asset liability management report 2q 2020
TRANSCRIPT

1
Asset Liability Management Report
2Q 2020
Performance Indicators and Key Measures
Cash, Investment and Debt Balances – Book Value ($M)
Restricted Cash and Investments 589.0 Unrestricted Cash and Investments 1,514.7 Total Cash and Investments 2,103.7
Total Outstanding Debt – Par Value 2,292.3
INVESTMENT PERFORMANCE
INTEREST RATE RISK CREDIT RISK LIQUIDITY RISK
Prior quarter: Above Average
Prior quarter: Low
Prior quarter: Low
Prior quarter: Low
Interest earnings exceeded revised budget for Q2 2020.
The current long term rate for tax exempt bonds
and blended rate for outstanding debts are below the assumed borrowing rate in the
financial plan.
Agency is well diversified against counterparty
credit risk. Investment portfolios are within policy
parameters.
Agency cash and investment balances are
sufficient to meet all known funding and
reserve requirements.
Key Measures Key Measures Key Measures Key Measures
Interest income of $21.2M
was $5.0M above Q2 budget of $16.2M. Note, excludes unrealized gains
and losses.
The blended ST interest cost is 3.58%. The
current assumed rate in the financial plan is 4% from 2017 to 2021 and
5.3% from 2022 to 2041.
All investment portfolios are in compliance with policy limits. Credit risk
exposure is low.
All reserves are fully
funded to date.
Book yield for the unrestricted ST
investment portfolio is 1.42%.
The blended investment yield is 1.45% versus the
variable debt rate of 1.48% in 2Q2020.
There were no credit rating actions that negatively impact the investment portfolio during the quarter.
Current liquidity meets
policy requirement.
Above
Average Low Low Low

2
2Q 2020 ALM Overview
Key Items
COVID-19 has significantly impacted the economy and financial markets beginning in late Q1. Revenues have been
reduced due to this recession, and this trend is expected to continue. Liquidity could be at risk in the upcoming months
and will require close monitoring. The investment portfolio was conservatively positioned entering this period of market
turmoil, and has weathered the volatility well. The portfolio continues to selectively add high-quality municipal, agency
and corporate securities when the market provides an attractive entry point. A key focus continues to be maintaining
liquidity given the uncertainty of the Agency’s future revenue environment and the ongoing Board level discussion on
capital spend.
Between current liquidity and undrawn TIFIA loan capacity, the Agency does not project any additional borrowing needs
until 2022. As future revenues and potential adjustments to the operating and capital plan come into focus, the portfolio
and borrowing plans will adjust accordingly.
Market Environment
The Fed has aggressively cut rates to combat the economic impacts of COVID-19. The target federal funds rates is in the 0.00%-0.25% range. The Fed Chair has publicly stated that the fed funds rate will remain at this level into 2022.
2-year US Treasury yields declined from .25% on 03/31/20 to 0.15% on 6/30/20. The 2-year Treasury yield traded in a very narrow range in the second quarter as the market comes to terms with a Fed firmly on hold. Rates have remained under continued downward pressure.
Actual Borrowing Rate versus Investment Rate
Current Tax Exempt Borrowing Rates
Current 30 year fixed at 2.98%
Current variable rate at 1.03%. Q2 SIFMA avg of .35% + LOC Cost of 0.60% + Rmktg Fee of 0.08% Credit Watch

3
ST is currently in “stand still” on its Lease In/Lease Out agreement with AIG, awaiting futher market and regulatory developlments. AIG’s financial standing has stabilized.
Cash, Investment and Debt Balances
ALM Position ($M)
Balance and Duration Value ($M) Interest Rate Duration/Avg.
Life (Year)
Benchmark
Duration (Year)
Assets (Cash/Investments)
Restricted 589.0 1.53% 1.65 NA
Unrestricted 1,514.7 1.42% 0.54 0.90
Assets (Cash/Investments) total 2,103.7 1.45% 0.85
Liabilities (Debt)
Fixed-Rate (2,142.3) 3.71%
Variable-Rate (150.0) 1.48%
Liabilities (Debt) total (2,292.3) 3.56% 14.13 19.51

4
2Q 2020 Investment Overview
Investment Strategy
The investment portfolio was conservatively positioned entering this period of market turmoil and has weathered the
volatility well.
Spreads on high-quality municipal, agency and corporate securities continue to be attractive and the portfolio seeks
opportunities to pick up additional spread without forgoing overall credit quality. The investment strategy has adapted to
the environment through a focus on strategically utilizing these asset classes given near daily changes in spread
relationships due to continued market volatility. Overall yield declined over the quarter and this is expected to continue as
reinvestments occur.
Cash and Investments ($M) Book Average Benchmark Current Qtrly Yield
Value Duration Duration Yield Change
Unrestricted
State Investment Pool 351.8 0.01 0.37% (0.96)
Operating account/Uncleared checks** (4.2) 0.01 0.35% 0.00
King County Investment Pool 65.1 0.95 1.36% (0.54)
ST Internal Investments 1,102.0 0.68 1.76% (0.45)
Total Unrestricted 1,514.7 0.54 0.90 1.42% (0.56)
Restricted
Operating/Contingency (internal) 91.1 0.01 0.37% (0.92)
Capital Replacement (internal) 343.9 2.69 3.04 2.14% (0.12)
Emergency Loss Reserve (internal) 36.0 0.01 0.37% (0.92)
Debt Service Accounts 68.1 0.01 0.37% (0.92)
BNSF Escrow 8.0 0.01 0.05% 0.00
OCIP Collateral 2.4 2.30 3.68% (0.00)
Link Risk Fund 0.5 0.95 1.34% (0.53)
Prior Debt Service Reserve 18.4 2.28 1.00 3.96% (0.07)
Affordable Housing Revolving Fund 8.0 0.01 0.37% (0.84)
Zurich Collateral 0.4 0.01 0.20% (0.00)
FTA Grant Recovery 12.2 0.01 0.37% (0.92)
Total Restricted 589.0 1.65 N/A* 1.52% (0.40)
Total 2,103.7 0.85 1.45% (0.51)
*Restricted benchmarks are based upon pro jected cash flow needs. Calculating a "total" benchmark duration for restricted investments is not applicable

5
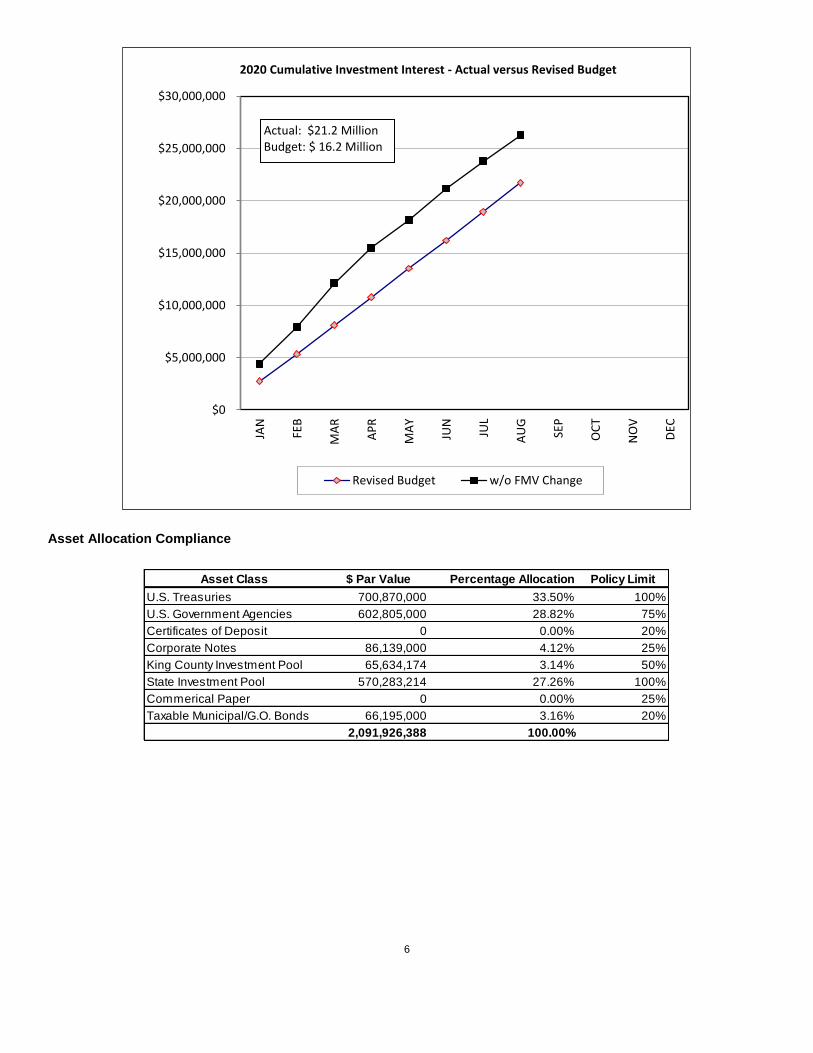
Investment Performance Portfolio Composition
6
Asset Allocation Compliance
$0
$5,000,000
$10,000,000
$15,000,000
$20,000,000
$25,000,000
$30,000,000
JAN
FEB
MA
R
AP
R
MA
Y
JUN
JUL
AU
G
SEP
OC
T
NO
V
DEC
2020 Cumulative Investment Interest - Actual versus Revised Budget
Revised Budget w/o FMV Change
Actual: $21.2 MillionBudget: $ 16.2 Million
Asset Class $ Par Value Percentage Allocation Policy Limit
U.S. Treasuries 700,870,000 33.50% 100%
U.S. Government Agencies 602,805,000 28.82% 75%
Certificates of Deposit 0 0.00% 20%
Corporate Notes 86,139,000 4.12% 25%
King County Investment Pool 65,634,174 3.14% 50%
State Investment Pool 570,283,214 27.26% 100%
Commerical Paper 0 0.00% 25%
Taxable Municipal/G.O. Bonds 66,195,000 3.16% 20%
2,091,926,388 100.00%

7
2Q 2020 Debt Overview Debt Strategy Sound Transit considers the diversification of its long-term liabilities in the context of its future borrowing needs. The Agency has over $3 billion of undrawn capacity on the TIFA loans to support the Agency’s liquidity needs. Debt Summary
The 20-year MMD ended the quarter at 1.43%, 37 basis points lower than the March 31st rate. During the quarter, rates experienced continued volitility with a high of 2.40% at the beginning of April and a low of 1.41% in mid June. Market rates remained volatile due to mixed economic and Covid-19 news throughout the quarter.
The average spread between the 20-year AAA MMD and the 20-year A MMD was 45 basis points as of 6/30/20, which is 9 basis points higher than what was measured on 03/31/20.
Prior Bonds Amount All-in Financial Plan
Series Issue Date Final Maturity Issue Size Outstanding Interest Cost Assumption
1999 1/6/1999 2/1/2028 $350,000,000 $230,630,000 5.03% 5.00%
2009P-2T (BABs) 9/29/2009 2/1/2028 $76,845,000 $69,455,000 3.36% 5.00%
2012P-1 8/22/2012 2/1/2028 $216,165,000 $118,545,000 2.62% 5.75%
Total Prior Bonds $643,010,000 $418,630,000 4.07%
Parity Bonds Amount All-in Financial Plan
Series Issue Date Final Maturity Issue Size Outstanding Interest Cost Assumption
2009S-2T (BABs) 9/29/2009 11/1/2039 $300,000,000 $300,000,000 3.66% 5.00%
2012S-1 8/22/2012 11/1/2030 $97,545,000 $77,080,000 2.73% 5.75%
2015S-1 9/10/2015 11/1/2050 $792,840,000 $789,940,000 3.89% 5.75%
2015S-2A* 9/10/2015 11/1/2045 $75,000,000 $75,000,000 1.45% 5.75%
2015S-2B* 9/10/2015 11/1/2045 $75,000,000 $75,000,000 1.52% 5.75%
2016S-1 12/19/2016 11/1/2046 $400,000,000 $400,000,000 3.60% 5.30%
Total Parity Bonds $1,740,385,000 $1,717,020,000 3.52%
Total Prior & Parity Bonds $2,383,395,000 $2,135,650,000 3.63%
*2015S-2A and 2015S-2B are variable rate bonds. The all-in Interest cost uses life-to-date average actuals.
Amount Financial Plan
TIFIA Loan Execution Date Final Maturity Loan Amount Drawn Interest Rate Assumption
East Link 1/16/2015 11/1/2058 $1,330,000,000 $50,000,000 2.38% 5.75%
Northgate 12/22/2016 11/1/2056 $615,267,000 $81,605,824 3.13% 5.30%
O&M Facility East 6/22/2017 11/1/2055 $87,663,515 $25,000,000 2.73% 5.30%
Lynnwood Link 12/19/2018 5/1/2059 $657,863,164 $0 3.06% 3.95%
Federal Way 12/19/2019 5/1/2059 $629,472,431 $0 2.36% 3.95%
$0
Total TIFIA Loans $3,320,266,110 $156,605,824 2.83%
Total Outstanding Debt $2,292,255,824 3.57%
Central Puget Sound Regional Transit Authority
Summary of Outstanding TIFIA Loans
Central Puget Sound Regional Transit Authority
Summary of Outstanding Bonds

8
Debt Portfolio Composition
Fixed $2,142M, 93%
Variable $150M, 7%
Outstanding Par Breakdown by Fixed and Variable Debt
Taxable BABs $369M, 16%
Tax-exempt $1,766M, 77%
Taxable TIFIA $157M, 7%
Outstanding Par Breakdown by Tax Status

9
The credit rating agencies actively monitor the transit sector. The pandemic has introduced great uncertainty into the sector and the credit rating agencies have responded with a series of sector and transit agency specific negative credit watches and downgrades. Sound Transit’s credit ratings remain strong despite the current market environment. The investment balances and liquidity available via undrawn TIFIA loans provide Sound Transit with flexibility and are viewed very positively by the credit rating agencies. Sound Transit maintains a sector leading level of credit quality.
Prior Parity TIFIA
Moody's Aaa Aa1
S&P AAA AAA AA+
Fitch AA+
Bond Ratings as of 06/30/2020

10
Asset Liability Management Report 2Q 2020
Key for Performance Summary
Above Average Average Below Average
INVESTMENT PERFORMANCE
Interest earnings forecast to exceed budget.
Interest earnings forecast to meet budget.
Interest earnings forecast to be below budget.
Low Medium High
INTEREST RATE RISK
Change in interest rates will have less than $5M impact on ST financial plan over 5-
year period.
Change in interest rates will have less than $10M
impact on ST financial plan over 5-year period.
Change in interest rates will have less than $20M
impact on ST financial plan over 5-year period.
LIQUIDITY RISK
All reserves and liquidity contingencies in place.
Current liquidity contingency greater than
policy minimum.
All reserves and liquidity contingencies in place.
Current liquidity contingency equal to policy
minimum.
Not all reserves and liquidity contingencies in
place.
CREDIT RISK
No known credit risks that could materially impact ST
balance sheet.
Known credit risks could potentially materially impact
ST balance sheet.
Known credit risks are likely to materially impact ST
balance sheet.

11
Glossary of Debt and Investment Terms
Basis Point – The smallest measure used in quoting yields on bonds and notes. One basis point is 0.01% of yield. For
example, a bond's yield that changed from 3.50% to 3.00% would be said to have moved 50 basis points.
Benchmark - A bond whose terms are used for comparison with other bonds of similar maturity. The global financial
market typically looks to U.S Treasury securities as benchmarks.
BNSF Escrow – Collateral pursuant to the Sound Transit / Amtrak / BNSF lease-sub-lease dated September 2000.
Book Value – The amount at which an asset is carried on the books of the owner. The book value of an asset does not
necessarily have a significant relationship to the market value of the security.
Duration - The weighted maturity of a fixed-income investment's cash flows, used in the estimation of the price
sensitivity of fixed-income securities for a given change in interest rates.
Federal Funds Rate – The rate of interest at which Federal Funds are traded between banks. Federal Funds are excess
reserves held by banks that desire to invest or lend them to banks needing reserves. The particular rate is heavily
influenced through the open market operations of the Federal Reserve Board. Also referred to as the “Fed Funds rate.”
General Obligation Bond (GO) - A municipal bond secured by the pledge of the issuer's full faith and credit, and backed
by their taxing authority.
Link Risk Fund – Funded by Sound Transit to pay certain claims related to the operation of Central Link.
Liquidity – The ease and speed with which an asset can be converted into cash without a substantial loss in value.
Local Government Investment Pool (LGIP) – The aggregate of all funds from political subdivisions that are placed in
the custody of the State Treasurer for investment.
Market Price - For securities traded through an exchange, the last reported price at which a security was sold; for
4securities traded "over-the-counter," the current price of the security in the market.
Par Value – The nominal or face value of a debt security; that is, the value at maturity.
Performance - An investment's return (usually total return), compared to a benchmark that is comparable to the risk level
or investment objectives of the investment.
SIFMA - The Securities Industry and Financial Markets Association Municipal Swap Index is a 7-day high-grade market
index comprised of tax-exempt Variable Rate Demand Obligations (VRDOs) with certain characteristics. The Index is
calculated and published by Bloomberg.
TIFIA Loan – Transportation Infrastructure Finance and Innovation Act loan with the United States Department of
Transportation, acting by and through the Federal Highway Administrator. TIFIA loans are used to complement other
sources of debt, resulting in a lower cost of funding than would be available in the capital markets.
Total Return - Investment performance measure over a stated time period which includes coupon interest, interest on
interest, and any realized and unrealized gains or losses.
OCIP Collateral – Pledged collateral for the Owner Controlled Insurance Program for University Link and Northgate Link.