asset management overview - southern dhb · 5.1 implementation ... the stage 1 master site plan and...
TRANSCRIPT

Asset Management Overview
February 2008
Draft for Discussion
Prepared for Otago District Health Board By SPM Consultants Ltd File: EMS AP Rev15.doc Printed: 04/02/2008 10:11 Status: Draft
Table of Contents
1 Introduction .................................................................................................................................................. 2
2 Asset Information ......................................................................................................................................... 3
2.1 Overview.................................................................................................................................................... 3
3 Levels of Service and Demand..................................................................................................................... 5
4 Financial Allocations .................................................................................................................................... 8
4.1 Overview.................................................................................................................................................... 8
4.2 Emergency, Medicine and Surgery ......................................................................................................... 9
4.3 Diagnostic and Support.......................................................................................................................... 10
4.4 Women’s, Children’s and Public Health .............................................................................................. 11
4.5 Mental Health and Community............................................................................................................. 12
4.6 Facilities................................................................................................................................................... 14
5 Implementation and Improvement Plan................................................................................................... 16
5.1 Implementation....................................................................................................................................... 16
5.2 Improvement Plan .................................................................................................................................. 16

Report Prepared by
Person Company Report component
Natalia Cardona SPM
Report Reviewed by
Person Company Report component
Steve Lyons SPM
Report Released by:
Steve Lyons
Director
SPM Consultants Ltd
January 2008 Otago District Health Board Page 1 of 19

Asset Management Overview Introduction
1 Introduction
Purpose of the Asset Management Overview
This overview document summarises the current assets, known shortfalls and the capital expenditure that could be required to address the shortfalls over the coming 20 years. As the overview document summarises information contained in each of the Health Services Asset Plans (HSAP) and the Facilities Asset Plan (FAP), it should be read as an Executive Summary by key Otago DHB stakeholders such as the Executive Management Team, the Board and the Ministry of Health.
The Asset Management Framework
The Ministry of Health and Treasury have recognised the 2006 National Asset Management Steering Group (NAMS) Property manual as being ‘better practice’ asset management and has been used to develop the HSAPs and the FAP. The framework formalises the link between the health services and the physical assets. By understanding the contribution assets make to the delivery of organisational outcomes and identifying the gaps between current and future requirements, it is possible to develop and select tactical options to address shortfalls.
The framework provides guidance on how to better manage the asset base considering:
1. Knowing our assets
2. Knowing what we need both now and into the future
3. Recognise the shortfalls between what we have and what we need and develop solutions or scope projects to address the shortfalls.
4. Prioritise the solutions and projects to ensure decisions are made to implement the most important initiatives first, considering limited resources.
5. Implement the projects and recognise the outcomes generated.
Requirements from the Ministry and Treasury
The Treasury will be requiring all asset intensive Crown Entities such as DHBs to base their capital asset management decisions on quality asset information and record their information, processes and requirements through a 20 year Asset Management Plan.
The Ministry of Health has been working towards implementing many of Treasury’s requirements since 2003 through National Workshops, Steering Groups and reporting
milestones such as the 2005 Asset Management Plan (AMP). The Ministry of Health now requires DHBs to follow sound asset management planning processes to support significant capital expenditure projects. Otago DHB is now introducing the series of HSAPs and FAP that are supporting the Stage 1 Master Site Plan and associated business case.
Document Structure
This Asset Management overview is structured in a way that is easy to read by stakeholders through use of graphics, tables and plain English. It has been written as an Executive Summary of the long term asset management requirements through the following sections:
• Introducing Otago DHB’s asset management needs
• Description of the existing assets
• Statements of level of service shortfalls and future demand expectations associated with each of the health service groups and facilities
• Financial projections over 20 years
• The implementation and improvement plan
Supporting documents
The asset information, levels of service shortfalls, demand statements and financial projections have all been summarised from the following supporting documents:
• Asset Management scoping report, November 2007
• Emergency, Medicine, and Surgery HSAP
• Diagnostics & Support HSAP
• Women’s, Children’s and Public Health HSAP
• Mental Health and Community Services HSAP
• Facilities Asset Plan
These supporting documents will be owned, used and maintained by each of the service groups. All future annual planning and strategic planning will be based on the information contained in these documents. The documents themselves only record the outputs and outcomes from the asset management planning process. Therefore, various business process changes will occur over the coming year.
Hierarchy of strategic planning
As stated by the Minister of Health in his letter to the Chair of Otago DHB dated 9 July 2007, “…approval of projects is dependant on both completion of a sound business case, and evidence of good asset management and health service planning.” The adjacent flow chart shows the hierarchy of the needed planning documents which are driving the options described in the Site Master Plans. The Business Case presented to the National Capital Committee is therefore based on this hierarchy of strategic planning and resulting documents
DistrictAsset Plan
Health Service & Facilities Asset Plans
Clinical Service Plan
Statement ofIntent
Site Master Plans
District
Strategic Plan
January 2008 Otago District Health Board Page 2 of 19
Asset Management Overview Asset Information
2 Asset Information
2.1 Overview
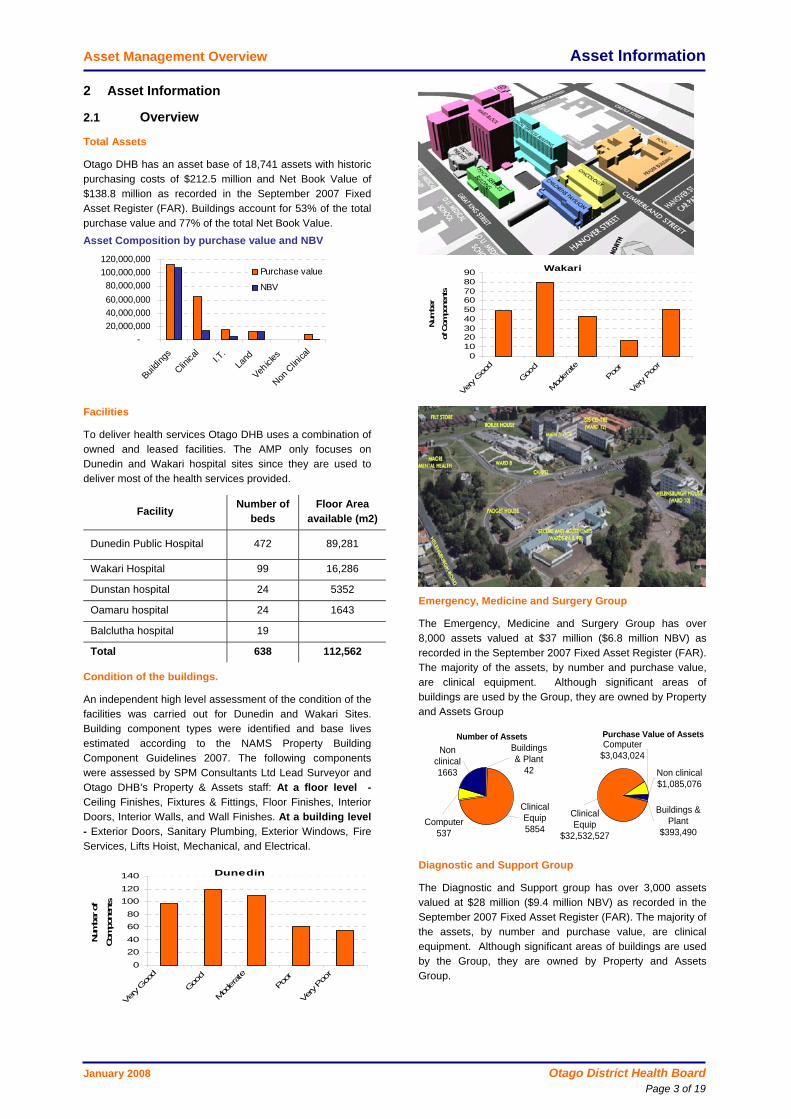
Total Assets
Otago DHB has an asset base of 18,741 assets with historic purchasing costs of $212.5 million and Net Book Value of $138.8 million as recorded in the September 2007 Fixed Asset Register (FAR). Buildings account for 53% of the total purchase value and 77% of the total Net Book Value. Asset Composition by purchase value and NBV
-20,000,00040,000,00060,000,00080,000,000
100,000,000120,000,000
Buildin
gs
Clinica
lI.T
.La
nd
Vehicle
s
Non C
linica
l
Purchase value
NBV
Facilities
To deliver health services Otago DHB uses a combination of owned and leased facilities. The AMP only focuses on Dunedin and Wakari hospital sites since they are used to deliver most of the health services provided.
Facility Number of beds
Floor Area available (m2)
Dunedin Public Hospital 472 89,281
Wakari Hospital 99 16,286
Dunstan hospital 24 5352
Oamaru hospital 24 1643
Balclutha hospital 19
Total 638 112,562
Condition of the buildings.
An independent high level assessment of the condition of the facilities was carried out for Dunedin and Wakari Sites. Building component types were identified and base lives estimated according to the NAMS Property Building Component Guidelines 2007. The following components were assessed by SPM Consultants Ltd Lead Surveyor and Otago DHB’s Property & Assets staff: At a floor level - Ceiling Finishes, Fixtures & Fittings, Floor Finishes, Interior Doors, Interior Walls, and Wall Finishes. At a building level - Exterior Doors, Sanitary Plumbing, Exterior Windows, Fire Services, Lifts Hoist, Mechanical, and Electrical.
Dunedin
0
2040
6080
100120
140
Very G
ood
Good
Mod
erate
Poor
Very Poo
r
Num
ber of
Com
pone
nts
Wakari
0102030405060708090
Very G
ood
Good
Mod
erate
Poor
Very Poo
r
Num
ber
of C
ompo
nent
s
Emergency, Medicine and Surgery Group
The Emergency, Medicine and Surgery Group has over 8,000 assets valued at $37 million ($6.8 million NBV) as recorded in the September 2007 Fixed Asset Register (FAR). The majority of the assets, by number and purchase value, are clinical equipment. Although significant areas of buildings are used by the Group, they are owned by Property and Assets Group
Non clinical1663
Computer537
Buildings & Plant
42
Clinical Equip5854
Number of AssetsComputer
$3,043,024
Buildings & Plant
$393,490
Clinical Equip
$32,532,527
Non clinical$1,085,076
Purchase Value of Assets
Diagnostic and Support Group
The Diagnostic and Support group has over 3,000 assets valued at $28 million ($9.4 million NBV) as recorded in the September 2007 Fixed Asset Register (FAR). The majority of the assets, by number and purchase value, are clinical equipment. Although significant areas of buildings are used by the Group, they are owned by Property and Assets Group.
January 2008 Otago District Health Board Page 3 of 19

Asset Management Overview Asset Information
Computer$1,661,171
Buildings & Plant
$2,039,202
Clinical Equip $21,605,896
Non clinical$3,045,009
Purchase Value of Assets
Computer 357
Buildings & Plant 61
Clinical Equip 1,726
Non clinical 899
Number of Assets
Women’s Health, Children’s Health and Public Health Group
The Women’s, Children’s and Public Health Group has over 3,000 assets valued at $6.6 million ($1.9 million NBV) as recorded in the September 2007 Fixed Asset Register (FAR). The majority of the assets, by number and purchase value, are clinical equipment.
Clinical Equip2042
Computer329
Non Clinical
628
Building & Plant11
Number of Assets
Building &Plant
$19,493Non Clinical
$541,538
Computer$531,775
Clinical Equip
$5.5 mil
Purchase Value of Assets
.
Mental Health Group
The Mental Health & Community Services Group has over 2,000 assets valued at $2.3 million ($505,000 NBV) as recorded in the September 2007 Fixed Asset Register (FAR). The assets, by number and purchase value, are spread between clinical equipment, IT/IS and non-clinical equipment. Although significant areas of buildings are used by the Group, they are owned by Property and Assets Group.
Number of Assets
Clinical Equip703
Comp.275
Building & Plant15
Non Clinical1028 Vehicles
1
Purchase Value of Assets
Vehicles$1,921
Non Clinical
$779,682
Comp.$553,953
Clinical Equip
$840,025
Building & Plant
$119,859
.
January 2008 Otago District Health Board Page 4 of 19
Asset Management Overview Levels of Service & Demand
3 Levels of Service and Demand
Strategic direction
The asset management planning process is one of the mechanisms that the management team is using to achieve Otago DHB’s Vision of "Working together to promote Wellness and Independence". The Vision is being realised through adherence to the following priorities:
• Equity of access to services
• Equity of outcomes
• Value for money
• Investing in the future
• Cultural appropriateness
• Treaty of Waitangi
• Ensuring sustainable, quality services
Levels of service shortfalls and resulting capital expenditure projects are guided by these priorities.
Clinical Services Plan
The Clinical Services Plan (CSP) provides the long term direction for health services in terms of both the volume and type of services and how the services will be delivered. It has considered the views of Otago DHB’s Clinicians and Managers through a structured interview process held in October 2007.
The financial requirements resulting from the asset management planning activities since October 2007, are largely based on the intention of the draft CSP dated 23 November 2007.
Inherent Levels of Service
Although the current DAP provides a range of inherent Levels of Service (LoS) standards with corresponding rationales, deliverables and target performance, they have yet to be linked back to assets and are too high level for use within an asset plan. As all capital expenditure projects need to be working towards addressing levels of service shortfalls, the Capital Decision Making Framework (CDMF) defined in the 2006 NAMS Property manual has been applied. This mechanism has provided a list of current and future requirements through structured interviews and questionnaires to identify shortfalls that can be addressed by tactical solutions. The end result is that all capital expenditure projects are linked to one or more ‘current and future requirement’ or level of service shortfall.
Current and future Levels of Service shortfalls
About 40 staff members from Otago DHB were interviewed during November and December 2007 to determine the current and future levels of service shortfalls. It was assumed that the staff interviewed inherently know Otago DHB’s service and related asset requirements. Ideally, these requirements need to be determined by robust and structured levels of service statements and targets. However, as these can take months or even years to develop, the NAMS Property CDMF model was used.
As a result of the interview process the following asset related shortfalls were found in common for most of the health services within Otago DHB.
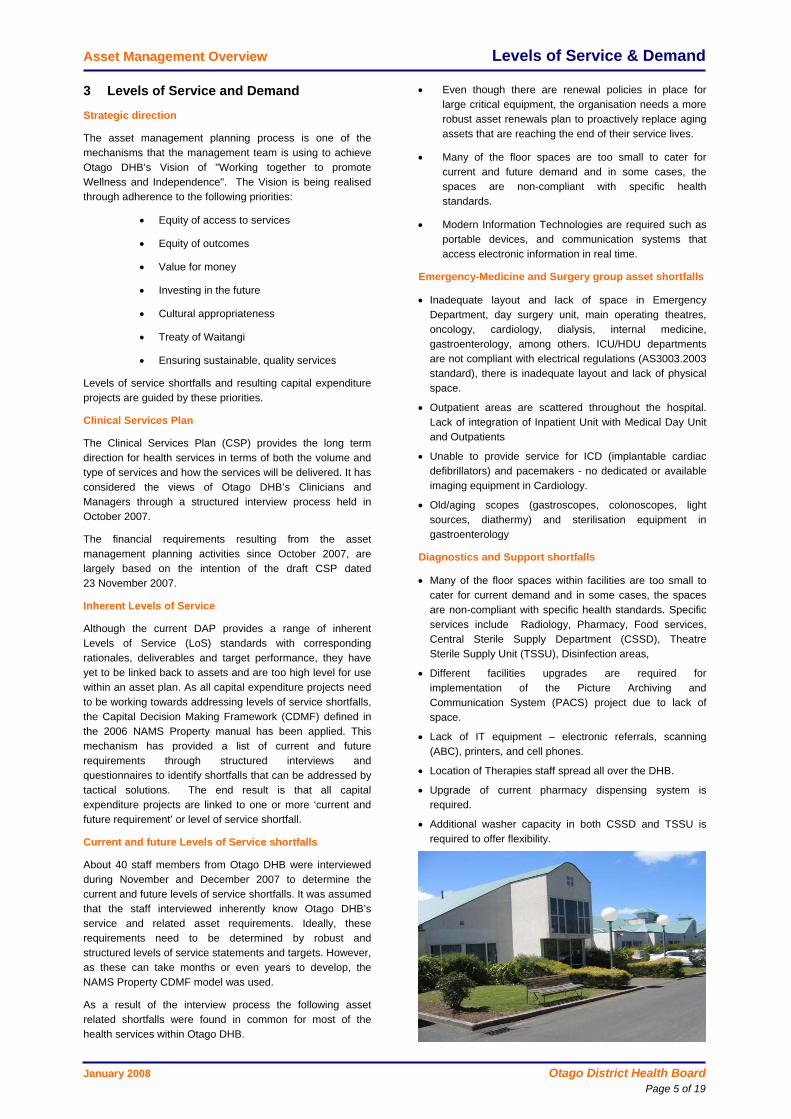
• Even though there are renewal policies in place for large critical equipment, the organisation needs a more robust asset renewals plan to proactively replace aging assets that are reaching the end of their service lives.
• Many of the floor spaces are too small to cater for current and future demand and in some cases, the spaces are non-compliant with specific health standards.
• Modern Information Technologies are required such as portable devices, and communication systems that access electronic information in real time.
Emergency-Medicine and Surgery group asset shortfalls
• Inadequate layout and lack of space in Emergency Department, day surgery unit, main operating theatres, oncology, cardiology, dialysis, internal medicine, gastroenterology, among others. ICU/HDU departments are not compliant with electrical regulations (AS3003.2003 standard), there is inadequate layout and lack of physical space.
• Outpatient areas are scattered throughout the hospital. Lack of integration of Inpatient Unit with Medical Day Unit and Outpatients
• Unable to provide service for ICD (implantable cardiac defibrillators) and pacemakers - no dedicated or available imaging equipment in Cardiology.
• Old/aging scopes (gastroscopes, colonoscopes, light sources, diathermy) and sterilisation equipment in gastroenterology
Diagnostics and Support shortfalls
• Many of the floor spaces within facilities are too small to cater for current demand and in some cases, the spaces are non-compliant with specific health standards. Specific services include Radiology, Pharmacy, Food services, Central Sterile Supply Department (CSSD), Theatre Sterile Supply Unit (TSSU), Disinfection areas,
• Different facilities upgrades are required for implementation of the Picture Archiving and Communication System (PACS) project due to lack of space.
• Lack of IT equipment – electronic referrals, scanning (ABC), printers, and cell phones.
• Location of Therapies staff spread all over the DHB.
• Upgrade of current pharmacy dispensing system is required.
• Additional washer capacity in both CSSD and TSSU is required to offer flexibility.
January 2008 Otago District Health Board Page 5 of 19

Asset Management Overview Levels of Service & Demand
Women’s, Children’s and Public Health shortfalls
• The building where Paediatrics is located is very old and has very limited mechanical and electrical services. There is a general lack of space and no compliant isolation facilities.
• Lifts in Children’s pavilion require immediate replacement
• Current floor areas associated with NICU, Queen Mary, Gynaecology and Outpatients are too small to deliver the current service volumes adequately.
Mental Health and Community Services shortfalls
• Very old facilities for most services, particularly Mental Health Services. Ward 1a has failed to meet accreditation compliance and is therefore assessed as unsuitable for its current purpose.
• Intellectual Disability Ward (10a) does not meet accreditation compliance in some areas and has capacity issues.
• All services require new equipment, from furniture and fittings etc, to clinical equipment to provide evidence-based care in both inpatient and community settings.
• Information Technology requires significant development in all services.
• Services are not dependent on high cost equipment and technology, but more so on appropriate facilities, fixtures and supportive technology for staff.
General shortfalls across Facilities
It is the needs of the health services that dictate the size, layout and general condition of the facilities. As the building assets enable each service group to deliver their health services, the current and future shortfalls listed above determine the facilities shortfalls. In general, these are:
• Insufficient floor space to deliver many of the health services, i.e. there are backlog capacity issues.
• Growing demand for services will require additional space in new buildings.
• The lack of car parks at Dunedin hospital is a significant issue for staff, patients and visitors.
• Many of the mechanical and electrical services are aging, under capacity and deteriorating throughout many of the building at both Waikari and Dunedin. For example, the Clinical Services Building: Data cabling needs immediate upgrade. Alarms in the operating theatre and air conditioning also require renewal. Plumbing services needs to be upgraded. Ward block: Nurse Call system requires immediate replacement. Approximately half of the power distribution boards are at capacity. Plumbing and HVAC services needs to be upgraded. Electrical services are at capacity across Dunedin hospital. Generators are at capacity and needs to be reconfigured or replaced in order to avoid contamination by fumes and to meet capacity demands.
Future Demand
Table 3.1 lists the various ‘demand statements’ made for each of the health services for the next 20 years. The percentage growth in demand is stated in the the CSP and further analysed for its effect on the building assets withih the Facilities Asset Plan.
It is expected that there will be an overall 26% increase in ‘inpatient’ health services throughout Otago DHB over the coming 20 years. This translates to about 1.15% growth per annum. Some of this growth in demand will result in a need for additional floor space to effectively deliver health services. This increase in floor space totals about 17,500 m2 over the 20 years and is expected to be gained through a two stage Site Master Plan process.
The growth percentages applied to each health service are based on the following assumptions:
1. While it is difficult to identify exact models of care changes, it can be accepted that over a twenty year timeframe, these will change to a significant degree, based upon this, facilities service growth is linked to 25% of specified growth in the CSP.
2. The following services are not expected to have an increase in demand: Children’s Health, Eyes, Public Health, Rehabilitation, Therapies, Women’s Health, Intellectual Disabilities, Public Health, Emergency, Medicine and Surgery services and leased areas.
3. The following services are expected to have a decrease in demand, but this will not be reflected in the floor space required: Maternity, Intensive Care Unit (ICU), Paediatrics, Neonatal Intensive Care Unit (NICU)
4. Floor area required for supporting areas will grow by 6.5%. This equals 25% of the overall growth in demand for all inpatient services. For the purpose of this analysis the following are considered supporting areas: Accommodation, assets and property, clinical support, diagnostic services, hotel services, pharmacy, specialist surgery, university.
5. Demand for outpatient treatments in local facilities will grow in the same proportion as the inpatient services (26%), hence it is also assumed that the growth in floor area required will be 6.5%
January 2008 Otago District Health Board Page 6 of 19

Asset Management Overview Levels of Service & Demand
Table 3.1Future Demand for Health Services - demand statement
New area gained New Area CSP Demand
Statement
Assets and Property 46,295 545 46,840 6.5% 49,885 Mental health 7,874 807 8,681 51% 12.8% 9,788 University 5,668 1,386 7,054 6.5% 7,513 Other Emergency, Medicine & Surgery 4,641 4,641 0.0% 4,641 Rehabilitation 3,691 59 3,750 0.0% 3,750 Hotel services 3,190 100 3,290 6.5% 3,504 Orthopaedics 3,144 - 3,144 22% 5.5% 3,317 Older peoples health 2,530 - 2,530 58% 14.5% 2,897 Diagnostic services 2,244 2,244 6.5% 2,390 Oncology 2,203 - 2,203 20% 5.0% 2,313 Outpatients 2,197 3,698 5,895 6.5% 6,278 Intellectual Disabilities 1,977 - 1,977 0.0% 1,977 Emergency 1,465 650 2,115 8% 2.0% 2,158 Maternity 1,463 - 1,463 -7% 0.0% 1,463
Children's health 1,400 - 1,400 0.0% 1,400 Radiology 1,335 - 1,335 33% 8.3% 1,445 ENT 1,157 200 1,357 15% 3.8% 1,408 General Surgery & Urology 1,002 337 1,339 29% 7.3% 1,436 Rheumatology 943 - 943 17% 4.3% 983 ICU 919 1,130 2,049 -23% 0.0% 2,049 Therapies 770 - 770 0.0% 770 Pharmacy 660 - 660 6.5% 703 Eyes 646 - 646 0.0% 646 Paediatrics 622 - 622 -14% 0.0% 622 Cardiology 539 - 539 34% 8.5% 584 Leased 516 - 516 0.0% 516 NICU 429 557 986 -14% -3.5% 952 Neurosciences 410 - 410 17% 4.3% 428 Clinical support 361 - 361 6.5% 385 Renal 329 - 329 17% 4.3% 343 Other 325 - 325 6.5% 346 Specialist surgery 259 - 259 6.5% 276 Women's health 251 250 501 0.0% 501 Gynaecology 246 - 246 1% 0.3% 246 Accommodation 222 - 222 6.5% 236 Urology 172 - 172 40% 10.0% 190 Respiratory 63 - 63 30% 7.5% 68
Public Health - 1,220 1,220 0.0% 1,220 Grand Total 102,157 10,939 113,097 119,624
Service Required area (m2)
2026 DemandMSP Stage 1 Current area occupied
January 2008 Otago District Health Board Page 7 of 19

Asset Management Overview Financial Allocations
4 Financial Allocations
4.1 Overview
Total capital expenditure over 20 years
Based on the current and future levels of service shortfalls combined with the ongoing needs of service groups, Otago DHB has identified capital expenditure in the vicinity of $349 million over the coming 20 years or an average of $17 million per year. See Figure 4.1 and Table 4.1. Over $230 million could be required in the first 10 years, which is about $92 million more than stated in the Ministry’s 2007 capital intentions spreadsheet.
Figure 4.1Forecasted expenditure summary
-
20,000,000
40,000,000
60,000,000
80,000,000
100,000,000
120,000,000
140,000,000
2007-2012 2012-2017 2017-2022 2022-2027
Corporate
Health Services
Facilities
Funding shortfall
Annual ‘baseline’ capital expenditure is funded through the depreciation charge of $13.0 million per annum as recorded in the asset register. As the majority of the capital expenditure is likely to be needed within the first 10 years, additional funding will be required from the National Capital Committee. Assuming that additional depreciation will be available as projects are capitalised, the overall funding shortfall is likely to be about $41 million over the 20 year period and $86 million over the next 10 years.
Health Service Groups
The expenditure analysis for each service group includes planned and analysed renewals. Planned renewals have been identified by Otago DHB staff through the annual planning process and interviews. Analysed renewals are based on historic purchase values and remaining service lives averaged over 50 years. The analysis also considers additional capacity gained through acquisition of new equipment.
The majority of the expenditure is associated with the following four service groups, which is summarised below:
• $90.1 million – Emergency, Medicine and Surgery
• $69.9 million – Diagnostics and Support
• $15.8 million – Women’s, Children’s and Public Health
• $4.7 million – Mental Health & Community Services
Based on a range of assumptions and using data from the current Fixed Asset Register, it’s possible that there will be a funding shortfall of $24 million within the next 5 years and $44 million over the next 20 years. The shortfall is largely due to the replacement of aging equipment that is reaching the end of their service lives that will also require further cyclic replacements during the 20 year planning period.
Corporate Services
In addition to the Health Services Groups, the replacement of aging and non-functional assets associated with Corporate Services may require capital expenditure of over $2.8 million per year based on the analysis of the data in the Fixed Asset Register. These assets mainly include IT/IS, non clinical equipment and some clinical assets. The Information Systems Strategic Plan (ISSP) states that $1 million of capital expenditure is planned annually but with leased assets and purchases IT/IS depreciation is $2.5m annually.
Facilities
As at January 2008, the first stage of the Site Master Plan (MSP) has identified a range of facilities projects that will require $34 million over the next 3 years. Each of these projects will be addressing the levels of service shortfalls identified through the structure interviews. The projects are considered as high priority and critically important to each of the health services.
Where Stage 1 MSP is addressing immediate shortfalls, the
Table 4.1Projected financial requirements
2007/2008 2008/2009 2009/2010 2007 to 2012 2012 to 2017 2017 to 2022 2022 to 2027
Facilities - Stage 1 MSP 5,796,000 20,448,001 8,113,000 34,357,001 - - - 34,357,001
Facilities - Stage 2 MSP - - - 18,597,200 27,895,800 - - 46,493,000
Facility functionality - - - 7,700,000 - - - 7,700,000
Facility demand - - - - 13,707,263 9,138,175 - 22,845,438
Equipment Modernisation 1,319,836 120,000 120,000 1,679,836 - - - 1,679,836
Equipment additional capacity 3,059,696 5,971,801 3,948,038 12,979,537 - - - 12,979,537
Equipment renewals 13,614,200 17,191,473 10,573,976 57,829,235 56,329,434 54,381,519 54,381,519 222,921,708
Sub-total 23,789,732 43,731,275 22,755,014 133,142,809 97,932,497 63,519,694 54,381,519 348,976,520 Current Depreciation 13,037,184 13,037,184 13,037,184 65,185,920 65,185,920 65,185,920 65,185,920 260,743,680
Additional Depreciation (3%) - 173,880 787,320 3,253,620 10,904,138 16,298,098 16,709,316 47,165,172
Baseline and strategic funding shortfall 64,703,269 21,842,439 41,067,668
Capital Expenditure Annual Requirements 5 year summaries Totals
Projected Operational Expenditure
2007/2008 2008/2009 2009/2010 2007 to 2012 2012 to 2017 2017 to 2022 2022 to 2027
Maintenance (facilities) 1,000,000 1,100,000 1,400,000 7,500,000 11,000,000 11,000,000 11,000,000 40,500,000
Operational Expenditure Annual Requirements 5 year summaries Totals
January 2008 Otago District Health Board Page 8 of 19

Asset Management Overview Financial Allocations
Stage 2 MSP will address longer term demand and functionality based shortfalls. Increasing demand on services may require an additional 6,500 m2 of floor space at a cost of about $23 million. Other functionality drivers such as co-location of services and new carparking, may require a further $54 million. In total, about $111 million could be required over the next 20 years. Associated depreciation may provide about $129 million, which leaves a surplus of about $18 million at the end of the planning timeframe. A maintenance renewal programme may also require a further $40 million over the 20 year period.
4.2 Emergency, Medicine and Surgery
Current asset value
The current asset NBV is $6.8 million and historic purchase value is $37 million for 8000 assets, resulting in the NBV of assets is 18% of the value. This suggests an aging asset base that is reaching the end of its expected service life.
Capital Expenditure
Over the long term, capital expenditure projects and procurements may total $90 million. As shown in Table 4.2 the majority of the expenditure is associated with renewing or replacement existing assets that are aging and at the end of their service lives.
Funding Shortfall
Current depreciation based funding only provides $69 million, which produces a funding shortfall of about $21 million. Comparing annual depreciation and the combined annual average expenditure shows a shortfall of $800,000 per annum after year 10. However, years 1 to 10 show a $12.9 million shortfall.
Planned Renewals
Analysed renewals has been compared to the planned capital expenditure requirements identified by Emergency Medicine and Surgery staff through the structured interviews and the annual planning process. The $23 million of planned replacements relates to a number of procurements. The following are the top five by replacement value:
• $4 million – LiNAC 21eX, in 2013
• $3.5 million – LiNAC 600C, in 2008
• $2.88 million – pool tools across 20 years.
• $2.34 million - anaesthetic machines, in 2008
• $1.25 million - knife planning system in 2008
Analysed Renewals
Analysed renewals total about $4.2 million per annum on average. This is based on a 50 year planning period and using purchase data, historic purchase value and expected service lives from the Fixed Asset Register.
The following figure shows the calculated timing of replacement for each of the assets associated with EMS over the next 20 years. The backlog expenditure in 2007/08 of over $29 million is based on a significant number of assets still being in service years after their expected service lives have expired.
-5
1015202530
1 3 5 7 9 11 13 15 17 19
Mill
ions
The pie graph also shows ‘special’, which describes assets that have yet to be mapped to the National Health Asset
Guidelines.
Table 4.2Emergency Medicine and Surgery
2007/2008 2008/2009 2009/2010 2008 to 2012 2012 to 2017 2017 to 2022 2022 to 2027
Capex
Equipment Modernisation 1,836 - - 1,836 - - - 1,836
Additional capacity (New Equipment) 966,945 2,000,000 1,960,029 4,926,974 - - - 4,926,974
Analysed Renewals 1,260,935 - - 6,460,595 15,283,354 19,998,354 20,498,355 62,240,658 Planned Renewals 2,998,736 7,480,000 3,319,024 14,837,760 6,015,001 1,300,001 800,000 22,952,762
Total 5,228,452 9,480,000 5,279,053 26,227,165 21,298,355 21,298,355 21,298,355 90,122,230 Depreciation 3,459,792 3,459,792 3,459,792 17,298,960 17,298,960 17,298,960 17,298,960 69,195,840
5 year block summariesTotals
Annual Requirements Categories
Clinical Equipment $54.3 m
68%
Special$18.4 m
23%
Other Equipment
$1.8 m 2%
IT Equipment
$5.9 m 7%
January 2008 Otago District Health Board Page 9 of 19

Asset Management Overview Financial Allocations
New equipment
New equipment expenditure includes 40 projects that have been identified through the planning process and structured interviews and totals about $5m for the first 5 years. The top five projects include C.T. scanner for Emergency Department, Diagnostic coronary angiography monitoring system, ventilators, computer TKR/THR navigation system, RFA system.
Net Book Values
The ‘forecasted net book value’ is based on adding the total capital expenditure less the allocated depreciation to the current NBV. Capex is insufficient to bring the asset’s capital value back to current day replacement costs.
Forecasted Net Book Value
$0$5
$10$15$20$25$30
2007
/2008
2009
/2010
2011
/2012
2013
/2014
2015
/2016
2017
/2018
2019
/2020
2022
/2023
2024
/2025
2026
/2027
Mill
ions
4.3 Diagnostic and Support
Current asset value
The current asset NBV is $9.4 million and replacement cost (historic purchase value) is $28 million, resulting in the NBV of assets is 34% of the replacement cost.
Capital Expenditure
Over the long term, capital expenditure projects and procurements may total $70 million. As shown in Table 4.3, the majority of the expenditure is associated with renewing or replacement existing assets that are aging and at the end of their service lives.
Funding Shortfall
Current depreciation based funding only provides $47 million, which produces a funding shortfall of about $22.8 million over the next 20 years. Comparing annual depreciation and the combined annual average expenditure shows a shortfall of $500,000 per annum after year 10. However, years 1 to 10 show a $17.9 million shortfall.
Planned Renewals
Analysed renewals has been compared to the planned capital expenditure requirements identified by Diagnostic and
Support staff through the structured interviews and the annual planning process. The $22.8 million of planned replacements relates to a number of procurements. The following are the top five by replacement value:
• $2.25 million – DSA Machine, in 2008
• $2 million – Nuclear medicine Gamma in 2012
• $2 million – CT machine in 2012
• $1.5 million – MRI in 2008
• $1.18 million – Digital mammography (lease) 2008
Analysed Renewals
Analysed renewals total about $2.85 million per annum on average. This is based on a 50 year planning period and using purchase data, historic purchase value and expected service lives from the Fixed Asset Register. Feedback from Diagnostic and Support suggests that the annual renewal expenditure needs to be well in excess of $3 million.
The following figure shows the calculated timing of replacement for each of the assets over the next 20 years. The backlog expenditure in 2007/08 of over $22 million is based on a significant number of assets still being in service years after their expected service lives have expired. The year 12 peak is based on many of the assets in year 1 having a 10 year service life.
-
5
10
15
20
1 2 3 4 5 6 7 8 9 10 11 12 13 14 15 16 17 18 19 20
Mill
ions
The pie graph also shows ‘special’, which describes assets that have yet to be mapped to the National Health Asset Guidelines.
Table 4.3Diagnostic and Support - capital expenditure summary
2007/2008 2008/2009 2009/2010 2007 to 2012 2012 to 2017 2017 to 2022 2022 to 2027
CapexEquipment Modernisation 8,000 - - 8,000 - - - 8,000 Additional capacity (New Equipment) 1,678,451 3,874,501 1,988,004 7,540,956 - - - 7,540,956
Analysed Renewals - - - - 11,044,544 14,237,430 14,237,430 39,519,404 Planned Renewals 5,557,976 5,966,334 3,564,034 17,685,146 5,140,801 - - 22,825,947
Sub-total 7,244,427 9,840,835 5,552,038 25,234,102 16,185,345 14,237,430 14,237,430 69,894,307 Depreciation 2352144 2352144 2352144 11,760,720 11,760,720 11,760,720 11,760,720 47,042,880
5 year block summariesTotals
Annual Requirements Categories
New equipment
New equipment expenditure includes 33 projects that have been identified through the planning process and structured
January 2008 Otago District Health Board Page 10 of 19

Asset Management Overview Financial Allocations
interviews and totals $7.5 m for the first 5 years. The top five projects include MRI machine, 2nd C.T scanner, Picture Archiving Communication System/ Radiology Information System (PAC/RIS), Robotic dispensing.
Clinical Equipment
$36,454,27164%
Motor Vehicles$11,952
0%
Other Equipment$2,535,864
4%
Special$15,227,548
26%
IT Equipment$3,556,932
6%
Net Book Values
The ‘forecasted net book value’ is based on adding the total capital expenditure less the allocated depreciation to the current NBV. Over the long term, the capex has brought the asset’s capital value back to current day replacement costs.
$0$5
$10$15$20$25$30$35
2007
/2008
2009
/2010
2011
/2012
2013
/2014
2015
/2016
2017
/2018
2019
/2020
2022
/2023
2024
/2025
2026
/2027
Mill
ions
4.4 Women’s, Children’s and Public Health
Current asset value
The current asset NBV is $1.9 million and replacement cost (historic purchase value) is $6.6 million, resulting in the NBV of assets is 29% of the replacement cost.
Capital Expenditure
Over the long term, capital expenditure projects and procurements may total $15.8 million. As shown in Table 4.4, the majority of the expenditure is associated with renewing or replacement existing assets that are aging and at the end of their service lives.
Funding Shortfall
Current depreciation based funding provides $14.7 million, which produces a funding shortfall of about $1.9 million over
the next 20 years. Comparing annual depreciation and the combined annual average expenditure shows a shortfall of $50,000 per annum after year 5. However, years 1 to 5 shows a $1.85 million shortfall. This is minor when compared to other health service groups.
Planned Renewals
Analysed renewals has been compared to the planned capital expenditure requirements identified by Woman Child and Public Health staff through the structured interviews and the annual planning process. Staff have identified 102 renewal projects worth $2.2 million over the next 20 years and an additional 21 projects that still require cost estimations. These are mainly equipment procurements such as the Maternity-CTG machine, Delivery Bed, Nitric Oxide monitoring equipment, and a Retinal camera.
Analysed Renewals
Analysed renewals total about $690,000 per annum on average. This is based on a 50 year planning period and using purchase data, historic purchase value and expected service lives from the Fixed Asset Register.
The following figure shows the calculated timing of replacement for each of the assets over the next 20 years.
0
1
2
3
4
5
1 2 3 4 5 6 7 8 9 10 11 12 13 14 15 16 17 18 19 20
Mill
ions
The backlog expenditure in 2007/08 of over $5.4 million is based on a number of assets still being in service years after their expected service lives have expired. The year 12 peak is based on many of the assets in year 1 having a 10 year service life.
Table 4.4Woman Child and Public Health - capital expenditure summary
2007/2008 2008/2009 2009/2010 2007 to 2012 2012 to 2017 2017 to 2022 2022 to 2027
Capex
Equipment Modernisation 1,310,000 120,000 120,000 1,670,000 - - - 1,670,000
Additional capacity (New Equipment) 336,200 95,500 - 431,702 - - - 431,702
Analysed Renewals 68,633 46,433 - 1,233,369 3,430,716 3,430,716 3,430,716 11,525,517 Planned Renewals 617,510 639,710 770,917 2,197,347 - - - 2,197,347
Sub-total 2,332,343 901,643 890,917 5,532,418 3,430,716 3,430,716 3,430,716 15,824,566 Depreciation 735,960 735,960 735,960 3,679,800 3,679,800 3,679,800 3,679,800 14,719,200
5 year block summariesTotals
Annual Requirements Categories
Other expenditure
Equipment modernisation and New equipment expenditure includes projects that have been identified through the
January 2008 Otago District Health Board Page 11 of 19

Asset Management Overview Financial Allocations
planning process and structured interviews. The top three projects include equipment for NICU upgrade ($1.67m), Transport incubator and retinal camera.
The following pie graph also shows ‘special’, which describes assets that have yet to be mapped to the National Health Asset Guidelines.
Clinical Equipment$9,999,568
73%
Other Equipment$1,145,851
8%
Special$830,139
6%
IT Equipment$1,720,002
13%
Net Book Values
The ‘forecasted net book value’ is based on adding the total capital expenditure less the allocated depreciation to the current NBV. Over the long term, the capex is insufficient to bring the asset’s capital value back to current day replacement costs.
$0
$1
$2
$3
$4
2007
/2008
2009
/2010
2011
/2012
2013
/2014
2015
/2016
2017
/2018
2019
/2020
2022
/2023
2024
/2025
2026
/2027
Milli
ons
4.5 Mental Health and Community
Current asset value
The current asset NBV is only $151,000 and replacement cost (historic purchase value) is $840,000, resulting in the NBV of assets being 18% of the replacement cost. Although Mental Health and Community Services has minimal assets, the service requires one of the largest amount of building space compared to the other service groups.
Capital Expenditure
Over the long term, capital expenditure projects and procurements may total $4.7 million. As shown in Table 4.5 he majority of the expenditure is associated with ‘analysed
renewals’ or replacing existing assets that are aging and at the end of their service lives. Planned renewals and other expenditure categories are minor in comparison and are reflective of the health services delivered.
Funding Shortfall
Current depreciation based funding provides $4 million, which produces a funding shortfall of about $400,000 over the next 20 years. In general, the shortfall is minor when compared to other health services.
Analysed Renewals
Analysed renewals total about $233,000 per annum on average. This is based on a 50 year planning period and using purchase data, historic purchase value and expected service lives from the Fixed Asset Register.
The following figure shows the calculated timing of replacement for each of the assets over the next 20 years.
The backlog expenditure in 2007/08 of about $1.2 million is based on a number of assets still being in service years after their expected service lives have expired.
-
200,000
400,000
600,000
800,000
1,000,000
1,200,000
1 2 3 4 5 6 7 8 9 10 11 12 13 14 15 16 17 18 19 20
The following pie graph also shows ‘special’, which describes assets that have yet to be mapped to the National Health Asset Guidelines. The pie chart summarises the expenditure by asset type over the 20 year period.
Table 4.5Mental Health & Community Services
2007/2008 2008/2009 2009/2010 2007 to 2012 2012 to 2017 2017 to 2022 2022 to 2027
CapexEquipment Modernisation - - - - - - - - Additional capacity (New Equipment) 78,100 1,800 5 79,905 - - - 79,905 Analysed Renewals - - - 625,611 1,165,018 1,165,018 1,165,018 4,120,666 Planned Renewals 260,410 208,996 70,001 539,407 - - - 539,407
Sub-total 338,510 210,796 70,006 1,244,923 1,165,018 1,165,018 1,165,018 4,739,978 Depreciation 200364 200364 200364 1,001,820 1,001,820 1,001,820 1,001,820 4,007,280
5 year block summariesTotals
Annual Requirements Categories
January 2008 Otago District Health Board Page 12 of 19

Asset Management Overview Financial Allocations
Clinical Equipment$1,363,444
29%
Motor Vehicles$5,763
0%
Special$740,945
16%Other
Equipment$1,176,993
25%
IT Equipment$1,447,636
30%
Net Book Values
The ‘forecasted net book value’ is based on adding the total capital expenditure less the allocated depreciation to the current NBV. Over the long term, the analysed average annual capital renewal expenditure is greater than allocated depreciation hence, the value of the asset base will increase if the various assumptions are adopted.
$0$200,000$400,000$600,000$800,000
$1,000,000$1,200,000
2007
/2008
2009
/2010
2011
/2012
2013
/2014
2015
/2016
2017
/2018
2019
/2020
2022
/2023
2024
/2025
2026
/2027
January 2008 Otago District Health Board Page 13 of 19

Asset Management Overview Financial Allocations
4.6 Facilities
Market valuation
The last Property valuation for Otago DHB was undertaken in December 2005, and totals $121.2 million. Figure below shows the market values for each property. Current Net Book Value is $107.2 million.
Trades building 3,010,000
Wakari Hospital 18,250,000
Dunstan Hospital
8,980,000
Dunedin Dw ellings 1,227,604
Dunedin Hospital
89,700,000
Capital Expenditure
The expenditure required over next 20 years totals $111.4 million and is derived from four sources as shown in Table 4.6.
Stage 1 MSP –includes 35 selected priority projects worth $34.3 million that responds to immediate shortfalls associated to functionality issues. The plan is to be completed within the next 3 years and allows decanting to occur to enable future developments on the Dunedin Hospital site. Distribution of capital required across the different group services for this stage is as follows:
Mental Health 9,287,000
Women's, Children's and Public Health 6,775,001
Corporate 7,966,007
Diagnostic and Support
3,114,001
Emergency, Medicine and
surgery 7,215,000
The main projects for each group are:
• Mental Health: Acute Mental Health inpatient ward relocation to Wakari site $2.3 million, relocation of Public Health South from Leased premises to Wakari $2.1 million, upgrade of offices for intermediary care $1 million.
• Women’s, Children’s and Public Health: Neonatal Intensive Care Unit - NICU redevelopment $6.7 million
• Corporate: Wakari Hospital electrical reticulation $1.5 million, relocation of CEO and corporate offices $1.4 million, Car parking $1.2 million,
• Diagnostic and support services: Dunedin staff cafeteria redevelopment $1.4 million, PACS alterations $1.1 million.
• Emergency, Medicine and Surgery: HDU/ICU redevelopment $6.3 million, medical day unit upgrade $0.9 million.
Stage 2 MSP includes 10 projects worth $46.5 million that cover a full range of initiatives that can only be undertaken after space has been freed up in the first stage. The three main projects are:
• Consolidation of outpatient areas for $21.5 million
• Relocation of MOP theatres $7 million
• Day surgery development $3.5 million
Table 4.6Projected financial requirements for facilities
2007/2008 2008/2009 2009/2010 2007 to 2012 2012 to 2017 2017 to 2022 2022 to 2027Stage 1 MSP 5,796,000 20,448,001 8,113,000 34,357,001 - - - 34,357,001
Stage 2 MSP - - - 18,597,200 27,895,800 - - 46,493,000
Other functionality driven projects - - - 7,700,000 - - - 7,700,000
Demand driven projects - - - - 13,707,263 9,138,175 - 22,845,438
Sub-total 5,796,000 20,448,001 8,113,000 60,654,201 41,603,063 9,138,175 - 111,395,439
Current Depreciation 4,101,072 4,101,072 4,101,072 20,505,360 20,505,360 20,505,360 20,505,360 82,021,440
Additional Depreciation (3%) 173,880 787,320 3,253,620 10,904,138 16,298,098 16,709,316 47,165,172
Baseline and strategic funding shortfall 36,895,221 10,193,565 17,791,173-
Capital Expenditure Annual Requirements 5 year summaries Totals
Projected Operational Expenditure
2007/2008 2008/2009 2009/2010 2007 to 2012 2012 to 2017 2017 to 2022 2022 to 2027
Maintenance (facilities) 1,000,000 1,100,000 1,400,000 7,500,000 11,000,000 11,000,000 11,000,000 40,500,000
Operational Expenditure Annual Requirements 5 year summaries Totals
The planning horizon for the second stage MPS is 10 years from now.
Other functionality driven projects for $7.7 million are requirements also derived from shortfalls expressed by service managers during interview process. These projects need to be further analysed.
January 2008 Otago District Health Board Page 14 of 19

Asset Management Overview Financial Allocations
Demand driven projects comprise 38 projects worth $22.8 million that are derived from the demand forecast for year 2026 as documented in the CSP. Figure below shows the distribution of capital required across the service groups.
Funding Shortfall
Both current and additional depreciation funding provides $129 million across 20 years. The funding shortfall for the first 10 years is about $47 million. There is a total surplus at the end of the planning horizon of $17.8 million.
Diagnostic and support
1,531,770.98
Women's, Children's and Public health1,496,845.35
Mental health and community
services 10,315,558.59
Emergency, Medicine &
Surgery 6,897,352.53
Corporate 26,200,724.55
Net Book Values
The ‘forecasted net book value’ over 20 years is about $154 million and is based on adding the total capital expenditure less the allocated depreciation to the current NBV. Over the long term, the capex is insufficient to bring the asset’s capital value back to current day replacement costs
$0$50
$100$150$200$250
2007
/2008
2009
/2010
2011
/2012
2013
/2014
2015
/2016
2017
/2018
2019
/2020
2021
/2022
2023
/2024
2025
/2026
Mill
ions
Main expenditures are associated to the following groups:
• Corporate areas $12.3 million (cafeterias, aisles, plant rooms, building services, conference rooms, university, etc).
• Mental health and community services $3.9 million
• Outpatients $1.34 million
• Older peoples health $1.3 million
• Hotel services $0.75 million
Expenditure items associated to Master Site Plan and Levels of Service Shortfalls do not include requirements for Dunstan Hospital as it was subject of a recent significant upgrade.
Operational expenditure
Maintenance required for building components totals $40.5m across 20 years. This is based on the assumption that about 1.5% of the capital replacement value will be needed for maintenance per annum. This amount increases from about $1 million to over $2 million per annum with the upcoming capital expenditure over the next 1 to 10 years. Note that building renewals or refurbishments are currently categorised as maintenance or other capital projects rather than capital renewals.
All Funding requirements and composition from table 4.6 are further summarised graphically in blocks of five years.
-
20,000,000
40,000,000
60,000,000
80,000,000
100,000,000
2007 to 2012 2012 to 2017 2017 to 2022 2022 to 2027
Inve
stm
ent (
$)
Master Site Plan Stage 1 Master Site Plan Stage 2 Functionality driven projects Depreciation Demand driven projects
January 2008 Otago District Health Board Page 15 of 19
Appendix H Scoped Capital Projects
5 Implementation and Improvement Plan
5.1 Implementation
The process of asset management planning, as defined through the NAMS Property principles, has yet to be fully implemented. Although Otago DHB staff are following good inherent practices, they would be more effective if they were more aligned to a proven framework.
Key implementation steps that are currently underway include:
• Gaining Board endorsement and support for the key asset management planning principles across all services and asset types.
• Forming an Asset Management Steering Group (AMSG) with representatives from the following relevant groups, and chaired by the CFO:
o The four health service groups
o Finance
o Facilities
o Information services
• Appointing an Asset Management Coordinator that is a trained and passionate advocate for implementing business change and special projects supporting the key principles.
• Implementation of the Improvement Plan.
• Consultation with other key staff at regular intervals. Otago DHB needs to report progress to staff that are affected by the known level of service shortfalls.
• Ensuring that the Health Service Asset Plans and the Facility Plan are used as working documents to record improvements in data, evolving levels of service and scoping the resulting capital requests.
• All capital requests will be considered through a new prioritisation model that compares importance within each group. The model has been offered by Capital & Coast DHB, it is well documented, and well proven.
• Asset related systems need to be the ‘best of breed’ and be able to have simple interfaces or, where needed, integrate. This will result in using both existing and new systems.
• Establish performance reporting for each of the Asset Plans to ensure progress is celebrated and communication is effective.
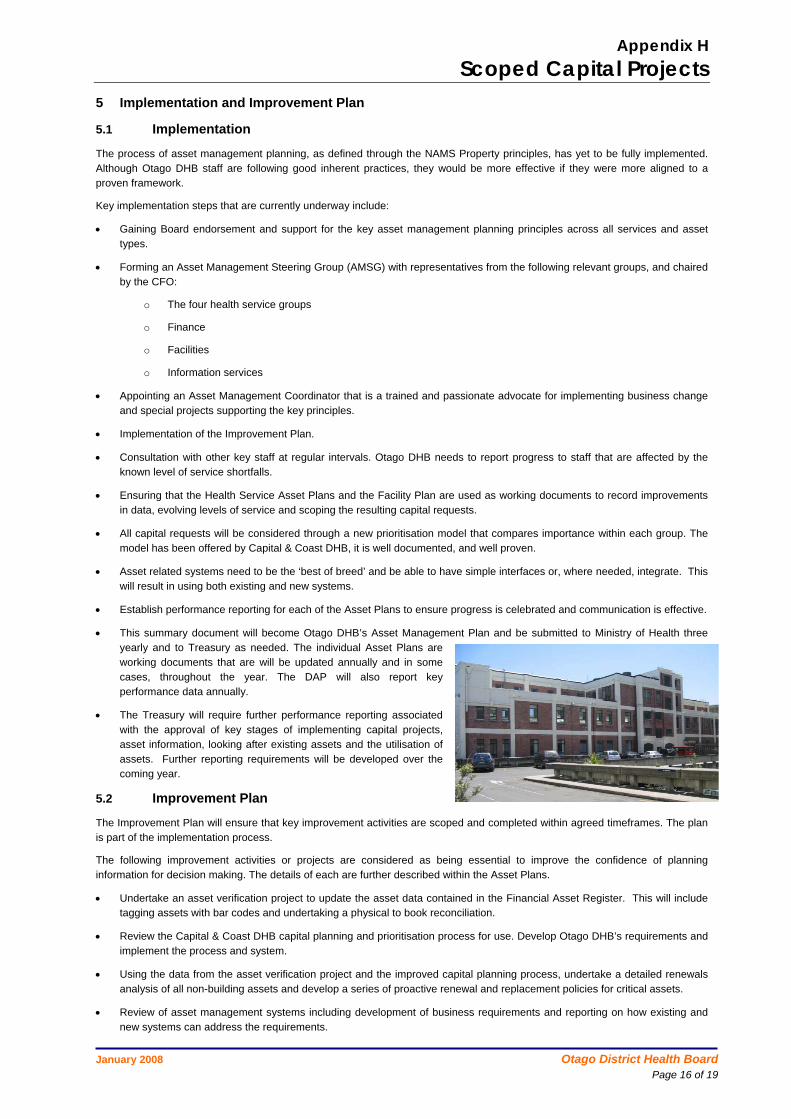
• This summary document will become Otago DHB’s Asset Management Plan and be submitted to Ministry of Health three yearly and to Treasury as needed. The individual Asset Plans are working documents that are will be updated annually and in some cases, throughout the year. The DAP will also report key performance data annually.
• The Treasury will require further performance reporting associated with the approval of key stages of implementing capital projects, asset information, looking after existing assets and the utilisation of assets. Further reporting requirements will be developed over the coming year.
5.2 Improvement Plan
The Improvement Plan will ensure that key improvement activities are scoped and completed within agreed timeframes. The plan is part of the implementation process.
The following improvement activities or projects are considered as being essential to improve the confidence of planning information for decision making. The details of each are further described within the Asset Plans.
• Undertake an asset verification project to update the asset data contained in the Financial Asset Register. This will include tagging assets with bar codes and undertaking a physical to book reconciliation.
• Review the Capital & Coast DHB capital planning and prioritisation process for use. Develop Otago DHB’s requirements and implement the process and system.
• Using the data from the asset verification project and the improved capital planning process, undertake a detailed renewals analysis of all non-building assets and develop a series of proactive renewal and replacement policies for critical assets.
• Review of asset management systems including development of business requirements and reporting on how existing and new systems can address the requirements.
January 2008 Otago District Health Board Page 16 of 19
Appendix H Scoped Capital Projects
• Development of internal and external reporting mechanisms based on Ministry’s requirements and AMSG requirements.
• Improve the linkage between the level of service shortfalls and the final CSP. This may involve adding or removing statements based on the agreed future model of care.
• Scoping capital projects and procurements based on the capital planning process using the Projects database. All Capital requests over $50,000 to be included. Train people on the process and use of the system.
• Integrating the implementation of capital projects with asset planning principles. This will be a prescribed performance based reporting process where ODHB will need to pass certain ‘gates’ before defined capital projects can proceed through to the next gate.
• It is important to note that Otago DHB capitalisation policy categorises any baseline works on buildings as maintenance and other strategic capital associated with buildings is categorised as capital expenditure. This capitalisation policy needs to be reviewed.
January 2008 Otago District Health Board Page 17 of 19