association between employee motivation and employee demographics in the banking industry
TRANSCRIPT

Association between
employee motivation and employee demographics
in the banking industry
A Research Report
presented to the
Graduate School of Business Leadership
University of South Africa
In partial fulfilment of the
requirements for the
MASTERS DEGREE IN BUSINESS LEADERSHIP,
UNIVERSITY OF SOUTH AFRICA
by
M PERUMAL
1 December 2008

Association between employee motivation and
employee demographics in the banking industry
____________________________________________________________________________________
ABSTRACT
Fourteen years after the demise of apartheid and embrace of democracy, South
Africa as a nation is still undergoing its transformation politically, socially and
economically. This environmental churning has high impact on employee
perceptions within the workplace, which subsequently affects retention rates.
Among the challenges facing people managers in this environment is employee
motivation. However, to thoroughly understand what motivates today’s diverse
employee base, one needs to look further than the current landscape into
historical backgrounds, to build up character models for different demographics.
The study aimed to identify associations between employee motivation and
employee demographics (gender, age, race and organisational level) in the
South African banking industry by also taking into account South African history
to understand these associations and to translate the insights gained into
effective leadership.
A survey questionnaire, based on ten motivation factors, was adapted from
similar studies pioneered by Kovach in 1946, who conducted subsequent
studies in 1987 and 1995. The questionnaire for this study was forwarded via
email to South African banking employees requesting them to provide
demographic data and complete a short questionnaire with two countercheck
questions per motivation factor. The collected data was then analysed to
identify any associations by highlighting differences in means of the responses
to the motivation factors between employee demographic categories. The
means were also used to rank the ten motivation factors for each demographic
category.
It was concluded that there were associations, particularly between generations
and the motivation factors, while gender showed the least association. On the
other hand, similarities were also identified. Deserving of particular mention are
similarities indicative of the Ubuntu concept of African culture across all
demographic categories. Recommendations for retention strategies were
provided based on these conclusions.

Association between employee motivation and
employee demographics in the banking industry
____________________________________________________________________________________
___________________________________________ ii
DECLARATION
I, Mr Marvin Perumal, declare that this research report is my own work except
as indicated in the references and acknowledgements. It is submitted in partial
fulfilment of the requirements for the degree of Master of Business Leadership
to the Graduate School of Business Leadership (University of South Africa). It
has not been submitted before for any degree or examination in this or any
other university.
-------------------------------------------------------------
Mr Marvin Perumal (70991081)
Signed at ……………………………………………………
On the …………………………….. day of ………………………… 2008

Association between employee motivation and
employee demographics in the banking industry
____________________________________________________________________________________
___________________________________________ iii
DEDICATION
To my parents, Krish and Jay Perumal, thank you for the foundation that you
built within me, giving me the strength to believe that anything is possible.
Making you both proud is my drive to succeed - I dedicate this report to you.

Association between employee motivation and
employee demographics in the banking industry
____________________________________________________________________________________
___________________________________________ iv
ACKNOWLEDGEMENTS
I am sincerely thankful and appreciative to everyone who contributed to the
presentation of this report. Of particular mention are the following individuals:
• Prof. Lize Booysen, my dissertation supervisor, for your commitment,
accessibility and guidance. Your support was unwavering, your approach
was always professional and your demeanour was one of consistent
encouragement.
• Prof. Riette Eiselen, for your assistance with the statistical analysis of the
results of the questionnaires. I appreciate the time that you spared for me,
albeit that you had your own allocation of students whom you supervised for
the year.
• My family, particularly my brothers, Laren Perumal and Neilan Perumal and
your families for the tolerance of my limited time and attention. I am thankful
for your understanding during the programme.
• My managers at SAP South Africa during the three years of my studies,
Laura King, Brent van Rooyen, Yushaa Abrahams and Bella de Freitas for
your support and accommodating of my study requirements.
• My study colleagues, Naresh Ashok, Sheleena Govind, Benhilda Moyo and
Prabashnee Naidoo for your support and assistance during this journey that
made my experience of the programme all the more rewarding.
• My friends for standing by me during these three years. I know that I have
asked a great deal in accepting my limited time and attention and remaining
my close friends – thank you.
• My cousin, Kay Naidu, for your guidance from my first year and for allowing
me the opportunity to learn my own lessons and find my own way through
these three years.

Association between employee motivation and
employee demographics in the banking industry
____________________________________________________________________________________
___________________________________________ v
TABLE OF CONTENTS
ABSTRACT ...................................................................................... I
DECLARATION ............................................................................... II
DEDICATION ................................................................................. III
ACKNOWLEDGEMENTS .............................................................. IV
LIST OF TABLES .........................................................................VIII
LIST OF FIGURES ......................................................................... X
CHAPTER 1: ORIENTATION .......................................................... 1
1.1 INTRODUCTION .......................................................................................... 1
1.2 PURPOSE AND OBJECTIVES OF STUDY ......................................................... 2
1.3 STATEMENT OF THE PROBLEM AND SUB-PROBLEMS ....................................... 3
1.4 DELIMITATIONS AND ASSUMPTIONS .............................................................. 3 1.4.1 DELIMITATIONS ................................................................................................... 3 1.4.2 ASSUMPTIONS .................................................................................................... 4
1.5 IMPORTANCE OF STUDY .............................................................................. 5
1.6 OUTLINE OF RESEARCH REPORT .................................................................. 6
1.7 CONCLUSION ............................................................................................. 6
CHAPTER 2: DISCUSSION OF THEORY – CULTURE AND MOTIVATION .................................................................................. 8
2.1 INTRODUCTION .......................................................................................... 8
2.2 CULTURE THEORY ..................................................................................... 8 2.2.1 DEFINITION ......................................................................................................... 8 2.2.2 SOCIAL IDENTITY GROUP DYNAMICS ................................................................... 11 2.2.3 CULTURAL DIMENSIONS .................................................................................... 13 2.2.4 CULTURAL DIVERSITY ....................................................................................... 17
2.3 MOTIVATION THEORY ............................................................................... 21 2.3.1 DEFINITION OF MOTIVATION .............................................................................. 21 2.3.2 NEEDS THEORY ................................................................................................ 22 2.3.3 EQUITY THEORY ............................................................................................... 23 2.3.4 EXPECTANCY THEORY ...................................................................................... 24 2.3.5 JOB DESIGN MODEL ......................................................................................... 25 2.3.6 ORGANISATIONAL DESIGN ................................................................................. 27
2.4 CONCLUSION ........................................................................................... 30

Association between employee motivation and
employee demographics in the banking industry
____________________________________________________________________________________
___________________________________________ vi
CHAPTER 3: REVIEW OF PRIOR STUDIES – CULTURE AND MOTIVATION ................................................................................ 31
3.1 INTRODUCTION ........................................................................................ 31
3.2 SOUTH AFRICAN CULTURE........................................................................ 31 3.2.1 HISTORY .......................................................................................................... 31 3.2.2 POWER SHIFTS ................................................................................................. 33 3.2.3 SOCIAL IDENTITY CHANGES ............................................................................... 40 3.2.4 GENERATIONS .................................................................................................. 43 3.2.5 MANAGING DIVERSITY ....................................................................................... 49
3.3 EMPLOYEE MOTIVATION ........................................................................... 53
3.4 CONCLUSION ........................................................................................... 57
CHAPTER 4: RESEARCH METHODOLOGY ............................... 59
4.1 INTRODUCTION ........................................................................................ 59
4.2 HYPOTHESIS............................................................................................ 59
4.3 RESEARCH DESIGN .................................................................................. 60
4.4 METHODOLOGY ....................................................................................... 63 4.4.1 SAMPLE ........................................................................................................... 63 4.4.2 MEASUREMENT INSTRUMENT ............................................................................. 64 4.4.3 ADMINISTERING PROCEDURE ............................................................................. 68 4.4.4 ANALYSIS OF DATA............................................................................................ 70
4.5 LIMITATIONS ............................................................................................ 71
4.6 ETHICAL CONSIDERATIONS ........................................................................ 72
4.7 CONCLUSION ........................................................................................... 73
CHAPTER 5: RESEARCH RESULTS ........................................... 75
5.1 INTRODUCTION ........................................................................................ 75
5.2 FINAL SAMPLE SIZE .................................................................................. 75
5.3 RESPONDENT PROFILE ............................................................................. 75
5.4 RELIABILITY ANALYSIS AND DATA DISTRIBUTION .......................................... 78
5.5 DIFFERENCES IN MOTIVATION BETWEEN DEMOGRAPHICS ............................. 83 5.5.1 HYPOTHESIS 1: GENDER DIFFERENCES.............................................................. 83 5.5.2 HYPOTHESIS 2: GENERATION DIFFERENCES ....................................................... 87 5.5.3 HYPOTHESIS 3: RACE DIFFERENCES .................................................................. 91 5.5.4 HYPOTHESIS 4: ORGANISATIONAL LEVEL DIFFERENCES ...................................... 96 5.5.5 HYPOTHESES SUMMARY ................................................................................. 101
5.6 RANK OF MOTIVATION FACTORS BY DEMOGRAPHIC CATEGORY ................... 103 5.6.1 GENDER RANK ................................................................................................ 103 5.6.2 GENERATION RANK ......................................................................................... 104 5.6.3 RACE RANK .................................................................................................... 106 5.6.4 ORGANISATIONAL LEVEL RANK ......................................................................... 107 5.6.5 RANK SUMMARY ............................................................................................. 109
5.7 CONCLUSION ......................................................................................... 110
Association between employee motivation and
employee demographics in the banking industry
____________________________________________________________________________________
___________________________________________ vii
CHAPTER 6: DISCUSSION, CONCLUSION AND RECOMMENDATIONS................................................................ 111
6.1 INTRODUCTION ...................................................................................... 111
6.2 DISCUSSION .......................................................................................... 111
6.3 RECOMMENDATIONS .............................................................................. 117
6.4 RECOMMENDATIONS FOR FUTURE RESEARCH ........................................... 120
6.5 CONCLUSION ......................................................................................... 121
REFERENCES ............................................................................ 123
APPENDICES ............................................................................. 129
APPENDIX A: SURVEY INSTRUMENT .................................................................... 129 APPENDIX A.1: EMPLOYEE MOTIVATION SURVEY .............................................................. 129
APPENDIX B: COMMUNIQUE ............................................................................... 134 APPENDIX B.1: LETTER FROM SBL CONFIRMING RESEARCHER AS BONA FIDE STUDENT ...... 134 APPENDIX B.2: EMAIL TO PILOT SAMPLE ........................................................................... 135 APPENDIX B.3: INITIAL EMAIL TO NON-BANKING EMPLOYEES .............................................. 136 APPENDIX B.4: INITIAL EMAIL TO BANKING EMPLOYEES ..................................................... 136 APPENDIX B.5: REMINDER EMAIL TO NON-BANKING EMPLOYEES ........................................ 137 APPENDIX B.6: REMINDER EMAIL TO BANKING EMPLOYEES ............................................... 138 APPENDIX B.7: ORIGINAL PROPOSAL LETTER TO SOUTH AFRICAN BANK ............................ 139 APPENDIX B.8: ORIGINAL PROPOSAL PRESENTATION TO SOUTH AFRICAN BANK ................. 141
APPENDIX C: SUPPLEMENTARY DATA ANALYSIS ................................................... 142 APPENDIX C.1: INDEPENDENT TWO SAMPLE T-TEST FOR GENDER ..................................... 142 APPENDIX C.2: ONE-WAY ANOVA FOR GENERATION (SCHEFFE) ..................................... 144 APPENDIX C.3: ONE-WAY ANOVA FOR RACE (SCHEFFE) ................................................ 147 APPENDIX C.4: ONE-WAY ANOVA FOR ORGANISATIONAL LEVEL (SCHEFFE) ..................... 150
Association between employee motivation and
employee demographics in the banking industry
____________________________________________________________________________________
___________________________________________ viii
LIST OF TABLES
Table 2.1 Key features of mechanistic and organic structures .................. 28
Table 2.2 Comparison of basic motivation categories ............................... 29
Table 3.1 Selected SA demographic statistics (1970s) ............................... 33
Table 3.2 Management employees by race and gender (2007) .................. 37
Table 3.3 Financial Sector Charter performance review (2006) ................. 40
Table 3.4 Examples of characteristics of femininity and masculinity ....... 51
Table 3.5 Manopoulos’ categorization of motivation factors ..................... 53
Table 3.6 Herzberg categorisation of Kovach’s motivation factors ........... 55
Table 4.1 Questionnaire statements link to motivation factors ................. 65
Table 4.2 Demographic variable values ....................................................... 70
Table 5.1 Composition of employee sample by demographics ................. 76
Table 5.2 Kendall’s tau-b for questions linked to motivation factors ........ 78
Table 5.3 Likert scale coding ........................................................................ 79
Table 5.4 Summary statistics per motivation factor ................................... 80
Table 5.5 Selected summary statistics for Gender ..................................... 85
Table 5.6 Independent two sample t-test for Gender .................................. 86
Table 5.7 Selected summary statistics for Generation ............................... 88
Table 5.8 One-way ANOVA for Generation .................................................. 89
Table 5.9 Homogenous subsets for Generation .......................................... 91
Table 5.10 Selected summary statistics for Race ....................................... 93

Association between employee motivation and
employee demographics in the banking industry
____________________________________________________________________________________
___________________________________________ ix
Table 5.11 One-way ANOVA for Race ........................................................... 94
Table 5.12 Homogenous subsets for Race .................................................. 95
Table 5.13 Selected summary statistics for Organisational level .............. 97
Table 5.14 One-way ANOVA for Organisational level ................................. 98
Table 5.15 Homogenous subsets for Organisational level ....................... 100
Table 5.16 Summary view of hypotheses testing ...................................... 101
Table 5.17 Intrinsic/Extrinsic comparisons................................................ 102
Table 5.18 Rank of motivation factors for Gender .................................... 103
Table 5.19 Rank of motivation factors for Generation .............................. 104
Table 5.20 Rank of motivation factors for Race ........................................ 106
Table 5.21 Rank of motivation factors for Organisational level ............... 107
Table 5.22 Summary view of ranking ......................................................... 109

Association between employee motivation and
employee demographics in the banking industry
____________________________________________________________________________________
___________________________________________ x
LIST OF FIGURES
Figure 2.1 Three levels of uniqueness in mental programming ................. 10
Figure 2.2 Diversity management policy evolution ..................................... 17
Figure 2.3 Primary and secondary diversity dimensions ........................... 19
Figure 2.4 Model of multicultural understanding ........................................ 20
Figure 2.5 The Motivation Process ............................................................... 21
Figure 2.6 Maslow’s hierarchy of needs ...................................................... 22
Figure 2.7 Vroom’s Expectancy Theory ....................................................... 25
Figure 2.8 Job Characteristics Model ........................................................... 27
Figure 3.1 Power shifts in South Africa post apartheid .............................. 34
Figure 3.2 The changing nature of the workforce and leadership styles .. 47
Figure 3.3 Immaturity/Maturity continuum ................................................... 48
Figure 4.1 Hypotheses ................................................................................... 70
Figure 5.1 Factor 1 Distribution .................................................................... 81
Figure 5.2 Factor 2 Distribution .................................................................... 81
Figure 5.3 Factor 3 Distribution .................................................................... 81
Figure 5.4 Factor 4 Distribution .................................................................... 81
Figure 5.5 Factor 5 Distribution .................................................................... 82
Figure 5.6 Factor 6 Distribution .................................................................... 82
Figure 5.7 Factor 7 Distribution .................................................................... 82
Figure 5.8 Factor 8 Distribution .................................................................... 82

Association between employee motivation and
employee demographics in the banking industry
____________________________________________________________________________________
___________________________________________ xi
Figure 5.9 Factor 9 Distribution .................................................................... 83
Figure 5.10 Factor 10 Distribution ................................................................ 83
Figure 5.11 Gender comparison of means ................................................... 84
Figure 5.12 Generation comparison of means ............................................ 87
Figure 5.13 Race comparison of means ....................................................... 92
Figure 5.14 Organisational level comparison of means ............................. 96
Figure 5.15 Rank of motivation factors for Gender ................................... 104
Figure 5.16 Rank of motivation factors for Generation ............................ 105
Figure 5.17 Rank of motivation factors for Race ....................................... 107
Figure 5.18 Rank of motivation factors for Organisational level ............. 108

Association between employee motivation and
employee demographics in the banking industry
____________________________________________________________________________
___________________________________________
1
CHAPTER 1: ORIENTATION
1.1 Introduction
“Intercultural sensitivity is not natural. It is not part of our primitive past, nor has
it characterised most of human history. Cross-cultural contact has often been
accompanied by bloodshed, oppression or genocide. Clearly, this pattern
cannot continue. Today, failure to exercise intercultural sensitivity is not simply
bad business or bad morality – it is self destructive. So we face a choice:
overcome the legacy of our history, or lose history for all time” (Bennet in ABSA,
2005b).
South African (SA) history has inflicted high degrees of physiological and
psychology turmoil on its citizens. Under the apartheid regime, blacks
experienced humiliating challenges from which buses they were allowed to
board on the way home to which toilets were designated for their use, while
whites were constantly plagued with worry of being the minority in power and
implemented firm and harsh policies to sustain their superiority (Beaty and
Harari, 1987). The freeing of Mandela marked a milestone in SA history as the
beginning of a transformation process that would bring new challenges for
nation but under the umbrella of a more equitable “rainbow nation” (Booysen,
2007b). The election in 1994 specifically transferred power, practically over-
night, to the blacks. These power shifts came not only in a political sense, but
soon in an economic, legislative and social form as well. While equality was the
undertone of the all the power shifts, SA was not starting from a clean slate, but
was simultaneously grappling through traces of discrimination from its “previous
life”. Job-hopping among high calibre blacks, emigration of valuable white talent
in scarce skills, concerns over tokenism regarding recruitment of blacks, black
women claiming that white males still hold influential positions in business and
coloureds and indians accusing the new SA of being a “reverse apartheid” are
among the most salient issues (Booysen, 2007c) that the current democratic
regime needs to resolve during this phase of transformation.

Association between employee motivation and
employee demographics in the banking industry
____________________________________________________________________________
___________________________________________
2
A key commonality among the symptoms of transformation listed above is the
problem of employee attrition. Diversity management specialists strongly
propose a paradigm shift in management practices away from traditional
leadership towards transformational leadership (Booysen, 2001) to improve
employee retention. They recommend that a heterogeneous workforce be
managed as such, with multiculturalism and not acculturation. SA leadership
needs to embrace an integrative approach (Allard, 2002), where differences are
appreciated and uniqueness is respected. The humanistic philosophy of Ubuntu
(meaning “I am because we are”) and its embeddedness in African culture is
pitched as the reference point for transformation leadership, valuing
cooperation, caring, respect and generally being good and working for a
common good (Booysen, 2001). Leadership studies have identified a significant
misalignment between Ubuntu and Eurocentric management practices while
new support for an Afrocentric style of management that embraces the culture
of Ubuntu is evident.
However, if diversity of the SA workforce demands integrative leadership
practices and assimilation is being discouraged then that brings an added
complexity of understanding what motivates employees from the different
cultures. The salient social identities of race and gender are specific to SA, but
internationally age and organisational levels have also proved to be challenging
differentiating characteristics for managers when trying to maintain high
motivation levels among employees (Wong, Sui and Tsang, 1999).
1.2 Purpose and Objectives of Study
The main objective of the study is to support retention efforts in the South
African banking industry by furthering the understanding of what motivates their
employees.
Among the associated objectives are:
• Provide a prioritised list of motivators that managers can integrate within
their existing retention strategy

Association between employee motivation and
employee demographics in the banking industry
____________________________________________________________________________
___________________________________________
3
• Identify key differences in the sources of motivation among the diverse SA
cultures
• Add to the existing South African body of knowledge in the field
• Ensure versatility of the research through the use of globally accepted
theoretical models to facilitate inclusion in future studies of a similar nature
and in so doing, support comparative analysis
1.3 Statement of the problem and sub-problems
Problem statement: To identify any associations between employee motivation
factors and employee demographics (gender, age, race, organisational level) in
the South African banking industry.
Subproblem 1: To identify any associations between employee motivation
factors and gender in the South African banking industry.
Subproblem 2: To identify any associations between employee motivation
factors and age in the South African banking industry.
Subproblem 3: To identify any associations between employee motivation
factors and race in the South African banking industry.
Subproblem 4: To identify any associations between employee motivation
factors and organisational level in the South African banking industry.
1.4 Delimitations and assumptions
1.4.1 Delimitations
• The study has been restricted to confirming the theory within the employee
population of the SA banking industry.
• Only four demographic dimensions, viz. gender, age, race and
organisational level will be included in the research study

Association between employee motivation and
employee demographics in the banking industry
____________________________________________________________________________
___________________________________________
4
• The race demographic is restricted to the four official South African race
groups: black africans, coloureds, indians and whites
• The age demographic will be analysed by a categorization that is equivalent
of the following three generations (McNally, 2007; Yu and Miller, 2005):
• Veterans (1920-1944): 64-88 years old
• Baby Boomers (1945-1964): 44-63 years old
• Generation X (1965-1980): 28-43 years old
• Generation Y (1981-1999): 9-27 years old
• The organisation levels that will be included in the study are (Financial
Sector Charter Council, 2008):
• Senior management
• Middle management
• Junior management
• Non-management
1.4.2 Assumptions
• It is assumed that all participants in the study are South African citizens and
can therefore be identified within one of the official race groups
• It is assumed that all employees in the sample can be categorised by the
four age generations
• It is assumed that all employees in the sample can be categorised by the
four organisational levels

Association between employee motivation and
employee demographics in the banking industry
____________________________________________________________________________
___________________________________________
5
1.5 Importance of study
Employee retention is a global concept which, in large companies, involves
dedicated teams who devise strategies to reduce their organisation’s attrition
rate. In SA, however, retention strategies are executed on the backdrop of
historical sentiments including discrimination, oppression and distrust. These
varying degrees of emotion are based on the differentiators that make the SA
workforce diverse. SA leaders are therefore tasked, not only with respecting the
diverse workforce and its emotions, but also appreciating the same diversity
(Allard, 2002) as leverage for employee motivation. One of the key questions in
this sphere of managing and valuing diversity is to ascertain the motivation
factors per diversity group. By understanding what motivates the members of
each group to perform optimally, leaders are more capable of extracting value
from the diversity of their employees. Integrating this knowledge with leadership
in SA, can realise various benefits:
• The injection of black South Africans and women into organisations has
been highlighted as a major change in the cultural diversity issues relevant
to leadership and the workforce in SA. A mind shift has already been
initiated to recognise the value that traditional women’s skills and
experience can add to leadership. Contrary to historical management styles,
a feminine (as opposed to masculine) approach to leadership has the
advantage of alignment with the spirit of equality and an increasing
worldwide inclination towards horizontal organisations and workforce
empowerment (Booysen and Nkomo, 2006).
• Recognizing the reality of a truly South African workforce will require
development of more indigenous management practices. This includes
embracing Afrocentric management values that factor in very specific South
African contextual and cultural factors, such as Ubuntu (Booysen, 2001).
• Innovation, challenging environments and leverage of resources are key
success factors in the competitive advantage of a company’s strategy.
Diversity management can have direct impact on the quality of innovative

Association between employee motivation and
employee demographics in the banking industry
____________________________________________________________________________
___________________________________________
6
delivery and is critical as a capability of SA organisations to compete in
today’s highly competitive, global marketplace (ABSA, 2005a).
1.6 Outline of research report
The report is broadly divided into two logical sections: the review of existing
literature and the specific research study. Chapter 1 (current chapter) provides
an introduction to the study and additional detail on the purpose and importance
of the study. Other orientation-related aspects are also discussed. Chapter 2
introduces the theory behind the two key components of the study, that is,
culture and motivation. The discussion is kept generic. Chapter 3 introduces the
South African context and combines the theory from the previous chapter,
predominantly culture-related, to deliver an integrated discussion of SA culture.
As one of the demographic variables of the report, research on age in the form
of generations is then considered before studies on cultural diversity is
introduced. Past motivation studies are also highlighted with their links to the
theorists mentioned in Chapter 2. Having covered the existing literature section
of the report, Chapter 4 discusses the specific research study with an in depth
discussion of the research design and methodology. Chapter 5 analyses the
results of the data collected by the methodology employed and uses the data to
test the hypotheses. The chapter also includes a rank of the motivation factors
for each demographic variable. Chapter 6 combines the theories presented in
chapter 2, the previous studies presented in chapter 3 and the results of this
study presented in chapter 5 to derive conclusions and propose
recommendations.
1.7 Conclusion
This chapter has set the scene for the rest of the report. A brief introduction
highlighted the salient points of the study with a chronological review of events
that motivates for a study of this nature in SA.
The goals of the study were then made explicit to guide the research along a
clear path. This included the main problem and subproblems that will be

Association between employee motivation and
employee demographics in the banking industry
____________________________________________________________________________
___________________________________________
7
investigated during the course of the study. The delimitations and assumptions
are crucial in defining the scope of the study with clear boundaries to ensure
that the study is completed within the allotted timelines.
Towards the close of the chapter, the benefits of the research were made
explicit. It is important that such a study hold benefits that are wider than its
problems and subproblems and that the bigger picture is kept in mind. This
sentiment is reiterated in the objective that the study be conducted with the
flexibility for its results to be integrated into future studies.
Before delving into previous studies regarding culture and motivation, it is
necessary to introduce these subjects through their related theories to better
appreciate the studies that have been conducted in these areas. These theories
follow in the next chapter.

Association between employee motivation and
employee demographics in the banking industry
____________________________________________________________________________
___________________________________________
8
CHAPTER 2: DISCUSSION OF THEORY – CULTURE
AND MOTIVATION
2.1 Introduction
Before attempting to conduct a research study one needs to establish a clear
understanding of the various theories that have been published over history.
This will ensure that a comprehensive study is conducted which will add value
to the respective field. The chapter therefore includes a generic discussion of
the various theories associated with firstly culture and secondly motivation. The
discussion begins with the acknowledgement that culture is not a simple
concept, but has various dimensions and components that demand attention as
one is trying to create an understanding. The second half of the chapter focuses
on motivation theory and begins once again with a definition. The simplicity of
this definition relative to culture is noted, but only until one enters the discussion
of specific motivation theories. The theories have been categorised to facilitate
understanding and allow cross-discussion of the theories highlighting their
similarities and differences. The integration of all the mentioned motivation
theories closes the chapter.
2.2 Culture Theory
2.2.1 Definition
Triandis and Suh (2002) provides a clear indication of the experience of trying
to define culture when he says “the conceptualization of culture is by no means
a simple matter.” In his attempt to succinctly define culture, Schein (1990)
begins with the definition that “culture is what a group learns over a period of
time as that group solves its problems of survival in an external environment
and its problems of internal integration”. He considers from systems theory,
Lewinian field theory and cognitive theory that systems tend towards an
equilibrium, attempting to reduce dissonance and align basic categories or

Association between employee motivation and
employee demographics in the banking industry
____________________________________________________________________________
___________________________________________
9
assumptions. He adds that systems containing sub-systems complicates the
total system and challenges the tendency towards equilibrium.
Schein (1990) defines culture as a pattern of basis assumptions, invented,
discovered or developed by a group, while it learns to cope with its problems of
external adaptation and internal integration, which has worked well enough to
be considered valid and is therefore taught to new members as the correct way
to perceive, think and feel in relation to those problems. The idea of a
successful set of assumptions that can be considered valid and transmitted to
future generations is reiterated by Triandis et al. (2002) citing Kluckhohn (1954),
who goes on to say “culture is to society what memory is to individuals”.
According to Booysen (2007c), House (1993) and House, Hanges, Javidan,
Dorfman and Gupta (2004) define culture as common experiences of individuals
which result in shared motives, values, beliefs, identities and interpretations or
meanings of significant events.
Trompenaars (1993) discusses three layers of culture namely, explicit artefacts
and products, a middle layer of norms and values and an inner core of
assumptions about existence. The explicit layer refers to the observable reality
of language, food, buildings, monuments, fashion, etc. Norms on the other hand
are a mutual sense a group has regarding “right” and “wrong” and therefore how
one should behave. Values determine the definition of “good and bad” and
therefore direct how one aspires or desires to behave. At the core are basic
differences in values between cultures that are necessary for human existence.
Trompenaars (1993) proposes “survival” as one of the basic values that people
strive for.
Schein (1990) defines culture within the realms of psychology and
anthropology. This view is supported by Hofstede (1980, 1994) referenced in
Human (1996) where he defines culture as the “collective programming of the
mind which distinguishes one group of people from another”. Human (1996)
refers to this as the classical maximalist definition of culture. In reference to the
current debates on culture definition and measurement, she places the
protagonists on a continuum between maximalists (universalists) and

Association between employee motivation and
employee demographics in the banking industry
____________________________________________________________________________
___________________________________________
10
minimalists (particularists). Maximalists argue that a person’s culture will tend to
determine how that person interacts with others, while minimalists support the
notion that culture is determined to a large extent by the perception of the other
party in the interaction.
Hofstede (1991) in Booysen (2007c) extends his definition of human mental
programming to identify three levels: human nature, culture and personality:
Personality
Cultural
Human nature
Specific to group
or category
Universal
Specific to
Individual
Inherited and
learned
Learned
Inherited
Personality
Cultural
Human nature
Personality
Cultural
Human nature
Specific to group
or category
Universal
Specific to
Individual
Inherited and
learned
Learned
Inherited
Source: Hofstede (1991) in Booysen (2007c).
Figure 2.1 Three levels of uniqueness in mental programming
According to Hofstede (1991), human nature is inherited and universal and is
the basis of one’s physical and psychological functioning. Booysen (2007c)
confirms that this level is independent of any cultural influences and relates only
to one’s ability to express needs, feelings and emotions. However, the next
level “culture” determines how one reacts via feelings, emotions and actions to
interpretations of the environment. This level is also specific to a group or
category and is learned. The final level, “personality”, is specific to an individual
and is inherited and learned and relates to that individual’s personal
interpretations and associated adjustments of the environment (Hofstede,
1991). Personality is described as a function of genetic and environment
influences which is confirmed by Triandis et al. (2002) who also states that
cultural influences are the most important component of environmental
influences. He cites Funder (1997) who defines personality as “an individual’s
characteristic pattern of thought, emotion and behaviour, together with
psychological mechanisms – hidden or not – behind those patterns.”

Association between employee motivation and
employee demographics in the banking industry
____________________________________________________________________________
___________________________________________
11
2.2.2 Social Identity group dynamics
In an attempt to explain the influence of intergroup interaction on human
behaviour, many studies have been based on social identity theory (SIT)
delivered by Turner and Giles in 1981 (Booysen, 2007a). SIT, a cognitive
theory, proposes that individuals are prone to identify with others in common
social categories and this in turn influences human interaction. Booysen
(2007b) identifies three components of the psychological and sociological
aspects of group behaviour:
• Categorisation refers to individuals classifying themselves and others into
categories, for example, Indians, 20-somethings and white males
• Identification occurs when individuals associate themselves with a certain
group in so far as it boosts their self-confidence
• Comparison describes individuals comparing groups to identify favourable
bias against competing groups
The differentiation of people through categorisation is extended in self-
categorisation theory particularly in reference to the “self” (Booysen, 2007a). It
explains how the characteristics of the category are assumed by the individual.
These characteristics include attitudes and behaviours of the group that are
deemed normative and cause those individuals who associate with the category
to think and behave in line with the norm (as defined by the category).
Stereotypes emerge when category prototypes are formed by like minded
individuals who perceive that they share common features. It is explained
further that re-personalisation categorises the ingroup fellow adherents and
outgroup members and results in individual identities becoming submerged by
stereotypical features which explains in-group favouritism and out-group
derogation (Herriot & Scott-Jackson, 2002). This also indicates a fluid nature of
identity where deindividualisation refers to the influence of changes in
psychological processes of the group on the individual to evolve or adapt in
tandem. Self-categorisation explains how some social identities gain saliency in

Association between employee motivation and
employee demographics in the banking industry
____________________________________________________________________________
___________________________________________
12
an environment, for example, race (black, coloured, indian, white) and gender
(female, male) in South Africa.
In reference to some of her own work with Nkomo (2006), Booysen relates
findings that race is the dominant categorisation in the South African workplace
while gender, ethnicity and professional identity are social identities that are
usually embedded in the primary group identification (that is, race
categorisation) for intra-group variation purposes.
Booysen (2007b) makes reference to Roccas and Brewer (2002) who argues
that one category evaluates others based on one dominant categorisation, also
known as the primary categorisation or most salient categorization. Those
individuals who share the salient social identity are known to the individuals’
category as in-group members and those who don’t have these characteristics
in common, are known as out-group members. Booysen (2007a) relates further
that research identifies ethnic or cultural groups as being a highly utilized
common denominator in social identification or identity formation (Bornman,
1999).
As per Schein’s (1990) consideration of systems theory in defining culture and
Alderfer’s (1986) embedded group theory in Booysen (2007a), two others
aspects need some consideration: i) the effect of dominance between social
identity groups and within social identity groups and ii) the influence of
suprasystems on sub-systems.
For her study, Booysen (2007a) defines social identity conflict as “any
discordant transaction that occurs between members of different social identity
groups, which can be attributed to identity group membership, and which
causes members of either group to feel unsafe, undervalued or disrespected”.
Embedded group theory firstly identifies the dominance between social identity
groups and the related in- and out- group dynamics. Dominance may exist in
number, hierarchy, status, power or access. The theory goes further to
describes the influence of supra-systems on subsystems where dynamic
parallel processes between the two levels of systems include forces of

Association between employee motivation and
employee demographics in the banking industry
____________________________________________________________________________
___________________________________________
13
dominance and subordinance combined with efforts for mutual reinforcing and
conflict. Alderfer (1986) summarises: “The effects of one’s own group’s
occupying a favourable position in a system may be muted by its being at a
relative disadvantage in the supra-system”.
2.2.3 Cultural Dimensions
Many research studies have been conducted to identify a universal list of
cultural dimensions that can be used to describe the culture of a specific
context. However, the complexity highlighted in the definition of culture
penetrates even deeper to identifying an all-encompassing list. Different
researchers have their preferences, for example, Booysen (2001) in her studies
at South African retail banks regarding Afrocentric and Eurocentric
management styles used the cultural dimensions of House, Wright and Aditya
(1997), while Licht, Goldschmidt and Schwartz (2007) used his own version in
his study of foundations of law and governance.
Complexity was described by Chick (1997) in Triandis et al. (2002) as the
dimension that contrasted hunters/gatherers from information societies. The
indices of cultural complexity include, among others, gross national product per
capita, percent of population that is urban, size of cities and personal computers
per capita.
Triandis et al. (2002) also described the dimension of tightness in reference to
his own earlier work (Triandis, 1994, 1995) as the degree of enforcement of
norms in a culture. Tight cultures strongly enforce a normative system while
loose cultures tolerate deviations. The latter is predominant in heterogeneous
societies, where multiple normative systems exist, people exercise
independence and population density is high (limiting surveillance).
Of all the dimensions, the most important dimension (Triandis, 2004) is
individualism and collectivism. Hofstede (1980) cited in Triandis (2004), House
(2004) referenced in Booysen (2007a) and the GLOBE project (Javidan, 2006)
all included this dimension or derivatives thereof in their studies. Collective
societies are generally considered tight and simple (Triandis et al., 2002).

Association between employee motivation and
employee demographics in the banking industry
____________________________________________________________________________
___________________________________________
14
Collectivists believe behaviour is due to external factors, such as norms and
roles and not internal factors, such as attitudes and personalities (Triandis,
2004). People give priority to ingroup goals rather than personal goals. There is
a high concern for relationships which are maintained with high priority,
especially in conflict situations. Individualism, on the other hand, is polar to
collectivism, where the personal goals, justice at the expense of relationships
and autonomy is emphasized. These societies are typically complex and loose.
Triandis et al. (2002) distinguishes between vertical and horizontal variances of
collectivism and individualism. Vertical collectivists value tradition, in-group
cohesion, respect for in-group norms and authority. Horizontal collectivists are
more concerned with empathy, sociability and cooperation. Vertical individualist
cultures are driven by competition and being the best to scale the hierarchy,
while horizontal individualists de-emphasise hierarchical differentiation and
focus on self-reliance, independence from others and uniqueness.
A further derivation of this dimension is delivered by House et al. (2004) in
Booysen (2007c) where he separates the dimension in-group and institiutional
encouraging of individualism/collectivism. Institutional individualism refers to
organisational and societal institutional practices encouraging prioritizing of
personal goals, conflict, independent views, competition for recognition and
rewards. Institutional collectivism occurs when societal institutions emphasise
group integration, group involvement in societal, legislative, economic, social
and political processes, team work, lack of competition and conformity. In-group
individualism involves loose ties between individuals, personal goals overruling
group goals, privacy, attention to self and close family and individual freedom.
In-group collectivism focuses on pride in membership of small groups,
interdependence, collective behaviour, strong in-group ties, protection of
members and in-group loyalty.
Triandis et al. (2002), in reference to his own work (Triandis, 1985) raised
another perspective of individualism and collectivism when he argued that this
dimension can be viewed from a cultural and individual level of analysis where
allocentrism and idiocentrism would be the respective references. Idiocentrics

Association between employee motivation and
employee demographics in the banking industry
____________________________________________________________________________
___________________________________________
15
emphasise self-reliance, competition, uniqueness and hedonism while
allocentrics emphasise interdependence, sociability, family integrity and take
into account the needs and wishes of in-group members. Triandis (2004) goes
further to say that the allocentric/idiocentric ratio in collectivist cultures is
approximately 65:35 and the converse is true for individualist cultures.
Idiocentrics in collective cultures will feel dominated by the culture and want to
escape, while allocentrics in individualist cultures will yearn for groups such as
associations, unions, social movements and communes.
A high association exists between Hofstede’s (1980) collectivism/ individualism
dimension and Schwartz (2000) embeddedness/autonomy dimension
respectively. Embeddedness, similar to collectivism, emphasises the individual
committing to and maintaining the status quo, traditional order and restriction on
behaviours that would disturb group solidarity. Polarised to embeddedness,
autonomy encourages uniqueness and is further subdivided into two variations.
Intellectual autonomy relates to individuals independently pursuing their own
ideas and intellectual directions, while affective autonomy relates to individuals
pursuing an affectively positive experience.
Hofstede (1980) in Triandis (2004) also identified Power Distance, which House
et al (2004) describes as the extent to which society minimises (low power
distance) or sustains (high power distance) inequalities of power and status
between individuals and groups in all levels of society (Booysen, 2007c).
Triandis (2004) has associated high power distance with vertical variances of
individualism/collectivism and low power distance with the horizontal variances
of individualism/collectivism mentioned above. Licht et al. (2007) includes in his
list of dimensions “hierarchy/egalitarianism” where high power distance is
similar to a hierarchical culture and low power distance can be aligned to an
egalitarian society.
Javidan et al. (2006) refers to Uncertainty Avoidance as the extent to which a
society, organisation or group places emphasis on social norms, rules and
procedures to ensure the predictability of future events. Triandis’ (2002)
dimension of tightness has direct relevance where a culture with high

Association between employee motivation and
employee demographics in the banking industry
____________________________________________________________________________
___________________________________________
16
uncertainty avoidance can be viewed as a tight society and the converse would
reveal a loose culture. An example of a tight culture is Japan, which was even
tighter in the 19th century, where deviation from norms can be received with
great criticism (Triandis et al., 2002).
Masculinity and femininity was a further dimension from Hofstede (1980)
referenced in Licht et al. (2007), which refers to the degree that acquisition of
money and things is valued more than the high quality of life for others. Triandis
et al. (2002) correlates masculinity to domestic political violence. House et al.
(2004), in his extension of Hofstede (1980) is cited in Booysen (2007c) as
dividing this dimension into two new dimensions: gender egalitarianism and
assertiveness. Gender egalitarianism is the extent to which society maximises
or minimizes gender inequality while assertiveness refers to the extent to which
individuals are confrontational and aggressive in their interaction with others
(Javidan et al., 2006). According to House et al. (2004) it is possible to
consolidate these two dimensions into the masculinity/femininity dimension,
where high egalitarianism and low assertiveness describes a feminine culture
and low egalitarianism and high assertiveness refers to a masculine society.
House et al. (2004) includes three other dimensions including future orientation,
humane orientation and performance orientation. Future orientation is the
degree to which the culture encourages either past/present or future oriented
thoughts and actions. Humane orientation refers to the extent of
encouragement from society towards either hostile or aggressive behaviour
versus fairness, generosity and kindness towards others. A high performance
oriented culture emphasises achievement and excellence.
A third dimension from Licht et al. (2007) measures mastery or harmony in the
relation of humankind to the natural and social world. Mastery encourages
progress through self-assertion and exploitation of the natural and social
environment. House’s et al (2004) high assertiveness and high performance
orientation can be associated with mastery. Harmony, at the other pole,
emphasises acceptance of the social and physical world and trying to fit in,
which conversely relates to low assertiveness and low performance orientation.

Association between employee motivation and
employee demographics in the banking industry
____________________________________________________________________________
___________________________________________
17
2.2.4 Cultural Diversity
Booysen (2007c) emphasises the need to move away from assimilation or the
“melting pot” theory to multiculturalism where diversity can be leveraged for
competitive advantage. She identifies the risk of the potential alternative which
includes misunderstandings, conflict, dissension, superiority and disrespect. As
mitigation to these risks the following tasks are recommended for individuals in
diverse groups:
• Acknowledge that cultural differences can result in conflict and
misunderstanding
• Appreciate the differences between cultures in the groups and learn to
accommodate and respect such differences
• Identify the similarities between cultures that can be used in conjunction
with the differences to support each other and work effectively
According to Booysen (2007c), Allard (2002) refers to the policy evolution of
diversity management in America, depicted below. He discusses the movement
in the past 30 years away from assimilation’s melting pot towards the affirmative
action and equal opportunity programmes of differentiation and the present
focus on multiculturalism which appreciates diversity and simultaneously
encourages uniqueness in the realm of integration.
Assimilation
Treat everyone the
same
Differentiation
Capitalise on
differences
Integration
Appreciate
differences and respect
uniqueness
Assimilation
Treat everyone the
same
Differentiation
Capitalise on
differences
Integration
Appreciate
differences and respect
uniqueness
Source: Allard (2002:7) in Booysen (2007c).
Figure 2.2 Diversity management policy evolution
Allard (2002) continues to explain that in America, policy modelling starting at
the assimilation end of the model, rapidly shifted to the differentiation (an
opposite extreme to assimilation) and has settled in a more stable area of the
continuum that integrates elements of both extremes. He also cautions that

Association between employee motivation and
employee demographics in the banking industry
____________________________________________________________________________
___________________________________________
18
diversity theory is ahead of its practical implementation in organisations.
Booysen (2007c) draws a parallel to South Africa where organisations can be
positioned either in the extremes of assimilation or differentiation.
Cox and Blake (2002) in Booysen (2007c) explicitly identify key competitive
advantages of managing cultural diversity. They categorise the advantages
between i) “inevitability of diversity” which highlights that competitiveness is
dependent on the need to hire more women and minorities which is the
workforce demographics trend and ii) “value in diversity hypothesis” which
equals a net-added value to organisational processes.
The “inevitability of diversity” advantages include:
• Cost argument: Poor integration of increasingly diverse workforces will
result in increasing costs into the future
• Resource acquisition argument: Organisations with the better integration of
diverse workforces will attract the best personnel among women and ethnic
minorities
The “value in diversity hypothesis” advantages include:
• Marketing argument: Diverse workforces can increase the cultural sensitivity
of an organisation’s of marketing efforts to the respective sub-populations of
countries represented by personnel in the organisation’s workforce
• Creativity argument: Diversity of perspectives and alleviation of conformity
will increase the levels of creativity
• Problem-solving argument: Diverse workforces increase the heterogeneity
of decision making and problem solving groups resulting a greater variety of
perspectives, a higher level of critical analysis and ultimately more
thoroughly tested solutions
• System flexibility argument: Multiculturalism will demand a more fluid
system and therefore one that is more flexible to react to environmental
changes.

Association between employee motivation and
employee demographics in the banking industry
____________________________________________________________________________
___________________________________________
19
Allard (2002) classifies diversity into primary and secondary dimensions as
depicted in the figure below. Primary dimensions are core to the individual and
are immutable, for example, gender, race and physical appearance, while
secondary dimensions can be changed or modified and include education,
religion, income and family status. The combination of primary and secondary
dimensions delivers an individuals values, priorities and perceptions.
Text
Gender
Ethnic heritage
RaceMental/physical
abilities and
characteristics
Sexual Orientation
Age
Religion
Income
Work
Experience
Geographical
location
Organisational
role and level
Family status
Communication
style
Education
Work style
First language
Military
experience
Text
Gender
Ethnic heritage
RaceMental/physical
abilities and
characteristics
Sexual Orientation
Age
Religion
Income
Work
Experience
Geographical
location
Organisational
role and level
Family status
Communication
style
Education
Work style
First language
Military
experience
Source: Allard (2002) In Booysen (2007c).
Figure 2.3 Primary and secondary diversity dimensions
Allard (2002) argues further that multiculturalism extends beyond the self of
primary and secondary dimensions to include not only an independent view but
also an interdependent view within the organisation and among fellow
colleagues. Figure 2.4 below, depicts the family, organisational and community
influences with the global and larger cultural factors.

Association between employee motivation and
employee demographics in the banking industry
____________________________________________________________________________
___________________________________________
20
Source: Allard (2002) In Booysen (2007c).
Figure 2.4 Model of multicultural understanding
Trompenaars (1993) highlights the increasing urgency for international
managers to elevate their cultural intelligence as the concept of glocalisation
becomes more applicable to today’s global business landscape. On the one
hand, managers attempt to standardise on organisational design, systems and
procedures in their global organisations, however they simultaneously need to
adapt to local characteristics of the market, the legislation, the fiscal regime, the
socio-political systems and the cultural system. The “balance between
consistency and adaptation is essential for corporate success” (Trompenaars
(1993:3). Human (1996) argues that managing diversity programmes positioned
at promoting cultural intelligence sometimes incorrectly focus on managing
culture. She cautions against the following signs of this confusion. Firstly, the
definitions of culture in these programmes can be unnecessarily fixed and
inflexible. Secondly, social variables that are discussed are limited to national or
ethnic culture. Thirdly, these programmes tend to ignore the relationship
between power and culture and the related impact on performance. Finally
Human (1996) identifies that these programmes rarely request of delegates to
enter a mode of self-reflection to internalise the concepts and begin with any
change from within.
Culture theory will be used in the study to explain varying attitudes to
motivation. Thus, having discussed culture theory in detail, a critical account of
motivation theory follows as the second key topic of the research study.

Association between employee motivation and
employee demographics in the banking industry
____________________________________________________________________________
___________________________________________
21
2.3 Motivation Theory
2.3.1 Definition of Motivation
In his review of motivation theories, Ramlall (2004) starts his discussion with
reference to the Latin word “movere”, meaning to move. He argues further that
motivation represents “those psychological processes that cause the arousal,
direction, and persistence of voluntary actions that are goal oriented”,
specifically organisational goals (Mitchell, 1982). Robbins (1993) is also cited to
define motivation as the “willingness to exert high levels of effort toward
organisational goals, conditioned by the effort’s ability to satisfy some individual
need”. Robbins (1993) continues to explain the motivation process is initiated by
an unsatisfied need that creates tension in an individual and in turn creates
drives to resolve that tension. This drive results in the search for a need to
satisfy and in so doing reduce the tension. Figure 2.5 below, illustrates this
process.
Unsatisfied
needTension Drives
Search
behaviour
Satisfied need
Reduction of
tension
Unsatisfied
needTension Drives
Unsatisfied
needTension Drives
Search
behaviour
Satisfied need
Reduction of
tension
Search
behaviour
Satisfied need
Reduction of
tension
Source: Robbins (1993) In Ramlall (2004).
Figure 2.5 The Motivation Process
The implication of the above model is that when employees are motivated, they
are experiencing tension and to reduce the tension, they will exert effort. A
higher tension (energy) will result in a higher level of effort. While motivation
theorists differ in opinion as to the source of the energy, they generally agree
that motivation requires a “desire to act, ability to act and having an objective”
(Ramlall, 2004).
Ramlall (2004) categorises the theories reviewed into four categories: i) needs
theory, ii) equity theory, iii) expectancy theory and iv) job design model. The
following discussion on motivation theories uses the same structure. A review of
organisational design is used as a mechanism to integrate the various theories
discussed.

Association between employee motivation and
employee demographics in the banking industry
____________________________________________________________________________
___________________________________________
22
2.3.2 Needs Theory
Need theories pinpoint internal physiological and psychological deficiencies to
stimulate action. The strength of these needs is influenced by environmental
factors and is time and place dependent.
Maslow (1943), referenced in Ramlall (2004), was among the pioneers of
motivation theories and developed his classical five level hierarchy of human
needs: psychological and biological, safety, social, esteem and self-
actualisation.
Safety needs
Self-Actualisation
Esteem needs
Social needs
Biological and Psychological needsBasic life needs – air, food, drink, shelter, warmth, sleep, etc.
Protection, security,order, law, limits, stability, etc.
Family, affection, relationships, work groups, etc.
Achievement, status, responsibility, reputation
Personal growth and fulfilment
Source: Maslow (1943) In Ramlall (2004).
Figure 2.6 Maslow’s hierarchy of needs
He referred to these as basic needs and believed that all human beings strived
for self-actualization. The implication was that human beings are a perpetually
wanting group. In its application in the workplace, Maslow’s (1943) hierarchy
gave managers the foresight to satisfy upcoming needs in its employees.
Accordingly to Ramlall (2004), Champagne and McAfee (1989) argue that
managers who heeded these insights and acted on them were considered more
considerate, supportive and interested in employees’ welfare. An important
interaction of the levels is highlighted in Daryanto and Drayanto (undated) in
that individuals move up the hierarchy satisfying each level such that once a
level is satisfied, giving more of that level does not provide motivation. They go
further to describe Alderfer’s (1972) ERG theory, which holds that individuals
move through a similar hierarchy as Maslow’s (1943) with three levels:

Association between employee motivation and
employee demographics in the banking industry
____________________________________________________________________________
___________________________________________
23
existence, relatedness and growth. A fundamental difference with Maslow’s
hierarchy however is that Alderfer positions these three levels on a continuum
more than a hierarchy which allows combinations of the needs to be activated
and movement can be up or down the “hierarchy”. Daryanto et al. (undated)
also reference McClelland’s (1975) three socially acquired needs: power,
affiliation and achievement with a resemblance to Maslow’s hierarchy. Power
refers to the need to make others behave in a specific way, affiliation is the
desire for close and friendly interpersonal relationships, while achievement is
the drive to succeed and excel.
2.3.3 Equity Theory
Equity theory acknowledges the behaviour of individuals to compare the
absolute amount of the rewards with their efforts and that received by others.
The rewards include salary levels, increases and recognition (that is, tangible
and intangible outputs), while the inputs include effort, experience, education
and competence (Ramlall, 2004). Adams (1963) theory presented in Swinton
(2007) is one of the most in depth studies on social exchange relationships.
Equity theory is based on three assumptions: i) People develop beliefs of what
is considered equitable reward for their efforts on the job, ii) People can
compare outputs in the exchange with employees and iii) If people perceive
their rewards as unfair compared to others, they will be motivated to take action.
Organisations are therefore continuously challenged to develop reward systems
that are fair and equitable to distribute rewards that are aligned to the value that
employees associate to themselves for the organisation.
When employees believe that they are not being fairly rewarded, they have
various options: i) Reduce input through directly restricting work output to
realign the ratio of expected rewards versus received rewards, ii) Increase
output in search of salary increases or a more enjoyable assignment, iii)
Withdraw by quitting the job and seeking employment elsewhere.

Association between employee motivation and
employee demographics in the banking industry
____________________________________________________________________________
___________________________________________
24
2.3.4 Expectancy Theory
Ramlall (2004) describes expectancy theory as the expectation of combined
rewards that motivates people to perform an action, where the variances in the
degree of rewards are directly related to the degree of effort in the action.
Among the expectancy theories discussed is Vroom (1964) whose theory
assumes “choices made by a person among alternative courses of action are
lawfully related to psychological events occurring contemporaneously with the
behaviour.” Vroom’s theory is commonly referred to as the “VIE” theory which is
an abbreviation for the three mental components thought to instigate and direct
behaviour: valence, instrumentality and expectancy. Valence refers to the
emotional desire of people for the outcomes. An important attribute of the
valence component is that it specifically refers to the perceived satisfaction that
an individual expects from an outcome which is not necessarily equal to the real
value derived from the outcome for the individual. Instrumentality is the belief of
the probability of desired outcomes. Expectancy is an employees expectations
based on their confidence levels of what they are actually capable of doing.
Figure 2.7 below, depicts Vroom’s expectancy theory. Porter and Lawler
(1968), referenced in Ramlall (2004) extended Vroom’s work by attempting to
identify the sources of people’s valences and expectancies and link effort with
performance and job satisfaction. They concluded that the predictability of
performance was a factor of an employee’s abilities, traits and roles. Another
important conclusion in their studies was that employees’ expectation for future
effort-reward probabilities is based on past experiences of these probabilities.

Association between employee motivation and
employee demographics in the banking industry
____________________________________________________________________________
___________________________________________
25
Effort
Performance
Outcome (Reward)
Personal Goals
Expectancy?
Leads to…
Instrumentality?
Leads to…
Valence?
Effort
Performance
Outcome (Reward)
Personal Goals
Expectancy?
Leads to…
Instrumentality?
Leads to…
Valence?
Source: Vroom (1964) In Ramlall (2004).
Figure 2.7 Vroom’s Expectancy Theory
2.3.5 Job Design Model
Theories in this category are based on the premise that the task itself is key to
employee motivation, specifically a challenging job as opposed to a
monotonous one is more motivating.
Herzberg (1968) cited in Ramlall (2004) conducted among the earliest studies
into the effect of job design on motivation. Unlike Maslow’s five level hierarchy
(1943), Herzberg (1968) suggested a two factor theory which argued that
individual needs satisfaction does not progress in a hierarchy, but is influenced
by two distinct sets of factors: hygiene factors and motivating factors. Hygiene
factors (extrinsic) influences job dissatisfaction including pay, company policies,
working conditions and the nature of supervision while motivating factors
(intrinsic) influences job satisfaction including recognition, promotion,
achievement and opportunities for personal growth.
Herzberg (1968) views extrinsic factors being relevant to a dissatisfaction
continuum:
While, intrinsic factors are seen as applicable to a satisfaction continuum:

Association between employee motivation and
employee demographics in the banking industry
____________________________________________________________________________
___________________________________________
26
Extrinsic factors have a placating effect implying that when they are not
adequately met, employees will become dissatisfied with their job. However,
they do not contribute to any extent of satisfaction among employees, even if
they are adequately met as this only creates a neutral environment. On the
other hand, intrinsic factors do have direct impact on the satisfaction of
employees and therefore have the ability to generate satisfaction (motivation).
In 2005, Basett-Jones and Lloyd delivered a study that aimed to validate
Herzberg’s motivation theory. They confirmed Herzberg’s predictions that
money, like other extrinsic factors do not hold as much motivation power as do
the extrinsic factors. In the same article, they highlight Herzberg’s argument of
the movement versus motivation question where he affirms that movement is
related to the extrinsic factors that “drive the internal engine” while motivation
(intrinsic factors) encourages the behaviour required for success (individual and
organisational) in the contemporary world of hyper-competitiveness and
globalisation.
The job characteristics model (Figure 2.8) is among the most popular current
perspective on job design and, developed by Hackman and Oldman (1980) as
cited in Ramlall (2004), it proposed that employee motivation is driven by three
fundamental psychological states. Firstly, an employee must experience
personal responsibility for the outcomes of a job. Secondly, the job must be
experienced as meaningful in that the employee must feel that his/her
contribution has an impact on the overall effectiveness of the organisation.
Thirdly, the employee must be made aware of the degree of impact that he/she
is contributing towards.

Association between employee motivation and
employee demographics in the banking industry
____________________________________________________________________________
___________________________________________
27
Personal and work
outcomes
� High internal work motivation
� High quality work performance
� High satisfaction with the work
� Low absenteeism and turnover
Core job
dimensions
Critical psychological
states
Skill varietyTask identityTask significance
FeedbackKnowledge of the actual results of the work activities
Autonomy
Experienced meaningfulnessof the work
Experienced responsibility for outcomes of the work
Employee growth-needand strength
Source: Hackman and Oldman (1980) In Ramlall (2004).
Figure 2.8 Job Characteristics Model
Regarding the first psychological state of experiencing of responsibility for the
outcomes of one job, providing an employee with autonomy including freedom,
independence and discretion to make his/her own decisions in completion of the
job will fulfil this need. This is consistent with McClelland’s (1975) need for
achievement among employees that contribute to motivation. Hackman and
Oldman (1980) saw the sources of meaningfulness (second psychological
state) as skill variety, task identity and significance. Skill variety refers to the
demand from a job for multiple talents which makes the job more intrinsically
motivating. Task identity is “the degree to which a job requires completion of a
“whole” and identifiable piece work…doing a job from beginning to end with a
visible outcome” (Hackman and Oldman, 1980:78). One of Herzberg’s (1968)
intrinsic factors, interesting work, would be consistent with task identity. Task
significance addresses the satisfaction of the esteem needs of an employee to
perceive his/her work as significant in its contribution. According to Alera (1990)
the third psychological state of “knowledge for results” requires regular
feedback to the employee to allow the employee to identify crucial relationships
between job characteristics and behavioural outcomes (Ramlall, 2004).
2.3.6 Organisational Design
Daryanto et al. (undated) references McGregor (1960) who identified two
distinct views of human nature and work: a negative view, labelled “Theory X”
and a positive view labelled “Theory Y” (Table 2.1). Depending on an

Association between employee motivation and
employee demographics in the banking industry
____________________________________________________________________________
___________________________________________
28
organisation’s management assumptions of its employees, different
organisational design would be supported. Managers assuming Theory X will
employ a mechanistic organisational structure, while managers assuming
Theory Y will prefer an organic (adhocracy) system. A mechanistic
(bureaucracy) structure is characterised by clear and centralised authority
where most individuals are limited in their work by authority. Jobs are
specialised and procedures to complete jobs are formal and standardised. The
central principle of Theory X is direction and control enforced by centralised
organisation and authority. In terms of Maslow’s hierarchy of needs, only the
first two levels (physiological and safety) are fulfilled and can be leveraged to
motivate employees under Theory X. The central principle of Theory Y is the
integration of individual and organisational goals where motivation can be
drawn from the affiliation, esteem and self-actualisation levels of Maslow’s
(1943) hierarchy
Table 2.1 Key features of mechanistic and organic structures
System/Dimension Mechanistic Organic
Management system Hierarchical structure of control A network structure of control
Psychosocial system Delineated by formal hierarchy Diffuse
Structural system Formal written communication Low, few and general
Goals and values Efficient performance Effective problem solving
Overall organisation system Single goal maximiser Searching and adaptive
Environmental suprasystem Certain, placid and stable Turbulent uncertain
Source: Adapted from Kast and Rosenwieg (1974) In Daryanto et al. (undated)
Daryanto et al (undated) argues further that no one motivation theory is the
answer in a heterogeneous environment and manager need to spend time with
their employees and get to know them. This sentiment is reiterated by
Osteraker (1999) whose study on measuring motivation concludes with the
advice that personnel managers need to conduct their own interviews with their
people to gain an understanding of their values and attitudes and so be in a
better position to identify their best motivators. She goes further to caution
against the direct use of static motivation theories in dynamic organisations and

Association between employee motivation and
employee demographics in the banking industry
____________________________________________________________________________
___________________________________________
29
recommends a contingency approach to motivation investigations in
organisations where contextual factors are factored in.
Table 2.2 below, highlights the commonalities between the various motivation
theories and the organisational design that supports the different components of
each theory.
Table 2.2 Comparison of basic motivation categories
Org.
Design
Maslow’s hierarchy
Alderfer’s categories
McClelland’s needs
Herzberg’s
factors
Theory X
1. Physiological needs
Existence needs Working conditions
H
Y
G
I
E
N
E
2. Safety needs
Material
Interpersonal
Power
Salary and benefits
Supervision
Theory Y
3. Affiliation, love and social needs
Relatedness needs
Affiliation Fellow Workers
4. Self-esteem needs
Feedback
Self-confirming
Growth needs
Achievement
Recognition, Advancement, Responsibility
M
O
T
I
V
A
T
O
R
S
5. Self-actualisation Job Challenge
Source: Adapted from Schein (1980) In Daryanto et al. (undated)
Ouchi (1981), referenced in Braden (2000), proposed another management
style called Theory Z or more popularly known as the “Japanese Management”
style which was popularized during the Asian economic boom of the 1980s
(Wikipedia, 2008). Theory Z focused on increasing employee loyalty to the
company by providing a job for life with a strong focus on the employee, both on
and off the job. According to Ouchi (1981), Theory Z management tends to
promote stable employment, high productivity, and high employee morale and
satisfaction. Braden (2000) indicates that similar to Theory Y, Theory Z also
assumes employees are motivated by their self-actualisation need. She
continues that the “Japanese Management” style assumes that employees do

Association between employee motivation and
employee demographics in the banking industry
____________________________________________________________________________
___________________________________________
30
not only seek out opportunities for increased responsibilities but actually crave
these opportunities and the need to advance and learn more about the
company.
2.4 Conclusion
The discussions of this chapter created an in depth generic background to the
two major components of the study: culture and motivation. The chapter begins
with a definition of culture that proves strong linkages between culture and the
realms of psychology and anthropology. Hofstede’s (1991) model of mental
programming with three levels: human nature, cultural and personality are
presented with an integration of Triandis’ (2002) work on the cultural influences
on personality. Booysen (2007a) is then cited to highlight the social identity
group dynamics including self categorisation, ingroup association and inter
group conflict. In a temporary reference to culture, Booysen et al. (2006) are
noted for mentioning that race is the dominant categorisation in South Africa.
The various proposed cultural dimensions are the next component discussed.
Theorists, including Hofstede (1991), House (2004), Licht et al. (2007) and
Triandis et al. (2002) are all referenced for their contributions to the search for a
set of universal cultural dimensions. The review of culture theory is concluded
with the topic of cultural diversity. The second half of the chapter delivers the
various motivation theories in existing literature. After a brief definition of
motivation, a categorisation proposed by Ramlall (2004) structures the
discussion into needs-, equity-, expectancy- and job design-related motivation
factors. The chapter then concludes with a discussion of organisational design
which uses Theory X and Theory Y as a basis to compare the key attributes of
each motivation theory. Theory Z (Ouchi, 1981) is also presented and while it
bears large similarity to Theory Y, distinct differences are also identified.
This concludes the discussion of culture and motivation theory which provides a
comprehensive platform to now review specific studies in these areas in the
following chapter.

Association between employee motivation and
employee demographics in the banking industry
____________________________________________________________________________
___________________________________________
31
CHAPTER 3: REVIEW OF PRIOR STUDIES – CULTURE
AND MOTIVATION
3.1 Introduction
This chapter adds context to the theoretical generic discussion of the previous
chapter beginning with South African culture. The topic is subdivided further
with an account of the country’s history, setting the scene with specific focus on
the apartheid regime. The chapter then crosses into the post 1994 period and
reviews the power shifts initiated by the transfer of power from blacks to whites
on a social, political, economic and legislative level and the resultant key social
identity changes. A discussion of generational and maturity theory is engaged
before the discussion extends to managing diversity. The review of studies
related to motivation follows with a comparison of approaches to motivation
research being the focus.
3.2 South African Culture
3.2.1 History
The SA history is riddled with numerous key events that have had significant
impact on the state of the nation today. Many of these events formalised a
society of oppression.
The country was colonised by both the English and the Dutch (also known as
Boers or Afrikaners) in the nineteenth century. The discovery of diamonds
around 1900 resulted in the Boer War. In the 1940’s, the Afrikaner National
Party, having gained a large majority over the English, devised apartheid as a
seal to their control over the economic and social system. (Leonard, 1980;
Thomas and Bendixen, 2000)
The Dutch settlers “will to power” eventually resulted in them gaining
government control in 1948. What followed was the execution of the apartheid

Association between employee motivation and
employee demographics in the banking industry
____________________________________________________________________________
___________________________________________
32
laws that institutionalised racial discrimination. These included laws, such as the
prohibition of marriages between non-whites and whites and sanctioning of
“white-only” jobs. The Population Registration Act in 1950 required that all
South Africans be grouped into three racial categories: white, black (African) or
coloured (of mixed decent). The coloured category included a subcategory of
Indians and Asians. Non-compliance with the race laws was met with severity
and all blacks were required to carry “pass books” containing fingerprints, a
photo and information on access to non-black areas (ABSA, 2005a).
The Bantu Authorities Act was introduced in 1951 and established a basis for
ethnic government in African reserves, known as “homelands.”(ABSA, 2005a)
These homelands operated as independent states within which all political
rights, including voting, held by an African could only be exercised within the
homeland. The purpose behind the Act was to strip Africans of their SA
citizenship and thereby exclude them from input in the SA parliament, which
held complete control over the homelands. Oppression was a key component in
the social identity of blacks in South Africa during apartheid. Beaty et al. (1987)
describe the lifestyle of working blacks compared to working whites. Blacks in
factories, for example, were discriminated upon within the factory and then
when they went home, the discrimination continued in the form of which
coaches of the train they could use to go home, being careful not to use
“whites-only” toilets, ensuring that they did not walk into a white bar for a drink,
etc.
The Public Safety Act and the Criminal Law Amendment Acts passed in 1953
gave government the authority to declare stringent states of emergency and
increased penalties for protesting against the laws of the country (ABSA,
2005a). The penalties included fines, imprisonment and whippings. One such
execution of the acts is held firmly in memory of the Sharpeville massacre on
March 21st, 1960. The refusal of a group of blacks to carry their passes resulted
in a 156 day “emergency” that ended with 67 people dead and 187 people
wounded. The exit of SA from the Commonwealth in 1961, allowed the
Nationalist government to further entrench apartheid into the policies and laws
of the Republic.

Association between employee motivation and
employee demographics in the banking industry
____________________________________________________________________________
___________________________________________
33
The apartheid policy was highly effective in sustaining preferential treatment for
whites, as is demonstrated by the table below which provides a snapshot of the
listed statistics from the late 1970s in SA.
Table 3.1 Selected SA demographic statistics (1970s)
Blacks Whites
Population 19 million 4.5 million
Land Allocation 13% 87%
Share of National Income <20% 75%
Ratio of average earnings 1 14
Minimum taxable income R360 R750
Doctors/population 1/44 000 1/400
Infant mortality rate 20% (urban) 2.7%
40% (rural)
Annual expenditure on education per pupil $45 $696
Teacher/pupil ratio 1/60 1/22
Source: Leonard (1980).
Both internal and external pressure forced the wheels of emancipation to turn
with the release of Nelson Mandela in 1990. The struggle for a full democracy
culminated in the eventual transformation to a country under the Government of
National Unity in 1994. The unique cultural history of the country, however, has
provided a complex heritage to the workplace dynamics of today
3.2.2 Power shifts
During apartheid in SA, most positions of power across social, political,
economic and management were held by white males. The following figure
summarizes the power shifts that characterised the post apartheid environment
in South Africa:

Association between employee motivation and
employee demographics in the banking industry
____________________________________________________________________________
___________________________________________
34
Management
Economic
Social
Political
WhiteMale
WhiteFemale
BlackMale
BlackFemale
Management
Economic
Social
Political
WhiteMale
WhiteFemale
BlackMale
BlackFemale
Source: Booysen (2007c).
Figure 3.1 Power shifts in South Africa post apartheid
In the 50 year reign of apartheid under the National Party, only six white women
were allowed the opportunity to occupy parliamentary positions, giving SA a
rank of 141 in the world in terms of women in parliament. (Booysen, 2007c).
The first democratic election on April 27th, 1994 brought a dramatic change of
political power to the country with a transfer from whites to blacks. A significant
new law instituted by the ANC, required a 30% percent quota of women in
parliament, which facilitated the power shift towards blacks via a more equitable
distribution between genders than pre-1994. SA rankings immediately changed
to 15th world-wide for the number of women in parliament. In 2006, the
representation of black women in parliament was at 33% ranking SA as 11th on
the same survey (Nkomo and Littrell, 2005). At this time, the first female Deputy
President for SA had also taken office.
As mentioned previously, Bornman (1999) “identifies ethnic or cultural groups
as being a highly utilized common denominator in social identification or identity
formation”. SA history has already taken society through a prototyping and
stereotyping phase for its major political identity which is decidedly racial lines.
The change in government in 1994 saw the black majority gain political power
and dominance (represented by the ANC), while the white minority lost its
political power and dominance. Booysen (2007b) argues that the power shifts
demand a re-evaluation of the existing prototypes of race since apartheid’s race
based categorization of society has no place in a democratic environment.
A number of new legislations have been introduced since 1994 to facilitate the
economic transformation of SA. Affirmative Action (AA) measures, for example,

Association between employee motivation and
employee demographics in the banking industry
____________________________________________________________________________
___________________________________________
35
have been introduced to establish a greater equality in the workplace and
redress past unfair discrimination and unearned privilege. The Reconstruction
and Development (RDP) and Growth, Employment and Redistribution (GEAR)
strategy are in place to find the democratic balance in the political, social and
economic SA landscape (Booysen, 2007a). Other laws introduced include the
Labour Relations Act of 1995, the Constitution of South Africa of 1996, The
Basic Conditions of Employment Act of 1997, the Employment Equity Act of
1999, the Skills Development Act of 1998 and the Skills Development Levies
Act of 1999. The last two acts support not only a redress of past wrongs but
also ensured effective workplace recruitment through succession planning,
development and training of people in designated groups and addressing of the
skills gap (Booysen, 2007c). The Broad-Based Black Economic Empowerment
(BBBEE) codes of good practice extended the Black Economic Empowerment
Act by not only proposing quotas for black ownership and management but also
broadening the scope of the Act over the value chain of organisations and
adding clauses to prevent tokenism. The BBBEE codes of good practice
became law in 2007.
According to the BBBEE strategy document (Department of Trade and Industry,
2008:15), BBBEE is defined as “an integrated and coherent socio-economic
process, that directly contributes to the economic transformation of South
Africa, and brings about significant increases in the number of black people that
manage, own and control the country’s economy, as well as significant
decreases in income inequalities.” Terreblanche (2003) and Rautenbach (2005)
cited by Booysen (2007a) argue that there are currently too few BBBEE players
making corporate deals. These players are also only the privileged few black
individuals with strong political ties resulting in the BBBEE process being of
benefit to only a selected few as opposed to broad-based empowerment. In a
related effect, BBBEE has also given rise to the development of a strong black
middle class, the so-called black elite, increasing the inequality in the black
community.
Booysen (2007b) indicates that another phenomenon which has been created
by the new legislations includes job-hopping among experienced African black

Association between employee motivation and
employee demographics in the banking industry
____________________________________________________________________________
___________________________________________
36
managers due to the high demand and associated high remuneration offered to
them. The high skills shortage among blacks provokes poaching which
compounds the job-hopping phenomenon. She also refers to Bhorat (2001) who
introduces another interesting statistic of white employees being the only race
group with a drop in their absolute number of workers. Two key reasons are
proposed to explain this statistic: growing emigration (also known as the brain
drain) and early retirement. Emigration is a result of legislative measures
introduced to increase the opportunities available to blacks compared to whites,
which creates concerns among whites, for example, regarding career
development. Booysen (2004) cites a quote from an interviewee reiterates this
sentiment: “Whites have no future, the white male career is on hold.”
Social power, which was predominantly held by white males prior to 1994, has
been redistributed more equally among all race groups, however mostly
concentrated in the black group which is evident in the media (Booysen, 2007c).
This shift in social power has resulted in a great influence of Africanism on the
social identity reconfiguration in SA. The possibility of an exclusive “African”
group is posed, which would categorise all other race groups as out-groups,
with the related inclusive privilege and out-group derogation. This would simply
imply a new form of oppression in South Africa.
In 1994, management power resided predominantly with white males. A
comparison on the most recent Commission of Employment Equity reports
(Commission for Employment Equity, 2007) reveals a similar picture but a
gradual (albeit slow) change towards black management power. Between the
periods 2000 and 2006, Africans saw an increase of 5.1% but between 2004
and 2006 a drop by 0.5% in top management positions. Females on the other
hand saw a healthier 9.2% increase between 2000 and 2006 of which between
2004 and 2006, 6.5% more females occupied top management positions.
Between black and white females, 2004 to 2006 saw an increase of 2.2% and
4.0% respectively. For the same period, black males dropped by 1.1% and
white males by 8%.

Association between employee motivation and
employee demographics in the banking industry
____________________________________________________________________________
___________________________________________
37
At senior management, Africans increased by 4.7% between 2000 and 2006
and 0.3% from 2004 to 2006. Females also saw an increase from 2000 to 2006
and 2004 to 2006 of 6.4% and 3.7% respectively. Between black and white
females the period 2004 to 2006 brought an increase of 1.4% and 1.9%
respectively. For the same period, black males dropped by 0.2% and white
males by 5.4%. the results reveal an unconvincing and slow change in
employment equity. A key concern, shared by Booysen (2007a), is that the slow
progress of filling professional and middle management positions with black
males and females will create succession planning challenges as these levels
are “feeders” for senior management and top management.
Table 3.2 below, provides a 2007 snapshot and clear evidence that white males
are still the dominant race/gender group in top management, senior
management and professional and middle management (Commission for
Employment Equity, 2007).
Table 3.2 Management employees by race and gender (2007)
Org. levels Male Female
African Coloured Indian White African Coloured Indian White
Top management
8.4% 2.7% 4.5% 60.2% 2.9% 2.0% 1.7% 14.7%
Senior Management
9.8% 3.7% 5.4% 51.9% 3.6% 2.1% 2.3% 19.0%
Professional and middle management
13.0% 4.6% 5.1% 40.1% 7.2% 3.4% 3.2% 22.1%
Source: Adapted from Commission for Employment Equity (2007: 8)
The top management is made up, in descending order, of 60.2% white males,
14.7% white females, 8.4% African males, 4.5% indian males, 2.9% African
females, 2.7% coloured males, 2.0% coloured females and 1.7% indian
females. The senior management is made up, in descending order, of 51.9%
white males, 19.0% white females, 9.8% African males, 5,4% indian males,
3.7% coloured males, 3.6% African females, 2.3% indian females and 2.1%
coloured females. Professional and middle management is made up, in
descending order, of 40.1% white males, 22.1% white females, 13.0% black

Association between employee motivation and
employee demographics in the banking industry
____________________________________________________________________________
___________________________________________
38
males, 7.2% black females, 5.1% indian males, 4.6% coloured males, 3.4%
coloured females and 3.2% indian females.
The table reveals that the various legislations instituted since 1994 have not
prevented white males from remaining the dominant position in all levels of
management. Black males (African, indian and coloured) however, have now
have made progress and assumed second place, moving white females into the
third position.
As a significant economic sector in SA, the financial sector has the leverage to
play a powerful role in achieving the transformation targets of the country.
Acknowledging this role, in August 2002, at the NEDLAC Financial Sector
Summit, the financial sector committed itself to the development of a Black
Economic Empowerment (BEE) charter. This resulted in the Financial Sector
Charter that became effective on 1 January 1994 to be applied until 31
December 2014 (Financial Sector Charter Council, 2008). In 2009 (based on
the reports for the year ended 31 December 2008), the Charter Council will
undertake a comprehensive mid-term review and make decisions regarding the
implementation of the charter in its second term. The ownership provisions will
be reviewed in 2011 to address identified shortcomings. The ownership
provisions will be reviewed by the Charter Council in 2011 to decide what
further steps (if any), to address identified shortcomings, should be taken at
individual financial institution, sub sector, sector or national levels (Financial
Sector Charter Council, 2008)
One of challenges highlighted in the charter is that “there are low levels of black
participation, especially of black women, in meaningful ownership, control,
management and high-level skilled positions in the sector”. Among the required
imperatives that need to be satisfied, are the following human resource
development relative imperatives (Financial Sector Charter Council, 2008):
• promote a non-racial, non-sexist environment and to enhance cultural
diversity and gender sensitivity within the sector

Association between employee motivation and
employee demographics in the banking industry
____________________________________________________________________________
___________________________________________
39
• invest in human resource development across the full spectrum of skills,
with special emphasis on increasing the participation of black people in
skilled, strategic and operational leadership in the sector
• invest in and equip current and future leadership incumbents in the sector
with the appropriate knowledge and capacity to enable them to play a
central role in driving the transformation programme
The following Employment Equity and Skills Development targets are stipulated
for 2008 on the charter scorecard (Financial Sector Charter Council, 2008):
• based on an estimated ratio of 10% for 2002, each financial institution will
have a minimum target of 20% to 25% black people at senior management
level;
• based on an estimated ratio of 1.6% for 2002, each financial institution will
have a target of a minimum of 4% black women at senior management level
• based on an estimated ratio of 17%% for 2002, each financial institution will
have a target of a minimum of 30% black people at middle management
level
• based on an estimated ratio of 5% for 2002, each financial institution will
have a target of a minimum of 10% black women at middle management
level
• based on an estimated ratio of 28% for 2002, each financial institution will
have a minimum target of 40% to 50% black people at junior management
level
• based on an estimated ratio of 12% for 2002, each financial institution will
have a target of a minimum of 15% black women at junior management
level
Table 3.3 below, summarises the financial sector performance over 2005 and
2006 for the above target categories.

Association between employee motivation and
employee demographics in the banking industry
____________________________________________________________________________
___________________________________________
40
Table 3.3 Financial Sector Charter performance review (2006)
Occupational levels
Black people Black women
2005 2006 Target 2005 2006 Target
Senior Management 16.70% 18.72% 25.00% 4.19% 5.17% 4.00%
Middle Management 28.37% 30.12% 30.00% 10.65% 12.42% 10.00%
Junior 39.71% 42.86% 50.00% 21.66% 24.21% 15.00%
Source: Financial Sector Charter Council (2008).
The above table provides clear indication that the statistics for blacks at senior
management is significantly behind its 2008 target and the Financial Sector
Charter Council (2008) remarks that current transformation dynamics would
need to be accelerated to meet the target of 25% black senior managers by
2008. In fact, among the statistics for black managers only middle management
has attained its target, while junior management statistics in 2006 compared to
2005 provide little comfort that the 2008 target of 50% will be reached. The
performance statistics for black women in management positions is in stark
contrast, with the 2008 targets being attained for all levels and the best
performance recorded for junior management in 2006 at more than 9% above
the 2008 target of 15%. Overall the results are positive for black women in the
financial sector but disappointing for the full constituency of black employees.
3.2.3 Social Identity Changes
South African history has accustomed society to the salient race divides that
has been the source of much social identity conflict before 1994 in the struggle
against apartheid and post 1994 in addressing the wrongs of apartheid. As the
democracy grows and the honeymoon phase of the “rainbow nation” comes to
end, the true extent of progress is revealed and is received with mixed emotions
(Booysen, 2007c). This section intends to highlight a few cultural challenges
within the workplace induced by the environment of the new South Africa. This
escalates the need for regular research into the country’s increasingly
heterogeneous economically active population.

Association between employee motivation and
employee demographics in the banking industry
____________________________________________________________________________
___________________________________________
41
One surprisingly negative reaction is from those whom transformation is
intended to benefit: black people. Companies are reporting high attrition rates of
these individuals and the reasons attributed to the low retention rates raise
questions around the cultural sensitivity and commitment of the South African
workplace to transformation (Booysen, 2007b). It is claimed that many
companies are rendering lip service when they speak about employment equity
with no sincerity of commitment from top management. New recruits are
refusing to assimilate into the current organisational culture of a company that
lacks cultural sensitivity and does not value diversity. Strong traces of a white
male dominant organisational culture send a message of exclusion to black
recruits. Black employees also claim to be used as tokens in organisations
without any real decision making responsibility or authority. A further grievance
is with regards to poor talent management of black employees.
Intergroup tensions between whites and black Africans may appear to be
obvious, set in the country’s history, but Booysen (2007b) highlights a deeper
cultural difference that leads to two distinct conflicts between the groups. Firstly,
the perception of time differs between the linear, sequential or monochronic
perception held by Whites and the cyclical, synchronic or polychromic
perception held by Blacks. Secondly, the dimension of collectivism and
individualism reveals varied approaches to relationships between the groups.
At the root of the black African perception of time and association with a
collectivist culture is the concept of Ubuntu (Booysen, 2001). Ubuntu is a
humanistic philosophy directly translated to mean “I am because we are” and
focuses on people and relationships – group support, acceptance, respect,
cooperation and sharing. Ubuntu is opposed to individualism and insensitive
competition, but does not support extreme collectivism in favour of retaining
some individuality. Schwartz (2000) cites Gyekye (1997) who agrees that
Africans share many important values and practices, but are flexible to
variations in individual or group preferences. The differing perceptions of time
and relationships is a clear point of frustration between the two groups when the
synchronic people conflict with sequential people by not remaining focused on
the discussion of a specific issue within the allotted time but rather opting for
Association between employee motivation and
employee demographics in the banking industry
____________________________________________________________________________
___________________________________________
42
relationship building over the concern for time. Khoza (2007) also refers to
Ubuntu when he explains how valuing humanity is one the values that
underpins the African leadership paradigm. He also reiterates the sentiment
above that in the “African context, even though heroes and heroines are
adored, rabid individualism is abhorred” (Khoza, 2007:25). Ubuntu is positioned
as the balance in the paradox facing African leaders who, as with other leaders
around the world, require power as the currency of leadership but
simultaneously must “live by the tenets of consultation, persuasion,
accommodation and cohabitation; shun coercion and domination” (Khoza,
2007:27). He explains that Ubuntu can be leveraged to overcome this apparent
contradiction by approaching power relations with the mindset that all people
are in kinship with each other and share the status of humanity. Khoza (2007)
also comments on this contrast to the Western world view, predicated on the
Darwinian philosophy of “survival of the fittest” which asserts that “self
preservation is the first law of life”. Trompenaars (1993), like Darwinian
philosophy also places emphasis on survival, to the extent that Trompenaars
(1993) positions survival as one of the basic assumptions at the core of culture
for human existence.
An interesting social dynamic created by the post 1994 legislations intended to
redress the wrongs of apartheid is the ironic static positioning of Indians and
Coloureds in the middle of Whites and Black Africans who are once again
battling salient social identity issues in South Africa (Booysen, 2007b).
Coloureds have been known to remark that under the Apartheid regime they
were not white enough and now under Democracy, they are not black enough.
Compared to all the race/gender social categories, white males are probably
currently experiencing the highest levels of social identity anxiety (Booysen,
2007b). High levels of job insecurity (hygiene factor) and low probabilities of
future promotional opportunities (motivator) have lead to high degrees of
demotivation. To compound the precarious position of white males and females,
many of these employees are required by their companies to train and mentor
new black recruits that have been hired to replace them. As per Booysen
(2007b), one white male stated: “We are asking turkeys to vote for Christmas”.

Association between employee motivation and
employee demographics in the banking industry
____________________________________________________________________________
___________________________________________
43
Nonetheless, while the blacks have power in the political supra-systems, whites
still hold the “legislative” positions in organisations which is where the decision
making authority lies. Dlamini (2005) is then referenced, who argues further that
companies still invest significantly in training and skills development to the
benefit of white men.
Black women are seen as the only social category to have a double
disadvantage in that they are of a subordinate gender and subordinate race
(Booysen, 2007b). This is one of the contributing factors to black women being
ranked as number one to be affirmed by the employment equity legislation.
Nkomo et al. (2005) commented that black females continue to be the most
poorly represented group in leadership and management positions, which has
wider inferences to all women in the workplace facing the proverbial glass-
ceiling phenomenon. To reiterate the point made earlier, according to Alderfer’s
(1986) embeddedness theory, the effects of one’s own group occupying a
favourable position in a system may be muted by its being in a relative
disadvantage in the supra-system, or vice versa.
3.2.4 Generations
Values structures, and therefore cultures, are also moulded and warped by the
era in which one grows up. According to McNally (2007), Codrington (2005)
remarked that “We forget that a 35-year-old man today is vastly different from a
35-year-old 10 years ago.” Factors such as the television one watches and the
ruling government during childhood play a vital role. McNally (2007) continues
that the generation gap has become far more pronounced because the world is
changing fast and shrinking due to travel and technology.
Among black South Africans, we have Baby Boomers who fought in the struggle
for democracy and the Internet generation who grew up in townships. According
to McNally (2007), Neil Higgs, of the Black Diamond Study at Research Surveys
comments that the black middle class hinges on two key factors: the younger
group’s distance from the struggle and the balancing act in the between
township traditions and Western influences. He goes further to divide the

Association between employee motivation and
employee demographics in the banking industry
____________________________________________________________________________
___________________________________________
44
generations into two broad categories separated by an age line of 24 years. The
younger group is optimistic about black economic empowerment compared to
the older group but are also simultaneously trying to integrate old traditions (e.g.
labola) in their contemporary lifestyles.
McNally (2007) argues further that the Veteran Generation (1920 -1944) were
greatly influenced by the great depression and World War 2. In South Africa,
this generation lived through the early years of racial segregation that eventually
evolved into a formal system of apartheid. When the Union of South Africa was
formed on 31st May 1910, Afrikaner Nationalists were given a relatively free
hand to reorganize the country’s franchise according to existing standards of
the now-incorporated Boer republics, the Zuid Afrikaansche Repulick (ZAR –
South African Republic or Transvaal) and Orange Free State. The term
Apartheid was introduced during the 1948 as part of the election campaign by
DF Malan's Herenigde Nasionale Party (HNP – 'Reunited National Party')
(Boddy-Evans, 2007). Loyalty is a predominant trait in these employees and
they consider this to be an implicit, though key expectation, from an employer in
terms of their employment contracts (McNally, 2007). Strong buy in into the
company vision is an important element of the values level of culture of these
employees (Schein, 1990). These employees also place great emphasis on
culture artefacts that express neatness (e.g. attire), order, professionalism,
tradition, control (e.g. everyone thinking similarly as stipulated by a “mission
statement” with no flexibility for lateral thinking) and hierarchical organisation
(e.g. title). Advancements in technology may also pose a challenge for this
generation.
The Baby Boomers (1945 – 1964) grew up during a period of fighting the
struggle against apartheid in South Africa for equality, freedom of speech and
human rights (McNally, 2007), when some joined the white border posts or
others joined the 1976 Soweto student uprising. It was also a time during which
South African was experiencing exceptional financial performance a 14%
growth rate in the 50’s and 60’s and the Rand was stronger than the dollar and
at times even the pound (Mol, 2004). Other generations see baby boomers as
loud, brash and individualistic and as employees they are particularly vocal in

Association between employee motivation and
employee demographics in the banking industry
____________________________________________________________________________
___________________________________________
45
the workplace. Artefacts (Schein, 1990) that deliver status such as perks that
include big offices and designated parking bays are important in the culture of
this generation. They value a highly supervised environment to identify where
they can add value and demand full attention in conversation. Face-to-face
conversation is preferred over email communication which is consistent with
Raths’ (1999) comment in Yu et al. (2005) that Baby Boomers are not
technology savvy. It is important that they are explicitly informed as to what is
required, how they will be measured what are the recognition and rewards
(McNally, 2007). Yu et al. (2005) extends his list of attributes to hard workers,
generally loyal, respectful of the chain of the command and expect managers to
give direction and to lead them towards organisational goals. McNally (2007)
and Yu et al. (2005) concur that they are also characterised by opting for lower
risk options.
Generation X (1965 – 1980), also known as “Xers” (Yu et al., 2005), lived
through key events in global history: end of apartheid in SA, fall of the Berlin
Wall, dismantling of communism in Russia and Tiananmen Square in China
(McNally, 2007). According to Codrington (2004), referred to by Mol (2004), in
South African history, they are known as the generation who are old enough to
remember apartheid and to be “judged” to be part of it, but not old enough to
have fought for or against the struggle. They approach power with pragmatism
and scepticism. These employees value honest (and brutal), transparency and
frequent feedback. Individual, tailored attention is preferred over being viewed
as a target segment in a mass market. Loyalty is much less important than to a
Veteran employee and prestige artefacts such as corner offices and titles do not
offer the same motivation that it does to Baby Boomers (Better Business
Communication, 2007). They are results driven and look for additional work and
training opportunities that offer continuous growth and stimulation and enjoy a
fun working environment and demand meaning in the work that they engage in,
which is aptly summarised by Yu et al. (2005): “Xers tend to be more
independent, self-motivated and self-sufficient”. He continues to argue that Xers
are more individualistic with a high need for autonomy and flexibility in their
lifestyles and jobs and therefore have a lower dependency on leadership. Xers
appear to have also broken the Maslow’s hierarchy needs rule (Yu et al., 2005).

Association between employee motivation and
employee demographics in the banking industry
____________________________________________________________________________
___________________________________________
46
While Baby Boomers follow an individual development progress through
education, career, marriage and promotion and finally attaining self-
achievement, Xers prefer to squeeze the process and demand self-
achievement from their job and basic needs at the same time. This appears to
be more consistent with Alderfer’s (1972) ERG Theory which positions needs
on the platform of a continuum as opposed to an “incremental” hierarchy.
Generation Y (1981 – 1999), the Internet generation, was born into the
Technology Age defined by Personal Data Assistants (PDA’s) and the World
Wide Web that together enable a shrinking of the “business globe” and the
growing concept of the mobile office. In South Africa this generation is
sometimes referred to as the “Millennial generation”, having left school in this
new millennium, or the “Born frees”, in South Africa, because by the time they
were old enough to understand the world around them, the country was free
from the hold of apartheid. Many of the black Born frees have walked away from
their culture and traditions; some cannot speak their parents’ mother tongue.
They don’t know the Struggle heroes’ names and most don’t care to vote. Their
white generational equivalents are much the same, unable to name Struggle
heroes beyond Nelson Mandela and indifferent to current politics (Grant-
Marshall, 2008). The generation as a whole is confident although not as
individualistic as Generation X employees and therefore prefer group level
organisation to thrive (McNally, 2007). This is a direct contradiction to Yu et al.
(2005) who argues that Generation Y is more individualistic than Xers.
Generation Y also values a challenging environment and sees greater
responsibility as a highly attractive option for reward. Research has also shown
that corporate social responsibility initiatives are important as a motivation factor
in the employers of these individuals.
Yu et al. (2005) goes further to comment on the leadership styles that are
required for the different generations. He proposes that as developed countries
have moved through the so-called “industry economy” to the “service economy”
and now towards the “knowledge economy”, the need for traditional leadership
will disappear, a sentiment shared by Booysen (2007c) in South Africa. He
argues further that a new leadership style will need to disassociate with

Association between employee motivation and
employee demographics in the banking industry
____________________________________________________________________________
___________________________________________
47
hierarchical position-based leadership and assume a new knowledge-based
influence where the knowledge workers would need to collaborate more with
their leaders than be managed by them. The figure below depicts the
chronology of phases and associated changes in leadership styles. In the
industrial economy, Theory X was assumed by most leaders who supported the
need to control and supervise workers who were thought to be lazy and needed
to be motivated for productivity. The service economy brought the new
approach of Theory Y when relationships, communication, customer service,
conflict resolution training were priorities on the leadership agenda. The
knowledge economy, Yu et al. (2005) continues, demand collaborative
leadership of knowledge workers who see themselves as “associates” of an
organisation more than “employees” to be managed.
Predominant emphasis
on Theory X, i.e. that
workers need to be
controlled and supervised
Industrial Economy
(to 1980)
����
Predominant emphasis
on Theory Y, i.e.
importance placed on
interpersonal
communication
(customer service) and
conflict resolution skills
Service Economy
(1980-2000)
����
����
Predominant emphasis
on collaborative
leadership and
knowledge-based
leadership
Knowledge Economy
(2000-)
����
����
����
Baby Boomers
Xers
Y Generation
The changing nature of the workforce
Leadership of workers is
characterised by different types
of each phase
Associated changes to leadership style
����- denotes present in this phase as workers Industrial workers Service workers Knowledge workers
Predominant emphasis
on Theory X, i.e. that
workers need to be
controlled and supervised
Industrial Economy
(to 1980)
����
Predominant emphasis
on Theory Y, i.e.
importance placed on
interpersonal
communication
(customer service) and
conflict resolution skills
Service Economy
(1980-2000)
����
����
Predominant emphasis
on collaborative
leadership and
knowledge-based
leadership
Knowledge Economy
(2000-)
����
����
����
Baby Boomers
Xers
Y Generation
The changing nature of the workforce
Leadership of workers is
characterised by different types
of each phase
Associated changes to leadership style
����- denotes present in this phase as workers Industrial workers Service workers Knowledge workers
Source: Yu et al. (2005).
Figure 3.2 The changing nature of the workforce and leadership styles
McNally (2007) advises that it is very complex to understand how the
generation gaps, in combination with other demographic factors, influence our
personal knowledge of colleagues in the workplace. It is best to ‘throw away’
what one thinks one knows about these individuals based on personal history
and to rather try to internalize the behaviours and emotions of your colleagues
based on the experiences that they may have been exposed to in the era of
their upbringing.
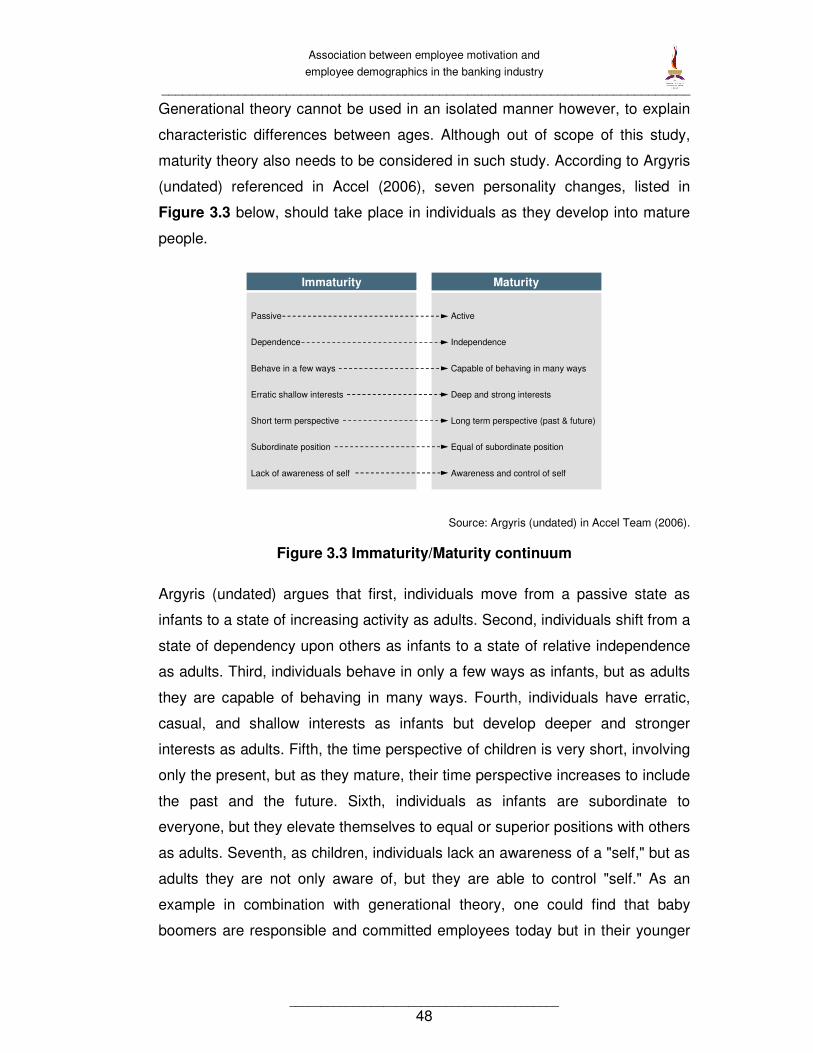
Association between employee motivation and
employee demographics in the banking industry
____________________________________________________________________________
___________________________________________
48
Generational theory cannot be used in an isolated manner however, to explain
characteristic differences between ages. Although out of scope of this study,
maturity theory also needs to be considered in such study. According to Argyris
(undated) referenced in Accel (2006), seven personality changes, listed in
Figure 3.3 below, should take place in individuals as they develop into mature
people.
Active
Independence
Capable of behaving in many ways
Deep and strong interests
Long term perspective (past & future)
Equal of subordinate position
Awareness and control of self
Immaturity Maturity
Passive
Dependence
Behave in a few ways
Erratic shallow interests
Short term perspective
Subordinate position
Lack of awareness of self
Source: Argyris (undated) in Accel Team (2006).
Figure 3.3 Immaturity/Maturity continuum
Argyris (undated) argues that first, individuals move from a passive state as
infants to a state of increasing activity as adults. Second, individuals shift from a
state of dependency upon others as infants to a state of relative independence
as adults. Third, individuals behave in only a few ways as infants, but as adults
they are capable of behaving in many ways. Fourth, individuals have erratic,
casual, and shallow interests as infants but develop deeper and stronger
interests as adults. Fifth, the time perspective of children is very short, involving
only the present, but as they mature, their time perspective increases to include
the past and the future. Sixth, individuals as infants are subordinate to
everyone, but they elevate themselves to equal or superior positions with others
as adults. Seventh, as children, individuals lack an awareness of a "self," but as
adults they are not only aware of, but they are able to control "self." As an
example in combination with generational theory, one could find that baby
boomers are responsible and committed employees today but in their younger

Association between employee motivation and
employee demographics in the banking industry
____________________________________________________________________________
___________________________________________
49
days of the 60s and 70s, they may have been free and irresponsible “hippies”
who have since experienced varying degrees of maturity.
3.2.5 Managing Diversity
Leadership has also experienced its fair share of challenges to identify the best
approach to the contemporary heterogeneous workplace in South Africa. As per
the “Diversity management policy evolution”, assimilation is not an option in
South African culture, where diversity is too engrained to be managed without
an appreciation for multiculturalism. Afrocentric management practices are
gaining favour as people acknowledge the failure of traditional leadership
solutions based on Western practices which assume homogeneity.
Nonetheless, South African organisations need to maintain global
competitiveness and Manning (1996, 1997a, 1997b) cited in Booysen (2001)
regards this as one of the most significant challenges in organisation leadership
in SA: “how to simultaneously compete globally and function parochially”.
Schwartz (2000) confirms different values between Western and African value
profiles and the associated challenges of intercultural communication which
further motivates for different leadership styles. Booysen’s (1999) findings
revealed that the culture of white managers was congruent with Eurocentric
management. They reflected high levels of performance orientation, above
average levels of uncertainty avoidance, future orientation, power distance and
assertiveness, below average levels of collectivism and humane orientation and
a low level of gender egalitarianism. On the contrary, her sample of black
managers was more Afrocentric in their approach. They reflected high levels of
collectivism and humane orientation, above average levels of performance
orientation, uncertainty avoidance and power distance, below average levels of
assertiveness and future orientation and a low level of gender egalitarianism.
These results are consistent with Schwartz (2000) who found that African
nations in Sub-Saharan Africa were especially high in hierarchy and
embeddedness but low in egalitarianism and intellectual autonomy. In
summary, Eurocentric leadership is characteristic of transactional leadership,
while Afrocentric leadership is more closely aligned to transformational

Association between employee motivation and
employee demographics in the banking industry
____________________________________________________________________________
___________________________________________
50
leadership. Ironically, a similar observation was made in relation to the
apartheid era for white management, when Beaty et al. (1987) remarked that
“American management textbooks, which abound in South African business
courses, hardly prepare novice (white) managers for the resentment and
scepticism that black workers will direct towards them”. Booysen (2001)
concluded that contemporary SA should not move forward with the objective to
choose between Afrocentric and Eurocentric management approaches, but
rather to place equal value on both in an integrative approach. SA leaders need
to understand the different cultural expectations of all South Africans while
corporate SA learn to South Africanise its leadership approaches to effectively
mobilise the SA workforce.
In 1999, Booysen conducted a study where she once again used Hofstede’s
(1980) cultural dimensions as an instrument to gauge gender influences on
managers in the SA retail banking industry. She concluded that males had
above average levels of Performance Orientation, Uncertainty Avoidance,
Collectivism, Future Orientation, Power Distance and Assertiveness but below
average levels of Humane Orientation and low Gender Egalitarianism which are
all generally associated with a “masculine” perspective of leadership in vertical
and hierarchical organisational structures characterised by formal authority
concentrated at the top. Females, on the other hand, were found to reflect
above average levels of Performance Orientation, Humane Orientation,
Uncertainty Avoidance, Collectivism and Power Distance with below average
levels of Future Orientation and Assertiveness with low Gender Egalitarianism
which are all generally associated with a “feminine” approach to leadership in
horizontal or network organisational structures characterised by inclusivity.
Booysen joined Nkomo in another study (2006) which tested the validity of the
“think manager, think male” stereotype in the South African context and added
further clarity to the degree of masculinity/femininity required. Table 3.4 below,
lists typical characteristics of femininity and masculinity. Newton (2008)
considers how we have gone through industrial and knowledge economies and
have now entered the relationship economy, “which plays to the many strengths
of women.” She highlights branding changes as displaying a definitive move
towards “feminine” values. From the masculine task driven “Simpler, Better,

Association between employee motivation and
employee demographics in the banking industry
____________________________________________________________________________
___________________________________________
51
Faster”, Standard Bank, for example, has embraced “Inspired, Motivated,
Involved”. Numerous other examples are evidence of the move away from
“cutthroat one-size-fits-all competitivism to a more individualised, one-on-one,
nurturing approach to business”. As such, companies need to measure the
negative impact that an over-masculine environment is having on their bottom
line, understand the needs of females in their workforce and gear up to meet
those needs so that they can retain their valued female staff. While Booysen et
al. (2006) confirmed previous research on the masculine management
stereotype, they also identified a strong movement by females away from the
stereotype and concluded that an androgynous nature would be most
appropriate in leadership of the South African workforce.
The duality of Afrocentric and Eurocentric leadership and the shift towards the
need for an androgynous leadership aligns with Allard’s (2002) explanation of
diversity management swinging from assimilation to the other extreme of
differentiation and finally settling on integration which is defined as “appreciating
differences and respect(ing) uniqueness” of a heterogeneous workforce.
Table 3.4 Examples of characteristics of femininity and masculinity
Researcher Femininity Masculinity
Capra (1983)
counteractive
responsive
co-operative
intuitive
synthesising
demanding
aggressive
competitive
Boydell and Hammond (1985)
illogical
part of nature
systemic
right-brain
submissive
holistic
soft
win-win
spatial
freeing
logical
separate from nature
mechanistic
left-brain
dominance
atomist
hard
win-lose
sequential
controlling
Source: Rigg and Sparrow (1994).
The 2007/2008 Global Competitiveness Report results for SA revealed, among
others, the following competitive disadvantages in terms of the seventh pillar:
“Labour market efficiency”:
• Hiring and firing practices

Association between employee motivation and
employee demographics in the banking industry
____________________________________________________________________________
___________________________________________
52
• Flexibility of wage determination
• Cooperation in labour-employer relations
• Female participation in the labour force
• Pay and productivity
• Rigidity of employment
• Brain drain
These results highlight certain key negative influences on the country’s global
competitiveness. Firstly, it shows that gender inequality is clearly still a
challenge in the South African business environment with females still not being
afforded equal opportunity at all organisational levels. Pay and productivity
relates to local businesses inability to match productivity and reward. This is an
example of expectancy theory where the rewards being offered are insufficient
in motivating people to perform an action (Vroom, 1964). Finally the brain drain
has specific reference to this study in terms of delivering recommendations for
inclusion in retention strategies that will alleviate the loss of skilled employees to
other countries. While not individually directly associated with demographic
factors, becoming more effective in diversity management is critical to improving
SA’s competencies as a global business player. The future prosperity and
stability of the country, and quite possibly the entire continent, depend on it.
As stated above, among the levers to improve South Africa’s global
competitiveness is the ability of local businesses to better understand the needs
of their employees and to use this knowledge to retain key skilled resources that
are part of that company’s sustainable competitive advantage. The next section
reviews previous employee motivation studies that have investigated these
needs.

Association between employee motivation and
employee demographics in the banking industry
____________________________________________________________________________
___________________________________________
53
3.3 Employee Motivation
In 2007, Manopoulos conducted an evaluation of employee motivation in the
extended public sector in Greece. He based his questionnaire on motivation
factors categorised by Herzberg’s (1968) two factor theory of extrinsic and
intrinsic factors. Each question provided a 4-point likert scale with ranges that
were specific to the context of the questions. The following table lists the
motivation factors used in the study:
Table 3.5 Manopoulos’ categorization of motivation factors
Extrinsic factors Intrinsic factors
Provision of fair wage Opportunities to advance the field of employees’ expertise
Provision of pay incentives Need for creative work
Communication and cooperation in the working environment
Need for esteem and reputation
Opportunity for hierarchical advancement Recognition for work
Security in the workplace Need for competence
Working conditions Opportunity to take responsibilities
Source: Manopoulos (2007).
Manopoulos (2007) categorisation of motivation factors appears to hold one
inconsistency compared to Herzberg’s (1968) two-factor theory. Herzberg
indicated that “Opportunity for hierarchical advancement” is an intrinsic
motivation factor, however the above table includes this factor under the
extrinsic category. Upon closer investigation of Manopoulos’ (2007)
questionnaire, this confusion seems to be explained by the survey question
linked to the factor: “The organisation has clear criteria for promotions, based
on meritocracy and transparent procedures”. This question is more related to
the motivation factors “Communication and cooperation in the working
environment” and “Provision of fair promotion procedures”, in which case the
motivation factor measured by the survey question is extrinsic, however it is
perhaps named inconsistently.

Association between employee motivation and
employee demographics in the banking industry
____________________________________________________________________________
___________________________________________
54
Wysocki and Kepner (2000) posed seven questions in their study, each with the
options of “agree” or “disagree” in an argument for management beliefs that
reduce employee motivation and productivity. They concur that money, as an
extrinsic factor, is more likely to be a demotivator, than a motivator while
feedback, similar to the “Job characteristics model” of Hackman and Oldman
(1980), is a crucial motivator. They further advise a ratio of 4:1 for positive-
negative feedback to improve the organisational work climate.
In 1946, 1981 and 1995, Kovach conducted comparison studies between
supervisors and employees in the industrial sector in the United States to
highlight any differences in the prioritization of motivation factors between the
two groups within each survey and over the 50 years. He noted that the
supervisors’ rankings of his ten motivation factors remained almost the same for
each year. He concluded that supervisors were very inconsistent in which
factors they thought motivated employees and which factors actually did
motivate their employees. In Herzberg’s (1968) terms, supervisors incorrectly
ranked may extrinsic factors higher than they were ranked by the employees.
Kovach (1995) attributed this misalignment to a phenomenon known as “self-
reference” where supervisors were ranking motivation factors based on what
would motivate them. Kovach (1995) used the following ten factors:
• Full appreciation of work done
• Feeling of being in on things
• Sympathetic help with personal problems
• Job security
• Good wages
• Interesting work
• Promotion and growth in the organization
• Personal loyalty to employees

Association between employee motivation and
employee demographics in the banking industry
____________________________________________________________________________
___________________________________________
55
• Good working conditions
• Tactful discipline
Wong et al. (1999) used Kovach’s (1995) ten motivation factors categorized by
Herzberg’s (1968) extrinsic and intrinsic two-factor theory to measure the
impact of motivation factors on Hong Kong hotel employees’ choice of job-
related motivators. The table below depicts this categorisation.
Table 3.6 Herzberg categorisation of Kovach’s motivation factors
Extrinsic factors Intrinsic factors
Good working conditions Full appreciation of work done
Tactful discipline Feeling of being involved
Job Security Sympathetic help with personal problems
Good wages Interesting work
Opportunities for advancement and development
Loyalty to employees
Source: Wong et al. (1999).
Kovach’s (1995) subgroups of employees for analysis were based on gender,
age and organisational level, amongst others. He found that females ranked
“full appreciation for work” in first place, while men place it at second. Females
placed “sympathetic help with personal problems” at position seven while males
placed it in positions ten perhaps implying that females associate greater
importance to interpersonal relationships and communication. According to
Wong et al. (1999), females in Hong Kong’s hotels ranked “interesting work”,
“feeling of being involved”, “good working conditions” and “appreciation and
praise for work done” as important. His analysis extends to indicate that
candidates in his sample between 16 and 25 years old rated “interesting work:
higher than any other age group which Wong et al. (1999) attributed to
ambitious and career oriented younger employees preferring challenging jobs.
That is contradictory to Kovach’s (1995) under-30 age group who valued good
wages, job security and promotion and growth as their top three choices. This
reason proposed by Kovach (1995) for this is that they are new workers and are
still fulfilling their basic needs. He also notes that as one moves up the age

Association between employee motivation and
employee demographics in the banking industry
____________________________________________________________________________
___________________________________________
56
groups, the extrinsic needs become less important. According to Maslow’s
(1943) theory, an individual moves up the hierarchy of needs as each level is
fulfilled. This concept appears to apply not only to Maslow’s (1943) hierarchy of
needs but even an individual’s specific version of a hierarchy of needs which
according to most “Needs” theorists including Herzberg (1968) and Maslow
(1943) should have extrinsic needs at its base. The important implication of this
observation is that what is fulfilled cannot motivate any more. From an
organisational level perspective, the lower-organisational level placed “good
wages” and “job security” as number one and two while middle- and higher-
organisational levels placed “job security” and “full appreciation of work done”
as numbers one and two. This offers further motivation for the proposal that
extrinsic needs require fulfilment before intrinsic needs, such as “self-esteem”.
Interestingly, Kovach’s ten motivation factors were used by Beaty et al. (1987)
in South Africa to measure the alignment of white managers’ perceptions of
what motivated black employees. Social dynamics, such as lack of trust for
white managers by blacks and fear of betrayal by informers among the blacks
impacted the rank of the motivation factors for blacks depending on what they
expected was actually possible which relates to Vroom’s (1964) Expectancy
Theory. While both ranked “good pay” as number one, each had a different
perception of the motivation factor (Beaty et al., 1987). Whites viewed this
purely as a corporate matter, while blacks could not resist contemplating this
factor in the bigger picture of economic freedom. Ironically, job security was
ranked relatively highly for blacks under the apartheid regime, while now under
democracy and as the country works its way through the transformation
process, white males are experiencing social identity anxiety (Booysen, 2007b).
“Interesting work” revealed a fundamental tension in apartheid where white
managers expected blacks to only perform simple tasks and not take initiative.
One interviewee attributed this to white managers not wanting to share any
power by delegating any decision making and influential responsibilities to
blacks as a mechanism of oppression (Beaty et al., 1987).

Association between employee motivation and
employee demographics in the banking industry
____________________________________________________________________________
___________________________________________
57
3.4 Conclusion
As stated in the introduction to the chapter, this chapter specifically adds the
context of South Africa and some international reference to the theoretical
foundation set in Chapter 2. South African history has been riddled with
emotions of fear, tension and inequality, characterised by blacks fighting the
struggle against whites who implemented strict measures to keep the blacks
oppressed and reduce their ability to gain power. Following 1994 though, as
mentioned in the chapter, significant power shifts were affected on a social,
political, economic and legislative perspective. The net result has been a mixed
bag of pains and gains for the South Africa. The redress of past inequality is
certainly among one of the gains, however the claim by some races of a
“reverse apartheid” phenomenon developing, is not the intention of
transformation. Retention of whites and interestingly blacks in some
circumstances is a focus for leaders of the new SA with calls for alignment of
management practices with the “Ubuntu” humanistic philosophy. Each
generation is then discussed with regards to varying sources of motivation and
elements of South African history. The discussion continues by a super-
imposing type of analysis of generation and economic eras (industrial, service
and knowledge). A caveat is also introduced in the form of maturity theory as a
consideration that should be taken account of (although not in this study) when
attempting to explain generational characteristic differences. Studies on
diversity management are also introduced where the impact on SA’s global
competitiveness is highlighted.
Finally, employee motivation, discussed in depth, highlighted various motivation
studies that have been conducted. Herzberg’s (1968) theory is certainly among
the more popular that was employed together with varying extrinsic and intrinsic
motivation factors. A well known set of motivation factors employed, even in
South Africa during apartheid (Beaty et al., 1987), were those of Kovach (1995),
who has himself used his list of factors to conduct comparative analysis
spanning over decades.

Association between employee motivation and
employee demographics in the banking industry
____________________________________________________________________________
___________________________________________
58
Now that the theory and studies for culture and theory have been discussed in
detail, the research methodology for this specific study is presented in the
following chapter.

Association between employee motivation and
employee demographics in the banking industry
____________________________________________________________________________
___________________________________________
59
CHAPTER 4: RESEARCH METHODOLOGY
4.1 Introduction
Chapter 4 provides an in-depth understanding of how the research study was
conducted to resolve the problem statement identified in Chapter 1. The chapter
begins with a translation of the four subproblems listed in Chapter 1 into four
hypotheses. The research design is then explained, where the various options
for the methodology are highlighted with brief discussions regarding the
strengths and weaknesses of the different approaches. The methodology then
introduces the context of the study and the selection of the specific alternatives
discussed in the research design section. The discussion begins with the
sample and then proceeds to the measurement instrument drawing focus to the
questions and the scale used to measure responses. Each of the three sections
in the questionnaire is described followed by the motivation for the validity and
reliability of the questionnaire. The details of administering procedure are also
outlined. The analysis of data section lists a step by step account of what was
done with the data to provide results included in the report. Finally research
limitations and ethical considerations conclude the chapter.
4.2 Hypothesis
As mentioned in Chapter 1, the following problem and associated sub-problems
were tested by the hypotheses:
Problem statement: To identify any associations between employee motivation
factors and employee demographics (gender, age, race, organisational level) in
the South African banking industry.
Subproblem 1: To identify any associations between employee motivation
factors and gender in the South African banking industry.
Subproblem 2: To identify any associations between employee motivation
factors and age in the South African banking industry.

Association between employee motivation and
employee demographics in the banking industry
____________________________________________________________________________
___________________________________________
60
Subproblem 3: To identify any associations between employee motivation
factors and race in the South African banking industry.
Subproblem 4: To identify any associations between employee motivation
factors and organisational level in the South African banking industry.
As each subproblem involves the testing of associations between a nominal
variable and the motivation factors, each hypothesis will test for “differences”
rather than “relationships” between the groups (Diamantopoulos et al.,
2000:135). Each sub-problem listed above was translated into a single
hypothesis below:
Hypothesis 1: Differences exist in employee motivation factors between
genders in the South African banking industry.
Hypothesis 2: Differences exist in employee motivation factors between
generations in the South African banking industry.
Hypothesis 3: Differences exist in employee motivation factors between races in
the South African banking industry.
Hypothesis 4: Differences exist in employee motivation factors between
organisational levels in the South African banking industry.
4.3 Research Design
There are two paradigms of research, qualitative and quantitative (Leedy and
Ormrod, 2005). In qualitative research, one collects numerous forms of data
and examines them from various dimensions to construct a rich and meaningful
picture of a complex, multifaceted situation. Quantitative research is best suited
to answer questions about relationships among measured variables with the
purpose of explaining, predicting and controlling phenomena. Quantitative
research usually begins with a specific hypothesis to be tested, while qualitative
research usually starts with general research questions rather than specific
hypotheses. Qualitative study does not necessarily involve studying something
new or modern, but rather initiates inquiry in a topic where little information

Association between employee motivation and
employee demographics in the banking industry
____________________________________________________________________________
___________________________________________
61
exists, the variables are unknown and/or a relevant theoretical base is
inadequate or missing.
There are various different approaches to sampling, which falls into two broad
categories: probability sampling and non-probability sampling. In probability
sampling, the researcher specifies in advance that each segment of the
population will be represented in the sample. This approach involves having
some control of your sample to be able to target the specific segments of the
sample. Utilizing non-probability sampling, the researcher has no way of
predicting whether each segment of the population will be represented in the
sample. According to Leedy and Ormrod (2005) any population of more than
5000 units requires a minimum sample size of 400 to ensure a representative
sample that can be used to draw useful inferences about the population.
Primary data is defined as data collected by the researcher him/herself, while
secondary data would be sourced from existing repositories. Primary data is
often the most valid, the most illuminating and the most truth manifesting (Leedy
and Ormrod, 2005). Secondary data, on the other hand, farther away from the
truth, is derived from primary data.
Two types of instruments are used for primary data collection: surveys and
observations. An observation study would require direct contact either by the
researcher or someone hired to conduct the exercise on behalf of the
researcher. Apart from the additional cost and time required for observation
studies, rater error is also possible if the raters are not trained to rate the
behaviours consistently. The behaviour or attitude measured by an observation
study also needs to be precise and concrete to identify when it occurs. A
survey-based study involves “acquiring information about one or more groups of
people…by asking them questions and tabulating their answers” (Leedy and
Ormrod, 2005:183). This information could be characteristics, opinions,
attitudes or questions. Survey-based research, like observation studies, is
categorized in a larger parent category of descriptive research which explores
the “as-is” situation to identify characteristics of an observed phenomenon or
investigate possible correlations among two or more phenomena (Leedy and

Association between employee motivation and
employee demographics in the banking industry
____________________________________________________________________________
___________________________________________
62
Ormrod, 2005:183). This study did not investigate correlations but focused on
identifying associations (characteristics) between employee demographics and
motivation factors (observed phenomena). Surveys are more efficient and
economical than observations. Appropriately chosen questions can be used to
source information that would typically take much longer to obtain by way of
observation. Surveys also facilitate a larger geographical area to be covered
(Cooper and Emory, 1995). One of the key drawbacks of questionnaires
however, is the poor response rate (Leedy and Ormrod, 2005).
Two types of techniques can be used to evaluate and quantify characteristics or
opinions. A checklist is a list of characteristics or opinions that the respondents
check to indicate whether an item is true or not. A rating scale is more
appropriate when the researcher requires a response on a continuum e.g. Likert
scales.
The advancement of technology offers the additional option of email for today’s
research studies as opposed to paper-based surveys for distribution of the
questionnaires to the sample. Email surveys allow a faster and more cost
saving distribution mechanism than paper-based surveys in addition to a
greater geographical coverage. Email surveys also increase the response rate
by being an easier way to complete and return the questionnaire. The
researcher is also at an advantage with this mechanism as it allows easier
online monitoring of the response rate and if it is within the budget of the study,
a computer programme can be developed to automate extraction of the
responses from the questionnaire into a format that can be uploaded to a
statistics programme, e.g. SPSS.
The validity and reliability of the measurement instrument are also important
aspects that need to be addressed as they influence the degree to which one
can learn something about the phenomenon being studied and draw meaningful
conclusions. Validity refers to the extent to which the measurement instrument
measures what it is supposed to measure. Reliability is the extent to which the
measuring instrument yields a certain result when the entity being measured
has not changed (Leedy and Ormrod, 2005).

Association between employee motivation and
employee demographics in the banking industry
____________________________________________________________________________
___________________________________________
63
Different method of analysis (e.g. two sample t-test and one-way ANOVAs) are
available, depending on specific elements of the study, such as the number of
groups, the number of measures, the nature of the variables (e.g. nominal or
interval) and whether the study involves identifying relationships.
4.4 Methodology
A quantitative approach was chosen for the study because of the main objective
to test specific hypotheses as per section 4.2.
4.4.1 Sample
The South African banking industry has an employee base in access of 30000
employees, which required a sample size of 400 to be representative. A non-
probability hybrid of convenience and snowball sampling was employed to
reach the required sample in the population. Convenience sampling
unfortunately creates a risk (as evidenced by the data collected) of not reaching
a representative subset of the population. The snowball approach was
introduced as part of the approach to facilitate reaching as many employees as
possible and obtaining the required sample size.
Two emails were sent to two distinct categories of individuals known by the
researcher. One category, including only non-banking industry employees,
received an email (Appendix B.3: Initial email to non-banking employees)
requesting them to forward the email to four colleagues working in the banking
industry, requesting the recipients to complete and return the survey and
forward the email, thereby creating the snowball effect. The other category,
including only banking industry employees, received an email (Appendix B.4:
Initial email to banking employees) requesting them to complete and return the
survey and to forward the email to four other colleagues working in the banking
industry, thereby also creating the snowball effect. This approach dramatically
increased the response rate for the survey with many recipients of the email
obliging by forwarding on the email to four other recipients, while a few
individuals even forwarded the email onto more than 25 other recipients.

Association between employee motivation and
employee demographics in the banking industry
____________________________________________________________________________
___________________________________________
64
Although the survey reached some individuals twice via different channels,
these participants only returned the completed survey once.
The original proposal was based on approval at an HR department level from
one the four largest banks in South Africa. When the questionnaire was to be
administered, the study was unfortunately denied access to the employee
database which prevented a systematic stratified sampling process from being
used. Appendix B.7: Original proposal letter to South African bank and
Appendix B.8: Original proposal presentation to South African bank (all
references to the specific bank removed) details the communication sent to the
bank as a proposal for approval to conduct the study.
4.4.2 Measurement instrument
The data collection instrument used for this study was a quantitative descriptive
survey based on a valid and reliable questionnaire which obtained information
regarding the importance placed on motivation factors by employees across the
four demographic dimensions. The questionnaire was based on Herzberg’s
(1968) motivational theories and adapted from Kovach’s (1980, 1987)
motivation studies.
The survey instructed the respondents to answer questions linked to ten job-
related factors (Kovach, 1980, 1987) categorized according to Herzberg’s
(1968) two factor theory. It was originally planned to request survey participants
to rank the ten job related motivation factors but this approach posed a few risks
that would have negatively affected the validity and response rate of the
questionnaire. These risks included:
• Misunderstanding of questionnaire instructions resulting in each factor
behind rated individually on a scale of 1 to 10 instead of being assigned an
exclusive rank position
• Participant mistakes in the rank process, such as assigning two factors to
one position

Association between employee motivation and
employee demographics in the banking industry
____________________________________________________________________________
___________________________________________
65
• Ambiguity of the motivation factor by their original name
• Misleading impression of a short questionnaire that takes longer than
originally anticipated due to large number of items (10 factors) that need to
be ranked as opposed to rated
This resulted in the preferred option of a questionnaire with two simple
questions posed to confirm the importance of each motivation factor. The
second question was a “countercheck” (Leedy and Ormrod, 2005) to ensure
reliability of the answers. The table below shows the links between each
motivation factor and two statements on the questionnaire. The responses
would then be analysed by each demographic subgroup to obtain a rank of
Kovach’s (1995) ten motivation factors.
Table 4.1 Questionnaire statements link to motivation factors
Motivation factor Statement
# Statement (“I require…”)
1. Full appreciation of work done
4 …more explicit performance criteria, against which I am rewarded accordingly
10 …greater recognition and appreciation in the workplace
2. Feeling of being involved
6 …greater involvement in decisions that will directly affect me
15 …management to share more accurate information about the organisation with me on a regular basis
3. Sympathetic help with personal problems
13 …management to make more time to meet and listen to me
8 …management to be more approachable to discuss my personal problems
4. Interesting work
2 …more creativity and meaning in my work
19 …additional responsibility and stimulation in my work
5. Opportunity for development
17 …more opportunities to succeed in my working environment
7 …more development opportunities that are aligned to my needs and aspirations
6. Loyalty to employees
11 …management to be more open and trustworthy
14 …management to be more trustworthy to look after my best interests

Association between employee motivation and
employee demographics in the banking industry
____________________________________________________________________________
___________________________________________
66
Motivation factor Statement
# Statement (“I require…”)
7. Good working conditions
1 …a greater work-life balance in my job
16 …my workplace to be more friendly and have a greater sense of unity
8. Tactful disciplining
18 …management to provide me with more timely and specific feedback on my accomplishments
20 …management to be more constructive and tactful when dealing with poor performance
9. Job security
3 …greater stability of employment at my company
12 …greater job security in my organisation
10. Good wages
9 …a more market related salary
5 …a higher remuneration in relation to my work commitment, position, experience and education
The next challenge was to mitigate the risk of the participants confusing job
dissatisfaction and job satisfaction (motivation) (Herzberg, 1968). One of the
concepts of Maslow’s (1943) theory was that, that which is fulfilled cannot be
used to motivate. If participants answered the questionnaire with job
dissatisfaction in mind, they would probably rate all the statements (factors) as
“Agree strongly”, but if they were asked which factor, not currently fulfilled,
would motivate them if it was fulfilled, their choice of which questions they
“Agree strongly” with, would be limited to only motivation factors. To accomplish
this, a term implying “an increase in”, was adjusted to the context and added to
each statement while a universal “I require” was indicated as the prefix to all
statements in the instructions for Section 3. Each question therefore read
similar to “I require an increase in...”
With the choice of a rating scale preferred to the 10-point rank scale, the
pertinent next design question was that of the likert scale. Firstly, there was the
consideration of an even or odd number of options. As remarked by Leedy and
Ormrod (2005), researchers have mixed views on this consideration. An even
scale was opted to prevent respondents from “straddling the fence” in light of
the responses being eventually aggregated per demographic subgroup. A six-
point design was favoured in light of these considerations and for reliability

Association between employee motivation and
employee demographics in the banking industry
____________________________________________________________________________
___________________________________________
67
purposes to allow the participant an adequate variation of responses per
statement to further facilitate the aggregated ratings of the motivation factors.
A checklist was used to capture the required demographic information, including
gender, generation, race and organisational level. To avoid any sentiment of
exclusion during completion of the survey among participants that may
negatively impact the response rate, the request for “race” in the first section
allowed for a category of “Other” with specification from the respondent. Any
data related to a category outside the four delimited races was, however, not be
used during the hypothesis testing of the study but was mentioned in the
statistical analysis of the sample.
In totality, the questionnaire (Appendix A.1: Employee motivation survey)
consisted of three sections: the first section requested demographic information
(age, race, gender) from the respondents using checklists, section two required
the respondents to rate 20 questions related to Kovach’s ten job-related
motivation factors on a six-point likert scale (1=Agree strongly, 6=Disagree
strongly) and section 3 allowed the respondent the option of providing contact
details if he/she requires an executive summary of the report once complete.
Herzberg’s (1968) and Kovach’s (1980, 1987) work on motivation theory have
been used for many years in employee motivation studies across the world and
in different industries. For example, in 1999, Wong et al. conducted a research
into possible relationships between demographic variables and the ten job-
related motivators among Hong Kong hotel employees to suggest strategies to
hoteliers for developing suitable motivation programmes for employees with
different demographic backgrounds. In another study, Kovach (1987) conducted
a study using his ten job-related motivation factors and Herzberg’s research to
compare results with a similar survey conducted in the industrial sector in 1946.
Beaty et al. (2001) also delivered results of Kovach’s motivation factors in South
Africa comparing the responses of supervisors and employees. The multiple
employs of Herzberg’s (1968) and Kovach’s (1980, 1987) motivation theory
research studies supported the face validity of the questionnaire.

Association between employee motivation and
employee demographics in the banking industry
____________________________________________________________________________
___________________________________________
68
In 2005, Kovach himself conducted a study to answer the question “Does
Herzberg’s motivation theory have staying power?” He employed a quantitative
survey questionnaire with questions related to Herzberg’s two-factor motivation
theory. The findings from data collected from over 3200 respondents in 32 large
organisations concluded that the Herzberg’s theory still had utility nearly 50
years after it was first developed.
Using a survey questionnaire as opposed to an observation study also
improved the reliability of the rating as the employees themselves were
requested to rate the questions and not independent raters.
4.4.3 Administering procedure
An important part of the survey was that it was entirely voluntary. Although a
recipient of the email would have received the questionnaire, it was up to the
individual as to whether they wanted to respond.
The questionnaire was distributed exclusively (for purposes of reliability) via
email with a return address on the questionnaire. The researcher setup an
email address specifically for the purposes of the research to effectively
manage the large number of respondents. The original email request however,
was sent from the researcher’s private email address as it was thought that this
would create a more personalized request to the recipients encouraging more of
them to forward the email on for the snowball effect. It was noted however, that
this did result in some responses being forwarded directly to the researcher’s
private email box and not to the specific email address setup to collect the
responses.
The questionnaire and the confidentiality letter (Appendix B.1: Letter from SBL
confirming researcher as bona fide student) was attached to both emails with
the cover letter in the body of the emails. This facilitated simpler forwarding of
the questionnaire with the sender not required to formulate any additional body
to the email as the original email was self-explanatory and in the words of the
researcher. This also prevented any miscommunication regarding the purpose
of the survey, adding to the questionnaire’s validity. As the only communication
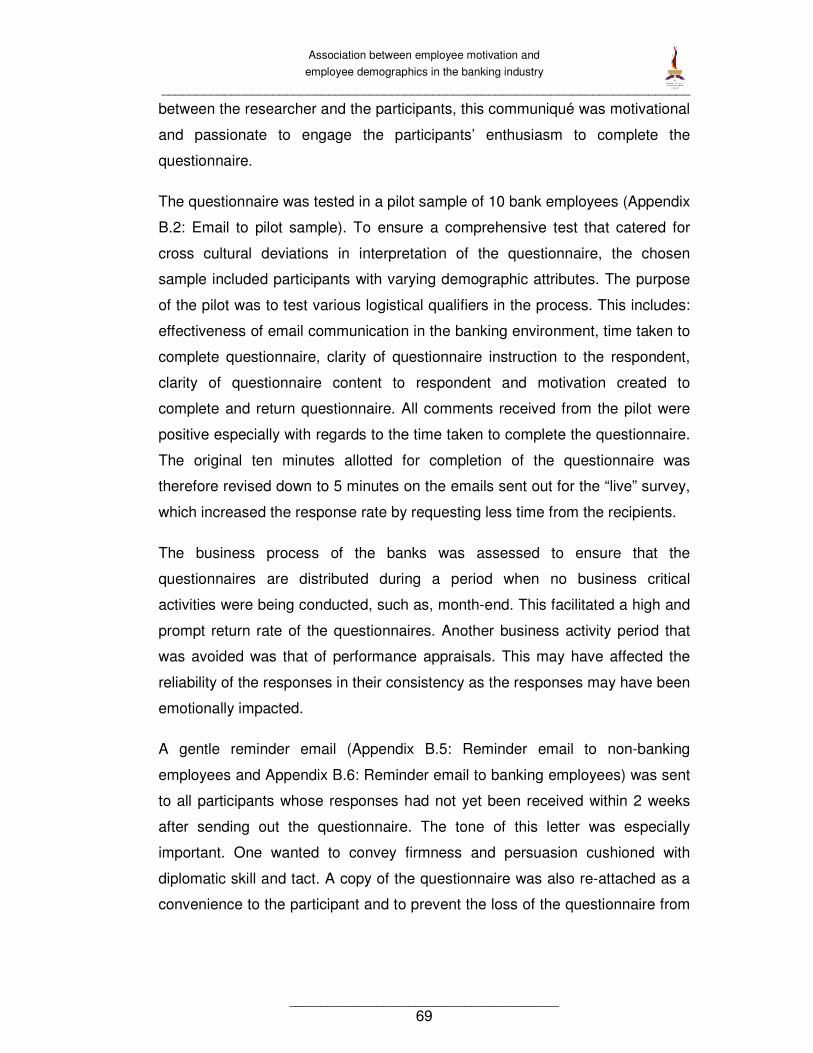
Association between employee motivation and
employee demographics in the banking industry
____________________________________________________________________________
___________________________________________
69
between the researcher and the participants, this communiqué was motivational
and passionate to engage the participants’ enthusiasm to complete the
questionnaire.
The questionnaire was tested in a pilot sample of 10 bank employees (Appendix
B.2: Email to pilot sample). To ensure a comprehensive test that catered for
cross cultural deviations in interpretation of the questionnaire, the chosen
sample included participants with varying demographic attributes. The purpose
of the pilot was to test various logistical qualifiers in the process. This includes:
effectiveness of email communication in the banking environment, time taken to
complete questionnaire, clarity of questionnaire instruction to the respondent,
clarity of questionnaire content to respondent and motivation created to
complete and return questionnaire. All comments received from the pilot were
positive especially with regards to the time taken to complete the questionnaire.
The original ten minutes allotted for completion of the questionnaire was
therefore revised down to 5 minutes on the emails sent out for the “live” survey,
which increased the response rate by requesting less time from the recipients.
The business process of the banks was assessed to ensure that the
questionnaires are distributed during a period when no business critical
activities were being conducted, such as, month-end. This facilitated a high and
prompt return rate of the questionnaires. Another business activity period that
was avoided was that of performance appraisals. This may have affected the
reliability of the responses in their consistency as the responses may have been
emotionally impacted.
A gentle reminder email (Appendix B.5: Reminder email to non-banking
employees and Appendix B.6: Reminder email to banking employees) was sent
to all participants whose responses had not yet been received within 2 weeks
after sending out the questionnaire. The tone of this letter was especially
important. One wanted to convey firmness and persuasion cushioned with
diplomatic skill and tact. A copy of the questionnaire was also re-attached as a
convenience to the participant and to prevent the loss of the questionnaire from

Association between employee motivation and
employee demographics in the banking industry
____________________________________________________________________________
___________________________________________
70
being cited as a reason for the lack of a response. A third reminder was sent
within one week before the due date of the questionnaire,
On receipt of the questionnaire, a prompt ‘Thank You’ email was sent back to
the recipient with the additional reassurance that the results would be made
available to those who requested it.
4.4.4 Analysis of data
The following diagram summarizes the hypotheses that were tested in the
study.
To identify any
associations
between employee
demographics (age,
gender, race,
organisational level)
and employee
motivation factors
in the South African
banking industry
age ��
employee motivation
gender ��
employee motivation
race ��
employee motivation
organisational level ��
employee motivation
H1 – H2 H3 – H4
Figure 4.1 Hypotheses
The values of the four demographic variables are listed in the table below:
Table 4.2 Demographic variable values
Age Gender Race Organisational Level
Veteran Female Black Top management
Baby boomer Male Coloured Senior management
Generation X Indian/Asian Junior management
Internet generation White Non-management
Gender and race are nominal variables. While age is typically a ratio variable, it
will be analysed by a generation categorisation as a nominal variable to draw
inferences regarding the different generations. Nonetheless, the variable will be
required as a ratio input on the questionnaire for the purposes of potential
statistical analysis. This will be combined with other descriptive and exploratory
statistical analyses (frequencies, cumulative frequencies, percentages and
histograms) of the entire questionnaire in order to describe the sample in terms

Association between employee motivation and
employee demographics in the banking industry
____________________________________________________________________________
___________________________________________
71
of the relevant biographical aspects and to get preliminary results for the item
responses on the demographic dimensions as a whole.
The following process was followed for analysis of the data:
• For each respondent a mean of the two questions was calculated for each
motivation factor
• The results from the previous step were used to calculate means for each
generation, gender, race and organisational level with respect to the
importance of each motivation factor
• For each motivation factor, the means of males and females were compared
using individual sample t-tests.
• For each motivation factor, the means of the three generations were
compared using ANOVA.
• For each motivation factor, the means of the four races were compared
using ANOVA.
• For each motivation factor, the means of the four organisational levels were
compared using ANOVA.
• For each generation, gender, race and organisational level, the means of
the motivation factors were sorted (calculated in the second step) in
ascending order (likert scale: 1 represented “Strongly agree” and 6
represented “Strongly disagree”) to ascertain rank.
• Graphically represent the associations and rank between the motivation
factors and the genders, generations, races and organisational levels.
4.5 Limitations
A survey research posed a risk as a data collection mechanism in that they
were based on self-report data, that is, people’s subjectivity. People delivered
information as they perceived it, which was not necessarily factual. Attitudes

Association between employee motivation and
employee demographics in the banking industry
____________________________________________________________________________
___________________________________________
72
and responses were also “constructed on the spot” and related to the current
context (Osteraker, 1999; Leedy and Ormrod, 2005), thereby revealing only a
snapshot view. Another side effect of using questionnaires was that participants
could have misrepresented responses to create a falsely favourable impression
to the researcher.
The study was limited to four demographic variables: age, gender, race and
organisational level. Among other demographic variables that were not included
in the study are the following: marital status, department (e.g. marketing, human
resources), education, tenure and monthly income.
The study was also only conducted in the banking industry. The literature
review conveyed other examples of industries where the survey was conducted
and as such the motivation factors are possibly applicable to all industries in an
economy.
The employee motivation factors were all job related. They do not consider how
non job related factors such as relationship with family and spouse, meaningful
leisure, personal educational pursuits and successful role fulfilment in non job
related activities might influence the employee motivation within the workplace.
The study used means of differences in motivation factor responses between
demographic categories to identify the existence of associations between the
demographic categories, but it did not measure the strength of these
relationships. The number of motivation factors which did display a difference
between categories (e.g. male and female) within a demographic (e.g. gender)
was used as a relative measure to compare the association between motivation
factors and other demographics within the study. This was based on the
assumption of a constant strength weighting on each association between a
demographic and a motivation factor.
4.6 Ethical considerations
In a research project of this nature where the responses of the participants
could have had direct impact of their working relationships with managers and

Association between employee motivation and
employee demographics in the banking industry
____________________________________________________________________________
___________________________________________
73
peers, confidentiality by the researcher was of the utmost importance. This
assurance, together with the principle of informed consent, was delivered in the
cover letter which included the following (Leedy, et al., 2005):
• A brief description of the study
• The extent of the participant’s involvement in the study
• That the participation was voluntary and that it could have been terminated
at any point without penalty
• A guarantee that all responses remained private and confidential. A
confidentiality letter from the researcher’s university was included as an
attachment on the email.
• Contact details in the event of any queries
• The option to be forwarded a summarized version of the results of the study
once complete
As discussed in the literature review, similar studies have been conducted by
other researchers. As such, their findings were used for the purpose of a literary
background into the field of study but were not be plagiarised in the findings of
this report.
The integrity of the results of the research was of utmost importance and as
such the validity of the research and analysis techniques were beyond
reproach. All techniques were fully documented and all results were made
objectively.
4.7 Conclusion
The study assumed the quantitative paradigm based on primary data. A non
probability hybrid of convenience and snowball sampling was employed to
obtain the required sample of employees for the study. Two types of emails
were sent out to initiate the snowball: one to banking and the other to non-

Association between employee motivation and
employee demographics in the banking industry
____________________________________________________________________________
___________________________________________
74
banking employees. The primary data was collected using a descriptive survey
questionnaire. The questionnaire discussion highlighted the researcher’s
concern that the questionnaire was made as simple as possible to encourage a
high response rate. Kovach (1995) and Herzberg (1968) were key contributors
in the literature behind this study. Each of Kovach’s (1995) ten motivation
factors that are typically ranked were divided into two representative rating
questions to simplify the process for the respondent and leave the work to the
researcher to ascertain the rank. Following a discussion of the instrument’s
validity and reliability, the administering procedure is explained. The cover
letter, pilot, integration with business processes, reminder and the eventual
“thank you” letter are all discussed in detail. The analysis is discussed with
specific steps to calculate the means of responses to the motivation factors and
then compare them within each demographic to identify association before
presenting the rank of the ten motivation factors for each of the fourteen
demographic categories. A discussion of the limitations of the study and the
ethical considerations highlighting confidentiality and informed consent of the
respondent conclude the chapter. This chapter has set the scene for review of
the results in the next chapter.

Association between employee motivation and
employee demographics in the banking industry
____________________________________________________________________________
___________________________________________
75
CHAPTER 5: RESEARCH RESULTS
5.1 Introduction
Chapter 5 will discuss the results from the study with the presentation of various
tables and charts to deliver different elements of the analysis. The chapter
begins with descriptive statistics regarding the sample and highlights specific
changes in some of the demographic categories used in the analysis, compared
to the literature, due to the sample that responded to the survey. The reliability
and data distribution of the questionnaire are then considered before the
chapter opens to the first of two key areas, which investigates the response
differences in employee motivation factors between employee demographic
categories to test the hypotheses. The second key area of the chapter then
uses the means of the responses for each motivation factor to rank the factors
per demographic category.
5.2 Final sample size
A total of 137 valid responses were received by the close of the survey, which
was deemed sufficient to conduct the analysis and draw inferences from the
results. The original email was sent to 18 banking colleagues, while 52 non-
banking colleagues received the request to the questionnaire on to their
banking colleagues. Although, the email did contain the instruction to include
the motivation survey email address on all emails that forwarded the
questionnaire to a new level of the snowball, this was not always done as some
responses were received without a trace to the sender, which created difficulty
in ascertaining an accurate response rate.
5.3 Respondent profile
Four demographic dimensions were considered in the research study including
gender, age, race and organisational level. Although the survey requested
direct entry for the age demographic, the analysis coded this data into the four

Association between employee motivation and
employee demographics in the banking industry
____________________________________________________________________________
___________________________________________
76
generations: Veterans, Baby Boomers, Generation X and Generation Y. The
rest of the demographic factors were analysed as per the groups requested on
the survey questionnaire. Table 5.1 below describes the composition of the
employee sample by the five demographics including in the survey
questionnaire.
Table 5.1 Composition of employee sample by demographics
Demographic Frequency Percentage
Factor Category
Generation
Veterans 0 0
Baby Boomers 46 33.6
Generation X 57 41.6
Generation Y 34 24.8
Gender Male 78 56.9
Female 59 43.1
Race
Black 18 13.1
Coloured 9 6.6
Indian 61 44.5
White 46 33.6
Other 3 2.2
Organisational level
Senior management 17 12.4
Middle management 27 19.7
Junior management 41 29.9
Non-management 52 38.0
Functional business area Business banking 23 16.8
Corporate Investment 13 9.5
Finance 15 10.9
Group Economics 0 0
Group Strategy 6 4.4
Human Resources 16 11.7
Information Technology 23 16.8
Marketing and Comm. 0 0
Operations 18 13.1
Retail Banking 21 15.3

Association between employee motivation and
employee demographics in the banking industry
____________________________________________________________________________
___________________________________________
77
Demographic Frequency Percentage
Factor Category
Other 2 1.5
One of the first impressions that one notes about the sample composition from
Table 5.1 is that no respondents were located in the veteran (older than 64
years old) generation. On the other hand, the highest number of responses
among the generations was generation X with 57 (41.6%) responses, while
generation Y accounted for the lowest (24.8%) among the generations. The
sample split between the two genders is also disparate, with more the 55% of
the respondents being male and 43.1% being female. The composition of
respondents across the four races is unevenly spread with the highest
percentage recorded by Indians returning 61 (44.5%) of 137 questionnaires and
the lowest number of surveys received from coloureds who formed 6.6% of the
sample size, which was just below half of the responses received from blacks
(13.1%). Three surveys were received with indication of races outside these
four races groups, all of whom were of Chinese decent. These three surveys
were not included in the analysis. Finally, the number of responses in each
management level was in a distinctly ascending order from senior to non-
management with 17 (12.4%) senior managers and 52 (38.0%) non-managers
returning the questionnaire.
Although functional business area is not considered the hypothesis of this
study, it was included in the questionnaire. No respondents were reached in the
group economics and marketing and communications functional business
areas, while the highest response rate was between information technology and
business banking employees with 23%, followed closely by 21% of the
responses being received from retail banking employees. Two employees
responded to this question by adding their specific functional business area to
the list due to none of the options of the questionnaire being applicable.
It should also be noted that although 152 questionnaires were received, 15
questionnaires were regarded as completely invalid when assessed against any
of the following criteria:

Association between employee motivation and
employee demographics in the banking industry
____________________________________________________________________________
___________________________________________
78
• Incomplete responses for any questions in section A or B
• Selection of multiple responses for any question in section A or B
• Omission of responses for any question in section A or B
5.4 Reliability analysis and data distribution
Kendall’s tau-b was used to measure the reliability of the questionnaire.
Kendall's tau-b is a nonparametric measure of association based on the number
of concordances and discordances in paired observations. Concordance occurs
when paired observations vary together, and discordance occurs when paired
observations vary differently (SAS Institute, 1999)
In the case of this study, each of the ten motivation factors was linked to two
questions on the survey, as described in Table 4.1. Kendall’s tau-b values were
therefore calculated in Table 5.2 below, between each of the two questions per
motivation factor.
Table 5.2 Kendall’s tau-b for questions linked to motivation factors
Motivation factor Statement # Kendall’s tau-b
1. Full appreciation of work done 4
0.483 10
2. Feeling of being involved 6
0.519 15
3. Sympathetic help with personal problems 13
0.524 8
4. Interesting work 2
0.542 19
5. Opportunity for development 17
0.696 7
6. Loyalty to employees 11
0.707 14
7. Good working conditions 1
0.331 16
8. Tactful disciplining 18
0.502 20

Association between employee motivation and
employee demographics in the banking industry
____________________________________________________________________________
___________________________________________
79
Motivation factor Statement # Kendall’s tau-b
9. Job security 3
0.660 12
10. Good wages 9
0.658 5
Most Kendall tau-b values indicated a high concordance between the two
“countercheck” (Leedy and Ormrod, 2005) questions related to each motivation
factor, with the exception of the questions for motivation factor “Good working
conditions” which had a moderate concordance. This was indicative of high
validity in the questionnaire as the two questions per motivation factor were
answered with similar responses.
Table 5.3 below, lists the coding used in the analysis for the likert scale
responses. In hindsight, it was identified subsequent to the questionnaires being
sent out that the likert scale was perhaps counter intuitive in its layout. Perhaps,
a swapping of the “agree” and “disagree” sides of the scale would have made
the questionnaire easier to complete, that is, with disagree to agree running
from left to right , rather than vice versa.
Table 5.3 Likert scale coding
Likert Scale Code
Agree strongly 1
Agree 2
Agree somewhat 3
Disagree somewhat 4
Disagree 5
Disagree strongly 6
As per Table 5.4 below, the means and medians are predominantly less than or
equal to 3.5 indicating that most responses to the questions were in greater
agreement with the questions to a certain degree.

Association between employee motivation and
employee demographics in the banking industry
____________________________________________________________________________
___________________________________________
80
Table 5.4 Summary statistics per motivation factor
Statistic Factor
1 Factor
2 Factor
3 Factor
4 Factor
5 Factor
6 Factor
7 Factor
8 Factor
9 Factor
10
Mean 2.832 2.821 3.478 3.102 2.668 2.891 2.989 2.971 3.544 2.387
Std Error 0.111 0.103 0.104 0.107 0.113 0.119 0.097 0.111 0.111 0.097
Median 2.5 2.5 3.5 3 2.5 2.5 3 3 3.5 2
Mode 2.5 2 2.5 4 1 2 3 3 5 2
Std. Dev. 1.295 1.202 1.220 1.255 1.327 1.396 1.138 1.297 1.295 1.131
Sample Var. 1.677 1.444 1.488 1.574 1.762 1.947 1.296 1.683 1.678 1.279
Kurtosis -0.749 -0.948 -0.775 -1.080 -0.818 -0.846 -0.776 -0.982 -1.038 -0.069
Skewness 0.457 0.398 -0.087 0.054 0.414 0.449 0.270 0.178 -0.121 0.742
Range 4.5 4 5 4.5 5 5 4.5 4.5 5 4
Min. 1 1 1 1 1 1 1 1 1 1
Max. 5.5 5 6 5.5 6 6 5.5 5.5 6 5
Count 137 137 137 137 137 137 137 137 137 137
The following figures (Figure 5.1 - Figure 5.10) graphically represent the
distribution of responses per motivation factor with trend lines (polynomial,
order=3). These figures also support the predominantly positive skew of the
distribution indicated in the table above, with the exception of factor 3 and factor
9 showing a slightly negative skew of the distribution as evidenced by the
means being lower than medians and the negative skewness in both cases. On
the other extreme the most prominent positive skew is for factor 10.

Association between employee motivation and
employee demographics in the banking industry
____________________________________________________________________________
___________________________________________
81
0
5
10
15
20
25
30
1 2 3 4 5 6
Agree����Disagree
Fre
qu
en
cy
Figure 5.1 Factor 1 Distribution
0
5
10
15
20
25
30
1 2 3 4 5 6
Agree����Disagree
Fre
qu
en
cy
Figure 5.2 Factor 2 Distribution
0
5
10
15
20
25
30
1 2 3 4 5 6
Agree����Disagree
Fre
qu
en
cy
Figure 5.3 Factor 3 Distribution
-5
0
5
10
15
20
25
1 2 3 4 5 6
Agree����Disagree
Fre
qu
en
cy
Figure 5.4 Factor 4 Distribution
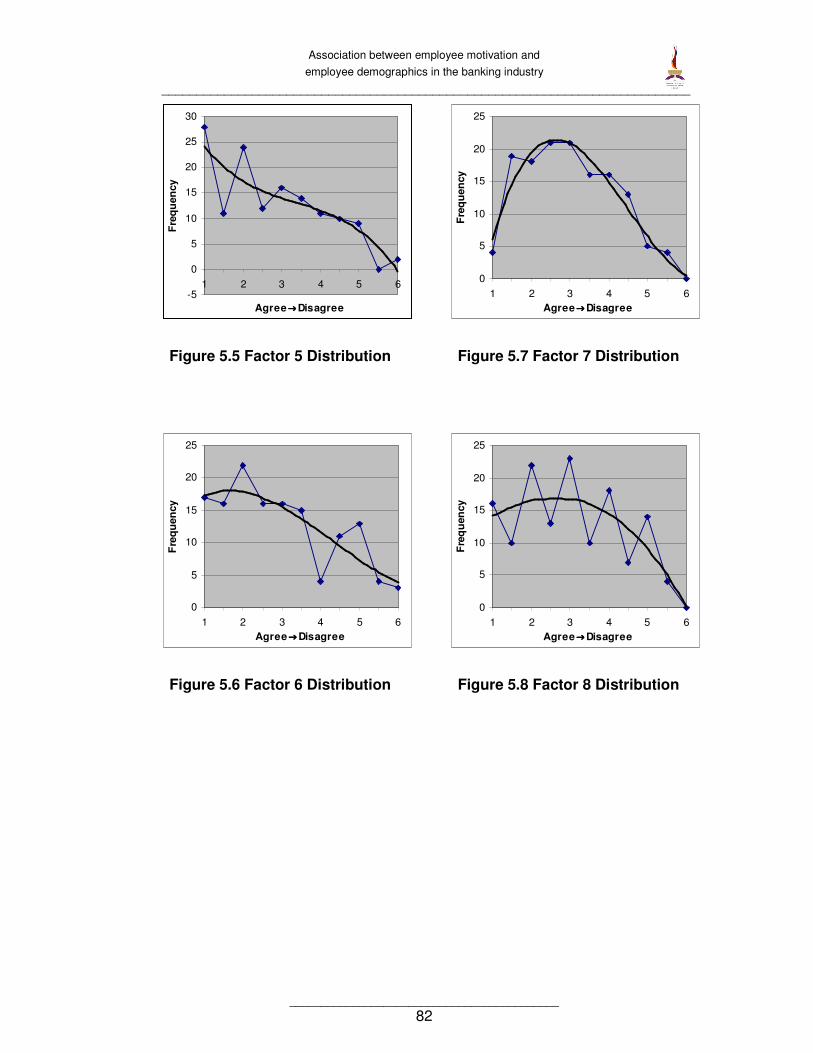
Association between employee motivation and
employee demographics in the banking industry
____________________________________________________________________________
___________________________________________
82
-5
0
5
10
15
20
25
30
1 2 3 4 5 6
Agree����Disagree
Fre
qu
en
cy
Figure 5.5 Factor 5 Distribution
0
5
10
15
20
25
1 2 3 4 5 6
Agree����Disagree
Fre
qu
en
cy
Figure 5.6 Factor 6 Distribution
0
5
10
15
20
25
1 2 3 4 5 6
Agree����Disagree
Fre
qu
en
cy
Figure 5.7 Factor 7 Distribution
0
5
10
15
20
25
1 2 3 4 5 6
Agree����Disagree
Fre
qu
en
cy
Figure 5.8 Factor 8 Distribution

Association between employee motivation and
employee demographics in the banking industry
____________________________________________________________________________
___________________________________________
83
0
5
10
15
20
25
30
1 2 3 4 5 6
Agree����Disagree
Fre
qu
en
cy
Figure 5.9 Factor 9 Distribution
0
5
10
15
20
25
30
1 2 3 4 5 6
Agree����Disagree
Fre
qu
en
cy
Figure 5.10 Factor 10 Distribution
5.5 Differences in motivation between demographics
The following section addresses the hypotheses from Section 4.2, repeated for
reference below:
Hypothesis 1: Differences exist in employee motivation factors between
genders in the South African banking industry.
Hypothesis 2: Differences exist in employee motivation factors between
generations in the South African banking industry.
Hypothesis 3: Differences exist in employee motivation factors between races in
the South African banking industry.
Hypothesis 4: Differences exist in employee motivation factors between
organisational levels in the South African banking industry.
5.5.1 Hypothesis 1: Gender differences
Figure 5.11 below, graphically represents the comparison of means between
the two gender groups: males and females. As can be observed, males

Association between employee motivation and
employee demographics in the banking industry
____________________________________________________________________________
___________________________________________
84
tendered to be in more disagreement than females and across all ten motivation
factors.
1.0
2.0
3.0
4.0
5.0
6.0
1 2 3 4 5 6 7 8 9 10
Motivational factors
Ag
ree�� ��
Dis
ag
ree
Male
Female
Figure 5.11 Gender comparison of means
The alternate and null hypotheses were as follows:
H1: Differences exist in employee motivation factors between genders in the
South African banking industry.
H0: Differences do not exist in employee motivation factors between genders in
the South African banking industry.
This hypothesis was tested using the two-sample t-test to measure the equality
of means of responses per employee motivation factor between males and
females. An inequality of means at a 5% significance level for a motivation
factor would reject the null hypothesis, thereby supporting the alternate
hypothesis that differences exist in that specific motivation factor between
genders in the South African banking industry.
Table 5.5 below, lists the means for the responses of males and females across
the ten motivation factors.

Association between employee motivation and
employee demographics in the banking industry
____________________________________________________________________________
___________________________________________
85
Table 5.5 Selected summary statistics for Gender
Factor Gender N Mean Std. Deviation Std. Error Mean
1. Full appreciation of work done
Female 78 2.7116 1.24452 0.14091
Male 59 2.9915 1.35345 0.17620
2. Feeling of being involved Female 78 2.7115 1.22877 0.13913
Male 59 2.9661 1.15916 0.15091
3. Sympathetic help with personal problems
Female 78 3.4038 1.29449 0.14657
Male 59 3.5763 1.11731 0.14546
4. Interesting work Female 78 3.0321 1.33713 0.15140
Male 59 3.1949 1.14100 0.14854
5. Opportunity for development Female 78 2.4808 1.33738 0.15143
Male 59 2.9153 1.28369 0.16712
6. Loyalty to employees Female 78 2.7949 1.42208 0.16102
Male 59 3.0169 1.36131 0.17723
7. Good working conditions Female 78 2.8205 1.15087 0.13031
Male 59 3.2119 1.09152 0.14210
8. Tactful disciplining Female 78 2.9103 1.36454 0.15450
Male 59 3.0508 1.20950 0.15746
9. Job security Female 78 3.5128 1.24831 0.14134
Male 59 3.5847 1.36506 0.17772
10. Good wages Female 78 2.2372 1.15299 0.13055
Male 59 2.5847 1.07940 0.14053
In Table 5.6, the above means for males and females are compared to each
other for each factor.

Association between employee motivation and
employee demographics in the banking industry
____________________________________________________________________________
___________________________________________
86
Table 5.6 Independent two sample t-test for Gender
Levene's Test for Equality of
Variances t-test for Equality of Means
F Sig. t Sig. (2-
tailed)
Mean Difference
1. Full appreciation of work done
Equal variances assumed
1.536 0.217 -1.256 0.211 -0.27999
Equal variances not assumed
-1.241 0.217 -0.27999
2. Feeling of being involved
Equal variances assumed
0.472 0.493 -1.230 0.221 -0.25456
Equal variances not assumed
-1.240 0.217 -0.25456
3. Sympathetic help with personal problems
Equal variances assumed
1.639 0.203 -0.818 0.415 -0.17243
Equal variances not assumed
-0.835 0.405 -0.17243
4. Interesting work
Equal variances assumed
1.967 0.163 -0.751 0.454 -0.16286
Equal variances not assumed
-0.768 0.444 -0.16286
5. Opportunity for development
Equal variances assumed
0.299 0.586 -1.916 0.058 -0.43449
Equal variances not assumed
-1.927 0.056 -0.43449
6. Loyalty to employees
Equal variances assumed
0.115 0.735 -0.922 0.358 -0.22208
Equal variances not assumed
-0.927 0.355 -0.22208
7. Good working conditions
Equal variances assumed
0.025 0.874 -2.015 0.046* -0.39135
Equal variances not assumed
-2.030 0.044* -0.39135
8. Tactful disciplining
Equal variances assumed
1.654 0.201 -0.627 0.532 -0.14059
Equal variances not assumed
-0.637 0.525 -0.14059
9. Job security
Equal variances assumed
1.648 0.201 -0.321 0.749 -0.07193
Equal variances not assumed
-0.317 0.752 -0.07193
10. Good wages
Equal variances assumed
0.079 0.779 -1.795 0.075 -0.34757
Equal variances not assumed
-1.812 0.072 -0.34757
Notes: * Denotes significance level < 0.05
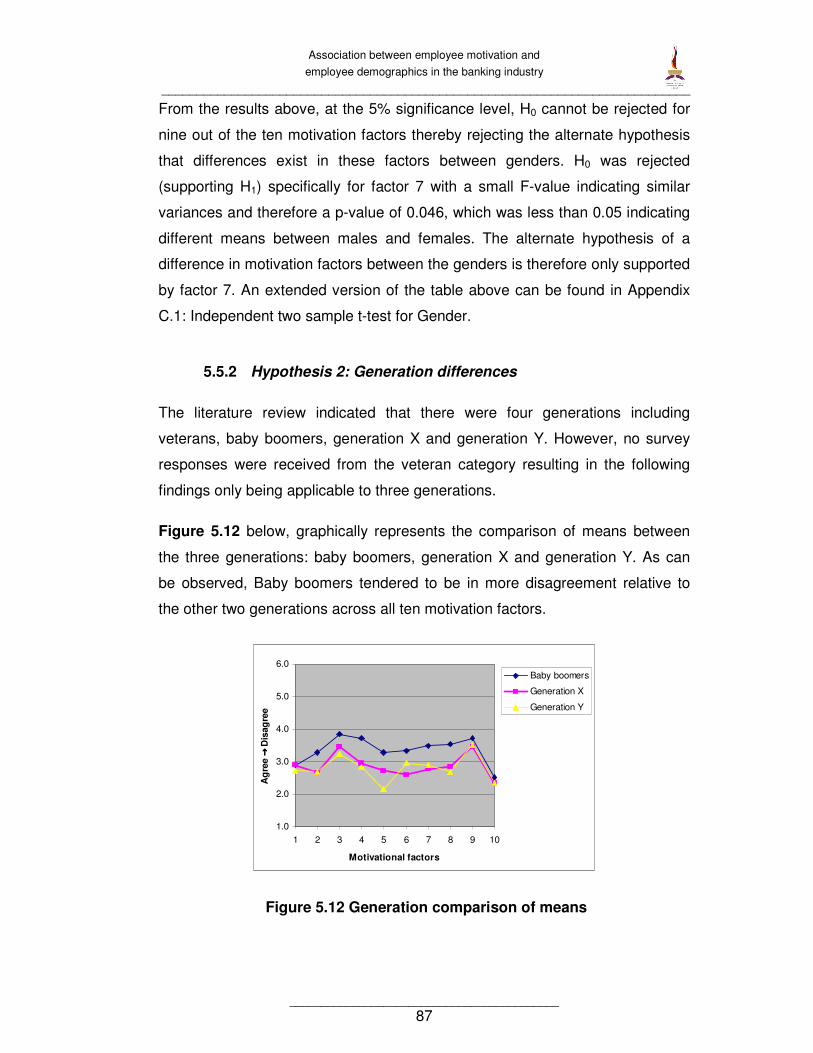
Association between employee motivation and
employee demographics in the banking industry
____________________________________________________________________________
___________________________________________
87
From the results above, at the 5% significance level, H0 cannot be rejected for
nine out of the ten motivation factors thereby rejecting the alternate hypothesis
that differences exist in these factors between genders. H0 was rejected
(supporting H1) specifically for factor 7 with a small F-value indicating similar
variances and therefore a p-value of 0.046, which was less than 0.05 indicating
different means between males and females. The alternate hypothesis of a
difference in motivation factors between the genders is therefore only supported
by factor 7. An extended version of the table above can be found in Appendix
C.1: Independent two sample t-test for Gender.
5.5.2 Hypothesis 2: Generation differences
The literature review indicated that there were four generations including
veterans, baby boomers, generation X and generation Y. However, no survey
responses were received from the veteran category resulting in the following
findings only being applicable to three generations.
Figure 5.12 below, graphically represents the comparison of means between
the three generations: baby boomers, generation X and generation Y. As can
be observed, Baby boomers tendered to be in more disagreement relative to
the other two generations across all ten motivation factors.
1.0
2.0
3.0
4.0
5.0
6.0
1 2 3 4 5 6 7 8 9 10
Motivational factors
Ag
ree�� ��
Dis
ag
ree
Baby boomers
Generation X
Generation Y
Figure 5.12 Generation comparison of means

Association between employee motivation and
employee demographics in the banking industry
____________________________________________________________________________
___________________________________________
88
The alternate and null hypotheses were as follows:
H1: Differences exist in employee motivation factors between generations in the
South African banking industry.
H0: Differences do not exist in employee motivation factors between
generations in the South African banking industry.
This hypothesis was tested using the one-way ANOVA to measure the equality
of means of responses per employee motivation factor between the
generations. An inequality of means at a 5% significance level for a motivation
factor would reject the null hypothesis, thereby supporting the alternate
hypothesis that differences exist in that specific motivation factor between
generations in the South African banking industry.
Table 5.7 below, lists the means for the responses of each generation across
the ten motivation factors.
Table 5.7 Selected summary statistics for Generation
Factor Generation N Mean Std.
Deviation Std. Error
1. Full appreciation of work done
Generation Y 46 2.7065 1.20911 0.17827
Generation X 57 2.8947 1.33208 0.17644
Baby Boomers 34 2.8971 1.36947 0.23486
Total 137 2.8321 1.29518 0.11065
2. Feeling of being involved
Generation Y 46 2.6848 1.12229 0.16547
Generation X 57 2.6579 1.15788 0.15337
Baby Boomers 34 3.2794 1.29212 0.22160
Total 137 2.8212 1.20162 0.10266
3. Sympathetic help with personal problems
Generation Y 46 3.2283 1.13874 0.16790
Generation X 57 3.4561 1.28619 0.17036
Baby Boomers 34 3.8529 1.15161 0.19750
Total 137 3.4781 1.22004 0.10423
4. Interesting work
Generation Y 46 2.8370 1.12079 0.16525
Generation X 57 2.9561 1.28619 0.17036
Baby Boomers 34 3.7059 1.20678 0.20696
Total 137 3.1022 1.25461 0.10719

Association between employee motivation and
employee demographics in the banking industry
____________________________________________________________________________
___________________________________________
89
Factor Generation N Mean Std.
Deviation Std. Error
5. Opportunity for development
Generation Y 46 2.1522 0.94204 0.13890
Generation X 57 2.7105 1.33613 0.17697
Baby Boomers 34 3.2941 1.49807 0.25692
Total 137 2.6679 1.32742 0.11341
6. Loyalty to employees
Generation Y 46 2.9457 1.20291 0.17736
Generation X 57 2.5877 1.31313 0.17393
Baby Boomers 34 3.3235 1.66462 0.28548
Total 137 2.8905 1.39552 0.11923
7. Good working conditions
Generation Y 46 2.9022 1.03612 0.15277
Generation X 57 2.7632 1.21782 0.16130
Baby Boomers 34 3.4853 1.00367 0.17213
Total 137 2.9891 1.13835 0.09726
8. Tactful disciplining
Generation Y 46 2.6957 1.13274 0.16701
Generation X 57 2.8509 1.24271 0.16460
Baby Boomers 34 3.5441 1.44792 0.24832
Total 137 2.9708 1.29729 0.11084
9. Job security
Generation Y 46 3.5109 1.27143 0.18746
Generation X 57 3.4649 1.30883 0.17336
Baby Boomers 34 3.7206 1.32683 0.22755
Total 137 3.5438 1.29546 0.11068
10. Good wages
Generation Y 46 2.3587 1.09373 0.16126
Generation X 57 2.3333 1.22596 0.16238
Baby Boomers 34 2.5147 1.03342 0.17723
Total 137 2.3869 1.13110 0.09664
In Table 5.8, the above means for each generation are compared to each other
for each factor.
Table 5.8 One-way ANOVA for Generation
Factor Sum of
Squares df
Mean Square
F Sig.
1. Full appreciation of work done
Between Groups 1.093 2 0.546 0.322 0.725
Within Groups 227.046 134 1.694
Total 228.139 136
2. Feeling of being involved
Between Groups 9.515 2 4.757 3.412 0.036*
Within Groups 186.854 134 1.394
Total 196.369 136

Association between employee motivation and
employee demographics in the banking industry
____________________________________________________________________________
___________________________________________
90
Factor Sum of
Squares df
Mean Square
F Sig.
3. Sympathetic help with personal problems
Between Groups 7.676 2 3.838 2.641 0.075
Within Groups 194.758 134 1.453
Total 202.434 136
4. Interesting work
Between Groups 16.843 2 8.421 5.722 0.004*
Within Groups 197.226 134 1.472
Total 214.069 136
5. Opportunity for development
Between Groups 25.671 2 12.836 8.039 0.001*
Within Groups 213.967 134 1.597
Total 239.639 136
6. Loyalty to employees
Between Groups 11.741 2 5.870 3.108 0.048*
Within Groups 253.117 134 1.889
Total 264.858 136
7. Good working conditions
Between Groups 11.629 2 5.814 4.733 0.010*
Within Groups 164.605 134 1.228
Total 176.234 136
8. Tactful disciplining
Between Groups 15.478 2 7.739 4.859 0.009*
Within Groups 213.405 134 1.593
Total 228.883 136
9. Job security
Between Groups 1.467 2 0.734 0.434 0.649
Within Groups 226.770 134 1.692
Total 228.237 136
10. Good wages
Between Groups 0.756 2 0.378 0.292 0.747
Within Groups 173.241 134 1.293
Total 173.996 136
Notes: * Denotes significance level < 0.05
From the results above, at the 5% significance level, H0 cannot be rejected for
four out of the ten motivation factors thereby rejecting the alternate hypothesis
that differences exist in these factors between generations. H0 was rejected
(supporting H1) specifically for factor 2 with a p-value of 0.036, factor 4 with a p-
value of 0.004, factor 5 with a p-value of 0.001, factor 6 with a p-value of 0.048,
factor 7 with a p-value of 0.010 and factor 8 with a p-value of 0.009, all of which
were less than 0.05 indicating different means between the generations.
Table 5.9 below lists selected homogenous subsets of the three generations
which show differences between subsets for the ten motivation factors.

Association between employee motivation and
employee demographics in the banking industry
____________________________________________________________________________
___________________________________________
91
Table 5.9 Homogenous subsets for Generation
Factor Generation N Subset for alpha = 0.05
2 1
4. Interesting work
Generation Y 46 2.8370
Generation X 57 2.9561
Baby Boomers 34 3.7059
Sig. 0.900 1.000
5. Opportunity for development
Generation Y 46 2.1522
Generation X 57 2.7105 2.7105
Baby Boomers 34 3.2941
Sig. 0.123 0.101
6. Loyalty to employees
Generation X 57 2.5877
Generation Y 46 2.9457 2.9457
Baby Boomers 34 3.3235
Sig. 0.479 0.440
7. Good working conditions
Generation X 57 2.7632
Generation Y 46 2.9022 2.9022
Baby Boomers 34 3.4853
Sig. 0.842 0.052
8. Tactful disciplining
Generation Y 46 2.6957
Generation X 57 2.8509
Baby Boomers 34 3.5441
Sig. 0.848 1.000
The table above reveals for factors 4 and 8, a similarity between generation X
and Y but a difference between these two generations and the baby boomers.
On the other hand, generation X does not differ from generation Y and baby
boomers for factor 5, but generation Y and baby boomers have responded
differently for these factors. Lastly, for factors 6 and 7, generation Y did not
differ from the other two generations, but generation X and baby boomers did
differ in opinion. The detailed Scheffe comparisons for the table above can be
found in Appendix C.2: One-way ANOVA for Generation (Scheffe).
5.5.3 Hypothesis 3: Race differences
The original intention of the analysis was to include all four races: blacks,
coloured, indians and whites. However, as per Table 5.1, a relatively smaller

Association between employee motivation and
employee demographics in the banking industry
____________________________________________________________________________
___________________________________________
92
number of responses were received from the black and coloured group
compared to the whites and indians. As such, the analysis includes a recoded
race which combines the responses from the blacks and coloureds into a single
race.
Figure 5.13 below, graphically represents the comparison of means between
the three races: whites, indians and blacks/coloureds. As can be observed,
indians tendered to be in more agreement relative to the other two races across
all ten motivation factors.
1.0
2.0
3.0
4.0
5.0
6.0
1 2 3 4 5 6 7 8 9 10
Motivational factors
Ag
ree�� ��
Dis
ag
ree
Black/Coloured
Indian
White
Figure 5.13 Race comparison of means
The alternate and null hypotheses were as follows:
H1: Differences exist in employee motivation factors between races in the South
African banking industry.
H0: Differences do not exist in employee motivation factors between races in the
South African banking industry.
This hypothesis was tested using the one-way ANOVA to measure the equality
of means of responses per employee motivation factor between the races. An
inequality of means at a 5% significance level for a motivation factor would
reject the null hypothesis, thereby supporting the alternate hypothesis that
differences exist in that specific motivation factor between races in the South
African banking industry.

Association between employee motivation and
employee demographics in the banking industry
____________________________________________________________________________
___________________________________________
93
Table 5.10 below, lists the means for the responses of each race across the ten
motivation factors.
Table 5.10 Selected summary statistics for Race
Factor Race N Mean Std.
Deviation Std. Error
1. Full appreciation of work done
Black/Coloured 27 3.1852 1.70490 0.32811
Indian 61 2.5902 1.16372 0.14900
White 46 2.9239 1.13023 0.16664
Total 134 2.8246 1.29088 0.11152
2. Feeling of being involved
Black/Coloured 27 2.9259 1.39851 0.26914
Indian 61 2.5492 1.03965 0.13311
White 46 3.0978 1.23657 0.18232
Total 134 2.8134 1.20412 0.10402
3. Sympathetic help with personal problems
Black/Coloured 27 3.5556 1.16300 0.22382
Indian 61 3.1475 1.35814 0.17389
White 46 3.8696 0.95123 0.14025
Total 134 3.4776 1.22760 0.10605
4. Interesting work
Black/Coloured 27 3.4074 1.45468 0.27995
Indian 61 2.7213 1.14573 0.14670
White 46 3.4565 1.05844 0.15606
Total 134 3.1119 1.23032 0.10628
5. Opportunity for development
Black/Coloured 27 3.1481 1.75310 0.33738
Indian 61 2.2295 1.06291 0.13609
White 46 2.9783 1.18770 0.17512
Total 134 2.6716 1.32515 0.11448
6. Loyalty to employees
Black/Coloured 27 2.7963 1.35348 0.26048
Indian 61 2.7213 1.42748 0.18277
White 46 3.2065 1.37670 0.20298
Total 134 2.9030 1.40284 0.12119
7. Good working conditions
Black/Coloured 27 3.2222 1.17942 0.22698
Indian 61 2.7623 1.13139 0.14486
White 46 3.2174 1.07317 0.15823
Total 134 3.0112 1.13632 0.09816
8. Tactful disciplining
Black/Coloured 27 3.0370 1.53125 0.29469
Indian 61 2.6639 1.13182 0.14491
White 46 3.3152 1.30537 0.19247
Total 134 2.9627 1.30301 0.11256
9. Job security Black/Coloured 27 3.6111 1.48928 0.28661
Indian 61 3.2541 1.29622 0.16596

Association between employee motivation and
employee demographics in the banking industry
____________________________________________________________________________
___________________________________________
94
Factor Race N Mean Std. Std. Error
White 46 3.8804 1.08620 0.16015
Total 134 3.5410 1.29204 0.11161
10. Good wages
Black/Coloured 27 2.4074 1.24836 0.24025
Indian 61 2.2049 1.12315 0.14381
White 46 2.5870 1.01272 0.14932
Total 134 2.3769 1.11793 0.09657
In Table 5.11, the above means for each race are compared to each other for
each factor.
Table 5.11 One-way ANOVA for Race
Factor Sum of
Squares df
Mean Square
F Sig.
1. Full appreciation of work done
Between Groups 7.317 2 3.658 2.236 0.111
Within Groups 214.312 131 1.636
Total 221.629 133
2. Feeling of being involved
Between Groups 8.322 2 4.161 2.954 0.056
Within Groups 184.514 131 1.409
Total 192.836 133
3. Sympathetic help with personal problems
Between Groups 13.877 2 6.938 4.872 0.009*
Within Groups 186.556 131 1.424
Total 200.433 133
4. Interesting work
Between Groups 17.127 2 8.564 6.090 0.003*
Within Groups 184.194 131 1.406
Total 201.321 133
5. Opportunity for development
Between Groups 22.380 2 11.190 6.942 0.001*
Within Groups 211.173 131 1.612
Total 233.552 133
6. Loyalty to employees
Between Groups 6.559 2 3.279 1.684 0.190
Within Groups 255.180 131 1.948
Total 261.739 133
7. Good working conditions
Between Groups 6.937 2 3.469 2.757 0.067
Within Groups 164.796 131 1.258
Total 171.733 133
8. Tactful disciplining
Between Groups 11.310 2 5.655 3.454 0.035*
Within Groups 214.503 131 1.637
Total 225.813 133
9. Job security Between Groups 10.454 2 5.227 3.236 0.042*
Within Groups 211.571 131 1.615

Association between employee motivation and
employee demographics in the banking industry
____________________________________________________________________________
___________________________________________
95
Factor Sum of
Squares df
Mean Square
F Sig.
Total 222.024 133
10. Good wages
Between Groups 3.859 2 1.930 1.557 0.215
Within Groups 162.359 131 1.239
Total 166.218 133
Notes: * Denotes significance level < 0.05
From the results above, at the 5% significance level, H0 cannot be rejected for
five out of the ten motivation factors thereby rejecting the alternate hypothesis
that differences exist in these factors between races. H0 was rejected
(supporting H1) specifically for factor 3 with a p-value of 0.009, factor 4 with a p-
value of 0.003, factor 5 with a p-value of 0.001, factor 8 with a p-value of 0.035
and factor 9 with a p-value of 0.042, all of which were less than 0.05 indicating
different means between the races.
Table 5.12 below lists selected homogenous subsets of the three races which
show differences between subsets for the ten motivation factors.
Table 5.12 Homogenous subsets for Race
Factor Generation N Subset for alpha = 0.05
2 1
3. Sympathetic help with personal problems
Indian 61 3.1475
Black/Coloured 27 3.5556 3.5556
White 46 3.8696
Sig. 0.315 0.503
4. Interesting work
Indian 61 2.7213
Black/Coloured 27 3.4074
White 46 3.4565
Sig. 1.000 0.983
5. Opportunity for development
Indian 61 2.2295
White 46 2.9783
Black/Coloured 27 3.1481
Sig. 1.000 0.837
As indicated in the table above, the black/coloured race responded similarly to
indians and whites for factor 3, whereas indians and whites differed in their
responses for this factor. For factors 4 and 5 however, indians differed from a
subset of the white and black/coloured groups. The detailed Scheffe
Association between employee motivation and
employee demographics in the banking industry
____________________________________________________________________________
___________________________________________
96
comparisons for the table above can be found in Appendix C.3: One-way
ANOVA for Race (Scheffe).
5.5.4 Hypothesis 4: Organisational level differences
The original intention of the analysis was to include all four organisational
levels: senior, middle, junior and non-management. However, as per Table 5.1,
a relatively smaller number of responses were from the senior and middle
management levels compared to the junior and non-management levels. As
such, the analysis includes a recoded organisational level which combines the
responses from the senior and middle management into a single organisational
level.
Figure 5.14 below, graphically represents the comparison of means between
the three organisational levels: senior/middle, junior and non-management. As
can be observed, senior management tendered to be in more disagreement
relative to the other two organisational levels across all ten motivation factors.
1.0
2.0
3.0
4.0
5.0
6.0
Motivational factors
Ag
ree�� ��
Dis
ag
ree
Senior/Middle
Junior
Non-management
Figure 5.14 Organisational level comparison of means
The alternate and null hypotheses were as follows:
H1: Differences exist in employee motivation factors between organisational
levels in the South African banking industry.

Association between employee motivation and
employee demographics in the banking industry
____________________________________________________________________________
___________________________________________
97
H0: Differences do not exist in employee motivation factors between
organisational levels in the South African banking industry.
This hypothesis was tested using the one-way ANOVA to measure the equality
of means of responses per employee motivation factor between the
organisational levels. An inequality of means at a 5% significance level for a
motivation factor would reject the null hypothesis, thereby supporting the
alternate hypothesis that differences exist in that specific motivation factor
between organisational level in the South African banking industry.
Table 5.13 below, lists the means for the responses of each organisational level
across the ten motivation factors.
Table 5.13 Selected summary statistics for Organisational level
Factor Organisational level N Mean Std.
Deviation Std. Error
1. Full appreciation of work done
Senior/Middle management
44 3.1250 1.18677 0.17891
Junior management 41 2.7317 1.31386 0.20519
Non-management 52 2.6635 1.34937 0.18712
Total 137 2.8321 1.29518 0.11065
2. Feeling of being involved
Senior/Middle management
44 3.0682 1.23227 0.18577
Junior management 41 2.6585 1.15347 0.18014
Non-management 52 2.7404 1.20249 0.16676
Total 137 2.8212 1.20162 0.10266
3. Sympathetic help with personal problems
Senior/Middle management
44 4.0227 1.03965 0.15673
Junior management 41 3.3537 0.99526 0.15543
Non-management 52 3.1154 1.37061 0.19007
Total 137 3.4781 1.22004 0.10423
4. Interesting work
Senior/Middle management
44 3.3750 1.16202 0.17518
Junior management 41 3.0610 1.29998 0.20302
Non-management 52 2.9038 1.27586 0.17693
Total 137 3.1022 1.25461 0.10719
5. Opportunity for development
Senior/Middle management
44 3.1364 1.24529 0.18773
Junior management 41 2.6707 1.35374 0.21142
Non-management 52 2.2692 1.26592 0.17555

Association between employee motivation and
employee demographics in the banking industry
____________________________________________________________________________
___________________________________________
98
Factor Organisational level N Mean Std. Std. Error
Total 137 2.6679 1.32742 0.11341
6. Loyalty to employees
Senior/Middle management
44 3.3182 1.40634 0.21201
Junior management 41 2.6585 1.31548 0.20544
Non-management 52 2.7115 1.39096 0.19289
Total 137 2.8905 1.39552 0.11923
7. Good working conditions
Senior/Middle management
44 3.2500 1.08639 0.16378
Junior management 41 2.8537 1.10252 0.17218
Non-management 52 2.8750 1.19178 0.16527
Total 137 2.9891 1.13835 0.09726
8. Tactful disciplining
Senior/Middle management
44 3.4091 1.21652 0.18340
Junior management 41 2.7805 1.30886 0.20441
Non-management 52 2.7500 1.28529 0.17824
Total 137 2.9708 1.29729 0.11084
9. Job security
Senior/Middle management
44 3.7500 1.18371 0.17845
Junior management 41 3.5000 1.38744 0.21668
Non-management 52 3.4038 1.31372 0.18218
Total 137 3.5438 1.29546 0.11068
10. Good wages
Senior/Middle management
44 2.4886 1.14368 0.17242
Junior management 41 2.5244 1.07791 0.16834
Non-management 52 2.1923 1.15535 0.16022
Total 137 2.3869 1.13110 0.09664
In Table 5.14, these means for each organisational level are compared to each
other for each factor.
Table 5.14 One-way ANOVA for Organisational level
Factor Sum of
Squares df
Mean Square
F Sig.
1. Full appreciation of work done
Between Groups 5.667 2 2.833 1.707 0.185
Within Groups 222.472 134 1.660
Total 228.139 136
2. Feeling of being involved
Between Groups 4.108 2 2.054 1.432 0.243
Within Groups 192.260 134 1.435
Total 196.369 136
3. Sympathetic help with personal problems
Between Groups 20.527 2 10.264 7.561 0.001*
Within Groups 181.907 134 1.358

Association between employee motivation and
employee demographics in the banking industry
____________________________________________________________________________
___________________________________________
99
Factor Sum of
Squares df
Mean Square
F Sig.
Total 202.434 136
4. Interesting work
Between Groups 5.390 2 2.695 1.731 0.181
Within Groups 208.679 134 1.557
Total 214.069 136
5. Opportunity for development
Between Groups 17.921 2 8.961 5.416 0.005*
Within Groups 221.717 134 1.655
Total 239.639 136
6. Loyalty to employees
Between Groups 11.920 2 5.960 3.157 0.046*
Within Groups 252.938 134 1.888
Total 264.858 136
7. Good working conditions
Between Groups 4.424 2 2.212 1.725 0.182
Within Groups 171.809 134 1.282
Total 176.234 136
8. Tactful disciplining
Between Groups 12.472 2 6.236 3.861 0.023*
Within Groups 216.411 134 1.615
Total 228.883 136
9. Job security
Between Groups 2.968 2 1.484 0.883 0.416
Within Groups 225.269 134 1.681
Total 228.237 136
10. Good wages
Between Groups 3.199 2 1.600 1.255 0.288
Within Groups 170.797 134 1.275
Total 173.996 136
Notes: * Denotes significance level < 0.05
From the results above, at the 5% significance level, H0 cannot be rejected for
six out of the ten motivation factors thereby rejecting the alternate hypothesis
that differences exist in these factors between organisational levels. H0 was
rejected (supporting H1) specifically for factor 3 with a p-value of 0.001, factor 5
with a p-value of 0.005, factor 6 with a p-value of 0.046 and factor 8 with a p-
value of 0.023, all of which were less than 0.05 indicating different means
between the organisational levels.
Table 5.15 below lists selected homogenous subsets of the three organisational
levels which show differences between subsets for the ten motivation factors.
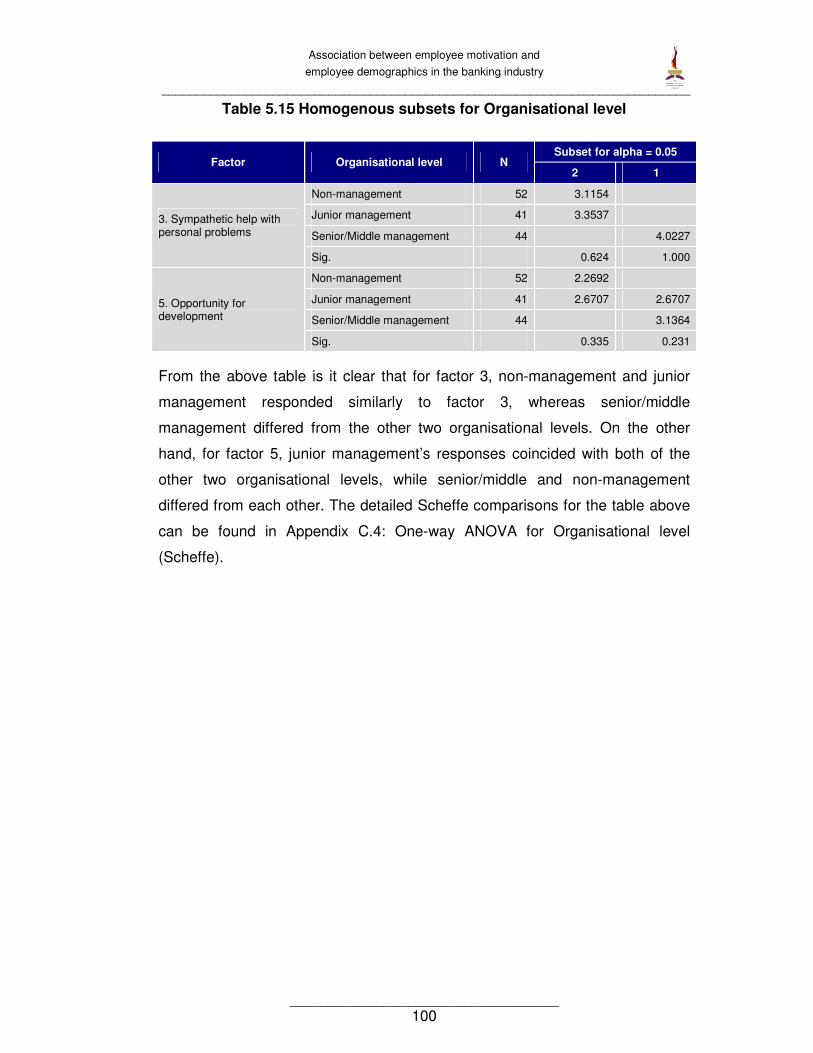
Association between employee motivation and
employee demographics in the banking industry
____________________________________________________________________________
___________________________________________
100
Table 5.15 Homogenous subsets for Organisational level
Factor Organisational level N Subset for alpha = 0.05
2 1
3. Sympathetic help with personal problems
Non-management 52 3.1154
Junior management 41 3.3537
Senior/Middle management 44 4.0227
Sig. 0.624 1.000
5. Opportunity for development
Non-management 52 2.2692
Junior management 41 2.6707 2.6707
Senior/Middle management 44 3.1364
Sig. 0.335 0.231
From the above table is it clear that for factor 3, non-management and junior
management responded similarly to factor 3, whereas senior/middle
management differed from the other two organisational levels. On the other
hand, for factor 5, junior management’s responses coincided with both of the
other two organisational levels, while senior/middle and non-management
differed from each other. The detailed Scheffe comparisons for the table above
can be found in Appendix C.4: One-way ANOVA for Organisational level
(Scheffe).

Association between employee motivation and
employee demographics in the banking industry
____________________________________________________________________________
___________________________________________
101
5.5.5 Hypotheses Summary
The following table provides a summary view, indicating support (�) or rejection
(�), for the four alternate hypotheses tested against each motivation factor in
this section.
Table 5.16 Summary view of hypotheses testing
Motivation factor Gender Generation Race Org. level
1. Full appreciation of work done � � � �
2. Feeling of being involved � � � �
3. Sympathetic help with personal problems � � � �
4. Interesting work � � � �
5. Opportunity for development � � � �
6. Loyalty to employees � � � �
7. Good working conditions � � � �
8. Tactful disciplining � � � �
9. Job security � � � �
10. Good wages � � � �
Where the table above indicates support for the alternate hypothesis, this
implies differences in employee motivation factors between the categories of
the corresponding demographic. As can be observed, there is support for the
existence of differences in at least 50% of the motivation factors between the
demographic categories of generation, race and organisational level, while for
gender, only one factor out of the ten supported the alternate hypothesis.
Table 5.17 below, assumes a weighting of “1” for every mean and calculates
the arithmetic mean for the extrinsic and intrinsic factors. Based on the
questionnaire setup, where higher means indicate lower motivators, a difference
(extrinsic-intrinsic) between these two sets of means were calculated per
demographic category to test the hypothesis that extrinsic factors are
dissatisfaction motivators and intrinsic factors are satisfaction motivators. A
positive difference would support this hypothesis.

Association between employee motivation and
employee demographics in the banking industry
_____________________________________________________________________________________________________________________________
___________________________________________
102
Table 5.17 Intrinsic/Extrinsic comparisons
Motivation factor
Gender Generation Race Organisational level
Female Male Baby
Boomers Generation
X Generation
Y Black/
Coloured Indian White Senior Junior
Non- management
1. Full appreciation of work done 2.7116 2.9915 2.8971 2.8947 2.7065 3.1852 2.5902 2.9239 3.1250 2.7317 2.6635
2. Feeling of being involved 2.7115 2.9661 3.2794 2.6579 2.6848 2.9259 2.5492 3.0978 3.0682 2.6585 2.7404
3. Sympathetic help with personal problems
3.4038 3.5763 3.8529 3.4561 3.2283 3.5556 3.1475 3.8696 4.0227 3.3537 3.1154
4. Interesting work 3.0321 3.1949 3.7059 2.9561 2.8370 3.4074 2.7213 3.4565 3.3750 3.0610 2.9038
5. Opportunity for development 2.4808 2.9153 3.2941 2.7105 2.1522 3.1481 2.2295 2.9783 3.1364 2.6707 2.2692
6. Loyalty to employees 2.7949 3.0169 3.3235 2.5877 2.9457 2.7963 2.7213 3.2065 3.3182 2.6585 2.7115
Intrinsic 2.8558 3.1102 3.3922 2.8772 2.7591 3.1698 2.6598 3.2554 3.3409 2.8557 2.7340
7. Good working conditions 2.8205 3.2119 3.4853 2.7632 2.9022 3.2222 2.7623 3.2174 3.2500 2.8537 2.8750
8. Tactful disciplining 2.9103 3.0508 3.5441 2.8509 2.6957 3.0370 2.6639 3.3152 3.4091 2.7805 2.7500
9. Job security 3.5128 3.5847 3.7206 3.4649 3.5109 3.6111 3.2541 3.8804 3.7500 3.5000 3.4038
10. Good wages 2.2372 2.5847 2.5147 2.3333 2.3587 2.4074 2.2049 2.5870 2.4886 2.5244 2.1923
Extrinsic 2.8702 3.1080 3.3162 2.8531 2.8669 3.0694 2.7213 3.2500 3.2244 2.9147 2.8053
Difference (Extrinsic-Intrinsic) 0.0144 -0.0021 -0.0760 -0.0241 0.1078 -0.1003 0.0615 -0.0054 -0.1165 0.0590 0.0713
The highest positive difference is calculated for generation Y, while the highest negative difference is calculated for senior
management.

Association between employee motivation and
employee demographics in the banking industry
____________________________________________________________________________
___________________________________________
103
5.6 Rank of motivation factors by demographic category
This section will expand on the analysis conducted above by deriving a rank for
the motivation factors by each demographic category based on the calculated
means of the responses.
5.6.1 Gender rank
Table 5.18 below, lists the motivation factors and the corresponding rank for
females and males.
Table 5.18 Rank of motivation factors for Gender
Motivation factor
Gender
Female Male
Mean Rank Mean Rank
1. Full appreciation of work done
2.7116 4 2.9915 4
2. Feeling of being involved 2.7115 3 2.9661 3
3. Sympathetic help with personal problems
3.4038 9 3.5763 9
4. Interesting work 3.0321 8 3.1949 7
5. Opportunity for development
2.4808 2 2.9153 2
6. Loyalty to employees 2.7949 5 3.0169 5
7. Good working conditions 2.8205 6 3.2119 8
8. Tactful disciplining 2.9103 7 3.0508 6
9. Job security 3.5128 10 3.5847 10
10. Good wages 2.2372 1 2.5847 1
Figure 5.15 below, translates the table above into a graphical comparison of
the motivation factors for gender.

Association between employee motivation and
employee demographics in the banking industry
____________________________________________________________________________
___________________________________________
104
1
2
3
4
5
6
7
8
9
10
1 2 3 4 5 6 7 8 9 10
Motivational factors
Ran
kin
g
Female
Male
Figure 5.15 Rank of motivation factors for Gender
While most of the ranks for the motivation factors are aligned between males
and females, differences are observed for factors 4, 7 and 8. The largest
disparity between the genders is for factor 7, which yields similar deductions
made earlier, where factor 7 was highlighted by the two sample t-test for its
inequality of means between the two genders, thereby being the only support
for the alternate hypothesis for a difference in motivation factors between
genders.
5.6.2 Generation rank
Table 5.19 below, lists the motivation factors and the corresponding rank for
baby boomers, generation X and generation Y.
Table 5.19 Rank of motivation factors for Generation
Motivation factor
Generation
Baby Boomers Generation X Generation Y
Mean Rank Mean Rank Mean Rank
1. Full appreciation of work done
2.8971 2 2.8947 7 2.7065 5
2. Feeling of being involved 3.2794 3 2.6579 3 2.6848 3
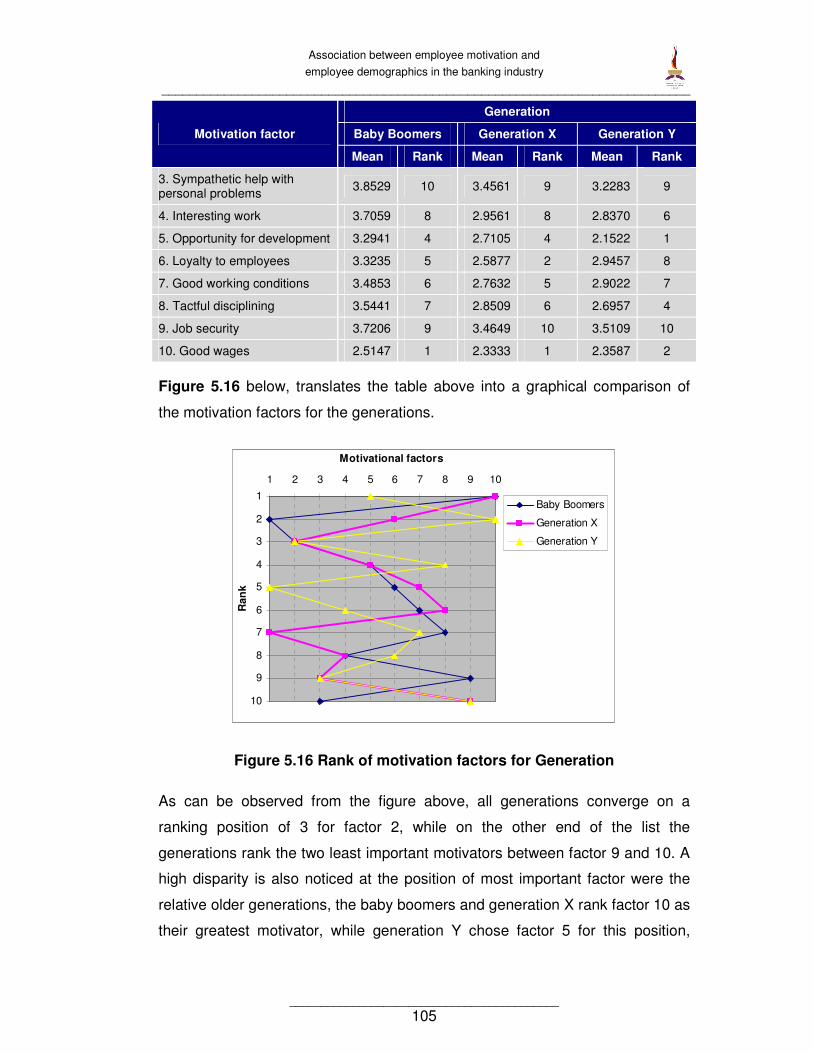
Association between employee motivation and
employee demographics in the banking industry
____________________________________________________________________________
___________________________________________
105
Motivation factor
Generation
Baby Boomers Generation X Generation Y
Mean Rank Mean Rank Mean Rank
3. Sympathetic help with personal problems
3.8529 10 3.4561 9 3.2283 9
4. Interesting work 3.7059 8 2.9561 8 2.8370 6
5. Opportunity for development 3.2941 4 2.7105 4 2.1522 1
6. Loyalty to employees 3.3235 5 2.5877 2 2.9457 8
7. Good working conditions 3.4853 6 2.7632 5 2.9022 7
8. Tactful disciplining 3.5441 7 2.8509 6 2.6957 4
9. Job security 3.7206 9 3.4649 10 3.5109 10
10. Good wages 2.5147 1 2.3333 1 2.3587 2
Figure 5.16 below, translates the table above into a graphical comparison of
the motivation factors for the generations.
1
2
3
4
5
6
7
8
9
10
1 2 3 4 5 6 7 8 9 10
Motivational factors
Ran
k
Baby Boomers
Generation X
Generation Y
Figure 5.16 Rank of motivation factors for Generation
As can be observed from the figure above, all generations converge on a
ranking position of 3 for factor 2, while on the other end of the list the
generations rank the two least important motivators between factor 9 and 10. A
high disparity is also noticed at the position of most important factor were the
relative older generations, the baby boomers and generation X rank factor 10 as
their greatest motivator, while generation Y chose factor 5 for this position,

Association between employee motivation and
employee demographics in the banking industry
____________________________________________________________________________
___________________________________________
106
which is the other two generations ranked as 4th on their list. Factor 10 was
positioned 2nd for generation Y, which still indicates a high importance across all
generations for this factor.
5.6.3 Race rank
Table 5.20 below, lists the motivation factors and the corresponding rank for
blacks/coloureds, whites and indians.
Table 5.20 Rank of motivation factors for Race
Motivation factor
Race
Black/Coloured Indian White
Mean Rank Mean Rank Mean Rank
1. Full appreciation of work done
3.1852 6 2.5902 4 2.9239 2
2. Feeling of being involved 2.9259 3 2.5492 3 3.0978 4
3. Sympathetic help with personal problems
3.5556 9 3.1475 9 3.8696 9
4. Interesting work 3.4074 8 2.7213 6 3.4565 8
5. Opportunity for development 3.1481 5 2.2295 2 2.9783 3
6. Loyalty to employees 2.7963 2 2.7213 6 3.2065 5
7. Good working conditions 3.2222 7 2.7623 8 3.2174 6
8. Tactful disciplining 3.0370 4 2.6639 5 3.3152 7
9. Job security 3.6111 10 3.2541 10 3.8804 10
10. Good wages 2.4074 1 2.2049 1 2.5870 1
Figure 5.17 below, translates the table above into a graphical comparison of
the motivation factors for race.

Association between employee motivation and
employee demographics in the banking industry
____________________________________________________________________________
___________________________________________
107
1
2
3
4
5
6
7
8
9
10
1 2 3 4 5 6 7 8 9 10
Motivational factors
Ran
kin
g
Black/Coloured
Indian
White
Figure 5.17 Rank of motivation factors for Race
All races coincided on their two least motivating factors, that is, factors 9 and
10, while on the opposite end of the list the races also converged on factor 10
for the top of their list of motivators. A high disparity is observed for the rest of
motivators across the races, where 50% of the rank list (positions 1, 5, 6, 7 and
8) are all assigned different motivators for each position by each race.
5.6.4 Organisational level rank
Table 5.21 below, lists the motivation factors and the corresponding rank for
senior/middle, junior and non-management.
Table 5.21 Rank of motivation factors for Organisational level
Motivation factor
Organisational level
Senior/ Middle Junior Non- management
Mean Rank Mean Rank Mean Rank
1. Full appreciation of work done 3.1250 3 2.7317 5 2.6635 3
2. Feeling of being involved 3.0682 2 2.6585 2 2.7404 5
3. Sympathetic help with personal problems 4.0227 10 3.3537 9 3.1154 9
4. Interesting work 3.3750 7 3.0610 8 2.9038 8
5. Opportunity for development 3.1364 4 2.6707 4 2.2692 2

Association between employee motivation and
employee demographics in the banking industry
____________________________________________________________________________
___________________________________________
108
Motivation factor
Organisational level
Senior/ Middle Junior Non- management
Mean Rank Mean Rank Mean Rank
6. Loyalty to employees 3.3182 6 2.6585 3 2.7115 4
7. Good working conditions 3.2500 5 2.8537 7 2.8750 7
8. Tactful disciplining 3.4091 8 2.7805 6 2.7500 6
9. Job security 3.7500 9 3.5000 10 3.4038 10
10. Good wages 2.4886 1 2.5244 1 2.1923 1
Figure 5.18 below, translates the table above into a graphical comparison of
the motivation factors for the organisational levels.
1
2
3
4
5
6
7
8
9
10
1 2 3 4 5 6 7 8 9 10
Motivational factors
Ra
nkin
g
Senior/Middle
Junior
Non-management
Figure 5.18 Rank of motivation factors for Organisational level
As per the previous demographic categories, organisational level also identified
factors 9 and 10 as the two least important motivators. Factor 10, similar to
most demographic categories of other demographics is positioned as the most
important factor. It was also observed that there is convergence of rank for
junior and non-management for six out of the ten motivation factors particularly
among the five least important factors (positions 6 to 10) where both
organisational levels have the same rank for each factor.

Association between employee motivation and
employee demographics in the banking industry
_____________________________________________________________________________________________________________________________
___________________________________________
109
5.6.5 Rank summary
Table 5.22 Summary view of ranking
Motivation factor
Gender Generation Race Organisational level
Female Male Baby
Boomers Generation
X Generation
Y Black/
Coloured Indian White Senior Junior
Non- management
1. Full appreciation of work done 4 4 2 7 5 6 4 2 3 5 3
2. Feeling of being involved 3 3 3 3 3 3 3 4 2 2 5
3. Sympathetic help with personal problems 9 9 10 9 9 9 9 9 10 9 9
4. Interesting work 8 7 8 8 6 8 6 8 7 8 8
5. Opportunity for development 2 2 4 4 1 5 2 3 4 4 2
6. Loyalty to employees 5 5 5 2 8 2 6 5 6 3 4
7. Good working conditions 6 8 6 5 7 7 8 6 5 7 7
8. Tactful disciplining 7 6 7 6 4 4 5 7 8 6 6
9. Job security 10 10 9 10 10 10 10 10 9 10 10
10. Good wages 1 1 1 1 2 1 1 1 1 1 1
The above table combines the rank results for all the demographics across the ten motivation factors and provides a comparison.
The nature of this study isolated the different demographics and did not analyse cross-combinations e.g. black females in
generation Y holding senior management positions. However, the above table allows one to identify the absolute overlaps between
groups across different demographic categories that have ranked a motivation factor in exactly the same position, e.g. all white
female baby boomers ranked “Tactful disciplining” as 7th on their list of motivators.

Association between employee motivation and
employee demographics in the banking industry
____________________________________________________________________________
___________________________________________
110
At the high of end of the rank list, “Good wages” is clearly supported across the
groups as a key motivation factor. One exception to the factor not being ranked
first is for generation Y, which is the only category that ranks “Opportunity for
development” higher. On the other extreme of the rank, positions 9 and 10 are
held between “Sympathetic help with personal problems” and “Job Security”.
Both extremes tie in with earlier data distribution analyses which identified
matching skew properties for these factors, that is, a high positive skew
(towards “agreement) for factor 10 and negative skews (towards disagreement)
for factors 3 and 9.
5.7 Conclusion
This chapter has delivered an insightful analysis into the results of the study
regarding the differences in employee motivation factors between the employee
demographic categories. The least difference was found between genders
compared to the other three demographics of generations, race and
organisational level. The greatest differences were identified with generation
where six of the ten motivation factors exhibiting changes between the
generations. The intrinsic and extrinsic comparison also revealed deviations
from the hypothesis that intrinsic motivators would be greater motivators with
more than half of the demographic categories requiring greater focus on
extrinsic motivators. Gender followed a similar trend to the main hypothesis
testing in the ranks of the motivation factors, where males and females showed
the greatest alignment compared to the other demographic categories. A few
motivation factors dominated the extremes of the rank. “Job Security” and
Sympathetic help with personal problems” alternated between position nine and
ten across all demographic categories with position one being held almost
consistently by “Good wages”. The one exception was with generation Y who
preferred “Opportunity for development” in their position one.
The following chapter engages in a discussion regarding the results delivered in
this chapter and highlights comparisons with theory and previous studies to
draw insights for recommendations to effective leadership.

Association between employee motivation and
employee demographics in the banking industry
____________________________________________________________________________
___________________________________________
111
CHAPTER 6: DISCUSSION, CONCLUSION AND
RECOMMENDATIONS
6.1 Introduction
As stated earlier, Hofstede (1980) defined culture as the ”collective
programming of the mind which distinguishes one group of people from
another”. The study aimed to identify associations between the collective
programmings of categories within specific demographics (gender, age, race,
and organisational level) and the elements of the job that motivates people in
these categories. Chapter 6 combines the research into theory and previous
studies, regarding both culture and motivation, with the results of this specific
study to identify key conclusions and highlight recommendations.
6.2 Discussion
From the results of the study, minimal association was established between
gender and the ten motivational factors, as evidenced by the response means
of only one factor showing difference, that is, by the factor “Good working
conditions”. For this specific factor, males, compared to females, were of the
opinion that this factor was less of a motivator. This difference of opinion was
reiterated in the rank of the motivation factors between the genders, where
males ranked the motivation factor as 8th and females gave this higher priority in
position 6. There were only two other variations in the rank of the motivation
factors between males and females and that was for factor 4, “Interesting work”,
and factor 8, “Tactful discipline”, each of which were one position apart between
the ranks by males and females. The rest of the motivation factors (7 out of the
10) were ranked equally, including the top five motivators, indicative of similar
high motivators between the genders.
“Good working conditions” is categorised among Herzberg’s (1968) extrinsic
(hygienic) factors and within the first layer of Maslow’s hierarchy (Table 2.2),
biological and physiological needs (Ramlall, 2004). According to McGregor

Association between employee motivation and
employee demographics in the banking industry
____________________________________________________________________________
___________________________________________
112
(1960) in Daryanto et al. (undated), managers assuming Theory X, where
direction and control, enforced by a centralised organisation and authority, are
limited to leverage the first and second layer of Maslow’s hierarchy as
motivators. This would imply that a more mechanistic organisational structure
would create a slightly higher degree of motivation among females than males
according to the study, which is more aligned to the characteristics of a
masculine leadership style (Rigg and Sparrow, 1994). While Booysen et al.
(2006) recommend a more androgynous leadership style, this would also allow
leadership the flexibility to assume different management styles (Theory X,
Theory Y, etc.) depending on the employees that are being motivated.
The greatest association with motivational factors was identified with the three
generations where the means of responses for six of the ten motivation factors
were different between the generations. These included “Feeling of being
involved”, “Interesting work”, “Opportunity for development”, “Loyalty to
employees”, “Good working conditions” and “Tactful discipline”. In almost all of
these motivation factors, the homogenous subsets showed baby boomers to be
isolated in their opinion of these motivation factors compared to the other
generations, where they were of the opinion that these factors were low
motivators. This was indicative of two, less granular, groups with baby boomers
in one group and generation X and Y in the other, which is contrary to McNally
(2007) who also identified two groups with generation Y isolated from the rest.
While consistent with the rest of the generations in a high rank for “Good
wages”, Baby boomers also ranked “Full appreciation for work done” and
“Feeling of being involved” in position two and three. These factors relate to the
third layer of Maslow’s hierarchy “Affiliation, love and social needs” in Figure
2.6, which is contradictory to Yu et al. (2005) who commented that baby
boomers are respectful to the chain of command, which is more in line with a
Theory X management style. However, the two factors mentioned above, in
rank position two and three, are appealed to by a Theory Y management style
that typically appeals to the third layer of Maslow’s hierarchy as depicted in
Table 2.2. Further, baby boomers ranked “Job Security” as ninth which also
argues against McNally (2007) and Yu et al. (2005) that baby boomers are risk
Association between employee motivation and
employee demographics in the banking industry
____________________________________________________________________________
___________________________________________
113
averse. Overall, however baby boomers considered extrinsic factors, which are
fundamentally appealed to by Theory X, as evidenced by Schein (1980) in
Table 2.2, as lower motivators than intrinsic motivators.
Of the three generations, generation X had the most balanced receipt to
extrinsic and intrinsic factors, which supports Yu et al. (2005) in the proposition
that generation X prefers to squeeze the process and demand self-achievement
from their job and basic needs at the same time. This deduction also assumes
Alderfer’s (1972) ERG Theory referred to in Booysen (2007a), which positions
needs on the platform of a continuum as opposed to an “incremental” hierarchy.
A contradiction to Better Business Communication (2007) was found where it
was proposed that loyalty is not important to this generation but the results
reveal a rank of “Loyalty to employees” as number two.
Generation Y on the other hand, while showing high similarity to rankings at the
extremes of the list, revealed a distinct contrast in one particular factor,
“Opportunity for development”, by positioning this factor as its highest motivator.
This was indicative of an ambitious generation that values a challenging
environment and see greater responsibility as a highly attractive option for
reward. The job-hopping fear of many generation Y employers was also
supported by the lowest ranking of “Loyalty to employees” across the
generations by generation Y – based on the assumption that they expect a
similar degree of loyalty to which they are willing to commit. They also showed
the highest alignment with Herzberg’s (1968) categorization of motivation
factors in Wong et al. (1999) which expects intrinsic factors to be higher
motivators being on the satisfaction continuum as opposed to extrinsic factors
which can only leverage the dissatisfaction continuum for employees.
Across all generations, the study supported the notion that the era within which
an employee was raised and events of the time, be it apartheid, the release of
Nelson Mandela or the “9/11” attacks, are all significant in the character makeup
of the employees in the workplace today.
Race was the second highest demographic in terms of the degree of
association with the motivators with 50% of the motivators recording different

Association between employee motivation and
employee demographics in the banking industry
____________________________________________________________________________
___________________________________________
114
means between the races. These included “Feeling of being involved”,
“Interesting work”, “Opportunity for development”, “Tactful discipline” and “Job
Security”. While all homogenous subsets depicted some isolation of Indians and
the other two races, a consistent difference was found between the perceptions
of Indians and Whites regarding these factors, where Indians were consistently
of the opinion that these were greater motivators.
Nonetheless, on their individual ranking, Whites ranked “Opportunity for
development” very high in position three, which is indicative of Booysen’s
(2007b) comment that the lack of these opportunities, due to BEE legislation, in
the workplace has lead to a high degree of demotivation and anxiety for whites
in the workplace. A related concern perhaps emanates from equity theory,
which acknowledges the behaviour of individuals to compare the absolute
amount of the rewards with their efforts and that received by others, specifically
in terms of this study, the comparison that whites make with their black
counterparts. Blacks, on the other hand, ranked “Loyalty to employees” as their
second most important motivator, which by definition implies a need for open
and honest communication across the organisation. This “affiliation” related
motivator contradicts previous studies that highlighted the fear of losing black
employees claiming that they now use BEE legislations as leverage to find
higher paying jobs. This Ubuntu infused behaviour by Blacks is consistent with
comments made by Khoza (2007) who went further to express that “rabid
individualism is abhorred” by the values consistent with such behaviour.
“Loyalty to employees” was ranked sixth and fifth by Indians and Whites
respectively.
Among all three races, Indians were the only group to show an inclination
towards intrinsic factors, while Blacks and Whites both rated extrinsic factors
more positively, to the extent that Blacks/Coloureds recorded the second
highest negative (extrinsic/intrinsic) difference between the means of the two
sets of factors (Table 5.17).
With only four of the ten motivation factors showing any change between the
different organisational levels, this demographic was found to have the second

Association between employee motivation and
employee demographics in the banking industry
____________________________________________________________________________
___________________________________________
115
least association with the motivation factors. Organisational level is an
interesting dimension in that it implicitly highlights changes in the motivation
levers during the career progression of an employee through the management
ranks of an organisation. The specific motivation factors which did show some
association included “Sympathetic help with personal problems”, Opportunity for
development”, “Loyalty to employees” and “Tactful discipline”. The homogenous
subsets showed that senior management were less convinced of these as
motivation factors than the other two organisational levels. This indicated that
these motivational factors were perhaps an expectation on employee
psychological contracts with their managers but not necessarily expectations at
a senior management level. Support for this deduction was also found in
relation to non-managers who ranked “Opportunity for development” as second
on their list of motivation factors.
Senior managers however, were calculated as having the highest negative
difference across all demographic categories between extrinsic and intrinsic
motivation factors which reveals a general dissatisfaction among senior
managers (Herzberg, 1968). According to Maslow (1943), referenced in Ramlall
(2004), motivation factors relevant to the first three layers need to be resolved
before any satisfaction related (intrinsic) motivation factors can be addressed.
The other two organisational levels both showed high positives for the mean
differences between extrinsic and intrinsic factors.
The largest difference in the motivation factor rank was for the factor “Feeling of
being involved”, for which non-management ranked this factor as fifth and junior
management and senior management positioned it as second. This maybe due
to managers at all levels (senior, middle and junior) acknowledging the greater
need to be involved in the organisation to understand how to achieve its growth.
This aligns suitably with the “Japanese management” style or Theory Z (Ouchi,
1981) in Braden (2000) that assumes an employee’s attitude to work includes
craving opportunities to advance and learn more about the organisation.
The extrinsic and intrinsic comparison on a whole brought to the fore an
interesting argument in consideration of Herzberg’s (1968) description of these

Association between employee motivation and
employee demographics in the banking industry
____________________________________________________________________________
___________________________________________
116
categories. According to Herzberg (1968), these extrinsic factors contribute only
to different degrees dissatisfaction, while intrinsic are used to ensure
satisfaction. If one analyses the differences calculated for each demographic
category (Table 5.17), it is clear that the greater tendency for employees was
towards extrinsic factors, that is, factors which are addressed by focusing on the
first two layers of Maslow’s (1943) hierarchy (Figure 2.6), specifically, biological
and physiological and safety needs. This was perhaps indicative of a currently
greater dissatisfaction than satisfaction among many of the South African
banking employees. On the other hand, the results also revealed that some
employees were not dissatisfied (extrinsic), but rather required greater
satisfaction in their working environments (intrinsic).
The rank of the motivation factors across the demographic groups reveals a few
insightful observations, some of which have already been alluded to. At the
extremes of the ranks, the different demographic categories, to a high degree,
positioned specific factors similarly. Position nine and ten, implying the least
strength as motivators, was held by either “Job Security” or “Sympathetic help
with problems”. At the other end of the continuum, the greatest motivator was,
with the exception of generation Y, “Good Wages”. Rank position two was
inconsistent across the demographic groups, but if one goes a step further, rank
three was held predominantly by “Feeling of being involved”. This related again
to the Theory Y appeal to Maslow’s hierarchy level of “Affiliation, love and social
needs”. Whereas earlier the discussion was only with regards to Blacks, this
commonality across demographic categories hints at a more widely accepted
collectivism among the greater South African population and perhaps an
embracing of the spirit of Ubuntu. The variation of motivation factors between
the extremes of the ranks however, revealed an importance of all motivation
factors depending on the mix of demographic categories begin addressed.
The study succinctly revealed the complexity in motivating employees of
different demographic categories. A thorough understanding of the political,
economic, legislative and historical landscape of a country and the resulting
influences on its people can contribute significantly to leadership effectiveness

Association between employee motivation and
employee demographics in the banking industry
____________________________________________________________________________
___________________________________________
117
in an environment. The following section extracts learnings from the study and
presents recommendations for effective leadership.
6.3 Recommendations
The following recommendations can be used as input into an organisation’s
retention strategies, specifically within career development and rewards and
appraisal systems.
• Train organisational leaders to be sensitive to employee behavioural
changes in each demographic category (gender, generation, race and
organisational) influenced by the South African environmental
(political, social, economic, etc.) landscape.
The different races in South Africa are influenced in different ways by the
oppression of the country’s history, the gap between female and male
perceptions in the workplace is closing and the different generations grew up
through different experiences around them. These sensitivities should be
inculcated in organisational leadership training and “flexibility” should be
added to the list of critical success factors for leadership effectiveness in a
diverse workplace.
• Customize career development plans depending on the organisational
level of the employees being addressed.
An employee’s current position in his/her career plays an important role in
how that employee is motivated particularly in the need for development
opportunities, being involved, loyalty, job security, interesting work and full
appreciation for work done. A study similar to this one within an organisation
would super-impose the pattern of these motivators on that organisational
structure thereby revealing an organisation-specific motivation map.
• Encourage a culture that avoids stereotyping, appreciates
generalisations, but ultimately respects the individual.

Association between employee motivation and
employee demographics in the banking industry
____________________________________________________________________________
___________________________________________
118
Employees should be encouraged to not use studies such as these as
sources for accurate generalisations of their colleagues. The results from
research are guidelines for explanation of selected commonalities among
behaviours within a demographic category. Ultimately each employee
should be respected for individual thought and action. Among other
contradictions to generalisations, this study showed Baby Boomers as being
less risk averse than commonly believed and that females are increasingly
assuming attributes of masculinity.
• Focus employee motivation activities to first resolve those factors that
affect dissatisfaction, and then address those that improve employee
satisfaction.
Some motivation factors only reduce dissatisfaction (extrinsic), but do not
necessarily create employee satisfaction (intrinsic).
• Exhibit creativity in employee motivation and incorporate these
initiatives in the value proposition of employment for current and
future employees.
The study showed good wages (extrinsic) continues to be one of the highest
motivators among employees. In reality, employers can and should only use
this as leverage for motivation to a certain degree. Leadership in an
organisation should be creative to explore the value of all motivation factors.
Increasing use of financial reward as a motivator will eventually only realise
diminishing returns on employee motivation.
• Leverage organisational learning as a tool for encouraging
multidimensional learning as a core competence.
South African organisations need to find the “sweet spot” in managing
diversity by integrating an appreciation for the nation’s differences and the
respect for uniqueness in business transactions for a competitive
advantage. Collective processes should take place within organisations in
such a way that social units learn and develop this core competence –
individuals need to learn if social aggregates are to learn.

Association between employee motivation and
employee demographics in the banking industry
____________________________________________________________________________
___________________________________________
119
• Employ effective communication to foster greater trust between the
organisation’s leadership and employees and among employees
themselves.
Intercultural communication will eliminate communication barriers, such as
insufficient exchange of information, semantic difficulties, different
perceptions among senders and receivers, etc.
• Use a common vision to focus efforts and realise synergies in
diversity.
The study identified a need for being involved in an organisation’s activities
as a motivator for employees in the banking industry. The ability of
employees to identify a link between their (relatively granular) activities and
the organisation’s strategy and vision should not be under-estimated as a
high employee motivator to exercise cross-cultural synergies to achieve that
vision.
• National cultural values, such as Ubuntu, are applicable to all citizens
and must be incorporated into South African leadership styles.
Behind many of the motivators that ranked highly in the study was the
concept of Ubuntu. Umuntu ngumuntu ngabantu – I am because you are,
you are because we are – are powerful foundations for values that bind a
nation towards the betterment of all and entrench a mindset in future
generations. Such similarities hold high value in fostering cohesion and
focus across different demographic backgrounds.
• Regularly conduct organisational-specific motivation studies, similar
to this one, to continuously update retention strategies.
The motivators for the different races would have been different during
apartheid, in 1994 with the welcome of democracy and today when the
ruling party in South Africa has split between its experienced past and
youthful future leadership camps. As such, motivation studies need constant

Association between employee motivation and
employee demographics in the banking industry
____________________________________________________________________________
___________________________________________
120
re-assessment to realign understanding of what motivates employees and
therefore what is required for effective leadership.
6.4 Recommendations for future research
The following future research needs would supplement the conclusions from
this study:
• Extend this study to identify the strength of the associations between
different demographics and motivation factors to confirm the assumption of
a constant weighting on each association between a demographic and a
motivation factor.
• Conduct a quantitative analysis that combines different demographic
categories and identifies associations between the cross-demographic
groups and motivation factors
• Conduct a qualitative study in a South African context to identify themes in
motivation factors that confirms the validity of the motivation factors used in
this study.
• Expand this study to compare the perceptions of leaders to the effect of
these motivation factors on their employees, similar to Kovach’s (1987,
1995) study on industrial employees.
• Conduct a quantitative study to find the links between motivation factors and
productivity in a specific industry or a comparison study over multiple
industries. Confirm whether high employee satisfaction equates to high
productivity in all industries.
• Conduct a quantitative study to include other demographics, such as tenure,
current monthly income, highest education level and marital status.
• Conduct a quantitative study across departments in an organisation or
across organisations in an industry to identify associations between
motivation factors and financial performance.
Association between employee motivation and
employee demographics in the banking industry
____________________________________________________________________________
___________________________________________
121
• Conduct a qualitative assessment of the human resource systems in an
organisation, such as career development, rewards and performance
appraisal, and test the weightings assigned to the motivation factors by
these systems with employees’ perceptions of the motivation factors.
6.5 Conclusion
As per the objective of the study, various associations have been identified in
motivation factors between the demographic categories. The complexity of the
topic and the fact that the human psyche is at the heart of its validity, prevents
one colour being painted over the story to reveal a single simple truth.
Among the key conclusions in the discussion were the convergence between
males and females on a merge of leadership characteristics typically
categorised neatly between masculinity and femininity. Generation has proven
to be a greater contributor to differences in motivation compared to race and
organisational level. This by no means discounts race and organisational level
as socio-political and socio-economic influences of our current South Africa has
shown differences in these demographic categories. Whites, who may
experience a degree of anxiety in the current job market, look to opportunities
for development to safeguard their roles in organisations, whiles blacks, due to
the employment transformation being achieved through BEE, are motivated by
better wages.
During his statement at the African Renaissance Conference in Johannesburg
on September 28th, 1998, President Thabo Mbeki made the following comment:
“The new African world which the African Renaissance seeks to build is one of
democracy, peace and stability, sustainable development and a better life for
the people, non-racism and non-sexism, equality among the nations and a just
and democratic system of international governance. None of this will come
about of its own. In as much as we liberated ourselves from colonialism through
struggle, so will it be that the African Renaissance will be victorious only as a
result of a protracted struggle that we ourselves must wage.”

Association between employee motivation and
employee demographics in the banking industry
____________________________________________________________________________
___________________________________________
122
(Mbeki,1998:7)
A recurring theme during that statement was “Yesterday is a foreign country –
tomorrow belongs to us!”
As we move through the grind of transformation and progress from the shadows
of the past, we should indeed acknowledge the peculiarities of our nation and
address them as such. While we draw knowledge from our peers across the
seas to provide hints to optimal play in the global business arena, we should
never lose sight of whom and what we are: “Africans!”
While we have clear differences that we need to respect and exploit as a
competitive advantage in our organisations, we also have similarities that we
should embrace and leverage as the glue that binds our nation’s people.
Studies, similar to this, are motivated by the cry for a better understanding of
local behaviours to establish the best balance in local leadership for SA’s
successful global business engagement.

Association between employee motivation and
employee demographics in the banking industry
____________________________________________________________________________
___________________________________________
123
REFERENCES
ABSA, 2005a. Workshop handout on ‘Managing Complexity and Valuing
Diversity’. Ver. 1.0. Unpublished.
ABSA, 2005b. Workshop handout on ‘Enabling Employment Equity through
Managing and Valuing Diversity’. Ver. 1.0. Unpublished.
Accel, 2006. Chris Argyris’ Maturity Theory [online]. Available from:
http://www.accel-team.com/human_relations/hrels_06ii_argyris.html. [Accessed
1 September 2008].
Basset-Jones, N., Lloyd, G.C. 2005. ‘Does Herzberg’s motivation theory have
staying power?’, Journal of Management Development, 24(10):929-943.
Beaty, D.T., Harari, O. 1987. ‘South Africa: white managers, black voices’,
Harvard Business Review, July August 1987:98-105.
Better Business Communication. 2007. Web Site. Generation X – The Young
and The Restless [online]. Available from:
http://www.powerfulperceptions.co.za/article.php?aid=6. [Accessed 20 January
2008].
Boddy-Evans, A. 2007. African history [online]. Available from:
http://africanhistory.about.com. [Access 31 July 2008].
Booysen, L. 1999. ’Male and female managers: gender influences on South
African managers in retail banking’, South African Journal of Labour Relations,
23(2):25-49.
Booysen, L. 2001. ‘The Duality in South African Leadership: Afrocentric or
Eurocentric, South African Journal of Labour Relations, Spring/Summer: 36-63.
Booysen, L., Nkomo, S. 2006. ‘Think Manager, Think (Fe)Male’, International
Journal of Interdisciplinary Social Sciences, 1(2):23-33.

Association between employee motivation and
employee demographics in the banking industry
____________________________________________________________________________
___________________________________________
124
Booysen, L. 2007a. ‘Societal Power Shifts And Changing Social Identities In
South Africa: Workplace Implications’, SAJEMS NS, 10(1):1-20.
Booysen, L. 2007b. ‘Social Identity Changes: Challenges Facing Leadership’. In
April K. and Shockley, M. 1st ed. Diversity in Africa – The Coming of Age of a
Continent. New York: Palgrave Macmillan. 127-156.
Booysen, L. 2007c. ‘Managing Cultural Diversity: A South African Perspective’.
In April K. and Shockley, M. 1st ed. Diversity in Africa – The Coming of Age of a
Continent. New York: Palgrave Macmillan. 51-92..
Braden, P.A. 2000. ‘Participative Management Styles: Theory Z – William
Ouchi’, Lecture handout. Parkersburg West Virginia University.
Chapman, A. 2004. Maslow’s Hierarchy of Needs [online]. Leicester, England:
Businessballs. Available from: www.businessballs.com. [Accessed 16 March
2008]
Commission for Employment Equity. 2007. Annual Report 2006-2007. Pretoria,
South Africa: Department of Labour.
Cooper, D.R. and Emory, C.W. 1995. Business Research Methods. 5th ed.
USA: Richard D Irwin Incorporated.
Daryanto, H.K.S. and Daryanto, A. undated. ‘Motivation Theories and
Organisation Design’, Bogor Agricultural University.
Department of Trade and Industry. 2008. Web Site. South Africa’s Economic
Tranformation: A Strategy for Broad-Based Black Economic Employment
[online]. Available from: www.dti.gov.za/bee/complete.pdf. [Accessed 21 May
2008]
Diamantopoulos, A and Schlegelmilch, B.B. 2000. Taking the Fear out of Data
Analysis. London: Thomson Learning.
Erasmus, B. 1998. ‘Women power: aspects of working life in the late 1990s’,
Management Today, June: 25-8.

Association between employee motivation and
employee demographics in the banking industry
____________________________________________________________________________
___________________________________________
125
Financial Sector Charter Council. 2008. Web Site. Financial Sector Charter and
Scorecard [online]. Available from:
www.powerfulperceptions.co.za/article.php?aid=6. [Accessed 10 January 2008]
Grant-Marshall, S. 2008. ‘Oops! Your gap is showing’, The Sunday Independent
Life, 27 January:1-4.
Herzberg, F., Bernard, M. and Narnara, S. 1968, The Motivation to Work, 2nd
ed. New York: John Wiley & Sons Inc.
Herzberg, F. 1966. Work and the Nature of Man. Cleveland: World Publishing.
Hofstee, E. 2006. Constructing a Good Dissertation: A Practical Guide to
Finishing a Master’s, MBA or PhD on Schedule. Johannesburg, South Africa:
EPE.
Human, L. 1996. ‘Managing workforce diversity: a critique and example from
South Africa’, International Journal of Manpower, 17(4/5): 46-64.
Javidan, M., Dorfman, P.W., Sully de Luque, M. and House, R.J. 2006. ‘In the
Eye of the Beholder: Cross Cultural Lessons in Leadership from Project
GLOBE’, Academy of Management Perspectives, 20(1): 67-90.
Kavanaugh, J., Duffy, J.A. and Lilly, J. 2006. ‘The relationship between job
satisfaction and demographic variables for healthcare professionals’,
Management Research News, 29(6): 304-325.
Khoza, R. 2007. ‘Values dominate the African leadership paradigm’,
Management Today, July: 24-27.
Kovach, K.A. 1987. ‘What motivates employees? Workers and supervisors give
different answers’, Business Horizons, 30(5): 58-65.
Kovach, K.A. 1995. ‘Employee Motivation: Addressing a Crucial Factor in your
Organisation’s Performance’, Employment Relations Today, 22(2):93-107.
Leedy, P.D. and Ormrod, J.E. 2005. Practical Research: Planning and Design.
New Jersey: Pearson Education Inc.

Association between employee motivation and
employee demographics in the banking industry
____________________________________________________________________________
___________________________________________
126
Leonard, R. circa 1980. Computers in South Africa: A Survey of U.S.
Companies. Science and Social Control.
Licht, A.M., Goldschmidt, C., Schwartz, H.C. 2007. ‘Culture rules: The
foundations of the rule of law and other forms of governance’. Journal of
Comparative Economics, 35:659-688.
Manolopoulos, D. 2007. ‘An evaluation of employee motivation in the extended
public sector in Greece’, Employee Relations, 30(1):63-85.
Mol, M. 2004. Stand in the Gap [online]. Available from:
http://www.michaelmol.co.za/articles/art_inthe_gap.html. [Accessed 20 August
2008]
Munene, J.C., Schwartz, S.H., Smith, P.B. 2000. ‘Development in Sub-Saharan
Africa: Cultural Influences and Managers’ Decision Behaviour’, Public
Administration and Development, 20:339-351.
Mbeki, T. 1998. ‘Statement by President Thabo Mbeki at the African
Renaissance Conference’ held on 28 September 1998 in Johannesburg.
McNally, P. 2007. ‘The Wisdom of Ages’. Men’s Health, 115: 99-102.
Newton, J. 2008. ’Finger on the female pulse’. Business Day Management
Review. February: 14.
Nkomo, S.M. and Littrell, R.F. 2005. ‘Gender and race differences in leader
behaviour preferences in South Africa’, Women in Management Review, 20(8):
562-580.
Osteraker, M.C. 1999. ‘Measuring motivation in a dynamic organisation-a
contingency approach’, Strategic Change, 8:103-109.
Ramlall, S. 2004. ‘A Review of Employee Motivation Theories and their
Implications for Employee Retention with Organisations’, The Journal of
American Academy of Business, September 2004.

Association between employee motivation and
employee demographics in the banking industry
____________________________________________________________________________
___________________________________________
127
Rigg, C. and Sparrow, J. 1994. ‘Gender, Diversity and Working Styles’, Women
in Management Review, 9(1): 9-16.
Schein, E.H. 1990. ‘Organisational Culture’, American Psychologist, 45(2): 109-
119.
Statistics South Africa. 2007. Web Site. Labour Force Survey - March 2007
[online]. Available from:
www.statssa.gov.za/publications/statsdownload.asp?PPN=P0210&SCH=4006.
[Accessed 1 February 2008]
Swinton L. Undated. Adams’ equity motivation theory; Put workplace
psychology into Action and Increase Motivation [online]. Available from:
http://www.mftrou.com/adams-equity-motivation-theory.html. [Accessed 25 April
2008]
SAS Institute. 1999. SAS Procedures Guide [online]. Available from:
http://www.tau.ac.il/cc/pages/docs/sas8/proc/zompmeth.htm. [Accessed 1
September 2008]
Thomas, A., Bendixen, M. 2000. ‘The Management Implications of Ethnicity in
South Africa’, Journal of International Business Studies. 31(3): 507-519.
Triandis, H.C., Suh, E.M. 2002. ‘Cultural Influences on Personality’, Annual
Reviews Psychology, 53:133-160.
Triandis, H.C. 2004. ‘The many dimensions of culture’, Academy of
Management Executive, 18(1): 88-93.
Trompenaars, F. 1993. Riding the Waves of Culture. 1st ed. London: The
Economist Books.
Wikipedia. 2008. Theory Z [online]. Available from:
http://en.wikipedia.org/wiki/Theory_Z. [Accessed 15 August 2008].

Association between employee motivation and
employee demographics in the banking industry
____________________________________________________________________________
___________________________________________
128
Wong, S., Sui, V., Tsang, N. 1999. ‘The impact of demographic factors on Hong
Kong hotel employees' choice of job-related motivators’, International Journal of
Contemporary Hospitality, 11(5): 230-241.
World Economic Forum. 2008. Web site. Global Competitiveness Report
2007/2008 [online]. Available from:
www.weforum.org/en/initiatives/gcp/index.htm. [Accessed 10 February 2008]
Wysocki, A.F., Kepner, W.K. 2000. Management Beliefs that tend to reduce
Associate Motivation and Productivity [online]. Available from:
http://edis.ifas.ufl.edu/pdffiles/HR/HR00300.pdf. [Accessed 25 April 2008]
Yu, H., Miller, M. 2004. ‘Leadership style – The X Generation and Baby
Boomers compared in a different cultural context’, Leadership and Organisation
Development Journal, 26(1):35-50.
Yukl, G. 2006. Leadership in Organisations. 6th ed. New Jersey: Pearson
Prentice Hall.

Association between employee motivation and
employee demographics in the banking industry
____________________________________________________________________________
___________________________________________
129
APPENDICES
Appendix A: Survey Instrument
Appendix A.1: Employee motivation survey
The objective of the following survey is to gather data for statistical analysis of
the association between employee motivation factors and employee
demographics (age, gender, race and organisational level). Your input is
confidential and will be used for research purposes only. The individual
responses need to be consolidated before any statistical inferences can be
made. Therefore, the results will only be presented in a summarized form as
part of the final report. Thank you for the time afforded in completing this
survey.
Instructions:
• The survey is divided into three sections.
• Section 1 requests demographic data of the respondent.
• Section 2 consists of a table which requires the respondent to rate each
statement on a four point scale ranging from “Strongly agree” to “Strongly
disagree” by marking the relevant block for that question with an “X”.
• If the survey is being completed electronically, the respondent may double
click on the box to be marked and select the “Checked” radio button to place
an “X” in the box.
• Section 3 is optional and requests contact information if an executive
summary of the results should be forwarded to the respondent.
• Once complete, please forward the survey to [email protected] or
fax to 0866527026 before 1st August 2008.

Association between employee motivation and
employee demographics in the banking industry
____________________________________________________________________________
___________________________________________
130
_______________________________________________________________
Section 1: Demographic Details
Please select one option only for the following questions:
1. Indicate your age in years?
2. Indicate your gender?
Gender Mark with
“X”
Female
Male
3. Indicate your race group?
If other, please specify:__________________
4. Indicate your organisational level?
Organisational
Level
Mark with “X”
Senior management
Middle management
Junior management
Non-management
Race Mark with
“X”
Black
Coloured
Indian
White

Association between employee motivation and
employee demographics in the banking industry
____________________________________________________________________________
___________________________________________
131
_______________________________________________________________
Section 2: Rating of statements
Please rate each of the following statements with an “X” in the appropriate
column. Each statement begins with “I require…”:
# Statement
Rating
Agree
strongly Agree
Agree
somewhat
Disagree somewhat
Disagree Disagree strongly
1 …a greater work-life balance in my job
2 …more creativity and meaning in my work
3 …greater stability of employment at my company
4
…more explicit performance criteria against which, I am rewarded accordingly
5
…a higher remuneration in relation to my work commitment, position, experience and education
6
…greater involvement in decisions that will directly affect me
7
…more development opportunities that are aligned to my needs and aspirations
8
…management to be more approachable to discuss my personal problems
9 …a more market related salary

Association between employee motivation and
employee demographics in the banking industry
____________________________________________________________________________
___________________________________________
132
# Statement
Rating
Agree
strongly Agree
Agree
somewhat
Disagree somewhat
Disagree Disagree strongly
10
…greater recognition and appreciation in the workplace
11 …management to be more open and trustworthy
12 …greater job security in my organisation
13
…management to make more time to meet and listen to me
14
…management to be more trustworthy to look after my best interests
15
…management to share more accurate information about the organisation with me on a regular basis
16
…my workplace to be more friendly and have a greater sense of unity
17
…more opportunities to succeed in my working environment
18
…management to provide me with more timely and specific feedback on my accomplishments
19
…additional responsibility and stimulation in my work
Association between employee motivation and
employee demographics in the banking industry
____________________________________________________________________________
___________________________________________
133
# Statement
Rating
Agree
strongly Agree
Agree
somewhat
Disagree somewhat
Disagree Disagree strongly
20
…management to be more constructive and tactful when dealing with poor performance
_______________________________________________________________
Section 3: Contact details (optional)
Please provide the following information if you wish to receive an executive
summary of the research results:
First name : _____________________________________
Surname : _____________________________________
Email address : _____________________________________
_______________________________________________________________
THANK YOU FOR YOUR ASSISTANCE IN THIS SURVEY

Association between employee motivation and
employee demographics in the banking industry
____________________________________________________________________________
___________________________________________
134
Appendix B: Communique
Appendix B.1: Letter from SBL confirming researcher as bona fide
student
Ref: Mrs Elsabe Broodryk
Tel: + 27 11 6520352
e-mail: [email protected]
Web: www.sblunisa.ac.za
2008-05-23
TO WHOM IT MAY CONCERN
This letter serves to confirm that Mr M Perumal, student number 70991081, a
registered final year student at the Graduate School of Business Leadership is
for 2008. The student will be doing the Research Report (MBLREP-P) in 2008
as part of the requirements to obtain the MBL postgraduate degree.
The MBL provides highly professional management development at
postgraduate level - with particular emphasis on the theory as well as the
practice of management in the education process. It also strives to offer
practical learning experience and an opportunity for the development of
leadership qualities

Association between employee motivation and
employee demographics in the banking industry
____________________________________________________________________________
___________________________________________
135
The Business School will observe any confidentiality requirements regarding
information made available to the student in assisting with this study. The
content of research reports may not be used by the author or any other person
without the permission of the SBL. The student must give this agreement as
well to the confidentiality requirement.
On behalf of the Business School and Mr Perumal we thank you for
participating in this research project.
Yours sincerely
PROF AE BOOYSEN
MANAGER: RESEARCH
+27 11 6520253
0824515003
Appendix B.2: Email to pilot sample
Hello
In completion of my MBL degree at the UNISA SBL, I am required to conduct a
research study. As part of the research methodology, a pilot run is necessary to
highlight any improvements in the survey prior to its "live" run that will be used
to draw statistics. In this regard, please find attached an employee motivation
survey. I know that you are busy with your own work commitments, but I would
appreciate it if you could spend 10 minutes to complete and return the survey
by 17:00 on 2008/07/18 using both the contact details (email and fax) included
in the survey.

Association between employee motivation and
employee demographics in the banking industry
____________________________________________________________________________
___________________________________________
136
Thanks and regards,
Marvin
Appendix B.3: Initial email to non-banking employees
Hi
I require your assistance, please. In completion of my Masters degree, I am
required to conduct a research study. In this regard, a banking industry specific
employee motivation survey and a confidentiality letter from the university, is
attached.
Please forward the survey to at least 4 colleagues who are employees at one of
the South African banks with the request to complete (which requires only 5
minutes) and return the survey by 17:00 on 2008/08/08 using either of the
contact details (fax or email) provided in the questionnaire. Kindly request that
they too forward the survey onto at least 4 of their colleagues and so on,
thereby creating a "snowball" effect. It is important that all email forwards of the
survey copy in ("Cc:") [email protected]. This is required to
calculate the response rate in the results of the survey.
I know that you are busy with your own work commitments, but it would be
appreciated if you would please assist with the request above. The survey
requires a minimum response of 400 banking employees to deliver
representative results.
Thanks and regards,
Marvin
Appendix B.4: Initial email to banking employees
Hi
I require your assistance, please. In completion of my Masters degree, I am
required to conduct a research study. In this regard, a banking industry specific

Association between employee motivation and
employee demographics in the banking industry
____________________________________________________________________________
___________________________________________
137
employee motivation survey and a confidentiality letter from the university are
attached. The following two activities are kindly requested:
1. Spare 5 minutes to complete and return the survey by 17:00 on 2008/08/08
using either of the contact details (fax or email) provided in the questionnaire.
2. Forward the survey to at least 4 colleagues who are also employees at one of
the South African banks. Kindly request that they too return their completed
surveys and forward the survey onto at least 4 of their colleagues and so on,
thereby creating a "snowball" effect. It is important that all email forwards of the
survey, copy in ("Cc:") [email protected]. This is required to
calculate the response rate in the results of the survey.
I know that you are busy with your own work commitments, but it would be
appreciated if you would please assist with the two requests above. The survey
requires a minimum response of 400 South African banking employees to
deliver representative results.
Thanks and regards,
Marvin
Appendix B.5: Reminder email to non-banking employees
Hi
As acknowledged in the original email, I understand that everyone is perhaps
busier than they would like to be and to find time for the essential and required
is challenging enough without setting aside time for the little extras and fulfilling
those intentions.
Regarding the survey sent about one and a half weeks ago, there has been no
reply. Perhaps with the timeline set to this coming Friday, you only planned on
forwarding the questionnaire to your colleagues during this week.
To this intention, I send this reminder and for your convenience, I have also
attached the original survey and confidentiality letter. Please find a few

Association between employee motivation and
employee demographics in the banking industry
____________________________________________________________________________
___________________________________________
138
moments during this week to forward through the survey to colleagues in the
South African banking industry allowing them sufficient time to return the
completed survey and facilitate the "snowball" effect for maximum coverage by
Friday, 2008/08/08.
Thank you once again for your assistance.
Kind regards,
Marvin
Appendix B.6: Reminder email to banking employees
Hi
As acknowledged in the original email, I understand that everyone is perhaps
busier than they would like to be and to find time for the essential and required
is challenging enough without setting aside time for the little extras and fulfilling
those intentions.
Regarding the survey sent about one and a half weeks ago, there has been no
reply. Perhaps with the timeline set to this coming Friday, you only planned on
completing, returning and forwarding the questionnaire to your colleagues
during this week.
To this intention, I send this reminder and for your convenience, I have also
attached the original survey and confidentiality letter. Please find a few minutes
during this week to complete and return the survey and forward it to other
colleagues in the South African banking industry allowing them sufficient time to
also return the completed survey and facilitate the "snowball" effect for
maximum coverage by Friday, 2008/08/08.
Thank you once again for your assistance.
Kind regards,
Marvin

Association between employee motivation and
employee demographics in the banking industry
____________________________________________________________________________
___________________________________________
139
Appendix B.7: Original proposal letter to South African bank
Dear Sir/Madam
Request to conduct survey for academic research
I am currently studying my Masters in Business Leadership (MBL) at the
University of South Africa (UNISA). This year is my final year of study and one
of the deliverables for the year is a research report. I have decided to conduct
my research into the association between employee demographics (age,
gender, race and organisational level) and employee motivation factors.
Employee motivation is becoming an increasingly relevant topic for discussion
in the current business environment. Globalisation driven by technological
advancements is opening up doors to employees for jobs around the world. The
various political, economic and social events in South Africa compound the
retention challenges facing employers trying to hold on to their key staff. The
modern-day employee need for mobility and versatility further requires that
employers become more astute to the requirements of their employees. Finally,
South Africa’s diversity is an additional dimension for consideration by
employers.
For this purpose, I kindly request that Bank X’s retail division be engaged to
conduct a survey for the research study. The questionnaire is simple and will
not consume more than 10 minutes of each employee’s time. Only the head
office employees will participate. The confidentiality of the participants will be
maintained and the final report will only contain aggregated results for statistical
inferences. On completion of the study, a copy of the report can be made
available to the bank via email free of charge.
I am also bound by the University’s ethics rules and guidelines regarding any
data gathered for research purposes. Please find the following attached for your
perusal:
1. Letter from the SBL confirming my registration and positioning of the
research report towards completing my MBL

Association between employee motivation and
employee demographics in the banking industry
____________________________________________________________________________
___________________________________________
140
2. Survey questionnaire to be issued to employees
Thank you in advance for your assistance in this regard. Please feel free to
contact me or UNISA should you have any queries.
Please confirm your approval for the study at Bank X.
Thanks and regards,
Marvin Perumal
Mobile : 072 172 2484
Fax : 0866527026
Email : [email protected]

Association between employee motivation and
employee demographics in the banking industry
_____________________________________________________________________________________________________________________________
___________________________________________
141
Appendix B.8: Original proposal presentation to South African bank
09 June 2008
Marvin Perumal
(MBL Student, UNISA SBL)
Research proposal:“Association between employee demographics and
employee motivation factors”
Objective of study
Support retention efforts at retail division by furthering the understanding
of what motivates their employees
Among the associated objectives are:
• Provide a prioritised list of motivators that managers can integrate within their existing retention strategy
• Identify key differences in the sources of motivation among the diverse SA cultures
• Add to the existing South African body of knowledge in the field
• Ensure versatility of the research through the use of globally accepted theoretical models to facilitate inclusion in future studies of a similar nature and in so doing, support comparative analysis
South Africa – post 1994 power shifts
• Sources of tension prevalent among salient social identity groups
– Blacks upset by notion of “tokenism”
– Whites experience social identity anxiety with job insecurity and low probability of future promotional opportunities
– Indians/Coloureds concerned to once again be in the middle of now “reverse apartheid”
• Retention strategies challenged by traces of discrimination rooted in country’s history
Management
Economic
Social
Political
WhiteMale
White
Female
Black
Male
BlackFemale
Valuing diversity
• Between continuum extremes of assimilation and differentiation, the integrated approach values multiculturalism
– Lower costs achieved by early integration of increasingly diverse workforces
– Attract best personnel by gaining reputation for better integration of diverse workforce
– Increase cultural sensitivity of marketing efforts
– Increase creativity through diversity of perspectives
– Improve decision making through heterogeneous problem solving
– More fluid and flexible system, demanded by multiculturalism, better positions the organisation for change
Assimilation
Treat everyone the
same
Differentiation
Capitalise on
differences
Integration
Appreciate
differences and respect
uniqueness
Research hypothesis
• Need for effective retention strategies becoming increasingly crucial in South African workplace
• Retention directly linked to employee motivation
• Race and gender are salient social identities in South Africa
• Age (baby boomers, X generation, Y generation) and organisational level included in international studies
• All four hypotheses of main problem assume existence of an association between each demographic sub-group and the motivation factors
To identify any
associations between
employee
demographics (age,
gender, race,
organisational level)
and employee
motivation factors in
the South African
banking industry
age �� employee motivation
gender �� employee motivation
race �� employee motivation
organisational level �� employee motivation
H1 – H2 H3 – H4
Maslow and Herzberg
• Maslow’s hierarchy of needs (1943) has been linked to Herzberg’s two-factor theory (1968)
• Extrinsic factors influence job dissatisfaction
– When adequately met, only create a neutral environment
– Known as “hygiene” factors
• Intrinsic factors influence job satisfaction
– When adequately met, have the ability to generate satisfaction
– Known as “motivators”
Safety needs
Self-
Actualisation
Esteem needs
Social needs
Biological and Psychological needsBasic life needs – air, food, drink, shelter,
warmth, sleep, etc.
Protection, security,order, law, limits,
stability, etc.
Family, affection, relationships, work
groups, etc.
Achievement, status, responsibility,
reputation
Personal growth and fulfilment
Intrinsic factors
Extrinsic factors

Association between employee motivation and
employee demographics in the banking industry
_____________________________________________________________________________________________________________________________
___________________________________________
142
• Kovach formulated ten motivation factors (1945)
• Factors used in 1946, 1981 and 1995 to conduct comparison studies in the industrial sector in the United States
• Herzberg categorised Kovach’s ten motivation factors using two-factor theory (1968)
• Proposed research study is based on Kovach’s ten motivation factors
5. Full appreciation of work done1. Good working conditions
10. Loyalty to employees
9. Opportunities for advancement and development
8. Interesting work4. Good wages
7. Sympathetic help with personal problems3. Job Security
6. Feeling of being involved2. Tactful discipline
Intrinsic factorsExtrinsic factors
Herzberg and Kovach
• Graduated BSc. Information Technology in 2002 at University of Natal
• Employed as Senior Consultant at global software vendor since 2003
• Currently third year MBL student at UNISA School of Business Leadership (SBL)
• Achieved individual ranking in top ten for 2007 (MBL2)
• Achieved group ranking in top ten for 2007 (MBL2)
• Research study contributes towards completion of degree
• Bound by confidentiality of UNISA SBL
• Timelines for deliverable submissions to SBL
– First draft due August 22nd, 2008
– Second draft due September 22nd, 2008
– Final copy due December 1st, 2008
Researcher profile
• Minimal cost
– 10-15 minutes required by each employee for completion of questionnaire
– No resource requirements as researcher will conduct all administrative functions including distribution and collection of questionnaires (unless otherwise requested)
• Only 10% (sample size) of retail division employees at head office will be engaged in survey
• Free copy of study will be emailed once statistical analysis is complete
• Possibility for study to be extended in the future to other divisions
• Valuable insight into motivation of diverse workforce can serve as input into retention strategies
• Facilitates finding balance between Afrocentric and Eurocentric management styles in South African workplace
• Integrated approach to diversity management reduces tension, encouraging appreciation for differences and respect for uniqueness, …
Raising the level of corporate cultural intelligence (CQ)
Benefits and conclusion
Appendix C: Supplementary data analysis
Appendix C.1: Independent two sample t-test for Gender
Levene's Test for Equality of Variances
t-test for Equality of Means
F Sig. t df Sig. (2-tailed)
Mean Difference
Std. Error Difference
95% Confidence Interval of the
Difference
Upper Lower
1. Full appreciation of work done
Equal variances assumed 1.536 0.217 -1.256 135 0.211 -0.27999 0.22300 -0.72101 0.16103
Equal variances not assumed -1.241 119.190 0.217 -0.27999 0.22562 -0.72673 0.16676

Association between employee motivation and
employee demographics in the banking industry
_____________________________________________________________________________________________________________________________
___________________________________________
143
Levene's Test for Equality of Variances
t-test for Equality of Means
F Sig. t df Sig. (2-tailed)
Mean Difference
Std. Error Difference
95% Confidence Interval of the
Difference
Upper Lower
2. Feeling of being involved
Equal variances assumed 0.472 0.493 -1.230 135 0.221 -0.25456 0.20694 -0.66382 0.15469
Equal variances not assumed -1.240 128.546 0.217 -0.25456 0.20526 -0.66069 0.15156
3. Sympathetic help with personal problems
Equal variances assumed 1.639 0.203 -0.818 135 0.415 -0.17243 0.21076 -0.58924 0.24439
Equal variances not assumed -0.835 132.602 0.405 -0.17243 0.20650 -0.58089 0.23604
4. Interesting work Equal variances assumed 1.967 0.163 -0.751 135 0.454 -0.16286 0.21682 -0.59166 0.26593
Equal variances not assumed -0.768 132.990 0.444 -0.16286 0.21210 -0.58240 0.25667
5. Opportunity for development
Equal variances assumed 0.299 0.586 -1.916 135 0.058 -0.43449 0.22682 -0.88306 0.01409
Equal variances not assumed -1.927 127.564 0.056 -0.43449 0.22552 -0.88073 0.01176
6. Loyalty to employees
Equal variances assumed 0.115 0.735 -0.922 135 0.358 -0.22208 0.24092 -0.69853 0.25438
Equal variances not assumed -0.927 127.721 0.355 -0.22208 0.23945 -0.69588 0.25173
7. Good working conditions
Equal variances assumed 0.025 0.874 -2.015 135 0.046 -0.39135 0.19424 -0.77549 -0.00721
Equal variances not assumed -2.030 128.249 0.044 -0.39135 0.19281 -0.77284 -0.00986
8. Tactful disciplining
Equal variances assumed 1.654 0.201 -0.627 135 0.532 -0.14059 0.22433 -0.58426 0.30307
Equal variances not assumed -0.637 131.576 0.525 -0.14059 0.22060 -0.57698 0.29580
9. Job security Equal variances assumed 1.648 0.201 -0.321 135 0.749 -0.07193 0.22426 -0.51544 0.37159
Equal variances not assumed -0.317 118.783 0.752 -0.07193 0.22707 -0.52155 0.37770
10. Good wages Equal variances assumed 0.079 0.779 -1.795 135 0.075 -0.34757 0.19358 -0.73041 0.03528
Equal variances not assumed -1.812 128.961 0.072 -0.34757 0.19181 -0.72707 0.03193

Association between employee motivation and
employee demographics in the banking industry
_____________________________________________________________________________________________________________________________
___________________________________________
144
Appendix C.2: One-way ANOVA for Generation (Scheffe)
Dependent Variable (I) Generation (J) Generation Mean Difference
(I-J) Std. Error Sig.
95% Confidence Interval
Upper Bound Lower Bound
1. Full appreciation of work done
Generation Y Generation X -0.18822 0.25799 0.767 -0.8268 0.4504
Baby Boomers -0.19054 0.29440 0.811 -0.9193 0.5382
Generation X Generation Y 0.18822 0.25799 0.767 -0.4504 0.8268
Baby Boomers -0.00232 0.28206 1.000 -0.7005 0.6959
Baby Boomers Generation Y 0.19054 0.29440 0.811 -0.5382 0.9193
Generation X 0.00232 0.28206 1.000 -0.6959 0.7005
2. Feeling of being involved
Generation Y Generation X 0.02689 0.23405 0.993 -0.5525 0.6062
Baby Boomers -0.59463 0.26707 0.088 -1.2557 0.0665
Generation X Generation Y -0.02689 0.23405 0.993 -0.6062 0.5525
Baby Boomers -0.62152 0.25588 0.056 -1.2549 0.0119
Baby Boomers Generation Y 0.59463 0.26707 0.088 -0.0665 1.2557
Generation X 0.62152 0.25588 0.056 -0.0119 1.2549
3. Sympathetic help with personal problems
Generation Y Generation X -0.22788 0.23894 0.636 -0.8194 0.3636
Baby Boomers -0.62468 0.27266 0.076 -1.2996 0.0503
Generation X Generation Y 0.22788 0.23894 0.636 -0.3636 0.8194
Baby Boomers -0.39680 0.26124 0.319 -1.0435 0.2499
Baby Boomers Generation Y 0.62468 0.27266 0.076 -0.0503 1.2996
Generation X 0.39680 0.26124 0.319 -0.2499 1.0435
4. Interesting work Generation Y Generation X -0.11918 0.24045 0.885 -0.7144 0.4760
Baby Boomers -.86893(*) 0.27438 0.008 -1.5481 -0.1897

Association between employee motivation and
employee demographics in the banking industry
_____________________________________________________________________________________________________________________________
___________________________________________
145
Dependent Variable (I) Generation (J) Generation Mean Difference
(I-J) Std. Error Sig.
95% Confidence Interval
Upper Bound Lower Bound
Generation X Generation Y 0.11918 0.24045 0.885 -0.4760 0.7144
Baby Boomers -.74974(*) 0.26289 0.019 -1.4005 -0.0990
Baby Boomers Generation Y .86893(*) 0.27438 0.008 0.1897 1.5481
Generation X .74974(*) 0.26289 0.019 0.0990 1.4005
5. Opportunity for development
Generation Y Generation X -0.55835 0.25045 0.087 -1.1783 0.0616
Baby Boomers -1.14194(*) 0.28579 0.001 -1.8494 -0.4345
Generation X Generation Y 0.55835 0.25045 0.087 -0.0616 1.1783
Baby Boomers -0.58359 0.27382 0.107 -1.2614 0.0942
Baby Boomers Generation Y 1.14194(*) 0.28579 0.001 0.4345 1.8494
Generation X 0.58359 0.27382 0.107 -0.0942 1.2614
6. Loyalty to employees
Generation Y Generation X 0.35793 0.27240 0.424 -0.3164 1.0322
Baby Boomers -0.37788 0.31084 0.480 -1.1473 0.3916
Generation X Generation Y -0.35793 0.27240 0.424 -1.0322 0.3164
Baby Boomers -0.73581 0.29782 0.051 -1.4730 0.0014
Baby Boomers Generation Y 0.37788 0.31084 0.480 -0.3916 1.1473
Generation X 0.73581 0.29782 0.051 -0.0014 1.4730
7. Good working conditions
Generation Y Generation X 0.13902 0.21967 0.819 -0.4047 0.6828
Baby Boomers -0.58312 0.25067 0.070 -1.2036 0.0374
Generation X Generation Y -0.13902 0.21967 0.819 -0.6828 0.4047
Baby Boomers -.72214(*) 0.24017 0.013 -1.3166 -0.1276
Baby Boomers Generation Y 0.58312 0.25067 0.070 -0.0374 1.2036
Generation X .72214(*) 0.24017 0.013 0.1276 1.3166

Association between employee motivation and
employee demographics in the banking industry
_____________________________________________________________________________________________________________________________
___________________________________________
146
Dependent Variable (I) Generation (J) Generation Mean Difference
(I-J) Std. Error Sig.
95% Confidence Interval
Upper Bound Lower Bound
8. Tactful disciplining
Generation Y Generation X -0.15523 0.25012 0.825 -0.7744 0.4639
Baby Boomers -.84847(*) 0.28542 0.014 -1.5550 -0.1420
Generation X Generation Y 0.15523 0.25012 0.825 -0.4639 0.7744
Baby Boomers -.69324(*) 0.27346 0.043 -1.3702 -0.0163
Baby Boomers Generation Y .84847(*) 0.28542 0.014 0.1420 1.5550
Generation X .69324(*) 0.27346 0.043 0.0163 1.3702
9. Job security
Generation Y Generation X 0.04596 0.25784 0.984 -0.5923 0.6842
Baby Boomers -0.20972 0.29422 0.776 -0.9380 0.5186
Generation X Generation Y -0.04596 0.25784 0.984 -0.6842 0.5923
Baby Boomers -0.25568 0.28189 0.664 -0.9535 0.4421
Baby Boomers Generation Y 0.20972 0.29422 0.776 -0.5186 0.9380
Generation X 0.25568 0.28189 0.664 -0.4421 0.9535
10. Good wages
Generation Y Generation X 0.02536 0.22536 0.994 -0.5325 0.5832
Baby Boomers -0.15601 0.25716 0.832 -0.7926 0.4805
Generation X Generation Y -0.02536 0.22536 0.994 -0.5832 0.5325
Baby Boomers -0.18137 0.24639 0.763 -0.7913 0.4285
Baby Boomers Generation Y 0.15601 0.25716 0.832 -0.4805 0.7926
Generation X 0.18137 0.24639 0.763 -0.4285 0.7913

Association between employee motivation and
employee demographics in the banking industry
_____________________________________________________________________________________________________________________________
___________________________________________
147
Appendix C.3: One-way ANOVA for Race (Scheffe)
Dependent Variable (I) Race
categories (J) Race
categories Mean Difference
(I-J) Std. Error Sig.
95% Confidence Interval
Upper Bound Lower Bound
1. Full appreciation of work done
Black/Coloured Indian 0.59502 0.29565 0.136 -0.1370 1.3271
White 0.26127 0.31009 0.702 -0.5065 1.0291
Indian Black/Coloured -0.59502 0.29565 0.136 -1.3271 0.1370
White -0.33375 0.24977 0.412 -0.9522 0.2847
White Black/Coloured -0.26127 0.31009 0.702 -1.0291 0.5065
Indian 0.33375 0.24977 0.412 -0.2847 0.9522
2. Feeling of being involved
Black/Coloured Indian 0.37675 0.27433 0.392 -0.3025 1.0560
White -0.17190 0.28773 0.837 -0.8843 0.5405
Indian Black/Coloured -0.37675 0.27433 0.392 -1.0560 0.3025
White -0.54865 0.23175 0.064 -1.1225 0.0252
White Black/Coloured 0.17190 0.28773 0.837 -0.5405 0.8843
Indian 0.54865 0.23175 0.064 -0.0252 1.1225
3. Sympathetic help with personal problems
Black/Coloured Indian 0.40801 0.27584 0.338 -0.2750 1.0910
White -0.31401 0.28931 0.556 -1.0304 0.4023
Indian Black/Coloured -0.40801 0.27584 0.338 -1.0910 0.2750
White -.72202(*) 0.23303 0.010 -1.2990 -0.1450
White Black/Coloured 0.31401 0.28931 0.556 -0.4023 1.0304
Indian .72202(*) 0.23303 0.010 0.1450 1.2990
4. Interesting work Black/Coloured Indian .68610(*) 0.27409 0.047 0.0074 1.3647
White -0.04911 0.28748 0.986 -0.7609 0.6627

Association between employee motivation and
employee demographics in the banking industry
_____________________________________________________________________________________________________________________________
___________________________________________
148
Dependent Variable (I) Race
categories (J) Race
categories Mean Difference
(I-J) Std. Error Sig.
95% Confidence Interval
Upper Bound Lower Bound
Indian Black/Coloured -.68610(*) 0.27409 0.047 -1.3647 -0.0074
White -.73521(*) 0.23155 0.008 -1.3085 -0.1619
White Black/Coloured 0.04911 0.28748 0.986 -0.6627 0.7609
Indian .73521(*) 0.23155 0.008 0.1619 1.3085
5. Opportunity for development
Black/Coloured Indian .91864(*) 0.29348 0.009 0.1920 1.6453
White 0.16989 0.30781 0.859 -0.5923 0.9320
Indian Black/Coloured -.91864(*) 0.29348 0.009 -1.6453 -0.1920
White -.74875(*) 0.24793 0.012 -1.3626 -0.1349
White Black/Coloured -0.16989 0.30781 0.859 -0.9320 0.5923
Indian .74875(*) 0.24793 0.012 0.1349 1.3626
6. Loyalty to employees
Black/Coloured Indian 0.07498 0.32261 0.973 -0.7238 0.8738
White -0.41023 0.33837 0.482 -1.2480 0.4276
Indian Black/Coloured -0.07498 0.32261 0.973 -0.8738 0.7238
White -0.48521 0.27254 0.209 -1.1600 0.1896
White Black/Coloured 0.41023 0.33837 0.482 -0.4276 1.2480
Indian 0.48521 0.27254 0.209 -0.1896 1.1600
7. Good working conditions
Black/Coloured Indian 0.45993 0.25926 0.211 -0.1820 1.1019
White 0.00483 0.27192 1.000 -0.6684 0.6781
Indian Black/Coloured -0.45993 0.25926 0.211 -1.1019 0.1820
White -0.45510 0.21902 0.120 -0.9974 0.0872
White Black/Coloured -0.00483 0.27192 1.000 -0.6781 0.6684
Indian 0.45510 0.21902 0.120 -0.0872 0.9974

Association between employee motivation and
employee demographics in the banking industry
_____________________________________________________________________________________________________________________________
___________________________________________
149
Dependent Variable (I) Race
categories (J) Race
categories Mean Difference
(I-J) Std. Error Sig.
95% Confidence Interval
Upper Bound Lower Bound
8. Tactful disciplining
Black/Coloured Indian 0.37310 0.29578 0.453 -0.3593 1.1055
White -0.27818 0.31023 0.670 -1.0463 0.4899
Indian Black/Coloured -0.37310 0.29578 0.453 -1.1055 0.3593
White -.65128(*) 0.24988 0.036 -1.2700 -0.0326
White Black/Coloured 0.27818 0.31023 0.670 -0.4899 1.0463
Indian .65128(*) 0.24988 0.036 0.0326 1.2700
9. Job security
Black/Coloured Indian 0.35701 0.29376 0.480 -0.3703 1.0844
White -0.26932 0.30810 0.683 -1.0322 0.4935
Indian Black/Coloured -0.35701 0.29376 0.480 -1.0844 0.3703
White -.62634(*) 0.24816 0.045 -1.2408 -0.0119
White Black/Coloured 0.26932 0.30810 0.683 -0.4935 1.0322
Indian .62634(*) 0.24816 0.045 0.0119 1.2408
10. Good wages
Black/Coloured Indian 0.20249 0.25733 0.734 -0.4347 0.8396
White -0.17955 0.26990 0.802 -0.8478 0.4887
Indian Black/Coloured -0.20249 0.25733 0.734 -0.8396 0.4347
White -0.38204 0.21740 0.217 -0.9203 0.1562
White Black/Coloured 0.17955 0.26990 0.802 -0.4887 0.8478
Indian 0.38204 0.21740 0.217 -0.1562 0.9203

Association between employee motivation and
employee demographics in the banking industry
_____________________________________________________________________________________________________________________________
___________________________________________
150
Appendix C.4: One-way ANOVA for Organisational level (Scheffe)
Dependent Variable (I) Organisational
level (recoded) (J) Organisational
level (recoded) Mean Difference
(I-J) Std. Error Sig.
95% Confidence Interval
Upper Bound Lower Bound
1. Full appreciation of work done
Senior/Middle management
Junior management 0.39329 0.27969 0.375 -0.2990 1.0856
Non-management 0.46154 0.26393 0.221 -0.1918 1.1149
Junior management
Senior/Middle management
-0.39329 0.27969 0.375 -1.0856 0.2990
Non-management 0.06825 0.26911 0.968 -0.5979 0.7344
Non-management
Senior/Middle management
-0.46154 0.26393 0.221 -1.1149 0.1918
Junior management -0.06825 0.26911 0.968 -0.7344 0.5979
2. Feeling of being involved
Senior/Middle management
Junior management 0.40965 0.26001 0.292 -0.2340 1.0533
Non-management 0.32780 0.24536 0.412 -0.2796 0.9351
Junior management
Senior/Middle management
-0.40965 0.26001 0.292 -1.0533 0.2340
Non-management -0.08185 0.25017 0.948 -0.7011 0.5374
Non-management
Senior/Middle management
-0.32780 0.24536 0.412 -0.9351 0.2796
Junior management 0.08185 0.25017 0.948 -0.5374 0.7011
3. Sympathetic help with personal problems
Senior/Middle management
Junior management .66907(*) 0.25291 0.033 0.0430 1.2951
Non-management .90734(*) 0.23866 0.001 0.3166 1.4981
Junior management
Senior/Middle management
-.66907(*) 0.25291 0.033 -1.2951 -0.0430
Non-management 0.23827 0.24334 0.620 -0.3641 0.8406
Non-management Senior/Middle management
-.90734(*) 0.23866 0.001 -1.4981 -0.3166

Association between employee motivation and
employee demographics in the banking industry
_____________________________________________________________________________________________________________________________
___________________________________________
151
Dependent Variable (I) Organisational
level (recoded) (J) Organisational
level (recoded) Mean Difference
(I-J) Std. Error Sig.
95% Confidence Interval
Upper Bound Lower Bound
Junior management -0.23827 0.24334 0.620 -0.8406 0.3641
4. Interesting work
Senior/Middle management
Junior management 0.31402 0.27088 0.512 -0.3565 0.9846
Non-management 0.47115 0.25562 0.187 -0.1616 1.1039
Junior management
Senior/Middle management
-0.31402 0.27088 0.512 -0.9846 0.3565
Non-management 0.15713 0.26064 0.834 -0.4880 0.8023
Non-management
Senior/Middle management
-0.47115 0.25562 0.187 -1.1039 0.1616
Junior management -0.15713 0.26064 0.834 -0.8023 0.4880
5. Opportunity for development
Senior/Middle management
Junior management 0.46563 0.27922 0.253 -0.2255 1.1568
Non-management .86713(*) 0.26348 0.005 0.2149 1.5194
Junior management
Senior/Middle management
-0.46563 0.27922 0.253 -1.1568 0.2255
Non-management 0.40150 0.26866 0.330 -0.2635 1.0665
Non-management
Senior/Middle management
-.86713(*) 0.26348 0.005 -1.5194 -0.2149
Junior management -0.40150 0.26866 0.330 -1.0665 0.2635
6. Loyalty to employees
Senior/Middle management
Junior management 0.65965 0.29823 0.090 -0.0786 1.3979
Non-management 0.60664 0.28142 0.102 -0.0900 1.3033
Junior management
Senior/Middle management
-0.65965 0.29823 0.090 -1.3979 0.0786
Non-management -0.05300 0.28695 0.983 -0.7633 0.6573
Non-management Senior/Middle management
-0.60664 0.28142 0.102 -1.3033 0.0900

Association between employee motivation and
employee demographics in the banking industry
_____________________________________________________________________________________________________________________________
___________________________________________
152
Dependent Variable (I) Organisational
level (recoded) (J) Organisational
level (recoded) Mean Difference
(I-J) Std. Error Sig.
95% Confidence Interval
Upper Bound Lower Bound
Junior management 0.05300 0.28695 0.983 -0.6573 0.7633
7. Good working conditions
Senior/Middle management
Junior management 0.39634 0.24579 0.276 -0.2121 1.0048
Non-management 0.37500 0.23194 0.274 -0.1991 0.9491
Junior management
Senior/Middle management
-0.39634 0.24579 0.276 -1.0048 0.2121
Non-management -0.02134 0.23649 0.996 -0.6067 0.5641
Non-management
Senior/Middle management
-0.37500 0.23194 0.274 -0.9491 0.1991
Junior management 0.02134 0.23649 0.996 -0.5641 0.6067
8. Tactful disciplining
Senior/Middle management
Junior management 0.62860 0.27585 0.078 -0.0542 1.3114
Non-management .65909(*) 0.26031 0.044 0.0147 1.3035
Junior management
Senior/Middle management
-0.62860 0.27585 0.078 -1.3114 0.0542
Non-management 0.03049 0.26542 0.993 -0.6265 0.6875
Non-management
Senior/Middle management
-.65909(*) 0.26031 0.044 -1.3035 -0.0147
Junior management -0.03049 0.26542 0.993 -0.6875 0.6265
9. Job security
Senior/Middle management
Junior management 0.25000 0.28144 0.675 -0.4467 0.9467
Non-management 0.34615 0.26559 0.430 -0.3113 1.0036
Junior management
Senior/Middle management
-0.25000 0.28144 0.675 -0.9467 0.4467
Non-management 0.09615 0.27080 0.939 -0.5742 0.7665
Non-management Senior/Middle management
-0.34615 0.26559 0.430 -1.0036 0.3113

Association between employee motivation and
employee demographics in the banking industry
_____________________________________________________________________________________________________________________________
___________________________________________
153
Dependent Variable (I) Organisational
level (recoded) (J) Organisational
level (recoded) Mean Difference
(I-J) Std. Error Sig.
95% Confidence Interval
Upper Bound Lower Bound
Junior management -0.09615 0.27080 0.939 -0.7665 0.5742
10. Good wages
Senior/Middle management
Junior management -0.03575 0.24506 0.989 -0.6424 0.5709
Non-management 0.29633 0.23126 0.442 -0.2761 0.8688
Junior management
Senior/Middle management
0.03575 0.24506 0.989 -0.5709 0.6424
Non-management 0.33208 0.23580 0.374 -0.2516 0.9158
Non-management
Senior/Middle management
-0.29633 0.23126 0.442 -0.8688 0.2761
Junior management -0.33208 0.23580 0.374 -0.9158 0.2516

Association between employee motivation and
employee demographics in the banking industry
____________________________________________________________________________
___________________________________________
154