association mapping reveals the genetic architecture of
TRANSCRIPT

HAL Id: hal-01403394https://hal.archives-ouvertes.fr/hal-01403394
Submitted on 25 Nov 2016
HAL is a multi-disciplinary open accessarchive for the deposit and dissemination of sci-entific research documents, whether they are pub-lished or not. The documents may come fromteaching and research institutions in France orabroad, or from public or private research centers.
L’archive ouverte pluridisciplinaire HAL, estdestinée au dépôt et à la diffusion de documentsscientifiques de niveau recherche, publiés ou non,émanant des établissements d’enseignement et derecherche français ou étrangers, des laboratoirespublics ou privés.
Association mapping reveals the genetic architecture oftomato response to water deficit: focus on major fruit
quality traitsElise Albert, Vincent Segura, Justine Gricourt, Julien Bonnefoi, Laurent
Derivot, Mathilde Causse
To cite this version:Elise Albert, Vincent Segura, Justine Gricourt, Julien Bonnefoi, Laurent Derivot, et al.. Associa-tion mapping reveals the genetic architecture of tomato response to water deficit: focus on majorfruit quality traits. Journal of Experimental Botany, Oxford University Press (OUP), 2016, 67 (22),pp.6413-6430. �10.1093/jxb/erw411�. �hal-01403394�

Journal of Experimental Botany, Vol. 67, No. 22 pp. 6413–6430, 2016doi:10.1093/jxb/erw411 This paper is available online free of all access charges (see http://jxb.oxfordjournals.org/open_access.html for further details)
RESEARCH PAPER
Association mapping reveals the genetic architecture of tomato response to water deficit: focus on major fruit quality traits
Elise Albert1, Vincent Segura2, Justine Gricourt1, Julien Bonnefoi3, Laurent Derivot3 and Mathilde Causse1,*1 INRA, UR1052, Génétique et Amélioration des Fruits et Légumes, 67 Allée des Chênes, Centre de Recherche PACA, Domaine Saint Maurice, CS60094, Montfavet, 84143, France2 INRA, UR0588, Amélioration, Génétique et Physiologie Forestières, 2163 Avenue de la Pomme de Pin, Centre de Recherche Val de Loire, CS 40001, Orléans, 45075, France3 GAUTIER Semences, route d’Avignon, Eyragues, 13630, France
* Correspondence: [email protected]
Received 16 August 2016; Editorial decision 13 October 2016; Accepted 13 October 2016
Editor: Ariel Vicente, CONICET-National University of La Plata
Abstract
Water scarcity constitutes a crucial constraint for agriculture productivity. High-throughput approaches in model plant species identified hundreds of genes potentially involved in survival under drought, but few having beneficial effects on quality and yield. Nonetheless, controlled water deficit may improve fruit quality through higher concentra-tion of flavor compounds. The underlying genetic determinants are still poorly known. In this study, we phenotyped 141 highly diverse small fruit tomato accessions for 27 traits under two contrasting watering conditions. A subset of 55 accessions exhibited increased metabolite contents and maintained yield under water deficit. Using 6100 single nucleotide polymorphisms (SNPs), association mapping revealed 31, 41, and 44 quantitative trait loci (QTLs) under drought, control, and both conditions, respectively. Twenty-five additional QTLs were interactive between condi-tions, emphasizing the interest in accounting for QTLs by watering regime interactions in fruit quality improvement. Combining our results with the loci previously identified in a biparental progeny resulted in 11 common QTLs and con-tributed to a first detailed characterization of the genetic determinants of response to water deficit in tomato. Major QTLs for fruit quality traits were dissected and candidate genes were proposed using expression and polymorphism data. The outcomes provide a basis for fruit quality improvement under deficit irrigation while limiting yield losses.
Key words: Acid and vitamin C content, candidate genes, drought, fleshy fruit quality, genotype by environment interaction, GWA, QTL, Solanum lycopersicum, sugar.
Introduction
Global water scarcity will constitute a crucial challenge in the coming years (Jury and Vaux, 2005). Agriculture, which is consuming up to 80% of the worldwide water resources through irrigation, has to move towards a more sustain-able use of water (Rost et al., 2008). Utilization of advanced
irrigation strategies and development of drought-adapted crops are among the solutions to solve this dilemma (Fereres and Soriano, 2006; Costa et al., 2007).
Beyond these concerns, deficit irrigation practices constitute a way to manage fruit flavor by exploiting the morphological,
This is an Open Access article distributed under the terms of the Creative Commons Attribution License (http://creativecommons.org/licenses/by/3.0/), which permits unrestricted reuse, distribution, and reproduction in any medium, provided the original work is properly cited.
© The Author 2016. Published by Oxford University Press on behalf of the Society for Experimental Biology.
at INR
A A
vignon on Novem
ber 18, 2016http://jxb.oxfordjournals.org/
Dow
nloaded from

6414 | Albert et al.
physiological, and molecular changes (referred to as ‘pheno-typic plasticity’) occurring in water-stressed plants (Ripoll et al., 2014). Under water deficit, plants close their stomata to limit transpiration, impacting resource availability from photosynthetic sources, which may result in a decrease in number and/or size of the fruits. On the other hand, a mild water deficit tends to shift photo-assimilate partitioning towards synthesis of antioxidant compounds (in particular vitamin C) involved in defense against stress-induced reac-tive oxygen species and compatible solutes (including sugars and acids) involved in osmotic adjustment (Lemoine et al., 2013; Albacete et al., 2014; Osorio et al., 2014). Evidence for the efficiency of deficit irrigation to concentrate the major flavor and nutritional components in fleshy fruits (mainly sugars, acids, and antioxidants), either by a concentration or an accumulation effect, was obtained in many species such as tomato (Kirda et al., 2004; Zheng et al., 2013), grapevine (Chaves et al., 2007), apple (Leib et al., 2006), and mango (Durán Zuazo et al., 2011). However, these studies focused on a small number of genotypes, while responses to deficit irri-gation seem to be highly genotype dependent (Ripoll et al., 2016a, b).
Gene expression studies have revealed hundreds of genes involved in plant survival under severe water limitation, but usually associated with detrimental effects on yield under a realistic drought scenario (Tardieu, 2012; Bac-Molenaar et al., 2016). These studies focused on model species, mainly Arabidopsis thaliana (Seki et al., 2002; Des Marais et al., 2012) and cereals (Langridge, 2006; Barnabas et al., 2007). Up to now, the identification of the genetic determinants of drought response from the natural diversity of fleshy fruit crops remains limited. Quantitative trait locus (QTL) map-ping might be particularly valuable to address this question (Des Marais et al., 2013).
Two complementary approaches are commonly applied to dissect genotype by environment interactions into their under-lying QTLs (QTL by environment interactions). The first one consists of computing the effects of a given QTL across the environmental conditions using multivariate QTL mapping models (van Eeuwijk et al., 2010; El-Soda et al., 2014b). The second one uses the construction of composite variables measuring phenotypic plasticity and univariate mapping models (El-Soda et al., 2014a). With both approaches, QTLs can be classified according to the prevalence of their effect under the different conditions. A QTL is considered ‘consti-tutive’ when its effect is conserved whatever the environment. QTLs whose effect is not significant in every environment are called ‘specific’, while the effect of ‘interactive’ QTLs changes direction (‘antagonist’) or intensity (‘differential’) according to the environment. With the availability of a high-through-put genotyping assay, this classification can be considered in crop species via conventional linkage mapping (Malosetti et al., 2007; Verbyla et al., 2014) as well as genome-wide asso-ciation studies (GWASs) (Korte et al., 2012; Saïdou et al., 2014). A GWAS has the advantage over linkage mapping that it allows exploration of the genetic diversity and the numer-ous recombination events present in germplasm collections and may lead to higher resolution mapping if the LD (linkage
disequilibrium) is low enough in the population (Brachi et al., 2010; Korte and Farlow, 2013; El-Soda et al., 2015; Pascual et al., 2016).
In tomato (Solanum lycopersicum L.), QTLs were mapped for fruit quality traits measured under optimal watering con-ditions using linkage (Causse et al., 2001; Saliba-Colombani et al., 2001; Tieman et al., 2006; Zanor et al., 2009b; Capel et al., 2015) and association mapping (Xu et al., 2013; Ruggieri et al., 2014; Sauvage et al., 2014; Sacco et al., 2015). The studies of QTLs by water regime interactions focused on introgression lines between the cultivated tomato and its wild relatives (mainly S. habrochaites and S. pennellii), leading to low mapping resolution (Semel et al., 2007; Gur et al., 2011; Arms et al., 2015). Recently, we analyzed QTLs by watering regime interaction in a segregating population derived from a cross between a small- and a large-fruited S. lycopersicum accession (Albert et al., 2016). A total of 56 QTLs were iden-tified for 19 traits, among which 20% were interactive between the control and deficit watering regimes. Nevertheless, these QTLs were limited to the allelic diversity present in the two parental accessions, and the confidence intervals were broad.
The aims of the present study were (i) to explore the pat-tern of genotype by watering regime interaction in a GWAS panel with a broad genetic basis (including S. pimpinellifo-lium, S. lycopersicum var. cerasiforme, and admixture geno-types) grown under two different watering regimes in two locations and phenotyped for 27 traits; (ii) to identify with a high resolution QTLs and QTL by watering regime interac-tions in this collection; (iii) to combine the results with those obtained in the bi-parental progeny to draw an accurate pic-ture of the genetic variability and the genetic determinants of tomato response to water deficit; and (iv) to identify candi-date genes related to the variation of major fruit quality traits under water deficit by dissecting some of the QTLs.
Materials and methods
Plant materialThe population consisted of 141 accessions (2–46 g FW) encom-passing the genetic diversity of the cultivated small fruit tomato. Among these, 105 accessions were previously investigated in Blanca et al. (2015). Preliminary genetic analysis of our collection con-firmed the genetic structure described by these authors, with clus-ters reflecting the species and the geographic origin of the accessions (see Supplementary Fig. S1A–D at JXB online). Ten accessions were S. pimpinellifolium (SP; closest wild ancestor of the tomato) originating from Peru and Ecuador. A total of 110 accessions were S. lycopersicum var. cerasiforme (SLC) originating mainly from South America. Finally, 21 accessions belonged to a mixed genetic group mainly including commercial cherry tomatoes and admixed genotypes between SP, SLC, and S. lycopersicum var. lycopersi-cum. A description of the accessions and their origin is available in Supplementary Table S1. The genetic groups (SLC, SP, and mixture) are used below in the statistical analysis.
Experimental designThe plants were cultivated with the same experimental design as in Albert et al. (2016). Plants were grown in a heated glasshouse in INRA Avignon (Avi, France) from March to July 2014 and in an unheated plastic greenhouse on the experimental site of the seed
at INR
A A
vignon on Novem
ber 18, 2016http://jxb.oxfordjournals.org/
Dow
nloaded from

Association mapping of tomato response to water deficit | 6415
company GAUTIER Semences in Agadir (Aga, Morocco) from December 2013 to March 2014. Two watering regimes were applied to the plants: control (C) and drought (D). The control treatment was set according to ET (evapotranspiration) and the cultural coef-ficient for tomato under greenhouse conditions (FAO Water, 2015). A maximal drainage of 25% and a relative humidity of the substrate of 65% were established in the control pots. Drought treatment was applied progressively after flowering of the second truss of the earli-est accession. Watering was first reduced by 25% compared with the control for 1 week and then reduced by 60% until the end of the experiments. Relative humidity of the peat substrate was controlled with GRODAN® moisture probes and monitored between 25% and 30% in drought pots. In both experiments, two plants per watering regime per accession were randomized in the greenhouse.
Plant and fruit phenotypingA total of 27 traits were assessed in the GWA population as described in Albert et al. (2016). Flowering date (Flw, days after sowing), stem diameter (Diam, mm), leaf length (Leaf, cm), and truss implantation height (Ht, cm) were measured on each plant both in Avignon (sixth truss) and in Agadir (fifth truss). Plant fruit number (Nbfruits, all fruits from the third to sixth truss) was measured only in Avignon.
Fruit quality measurements were carried out on a minimum of 20 mature fruits per accession per watering regime harvested daily on the third to the sixth truss. All the fruits were weighed (FW, g) and their firmness was measured with a Durofel device (FIR). Only in Avignon, fruits were pooled in three groups in each watering regime. Half of the fruits of each pool were used to assess dry matter weight (DMW, %), pH, and soluble solid content (SSC, °Brix). From the second half of the fruit replicates, pericarps were crushed in liquid nitrogen and assayed for total vitamin C content (VitCFM) accord-ing to the microplate method described in Stevens et al. (2006), for sugar content (glucose and fructose) according to the enzymatic method described in Gomez et al. (2007), and for organic acid con-tent (malic and citric) according to the HPLC method reported in Wu et al. (2002). The different metabolite concentrations were expressed relative to fresh matter (g 100 g–1 of FM) and relative to dry matter (g 100 g–1 of DM). Yield (g per plant) was computed by multiplying average fruit FW by average fruit number per plant.
Plant genotyping and SNP filteringThe GWA population was genotyped using the Tomato Infinium Array developed within the SolCAP project (http://solcap.msu.edu/) (Hamilton et al., 2012; Sim et al., 2012). The maximum rates of missing data were fixed at 25% per accessions and 10% per SNP. A minor allele frequency threshold of 0.04 was applied to discard markers with very rare alleles according to Aulchenko et al. (2007). After filtering, the set of markers was constituted of 6100 SNPs. Prior to any genetic analysis, the remaining missing genotypes were replaced by the allele frequency of the major allele. The SNPs were renamed according to their positions on the tomato genome (SL2.50), as S01_58000085 at base pair 58 000 085 on chromosome 1 (Supplementary Table S2).
Statistical analysis of the phenotypic dataAll statistical analyses were performed using R (R Development Core Team, 2012). Because fewer and different traits were measured in Agadir experiments, data from both locations were analysed sepa-rately (Pearson correlations for the common trait means available in Supplementary Table S4—all significant). Prior to the ANOVAs and when distributions were skewed, phenotypic data were normalized using Box and Cox transformations. The ANOVAs were performed according to the following model:
Y Gr Gr G W Gr W Gr G W eijkl i k i k i j ijkl= + + ( ) + + × + ( ) × +µ i j k
Yijkl was the phenotypic value of accession j from genetic group i in watering regime k, µ the overall mean, Gri the fixed effect of genetic group i, Gri(Gj) the fixed effect of accession j nested in genetic group i, Wk the fixed effect of watering regime k, and eijkl the residual error effect. No significant microenvironment pattern was identified and we chose not to include any spatial effect in the model. When the interaction Gr×W was significant, we computed a Tukey’s post-hoc test to compare the means.
Then, in both watering regimes, restricted maximum likelihood estimates of the genetic and residual variances (σ2
G and σ2e) were
computed with a second linear model: Yijk=µ+Gri+Gri(Gj)+eijk (Grj fixed, Gi and eijk random). Broad-sense heritabilities (H2) were calcu-lated under both watering regimes as the ratio between the genetic variance and the total phenotypic variance: H2=σ2
G/σ2Total, with
σ2Total=σ2
G+1/n×σ2e (with n the number of replicates per accession). Spearman coefficients estimated the correlations between H2 and σ2
G under drought and control conditions for the same trait.Average values per accession in each watering regime and location
were used for subsequent analyses. Plasticity was computed on the accession means as: ∆ki=(Dki–Cki)/Cki, with ∆ki the plasticity value for trait k and accession i, Dki the mean of trait k under drought condition for accession i, and Cki the mean of trait k under control condition for accession i.
Construction of kinship and structure matricesWe performed a principal co-ordinate analysis (PCoA) on the geno-type matrix. The co-ordinates of the accessions on the first three components are available in Supplementary Table S3 and displayed graphically in Supplementary Fig. S1. A kinship matrix (K) based on identity by state among the 6100 SNPs was estimated.
GWA mappingAverage values for each trait following the transformation giving the least skewed distribution were used in the mapping models. GWASs were performed using correction for population structure (PCoA) and modeling genetic variance with the kinship matrix (K). Two mixed models were implemented.
First, the bivariate multitrait mixed model (MTMM) developed by Korte et al. (2012) to take into account the correlation structure of multienvironment data sets and increase the detection power was implemented. The MTMM approach includes two different tests: (i) the ‘global test’ compared a model including only the genotype effect with a null model to identify markers with common effect between watering regimes (‘constitutive QTLs’); and (ii) the ‘G×W test’ compared a full model with a model including only the geno-type effect to identify markers with an interactive effect between the watering conditions (‘interactive QTLs’). SNPs with a P-value <10–4 were considered as significant. From each test, the percentage of variation explained by the marker (individual PVE for each signifi-cant marker) was computed.
Secondly, the univariate multilocus mixed model (MLMM) devel-oped by Segura et al. (2012) to increase the detection power for polygenic characters was used to identify associations for each trait under each watering regime (‘specific QTLs’) and for the ∆ values (‘interactive QTLs’). We implemented a new model selection crite-rion in the MLMM framework to allow for a more permissive detec-tion threshold to compromise between type I (false-positive) and type II (false-negative) errors, while limiting the number of cofactors selected to avoid overestimation of the P-values due to the relatively small size of the population. Models with a maximum of five cofac-tors all having a raw P-value <10–4 were retained. From the optimal model selected, the percentage variation explained by the selected markers (global PVE for all the significant markers) was computed for each trait.
For all the QTLs identified, we computed phenotypic effects under both watering conditions as: (Minor allele mean−Major allele mean)/2. Among the interactive QTLs, we distinguished between
at INR
A A
vignon on Novem
ber 18, 2016http://jxb.oxfordjournals.org/
Dow
nloaded from

6416 | Albert et al.
‘antagonist QTLs’ (effect changing direction according to the water-ing regime) and ‘differential QTLs’ (effect changing intensity accord-ing to the watering regime).
Linkage disequilibrium estimation and confidence interval definitionTo define intervals around QTLs, we used a strategy based on LD between pairs of markers inspired from Cormier et al. (2014). We used the r2 estimator implemented in the package ‘genetics’ (Warnes and Leisch, 2012) to assess LD between marker pairs. First, we per-formed LD calculation between 100 000 randomly chosen pairs of unlinked loci (on different chromosomes). The 95th percentile of the unlinked-r2 distribution equal to 0.28 was considered as the critical LD threshold. Then, for each significant marker, we computed LD with all the markers upstream and downstream on the same chro-mosome. We defined the lower (upper) boundary of the interval as the last marker downstream (upstream) on the chromosome that presented an LD with the significant marker above the ‘critical LD’ threshold. For the QTLs detected with the MTMM procedure, when two markers presented a LD higher than the LD threshold, we con-sidered them as a unique QTL. The number of genes within each interval was identified from the tomato genome (ITAG2.4).
Comparison between linkage and association QTLs and identification of candidate genesFor the comparison with the QTLs detected in the recombinant inbred lines (RILs) grown under the same conditions and pheno-typed for the same traits (Albert et al., 2016), we projected the QTLs detected in both populations onto the tomato genome (SL2.50). In the comparison, we considered related traits as a single trait: pH, malic acid, and citric acid contents were grouped as ‘acids’, and SSC, glucose, and fructose contents as ‘sugars’. Besides, whatever the QTL type (‘interactive’, ‘constitutive’, or ‘specific’) and the loca-tion of the trial, we considered that a single QTL was present when the intervals overlapped between RIL and GWA QTLs.
We then focused on the QTLs for vitamin C, sugar, and acid con-tent including <100 genes to identify putative candidate genes with a reasonable confidence. Under those QTLs, we refined the set of can-didates by selecting the genes expressed in tomato fruits according to gene expression data published by the Tomato Genome Consortium (2012). Then, we examined their functional annotations and focused on genes with annotations corresponding to related functions. Finally, we screened the polymorphism data obtained through the whole-genome resequencing of four accessions of our GWA popu-lation chosen to represent a large range of the molecular variabil-ity present in small fruit tomato (Causse et al., 2013): Cervil (13.3× sequence depth), Criollo (8.1×), LA1420 (12.5×), and Plovdiv (12.2×). First, we considered the nucleotide variants with moder-ate (non-synonymous polymorphisms in coding regions) to high (modification of splice sites or start/stop codons) effect on the pro-tein sequence (detected using SnpEff; Cingolani et al., 2012). Then, the predicted impacts of the variants on the protein function were assessed using the web interfaces of PROVEAN (http://provean.jcvi.org/seq_submit.php) (Choi and Chan, 2015).
Results
Dissection of the phenotypic variations in the GWA population
In the variance analysis, the part of the total variation attrib-uted to the genotype effect was predominant (35–80%, all P-values <0.001) compared with the one attributed to the genetic group (0–15%, all P-values <0.05) and the watering regime (0–28%, significant for 17 traits), except for leaf length
in Agadir and stem diameter in Avignon and Agadir (Fig. 1; Supplementary Table S5). For those vigour traits, the water-ing regime represented 48–61% of the total variation.
The genetic group by watering regime interactions repre-sented <2% of the total sum of squares for all traits and was non-significant for 12 traits. The eight significant traits were Diam.Aga, Leaf.Avi, Leaf.Aga, Ht.Avi, FW.Avi, FW.Aga, FIR.Aga, and VitCFM.Avi. Tukey’s post-hoc test indi-cated that these interactions were mainly driven by a sin-gular behavior of the SP group in response to water deficit (Supplementary Fig. S2). In contrast, the genotype by water-ing regime interaction represented 1–19% of the total varia-tion and was significant for all traits, except Flw.Avi, DMW.Avi, pH.Avi, and MalicFM.Avi. Interaction partitioning according to method 1 from Muir et al. (1992) indicated that the genotype by watering regime interactions were mainly due to accessions re-ranking across watering regimes (80–100%) and in a minor way to scale changes (0–20%, data not shown). The broad-sense heritabilities ranged from 30% for FructoseFM.Avi.D to 92% for FW.Avi.C. These values were correlated across watering regimes (rH
2=0.80), as well as the genetic variances (rσ
2G=0.99), confirming genotype re-rank-
ing across watering regimes (Fig. 1; Supplementary Table S5).
Impact of the water deficit on fruit quality and yield components
The RIL and GWA populations were grown in Avignon and Agadir in separate greenhouse trials over the years 2013 and 2014, while ensuring similar watering conditions (control and drought) (see Albert et al., 2016 for details concerning the RILs). On average, in both locations, water deficit impacted plant and fruit traits in the same direction in the GWA and RIL populations, with a decline in plant vigor, a decrease in yield, and a higher concentration of the metabolites in fruits (as a percentage of FM) (Table 1). However, when apply-ing the drought treatment, FW.Avi was decreased 2-fold and Nbfruits.Avi 9-fold in the RILs (FW.Avi, –37.7%; Nbfruits, –21.7%) compared with the GWA accessions (FW.Avi, –19.0%; Nbfruits, –2.5%). It resulted in a yield decrease reach-ing the level of –50% in the RILs against –20% in the GWA accessions. On the other hand, SSC, DMW, and VitCFM were more strongly enhanced in the RILs (SSC, +26.3%; DMW, +30.7%; and VitCFM, +26.3%) than in the GWA accessions (SSC, +12.6%; DMW, +11.4%; and VitCFM, +12.7%).
The correlation between fruit FW in control conditions (indicator of fruit size) and ∆FW was strongly negative in the GWA accessions (Avi, r= –0.55, P=2.70 × 10⁻¹²; Aga, r= –0.52, P=2.65 × 10⁻¹⁰), as was previously noted in the RILs. This indicated greater FW loss in larger fruited accessions under drought and increased metabolite contents resulting mainly from the reduced amount of water in the fruits. Thus, the differences observed between the populations may mostly reflect differences in fruit size, with larger fruits among the RILs (8–61 g, mean=20 g, SD=9 g) compared with the GWA accessions (2–46 g, mean=13 g, SD=10 g). Nevertheless, a larger range of variation was observed among the GWA accessions for ∆Yield.Avi and ∆Nbfruits.Avi compared with
at INR
A A
vignon on Novem
ber 18, 2016http://jxb.oxfordjournals.org/
Dow
nloaded from

Association mapping of tomato response to water deficit | 6417
the RILs (Fig. 2; Supplementary Figs S3, S4). In particular, 55 accessions exhibited an increased yield under drought in the GWA population against only two among the RILs. No noticeable geographic origin or genetic group was obvious among these 55 accessions of the GWA population (10 mix-ture, 43 SLC, and 2 SP).
When plotting ∆Nbfruits against ∆SSC in regard to fruit size and ∆FW.Avi, the RIL and GWA plants pre-sented different patterns (Fig. 2). Among the RILs, only 18 accessions were present in the top right quarter of the plot corresponding to accessions with increased SSC and Nbfruits under water deficit. Besides, all the top right quarter RILs had a negative ∆FW.Avi (blue and purple color) meaning a decreased FW under drought compared with the control condition for these accessions. On the other hand, 40% of the GWA accessions were present in the top right quarter of the plot and six of them had a positive ∆FW.Avi (magenta and red color) and small to medium fruit size (FW in control from 2 g to 28 g). Similar figures were obtained when considering fruit ascorbate
(Supplementary Fig. S5), malic acid, and citric acid con-tents (Supplementary Fig. S6).
QTL and QTL by watering regime interactions identified by association mapping
The MTMM mapping approach detected 53 unique associa-tions for 15 out of 27 phenotyped traits in the GWA pop-ulation with P-values <10–4 and percentages of variation explained varying from 5.45% to 18.22% (individual PVE per marker) (Supplementary Table S6). A total of 49 associa-tions were ‘constitutive’ irrespective of the watering regime. Among these associations, the most significant were observed for malic acid content, with P-values comprised between 2.40 × 10⁻⁶ and 1.33 × 10⁻¹³ in the global test (chromosomes 6 and 7) (Supplementary Fig. S7). Four associations were declared ‘interactive’ between the watering regimes, two for Flw.Avi (chromosomes 9 and 11) and two for GlucoseDM.Avi (chromosomes 4 and 5), with P-values ranging from 1.48 × 10⁻⁵ to 7.04 × 10⁻⁵ (Fig. 3).
Fig. 1. Dissection of the total phenotypic variation. For each phenotypic trait, the top figure displays the proportion of each effect in the total sum of squares: green for watering regime (W); dark blue for genetic group (Gr); light blue for genotype nested in genetic group [Gr(G)]; black for the interaction genetic group by watering regime (Gr×W); gray for the interaction genotype by watering regime [Gr(G)×W], and yellow for the residual. The table shows the significance of the P-value for the different effects: ***P<0.001, **P=0.001–0.01, *P=0.01–0.05, and ns >0.05. ‘H2 C’ and ‘H2 D’ indicate the broad-sense heritabilities in control and drought conditions, respectively.
at INR
A A
vignon on Novem
ber 18, 2016http://jxb.oxfordjournals.org/
Dow
nloaded from

6418 | Albert et al.
The MLMM approach identified a total of 124 asso-ciations (P <1 × 10⁻⁴) for the 27 studied phenotypic traits. Among them, 94 associations were ‘specific’ (39 and 55 to drought and control conditions, respectively), 23 ‘interac-tive’ (detected on ∆ values) and seven ‘constitutive’ (detected under both conditions; Supplementary Tables S7, S8). The explained percentages of phenotypic variation ranged from 8.16% (one SNP for Leaf.Aga.C) to 63.85% (six SNPs for SSC.Avi.D) (global PVE for all the significant markers for a trait). Constitutive and/or specific associations were observed for all the traits. The most significant P-values were associated ith MalicFM.Avi.D (S06_44955568: 1.88 × 10⁻¹⁹), MalicDM.Avi.D (S06_44955568: 1.27 × 10⁻¹⁷), pH.Avi (S04_66307772: 9.95 × 10⁻¹¹, Fig. 3), and SSC.Avi.C (S10_64149793: 5.96 × 10–
10). The 23 interactive SNPs were associated with 11 out of 27 traits. Their P-values ranged from 7.59 × 10⁻⁵ (∆Flw.Avi:
S06_36868039) to 2.75 × 10⁻¹¹ (∆FW.Aga: S11_50391249, Supplementary Fig. S8).
When gathering the associations obtained with MLMM and MTMM, 20 associations were detected in common (same trait and same QTL type), resulting in a total of 157 associations for the 27 traits (Supplementary Tables S6–S8). Sixteen associations were detected between twice and three times with related traits (‘acid’ and ‘sugar’ traits) and/or for the same trait in the two locations. Thus, a total of 141 different associations were identi-fied, spread unevenly over the genome (Table 2). Chromosomes carried out six (chromosomes 7 and 8) to 23 associations (chro-mosome 2; Supplementary Fig. S7). Thirty percent of the asso-ciations were ‘constitutive’ (44/141), 30% were ‘control specific’ (41/141), 22% were ‘drought specific’ (31/141), and 17% were ‘interactive’ (25/141). Among the interactive associations, 16 showed ‘differential’ effects (effect intensity changing according to watering regime) whereas nine presented ‘antagonist’ effects (effect direction changing according to watering regime). Up to 14, 24, and 28 different associations were mapped for vitamin C, ‘acid’, and ‘sugar’ content in fruit, respectively.
Confidence intervals and candidate gene selection under QTLs for fruit quality traits
We observed large differences in size and number of under-lying genes when drawing confidence intervals around the association peaks. Eighteen QTLs mapped around the weakly recombinant centromeres covered >10 Mbp and included between 410 and 2573 genes, whereas 84 QTLs cov-ered <5.5 Mbp and encompassed between one and 97 genes (Supplementary Fig. S9). In the RILs grown in the same con-ditions (Albert et al., 2016), only four QTLs covered <100 genes on a total of 56 QTLs. The comparison of the QTL positions between the RIL and GWA populations resulted in a total of 11 QTLs common to both populations (Table 2), whereas 45 were specific to the RILs and 130 to the GWA population (Supplementary Fig. S10).
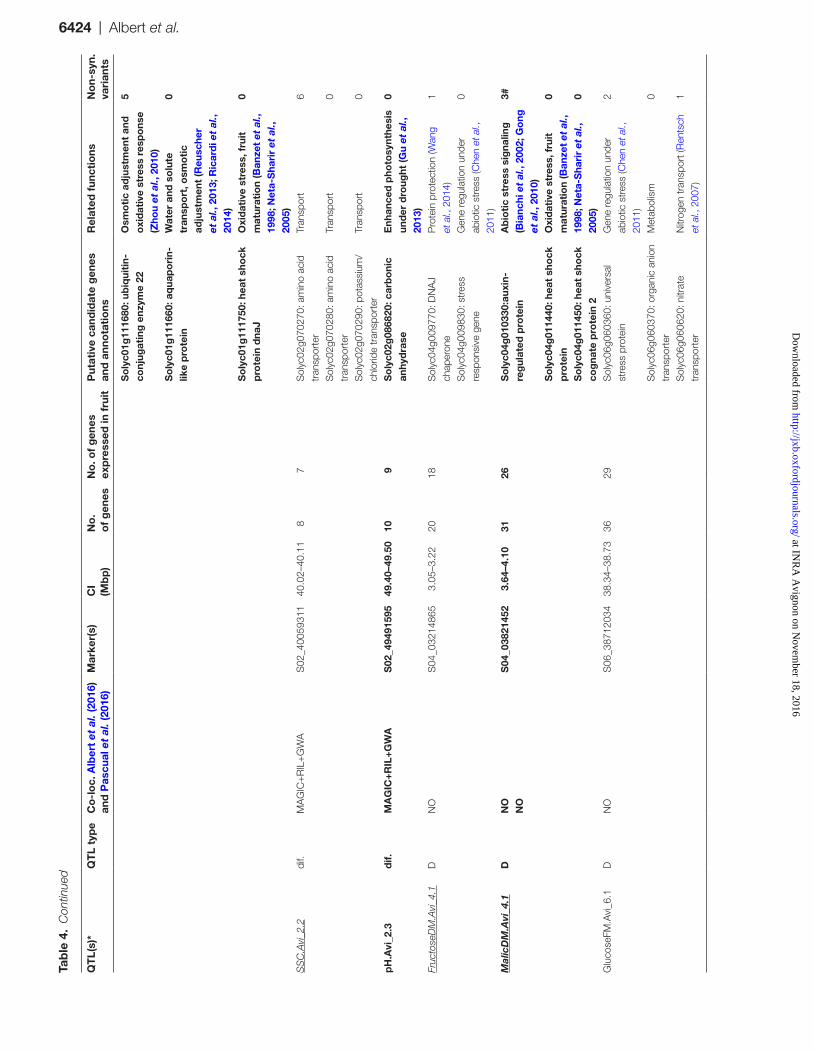
To propose putative candidate genes, we focused on QTLs for vitamin C, sugar, and acid contents in fruit including <100 genes (42 among 66 QTLs) and selected in their intervals genes showing expression in the fruits according to the data from the Tomato Genome Consortium (2012). This reduced the gene list to screen for between one and 87 genes depend-ing on the QTL intervals. Annotations were analyzed to iden-tify genes with functions related to vitamin C, sugar, or acid metabolism under ‘constitutive’ QTLs and functions related to primary metabolism and/or defense against abiotic stress under ‘specific’ and ‘interactive’ QTLs. A total of 41 puta-tive candidates were proposed for three ‘constitutive’ QTLs (Table 3) and 15 ‘interactive’ or ‘specific’ QTLs (Table 4). Of those genes, 22 were reported to have DNA polymorphisms in the four accessions of our GWA population which were re-sequenced by Causse et al. (2013). The polymorphisms in four of those genes were predicted to change the amino acids, affecting biological function of a protein.
From the 18 dissected QTLs, ‘SSC.Avi_9.1’ (control specific) probably corresponded to the cloned QTL ‘Brix9.2.5’ control-ling SSC in fruit and associated with a polymorphism in a cell
Table 1. Average relative difference between control and drought conditions for the fruit and plant traits measured in the GWA and RIL populations (%)
The average relative differences were computed as: (Mean Drought–Mean Control)/Mean Control.
Plant traits GWA RILa
Flw.Avi 0.0 –0.2Flw.Aga –0.6 +0.6Diam.Avi –27.5 –20.7Diam.Aga –37.4 –30.3Leaf.Avi –19.7 –13.4Leaf.Aga –31.8 –25.8Ht.Avi –5.1 –5.6Ht.Aga –4.2 +2.4Nbfruits.Avi –2.5 –21.7Fruit traits FW.Avi –19.0 –37.7FW.Aga –30.5 –25.4FIR.Avi –1.0 +3.4FIR.Aga +3.5 +0.8VitCFM.Avi +12.7 +26.3VitCDM.Avi +0.6 –8.9DMW.Avi +11.4 +30.7SSC.Avi +12.6 +26.3GlucoseFM.Avi +13.8 NAFructoseFM.Avi +17.7 NAGlucoseDM.Avi +0.5 NAFructoseDM.Avi +4.3 NApH.Avi –1.3 –3.2CitricFM.Avi +10.7 NAMalicFM.Avi –3.6 NACitricDM.Avi –1.2 NAMalicDM.Avi –14.8 NAYield.Avi –18.8 –50.3
aData for the RIL population were reported in Albert et al. (2016).DM, metabolite concentrations expressed relative to dry matter; FM, metabolite concentrations expressed relative to fresh matter; NA,traits not measured in the RIL population.Color scale:< –25 –25 to –5 –5 to 5 5 to 25 >25
at INR
A A
vignon on Novem
ber 18, 2016http://jxb.oxfordjournals.org/
Dow
nloaded from

Association mapping of tomato response to water deficit | 6419
Fig. 2. Impact of water deficit on yield, fruit number, fruit FW, and soluble solid content (SSC) in fruit. (A) and (B) Histograms of yield plasticity (∆Yield) in the GWA and RIL populations, respectively. (C) and (D) Relationship between plasticity of fruit number (∆Nbfruits) and plasticity of SSC (∆SSC), in view of FW plasticity (∆FW), in the GWA and RIL populations, respectively. In the bottom figures, the color scale indicates the variation in FW plasticity: blue for values below –0.5, purple for values between –0.25 and 0, magenta for values between 0 and 0.25, and red for values >0.5. The size of the points is proportional to the FW in control watering conditions.
wall invertase gene (Solyc09g010080: Lin5) (Fridman et al., 2000) (Table 4). A second QTL (‘Malic.Avi_6.3’) co-localized with a previously mapped QTL for acid content in fruit in different tomato populations and for which two ‘aluminum-activated malate transporter-like’ genes (Solyc06g072910 and Solyc06g072920) were pointed out as putative candidate genes by Sauvage et al. (2014) (Table 3). Although these two genes presented promising polymorphisms between our four re-sequenced accessions, they displayed a very low expression in fruit (Tomato Genome Consortium, 2012; personal data) and will need further validation to be clearly associated with the phenotypes.
Ten QTLs co-localized with loci identified in the RILs (Albert et al., 2016, control and drought conditions) and/or in the three tomato population analyzed by Pascual et al. (2016) (RIL, GWA, and MAGIC, control conditions) but for which no can-didate gene was proposed until now, while six were present in genomic regions where, to the best of our knowledge, no QTLs for related traits were mapped thus far. In the intervals of four of them, controlling vitamin C and fructose content in a drought-specific manner (‘VitCDM.Avi_1.1’, ‘FructoseDM.Avi_4.1’, and ‘FructoseDM.Avi_10.1’), three genes coding for ‘chaperone pro-teins dnaJ’ were identified (Solyc01g105340, Solyc04g009770, and Solyc10g078560; Table 4). Five more genes coding for
‘heat/cold shock proteins’ (Solyc01g111280, Solyc01g111300, Solyc01g111750, Solyc04g011440, and Solyc04g011450) were identified under antagonist and drought-specific QTLs for fructose and malic acid content (‘FructoseDM.Avi_1.1’ and ‘MalicDM.Avi_4.1’; Table 4).
Three constitutive QTLs, the first two on chromosome 7 con-trolling glucose and malic acid content and the third on chro-mosome 10 controlling fructose content, seemed particularly promising. The first two (‘GlucoseDM.Avi_7.2’ and ‘Malic.Avi.7_2’ in Table 3) shared a common interval including a gene coding for a ‘phosphoenolpyruvate carboxylase’ (Solyc07g062530: PEPC) and a gene coding for a ‘malate dehydrogenase’ (Solyc07g062650). The PEPC gene presented a non-synon-ymous polymorphism with a predicted impact on the protein function when comparing the four re-sequenced accessions. The third one (‘FructoseDM.Avi_10.2’ in Table 3) contained two genes coding for ‘cell wall invertases’, Lin6 (Solyc10g083290) and Lin8 (Solyc10g083300), presenting three non-synonymous polymorphisms between the re-sequenced accessions.
Discussion
To assess the extent of natural variation in tomato responses to water deficit, we phenotyped a collection of 141 small
at INR
A A
vignon on Novem
ber 18, 2016http://jxb.oxfordjournals.org/
Dow
nloaded from

6420 | Albert et al.
Fig. 3. Focus on QTLs detected for fruit quality traits at the bottom of chromosome 4. (A) Manhattan plot displaying the –log10(P-values) (y-axis) over genomic positions (x-axis) in a window of 1.46 Mbp corresponding to the common confidence interval of QTLs detected for VitCDM.Avi (MLMM control condition, blue), GlucoseDM.Avi (MTMM GxW test, purple), GlucoseFM.Avi (MLMM ∆, red), and pH.Avi (MLMM control, green) on chromosome 4 in the GWA population. P-values <10–4 were considered as significant (4 in logit values). The pairwise LD heatmap was drawn using the R package ‘snp.plotter’ (Luna and Nicodemus, 2007). (B) Box-plot of the allelic effects for the four associated markers: S04_65828262 (VitCDM, ‘control specific’), S04_65907012 (GlucoseFM, ‘antagonist’), S04_65908608 (GlucoseDM, ‘antagonist’), and S04_6630772 (pH, ‘control specific’). Blue: allelic effects under control conditions. Red: allelic effects under drought conditions.
at INR
A A
vignon on Novem
ber 18, 2016http://jxb.oxfordjournals.org/
Dow
nloaded from

Association mapping of tomato response to water deficit | 6421
Tab
le 2
. D
escr
iptio
n of
QTL
s de
tect
ed fo
r pl
ant a
nd fr
uit t
raits
in th
e G
WA
pop
ulat
ion
thro
ugh
asso
ciat
ion
map
ping
and
com
paris
on w
ith th
ose
dete
cted
in th
e R
IL p
opul
atio
n th
roug
h lin
kage
ana
lysi
s
QTL
s de
tect
ed in
the
GW
A p
opul
atio
n w
ere
clas
sifie
d ac
cord
ing
to th
eir
type
. QTL
s si
gnifi
cant
und
er b
oth
wat
erin
g re
gim
es a
re re
ferr
ed to
as
‘con
stitu
tive’
. QTL
s si
gnifi
cant
und
er o
ne
wat
erin
g re
gim
e on
ly (‘
cont
rol’
or ‘d
roug
ht’)
are
desi
gnat
ed a
s ‘s
peci
fic’.
QTL
s de
tect
ed w
ith th
e pl
astic
ity d
ata
and/
or w
ith th
e in
tera
ctio
n te
st a
re d
esig
nate
d as
‘int
erac
tive’
. For
eac
h ph
enot
ypic
trai
t and
eac
h Q
TL ty
pe, t
he n
umbe
r of
QTL
s, m
inim
um a
nd m
axim
um c
onfid
ence
inte
rval
(CI i
n M
bp o
n ge
nom
e as
sem
bly
v2.5
) and
min
imum
and
max
imum
num
ber
of g
enes
in
the
inte
rval
are
dis
play
ed. W
e co
nsid
ered
rela
ted
trai
ts a
s a
sing
le tr
ait:
pH, a
cid
mal
ic (D
M a
nd F
M),
and
acid
citr
ic (D
M a
nd F
M) w
ere
grou
ped
in ‘a
cids
’, as
wel
l as
SS
C, g
luco
se (D
M
and
FM),
and
fruct
ose
(DM
and
FM
) in
‘sug
ars’
. We
gath
ered
QTL
s de
tect
ed in
bot
h tr
ial l
ocat
ions
(Aga
dir
and
Avi
gnon
) for
the
sam
e tr
ait.
For
the
com
paris
on w
ith th
e R
IL p
opul
atio
n (re
sults
des
crib
ed in
Alb
ert e
t al.,
201
6), w
hate
ver
the
QTL
type
, we
cons
ider
ed th
at a
sin
gle
QTL
was
pre
sent
whe
n th
e C
I ove
rlapp
ed b
etw
een
RIL
and
GW
A Q
TLs.
Trai
tC
ons
titu
tive
QT
LS
pec
ific
QT
LIn
tera
ctiv
e Q
TL
Co
ntro
lD
roug
ht
Nb
QT
L to
tal
Nb
Chr
.M
in–M
ax C
I (M
pb
)M
in–M
ax
no. o
f g
enes
Co
m.
RIL
Nb
LGM
in–M
ax
CI (
Mp
b)
Min
–Max
no
. of
gen
esC
om
. R
ILN
bLG
Min
–Max
C
I (M
pb
)M
in–M
ax
No
. of
nes
Co
m.
RIL
Nb
an
t.N
b
diff
.LG
Min
–Max
C
I (M
pb
)M
in–M
ax
no. o
f g
enes
Co
m.
RIL
Pla
nt t
rait
s
Flw
102
1; 1
20.
08–0
.94
17–1
170
13
0.33
300
34;
5; 1
00.
00–5
9.94
1–16
531
04a
1; 6
; 9; 1
10.
06–1
6.69
7–94
0
Dia
m14
110
2.56
336
04
2; 5
; 6; 1
10.
14–3
.64
16–5
000
42;
4; 9
; 12
0.02
–36.
642–
600
13
22;
5; 6
0.02
–12.
802–
516
0
Leaf
126
1; 2
; 3;
11
0.03
–45.
301–
1147
12
2; 4
3.50
–4.8
623
2–46
31
31;
20.
08–9
.03
6–28
40
01
81.
6096
0
Ht
83
1; 2
; 30.
22–3
2.22
10–7
200
4b2;
3; 7
; 90.
10–5
.34
14–1
400
112
0.63
310
00
––
–0
Nbf
ruits
70
––
–0
44;
7;;1
1;12
0.34
-50.
4340
-741
03
9;10
1.28
-7.5
497
-819
00
0–
––
0
Frui
t tr
aits
FW6
2b2;
30.
07–1
.87
6 -
250
00
––
–0
12
31.3
367
70
12
1; 1
0; 1
10.
23–5
6.14
17–1
287
1
FIR
156b
1; 2
; 5;
6; 1
1
0.02
–32.
562–
858
07
1; 2
; 3; 5
;
9; 1
2
0.04
–48.
915–
928
02
4; 1
00.
04–6
5.29
4–25
731
00
––
–0
VitC
144
8; 9
; 10;
11
0.15
–8.5
018
–899
05
4; 7
; 9; 1
20.
27–4
1.12
18–7
960
41;
2; 4
; 11
0.08
–4.3
07–
494
10
110
0.26
390
DM
W2
0–
––
02
4; 9
0.01
–0.9
32–
137
00
––
–0
00
––
–0
Sug
ars
289c
4; 5
; 7;
8; 9
; 10;
11
0.07
–59.
3718
–160
20
53;
9; 1
10.
01–3
.34
2–41
72
71;
4; 6
;
10; 1
1
0.03
–2.6
25–
327
02
51;
2; 4
; 5; 1
10.
04–5
9.37
8–16
021
Aci
ds24
11c
5; 6
; 7;
8; 9
0.00
–2.0
91–
289
16
2; 3
; 4; 6
; 11
0.00
-0.9
31–
137
03
1; 4
; 60.
04–0
.47
6–31
03
12;
4; 1
0; 1
10.
09–6
4.21
10–2
427
0
Yie
ld1
0–
––
01
10.
3549
00
––
–0
00
––
–0
Tota
l14
144
241
331
49
162
Co
m. R
IL11
a Indi
catio
n of
inte
ract
ive
QTL
s co
nfirm
ed w
ith b
oth
plas
ticity
dat
a an
d in
tera
ctio
n te
st.
b Indi
catio
n of
QTL
s co
nfirm
ed in
bot
h lo
catio
ns, A
gadi
r an
d A
vign
on (w
ith th
e sa
me
type
: ‘co
nstit
utiv
e’, ‘
spec
ific’
, or
‘inte
ract
ive’
).c In
dica
tion
of Q
TLs
for
acid
s an
d su
gars
con
firm
ed w
ith s
ever
al m
easu
rem
ent m
etho
ds (p
H a
nd a
cid
cont
ent,
SS
C a
nd s
ugar
con
tent
).
at INR
A A
vignon on Novem
ber 18, 2016http://jxb.oxfordjournals.org/
Dow
nloaded from

6422 | Albert et al.
Tab
le 3
. P
utat
ive
cand
idat
e ge
nes
in th
e co
nfide
nce
inte
rval
aro
und
cons
titut
ive
GW
A Q
TLs
for
vita
min
C, s
ugar
. and
aci
d co
nten
t in
fruit.
We
focu
sed
on Q
TLs
enco
mpa
ssin
g <
100
gene
s. C
ompa
rison
s w
ith th
e Q
TLs
dete
cted
in A
lber
t et a
l. (2
016)
(RIL
und
er c
ontr
ol a
nd d
roug
ht c
ondi
tions
) and
Pas
cual
et a
l. (2
016)
(M
AG
IC, R
IL, a
nd G
WA
pop
ulat
ions
und
er c
ontr
ol c
ondi
tions
) for
rela
ted
trai
ts a
re in
dica
ted.
For
eac
h Q
TL, s
igni
fican
t mar
ker(s
), co
nfide
nce
inte
rval
(CI),
num
ber
of g
enes
in th
e in
terv
al,
and
amon
g th
em th
e nu
mbe
r of
gen
es w
hich
are
exp
ress
ed in
the
tom
ato
fruits
acc
ordi
ng to
gen
e ex
pres
sion
dat
a pu
blis
hed
by th
e To
mat
o G
enom
e C
onso
rtiu
m (2
012)
are
indi
cate
d.
Put
ativ
e ca
ndid
ate
gene
s ar
e pr
opos
ed o
n th
e ba
sis
of th
eir
expr
essi
on in
the
fruit,
thei
r fu
nctio
nal a
nnot
atio
n, a
nd th
e sc
ient
ific
liter
atur
e. ‘V
aria
nts’
dis
play
s th
e nu
mbe
r of
mod
erat
e (n
on-
syno
nym
ous
poly
mor
phis
ms
in c
odin
g re
gion
s) to
hig
h (m
odifi
catio
n of
spl
ice
site
s or
sta
rt/s
top
codo
ns) e
ffect
pol
ymor
phis
ms
iden
tified
from
the
rese
quen
cing
of f
our
acce
ssio
ns o
f the
G
WA
pop
ulat
ion
(Cau
sse
et a
l., 2
013)
. Var
iant
s w
hich
hav
e a
dele
terio
us im
pact
on
the
prot
ein
stru
ctur
e ac
cord
ing
to P
RO
VE
AN
are
indi
cate
d by
‘#’.
QT
L(s)
aQ
TL
typ
eC
o-l
oc.
Alb
ert
et a
l. (2
016)
and
Pas
cual
et
al.
(201
6)
Mar
ker(
s)C
I(M
bp
)N
o. o
f g
enes
No
. of
gen
es
exp
ress
ed in
fru
itP
utat
ive
cand
idat
e g
enes
an
d a
nno
tati
ons
Rel
ated
fun
ctio
nsN
on-
syn.
vari
ants
Mal
icD
M.A
vi_6
.3; M
alic
FM.
Avi
_6.3
C a
nd D
MA
GIC
+G
WA
S06
_449
5556
844
.92–
44.9
68
5S
olyc
06g0
7291
0: a
lum
inum
- ac
tivat
ed m
alat
e tr
ansp
orte
r-
likeb
Car
bo
n m
etab
olis
m a
nd
mal
ate
com
par
tmen
tati
on
(Mar
tino
ia a
nd R
ents
ch,
1995
; Sau
vag
e et
al.,
201
4)
1
Sol
yc06
g072
920:
alu
min
um-
activ
ated
mal
ate
tran
spor
ter-
lik
e b
2
Glu
cose
DM
.Avi
_7.1
; Mal
icD
M.
Avi
_7.2
; Mal
icFM
.Avi
_7.2
C a
nd D
MA
GIC
+G
WA
S07
_648
7819
5;
S07
_650
7966
764
.86–
65.6
097
87S
olyc
07g0
6253
0:
Pho
spho
enol
pyru
vate
car
boxy
lase
2
Mal
ic a
nd c
itric
aci
d ac
cum
ulat
ion
(Gui
llet e
t al.,
20
02)
1#
Sol
yc07
g062
650:
mal
ate
dehy
drog
enas
eC
arbo
n m
etab
olis
m a
nd
mal
ate
com
part
men
tatio
n (M
artin
oia
and
Ren
tsch
, 199
5)
0
Fruc
tose
DM
.Avi
_10.
2C
and
DN
OS
10_6
3163
119
63.1
0–63
.24
1816
So
lyc1
0g08
3290
: bet
a-
fruc
tofu
rano
sid
ase
inso
lub
le
iso
enzy
me
2 (L
in6)
Sug
ar m
etab
olis
m
(Fri
dm
an e
t al
., 20
04;
Pro
els
and
Ro
itsc
h, 2
009;
R
uan
et a
l., 2
010;
Li e
t al
., 20
12)
1
So
lyc1
0g08
3300
: bet
a-
fruc
tofu
rano
sid
ase
inso
lub
le
iso
enzy
me
2 (L
in8)
2
a QTL
nam
es m
ake
refe
renc
e to
the
map
repr
esen
tatio
n in
Sup
plem
enta
ry F
ig. S
7. T
hey
are
in u
nder
lined
whe
n th
ey w
ere
iden
tified
with
P-v
alue
s <
10–5
.b G
enes
poo
rly e
xpre
ssed
in th
e fru
it.
at INR
A A
vignon on Novem
ber 18, 2016http://jxb.oxfordjournals.org/
Dow
nloaded from

Association mapping of tomato response to water deficit | 6423
Tab
le 4
. P
utat
ive
cand
idat
e ge
nes
in th
e co
nfide
nce
inte
rval
aro
und
spec
ific
and
inte
ract
ive
GW
A Q
TLs
for
vita
min
C, s
ugar
and
aci
d co
nten
t in
fruit
We
focu
sed
on Q
TLs
enco
mpa
ssin
g <
100
gene
s. C
ompa
rison
s w
ith th
e Q
TLs
dete
cted
in A
lber
t et a
l. (2
016)
(RIL
und
er c
ontr
ol a
nd d
roug
ht c
ondi
tions
) and
Pas
cual
et a
l. (2
016)
(MA
GIC
, R
IL, a
nd G
WA
pop
ulat
ions
und
er c
ontr
ol c
ondi
tions
) for
rela
ted
trai
ts a
re in
dica
ted.
For
eac
h Q
TL, s
igni
fican
t mar
ker(s
), co
nfide
nce
inte
rval
(CI),
num
ber
of g
enes
in th
e in
terv
al, a
nd a
mon
g th
em n
umbe
r of
gen
es w
hich
are
exp
ress
ed in
the
tom
ato
fruits
acc
ordi
ng to
gen
e ex
pres
sion
dat
a pu
blis
hed
by th
e To
mat
o G
enom
e C
onso
rtiu
m (2
012)
are
indi
cate
d. P
utat
ive
cand
idat
e ge
nes
are
prop
osed
on
the
basi
s of
thei
r ex
pres
sion
in th
e fru
its, t
heir
func
tiona
l ann
otat
ion,
and
the
scie
ntifi
c lit
erat
ure.
‘Var
iant
s’ d
ispl
ays
the
num
ber
of m
oder
ate
(non
-syn
onym
ous
poly
mor
phis
ms
in c
odin
g re
gion
s) to
hig
h (m
odifi
catio
n of
spl
ice
site
s or
sta
rt/s
top
codo
ns) e
ffect
pol
ymor
phis
ms
iden
tified
from
the
rese
quen
cing
of f
our
acce
ssio
ns o
f the
GW
A p
opul
atio
n (C
auss
e et
al.,
201
3). V
aria
nts
whi
ch h
ave
a de
lete
rious
impa
ct o
n th
e pr
otei
n st
ruct
ure
acco
rdin
g to
PR
OV
EA
N a
re in
dica
ted
by ‘#
’.
QT
L(s)
*Q
TL
typ
eC
o-l
oc.
Alb
ert
et a
l. (2
016)
an
d P
ascu
al e
t al
. (20
16)
Mar
ker(
s)C
I(M
bp
)N
o.
of
gen
esN
o. o
f g
enes
ex
pre
ssed
in f
ruit
Put
ativ
e ca
ndid
ate
gen
es
and
ann
ota
tio
nsR
elat
ed f
unct
ions
No
n-sy
n.va
rian
ts
Citr
icD
M.A
vi_1
.1D
RIL
S01
_861
7473
986
.15–
86.2
06
6S
olyc
01g0
9472
0: v
esic
ular
gl
utam
ate
tran
spor
ter
Nitr
ogen
tran
spor
ter
(Ren
tsch
et a
l., 2
007)
1
Vit
CD
M.A
vi_1
.1D
NO
S01
_937
0206
893
.47–
93.7
642
36S
oly
c01g
1053
40: c
hap
ero
ne
pro
tein
dna
JP
rote
in p
rote
ctio
n (W
ang
et
al.,
201
4)0
So
lyc0
1g10
5540
: 2-
oxo
glu
tara
te/m
alat
e tr
ansl
oca
tor
Car
bo
n m
etab
olis
m a
nd
mal
ate
com
par
tmen
tati
on
(Mar
tino
ia a
nd R
ents
ch,
1995
)
0
So
lyc0
1g10
5630
: cal
mo
dul
inO
smo
tic
adju
stm
ent
and
str
ess
sig
nalin
g in
in
tera
ctio
n w
ith
cellu
lar
calc
ium
(Per
ruc
et a
l.,
2004
; Red
dy
et a
l., 2
011)
1
SS
C_A
vi_1
.2D
MA
GIC
S01
_962
2684
596
.22–
96.2
57
5S
olyc
01g1
0922
0: m
itoch
ondr
ial
impo
rt re
cept
orO
xida
tive
stre
ss (F
rank
et a
l.,
2007
)1#
Fruc
tose
DM
.Avi
_1.1
ant.
MA
GIC
S01
_978
7755
197
.43–
97.9
979
61S
oly
c01g
1112
80: c
old
sho
ck
pro
tein
-1P
rote
in p
rote
ctio
n un
der
sa
lt a
nd d
roug
ht s
tres
s (K
im e
t al
., 20
13)
2
So
lyc0
1g11
1300
: co
ld s
hock
p
rote
in-1
0
So
lyc0
1g11
1320
: tha
umat
in-
like
pro
tein
Sw
eet-
tast
ing
pro
tein
, su
gar
acc
umul
atio
n an
d
pla
nt d
efen
se (K
im e
t al
., 20
02; P
etre
et
al.,
2011
)
0
So
lyc0
1g11
1330
: tha
umat
in-
like
pro
tein
0
So
lyc0
1g11
1510
: Asc
orb
ate
per
oxi
das
eS
oly
c01g
1115
10: A
sco
rbat
e p
ero
xid
ase
So
lyc0
1g11
1510
: asc
orb
ate
per
oxi
das
eO
xid
ativ
e st
ress
(P
igno
cchi
et
al.,
2006
)0
So
lyc0
1g11
1630
: gly
oxy
late
/ hy
dro
xyp
yruv
ate
red
ucta
se B
Rec
yclin
g f
atty
aci
ds
into
g
luco
se (C
orn
ah e
t al
., 20
04)
0
at INR
A A
vignon on Novem
ber 18, 2016http://jxb.oxfordjournals.org/
Dow
nloaded from
6424 | Albert et al.
QT
L(s)
*Q
TL
typ
eC
o-l
oc.
Alb
ert
et a
l. (2
016)
an
d P
ascu
al e
t al
. (20
16)
Mar
ker(
s)C
I(M
bp
)N
o.
of
gen
esN
o. o
f g
enes
ex
pre
ssed
in f
ruit
Put
ativ
e ca
ndid
ate
gen
es
and
ann
ota
tio
nsR
elat
ed f
unct
ions
No
n-sy
n.va
rian
ts
So
lyc0
1g11
1680
: ub
iqui
tin-
co
njug
atin
g e
nzym
e 22
Osm
oti
c ad
just
men
t an
d
oxi
dat
ive
stre
ss r
esp
ons
e (Z
hou
et a
l., 2
010)
5
So
lyc0
1g11
1660
: aq
uap
ori
n-
like
pro
tein
Wat
er a
nd s
olu
te
tran
spo
rt, o
smo
tic
adju
stm
ent
(Reu
sche
r et
al.,
201
3; R
icar
di e
t al
., 20
14)
0
So
lyc0
1g11
1750
: hea
t sh
ock
p
rote
in d
naJ
Oxi
dat
ive
stre
ss, f
ruit
m
atur
atio
n (B
anze
t et
al.,
19
98; N
eta-
Sha
rir
et a
l.,
2005
)
0
SS
C.A
vi_2
.2di
f.M
AG
IC+
RIL
+G
WA
S02
_400
5931
140
.02–
40.1
18
7S
olyc
02g0
7027
0: a
min
o ac
id
tran
spor
ter
Tran
spor
t6
Sol
yc02
g070
280:
am
ino
acid
tr
ansp
orte
rTr
ansp
ort
0
Sol
yc02
g070
290:
pot
assi
um/
chlo
ride
tran
spor
ter
Tran
spor
t0
pH
.Avi
_2.3
dif.
MA
GIC
+R
IL+
GW
AS
02_4
9491
595
49.4
0–49
.50
109
So
lyc0
2g08
6820
: car
bo
nic
anhy
dra
seE
nhan
ced
pho
tosy
nthe
sis
und
er d
roug
ht (G
u et
al.,
20
13)
0
Fruc
tose
DM
.Avi
_4.1
DN
OS
04_0
3214
865
3.05
–3.2
220
18S
olyc
04g0
0977
0: D
NA
J ch
aper
one
Pro
tein
pro
tect
ion
(Wan
g et
al.,
201
4)1
Sol
yc04
g009
830:
str
ess
resp
onsi
ve g
ene
Gen
e re
gula
tion
unde
r ab
iotic
str
ess
(Che
n et
al.,
20
11)
0
Mal
icD
M.A
vi_4
.1D
NO
NO
S04
_038
2145
23.
64–4
.10
3126
So
lyc0
4g01
0330
:aux
in-
reg
ulat
ed p
rote
inA
bio
tic
stre
ss s
igna
ling
(B
ianc
hi e
t al
., 20
02; G
ong
et
al.,
201
0)
3#
So
lyc0
4g01
1440
: hea
t sh
ock
p
rote
inO
xid
ativ
e st
ress
, fru
it
mat
urat
ion
(Ban
zet
et a
l.,
1998
; Net
a-S
hari
r et
al.,
20
05)
0
So
lyc0
4g01
1450
: hea
t sh
ock
co
gna
te p
rote
in 2
0
Glu
cose
FM.A
vi_6
.1D
NO
S06
_387
1203
438
.34–
38.7
336
29S
olyc
06g0
6036
0: u
nive
rsal
st
ress
pro
tein
Gen
e re
gula
tion
unde
r ab
iotic
str
ess
(Che
n et
al.,
20
11)
2
Sol
yc06
g060
370:
org
anic
ani
on
tran
spor
ter
Met
abol
ism
0
Sol
yc06
g060
620:
nitr
ate
tran
spor
ter
Nitr
ogen
tran
spor
t (R
ents
ch
et a
l., 2
007)
1
Tab
le 4
. C
ontin
ued
at INR
A A
vignon on Novem
ber 18, 2016http://jxb.oxfordjournals.org/
Dow
nloaded from

Association mapping of tomato response to water deficit | 6425
QT
L(s)
*Q
TL
typ
eC
o-l
oc.
Alb
ert
et a
l. (2
016)
an
d P
ascu
al e
t al
. (20
16)
Mar
ker(
s)C
I(M
bp
)N
o.
of
gen
esN
o. o
f g
enes
ex
pre
ssed
in f
ruit
Put
ativ
e ca
ndid
ate
gen
es
and
ann
ota
tio
nsR
elat
ed f
unct
ions
No
n-sy
n.va
rian
ts
Fru
ctos
eFM
.Avi
_6.1
DN
OS
06_4
2161
946
42.0
0–42
.20
2819
So
lyc0
6g06
6820
: gib
ber
ellin
3-
bet
a-hy
dro
xyla
seW
ater
sta
tus
and
red
uced
tr
ansp
irat
ion
(Nir
et
al.,
2014
)
2
VitC
FM.A
vi_7
.1C
NO
-S
07_0
2439
123
2.29
–2.5
625
24S
olyc
07g0
0779
0: s
ucro
se
phos
phat
e sy
ntha
seS
ugar
com
part
men
tatio
n,
sink
str
engt
h (N
guye
n-Q
uoc
and
Foye
r, 20
01)
1
SS
C.A
vi_9
.1C
MA
GIC
+R
IL+
GW
AS
09_0
3477
979
0.34
–0.3
52
2S
oly
c09g
0100
80: b
eta-
fr
ucto
fura
nosi
das
e, in
solu
ble
is
oen
zym
e 1
(Lin
5)
Sug
ar m
etab
olis
m, h
eat
and
dro
ught
to
lera
nce
(Fri
dm
an e
t al
., 20
04;
Zan
or
et a
l., 2
009a
; Rua
n et
al.,
201
0; L
i et
al.,
2012
)
4
So
lyc0
9g01
0090
: bet
a-
fruc
tofu
rano
sid
ase
inso
lub
le
iso
enzy
me
2 (L
in7)
1
VitC
FM.A
vi_1
0.1
dif.
NO
-S
10_0
0934
508
0.08
–0.1
139
38S
olyc
10g0
0613
0: e
thyl
ene
resp
onsi
ve T
rFA
biot
ic s
tres
s si
gnal
ing
(Pan
et
al.,
201
2)1
Fru
ctos
eDM
.A
vi_1
0.1
DN
OS
10_6
0291
460
60.1
2–60
.37
3130
So
lyc1
0g07
8370
: aux
in e
fflux
ca
rrie
rA
bio
tic
stre
ss s
igna
ling
(B
ianc
hi e
t al
., 20
02; G
ong
et
al.,
201
0)
0
So
lyc1
0g07
8490
: aq
uap
ori
nW
ater
and
so
lute
tr
ansp
ort
, osm
oti
c ad
just
men
t (R
eusc
her
et a
l., 2
013;
Ric
ard
i et
al.,
2014
)
0
So
lyc1
0g07
8560
: cha
per
one
p
rote
in d
naJ
Pro
tein
pro
tect
ion
(Wan
g
et a
l., 2
014)
1#
Fruc
tose
FM.A
vi_1
1.3
DM
AG
ICS
11_5
2838
456
52.8
0–52
.84
55
Sol
yc11
g067
050:
neu
tral
in
vert
ase
Sug
ar m
etab
olis
m, h
eat a
nd
drou
ght t
oler
ance
(Rua
n et
al.,
201
0; L
i et a
l., 2
012)
1
a QTL
nam
es m
ake
refe
renc
e to
the
map
repr
esen
tatio
n in
Sup
plem
enta
ry F
ig. S
7. T
hey
are
in u
nder
lined
whe
n th
ey w
ere
iden
tified
with
P-v
alue
s <
10–5
.
Tab
le 4
. C
ontin
ued
at INR
A A
vignon on Novem
ber 18, 2016http://jxb.oxfordjournals.org/
Dow
nloaded from
6426 | Albert et al.
fruit accessions for plant and fruit traits, under control and drought conditions. Using 6100 SNPs genotyped over the genome, we achieved association mapping using univariate and bivariate mixed models. QTLs, QTL by watering regime interactions, and putative candidate genes were identified. This study, in combination with the results reported in RILs grown under the same watering conditions, contributed to a first detailed characterization of the genetic variations and genomic determinants of response to water deficit in tomato.
Improving fruit quality while maintaining yield in tomato under water limitation
Deficit irrigation strategies aiming to reduce non-beneficial water consumption while maximizing fruit quality and mini-mizing yield losses are studied in horticultural production to address environmental issues and market expectations simulta-neously. It seems particularly relevant for tomato since consum-ers complain about lack of taste in the new varieties (Bruhn et al., 1991; Causse et al., 2010). In our trials, after a decrease in 60% of the water supply throughout plant growth, we observed on average reduced plant vigor and yield, while fruit quality was improved or stable depending on whether metabolite concentra-tions were expressed relative to FM or DM. This antagonistic relationship between quality and yield performances confirmed the results obtained in RILs (Albert et al., 2016) and the ten-dencies reported by other authors in tomato (Guichard et al., 2001; Kirda et al., 2004; Zheng et al., 2013), peach (Mirás-Avalos et al., 2013), or grapevine (Santesteban and Royo, 2006).
Nevertheless, 50 accessions (with small to medium fruit size) had both improved fruit quality and maintained yield (or even improved) under water deficit compared with the control water-ing regime, although their vigor (measured through leaf length and stem diameter) was decreased. These accessions empha-sized the opportunity to increase metabolite content in tomato fruits using deficit irrigation without achieving parallel limita-tion of the yield. In contrast, no RIL presented such a response to the water deficit treatment, and the increased sugar and acid contents observed reflected mainly concentration effects due to a decreased amount of water in fruit (Albert et al., 2016).
The large phenotypic variations observed mainly resulted from genotype effects (35–80%) and less from genotype by watering regime interactions (1–19%). The watering regime effect represented a significant part of the total phenotypic variability (up to 40%) only for stem diameter and leaf length. This suggests that tomato plants buffer the negative effect of water limitation by limiting their vegetative growth and real-locating the photo-assimilates to the fruits (Lemoine et al., 2013; Osorio et al., 2014).
Benefits and limits of GWA to dissect the genetic architecture of response to water deficit in tomato
Association studies aiming to identify alleles whose effects are modulated by environmental conditions are still few in plants. To date, such studies were only reported in Arabidopsis thaliana (Li et al., 2010; Morrison and Linder, 2014; El-Soda et al., 2015; Sasaki et al., 2015), and maize (Saïdou et al.,
2014). Explicitly accounting for ‘QTL by environment inter-actions’ in QTL studies can help to discover novel genes that act synergistically with the environment, potentially leading to the identification of superior genotypes according to the environments (Des Marais et al., 2013).
We identified a total of 141 QTLs with low to medium effects. The phenotyped traits were strongly polygenic and justified the use of a multilocus GWA mapping model (MLMM: Segura et al., 2012). In particular, up to 14, 24, and 28 different QTLs were identified for vitamin C, acid, and sugar content, respectively. Among the loci identified, 51% were specific to one watering condition, 31% were constitu-tive and detected whatever the condition, and 18% were inter-active between the watering conditions. These proportions of QTL types are relatively similar to those reported in the RILs grown in the same conditions (Albert et al., 2016) and in the study of Gur et al. (2011) on tomato introgression lines. However, while most of the interactive QTLs identified in the RILs presented antagonist effects, a majority of differential effects was observed in the GWA study. These discrepancies between both populations may reflect their different genetic basis: the RILs segregate between a small- and a large-fruited accession, whereas the GWA collection focuses on the poly-morphisms between several diverse small-fruited accessions.
Because of the large number of markers to be used in GWA analysis, it is not straightforward to choose an appro-priate significance threshold controlling for false positives while maintaining the statistical power. We thus opted for a lowered threshold of 10–4. If we used Bonferroni correction usually applied to exclude false positives, we should have used a significance threshold of 10–5. This would reduce the num-ber of associations detected to 69 (nine ‘interactive’, 44 ‘spe-cific’, and 16 ‘constitutive’). With this stringent threshold, we would not have recovered some well-described tomato QTLs, such as, for example, FW11.2 and FW11.3 on chro-mosome 11 (fruit FW QTLs: Huang and van der Knaap, 2011; Illa-Berenguer et al., 2015). The need for more permis-sive thresholds in GWASs is often claimed. Strategies based on enrichment tests using known candidate genes from the literature to evaluate the false-positive rate and choose the appropriate threshold values are proposed (Atwell et al., 2010; Sasaki et al., 2015). However, these approaches are lim-ited to well-annotated model genomes and simple traits with already well-described genetic architecture. Another solution to solve the multiple testing issues could be to use haplotypes instead of individual markers to minimize the number of tests, especially in species where the LD spans large genomic regions (Bader, 2001; McClurg et al., 2006). This has already been successfully applied in crops (Gawenda et al., 2015) and would be worth testing in tomato, but may need more mark-ers to identify haplotypes correctly.
The projection of the QTL intervals onto the physical map of tomato allowed the comparison of QTL positions between the RIL and GWA population even though they were geno-typed with different markers. This projection resulted in a total of 11 QTLs conserved between both populations. On the other hand, 45 were specific to the RIL population and 130 to the GWA population. This may seem like a relatively
at INR
A A
vignon on Novem
ber 18, 2016http://jxb.oxfordjournals.org/
Dow
nloaded from

Association mapping of tomato response to water deficit | 6427
small number of common QTLs between the populations, but the RIL parental accessions reflected only a limited frac-tion of the genetic variation present in the GWA population.
Searching for candidate genes under QTLs for fruit quality traits
Our approach, combining linkage and association mapping, was powerful in recovering previously identified loci associ-ated with fruit quality. As an example, we mapped a QTL associated with fruit fructose content on chromosome 9 which included in its interval the gene Lin5 (Solyc09g010080) known to encode a cell wall invertase affecting tomato fruit sugar content (Fridman et al., 2000). Apart from recovering previously described genes, we identified QTLs in genomic regions where QTLs associated with related traits were previ-ously identified in other populations but for which no candi-date gene was proposed until now (probably because of too large confidence intervals) or in genomic regions where, to the best of our knowledge, no QTL was reported for related traits thus far. The confidence intervals around the asso-ciation peaks obtained using an LD-based approach were mostly shorter (1–97 genes for 84 intervals) compared with the intervals obtained using the RILs or introgression lines (Semel et al., 2007; Gur et al., 2011; Arms et al., 2015).
Combining publicly available expression data (Tomato Genome Consortium, 2012), exonic variants gained from re-sequencing of four accessions of the GWA collection (Causse et al., 2013) and functional analysis of the gene annotations in the confidence intervals, we proposed 41 putative candidate genes under three constitutive QTLs and 15 interactive or specific QTLs. Under the interactive and specific QTLs, genes related to protein protection (chaperone and heat/cold shock proteins), water and solute transport (aquaporins and others transporters), sugar metabolism (sucrose phosphate synthase and invertases), and hormonal signaling (auxin, gibberellin, and ethylene) were identified and may play a crucial role in responses to water deficit (Wang et al., 2003; Shinozaki and Yamaguchi-Shinozaki, 2007). Some of them presented poly-morphisms with predicted impacts on the protein function when comparing the re-sequenced accessions and constitute promising targets for future functional validations.
On the bottom of chromosome 7, two QTLs, controlling glucose and malic acid content, shared a common interval including a gene coding for a ‘phosphoenolpyruvate carboxy-lase’ (PEPC) and a gene coding for a ‘malate dehydrogenase’. The PEPC gene presented a non-synonymous polymorphism with a predicted impact on the protein function in the four re-sequenced accessions. As the PEPC is catalyzing the carbox-ylation of the phosphoenolpyruvate arising from glycolysis into oxaloacetate which is then converted into malate by the malate dehydrogenase or enters the Krebs cycle (Guillet et al., 2002), this gene constitutes a likely candidate. Nevertheless, although if the ‘malate dehydrogenase’ gene did not pre-sent any exonic SNPs in our data, it remains an interesting candidate as our four re-sequenced accessions probably did not represent the full genetic diversity present in the GWA population, and the phenotypic variations observed may
result from regulation change more than modifications of the protein. On the bottom of chromosome 10, a QTL interval controlling fructose content contained two genes coding for ‘cell wall invertases’ (Lin6 and Lin8). Both genes presented non-synonymous polymorphisms between the re-sequenced accessions. In contrast to Lin5 on chromosome 9, Lin6 and Lin8 have not yet been associated with variation in sugar con-tent in fruit. Cell wall invertases are extracellular hydrolases which cleave sucrose to glucose and fructose, which are then transported into the cell. They play a central role in regulat-ing, amplifying, and integrating different signals that lead to the source–sink transition in plants.
Subsequent analyses based on either fine mapping around the candidate genes using target re-sequencing approach or functional validation, for example by genome editing, could clarify the involvement of these genes in the phenotypic vari-ations observed.
Supplementary data
Supplementary data are available at JXB onlineFig. S1. Structuration observed in the GWA population
based on principal co-ordinate analysis (PCoA) on data of 6100 SNPs.
Fig. S2. Box-plot of the mean distribution for the nine traits that showed a significant genetic group by watering regime interaction in the ANOVAs.
Fig. S3. Distribution of the accession means for plant traits in the GWA population grown under two watering regimes..
Fig. S4. Distribution of the accession means for fruit traits in the GWA population grown under two watering regimes.
Fig. S5. Relationship between plasticity of fruit number and plasticity of vitamin C content in fruit, in view of the fruit FW plasticity, in the GWA and RIL populations, respectively.
Fig. S6. Relationship between plasticity of fruit number and plasticity of citric and malic acid content in fruit (rela-tive to FW), in view of the fruit FW plasticity, in the GWA population.
Fig. S7. Physical map of the QTLs detected in the GWA and RIL populations.
Fig. S8. Example of co-localizations between GWA and RIL QTLs for soluble solid content and fruit FW on the bot-tom of chromosome 11.
Fig. S9. Confidence interval (CI) sizes and numbers of genes underlying the QTLs in the GWA and RIL populations.
Fig. S10. Venn diagram representing common QTLs between the RIL population (linkage mapping) and the GWA population (association mapping).
Table S1. Genetic and phenotypic description of the acces-sions in the GWA population.
Table S2. Genotypic data in the GWA population. Table S3. Principal co-ordinates analysis in the GWA
population.Table S4. Correlations between Avignon and Agadir trials. Table S5. Effect of watering regime (W), genetic group
(Gr), genotype nested in genetic group [Gr(G)] and the inter-actions [Gr×W and Gr(G)×W] on the plant and fruit traits measured in the GWA population.
at INR
A A
vignon on Novem
ber 18, 2016http://jxb.oxfordjournals.org/
Dow
nloaded from

6428 | Albert et al.
Table S6. QTLs identified under both watering regimes (‘Control’ and ‘Drought’) using the bivariate multitrait mixed model (MTMM) genome-wide association mapping approach.
Table S7. QTLs identified under each watering regime (‘Control’ and ‘Drought’) using the univariate multilocus mixed model (MLMM) genome-wide association mapping approach.
Table S8. QTLs identified for plasticity data each [(Drought–Control)/Control] using the univariate multilocus mixed model (MLMM) genome-wide association mapping approach.
AcknowledgementsWe acknowledge the experimental teams of UR-GAFL and Gautier SEMENCES for their collaboration in implementing the experimentations. We particularly thank Yolande Carretero, Esther Pelpoir, Romain Novaretti, Doriane Bancel, and the employees of ‘Domaine Margau’ (Agadir) for their help in phenotyping. Thanks to Christopher Sauvage for proofreading and script sharing. The CTPS project TOMSEC supported this work. EA was supported by an INRA PhD fellowship. EA conducted experiments in France, analyzed data, and wrote the manuscript. VS developed scripts for the GWA mapping. JG sampled and collected phenotypic data in France. JB and LD supervised sample collection and phenotypic measurements in Morocco. MC supervised the project, built the experimental design, and revised the manuscript. All authors discussed the results and commented on the manuscript. The authors declare no conflict of interest in the authorship and publication of this document.
ReferencesAlbacete A, Martínez-Andújar C, Pérez-Alfocea F. 2014. Hormonal and metabolic regulation of source–sink relations under salinity and drought: from plant survival to crop yield stability. Biotechnology Advances 32, 12–30.
Albert E, Gricourt J, Bertin N, Bonnefoi J, Pateyron S, Tamby J-P, Bitton F, Causse M. 2016. Genotype by watering regime interaction in cultivated tomato: lessons from linkage mapping and gene expression. Theoretical and Applied Genetics 129, 395–418.
Arms EM, Bloom AJ, St Clair DA. 2015. High-resolution mapping of a major effect QTL from wild tomato Solanum habrochaites that influences water relations under root chilling. Theoretical and Applied Genetics 128, 1713–1724.
Atwell S, Huang YS, Vilhjálmsson BJ, et al. 2010. Genome-wide association study of 107 phenotypes in a common set of Arabidopsis thaliana inbred lines. Nature 465, 627–631.
Aulchenko YS, Ripke S, Isaacs A, van Duijn CM. 2007. GenABEL: an R library for genome-wide association analysis. Bioinformatics 23, 1294–1296.
Bac-Molenaar JA, Granier C, Keurentjes JJB, Vreugdenhil D. 2016. Genome-wide association mapping of time-dependent growth responses to moderate drought stress in Arabidopsis. Plant, Cell and Environment 39, 88–102.
Bader JS. 2001. The relative power of SNPs and haplotype as genetic markers for association tests. Pharmacogenomics 2, 11–24.
Banzet N, Richaud C, Deveaux Y, Kazmaier M, Gagnon J, Triantaphylidès C. 1998. Accumulation of small heat shock proteins, including mitochondrial HSP22, induced by oxidative stress and adaptive response in tomato cells. The Plant Journal 13, 519–527.
Barnabas B, Jager K, Feher A. 2007. The effect of drought and heat stress on reproductive processes in cereals. Plant, Cell and Environment 31, 11–38.
Bianchi MW, Damerval C, Vartanian N. 2002. Identification of proteins regulated by cross-talk between drought and hormone pathways in Arabidopsis wild-type and auxin-insensitive mutants, axr1 and axr2. Functional Plant Biology 29, 55.
Blanca J, Montero-Pau J, Sauvage C, Bauchet G, Illa E, Díez MJ, Francis D, Causse M, van der Knaap E, Cañizares J. 2015. Genomic variation in tomato, from wild ancestors to contemporary breeding accessions. BMC Genomics 16, 257.
Brachi B, Faure N, Horton M, Flahauw E, Vazquez A, Nordborg M, Bergelson J, Cuguen J, Roux F. 2010. Linkage and association mapping of Arabidopsis thaliana flowering time in nature. PLoS Genetics 6, e1000940.
Bruhn CM, Feldman N, Garlitz C, Harwood J, Ivans E, Marshall M, Riley A, Thurber D, Williamson E. 1991. Consumer perceptions of quality: apricots, cantaloupes, peaches, pears, strawberries and tomatoes. Journal of Food Quality 14, 187–195.
Capel C, Fernández del Carmen A, Alba JM, et al. 2015. Wide-genome QTL mapping of fruit quality traits in a tomato RIL population derived from the wild-relative species Solanum pimpinellifolium L. Theoretical and Applied Genetics 128, 2019–2035.
Causse M, Desplat N, Pascual L, et al. 2013. Whole genome resequencing in tomato reveals variation associated with introgression and breeding events. BMC Genomics 14, 791.
Causse M, Friguet C, Coiret C, LePicier M, Navez B, Lee M, Holthuysen N, Sinesio F, Moneta E, Grandillo S. 2010. Consumer preferences for fresh tomato at the European scale: a common segmentation on taste and firmness. Journal of Food Science 75, S531–S541.
Causse M, Saliba-Colombani V, Lesschaeve I, Buret M. 2001. Genetic analysis of organoleptic quality in fresh market tomato. 2. Mapping QTLs for sensory attributes. Theoretical and Applied Genetics 102, 273–283.
Chaves MM, Santos TP, Souza CR, Ortuño MF, Rodrigues ML, Lopes CM, Maroco JP, Pereira JS. 2007. Deficit irrigation in grapevine improves water-use efficiency while controlling vigour and production quality. Annals of Applied Biology 150, 237–252.
Chen H, Zhang B, Hicks LM, Xiong L. 2011. A nucleotide metabolite controls stress-responsive gene expression and plant development. PLoS One 6, e26661.
Choi Y, Chan AP. 2015. PROVEAN web server: a tool to predict the functional effect of amino acid substitutions and indels. Bioinformatics 31, 2745–2747.
Cingolani P, Platts A, Wang LL, Coon M, Nguyen T, Wang L, Land SJ, Lu X, Ruden DM. 2012. A program for annotating and predicting the effects of single nucleotide polymorphisms, SnpEff: SNPs in the genome of Drosophila melanogaster strain w 1118; iso-2; iso-3. Fly 6, 80–92.
Cormier F, Le Gouis J, Dubreuil P, Lafarge S, Praud S. 2014. A genome-wide identification of chromosomal regions determining nitrogen use efficiency components in wheat (Triticum aestivum L.). Theoretical and Applied Genetics 127, 2679–2693.
Cornah JE, Germain V, Ward JL, Beale MH, Smith SM. 2004. Lipid utilization, gluconeogenesis, and seedling growth in Arabidopsis mutants lacking the glyoxylate cycle enzyme malate synthase. Journal of Biological Chemistry 279, 42916–42923.
Costa JM, Ortuño MF, Chaves MM. 2007. Deficit irrigation as a strategy to save water: physiology and potential application to horticulture. Journal of Integrative Plant Biology 49, 1421–1434.
Des Marais DL, Hernandez KM, Juenger TE. 2013. Genotype-by-environment interaction and plasticity: exploring genomic responses of plants to the abiotic environment. Annual Review of Ecology, Evolution, and Systematics 44, 5–29.
Des Marais DL, McKay JK, Richards JH, Sen S, Wayne T, Juenger TE. 2012. Physiological genomics of response to soil drying in diverse Arabidopsis accessions. The Plant Cell 24, 893–914.
Durán Zuazo VH, Pleguezuelo CRR, Tarifa DF. 2011. Impact of sustained-deficit irrigation on tree growth, mineral nutrition, fruit yield and quality of mango in Spain. Fruits 66, 257–268.
El-Soda M, Boer MP, Bagheri H, Hanhart CJ, Koornneef M, Aarts MGM. 2014a. Genotype–environment interactions affecting preflowering physiological and morphological traits of Brassica rapa grown in two watering regimes. Journal of Experimental Botany 65, 697–708.
El-Soda M, Kruijer W, Malosetti M, Koornneef M, Aarts MGM. 2015. Quantitative trait loci and candidate genes underlying genotype by environment interaction in the response of Arabidopsis thaliana to drought. Plant, Cell and Environment 38, 585–599.
at INR
A A
vignon on Novem
ber 18, 2016http://jxb.oxfordjournals.org/
Dow
nloaded from

Association mapping of tomato response to water deficit | 6429
El-Soda M, Malosetti M, Zwaan BJ, Koornneef M, Aarts MGM. 2014b. Genotype×environment interaction QTL mapping in plants: lessons from Arabidopsis. Trends in Plant Science 19, 390–398.
FAO Water. 2015. Crop WATER INFORMATION: SOybean. http://www.fao.org/nr/water/cropinfo_tomato.html.
Fereres E, Soriano MA. 2006. Deficit irrigation for reducing agricultural water use. Journal of Experimental Botany 58, 147–159.
Frank W, Baar KM, Qudeimat E, Woriedh M, Alawady A, Ratnadewi D, Gremillon L, Grimm B, Reski R. 2007. A mitochondrial protein homologous to the mammalian peripheral-type benzodiazepine receptor is essential for stress adaptation in plants. The Plant Journal 51, 1004–1018.
Fridman E, Carrari F, Liu Y-S, Fernie AR, Zamir D. 2004. Zooming in on a quantitative trait for tomato yield using interspecific introgressions. Science 305, 1786–1789.
Fridman E, Pleban T, Zamir D. 2000. A recombination hotspot delimits a wild-species quantitative trait locus for tomato sugar content to 484 bp within an invertase gene. Proceedings of the National Academy of Sciences, USA 97, 4718–4723.
Gawenda I, Thorwarth P, Gunther T, Ordon F, Schmid KJ. 2015. Genome-wide association studies in elite varieties of German winter barley using single-marker and haplotype-based methods. Plant Breeding 134, 28–39.
Gomez L, Bancel D, Rubio E, Vercambre G. 2007. The microplate reader: an efficient tool for the separate enzymatic analysis of sugars in plant tissues—validation of a micro-method. Journal of the Science of Food and Agriculture 87, 1893–1905.
Gong P, Zhang J, Li H, Yang C, Zhang C, Zhang X. 2010. Transcriptional profiles of drought-responsive genes in modulating transcription signal transduction, and biochemical pathways in tomato. Journal of Experimental Botany 61, 3563–3575.
Gu J-F, Qiu M, Yang J-C. 2013. Enhanced tolerance to drought in transgenic rice plants overexpressing C4 photosynthesis enzymes. Crop Journal 1, 105–114.
Guichard S, Bertin N, Leonardi C, Gary C. 2001. Tomato fruit quality in relation to water and carbon fluxes. Agronomie 21, 385–392.
Guillet C, Just D, Bernard N, Destrac-Irvine A, Baldet P, Hernould M, Causse M, Raymond P, Rothan C. 2002. A fruit-specific phosphoenolpyruvate carboxylase is related to rapid growth of tomato fruit. Planta 214, 717–726.
Gur A, Semel Y, Osorio S, et al. 2011. Yield quantitative trait loci from wild tomato are predominately expressed by the shoot. Theoretical and Applied Genetics 122, 405–420.
Hamilton JP, Sim S-C, Stoffel K, Van Deynze A, Buell CR, Francis DM. 2012. Single nucleotide polymorphism discovery in cultivated tomato via sequencing by synthesis. Plant Genome Journal 5, 17.
Huang Z, van der Knaap E. 2011. Tomato fruit weight 11.3 maps close to fasciated on the bottom of chromosome 11. Theoretical and Applied Genetics 123, 465–474.
Illa-Berenguer E, Van Houten J, Huang Z, van der Knaap E. 2015. Rapid and reliable identification of tomato fruit weight and locule number loci by QTL-seq. Theoretical and Applied Genetics 128, 1329–1342.
Jury Wa, Vaux H. 2005. The role of science in solving the world’s emerging water problems. Proceedings of the National Academy of Sciences, USA 102, 15715–15720.
Kim YS, Park JY, Kim KS, Ko MK, Cheong SJ, Oh BJ. 2002. A thaumatin-like gene in nonclimacteric pepper fruits used as molecular marker in probing disease resistance, ripening, and sugar accumulation. Plant Molecular Biology 49, 125–135.
Kim M-H, Sato S, Sasaki K, Saburi W, Matsui H, Imai R. 2013. COLD SHOCK DOMAIN PROTEIN 3 is involved in salt and drought stress tolerance in Arabidopsis. FEBS Open Bio 3, 438–442.
Kirda C, Cetin M, Dasgan Y, Topcu S, Kaman H, Ekici B, Derici MR, Ozguven AI. 2004. Yield response of greenhouse grown tomato to partial root drying and conventional deficit irrigation. Agricultural Water Management 69, 191–201.
Korte A, Farlow A. 2013. The advantages and limitations of trait analysis with GWAS: a review. Plant Methods 9, 29.
Korte A, Vilhjálmsson BJ, Segura V, Platt A, Long Q, Nordborg M. 2012. A mixed-model approach for genome-wide association studies
of correlated traits in structured populations. Nature Genetics 44, 1066–1071.
Langridge P. 2006. Functional genomics of abiotic stress tolerance in cereals. Briefings in Functional Genomics and Proteomics 4, 343–354.
Leib BG, Caspari HW, Redulla CA, Andrews PK, Jabro JJ. 2006. Partial rootzone drying and deficit irrigation of ‘Fuji’ apples in a semi-arid climate. Irrigation Science 24, 85–99.
Lemoine R, Camera S La, Atanassova R, et al. 2013. Source-to-sink transport of sugar and regulation by environmental factors. Frontiers in Plant Science 4, 272.
Li Y, Huang Y, Bergelson J, Nordborg M, Borevitz JO. 2010. Association mapping of local climate-sensitive quantitative trait loci in Arabidopsis thaliana. Proceedings of the National Academy of Sciences, USA 107, 21199–21204.
Li Z, Palmer WM, Martin AP, Wang R, Rainsford F, Jin Y, Patrick JW, Yang Y, Ruan YL. 2012. High invertase activity in tomato reproductive organs correlates with enhanced sucrose import into, and heat tolerance of, young fruit. Journal of Experimental Botany 63, 1155–1166.
Luna A, Nicodemus KK. 2007. snp.plotter: an R-based SNP/haplotype association and linkage disequilibrium plotting package. Bioinformatics 23, 774–776.
Malosetti M, Ribaut JM, Vargas M, Crossa J, van Eeuwijk FA. 2007. A multi-trait multi-environment QTL mixed model with an application to drought and nitrogen stress trials in maize (Zea mays L.). Euphytica 161, 241–257.
Martinoia E, Rentsch D. 1995. Malate compartmentation—responses to a complex metabolism. Annual Review of Plant Biology 45, 447 – 467.
McClurg P, Pletcher MT, Wiltshire T, Su AI. 2006. Comparative analysis of haplotype association mapping algorithms. BMC Bioinformatics 7, 61.
Mirás-Avalos JM, Alcobendas R, Alarcón JJ, Valsesia P, Génard M, Nicolás E. 2013. Assessment of the water stress effects on peach fruit quality and size using a fruit tree model, QualiTree. Agricultural Water Management 128, 1–12.
Morrison GD, Linder CR. 2014. Association mapping of germination traits in Arabidopsis thaliana under light and nutrient treatments: searching for G×E effects. G3 (Bethesda, Md.) 4, 1465–1478.
Muir W, Nyquist WE, Xu S. 1992. Alternative partitioning of the genotype-by-environment interaction. Theoretical and Applied Genetics 84, 193–200.
Neta-Sharir I, Isaacson T, Lurie S, Weiss D. 2005. Dual role for tomato heat shock protein 21: protecting photosystem II from oxidative stress and promoting color changes during fruit maturation. The Plant Cell 17, 1829–1838.
Nguyen-Quoc B, Foyer CH. 2001. A role for ‘futile cycles’ involving invertase and sucrose synthase in sucrose metabolism of tomato fruit. Journal of Experimental Botany 52, 881–889.
Nir I, Moshelion M, Weiss D. 2014. The Arabidopsis GIBBERELLIN METHYL TRANSFERASE 1 suppresses gibberellin activity, reduces whole-plant transpiration and promotes drought tolerance in transgenic tomato. Plant, Cell and Environment 37, 113–123.
Osorio S, Ruan Y-L, Fernie AR. 2014. An update on source-to-sink carbon partitioning in tomato. Frontiers in Plant Science 5, 516.
Pan Y, Seymour GB, Lu C, Hu Z, Chen X, Chen G. 2012. An ethylene response factor (ERF5) promoting adaptation to drought and salt tolerance in tomato. Plant Cell Reports 31, 349–360.
Pascual L, Albert E, Sauvage C, et al. 2016. Dissecting quantitative trait variation in the resequencing era: complementarity of bi-parental, multi-parental and association panels. Plant Science 242, 120–130.
Perruc E, Charpenteau M, Ramirez BC, Jauneau A, Galaud J-P, Ranjeva R, Ranty B. 2004. A novel calmodulin-binding protein functions as a negative regulator of osmotic stress tolerance in Arabidopsis thaliana seedlings. The Plant Journal 38, 410–420.
Petre B, Major I, Rouhier N, Duplessis S. 2011. Genome-wide analysis of eukaryote thaumatin-like proteins (TLPs) with an emphasis on poplar. BMC Plant Biology 11, 33.
Pignocchi C, Kiddle G, Hernández I, Foster SJ, Asensi A, Taybi T, Barnes J, Foyer CH. 2006. Ascorbate oxidase-dependent changes in the redox state of the apoplast modulate gene transcript accumulation leading to modified hormone signaling and orchestration of defense processes in tobacco. Plant Physiology 141, 423–435.
at INR
A A
vignon on Novem
ber 18, 2016http://jxb.oxfordjournals.org/
Dow
nloaded from

6430 | Albert et al.
Proels RK, Roitsch T. 2009. Extracellular invertase LIN6 of tomato: a pivotal enzyme for integration of metabolic, hormonal, and stress signals is regulated by a diurnal rhythm. Journal of Experimental Botany 60, 1555–1567.
R Development Core Team. 2012. R: a language and environment for statistical computing. Vienna, Austria: R Foundation for Statistical Computing.
Reddy ASN, Ali GS, Celesnik H, Day IS. 2011. Coping with stresses: roles of calcium- and calcium/calmodulin-regulated gene expression. The Plant Cell 23, 2010–2032.
Rentsch D, Schmidt S, Tegeder M. 2007. Transporters for uptake and allocation of organic nitrogen compounds in plants. FEBS Letters 581, 2281–2289.
Reuscher S, Akiyama M, Mori C, Aoki K, Shibata D, Shiratake K. 2013. Genome-wide identification and expression analysis of aquaporins in tomato. PLoS One 8, e79052.
Ricardi MM, González RM, Zhong S, et al. 2014. Genome-wide data (ChIP-seq) enabled identification of cell wall-related and aquaporin genes as targets of tomato ASR1, a drought stress-responsive transcription factor. BMC Plant Biology 14, 29.
Ripoll J, Urban L, Bertin N. 2016a. The potential of the MAGIC TOM parental accessions to explore the genetic variability in tomato acclimation to repeated cycles of water deficit and recovery. Frontiers in Plant Science 6, 1172.
Ripoll J, Urban L, Brunel B, Bertin N. 2016b. Water deficit effects on tomato quality depend on fruit developmental stage and genotype. Journal of Plant Physiology 190, 26–35.
Ripoll J, Urban L, Staudt M, Lopez-Lauri F, Bidel LPR, Bertin N. 2014. Water shortage and quality of fleshy fruits, making the most of the unavoidable. Journal of Experimental Botany 65, 4097–4117.
Rost S, Gerten D, Bondeau A, Lucht W, Rohwer J, Schaphoff S. 2008. Agricultural green and blue water consumption and its influence on the global water system. Water Resources Research 44, W09405.
Ruan YL, Jin Y, Yang YJ, Li GJ, Boyer JS. 2010. Sugar input, metabolism, and signaling mediated by invertase: roles in development, yield potential, and response to drought and heat. Molecular Plant 3, 942–955.
Ruggieri V, Francese G, Sacco A, Alessandro AD, Rigano MM, Parisi M, Milone M, Cardi T, Mennella G, Barone A. 2014. An association mapping approach to identify favourable alleles for tomato fruit quality breeding. BMC Plant Biology 14, 1–15.
Sacco A, Ruggieri V, Parisi M, Festa G, Rigano MM, Picarella ME, Mazzucato A, Barone A. 2015. Exploring a tomato landraces collection for fruit-related traits by the aid of a high-throughput genomic platform. PLoS One 10, e0137139.
Saïdou A-A, Thuillet A-C, Couderc M, Mariac C, Vigouroux Y. 2014. Association studies including genotype by environment interactions: prospects and limits. BMC Genetics 15, 3.
Saliba-Colombani V, Causse M, Langlois D, Philouze J, Buret M. 2001. Genetic analysis of organoleptic quality in fresh market tomato. 1. Mapping QTLs for physical and chemical traits. Theoretical and Applied Genetics 102, 259–272.
Santesteban LG, Royo JB. 2006. Water status, leaf area and fruit load influence on berry weight and sugar accumulation of cv. ‘Tempranillo’ under semiarid conditions. Scientia Horticulturae 109, 60–65.
Sasaki E, Zhang P, Atwell S, Meng D, Nordborg M. 2015. ‘Missing’ G×E variation controls flowering time in Arabidopsis thaliana. PLoS Genetics 11, e1005597.
Sauvage C, Segura V, Bauchet G, Stevens R, Do PT, Nikoloski Z, Fernie AR, Causse M. 2014. Genome-wide association in tomato reveals 44 candidate loci for fruit metabolic traits. Plant Physiology 165, 1120–1132.
Segura V, Vilhjálmsson BJ, Platt A, Korte A, Seren Ü, Long Q, Nordborg M. 2012. An efficient multi-locus mixed-model approach for genome-wide association studies in structured populations. Nature Genetics 44, 825–830.
Seki M, Narusaka M, Ishida J, et al. 2002. Monitoring the expression profiles of 7000 Arabidopsis genes under drought, cold and high-salinity stresses using a full-length cDNA microarray. The Plant Journal 31, 279–292.
Semel Y, Schauer N, Roessner U, Zamir D, Fernie AR. 2007. Metabolite analysis for the comparison of irrigated and non-irrigated field grown tomato of varying genotype. Metabolomics 3, 289–295.
Shinozaki K, Yamaguchi-Shinozaki K. 2007. Gene networks involved in drought stress response and tolerance. Journal of Experimental Botany 58, 221–227.
Sim S-C, Durstewitz G, Plieske J, et al. 2012. Development of a large SNP genotyping array and generation of high-density genetic maps in tomato. PLoS One 7, e40563.
Stevens R, Buret M, Garchery C, Carretero Y, Causse M. 2006. Technique for rapid, small-scale analysis of vitamin C levels in fruit and application to a tomato mutant collection. Journal of Agricultural and Food Chemistry 54, 6159–6165.
Tardieu F. 2012. Any trait or trait-related allele can confer drought tolerance: just design the right drought scenario. Journal of Experimental Botany 63, 25–31.
Tieman DM, Zeigler M, Schmelz EA, Taylor MG, Bliss P, Kirst M, Klee HJ. 2006. Identification of loci affecting flavour volatile emissions in tomato fruits. Journal of Experimental Botany 57, 887–896.
Tomato Genome Consortium. 2012. The tomato genome sequence provides insights into fleshy fruit evolution. Nature 485, 635–641.
van Eeuwijk FA, Bink MC, Chenu K, Chapman SC. 2010. Detection and use of QTL for complex traits in multiple environments. Current Opinion in Plant Biology 13, 193–205.
Verbyla AP, Cavanagh CR, Verbyla KL. 2014. Whole-genome analysis of multienvironment or multitrait QTL in MAGIC. G3 Genes|Genomes|Genetics 4, 1569–1584.
Wang G, Cai G, Kong F, Deng Y, Ma N, Meng Q. 2014. Overexpression of tomato chloroplast-targeted DnaJ protein enhances tolerance to drought stress and resistance to Pseudomonas solanacearum in transgenic tobacco. Plant Physiology and Biochemistry 82, 95–104.
Wang W, Vinocur B, Altman A. 2003. Plant responses to drought, salinity and extreme temperatures: towards genetic engineering for stress tolerance. Planta 218, 1–14.
Warnes G, Leisch F. 2012. Package ‘genetics’ http://CRAN.R-project.org/package=genetics.
Wu B-H, Genard M, Lescourret F, Gomez L, Li S-H. 2002. Influence of assimilate and water supply on seasonal variation of acids in peach (cv Suncrest). Journal of the Science of Food and Agriculture 82, 1829–1836.
Xu J, Ranc N, Muños S, Rolland S, Bouchet JP, Desplat N, Le Paslier MC, Liang Y, Brunel D, Causse M. 2013. Phenotypic diversity and association mapping for fruit quality traits in cultivated tomato and related species. Theoretical and Applied Genetics 126, 567–581.
Zanor MI, Osorio S, Nunes-Nesi A, et al. 2009a. RNA interference of LIN5 in tomato confirms its role in controlling brix content, uncovers the influence of sugars on the levels of fruit hormones, and demonstrates the importance of sucrose cleavage for normal fruit development and fertility. Plant Physiology 150, 1204–1218.
Zanor MI, Rambla JL, Chaïb J, Steppa A, Medina A, Granell A, Fernie AR, Causse M. 2009b. Metabolic characterization of loci affecting sensory attributes in tomato allows an assessment of the influence of the levels of primary metabolites and volatile organic contents. Journal of Experimental Botany 60, 2139–2154.
Zheng J, Huang G, Jia D, Wang J, Mota M, Pereira LS, Huang Q, Xu X, Liu H. 2013. Responses of drip irrigated tomato (Solanum lycopersicum L.) yield, quality and water productivity to various soil matric potential thresholds in an arid region of Northwest China. Agricultural Water Management 129, 181–193.
Zhou GA, Chang RZ, Qiu LJ. 2010. Overexpression of soybean ubiquitin-conjugating enzyme gene GmUBC2 confers enhanced drought and salt tolerance through modulating abiotic stress-responsive gene expression in Arabidopsis. Plant Molecular Biology 72, 357–367.
at INR
A A
vignon on Novem
ber 18, 2016http://jxb.oxfordjournals.org/
Dow
nloaded from