skim-sequencing based genotyping reveals genetic
TRANSCRIPT
biology
Article
Skim-Sequencing Based Genotyping Reveals GeneticDivergence of the Wild and Domesticated Populationof Black Tiger Shrimp (Penaeus monodon) in theIndo-Pacific Region
Li Lian Wong 1,*,†, Zulaikha Mat Deris 1,†, Yoji Igarashi 2, Songqian Huang 3, Shuichi Asakawa 3,Qasim Ayub 4, Shu Yong Lim 4, Mhd Ikhwanuddin 5 , Shumpei Iehata 6, Kazutoshi Okamoto 7,Mariom 8 and Md Asaduzzaman 3,9,*
1 Institute of Marine Biotechnology, Universiti Malaysia Terengganu, Kuala-Terengganu 21030,Terengganu, Malaysia; [email protected]
2 Graduate School of Bioresources, Mie University, Kurimamachiya 1577, Tsu, Mie 514-8507, Japan;[email protected]
3 Department of Aquatic Bioscience, The University of Tokyo, 1-1-1 Yayoi, Bunkyo-ku, Tokyo 113-8657, Japan;[email protected] (S.H.); [email protected] (S.A.)
4 School of Science, Monash University Malaysia Genomics Facility, Bandar Sunway 47500, Selangor,Malaysia; [email protected] (Q.A.); [email protected] (S.Y.L.)
5 Institute of Tropical Aquaculture and Fisheries, Universiti Malaysia Terengganu, Kuala-Terengganu 21030,Terengganu, Malaysia; [email protected]
6 Faculty of Fisheries and Food Science, Universiti Malaysia Terengganu, Kuala-Terengganu 21030,Terengganu, Malaysia; [email protected]
7 Shizuoka Prefectural Research Institute of Fishery and Ocean, Yaizu-shi, Shizuoka 425-0032, Japan;[email protected]
8 Department of Fisheries Biology and Genetics, Faculty of Fisheries, Bangladesh Agricultural University,Mymensingh 2202, Bangladesh; [email protected]
9 Department of Marine Bioresource Science, Faculty of Fisheries, Chattogram Veterinary and AnimalSciences University, Khulshi 4225, Chattogram, Bangladesh
* Correspondence: [email protected] (L.L.W.); [email protected] (M.A.);Tel.: +60-(96)-683671 (L.L.W.); +88-017-1741-2049 (M.A.)
† These authors contribute equally to this work.
Received: 3 August 2020; Accepted: 2 September 2020; Published: 7 September 2020�����������������
Abstract: The domestication of a wild-caught aquatic animal is an evolutionary process, which resultsin genetic discrimination at the genomic level in response to strong artificial selection. Although blacktiger shrimp (Penaeus monodon) is one of the most commercially important aquaculture species,a systematic assessment of genetic divergence and structure of wild-caught and domesticatedbroodstock populations of the species is yet to be documented. Therefore, we used skim sequencing(SkimSeq) based genotyping approach to investigate the genetic structure of 50 broodstock individualsof P. monodon species, collected from five sampling sites (n = 10 in each site) across their distribution inIndo-Pacific regions. The wild-caught P. monodon broodstock population were collected from Malaysia(MS) and Japan (MJ), while domesticated broodstock populations were collected from Madagascar(MMD), Hawaii, HI, USA (MMO), and Thailand (MT). After various filtering process, a total of194,259 single nucleotide polymorphism (SNP) loci were identified, in which 4983 SNP loci wereidentified as putatively adaptive by the pcadapt approach. In both datasets, pairwise FST estimateshigh genetic divergence between wild and domesticated broodstock populations. Consistently,different spatial clustering analyses in both datasets categorized divergent genetic structure intotwo clusters: (1) wild-caught populations (MS and MJ), and (2) domesticated populations (MMD,MMO and MT). Among 4983 putatively adaptive SNP loci, only 50 loci were observed to be in thecoding region. The gene ontology (GO) and Kyoto Encyclopedia of Genes and Genomes (KEGG)
Biology 2020, 9, 277; doi:10.3390/biology9090277 www.mdpi.com/journal/biology
Biology 2020, 9, 277 2 of 22
analyses suggested that non-synonymous mutated genes might be associated with the energyproduction, metabolic functions, respiration regulation and developmental rates, which likely act topromote adaptation to the strong artificial selection during the domestication process. This study hasdemonstrated the applicability of SkimSeq in a highly duplicated genome of P. monodon specifically,across a range of genetic backgrounds and geographical distributions, and would be useful for futuregenetic improvement program of this species in aquaculture.
Keywords: low coverage sequencing; population structure; genetic improvement; outlier approach;domesticated population; Penaeus monodon
1. Introduction
The world production of inland aquaculture reached 51.3 million tonnes in 2018, with theirdominant production of 97.2% comprising of finfish, while mariculture produced 30.8 milliontonnes, with 56.2% represented by mollusc [1]. Marine shrimp industries yielded almost 4 milliontonnes in the same year, playing the role as the major supply of shrimps in the global market [2].While disease outbreak and price fluctuations in the global trade have highly impacted the productionand socio-economic development in many countries, the surging prices and shortage of good qualityshrimp broodstocks have further impeded the shrimp industry [1,3]. In fact, shrimp farming is heavilydependent on wild-caught broodstocks or domesticated broodstocks with reduced quality, due torepeated spawning programs [4–6]. To ensure sustainable seed supply, standardized benchmarks forquality and quantity assessment of broodstocks are essential [7].
Population structure is the organization of genetic diversity, and it is influenced by multipleevolutionary process, such as genetic drift, mutation, gene flow, natural selection and demographichistory [8,9]. It is estimated by parameters like genetic differentiation, variant alleles frequencies,population size and population dynamic [10–13]. Low number of breeders and inadvertent or massselection of prospective shrimp broodstocks can result in rapid reduction of genetic diversity [14–19].The loss of genetic variation, reduction in effective population size and accumulation of inbreedingeffects over several generations of selective breeding can compromise the effectiveness of geneticimprovement programs [20–22]. Although the magnitude of inbreeding effects are variable betweendifferent traits, genetic structure of a population and environmental interactions, the overall meanphenotypic value of traits associated with reproductive fitness and physiological efficiency is oftenreduced [23–25]. Therefore, adequate levels of genetic variation are vital for the maintenance of thegene pool in cultured shrimp with minimal effects of inbreeding depression and enhanced capacity inresponding to environmental changes [26,27]. Long-term crossbreeding programs may help to achievea balance between continuous genetic gains and reduced risk of inbreeding depression [6,28].
Penaeus monodon, commonly known as black tiger shrimp is widely distributed across theIndo-Pacific region, and is one of the most commercially important aquaculture species [29,30]. To date,population structure studies of P. monodon have only been limited to several traditional markers suchas mtDNA RFLP [29], allozymes [31], microsatellite [32,33] and Sanger sequencing of various genesincluding mtCR (mtDNA control region) [34,35], mitochondria DNA [36] and elongation factor-1a [37],while next generation sequencing (NGS) approaches are yet to be explored for this species in this aspect.In fact, NGS have been well proven in revealing fine-scale population structure and phylogeographicdivergence in numerous aquatic species [38–44].
Skim sequencing (SkimSeq) is one of the less complex NGS methods, which uses low coverage(1–10X) whole genome sequencing of multiple individuals for high resolution genotyping [45–48].SkimSeq is less laborious with fewer complex steps, is unbiased towards specific alleles, is capableof SNPs detection, which enables informative sampling and validation of the genome [49–53].
Biology 2020, 9, 277 3 of 22
This genotyping by sequencing approach is useful in population study with unknown parentalgenome information to generate detailed diversity analysis and marker-assisted selections [45,53].
Given that the SkimSeq is known as low coverage genome sequencing approach [38], and so farhave only been applied in plant genomics research [45–48], we have chosen this technique to generatehigh resolution sequence dataset, as reported in previous studies, for the first aquatic invertebratewith small samples size. To explore the genetic diversity, population structure and discover thenovel molecular markers of P. monodon from different origins (wild vs. domesticated), we geneticallyassayed 50 individuals with the SkimSeq approach using the short read Illumina sequencing platform.This study aimed to: (i) investigate the genetic structure of wild and domesticated populations,(ii) quantify the genetic differentiation between populations and (iii) examine the presence of putativeloci causing the genetic variation. The genomic analyses and genetic resource acquired from thisstudy will be useful to support future genetic improvements in P. monodon culture and brood-stockselection activities.
2. Materials and Methods
2.1. Sample Collection
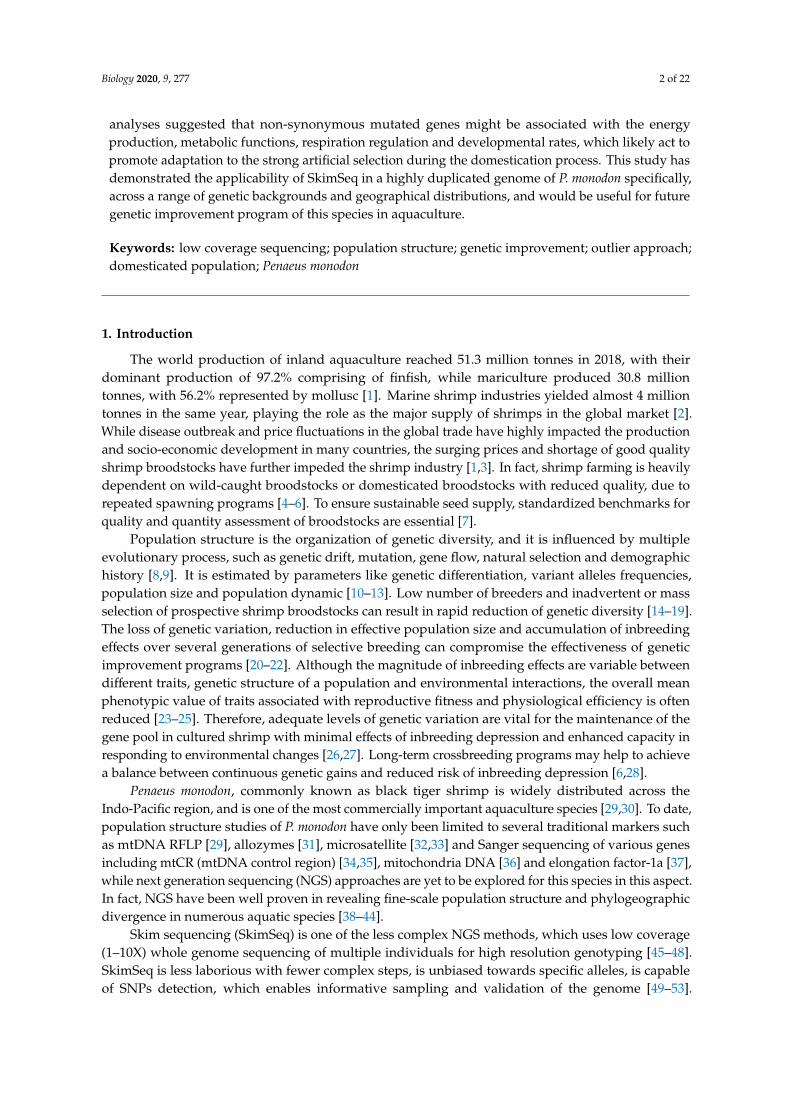
A total of 50 P. monodon individuals consisting of both domesticated and wild-caught broodstockswere collected from five sampling sites (10 individuals from each site and of same family) acrossIndo-Pacific regions (Figure 1), and the sampling details are listed in Table 1. Among the five locations,P. monodon broodstock populations from MMD (Madagascar), MT (Thailand) and MMO (Hawaii, HI,USA) were obtained from domesticated shrimp farms, while MS (Malaysia) and MJ (Japan) were caughtfrom the wild. The muscle tissues were extracted from broodstock individuals and preserved in 99.5%v/v ethanol and stored at −20 ◦C until DNA extraction. All samples were collected in accordance withthe animal care and tissue collection protocol as approved by the Universiti Malaysia Terengganu’sAnimal Care and Biosafety Committee.
Biology 2020, 8, x 3 of 22
genotyping by sequencing approach is useful in population study with unknown parental genome
information to generate detailed diversity analysis and marker-assisted selections [45,53].
Given that the SkimSeq is known as low coverage genome sequencing approach [38], and so far
have only been applied in plant genomics research [45–48], we have chosen this technique to generate
high resolution sequence dataset, as reported in previous studies, for the first aquatic invertebrate
with small samples size. To explore the genetic diversity, population structure and discover the novel
molecular markers of P. monodon from different origins (wild vs. domesticated), we genetically
assayed 50 individuals with the SkimSeq approach using the short read Illumina sequencing
platform. This study aimed to: (i) investigate the genetic structure of wild and domesticated
populations, (ii) quantify the genetic differentiation between populations and (iii) examine the
presence of putative loci causing the genetic variation. The genomic analyses and genetic resource
acquired from this study will be useful to support future genetic improvements in P. monodon culture
and brood-stock selection activities.
2. Materials and Methods
2.1. Sample Collection
A total of 50 P. monodon individuals consisting of both domesticated and wild-caught
broodstocks were collected from five sampling sites (10 individuals from each site and of same
family) across Indo-Pacific regions (Figure 1), and the sampling details are listed in Table 1. Among
the five locations, P. monodon broodstock populations from MMD (Madagascar), MT (Thailand) and
MMO (Hawaii, HI, USA) were obtained from domesticated shrimp farms, while MS (Malaysia) and
MJ (Japan) were caught from the wild. The muscle tissues were extracted from broodstock
individuals and preserved in 99.5% v/v ethanol and stored at -20 °C until DNA extraction. All samples
were collected in accordance with the animal care and tissue collection protocol as approved by the
Universiti Malaysia Terengganu’s Animal Care and Biosafety Committee.
Figure 1. Sampling sites of five broodstock populations of Penaeus monodon in the Indo-Pacific region.
MMD (Madagascar), MT (Thailand) and MMO (Hawaii, HI, USA) represent domesticated
populations, while MS (Malaysia) and MJ (Japan) are wild-caught populations. Values in parentheses
denote the sample size for each population.
Figure 1. Sampling sites of five broodstock populations of Penaeus monodon in the Indo-Pacific region.MMD (Madagascar), MT (Thailand) and MMO (Hawaii, HI, USA) represent domesticated populations,while MS (Malaysia) and MJ (Japan) are wild-caught populations. Values in parentheses denote thesample size for each population.
Biology 2020, 9, 277 4 of 22
Table 1. Summary of the sampling information of Penaeus monodon population collected from thedifferent Indo-Pacific regions.
Locations LocationAbbreviation
BroodstockSource Latitudes Longitudes Year
Mahajamba, Madagascar MMD Domesticated 16◦02′52.8′′ 47◦11′38.0′′ 2018Hawaii, HI, USA MMO Domesticated 19◦42′55.9′′ 156◦02′34.6′′ 2018
Petchaburi Province, Thailand MT Domesticated 12◦58′06.5′′ 99◦37′48.0′′ 2019Setiu Wetland, Malaysia MS Wild 5◦40′38.3′′ 102◦42′36.8′′ 2019
Shizuoka, Japan MJ Wild 34◦56′25.9′′ 138◦02′17.9′′ 2018
2.2. DNA Extraction and Library Preparation
Genomic DNA of P. monodon broodstocks were isolated from the muscle tissues using WizardGenomic DNA Purification Kit following the manufacturer’s protocols (Promega, San Luis Obispo,CA, USA). The concentration and purity of the extracted genomic DNA were quantified based onA260/280 nm ratio using BioDrop (BioDrop, Cambridge, UK). DNA quantifications were conductedusing real-time PCR fluorescence measurements of double stranded DNA [54] and the Quant-it kit(Life Technologies, Foster City, CA, USA). Genomic DNA was fragmented into the insert size of350 bp using with TruSeq® DNA PCR-Free Library Prep Kit (Illumina Inc., San Diego, CA, USA) andCovaris M220 (Covaris Inc., Woburn, MA, USA), following the kits’ protocol at Monash UniversityMalaysia Genomics Facility (Selangor, Malaysia). Accurate quantification and quality checking of theDNA libraries were conducted using the KAPA Library Quantification Kit (Roche Sequencing andLife Science, Indianapolis, IN, USA), while qualitative estimation of the libraries was performed byAgilent Technologies 2100 Bioanalyzer (Agilent Technologies Inc., Santa Clara, CA, USA). Detailed QCparameters, including library cluster density, library complexity, percent duplication, GC bias, andindex representation were generated on the MiSeq system (Illumina Inc., Foster City, CA, USA) toensure a uniform concentration of all samples prior to SkimSeq. The pooled library was denaturedbased on the Illumina NextSeq denaturation guideline and paired-end sequencing was carried outusing NextSeq 500/550 High Output v2 300 cycles kit on a NextSeq 500 (Illumina Inc., Foster City,CA, USA).
2.3. Sequence Assembly, Filtering and SNPs Discovery
From the Illumina platform, 151 base-pair paired-end (2 × 151) sequencing reads were obtained inFASTQ format. Sequencing reads matching to PhiX DNA sequences were first removed by aligningreads against the PhiX DNA sequence using Bowtie 2 software version 2.2.3 (http://bowtie.cbcb.umd.edu) [55,56]. The cleaned reads were then subjected to Illumina sequencing adapter trimming andbase quality (Q ≥ 20) trimming using PEAT software version 1.2.4 (http://jhhung.github.io/PEAT) [57],to ensure that only good quality bases derived from the sample were further analyzed. Trimmed readsof less than 36 bp were also discarded using Trimmomatic software version 0.36 (http://www.usadellab.org/cms/index.php?page=trimmomatic) [58]. The quality trimming and filtering analyses of the wholegenome SkimSeq data revealed that each of the 50 individuals of P. monodon had about 30% low-qualityreads, which were discarded before de novo genome assembly (Table S1). In the present study, the goodquality reads of all samples were assembled collectively using SOAPdenovo software version 2-r240(ftp://public.genomics.org.cn/BGI/SOAPdenovo2) [59] into a set of scaffolds. All samples (exceptMJ10) had greater than 91% mapping rate to the assembled scaffold, indicating that the assembledscaffold is able to comprehensively represent all samples (Table S2). The calculated coverage ofSkimSeq data in different samples was found to vary from 1.3 to 1.8X. Subsequently, BLAST+ version2.2.31 (ftp://ftp.ncbi.nlm.nih.gov/blast/executables/blast+/LATEST) [60] was used to identify the codingprotein sequences from the order of Decapoda and the full SwissProt database [61] to the assembledscaffold sequences. The good quality sequencing reads were aligned to the assembled scaffold sequencesusing BWA version 0.7.12-r1039 (http://maq.sourceforge.net) [62]. The reads alignments were sorted,
Biology 2020, 9, 277 5 of 22
and potential PCR duplicate reads were identified and marked using Picard Tools version 2.9.0.The reads alignments were analyzed to identify variants using FreeBayes version 1.2.0-2-g29c4002 [63]to find small polymorphisms, specifically SNPs (single-nucleotide polymorphisms), indels (insertionsand deletions), MNPs (multi-nucleotide polymorphisms) and complex events (composite insertionand substitution events) smaller than the length of a short-read sequencing alignment. The outputsincludes a total number of 17,226,908 raw variants loci in the VCF file format. The identified variantscoordinates were compared to the gene coordinates obtained from genome annotation using vcfannosoftware version 0.2.9 (https://github.com/brentp/vcfanno) [64]. If a variant fell within the regionfor a protein-genome match, the information of the protein name was transferred to the variants asan annotation.
SNP profiles were analyzed and visualized using SNPRelate version 1.16.0 [65], to exclude outliersamples with inconsistent genetic profiles. Likewise, samples containing a completeness of data ofless than 80% among the remaining loci, a minimum quality score with minor allele frequency belowthreshold, and a mean depth per genotype lower than 20 were removed from the dataset. Out ofthe 50 P. monodon, 5 individual sequences (MJ10, MS9, MMO1, MMO7 and MMO16) were removedfrom the dataset due to the inconsistent SNP profiles and/or greater than 20% missing genotypes,while the remaining 45 samples were used for all downstream analyses. Furthermore, variants filteringwas conducted using VCFtools software version 0.1.16 (https://vcftools.github.io/) [66] and BCFtoolssoftware version 1.9 (http://samtools.github.io/bcftools/bcftools.html). At first, the variants filteringsteps included the removal of complex indels, SNPs with more than two alleles, and compositeinsertion and substitution events. Further filtering steps included the removal of sites with less than5% overall minor allele frequency, missing genotypes in >90% of the samples in any population, andSNP sites with genotypes not in Hardy-Weinberg equilibrium in any population (PHWE < 0.001).After all filtering steps, a total of 194,259 individual SNP loci remained in the dataset. To detectputatively adaptive SNP loci among different wild and domesticated broodstock populations ofP. monodon, we identified outlier SNPs from the 194,259 filtered individual SNP loci using pcadaptversion 3.0.2 [67,68]. The “pcadapt” approach performs a principal component analysis and computesthe p-values of each locus to detect adaptive loci. Default parameters were used for pcadapt analysis,and the “number_of_samples” parameter was set to 5 (a number equal to the sampled collections).The false discovery rate (FDR) threshold value set to 0.05, to control the false positive. Finally, an overallSNP loci dataset and putatively adaptive SNP loci dataset were created and used for all down-streamspatial clustering analyses.
2.4. Power Analysis
A power analysis using POWSIM v. 4.1 [69] was carried out to determine the power of all SNP lociand putatively adaptive SNP loci datasets derived from the SkimSeq approach. This program evaluatesthe statistical power of genetic homogeneity in individual species and allows the user to adjust anumber of user-defined parameters. To calculate the power of our sampling design, the number ofsubpopulations was set to five (equals to the number of our collection sites), with 10 samples persubpopulation (number of the collected individuals per sampling site) for both all of the SNP loci andthe putatively adaptive SNP loci datasets. The effective population size of the subpopulations were setto 1000, 2000 and 3000, and generation time (t) was adjusted to assess power at multiple FST values(10 and 20 generations), as described previously [39]. As FST in POWSIM assumes the independence ofthe subpopulations, power was expressed as the proportion of significant outcomes for 1000 alterationsper batch and a statistically significant test (p < 0.05).
2.5. Genetic Variation Analysis
The filtered data was imported as a genind object into R and down-stream spatial clusteringanalyses were largely conducted using the adegenet v2.0.1 R package (http://cran.r-project.org/mirrors.html) [70]. The GenoDive version 3.0 (Universiteit van Amsterdam, Amsterdam, The Netherlands)
Biology 2020, 9, 277 6 of 22
was used to conduct an analysis of molecular variance (AMOVA) on both datasets [71]. The GenoDivewas also used for significance testing of pairwise FST to determine the genetic differences betweencollection sites for the all SNP loci and outlier datasets using the default settings, with the samplesgrouped by collection sites. Clustering analysis, discriminant analysis of the principal component(DAPC), was conducted using the adegenet R package (Universite’ de Lyon, UMR 5558, Lyon, France)on all SNP loci dataset and outlier datasets. Neighbor-joining trees were generated using all theSNP loci dataset and outlier datasets using Nei’s genetic distance method. The Bayesian clusteringmethod, implemented in the STRUCTURE software v. 2.3.4 (Stanford University, Stanford, CA, USA),was used to genetically assign individuals to clusters [72]. Simulations were run for 100,000 steps,following a burn-in period of 100,000 steps, considering values of K (number of clusters) from oneto 15, with 10 replications for each value of K. The analysis was performed using an admixture,correlated allele frequencies, and no prior information on the sampling location or morphologicalspecies. For each individual, the program identifies the fraction of the genome that belongs to eachone of the clusters. The rate of change in the log likelihood between successive K values was alsoestimated [73]. The calculations were performed using STRUCTURE HARVESTER [74]. The clustersof the estimated population structure were visualized using CLUMPAK [75].
2.6. GO and KEGG Enrichment Analysis of Putatively Adaptive SNP Loci
To identify the genes encoded within the adaptive SNP loci, a homology search program wasapplied for each putatively adaptive SNP locus with the genome sequences available for the L. vannameiin the NCBI database. For each detected 4983 SNP loci, flanking region of upstream and downstream100 bp was extracted from the reference nucleotide sequence. Homology search between this extractedsequence set and CDS amino acid sequences of L. vannamei was performed under the homologythreshold of e-value = 1 × 10⁻⁵. Homology search program of the SNP flanking sequences showed thatthe total of 50 coding regions containing nonsynonymous mutations were encoded by the putativelyadaptive SNP loci. To know the functional distribution of the genes encoded within the adaptiveSNP loci, gene ontology (GO) and Kyoto Encyclopedia of Genes and Genomes (KEGG) pathwayenrichment analysis were performed using KOBAS 3.0 software (http://kobas.cbi.pku.edu.cn/kobas3)and visualized with R [76]. The hypergeometric test was used to identify the significant GO and KEGGpathways (p < 0.05).
2.7. Data Accessibility
Our raw data for 50 individuals were submitted to the DDBJ (https://ddbj.nig.ac.jp), with the DRAaccession number: DRA010601. The data will be publicly available from 10 September 2020.
3. Results
3.1. Genome Assembly, Annotation and Quality Filtering of SNP Loci
The de novo assembley of good quality data generated a total of 6,425,442 scaffolds with the largestand smallest scaffold size of 15,300 bp and 100 bp, respectively, and totaling 1,531,786,734 base pairs inlength (Table 2). Genome annotation analyses displayed that 440,707 scaffolds matched with at leastone protein sequence, and 107,063 Decapoda and 42,351 SwissPort protein sequences were matchedto the scaffold (Table 2). A total of 17,226,908 variant sites were identified across 3,651,235 scaffolds.Among 17,226,908 variant sites, 1,347,070 were annotated with sequence similarity to Decapoda orSwissProt protein sequences (Table 2).
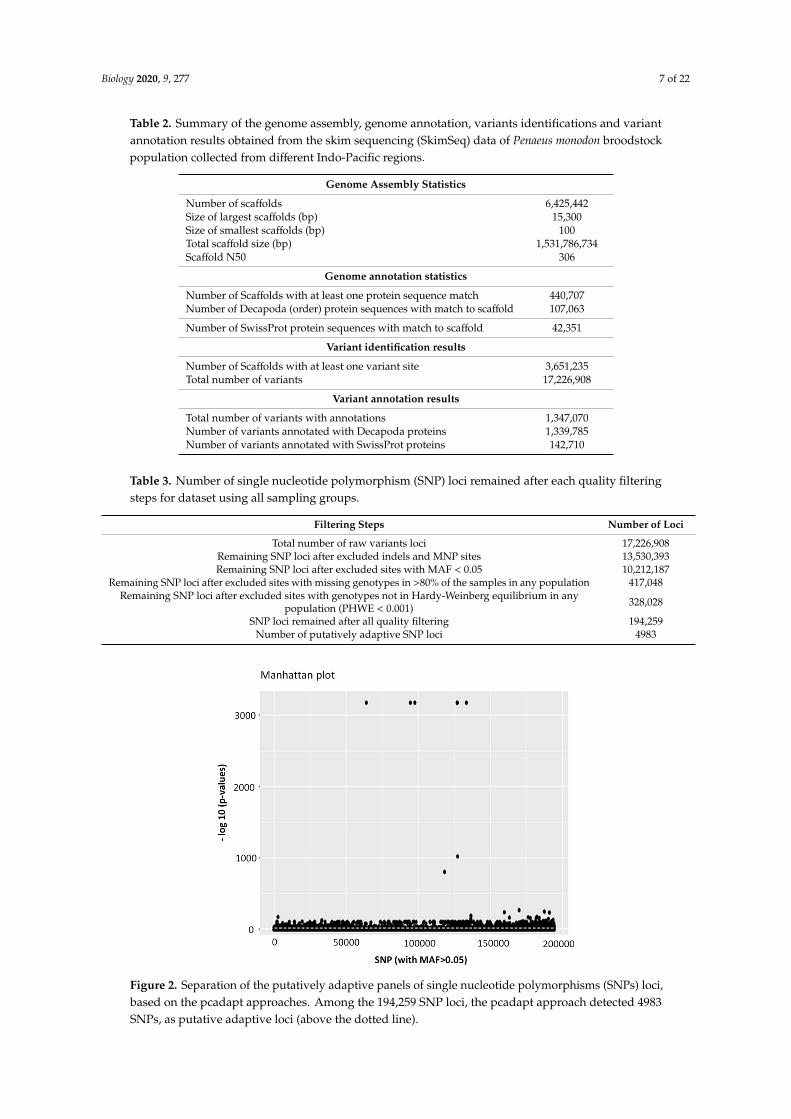
Among the 17,226,908 variant sites, 10,212,187 SNP loci were retained after removing indels,MNPs and SNP sites with less than 5% minor allele frequency (Table 3). After all of the filtering stepswere complete, a total of 194,259 individual SNP loci remained in the dataset. Out of the 194,259polymorphic SNPs loci, 4983 SNP loci were identified as outliers and putatively under positive selectionby the pcadapt approach (Table 3, Figure 2).
Biology 2020, 9, 277 7 of 22
Table 2. Summary of the genome assembly, genome annotation, variants identifications and variantannotation results obtained from the skim sequencing (SkimSeq) data of Penaeus monodon broodstockpopulation collected from different Indo-Pacific regions.
Genome Assembly Statistics
Number of scaffolds 6,425,442Size of largest scaffolds (bp) 15,300Size of smallest scaffolds (bp) 100Total scaffold size (bp) 1,531,786,734Scaffold N50 306
Genome annotation statistics
Number of Scaffolds with at least one protein sequence match 440,707Number of Decapoda (order) protein sequences with match to scaffold 107,063
Number of SwissProt protein sequences with match to scaffold 42,351
Variant identification results
Number of Scaffolds with at least one variant site 3,651,235Total number of variants 17,226,908
Variant annotation results
Total number of variants with annotations 1,347,070Number of variants annotated with Decapoda proteins 1,339,785Number of variants annotated with SwissProt proteins 142,710
Table 3. Number of single nucleotide polymorphism (SNP) loci remained after each quality filteringsteps for dataset using all sampling groups.
Filtering Steps Number of Loci
Total number of raw variants loci 17,226,908Remaining SNP loci after excluded indels and MNP sites 13,530,393Remaining SNP loci after excluded sites with MAF < 0.05 10,212,187
Remaining SNP loci after excluded sites with missing genotypes in >80% of the samples in any population 417,048Remaining SNP loci after excluded sites with genotypes not in Hardy-Weinberg equilibrium in any
population (PHWE < 0.001) 328,028
SNP loci remained after all quality filtering 194,259Number of putatively adaptive SNP loci 4983
Biology 2020, 8, x 7 of 22
Size of smallest scaffolds (bp) 100
Total scaffold size (bp) 1,531,786,734
Scaffold N50 306
Genome annotation statistics
Number of Scaffolds with at least one protein sequence match 440,707
Number of Decapoda (order) protein sequences with match to scaffold 107,063
Number of SwissProt protein sequences with match to scaffold 42,351
Variant identification results
Number of Scaffolds with at least one variant site 3,651,235
Total number of variants 17,226,908
Variant annotation results
Total number of variants with annotations 1,347,070
Number of variants annotated with Decapoda proteins 1,339,785
Number of variants annotated with SwissProt proteins 142,710
Among the 17,226,908 variant sites, 10,212,187 SNP loci were retained after removing indels,
MNPs and SNP sites with less than 5% minor allele frequency (Table 3). After all of the filtering steps
were complete, a total of 194,259 individual SNP loci remained in the dataset. Out of the 194,259
polymorphic SNPs loci, 4983 SNP loci were identified as outliers and putatively under positive
selection by the pcadapt approach (Table 3; Figure 2).
Table 3. Number of single nucleotide polymorphism (SNP) loci remained after each quality filtering
steps for dataset using all sampling groups.
Filtering Steps Number of
Loci
Total number of raw variants loci 17,226,908
Remaining SNP loci after excluded indels and MNP sites 13,530,393
Remaining SNP loci after excluded sites with MAF < 0.05 10,212,187
Remaining SNP loci after excluded sites with missing genotypes in >80% of the samples in
any population 417,048
Remaining SNP loci after excluded sites with genotypes not in Hardy-Weinberg
equilibrium in any population (PHWE < 0.001) 328,028
SNP loci remained after all quality filtering 194,259
Number of putatively adaptive SNP loci 4983
Figure 2. Separation of the putatively adaptive panels of single nucleotide polymorphisms (SNPs) loci,based on the pcadapt approaches. Among the 194,259 SNP loci, the pcadapt approach detected 4983SNPs, as putative adaptive loci (above the dotted line).
Biology 2020, 9, 277 8 of 22
3.2. Power Analysis
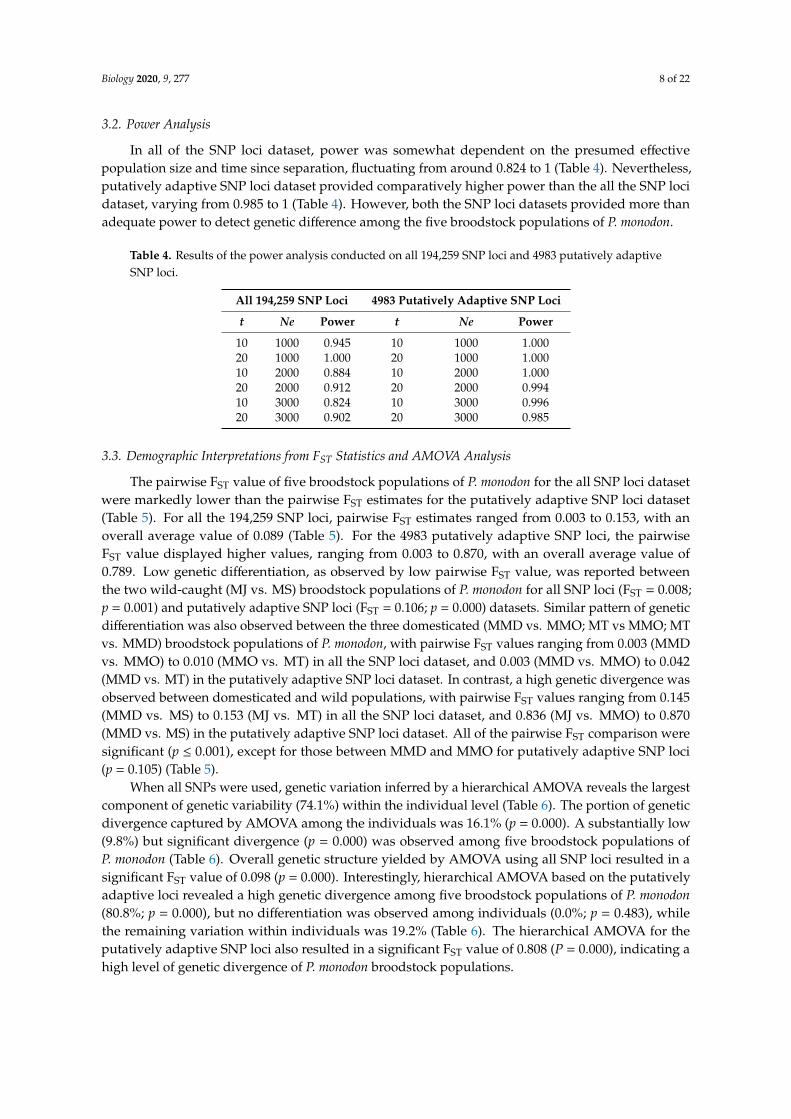
In all of the SNP loci dataset, power was somewhat dependent on the presumed effectivepopulation size and time since separation, fluctuating from around 0.824 to 1 (Table 4). Nevertheless,putatively adaptive SNP loci dataset provided comparatively higher power than the all the SNP locidataset, varying from 0.985 to 1 (Table 4). However, both the SNP loci datasets provided more thanadequate power to detect genetic difference among the five broodstock populations of P. monodon.
Table 4. Results of the power analysis conducted on all 194,259 SNP loci and 4983 putatively adaptiveSNP loci.
All 194,259 SNP Loci 4983 Putatively Adaptive SNP Loci
t Ne Power t Ne Power
10 1000 0.945 10 1000 1.00020 1000 1.000 20 1000 1.00010 2000 0.884 10 2000 1.00020 2000 0.912 20 2000 0.99410 3000 0.824 10 3000 0.99620 3000 0.902 20 3000 0.985
3.3. Demographic Interpretations from FST Statistics and AMOVA Analysis
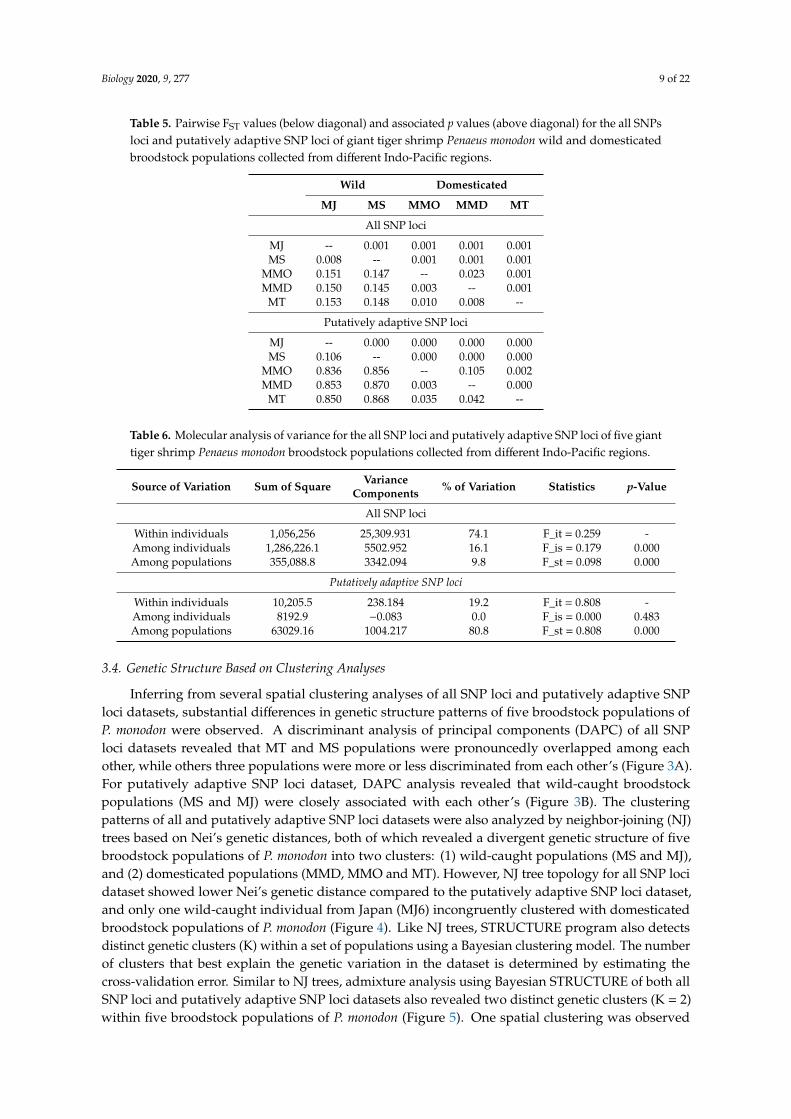
The pairwise FST value of five broodstock populations of P. monodon for the all SNP loci datasetwere markedly lower than the pairwise FST estimates for the putatively adaptive SNP loci dataset(Table 5). For all the 194,259 SNP loci, pairwise FST estimates ranged from 0.003 to 0.153, with anoverall average value of 0.089 (Table 5). For the 4983 putatively adaptive SNP loci, the pairwiseFST value displayed higher values, ranging from 0.003 to 0.870, with an overall average value of0.789. Low genetic differentiation, as observed by low pairwise FST value, was reported betweenthe two wild-caught (MJ vs. MS) broodstock populations of P. monodon for all SNP loci (FST = 0.008;p = 0.001) and putatively adaptive SNP loci (FST = 0.106; p = 0.000) datasets. Similar pattern of geneticdifferentiation was also observed between the three domesticated (MMD vs. MMO; MT vs MMO; MTvs. MMD) broodstock populations of P. monodon, with pairwise FST values ranging from 0.003 (MMDvs. MMO) to 0.010 (MMO vs. MT) in all the SNP loci dataset, and 0.003 (MMD vs. MMO) to 0.042(MMD vs. MT) in the putatively adaptive SNP loci dataset. In contrast, a high genetic divergence wasobserved between domesticated and wild populations, with pairwise FST values ranging from 0.145(MMD vs. MS) to 0.153 (MJ vs. MT) in all the SNP loci dataset, and 0.836 (MJ vs. MMO) to 0.870(MMD vs. MS) in the putatively adaptive SNP loci dataset. All of the pairwise FST comparison weresignificant (p ≤ 0.001), except for those between MMD and MMO for putatively adaptive SNP loci(p = 0.105) (Table 5).
When all SNPs were used, genetic variation inferred by a hierarchical AMOVA reveals the largestcomponent of genetic variability (74.1%) within the individual level (Table 6). The portion of geneticdivergence captured by AMOVA among the individuals was 16.1% (p = 0.000). A substantially low(9.8%) but significant divergence (p = 0.000) was observed among five broodstock populations ofP. monodon (Table 6). Overall genetic structure yielded by AMOVA using all SNP loci resulted in asignificant FST value of 0.098 (p = 0.000). Interestingly, hierarchical AMOVA based on the putativelyadaptive loci revealed a high genetic divergence among five broodstock populations of P. monodon(80.8%; p = 0.000), but no differentiation was observed among individuals (0.0%; p = 0.483), whilethe remaining variation within individuals was 19.2% (Table 6). The hierarchical AMOVA for theputatively adaptive SNP loci also resulted in a significant FST value of 0.808 (P = 0.000), indicating ahigh level of genetic divergence of P. monodon broodstock populations.
Biology 2020, 9, 277 9 of 22
Table 5. Pairwise FST values (below diagonal) and associated p values (above diagonal) for the all SNPsloci and putatively adaptive SNP loci of giant tiger shrimp Penaeus monodon wild and domesticatedbroodstock populations collected from different Indo-Pacific regions.
Wild Domesticated
MJ MS MMO MMD MT
All SNP loci
MJ -- 0.001 0.001 0.001 0.001MS 0.008 -- 0.001 0.001 0.001
MMO 0.151 0.147 -- 0.023 0.001MMD 0.150 0.145 0.003 -- 0.001
MT 0.153 0.148 0.010 0.008 --
Putatively adaptive SNP loci
MJ -- 0.000 0.000 0.000 0.000MS 0.106 -- 0.000 0.000 0.000
MMO 0.836 0.856 -- 0.105 0.002MMD 0.853 0.870 0.003 -- 0.000
MT 0.850 0.868 0.035 0.042 --
Table 6. Molecular analysis of variance for the all SNP loci and putatively adaptive SNP loci of five gianttiger shrimp Penaeus monodon broodstock populations collected from different Indo-Pacific regions.
Source of Variation Sum of Square VarianceComponents % of Variation Statistics p-Value
All SNP loci
Within individuals 1,056,256 25,309.931 74.1 F_it = 0.259 -Among individuals 1,286,226.1 5502.952 16.1 F_is = 0.179 0.000Among populations 355,088.8 3342.094 9.8 F_st = 0.098 0.000
Putatively adaptive SNP loci
Within individuals 10,205.5 238.184 19.2 F_it = 0.808 -Among individuals 8192.9 −0.083 0.0 F_is = 0.000 0.483Among populations 63029.16 1004.217 80.8 F_st = 0.808 0.000
3.4. Genetic Structure Based on Clustering Analyses
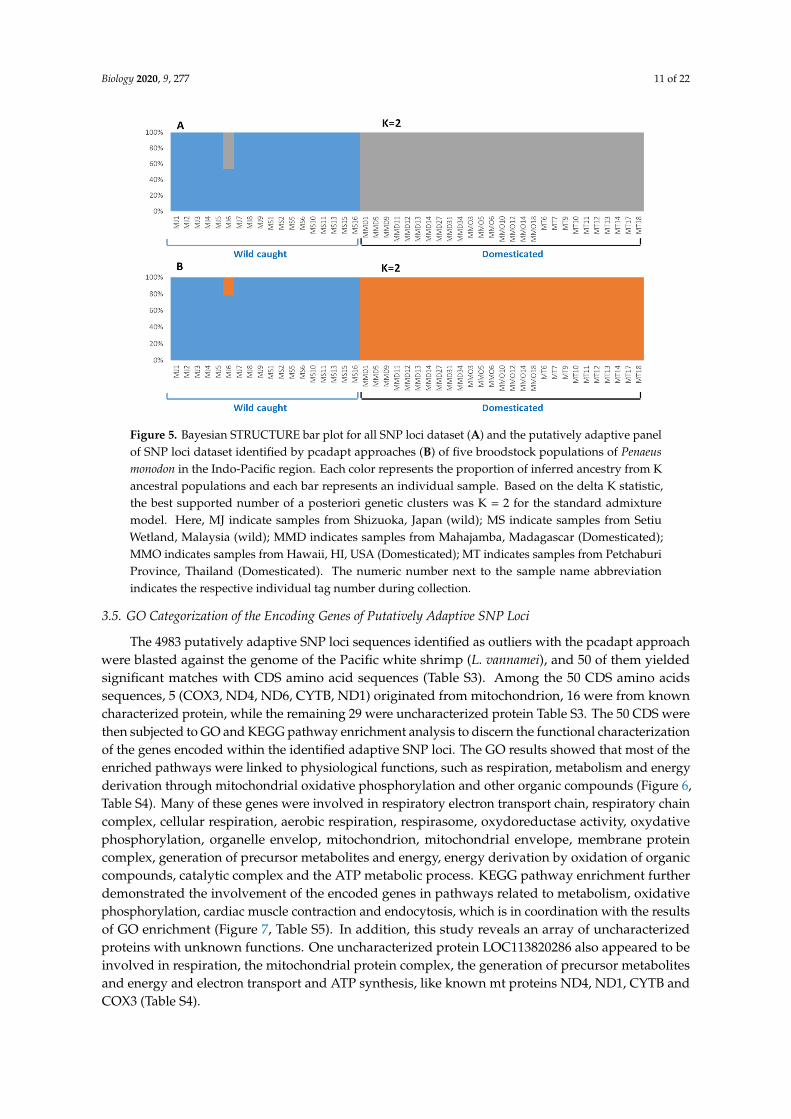
Inferring from several spatial clustering analyses of all SNP loci and putatively adaptive SNPloci datasets, substantial differences in genetic structure patterns of five broodstock populations ofP. monodon were observed. A discriminant analysis of principal components (DAPC) of all SNPloci datasets revealed that MT and MS populations were pronouncedly overlapped among eachother, while others three populations were more or less discriminated from each other’s (Figure 3A).For putatively adaptive SNP loci dataset, DAPC analysis revealed that wild-caught broodstockpopulations (MS and MJ) were closely associated with each other’s (Figure 3B). The clusteringpatterns of all and putatively adaptive SNP loci datasets were also analyzed by neighbor-joining (NJ)trees based on Nei’s genetic distances, both of which revealed a divergent genetic structure of fivebroodstock populations of P. monodon into two clusters: (1) wild-caught populations (MS and MJ),and (2) domesticated populations (MMD, MMO and MT). However, NJ tree topology for all SNP locidataset showed lower Nei’s genetic distance compared to the putatively adaptive SNP loci dataset,and only one wild-caught individual from Japan (MJ6) incongruently clustered with domesticatedbroodstock populations of P. monodon (Figure 4). Like NJ trees, STRUCTURE program also detectsdistinct genetic clusters (K) within a set of populations using a Bayesian clustering model. The numberof clusters that best explain the genetic variation in the dataset is determined by estimating thecross-validation error. Similar to NJ trees, admixture analysis using Bayesian STRUCTURE of both allSNP loci and putatively adaptive SNP loci datasets also revealed two distinct genetic clusters (K = 2)within five broodstock populations of P. monodon (Figure 5). One spatial clustering was observed
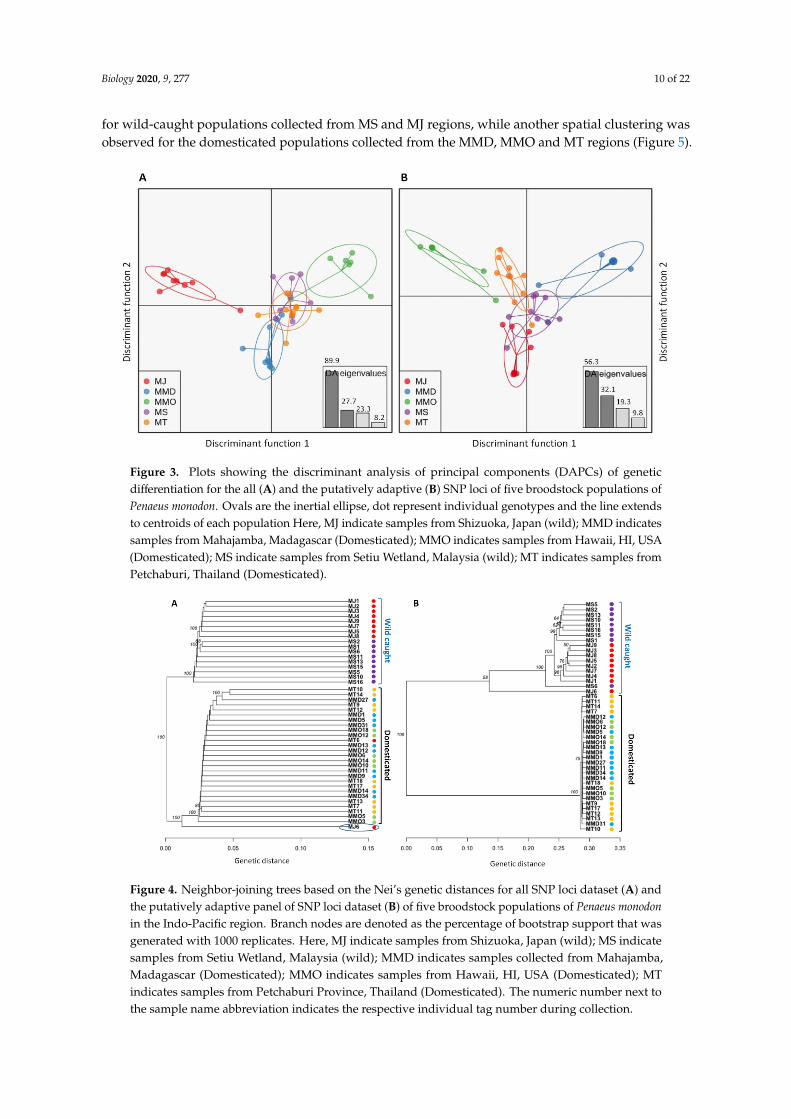
Biology 2020, 9, 277 10 of 22
for wild-caught populations collected from MS and MJ regions, while another spatial clustering wasobserved for the domesticated populations collected from the MMD, MMO and MT regions (Figure 5).Biology 2020, 8, x 10 of 22
Figure 3. Plots showing the discriminant analysis of principal components (DAPCs) of genetic
differentiation for the all (A) and the putatively adaptive (B) SNP loci of five broodstock populations
of Penaeus monodon. Ovals are the inertial ellipse, dot represent individual genotypes and the line
extends to centroids of each population Here, MJ indicate samples from Shizuoka, Japan (wild); MMD
indicates samples from Mahajamba, Madagascar (Domesticated); MMO indicates samples from
Hawaii, HI, USA (Domesticated); MS indicate samples from Setiu Wetland, Malaysia (wild); MT
indicates samples from Petchaburi, Thailand (Domesticated).
Figure 4. Neighbor-joining trees based on the Nei’s genetic distances for all SNP loci dataset (A) and
the putatively adaptive panel of SNP loci dataset (B) of five broodstock populations of Penaeus
monodon in the Indo-Pacific region. Branch nodes are denoted as the percentage of bootstrap support
that was generated with 1000 replicates. Here, MJ indicate samples from Shizuoka, Japan (wild); MS
indicate samples from Setiu Wetland, Malaysia (wild); MMD indicates samples collected from
Mahajamba, Madagascar (Domesticated); MMO indicates samples from Hawaii, HI, USA
(Domesticated); MT indicates samples from Petchaburi Province, Thailand (Domesticated). The
numeric number next to the sample name abbreviation indicates the respective individual tag number
during collection.
Figure 3. Plots showing the discriminant analysis of principal components (DAPCs) of geneticdifferentiation for the all (A) and the putatively adaptive (B) SNP loci of five broodstock populations ofPenaeus monodon. Ovals are the inertial ellipse, dot represent individual genotypes and the line extendsto centroids of each population Here, MJ indicate samples from Shizuoka, Japan (wild); MMD indicatessamples from Mahajamba, Madagascar (Domesticated); MMO indicates samples from Hawaii, HI, USA(Domesticated); MS indicate samples from Setiu Wetland, Malaysia (wild); MT indicates samples fromPetchaburi, Thailand (Domesticated).
Biology 2020, 8, x 10 of 22
Figure 3. Plots showing the discriminant analysis of principal components (DAPCs) of genetic
differentiation for the all (A) and the putatively adaptive (B) SNP loci of five broodstock populations
of Penaeus monodon. Ovals are the inertial ellipse, dot represent individual genotypes and the line
extends to centroids of each population Here, MJ indicate samples from Shizuoka, Japan (wild); MMD
indicates samples from Mahajamba, Madagascar (Domesticated); MMO indicates samples from
Hawaii, HI, USA (Domesticated); MS indicate samples from Setiu Wetland, Malaysia (wild); MT
indicates samples from Petchaburi, Thailand (Domesticated).
Figure 4. Neighbor-joining trees based on the Nei’s genetic distances for all SNP loci dataset (A) and
the putatively adaptive panel of SNP loci dataset (B) of five broodstock populations of Penaeus
monodon in the Indo-Pacific region. Branch nodes are denoted as the percentage of bootstrap support
that was generated with 1000 replicates. Here, MJ indicate samples from Shizuoka, Japan (wild); MS
indicate samples from Setiu Wetland, Malaysia (wild); MMD indicates samples collected from
Mahajamba, Madagascar (Domesticated); MMO indicates samples from Hawaii, HI, USA
(Domesticated); MT indicates samples from Petchaburi Province, Thailand (Domesticated). The
numeric number next to the sample name abbreviation indicates the respective individual tag number
during collection.
Figure 4. Neighbor-joining trees based on the Nei’s genetic distances for all SNP loci dataset (A) andthe putatively adaptive panel of SNP loci dataset (B) of five broodstock populations of Penaeus monodonin the Indo-Pacific region. Branch nodes are denoted as the percentage of bootstrap support that wasgenerated with 1000 replicates. Here, MJ indicate samples from Shizuoka, Japan (wild); MS indicatesamples from Setiu Wetland, Malaysia (wild); MMD indicates samples collected from Mahajamba,Madagascar (Domesticated); MMO indicates samples from Hawaii, HI, USA (Domesticated); MTindicates samples from Petchaburi Province, Thailand (Domesticated). The numeric number next tothe sample name abbreviation indicates the respective individual tag number during collection.
Biology 2020, 9, 277 11 of 22Biology 2020, 8, x 11 of 22
Figure 5. Bayesian STRUCTURE bar plot for all SNP loci dataset (A) and the putatively adaptive panel
of SNP loci dataset identified by pcadapt approaches (B) of five broodstock populations of Penaeus
monodon in the Indo-Pacific region. Each color represents the proportion of inferred ancestry from K
ancestral populations and each bar represents an individual sample. Based on the delta K statistic, the
best supported number of a posteriori genetic clusters was K = 2 for the standard admixture model.
Here, MJ indicate samples from Shizuoka, Japan (wild); MS indicate samples from Setiu Wetland,
Malaysia (wild); MMD indicates samples from Mahajamba, Madagascar (Domesticated); MMO
indicates samples from Hawaii, HI, USA (Domesticated); MT indicates samples from Petchaburi
Province, Thailand (Domesticated). The numeric number next to the sample name abbreviation
indicates the respective individual tag number during collection.
3.5. GO Categorization of the Encoding Genes of Putatively Adaptive SNP Loci
The 4983 putatively adaptive SNP loci sequences identified as outliers with the pcadapt
approach were blasted against the genome of the Pacific white shrimp (L. vannamei), and 50 of them
yielded significant matches with CDS amino acid sequences (Table S3). Among the 50 CDS amino
acids sequences, 5 (COX3, ND4, ND6, CYTB, ND1) originated from mitochondrion, 16 were from
known characterized protein, while the remaining 29 were uncharacterized protein Table S3. The 50
CDS were then subjected to GO and KEGG pathway enrichment analysis to discern the functional
characterization of the genes encoded within the identified adaptive SNP loci. The GO results showed
that most of the enriched pathways were linked to physiological functions, such as respiration,
metabolism and energy derivation through mitochondrial oxidative phosphorylation and other
organic compounds (Figure 6, Table S4). Many of these genes were involved in respiratory electron
transport chain, respiratory chain complex, cellular respiration, aerobic respiration, respirasome,
oxydoreductase activity, oxydative phosphorylation, organelle envelop, mitochondrion,
mitochondrial envelope, membrane protein complex, generation of precursor metabolites and
energy, energy derivation by oxidation of organic compounds, catalytic complex and the ATP
metabolic process. KEGG pathway enrichment further demonstrated the involvement of the encoded
genes in pathways related to metabolism, oxidative phosphorylation, cardiac muscle contraction and
endocytosis, which is in coordination with the results of GO enrichment (Figure 7, Table S5). In
addition, this study reveals an array of uncharacterized proteins with unknown functions. One
uncharacterized protein LOC113820286 also appeared to be involved in respiration, the
mitochondrial protein complex, the generation of precursor metabolites and energy and electron
transport and ATP synthesis, like known mt proteins ND4, ND1, CYTB and COX3 (Table S4).
Figure 5. Bayesian STRUCTURE bar plot for all SNP loci dataset (A) and the putatively adaptive panelof SNP loci dataset identified by pcadapt approaches (B) of five broodstock populations of Penaeusmonodon in the Indo-Pacific region. Each color represents the proportion of inferred ancestry from Kancestral populations and each bar represents an individual sample. Based on the delta K statistic,the best supported number of a posteriori genetic clusters was K = 2 for the standard admixturemodel. Here, MJ indicate samples from Shizuoka, Japan (wild); MS indicate samples from SetiuWetland, Malaysia (wild); MMD indicates samples from Mahajamba, Madagascar (Domesticated);MMO indicates samples from Hawaii, HI, USA (Domesticated); MT indicates samples from PetchaburiProvince, Thailand (Domesticated). The numeric number next to the sample name abbreviationindicates the respective individual tag number during collection.
3.5. GO Categorization of the Encoding Genes of Putatively Adaptive SNP Loci
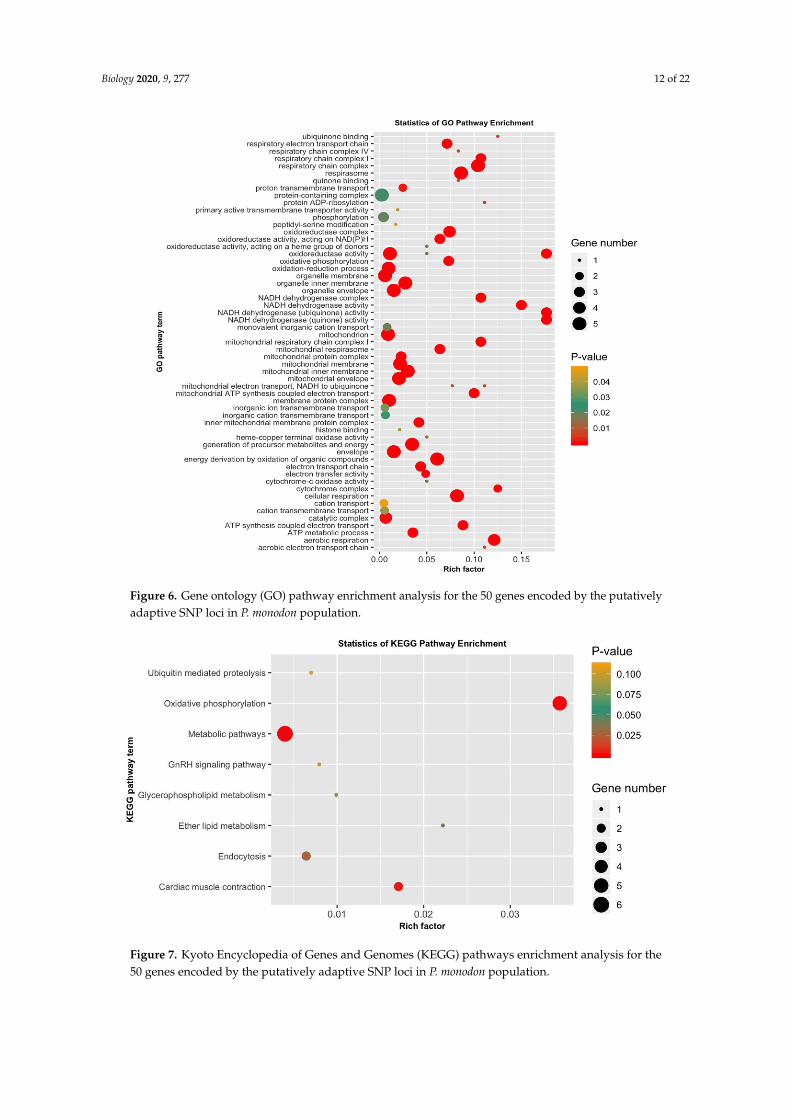
The 4983 putatively adaptive SNP loci sequences identified as outliers with the pcadapt approachwere blasted against the genome of the Pacific white shrimp (L. vannamei), and 50 of them yieldedsignificant matches with CDS amino acid sequences (Table S3). Among the 50 CDS amino acidssequences, 5 (COX3, ND4, ND6, CYTB, ND1) originated from mitochondrion, 16 were from knowncharacterized protein, while the remaining 29 were uncharacterized protein Table S3. The 50 CDS werethen subjected to GO and KEGG pathway enrichment analysis to discern the functional characterizationof the genes encoded within the identified adaptive SNP loci. The GO results showed that most of theenriched pathways were linked to physiological functions, such as respiration, metabolism and energyderivation through mitochondrial oxidative phosphorylation and other organic compounds (Figure 6,Table S4). Many of these genes were involved in respiratory electron transport chain, respiratory chaincomplex, cellular respiration, aerobic respiration, respirasome, oxydoreductase activity, oxydativephosphorylation, organelle envelop, mitochondrion, mitochondrial envelope, membrane proteincomplex, generation of precursor metabolites and energy, energy derivation by oxidation of organiccompounds, catalytic complex and the ATP metabolic process. KEGG pathway enrichment furtherdemonstrated the involvement of the encoded genes in pathways related to metabolism, oxidativephosphorylation, cardiac muscle contraction and endocytosis, which is in coordination with the resultsof GO enrichment (Figure 7, Table S5). In addition, this study reveals an array of uncharacterizedproteins with unknown functions. One uncharacterized protein LOC113820286 also appeared to beinvolved in respiration, the mitochondrial protein complex, the generation of precursor metabolitesand energy and electron transport and ATP synthesis, like known mt proteins ND4, ND1, CYTB andCOX3 (Table S4).
Biology 2020, 9, 277 12 of 22Biology 2020, 8, x 12 of 22
Figure 6. Gene ontology (GO) pathway enrichment analysis for the 50 genes encoded by the
putatively adaptive SNP loci in P. monodon population.
Figure 7. Kyoto Encyclopedia of Genes and Genomes (KEGG) pathways enrichment analysis for the
50 genes encoded by the putatively adaptive SNP loci in P. monodon population.
4. Discussion
Revealing the population structure patterns of P. monodon broodstocks is important for the
systematic monitoring and management of both natural and wild populations. This study applied
Figure 6. Gene ontology (GO) pathway enrichment analysis for the 50 genes encoded by the putativelyadaptive SNP loci in P. monodon population.
Biology 2020, 8, x 12 of 22
Figure 6. Gene ontology (GO) pathway enrichment analysis for the 50 genes encoded by the
putatively adaptive SNP loci in P. monodon population.
Figure 7. Kyoto Encyclopedia of Genes and Genomes (KEGG) pathways enrichment analysis for the
50 genes encoded by the putatively adaptive SNP loci in P. monodon population.
4. Discussion
Revealing the population structure patterns of P. monodon broodstocks is important for the
systematic monitoring and management of both natural and wild populations. This study applied
Figure 7. Kyoto Encyclopedia of Genes and Genomes (KEGG) pathways enrichment analysis for the50 genes encoded by the putatively adaptive SNP loci in P. monodon population.
Biology 2020, 9, 277 13 of 22
4. Discussion
Revealing the population structure patterns of P. monodon broodstocks is important for thesystematic monitoring and management of both natural and wild populations. This study appliedSkimSeq-based data to explore the variation of P. monodon broodstocks collected from natural habitatsand shrimp farms in the Indo-Pacific regions. Loci with a high resolving power and potentially underselective process were detected. We observed a remarkable divergence between the domesticated andwild broodstocks. Although similar genetic discriminations were observed, putatively adaptive SNPloci most powerfully detected the genetic discrimination, as revealed by demographic interpretationsand inferred clustering analyses. Compared to conventional molecular markers used for populationgenetic studies, our SkimSeq approach uses unbiased whole genome sequences to accurately identifythe traces of selection that cause genetic differentiation using a lower coverage area with combinationof small population size [77,78]. We noted that the impact of random genetic drift is larger in smallersample size [79]. However, empirical studies have denoted that high throughput DNA sequencing havecompensated smaller sample size with large number of generated SNP loci, to ensure high accuracy inestimating population genetic parameters [80–82]. Sample size as low as four individuals have beendocumented to be efficient in providing a precise estimate of FST values [83,84]. Indeed, a universalsample size rule may not be feasible to address the complexities in genomic kinship estimates [85].As such, with the supporting power analysis output, the number of samples used in the present studyis optimal in generating datasets of high precision.
AMOVA of putatively adaptive SNP loci showed a high total variance of 80.8% attributed todifferences between the wild and domesticated groups. The low pairwise FST between wild populationsof MS and MJ indicate that the two broodstock populations have genetic affinity, which could be the resultof reciprocal transport, despite showing no significant geographic proximity, and this genetic patterncan be seen in other species, such as giant freshwater prawn (Macrobrachium rosenbergii) [86,87]. The NJtree (Figure 4) and Bayesian STRUCTURE analysis (Figure 5) suggest limited genetic differentiationbetween all cultured populations (MMO, MMD and MT), implying that they might be derived fromsimilar sources prior to domestication. Significant genetic similarity between the cultured populationsmay have stemmed from similar founder populations and selection procedures, which are normallypracticed in shrimp industry.
Wild populations (MS, MJ) co-locate on another branch in NJ tree, indicating they have a separateorigin from the cultured populations [86]. Besides, pairwise FST estimates, AMOVA, DAPC plot andSTRUCTURE analysis agree with the genetic homogeneity of domesticated populations and theirsignificant differentiation from the wild progenitor populations [88,89], particularly more significantfor the putatively adaptive dataset. Significant genetic differentiation between domesticated stocksand wild populations has not been commonly observed in studies of the same species [37], but in otherspecies such as salmon (Salmo salar) [90], grass carp (Ctenopharyngodon idella) [91,92] and Asian seabass(Lates calcarifer) [93].
In the present study, only one individual from MJ population was genetically identical to thecultured populations. Wild broodstocks, obtained as founders for shrimp domestication program,have been subjected to mass selection process over many generations, which may render lower geneticaffinity between the cultured and wild populations. We also hypothesize that the founder broodstocksfor the domestication program may have originated from more than one shrimp breeding company,and wild populations of different geographical localities. A lack of significant differentiation amongdomesticated populations may suggest the probability of a relatively short domestication history orgenetically closely related populations [94].
Lack of gene flow between domesticated and wild populations is not unexpected when the confinedenvironment of shrimp hatcheries and farms were taken into consideration. Moreover, our experimentaldesign have defiled the potential occurrence of escapees from farms to the natural environment, giventhat all individuals were only obtained from populations, which were isolated completely from eachother with a minimum of 500 km apart (MT and MS). The genetic structuring pattern being impacted by
Biology 2020, 9, 277 14 of 22
farm escapees was not uncommon, and has been reported in P. monodon [33,95]. However, more shrimpsamples of wild and cultured stocks from different regions need to be analyzed to validate this geneticdistinction. In fact, previous studies have suggested that fragmentation was commonly observedwithin the penaeid shrimp populations that were geographically separated by smaller distance [96].
The genetic homogeneity between the domesticated populations may be due to the artificialselection of favorable traits or adaptation to similar aquaculture practices. Aquaculture practices havebeen observed to reduce genetic variability in farmed reared stocks of other aquatic species [97–99].Despite being geographically isolated, the genetic similarity among the wild populations, couldpossibly be linked to adaptive fitness to similar environmental conditions [100,101]. Convergentevolution has been documented in abalone (Haliotis midae) [102] and scallops (Pectinidae) [103],inhabiting analogous ecological niches, which subsequently develop consonant phenotypic traits.In addition, early population genetic studies on penaeid shrimp based on various techniques, includingallozyme, RAPD and mtDNA analyses, showed that small genetic differences in these species wereattributed to the dispersal ability, life history of shrimp and lack of physical barriers in the marineenvironment [32,95,104,105].
The effect of random genetic drift is more accentuated in smaller sample size [106]. Unequalsex ratio or differential reproductive contributions of the broodstocks in most breeding programsmay cause random genetic drift [94,107]. In the present study, the low genetic differences betweendomesticated populations might be partially caused by random genetic drift or regionally differentselective regimes [108]. Although this factor is a determinant key in dramatic depression of geneticvariability in domesticated populations, it is beyond the scope of this study.
Unique genes also persists in differentiating the domesticated and wild populations, which canbe explained by selection of differentially favored alleles, holding particular reference to geneticimprovement program in captive breeding environment [89]. The evidence of differential selectionbetween the two groups (Figures 4 and 5) highlighting the role of selection as a major evolutionary forcein driving genetic divergence, specifically in domesticated populations. Selective pressures may be inpart responsible for facilitating population variation; considering that these domesticated stocks havebeen undergoing grading procedures where undesired specimens were culled in the entire productionsystem [89]. On the other hand, population heterogeneity connected to adaptation to environmentalfactors or ecological niches is well revealed in wild populations [102,109,110]. The development ofecotypes is well documented for many aquatic species in various environments where environmentalclines persist [111–113].
The putatively adaptive SNP loci identified by the pcadapt approach also identifies genomicregions associated with the strong artificial selection during the domestication process over temporalscales. Of the 4983 putatively adaptive SNPs, only 50 genes were encoded successfully annotatedthrough BLAST analysis. We have an array of uncharacterized proteins, with their functions are notknown. Moreover, it was also observed that five mitochondrial genes (COX3, ND4, ND6, CYTB, ND1)were mutated among different populations of P. monodon. mtDNA has been widely used in populationgenetic studies to reconstruct phylogenetic relationships and analyze population structure [114],due to its unique characteristics such as maternal inheritance, neutrality, higher mutational ratethan nuclear DNA and little to no recombination [115–117]. However, the prominent functionsof a set of proteins encoded by mitochondrial genome in cellular energy production question itsutility as a neutral marker [118]. In fact, our results from the KEGG pathway enrichment analysishas also suggested the presence of mutations under positive selection for the peptides, in whichtheir functional properties are highly related in metabolic efficiency. Mitochondria produce 95% ofcellular energy through oxidative phosphorylation of ADP (adenosine diphosphate) to form ATP(adenosine triphosphate). There is evidence that shows that several proteins containing mitochondrialencoded amino acids are involved not only in ion translocation, but also in mitochondrial respirationregulation [119,120]. Variation in mtDNA maybe taxon specific [121], and is linked to a range ofenvironmental conditions affecting metabolic processes [122], development rates [123], biological
Biology 2020, 9, 277 15 of 22
ageing [124] and fitness. Mutations in the mitochondrial genome may affect the ability of mitochondriain ATP production [125], and putative maternal effects of mitochondrial genome on fish growth rate hasbeen observed in other species, such as the Atlantic salmon [126]. Natural selection has also favoredco-adaptative functions between mtDNA and nuclear DNA in maintaining optimal metabolic functionand, thus, shaping the evolution of a species populations [127,128]. Despite being extensively utilizedin manifold population structure studies, our findings have discovered the core functional properties ofmitochondrial genome, particularly those involved in metabolic and energy productions as the drivingforce of population divergence. These fine attributes of mitochondrial functional properties warrantfurther new exploration and continual usage as one of the parameters in population genomics studiesof various organisms. It has also been noticed that several genes are likely linked to other biologicalfunctions like molting (cuticle protein 21-like) [129], developmental process (neurotrophin 1-like) [130]and immunity (baculoviral IAP repeat-containing protein, serine protease 42-like) [131,132]. However,the present findings demonstrated that the nonsynonymous mutations in these encoded genes mightbe associated with different biological functions, which may enable P. monodon broodstocks to adapt tostrong artificial selection during domestication process.
5. Conclusions
We observed a pronounced genetic divergence between the wild and domesticated broodstockpopulations of P. monodon across the Indo-Pacific region. We suggested that similar founder populations,artificial selection regimes of desired commercial traits and local adaptive process to similar aquaculturepractices have dramatically reduced the genetic heterogeneity of the domesticated stocks. Despite beinggeographically isolated, we denote that the patterns of genetic homogeneity in wild populations maybestrongly influenced by hydrographic conditions and ecological niches which are expected to increase theadaptive processes of the populations towards their natural habitats. Genetic differences between wildand domesticated populations presented in this study can be likely explained by a number of uniquegenes within the putatively adaptive SNP loci. These genes were found to be significantly associatedwith the mitochondrial genome. Our results from KEGG pathway analysis further reinforce thepotential selective force which have diverged both groups. We noted the presence of polymorphism inthe mitochondrial regions, notably those that are related to the energy production, metabolic functions,respiration regulation and developmental rates. The combination of these functional properties ofpeptide encoded by mitogenome are linked to various environmental parameters, and this likelyacting to promote the genetic isolation of domesticated populations from their wild. Separated bygeographical distance and various selection breeding programs, these two groups may each developlocal adaptation to ecological niches, biological traits and demographic histories found within theirthriving habitats. Taken together, this study has demonstrated the applicability of SkimSeq in a highlyduplicated genome of penaeid shrimp, P. monodon specifically, across a range of genetic backgroundsand geographical distributions. This ultra-low sequencing coverage has enabled the sequencing oflow number of individuals to achieve either similar or perhaps more powerful coverage, but withlower cost than other traditional GBS methods. In future work, larger sample sizes from a largernumber of populations collected from wider distribution range should be included within a similarcomparative framework, to validate if this specific trend represents a general rule associated with thegenetic divergence of P. monodon broodstocks.
Supplementary Materials: The following are available online at http://www.mdpi.com/2079-7737/9/9/277/s1,Table S1: Number of read pairs before and after quality control of each individuals of Penaeus monodon collectedfrom different Indo-Pacific region, Table S2: Reads alignment rate of each individual of Penaeus monodon collectedfrom different Indo-Pacific region, Table S3: Summary of the gene annotation of the putatively adaptive panel ofthe SNP loci of broodstock populations of Penaeus monodon based on the reference genomes of Pacific white shrimpLitopenaeus vannamei, Table S4: Result of GO enrichment analysis showing significant GO pathway terms (p < 0.05)of the 50 genes encoded by the putatively adaptive panel of the SNP loci of P. monodon population, Table S5: KyotoEncyclopedia of Genes and Genomes (KEGG) pathway terms and statistics of KEGG pathway enrichment analysisof the 50 genes encoded by the putatively adaptive panel of the SNP loci of P. monodon population.
Biology 2020, 9, 277 16 of 22
Author Contributions: Conceptualization and design of the research, L.L.W. and M.A.; Field work and datacollection, S.I., and K.O.; Methodology, Z.M.D., L.L.W., Q.A., and S.Y.L.; Bioinformatics and spatial analysis, Y.I.,S.A. and M.A.; Molecular data curation, M.A., S.H. and Mariom; Writing—original draft preparation, M.A., L.L.W.,Mariom and Z.M.D.; Writing—review and editing, L.L.W., M.A., K.O., Q.A., S.A. and M.I.; Project administration,L.L.W.; Funding acquisition, L.L.W. All authors have read and agreed to the published version of the manuscript.
Funding: This study was funded by the Illumina, Inc. and ScienceVision Sdn. Bhd under the AgrigenomicSkimSeq Grant and Ministry of Higher Education, Malaysia under the Niche Research Grant Scheme (NRGS)(NRGS/ 2014/53131/6).
Acknowledgments: We would like to express our deepest gratitude to BioEasy Sdn. Bhd. for the sequencing,notably to Tay Yea-Ling, Teow Kok Sin, Khor Bee Yin and Lim Lik-Sin. We would also like to thank WilhelmEng from Monash University Malaysia Genomics Facility for his technical and administrative assistance. Specialthanks to Alunan Asli Sdn Bhd for providing domesticated broodstocks (MMO, MMD, MT).
Conflicts of Interest: The authors declare no conflict of interest.
References
1. FAO (Food and Agriculture Organization of the United Nations). The State of World Fisheries and Aquaculture2020; Sustainability in Action; FAO: Rome, Italy, 2020.
2. FAO (Food and Agriculture Organization of the United Nations). GLOBEFISH—Information and Analysis onWorld Fish Trade; FAO: Italy, Rome, 2019.
3. Venkateswarlu, V.; Venkatrayulu, C. Prevalence of disease problems affecting shrimp Litopenaeus vannameifarming in Andhra Pradesh, India. Int. J. Fish. Aquat. Stud. 2019, 7, 275–279.
4. Wyban, J.; Martinez, G.; Sweeney, J.N. Adding paprika to Penaeus vannamei maturation diet improves naupliiquality. World Aquac. 1997, 28, 59–62.
5. Klinbunga, S.; Siludjai, D.; Wuthijinda, W.; Tassanakajon, A.; Jarayabhand, P.; Menasveta, P. Geneticheterogeneity of the giant tiger shrimp (Penaeus monodon) in Thailand revealed by RAPD and mtDNA-RFLPanalyses. Mar. Biotechnol. 2001, 3, 428–438. [CrossRef] [PubMed]
6. Nahavandi, R.; Hafezamini, P.; Shamsudin, M.N. Genetic diversity of intensive cultured and wild tigershrimp Penaeus monodon (Fabricius) in Malaysia using microsatellite markers. Afr. J. Biotechnol. 2011,10, 15501–15508. [CrossRef]
7. FAO (Food and Agriculture Organization of the United Nations). Improving Penaeus Monodon HatcheryPractices; FAO Fisheries Technical Paper 446; FAO: Rome, Italy, 2007.
8. Andam, C.P.; Challagundla, L.; Azarian, T.; Hanage, W.P.; Robinson, D.A. 3—Population Structure 2017, Pages51–70 of Pathogenic Bacteria. In Genetics and Evolution of Infectious Diseases, 2nd ed.; Elsevier: Amsterdam,The Netherlands, 2017; pp. 51–70.
9. Fowler, S.; Roush, R.; Wise, J. Concept of Biology. OpenStax, Pressbook. 2019. Available online: https://openstax.org/details/books/concepts-biology (accessed on 28 June 2020).
10. De León, F.J.G.; Galván-Tirado, C.; Velasco, L.S.; Segundo, C.A.S.; Guzmán, H.R.; Barriga-Sosa, I.A.;Jaimes, P.D.; Canino, M.; Cruz-Hernandez, P. Role of oceanography in shaping the genetic structure in theNorth Pacific hake Merluccius productus. PLoS ONE 2018, 13, e0194646.
11. Perina, A.; Mari-Mena, N.; Torrecilla, Z.; González-Tizón, A.M.; González-Castellano, I.; González-Ortegón, E.;Martínez-Lage, A. Assessment of genetic diversity and population structure of the common littoralshrimp Palaemon serratus (Pennant, 1777) by microsatellites: Towards a sustainable management. AquaticConservation. Mar. Freshw. Ecosyst. 2018, 29, 528–536. [CrossRef]
12. Yu, L.; Zhu, X.; Liang, J.; Fan, J.; Chen, C. Analysis of genetic structure of wild and cultured Giant FreshwaterPrawn (Macrobrachium rosenbergii) using newly developed microsatellite. Front. Mar. Sci. 2019, 6, 323.[CrossRef]
13. Shen, Y.; Wang, L.; Fu, J.; Xu, X.; Yue, G.H.; Li, J. Population structure, demographic history and localadaptation of the grass carp. BMC Genom. 2019, 20, 467. [CrossRef]
14. Dixon, T.J.; Coman, G.J.; Arnold, S.J.; Sellars, M.J.; Lyons, R.E.; Dierens, L.E.; Preston, N.G.; Li, Y. Shiftsin genetic diversity during domestication of Black Tiger shrimp, Penaeus monodon, monitored using twomultiplexed microsatellite systems. Aquaculture 2008, 283, 1–6. [CrossRef]
Biology 2020, 9, 277 17 of 22
15. Souza de Lima, A.P.; Lira dos, S.A.C.; Dantas, H.L.; Gomes, F.M.; Maggioni, R.; Moura, C.M.R. Geneticmonitoring of broodstocks of the marine shrimp Litopenaeus vannamei in a closed rearing system inPernambuco, Brazil. Aquac. Res. 2008, 39, 1461–1466. [CrossRef]
16. Benzie, J.A.H. Use and exchange of genetic resources of penaeid shrimps for food and aquaculture. Rev. Aquac.2009, 1, 232–250. [CrossRef]
17. Perez-Enriquez, R.; Hernández-Martínez, F.; Cruz, P. Genetic diversity status of White shrimp Penaeus(Litopenaeus) vannamei broodstock in Mexico. Aquaculture 2009, 297, 44–50. [CrossRef]
18. Zhang, T.; Kong, J.; Wang, W.; Wang, Q. Genetic variability assessed by microsatellites in the breedingpopulations of the shrimp Penaeus (Fenneropenaeus) chinensis in China. Aquaculture 2010, 310, 229–233.[CrossRef]
19. Li, Z.-M.; Xie, L.; Ye, F.; Chen, G. SSR analysis of three species from primary parent and their first generationof Litopenaeus vannamei. Agric. Biotechnol. 2010, 11, 57–61.
20. De Donato, M.; Manrique, R.; Ramirez, R.; Mayer, L.; Howell, C. Mass selection and inbreeding effects on acultivated strain of Penaeus (Litopenaeus) vannamei in Venezuela. Aquaculture 2005, 247, 159–167. [CrossRef]
21. Khedkar, G.D.; Reddy, A.C.; Ron, T.B.; Haymer, D. High levels of genetic diversity in Penaeus monodonpopulations from the east coast of India. Springer Plus 2013, 2, 671. [CrossRef]
22. Ríos-Pérez, L.D.L.; Campos-Montes, G.R.; Martínez-Ortegad, A.; Castillo-Juárez, H.; Montaldo, H.H.Inbreeding effects on reproductive traits in a breeding population of Pacific white shrimp Penaeus (Litopenaeus)vannamei. Aquaculture 2017, 479, 442–446. [CrossRef]
23. Lynch, M.; Walsh, B. Genetics and Analysis of Quantitative Traits; Sinauer Associates: Sunderland, MA,USA, 1998.
24. Hedrick, P.W.; Kalinowski, S.T. Inbreeding depression in conservation biology. Annu. Rev. Ecol. Syst. 2000,31, 139–162. [CrossRef]
25. Ponzoni, R.W.; Khaw, H.L.; Nguyen, N.H.; Hamzah, A. Inbreeding and effective population size in theMalaysian nucleus of the GIFT strain of Nile tilapia (Oreochromis niloticus). Aquaculture 2010, 302, 42–48.[CrossRef]
26. Francisco, A.K.; Galetti, P.M., Jr. Genetic distance between broodstock of the marine shrimp Litopenaeusvannamei (Decapoda, Penaeidae) by mtDNA analyses. Genet. Mol. Biol. 2005, 28, 258–261. [CrossRef]
27. Rezaee, S.; Farahmand, H.; Nematollahi, M.A. Genetic diversity status of Pacific white shrimp (Litopenaeusvannamei) using SSR markers in Iran. Aquac. Int. 2015, 247, 159–167. [CrossRef]
28. Gaiotto, F.A.; Bramucci, M.; Grattapaglia, D. Estimation of outcrossing rate in a breeding population ofEucalyptus urophylla with dominant RAPD and AFLP markers. Theor. Appl. Genet. 1997, 95, 842–849.[CrossRef]
29. Benzie, J.A.H.; Ballment, E.; Forbes, A.T.; Demetriades, N.T.; Sugama, K.; Haryanti; Moria, S. MitochondrialDNA variation in Indo-Pacific populations of the Giant Tiger prawn, Penaeus monodon. Mol. Ecol. 2002,11, 2553–2569. [CrossRef] [PubMed]
30. Waqairatu, S.S.; Dierens, L.; Cowley, J.A.; Dixon, T.J.; Johnson, K.N.; Barnes, A.C.; Li, Y. Genetic analysis ofBlack Tiger shrimp (Penaeus monodon) across its natural distribution range reveals more recent colonizationof Fiji and other South Pacific Islands. Ecol. Evol. 2012, 2, 2057–2071. [CrossRef]
31. Sugama, K.; Haryanti Benzie, J.A.H.; Ballment, E. Genetic variation and population structure of the gianttiger prawn, Penaeus monodon, in Indonesia. Aquaculture 2002, 205, 37–48. [CrossRef]
32. Brooker, A.L.; Benzie, J.A.H.; Blair, D.; Versini, J.J. Population structure of the giant tiger prawn Penaeusmonodon in Australian waters, determined using microsatellite markers. Mar. Biol. 2000, 136, 149–157.[CrossRef]
33. Xu, Z.K.; Primavera, J.H.; de la Pena, L.D.; Belak, J.; Alcivar-Warren, A. Genetic diversity of wild and culturedBlack tiger Shrimp (Penaeus monodon) in the Philippines using microsatellites. Aquaculture 2001, 199, 13–40.[CrossRef]
34. You, E.M.; Chiu, T.S.; Liu, K.F.; Tassanakajon, A.; Klinbunga, S.; Triwitayakorn, K.; de la Peña, L.D.; Li, Y.;Yu, H.T. Microsatellite and mitochondrial haplotype diversity reveals population differentiation in the tigershrimp (Penaeus monodon) in the Indo-Pacific region. Anim. Genet. 2008, 39, 267–277. [CrossRef]
35. Walther, E.; Schöfl, G.; Mrotzek, G.; Sugama, K.; Saluz, H.P. Paralogous mitochondrial control regionin the giant tiger shrimp, Penaeus monodon (F.) affects population genetics inference: A cautionary tale.Mol. Phylogenetics Evol. 2011, 58, 404–408. [CrossRef]
Biology 2020, 9, 277 18 of 22
36. Abdul-Aziz, M.A.; Sch€ofl, G.; Mrotzek, G.; Haryanti, H.; Sugama, K.; Saluz, H.P. Population structureof the Indonesian giant tiger shrimp Penaeus monodon: A window into evolutionary similarities betweenparalogous mitochondrial DNA sequences and their genomes. Ecol. Evol. 2015, 5, 3570–3584. [CrossRef]
37. Duda, T.F.; Palumbi, S.R. Population structure of the black tiger prawn, Penaeus monodon, among westernIndian Ocean and western Pacific populations. Mar. Biol. 1999, 134, 705–710. [CrossRef]
38. Carreras, C.; Ordóñez, V.; Zane, L.; Kruschel, C.; Nasto, I.; Macpherson, E.; Pascual, M. Population genomicsof an endemic Mediterranean fish: Differentiation by fine scale dispersal and adaptation. Sci. Rep. 2016,7, 43417. [CrossRef] [PubMed]
39. Vendrami, D.L.; Telesca, L.; Weigand, H.; Weiss, M.; Fawcett, K.; Lehman, K.; Clark, M.S.; Leese, F.; McMinn, C.;Moore, H.; et al. RAD sequencing resolves fine-scale population structure in a benthic invertebrate: Implicationsfor understanding phenotypic plasticity. R. Soc. Open Sci. 2017, 4, 160548. [CrossRef] [PubMed]
40. Murphy, M.O.; Jones, K.S.; Price, S.J.; Weisrock, D.W. A genomic assessment of population structure and geneflow in an aquatic salamander identifies the roles of spatial scale, barriers, and river architecture. Freshw. Biol.2018, 63, 407–419. [CrossRef]
41. Asaduzzaman, M.; Wahab, M.A.; Rahman, M.J.; Nahiduzzzaman, M.; Dickson, M.W.; Igarashi, Y.; Asakawa, S.;Wong, L.L. Fine-scale population structure and ecotypes of anadromous Hilsa shad (Tenualosa ilisha) acrosscomplex aquatic ecosystems revealed by NextRAD genotyping. Sci. Rep. 2019, 9, 1–14. [CrossRef]
42. Zhang, B.D.; Xue, D.X.; Li, Y.L.; Liu, J.X. RAD genotyping reveals fine-scale population structure and providesevidence for adaptive divergence in a commercially important fish from the northwestern Pacific Ocean.PeerJ 2019, 7, e7242. [CrossRef]
43. Sherman, K.D.; Paris, J.R.; King, R.A.; Moore, K.A.; Dahlgren, C.P.; Knowles, L.C.; Stump, K.; Tyler, C.R.;Stevens, J.R. RAD-Seq Analysis and in situ Monitoring of Nassau Grouper Reveal Fine-Scale PopulationStructure and Origins of Aggregating Fish. Front. Mar. Sci. 2020, 7, 157. [CrossRef]
44. Gamboa, M.; Watanabe, K. Genome-wide signatures of local adaptation among seven stoneflies speciesalong a nationwide latitudinal gradient in Japan. BMC Genom. 2019, 20, 84. [CrossRef]
45. Huang, X.; Feng, Q.; Qian, Q.; Zhao, Q.; Wang, L.; Wang, A.; Guan, J.; Fan, D.; Weng, Q.; Huang, T.; et al.High-throughput genotyping by whole-genome resequencing. Genome Res. 2009, 19, 1068–1076. [CrossRef]
46. Bayer, P.E.; Ruperao, P.; Mason, A.S.; Stiller, J.; Chan, C.K.K.; Hayashi, S.; Long, Y.; Meng, J.; Sutton, T.;Visendi, P.; et al. High-resolution skim genotyping by sequencing reveals the distribution of crossovers andgene conversions in Cicer arietinum and Brassica napus. Theor. Appl. Genet. 2015, 128, 1039–1045. [CrossRef]
47. Golicz, A.A.; Bayer, P.E.; Edwards, D. Skim-based genotyping by sequencing. Methods Mol. Biol. 2015,1245, 257–270. [PubMed]
48. Scheben, A.; Batley, J.; Edwards, D. Genotyping-by-sequencing approaches to characterize crop genomes:Choosing the right tool for the right application. Plant Biotechnol. J. 2017, 15, 149–161. [CrossRef] [PubMed]
49. Scheben, A.; Batley, J.; Edwards, D. Revolution in Genotyping Platforms for Crop Improvement. In Advancesin Biochemical Engineering Biotechnology; Springer: Berlin/Heidelberg, Germany, 2018.
50. Anderson, J.; Kantar, M.; Bock, D.; Grubbs, K.C.; Schilling, E.; Rieseberg, L. Skim-Sequencing Reveals theLikely Origin of the Enigmatic Endangered Sunflower Helianthus schweinitzii. Genes 2019, 10, 1040. [CrossRef][PubMed]
51. Bayer, P.E. Skim-Based Genotyping by Sequencing Using a Double Haploid Population to Call SNPs, InferGene Conversions, and Improve Genome Assemblies. In Plant Bioinformatics; Humana Press: New York, NY,USA, 2016; pp. 285–292.
52. Bayer, P.E.; Hurgobin, B.; Golicz, A.A.; Chan, C.K.K.; Yuan, Y.; Lee, H.; Renton, M.; Meng, J.; Li, R.; Long, Y.;et al. Assembly and comparison of two closely related Brassica napus genomes. Plant Biotechnol. J. 2017,15, 1602–1610. [CrossRef]
53. Gacek, K.; Bayer, P.E.; Bartkowiak-Broda, I.; Szala, L.; Bocianowski, J.; Edwards, D.; Batley, J. Genome-wideassociation study of genetic control of seed fatty acid biosynthesis in Brassica napus. Front. Plant Sci. 2017,7, 2062. [CrossRef] [PubMed]
54. Blotta, I.; Prestinaci, F.; Mirante, S.; Cantafora, A. Quantitative assay of total dsDNA with PicoGreen reagentand real-time fluorescent detection. Ann. Ist Super Sanita 2005, 41, 119–123.
55. Langmead, B.; Trapnell, C.; Pop, M.; Salzburg, S.L. Ultrafast and memory-efficient alignment of short DNAsequences to the human genome. Genome Biol. 2009, 10, R25. [CrossRef]
Biology 2020, 9, 277 19 of 22
56. Langmead, B.; Salzberg, S.L. Fast gapped-read alignment with Bowtie 2. Nat. Methods 2012, 9, 357–359.[CrossRef]
57. Li, Y.L.; Weng, J.C.; Hsiao, C.C.; Chou, M.T.; Tseng, C.W.; Hung, J.H. PEAT: An intelligent and efficientpaired-end sequencing adapter trimming algorithm. BMC Bioinform. 2015, 16, S2. [CrossRef]
58. Bolger, A.M.; Lohse, M.; Usadel, B. Trimmomatic: A flexible trimmer for Illumina sequence data. Bioinformatics2014, 30, 2114–2120. [CrossRef]
59. Luo, R.; Liu, B.; Xie, Y.; Li, Z.; Huang, W.; Yuan, J.; He, G.; Chen, Y.; Pan, Q.; Liu, Y.; et al. SOAPdenovo2:An empirically improved memory-efficient shortread de novo assembler. GigaScience 2012, 1, 18. [CrossRef]
60. Camacho, C.; Coulouris, G.; Avagyan, V.; Ma, N.; Papadopoulos, J.; Bealer, K.; Madden, T.L. BLAST+:Architecture and applications. BMC Bioinform. 2009, 10, 421. [CrossRef] [PubMed]
61. Bairoch, A.; Boeckmann, B.; Ferro, S.; Gasteiger, E. Swiss-Prot: Juggling between evolution and stability.Brief. Bioinform. 2004, 5, 39–55. [CrossRef] [PubMed]
62. Li, H.; Durbin, R. Fast and accurate short read alignment with Burrows–Wheeler transform. Bioinformatics2009, 25, 1754–1760. [CrossRef]
63. Garrison, E.; Marth, G. Haplotype-based variant detection from short-read sequencing. arXiv 2012,arXiv:1207.3907.
64. Pedersen, B.S.; Layer, R.M.; Quinlan, A.R. Vcfanno: Fast, flexible annotation of genetic variants. Genome Biol.2016, 17, 118. [CrossRef]
65. Zheng, X.; Levine, D.; Shen, J.; Gogarten, S.M.; Laurie, C.; Weir, B.S. A high-performance computing toolsetfor relatedness and principal component analysis of SNP data. Bioinformatics 2012, 28, 3326–3328. [CrossRef]
66. Danecek, P.; Auton, A.; Abecasis, G.; Albers, C.A.; Banks, E.; DePristo, M.A.; Handsaker, R.E.; Lunter, G.;Marth, G.T.; Sherry, S.T.; et al. The variant call format and VCFtools. Bioinformatics 2011, 27, 2156–2158.[CrossRef]
67. Duforet-Frebourg, N.; Luu, K.; Laval, G.; Bazin, E.; Blum, M.G. Detecting genomic signatures of naturalselection with principal component analysis: Application to the 1000 Genomes data. Mol. Biol. Evol. 2015,334, 1082–1093. [CrossRef]
68. Luu, K.; Bazin, E.; Blum, M.G.B. pcadapt: An R package to perform genome scans for selection based onprincipal component analysis. Mol. Ecol. Resour. 2017, 17, 67–77. [CrossRef]
69. Ryman, N.; Palm, S. POWSIM: A computer program for assessing statistical power when testing for geneticdifferentiation. Mol. Ecol. Notes 2006, 6, 600–602. [CrossRef]
70. Jombart, T. adegenet: An R package for the multivariate analysis of genetic markers. Bioinformatics 2008,24, 1403–1405. [CrossRef] [PubMed]
71. Meirmans, P.G.; van Tienderen, P.H. GENOTYPE and GENODIVE: Two programs for the analysis of geneticdiversity of asexual organisms. Mol. Ecol. Notes 2004, 4, 792–794. [CrossRef]
72. Pritchard, J.K.; Stephens, M.; Donnelly, P. Inference of population structure using multilocus genotype data.Genetics 2000, 155, 945–959. [PubMed]
73. Evanno, G.; Regnaut, S.; Goudet, J. Detecting the number of clusters of individuals using the softwarestructure: A simulation study. Mol. Ecol. 2005, 14, 2611–2620. [CrossRef]
74. Earl, D.A.; vonHoldt, B.M. STRUCTURE HARVESTER: A website and program for visualizing STRUCTUREoutput and implementing the Evanno method. Conserv. Genet. Resour. 2012, 4, 359–361. [CrossRef]
75. Kopelman, N.M.; Mayzel, J.; Jakobsson, M.; Rosenberg, N.A.; Mayrose, I. Clumpak: A program for identifyingclustering modes and packaging population structure inferences across K. Mol. Ecol. Resour. 2015, 15, 1179–1191.[CrossRef] [PubMed]
76. Xie, C.; Mao, X.; Huang, J.; Ding, Y.; Wu, J.; Dong, S.; Kong, L.; Gao, G.; Li, C.Y.; Wei, L. KOBAS 2.0:A web server for annotation and identification of enriched pathways and diseases. Nucleic Acids Res. 2011,39, W316–W322. [CrossRef]
77. Hollenbeck, C.M.; Portnoy, D.S.; Gold, J.R. Evolution of population structure in an estuarine-dependentmarine fish. Ecol. Evol. 2019, 9, 3141–3152. [CrossRef]
78. Milano, I.; Babbucci, M.; Cariani, A.; Atanassova, M.; Bekkevold, D.; Carvalho, G.R.; Espiñeira, M.;Fiorentino, F.; Garofalo, G.; Geffen, A.J.; et al. Outlier SNP markers reveal fine-scale genetic structuringacross European hake populations (Merluccius merluccius). Mol. Ecol. 2014, 23, 118–135. [CrossRef]
Biology 2020, 9, 277 20 of 22
79. Purves, W.K.; Sadava, D.; Orians, G.H.; Heller, H.C. Genetic drift may cause large changes in smallpopulations. In Life: The Science of Biology, 7th ed.; Sinauer Associates, Inc.: Sunderland, MA, USA, 2003;pp. 468–469.
80. Nazareno, A.G.; Bemmels, J.B.; Dick, C.W.; Lohmann, L.G. Minimum sample sizes for population genomics:An empirical study from an Amazonian plant species. Mol. Ecol. Resour. 2017, 17, 1136–1147. [CrossRef][PubMed]
81. Jeffries, D.L.; Copp, G.H.; Lawson Handley, L.; Olsén, K.H.; Sayer, C.D.; Hänfling, B. Comparing RAD seqand microsatellites to infer complex phylogeographic patterns, an empirical perspective in the Crucian carp,Carassius carassius, L. Mol. Ecol. 2016, 25, 2997–3018. [CrossRef] [PubMed]
82. Puckett, E.E.; Eggert, L.S. Comparison of SNP and microsatellite genotyping panels for spatial assignment ofindividuals to natal range: A case study using the American black bear (Ursus americanus). Biol. Conserv.2016, 193, 86–93. [CrossRef]
83. Qu, W.M.; Liang, N.; Wu, Z.K.; Zhao, Y.G.; Chu, D. Minimum sample sizes for invasion genomics: Empiricalinvestigation in an invasive whitefly. Ecol. Evol. 2020, 10, 38–49. [CrossRef] [PubMed]
84. Li, H.; Qu, W.; Obrycki, J.J.; Meng, L.; Zhou, X.; Chu, D.; Li, B. Optimizing Sample Size for PopulationGenomic Study in a Global Invasive Lady Beetle, Harmonia Axyridis. Insects 2020, 11, 290. [CrossRef]
85. Flesch, E.P.; Rotella, J.J.; Thomson, J.M.; Graves, T.A.; Garrott, R.A. Evaluating sample size to estimate geneticmanagement metrics in the genomics era. Mol. Ecol. Resour. 2018, 18, 1077–1091. [CrossRef]
86. Thanh, H.N.; Liu, Q.; Zhao, L.; Zhang, H.; Liu, J. Genetic diversity of the cultured giant freshwater prawn(Macrobrachium rosenbergii) in China based on microsatellite markers. Biochem. Syst. Ecol. 2015, 59, 144–154.[CrossRef]
87. Miao, W.M.; Ge, X.P. Freshwater prawn culture in China: An overview. Aquaculture Asia 2002, VII, 9–12.88. Rhode, C.; Hepple, J.; Jansen, S.; Davis, T.; Vervalle, J.; Bester-van der Merwe, A.E.; Roodt-Wilding, R.
A population genetic analysis of abalone domestication events in South Africa: Implications for themanagement of the abalone resource. Aquaculture 2012, 356–357, 235–242. [CrossRef]
89. An, H.A.; Wook, J.; Kim, H.C.; Myeong, J. Genetic characterization of five hatchery populations of pacificabalone (Haliotis discus hannai) using microsatellite markers. Int. J. Mol. Sci. 2011, 12, 4836–4849. [CrossRef]
90. Norris, A.T.; Bradley, D.G.; Cunningham, E.P. Microsatellite genetic variation between and within farmedand wild Atlantic salmon (Salmo salar) populations. Aquaculture 1999, 180, 247–264. [CrossRef]
91. Zhang, D.C.; Yu, L.N.; Fang, Y.L. A study on genetic diversity of wild and cultured grass carp populationsusing RAPD. Freshw. Fish 2004, 4, 5–7.
92. Liu, F.; Xia, J.; Bai, Z.; Fu, J.; Li, J.; Yue, G.H. High genetic diversity and substantial population differentiationin grass carp (Ctenopharyngodon idella) revealed by microsatellite analysis. Aquaculture 2009, 297, 51–56.[CrossRef]
93. Yue, G.H.; Zhu, Z.Y.; Lo, L.C.; Wang, C.M.; Lin, G.; Feng, F.; Pang, H.Y.; Li, J.; Gong, P.; Liu, H.M.; et al.Genetic variation and population structure of Asian seabass (Lates calcarifer) in the Asia-Pacific region.Aquaculture 2009, 293, 22–28. [CrossRef]
94. Li, L.; Lin, H.; Tang, W.; Liu, D.; Bao, B.; Yang, J. Population genetic structure in wild and aquaculturepopulations of Hemibarbus maculates inferred from microsatellites markers. Aquac. Fish. 2017, 2, 78–83.[CrossRef]
95. Tassanakajon, A.; Pongsomboon, S.; Jarayabhand, P.; Klinbunga, S.; Boonsaeng, V. Genetic structure in wildpopulations of black tiger shrimp Penaeus monodon using randomly amplified polymorphic DNA analysis.J. Mar. Biotechnol. 1998, 6, 249–254.
96. Benzie, J.A.H.; Frusher, S.; Ballment, E. Geographical variation in allozyme frequencies of populations ofPenaeus monodon Crustacea: Decapoda in Australia. Aust. J. Mar. Freshw. Res. 1992, 43, 715–725. [CrossRef]
97. Sekino, M.; Hara, M.; Taniguchi, N. Loss of microsatellite and mitochondrial DNA variation in hatcherystrains of Japanese flounder Paralichthys olivaceus. Aquaculture 2002, 213, 101–122. [CrossRef]
98. Lundrigan, T.A.; Reist, J.D.; Ferguson, M.M. Microsatellite genetic variation within and among Arctic charr(Salvelinus alpinus) from aquaculture and natural populations in North America. Aquaculture 2005, 244, 63–75.[CrossRef]
99. Kohlmann, K.; Kersten, P.; Flajshans, M. Microsatellite-based genetic variability and differentiation ofdomesticated, wild and feral common carp (Cyprinus carpio L.) populations. Aquaculture 2005, 247, 253–266.[CrossRef]
Biology 2020, 9, 277 21 of 22
100. Koljonen, M.L.; Tähtinen, J.; Säisä, M.; Koskiniemi, J. Maintenance of genetic diversity of Atlantic salmon(Salmo salar) by captive breeding programmes and the geographic distribution of microsatellite variation.Aquaculture 2002, 212, 69–92. [CrossRef]
101. Wang, L.; Meng, Z.; Liu, X.; Zhang, Y.; Lin, H. Genetic Diversity and differentiation of the Orange SpottedGrouper (Epinephelus coioides) between and bithin cultured stocks and wild populations Inferred fromMicrosatellite DNA analysis. Int. J. Mol. Sci. 2011, 12, 4378–4394. [CrossRef] [PubMed]
102. Bester-van der Merwe, A.E.; Roodt-Wilding, R.; Volckaert, F.A.M.; D’Amato, M.E. Historical isolation andhydrodynamically constrained gene flow in declining population of the South-African abalone, Haliotismidae. Conserv. Genet. 2011, 12, 543–555. [CrossRef]
103. Alejandrino, A.; Puslednik, L.; Serb, J.M. Convergent and parallel evolution in life habit of the scallops(Bivalvia: Pectinidae). BMC Evol. Biol. 2011, 11, 164. [CrossRef]
104. Lester, L.J. Population genetics of penaeid shrimp from the Gulf of Mexico. J. Hered. 1979, 70, 175–180.[CrossRef]
105. Benzie, J.A.H.; Ballment, E.; Frusher, S. Genetic structure of Penaeus monodon in Australia: Concordant resultsfrom mtDNA and allozymes. Aquaculture 1993, 111, 89–93. [CrossRef]
106. Wade, M.J. Extinction and recolonization: Their effects on the genetic differentiation of local population.Evolution 1988, 42, 995–1005. [CrossRef]
107. Li, J.; Wang, G.; Bai, Z. Genetic variability in four wild and two farmed stocks of the Chinese freshwaterpearl mussel (Hyriopsis cumingii) estimated by microsatellite DNA Markers. Aquaculture 2009, 287, 286–291.[CrossRef]
108. Qi, P.; Qin, J.; Xie, C. Determination of genetic diversity of wild and cultured topmouth culter (Culter alburnus)inhabiting China using mitochondrial DNA and microsatellites. Biochem. Syst. Ecol. 2015, 61, 232–239.[CrossRef]
109. Hemmer-Hansen, J.; Nielsen, E.E.; Frydenberg, J.; Loeschcke, V. Adaptive divergence in a high gene flowenvironment: Hsc70 variation in the European flounder (Platichthys flesus L.). Heredity 2007, 99, 592–600.[CrossRef]
110. Nielsen, E.E.; Hemmer-Jansen, J.; Larsen, P.F.; Bekkevold, D. Population genomics of marine fishes: Identifyingadaptive variation in space and time. Mol. Ecol. 2009, 18, 3128–3150. [CrossRef] [PubMed]
111. Schmidt, P.S.; Serrão, E.A.; Pearson, G.A.; Riginos, C.; Rawson, P.D.; Hilbish, T.J.; Brawley, S.H.; Trussell, G.C.;Carrington, E.; Wethey, D.S.; et al. Ecological genetics in the North Atlantic: Environmental gradients andadaptation at specific loci. Ecology 2008, 89, S91–S107. [CrossRef] [PubMed]
112. Asaduzzaman, M.; Igarashi, Y.; Wahab, M.A.; Nahiduzzzaman, M.; Rahman, M.J.; Phillips, M.J.; Huang, S.;Asakawa, S.; Rahman, M.M.; Wong, L.L. Population Genomics of an Anadromous Hilsa Shad Tenualosailisha Species across its diverse migratory habitats: Discrimination by fine-scale local adaptation. Genes 2020,11, 46. [CrossRef] [PubMed]
113. Asaduzzaman, M.; Wahab, M.A.; Rahman, M.M.; Mariom; Nahiduzzaman, M.; Rahman, M.J.; Roy, B.K.;Phillips, M.J.; Wong, L.L. Morpho-Genetic Divergence and Adaptation of Anadromous Hilsa shad (Tenualosailisha) Along Their Heterogenic Migratory Habitats. Front. Mar. Sci. 2020, 7, 554. [CrossRef]
114. Avise, J.C.; Arnold, J.; Ball, R.M.; Bermingham, E.; Lamb, T.; Neigel, J.E.; Reeb, C.A.; Saunders, N.C.Intraspecific phylogeography: The mitochondrial DNA bridge between population genetics and systematics.Annu. Rev. Ecol. Evol. Syst. 1987, 18, 489–522. [CrossRef]
115. Moritz, C.; Dowling, T.E.; Brown, W.M. Evolution of animal mitochondrial DNA: Relevance for populationbiology and systematics. Annu. Rev. Ecol. Evol. Syst. 1987, 18, 269–292. [CrossRef]
116. Ballard, J.W.O.; Kreitman, M. Is mitochondrial DNA a strictly neutral marker? Trends Ecol. Evol. 1995,10, 485–488. [CrossRef]
117. Ciborowski, K.L.; Consuegra, S.; García de Leániz, C.; Wang, J.; Beaumont, M.A.; Jordan, W.C. Stockingmay increase mitochondrial DNA diversity but fails to halt the decline of endangered Atlantic salmonpopulations. Conserv. Genet. 2007, 8, 1355–1367. [CrossRef]
118. Blier, P.U.; Dufresne, F.; Burton, R.S. Natural selection and the evolution of mtDNA-encoded peptides:Evidence for intergenomic co-adaptation. Trends Genet. 2001, 17, 400–406. [CrossRef]
119. Moreno-Sánchez, R.; Hogue, B.A.; Hansford, R.G. Influence of NAD-linked dehydrogenase activity on fluxthrough oxidative phosphorylation. Biochem. J. 1990, 268, 421–428. [CrossRef]
Biology 2020, 9, 277 22 of 22
120. Bai, Y.; Shakeley, R.M.; Attardi, G. Tight control of respiration by NADH Dehydrogenase ND5 subunit geneexpression in mouse mitochondria. Mol. Cell Biol. 2000, 20, 805–815. [CrossRef] [PubMed]
121. Meiklejohn, C.D.; Montooth, K.L.; Ran, D.M. Positive and negative selection on the mitochondrial genome.Trends Genet. 2007, 23, 259–263. [CrossRef]
122. Blier, P.U.; Guderley, H.E. Mitochondrial activity in rainbow trout red muscle: The effect of temperature onthe ADP-dependence of ATP synthesis. J. Exp. Biol. 1993, 176, 145–158.
123. Brown, K.H.; Lee, R.W.; Thorgaard, G.H. Use of androgenesis for estimating maternal and mitochondrialgenome effects on development and oxygen consumption in rainbow trout, Oncorhynchus mykiss.Comp. Biochem. Physiol. Part B Biochem. Mol. Biol. 2006, 143, 415–421. [CrossRef] [PubMed]
124. Kivisild, T. Maternal ancestry and population history from whole mitochondrial genomes. Investig. Genet.2015, 6, 3. [CrossRef] [PubMed]
125. Kelley, D.E.; He, J.; Menshikova, E.V.; Ritov, V.B. Dysfunction of mitochondria in human skeletal muscle intype 2 diabetes. Diabetes/Metab. Res. Rev. 2002, 51, 2944–2950. [CrossRef]
126. Einum, S.; Fleming, I.A. Highly fecund mothers sacrifice offspring survival to maximize fitness. Nature 2000,405, 565–567. [CrossRef]
127. Rand, D.M.; Haney, R.A.; Fry, A.J. Cytonuclear coevolution: The genomics of cooperation. Trends Ecol. Evol.2004, 19, 645–653. [CrossRef]
128. Das, J. The role of mitochondrial respiration in physiological and evolutionary adaptation. BioEssays 2006,28, 890–901. [CrossRef]
129. Zhao, X.; Gou, X.; Qin, Z.; Li, D.; Wang, Y.; Ma, E.; Li, S.; Zhang, J. Identification and expression of cuticularprotein genes based on Locusta migratoria transcriptome. Sci. Rep. 2017, 7, 45462. [CrossRef]
130. McKay, S.E.; Purcell, A.L.; Carew, T.J. Regulation of synaptic function by neurotrophic factors in vertebratesand invertebrates: Implications for development and learning. Learn. Mem. 1999, 6, 193–215. [PubMed]
131. Saleem, M.; Qadir, M.I.; Perveen, N.; Ahmad, B.; Saleem, U.; Irshad, T.; Ahmad, B. Inhibitors of apoptoticproteins: New targets for anticancer therapy. Chem. Biol. Drug. Des. 2013, 82, 243–251. [CrossRef] [PubMed]
132. Twigg, M.; Brockbank, S.; Lowry, P.; FitzGerald, S.P.; Taggart, C.; Weldon, S. The role of serine proteases andantiproteases in the cystic fibrosis lung. Mediat. Inflamm. 2015, 293053, 10. [CrossRef] [PubMed]
© 2020 by the authors. Licensee MDPI, Basel, Switzerland. This article is an open accessarticle distributed under the terms and conditions of the Creative Commons Attribution(CC BY) license (http://creativecommons.org/licenses/by/4.0/).