association of financial leverage with cost of capital and...
TRANSCRIPT
Association of Financial Leverage withCost of Capital and Shareholder Value:
An empirical study of BSE Sensex Companies
BHARGAV PANDYA
AbstractPurpose - The paper aims to examine the impact of financial leverage on cost of capital and shareholder value. The primary
objective of the paper is to offer empirical evidence to establish whether there exists any association between financial
leverage and cost of capital, and between financial leverage and shareholder value.
Design / Methodology / Approach - An empirical analysis of 28 companies included in the Bombay Stock Exchange's flagship
index 'Sensex' was conducted for a period of three years ranging from 2013 to 2015. A multiple step-wise regression method
was used to analyze the association between financial leverage and cost of capital as well as financial leverage and shareholder
value.
Findings - The study reveals that financial leverage and cost of capital are negatively correlated. The debt-equity ratio is found
to have a statistically significant negative association with market value added, residual income and refined economic value
added (EVA). Interest cover is found to have a statistically significant positive correlation with residual income and refined
economic value added; however, it is not significantly correlated to market value added.
Implications - The study implies that by raising debt in the capital structure of the company, managers can reduce the overall
cost of capital; however, a higher proportion of debt need not necessarily increase shareholder value.
Key words: Leverage, Cost of capital, EVA, MVA, Shareholder Value
1. IntroductionInvestigating the relationship between financial leverage and cost of capital has always attracted the attention of academics
and practitioners alike. They have also been keen to ascertain how changing the amount of debt in the capital structure of the
firm affects its cost of capital and finally, whether it leads to maximization of shareholders' wealth. The traditional approach of
capital structure hypothesized that raising the proportion of debt in the capital structure up to a point does lower cost of capital
and subsequently maximizes value of the firm. On the other hand, there are arguments against the traditional approach
claiming that capital structure decision is irrelevant for the firm's value. Earlier, Brigham and Jordon (1968) showed that the
cost of capital of a firm depends on how the firm is financing its capital and the value of its stock is dependent on its financing
policy. Intuitively, it is quite appealing to use debt given the benefit of interest tax deductibility attached to it. However,
increasing the amount of debt also increases financial risk and thus increases the chances of bankruptcy. In this case, it does not
pay well to use an excessive amount of debt to maximize the value of the firm. Rather, beyond a point, the benefit of cheaper
cost of debt is more than offset by increased cost of equity, resulting in an increase in overall cost of capital. This, in turn, will
negatively affect the firm's value.
In this paper, an attempt has been made to examine the impact of financial leverage on cost of capital and on shareholder
value. The remainder of the paper is structured as follows: the second section discusses the literature review; the third section
specifies the research methodology; the fourth section presents results and the discussion, and the fifth section offers the
conclusion and summary.
2. Literature ReviewModigliani and Miller (1958) set out the capital structure irrelevance theorem concluding that leverage did not affect the firm's
value when the market is perfect, there are no taxes and transaction costs. Later, Modigliani and Miller MM (1963) corrected
NMIMS JOURNAL OF ECONOMICS AND PUBLIC POLICYVolume II • Issue 1 • April 2017
NMIMS JOURNAL OF ECONOMICS AND PUBLIC POLICYVolume II • Issue 1 • April 2017
References• Alam, M.R., Chowdhury, E.K. & Chowdhury, T.U. (2015). Application of Capital Asset Pricing Model: Empirical Evidences
from Chittagong Stock Exchange. The Cost and Management, 43(3).
• Avadhanam, P. K., Mamidi, V., & Mishra, R. K. (2014). Empirical Testing of CAPM for Central Public Sector Enterprises in
India. Journal Of Institute Of Public Enterprise, 37(3/4), 50-64.
• Bark, Hee-Kywzg K. (1991). Risk, Return and Equilibrium in the Emerging Markets: Evidence from the Korean Stock Market,
Journal of Economics and Business, November, Vol. 43, No.4, pp. 353-362.
• Dzaja, J. Aljinavic, Z. (2012). Testing CAPM model on the emerging markets of the central and Southeastern Europe.
Croatian Operational Research Review (CRORR), Vol. 4, 2013.
• Gupta, L.C. (1981). Rates of Return on Equities, Oxford University Press.
• Leonard, F. Loli, B. Kralj, B. & Vlachos, V. (2012). The Capital Assets Pricing Model. Investment and Valuation of Firms. pp. 8
• Lintner, John (1965). The valuation of risk assets and the selection of risky investments in stock portfolios and capital
budgets. Review of Economics and Statistics, 47 (1), 13–37.
• Markowitz, Harry. (1959). Portfolio Selection: Efficient Diversification of Investment. New York: John Wiley and Sons.
• Michailidis, G., Tsopoglou, S., Papanastasiou, D., Mariola, E. (2006). Testing the Capital Asset Pricing Model (CAPM): The
Case of the Emerging Greek Securities Market. International Research Journal of Finance and Economics, Issue 4, pp.78-91.
• Mossin, Jan. (1966). Equilibrium in a Capital Asset Market, Econometrica, Vol. 34, No. 4, pp. 768–783.
• Pettit, R. and Westerfield, R. (1974). Using capital assets pricing model and market model to predict security returns.
Journal of financial and quantitative analysis (Sept 1974).
• Rizwan Qamar, M. Rehman, S. Shah, S. A. (2013). Applicability of Capital Assets Pricing Model (CAPM) on Pakistan Stock
Markets. Int. J. Manag. Bus. Res., 4 (1), 1-9, Winter 2014.
• Sharpe, William F. (1964). Capital asset prices: A theory of market equilibrium under conditions of risk, Journal of Finance,
19 (3), 425–442.
• Syed Ali, R. Syed Tehseen, J. Imtiaz, A. & Fahim, Q. (2011). Validity of capital assets pricing model: Evidence from Karachi
Stock Exchange. Online at http://mpra.ub.uni-muenchen.de/32737/ MPRA Paper No. 32737, posted 11. August 2011
11:10 UTC.
• Taneja, Y. P. (2010). Revisiting Fama French Three-Factor Model in Indian Stock Market. Vision (09722629), 14(4), 267-274.
• Treynor, Jack L. (1961). Market Value, Time, and Risk. Unpublished manuscript.
• Treynor, Jack L. (1962). Toward a Theory of Market Value of Risky Assets. Unpublished manuscript. A final version was
published in 1999, in Asset Pricing and Portfolio Performance: Models, Strategy and Performance Metrics. Robert A.
Korajczyk (editor) London: Risk Books, pp. 15–22.
• Yalawar, Y.B. (1985). Bombay Stock Exchange: Rates of Return and Efficiency, Paper Published by Indian Institute of
Management, Bangalore.
Dr. Abhay Raja holds academic distinctions of MBA (Finance), M.Com. (Finance), UGC-NET and FDP with IIM - Kozhikode.
His aptitude for research is evident from the number of international and national conference presentations and his
published research work in journals of international and national repute. Currently Dr. Raja is working as an Associate
Professor - Finance with Shanti Business School, Ahmedabad. His research areas are: Security Analysis and Portfolio
Management, Corporate Finance, Mergers and Acquisitions and Universal Human Values. He can be reached at
Priya Chocha is a Business Analyst at TCS. Her delightful presence and work ethics have made her eligible for “Star
Performer of the Month” award. She is a self-starter who is able to work independently and is a valued contributor in
group tasks as well. She has a strong aptitude for research and undertakes research assignments with passion and
dedication. She is an MBA (Finance) from Atmiya Institute of Technology and Science, Rajkot. She can be reached at
Nita Lalkiya is an MBA (Finance) from Atmiya Institute of Technology and Science, Rajkot. She is working with a Business
Consultancy firm and is a perfectionist at her work. She likes challenges and is comfortable working with deadlines. A
leader by nature, Nita is gradually moving to excel in her career. The subject of Finance has always fascinated her; this
became the motivating factor for her to take up this research as a part of her course requirements. She can be reached at
16 17
mall farmers. Majority of the
farmers (82%) borrow less than
Rs 5 lakhs, and 18% borrow
between Rs 5 – 10 lakhs on a per
annum basis. Most farmers
(65.79%) ar
Table & Image source
sub heading table headingmain heading

their original model and acknowledged the impact of taxes and other transaction costs. However, they still argued that change
in the debt-equity ratio did not have any effect on the firm's value. Solomon (1963) showed that the cost of capital does not
remain constant with an increase in leverage. Rather, it rises as the degree of leverage is increased.
Davenport (1971) found the U-shaped cost of capital with respect to leverage and confirmed the traditional view that leverage
does reduce the cost of capital up to a point.
Rao and Litzenberger (1971) made a comparative study of the impact of capital structure on cost of capital in India and USA. The
findings of their study with respect to Indian companies indicated that a moderate amount of debt reduces the firm's cost of
capital. Gapenski (1987) found a strong relationship between financial leverage and cost of equity. Barniv and Bulmash (1988)
found that with increase in the financial leverage, cost of equity and cost of capital also increase. Chatrath (1994) found a
negative association between financial leverage and cost of capital.
Hall and De Wet (2003) reported that the benefit of higher financial leverage was completely offset by a lower cost of
ownership capital. Carpentier (2006) analyzed the impact of change in capital structure on the firm's value in the context of 243
French firms. His study did not find any significant relationship between changes in debt ratios and change in value. Ward and
Price (2006) showed that increasing the debt-equity ratio results in higher shareholder returns at the cost of higher risk.
Sharma (2006) concluded that there was a direct correlation between leverage and the firm's value. Jahfer (2006) investigated
the impact of financial leverage on the wealth of shareholders in the context of 60 listed Sri Lankan firms. He found no
correlation between financial leverage and shareholders' wealth. Al-Hasan and Gupta (2013), using the pooled regression
analysis, analyzed the impact of leverage on shareholders' return. They found that leverage had a statistically significant impact
on shareholders' return. Matemilola, Bany-Ariffin and Azman-Saini (2012) investigated the impact of debt leverage on
shareholders' required return in the context of South Africa. The results of their study showed that total debt and long-term
debt had a positive relationship with shareholders' required return. Pachori and Totala (2012) reported that financial leverage
did not have a significant impact on shareholders' return and market capitalization. Ramadan (2015) found that the leverage
level of a firm significantly affects the firm's value. Niresh and Alfred (2014) assessed the relationship between EVA, and
leverage. They found that economic value added and leverage did not have a significant impact on market value added (MVA).
Vijayalakshmi and Manoharan (2015) analyzed the impact of corporate leverage on EVA and MVA of seven firms listed on the
Bombay Stock Exchange and the National Stock Exchange. Using pooled regression analysis, they found that the long-term
debt ratio, interest cover, and financial leverage did not have a significant impact on economic value added. Similarly, the long-
term debt ratio and financial leverage did not demonstrate a significant impact on market value added. Only, interest cover was
found to have a significant impact on market value added.
Barakat (2015) investigated the impact of financial leverage on share value of industrial companies listed on the Saudi Stock
Market. He found a negative relationship between financial leverage and stock value. He also reported that there was no
statistically significant relationship between financial leverage and value of the company.
Ayeni and Olaoye (2015) suggested that by increasing the debt capital, the firm's value can be increased. They also
recommended that the firm should increase its debt so as to increase its bargaining power and market alternatives of suppliers.
Ishari and Abeyrathna (2016) measured the impact of financial leverage on the value of listed Sri Lankan manufacturing
companies. They reported a negative relationship between the debt-equity ratio and return on equity. They concluded that
financial leverage did not have a significant impact on the firm's value.
Adetunji, Akinyemi, and Rasheed (2016) investigated the impact of financial leverage on the firm's value in the context of listed
firms of the Nigerian Stock Exchange. They found a significant relationship between financial leverage and the firm's value.
Venugopal and Reddy (2016) found that the debt-equity ratio had a positive impact on market value and shareholders' wealth
of listed Indian cement manufacturing companies; however, this relationship was not statistically significant.
Pandey and Prabhavati (2016) investigated the relationship impact of leverage on the shareholders' wealth of the Indian
automobile industry. They found a strong association between financial leverage and returns of the firms.
Pandya (2016) found the interest cover as the most significant predictor of MVA. Further, he also reported that the debt-equity
ratio and debt ratio jointly did not demonstrate a significant association with MVA.
3. Research MethodologyThis paper aims to provide empirical evidence with respect to the impact of financial leverage on the cost of capital, and on
shareholder value. Using secondary data, an empirical study was conducted for the said purpose.
3.1 Research Objectives
• To examine the association between financial leverage and cost of capital.
• To evaluate the association between financial leverage and shareholder value.
The study covers a three-year time period ranging from 2013 to 2015. BSE Sensex companies comprise the sample of the study.
Out of 30 companies that constitute the Sensex, 28 companies were included in the study owing to availability of the requisite
data for the period of study. The data required for the study was taken from CAPITALINE software.
3.2 Variables of the study
The debt-equity ratio and interest cover ratio were taken as the measures of financial leverage. Market Value Added (MVA),
Residual Income, (REIN), and Refined Economic Value Added (REVA) were taken as the measures of shareholder value.
MVA was calculated as the difference between market capitalization and net worth. Residual income was computed as the
spread between ROCE and WACC multiplied by the capital invested. The following equation was used to calculate residual
income.
REIN = (ROCE -WACC ) * CEit it it it-1
thIn the above equation, ROCE stands for return on capital employed for i firm in t time period;it
th thWACC stands for the weighted average cost of capital for i firm in t time period and CE stands for capital employed for i firm it it-1
in t-1 time period.
In order to calculate WACC, the following equation was used.
WACC = r (1-t) (D/V) + r (E/V) D E
Calculation of cost of debt (r involves estimating the current rate of interest being offered to investors for investing in bonds of D)
identical risk. However, it is quite impossible to identify a similar kind of company with the similar kind of debt instrument with
an identical risk. To sort out this estimation problem, r was calculated by dividing the actual interest paid by the company by the D
average amount of total debt the company carried during that particular year. To estimate the debt ratio (D/V) and the equity
ratio (E/V), the book value of debt and market value of equity were used. While determining the relative weighting of the
instruments, market value weights are considered to be superior to book value weights as the former reflect future
expectations of investors. In case of debt, as it is difficult to estimate the current market value, book value proves to be a
reasonable proxy for the weighting purpose. For the purpose of this study, the value of the firm (V) was computed as the
summation of the book value of debt and market capitalization of equity.
Computation of REVA requires three inputs - cost of equity, return on net worth (RONW), and equity market value. Equity
market value and RONW were directly available from the CAPITALINE database; the cost of equity had to be calculated.
Capital Asset Pricing Model (CAPM) is extensively used in financial literature to calculate cost of equity. CAPM was used for this
study also.
As per CAPM, cost of equity can be calculated as below:
K = R + β (R - R )e f i m f
In the above equation, Ke represents the cost of equity, R stands for risk-free rate, β stands for beta of a stock, and R stands for f i m
return on the market portfolio. The difference between the return on the market portfolio and risk-free rate is referred to as
equity market risk premium. For this study, weighted annual returns on Central Government securities for respective years
were taken as the risk-free rates. These were directly taken from the Reserve Bank of India website. Following Fernandez
(2014), the equity market risk premium was taken as 8% uniformly for all three years of the study period.
3.3 Hypotheses of the study
The following hypotheses were tested in order to achieve the objectives of the study.
NMIMS JOURNAL OF ECONOMICS AND PUBLIC POLICYVolume II • Issue 1 • April 2017
NMIMS JOURNAL OF ECONOMICS AND PUBLIC POLICYVolume II • Issue 1 • April 2017
18 19
mall farmers. Majority of the
farmers (82%) borrow less than
Rs 5 lakhs, and 18% borrow
between Rs 5 – 10 lakhs on a per
annum basis. Most farmers
(65.79%) ar
Table & Image source
sub heading table headingmain heading

H : There is no significant association between financial leverage ratios and the cost of capital.1
H : There is no significant association between financial leverage ratios and shareholder value.2
3.4 Regression Models
Relationship between Financial Leverage and Cost of Capital
Model: NRWACC = β + β NRDER + β NRINTSCRit 0 1 it 2 it
The objective of this model is to test the relationship between cost of capital and financial leverage ratios. Traditionally, it has
been observed that usage of debt reduces the cost of capital, as the interest expenses on debt are tax deductible. In order to
test this hypothesis, empirically, the aforesaid model was run to examine the statistical significance of the debt-equity ratio and
interest cover ratio in explaining the variation in cost of capital.
Relationship between Financial Leverage and Shareholders' Wealth
Model 1: NRMVA = β + β NRDER + β NRINTSCRit 0 1 it 2 it
Model 2: NRREIN = β + β NRDER + β NRINTSCRit 0 1 it 2 it
Model 3: NRREVA = β + β NRDER + β NRINTSCRit 0 1 it 2 it
In order to gauge the association between financial leverage and shareholders' wealth, the aforesaid models were run (Model
1, 2 and 3). Market Value added (MVA), Residual income (REIN) and Refined Economic value added (REVA) were used as the
measures of shareholders' wealth. The financial leverage ratios measured in terms of the debt-equity ratio and interest cover
ratio were regressed against each measure of shareholders' wealth separately.
4. Results and DiscussionTable 1 presents the descriptive statistics of MVA, REIN and REVA of the sample companies for the study period. The mean
values of MVA, REIN and REVA were found to be Rs. 91,030.85 crore, Rs. 160,991.88 crore, and Rs. 1,301,498.96 crore
respectively, with the standard deviation of Rs. 83,059.34 crore, Rs. 659,755.92 crore and Rs. 3,580,021.72 crore respectively.
4.1 Descriptive Statistics
Table 1: Descriptive Statistics
N Range Minimum Maximum Mean Std. Deviation
MVA 84 489365.50 -35890.90 453474.60 91030.8536 83059.34338
REIN
84
3947890.99 -2072235.47
1875655.52
160991.8777
659755.92724
REVA
84
15708271.39 -2570505.79
13137765.60
1301498.9575
3580021.71549
WACC
84
17.41
-.59
16.82
9.5790 4.67473
Valid N (list-wise)
84
In order to test the relationship between financial leverage and cost of capital as well as between financial leverage and
measures of shareholder value (MVA, REIN, and REVA), it was required to transform the values of these variables to
demonstrate normality. Following the two-step method of Templeton (2011), these variables were normalized. Further, in
order to check the normality of these variables, a normality test was conducted using Kolmogorov-Smirnov test.
The following hypotheses were framed to test the normality.
H0: The observed distribution fits the normal distribution.
H1: The observed distribution does not fit the normal distribution.
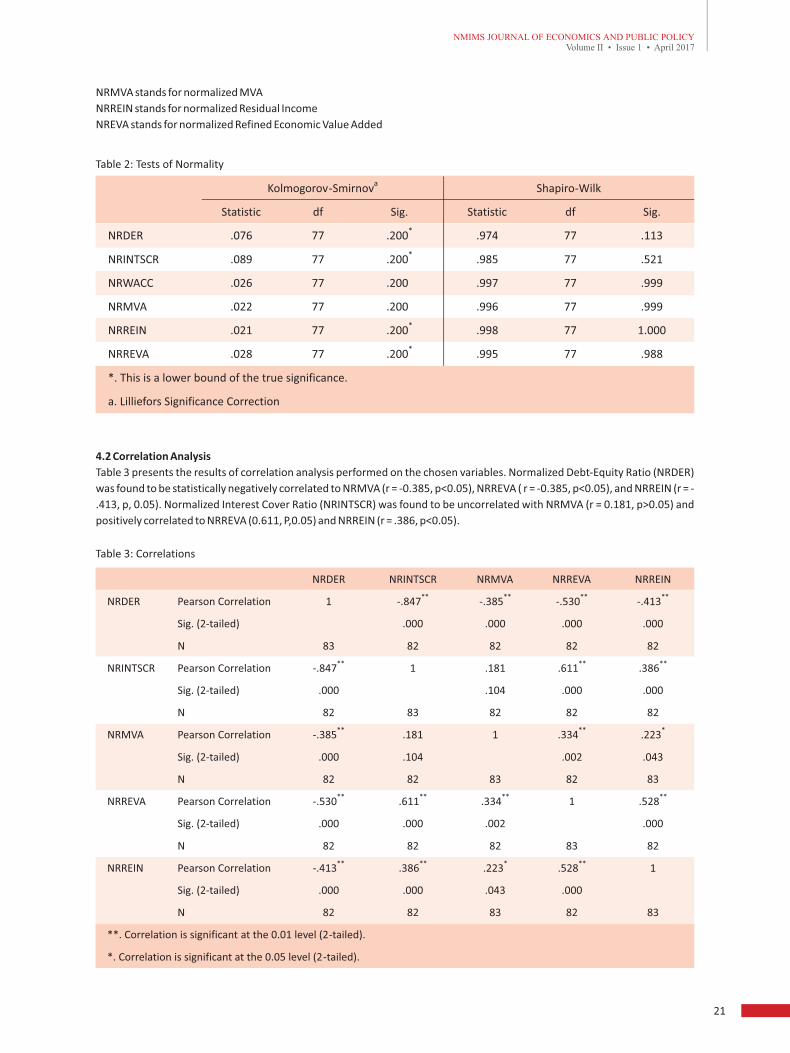
The results of the Kolmogorov - Smirnov test are presented in Table 2. These results indicate that variables in question depict
normality as p-value being greater than 0.05. Following is the description of the variables used in the test.
NRDER stands for the normalized debt-equity ratio
NRINTSCR stands for the normalized interest cover ratio
NRWACC stands for normalized WACC
NRMVA stands for normalized MVA
NRREIN stands for normalized Residual Income
NREVA stands for normalized Refined Economic Value Added
Table 2: Tests of Normality
Kolmogorov-Smirnova
Shapiro-Wilk
Statistic df Sig. Statistic df Sig.
NRDER .076 77 .200*
.974 77 .113
NRINTSCR .089 77 .200*
.985 77 .521
NRWACC .026 77 .200 .997 77 .999
NRMVA .022 77 .200 .996 77 .999
NRREIN .021 77 .200*
.998 77 1.000
NRREVA .028 77 .200*
.995 77 .988
*. This is a lower bound of the true significance.
a. Lilliefors Significance Correction
4.2 Correlation Analysis
Table 3 presents the results of correlation analysis performed on the chosen variables. Normalized Debt-Equity Ratio (NRDER)
was found to be statistically negatively correlated to NRMVA (r = -0.385, p<0.05), NRREVA ( r = -0.385, p<0.05), and NRREIN (r = -
.413, p, 0.05). Normalized Interest Cover Ratio (NRINTSCR) was found to be uncorrelated with NRMVA (r = 0.181, p>0.05) and
positively correlated to NRREVA (0.611, P,0.05) and NRREIN (r = .386, p<0.05).
Table 3: Correlations
NRDER NRINTSCR NRMVA NRREVA NRREIN
NRDER Pearson Correlation 1 -.847**
-.385**
-.530**
-.413**
Sig. (2-tailed) .000 .000 .000 .000
N 83 82 82 82 82
NRINTSCR
Pearson Correlation -.847**
1 .181 .611**
.386**
Sig. (2-tailed) .000 .104 .000 .000
N 82 83 82 82 82
NRMVA
Pearson Correlation -.385**
.181
1 .334**
.223
*
Sig. (2-tailed)
.000
.104
.002 .043
N
82
82
83 82 83
NRREVA
Pearson Correlation -.530**
.611**
.334**
1
.528**
Sig. (2-tailed) .000 .000 .002 .000
N
82
82
82 83 82
NRREIN
Pearson Correlation -.413**
.386**
.223*
.528**
1
Sig. (2-tailed)
.000
.000
.043 .000
N
82
82
83 82 83
**. Correlation is significant
at the 0.01 level (2-tailed).
*. Correlation is significant at the 0.05 level (2-tailed).
NMIMS JOURNAL OF ECONOMICS AND PUBLIC POLICYVolume II • Issue 1 • April 2017
NMIMS JOURNAL OF ECONOMICS AND PUBLIC POLICYVolume II • Issue 1 • April 2017
20 21
mall farmers. Majority of the
farmers (82%) borrow less than
Rs 5 lakhs, and 18% borrow
between Rs 5 – 10 lakhs on a per
annum basis. Most farmers
(65.79%) ar
Table & Image source
sub heading table headingmain heading
H : There is no significant association between financial leverage ratios and the cost of capital.1
H : There is no significant association between financial leverage ratios and shareholder value.2
3.4 Regression Models
Relationship between Financial Leverage and Cost of Capital
Model: NRWACC = β + β NRDER + β NRINTSCRit 0 1 it 2 it
The objective of this model is to test the relationship between cost of capital and financial leverage ratios. Traditionally, it has
been observed that usage of debt reduces the cost of capital, as the interest expenses on debt are tax deductible. In order to
test this hypothesis, empirically, the aforesaid model was run to examine the statistical significance of the debt-equity ratio and
interest cover ratio in explaining the variation in cost of capital.
Relationship between Financial Leverage and Shareholders' Wealth
Model 1: NRMVA = β + β NRDER + β NRINTSCRit 0 1 it 2 it
Model 2: NRREIN = β + β NRDER + β NRINTSCRit 0 1 it 2 it
Model 3: NRREVA = β + β NRDER + β NRINTSCRit 0 1 it 2 it
In order to gauge the association between financial leverage and shareholders' wealth, the aforesaid models were run (Model
1, 2 and 3). Market Value added (MVA), Residual income (REIN) and Refined Economic value added (REVA) were used as the
measures of shareholders' wealth. The financial leverage ratios measured in terms of the debt-equity ratio and interest cover
ratio were regressed against each measure of shareholders' wealth separately.
4. Results and DiscussionTable 1 presents the descriptive statistics of MVA, REIN and REVA of the sample companies for the study period. The mean
values of MVA, REIN and REVA were found to be Rs. 91,030.85 crore, Rs. 160,991.88 crore, and Rs. 1,301,498.96 crore
respectively, with the standard deviation of Rs. 83,059.34 crore, Rs. 659,755.92 crore and Rs. 3,580,021.72 crore respectively.
4.1 Descriptive Statistics
Table 1: Descriptive Statistics
N Range Minimum Maximum Mean Std. Deviation
MVA 84 489365.50 -35890.90 453474.60 91030.8536 83059.34338
REIN
84
3947890.99 -2072235.47
1875655.52
160991.8777
659755.92724
REVA
84
15708271.39 -2570505.79
13137765.60
1301498.9575
3580021.71549
WACC
84
17.41
-.59
16.82
9.5790 4.67473
Valid N (list-wise)
84
In order to test the relationship between financial leverage and cost of capital as well as between financial leverage and
measures of shareholder value (MVA, REIN, and REVA), it was required to transform the values of these variables to
demonstrate normality. Following the two-step method of Templeton (2011), these variables were normalized. Further, in
order to check the normality of these variables, a normality test was conducted using Kolmogorov-Smirnov test.
The following hypotheses were framed to test the normality.
H0: The observed distribution fits the normal distribution.
H1: The observed distribution does not fit the normal distribution.
The results of the Kolmogorov - Smirnov test are presented in Table 2. These results indicate that variables in question depict
normality as p-value being greater than 0.05. Following is the description of the variables used in the test.
NRDER stands for the normalized debt-equity ratio
NRINTSCR stands for the normalized interest cover ratio
NRWACC stands for normalized WACC
NRMVA stands for normalized MVA
NRREIN stands for normalized Residual Income
NREVA stands for normalized Refined Economic Value Added
Table 2: Tests of Normality
Kolmogorov-Smirnova
Shapiro-Wilk
Statistic df Sig. Statistic df Sig.
NRDER .076 77 .200*
.974 77 .113
NRINTSCR .089 77 .200*
.985 77 .521
NRWACC .026 77 .200 .997 77 .999
NRMVA .022 77 .200 .996 77 .999
NRREIN .021 77 .200*
.998 77 1.000
NRREVA .028 77 .200*
.995 77 .988
*. This is a lower bound of the true significance.
a. Lilliefors Significance Correction
4.2 Correlation Analysis
Table 3 presents the results of correlation analysis performed on the chosen variables. Normalized Debt-Equity Ratio (NRDER)
was found to be statistically negatively correlated to NRMVA (r = -0.385, p<0.05), NRREVA ( r = -0.385, p<0.05), and NRREIN (r = -
.413, p, 0.05). Normalized Interest Cover Ratio (NRINTSCR) was found to be uncorrelated with NRMVA (r = 0.181, p>0.05) and
positively correlated to NRREVA (0.611, P,0.05) and NRREIN (r = .386, p<0.05).
Table 3: Correlations
NRDER NRINTSCR NRMVA NRREVA NRREIN
NRDER Pearson Correlation 1 -.847**
-.385**
-.530**
-.413**
Sig. (2-tailed) .000 .000 .000 .000
N 83 82 82 82 82
NRINTSCR
Pearson Correlation -.847**
1 .181 .611**
.386**
Sig. (2-tailed) .000 .104 .000 .000
N 82 83 82 82 82
NRMVA
Pearson Correlation -.385**
.181
1 .334**
.223
*
Sig. (2-tailed)
.000
.104
.002 .043
N
82
82
83 82 83
NRREVA
Pearson Correlation -.530**
.611**
.334**
1
.528**
Sig. (2-tailed) .000 .000 .002 .000
N
82
82
82 83 82
NRREIN
Pearson Correlation -.413**
.386**
.223*
.528**
1
Sig. (2-tailed)
.000
.000
.043 .000
N
82
82
83 82 83
**. Correlation is significant
at the 0.01 level (2-tailed).
*. Correlation is significant at the 0.05 level (2-tailed).
NMIMS JOURNAL OF ECONOMICS AND PUBLIC POLICYVolume II • Issue 1 • April 2017
NMIMS JOURNAL OF ECONOMICS AND PUBLIC POLICYVolume II • Issue 1 • April 2017
20 21
mall farmers. Majority of the
farmers (82%) borrow less than
Rs 5 lakhs, and 18% borrow
between Rs 5 – 10 lakhs on a per
annum basis. Most farmers
(65.79%) ar
Table & Image source
sub heading table headingmain heading
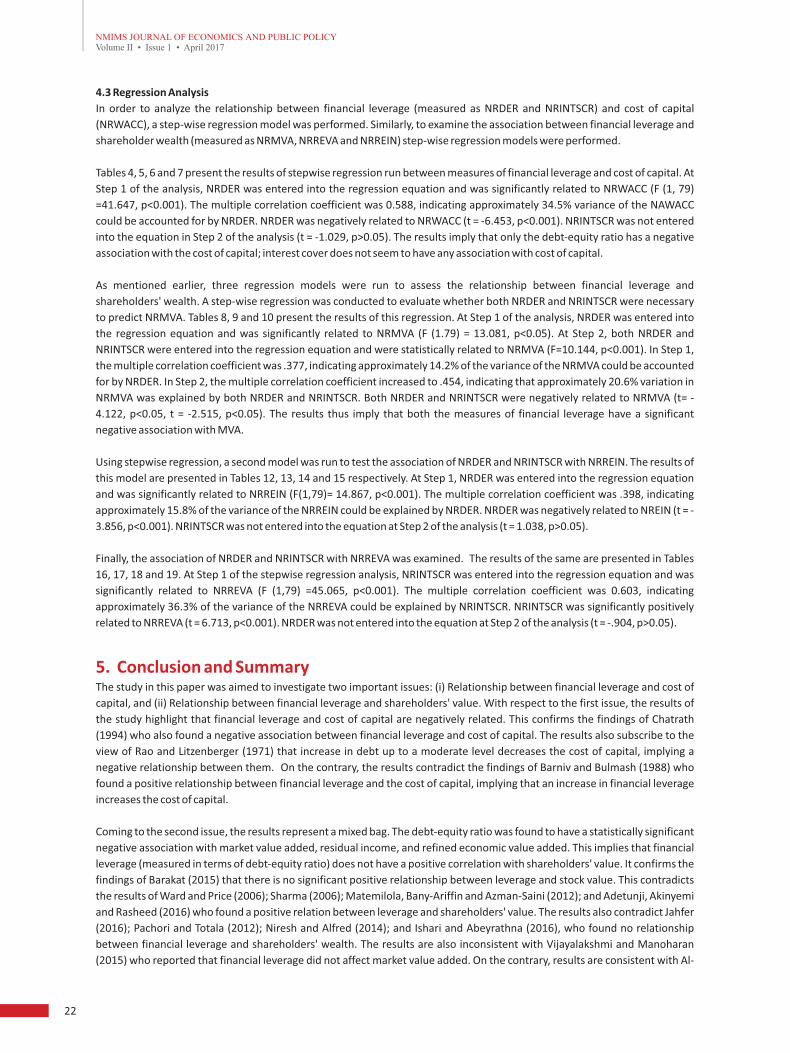
4.3 Regression Analysis
In order to analyze the relationship between financial leverage (measured as NRDER and NRINTSCR) and cost of capital
(NRWACC), a step-wise regression model was performed. Similarly, to examine the association between financial leverage and
shareholder wealth (measured as NRMVA, NRREVA and NRREIN) step-wise regression models were performed.
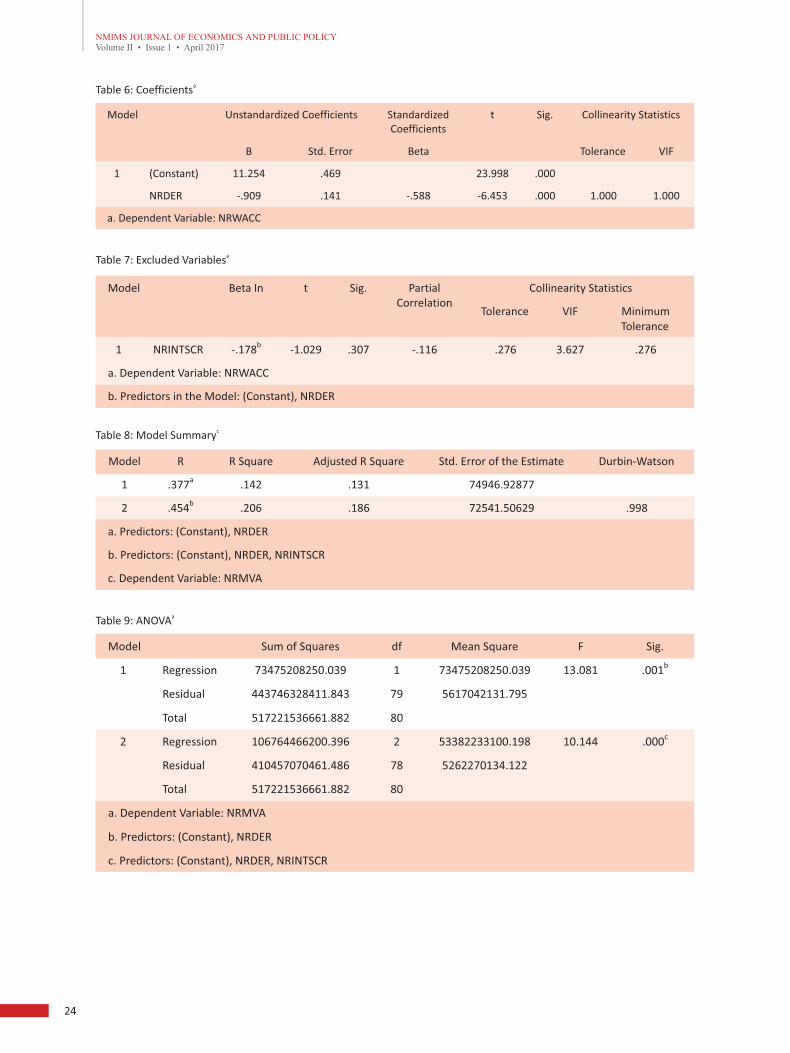
Tables 4, 5, 6 and 7 present the results of stepwise regression run between measures of financial leverage and cost of capital. At
Step 1 of the analysis, NRDER was entered into the regression equation and was significantly related to NRWACC (F (1, 79)
=41.647, p<0.001). The multiple correlation coefficient was 0.588, indicating approximately 34.5% variance of the NAWACC
could be accounted for by NRDER. NRDER was negatively related to NRWACC (t = -6.453, p<0.001). NRINTSCR was not entered
into the equation in Step 2 of the analysis (t = -1.029, p>0.05). The results imply that only the debt-equity ratio has a negative
association with the cost of capital; interest cover does not seem to have any association with cost of capital.
As mentioned earlier, three regression models were run to assess the relationship between financial leverage and
shareholders' wealth. A step-wise regression was conducted to evaluate whether both NRDER and NRINTSCR were necessary
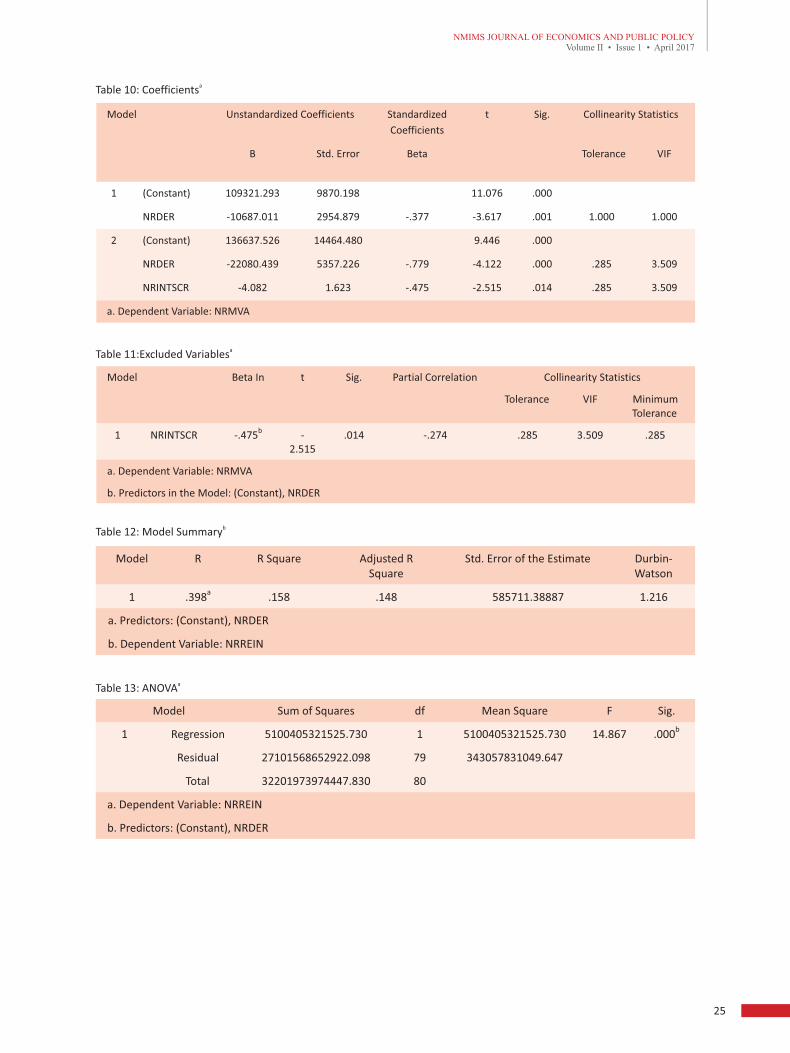
to predict NRMVA. Tables 8, 9 and 10 present the results of this regression. At Step 1 of the analysis, NRDER was entered into
the regression equation and was significantly related to NRMVA (F (1.79) = 13.081, p<0.05). At Step 2, both NRDER and
NRINTSCR were entered into the regression equation and were statistically related to NRMVA (F=10.144, p<0.001). In Step 1,
the multiple correlation coefficient was .377, indicating approximately 14.2% of the variance of the NRMVA could be accounted
for by NRDER. In Step 2, the multiple correlation coefficient increased to .454, indicating that approximately 20.6% variation in
NRMVA was explained by both NRDER and NRINTSCR. Both NRDER and NRINTSCR were negatively related to NRMVA (t= -
4.122, p<0.05, t = -2.515, p<0.05). The results thus imply that both the measures of financial leverage have a significant
negative association with MVA.
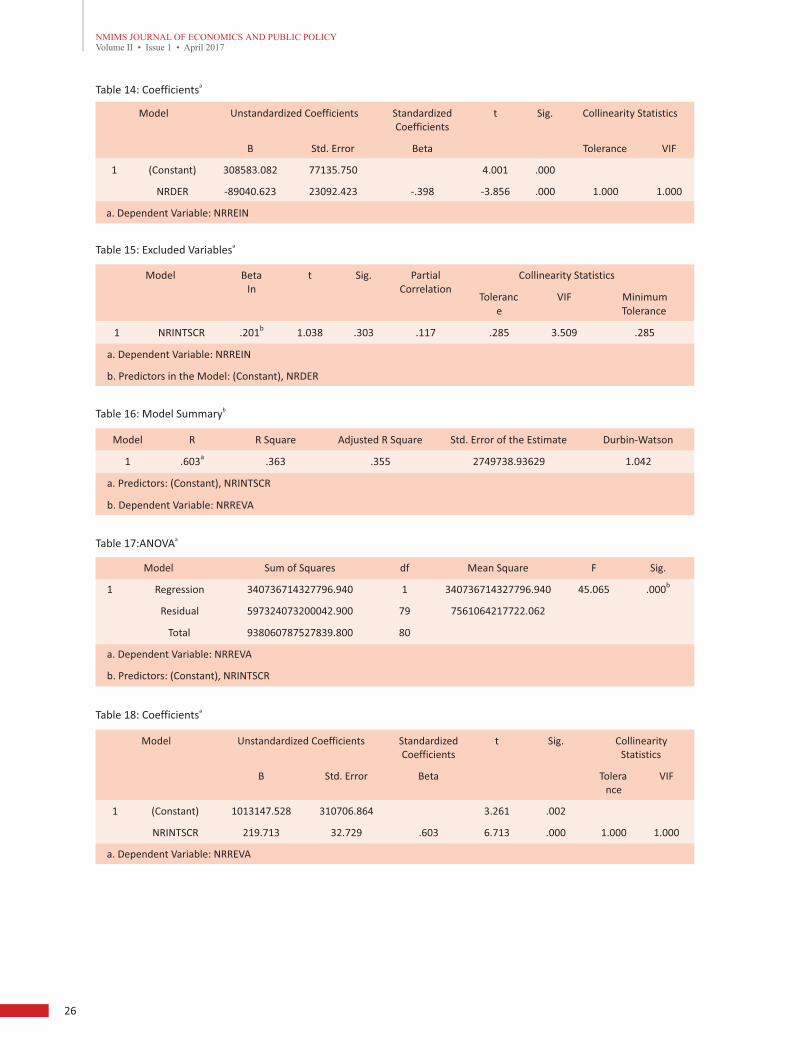
Using stepwise regression, a second model was run to test the association of NRDER and NRINTSCR with NRREIN. The results of
this model are presented in Tables 12, 13, 14 and 15 respectively. At Step 1, NRDER was entered into the regression equation
and was significantly related to NRREIN (F(1,79)= 14.867, p<0.001). The multiple correlation coefficient was .398, indicating
approximately 15.8% of the variance of the NRREIN could be explained by NRDER. NRDER was negatively related to NREIN (t = -
3.856, p<0.001). NRINTSCR was not entered into the equation at Step 2 of the analysis (t = 1.038, p>0.05).
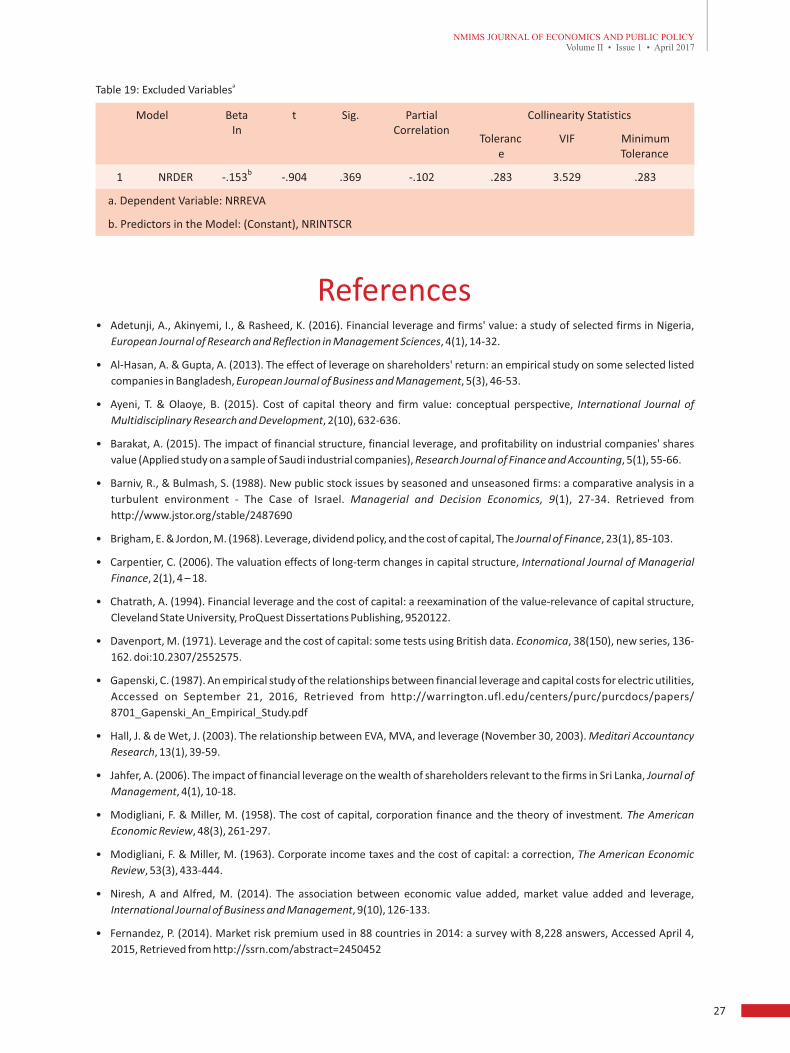
Finally, the association of NRDER and NRINTSCR with NRREVA was examined. The results of the same are presented in Tables
16, 17, 18 and 19. At Step 1 of the stepwise regression analysis, NRINTSCR was entered into the regression equation and was
significantly related to NRREVA (F (1,79) =45.065, p<0.001). The multiple correlation coefficient was 0.603, indicating
approximately 36.3% of the variance of the NRREVA could be explained by NRINTSCR. NRINTSCR was significantly positively
related to NRREVA (t = 6.713, p<0.001). NRDER was not entered into the equation at Step 2 of the analysis (t = -.904, p>0.05).
5. Conclusion and SummaryThe study in this paper was aimed to investigate two important issues: (i) Relationship between financial leverage and cost of
capital, and (ii) Relationship between financial leverage and shareholders' value. With respect to the first issue, the results of
the study highlight that financial leverage and cost of capital are negatively related. This confirms the findings of Chatrath
(1994) who also found a negative association between financial leverage and cost of capital. The results also subscribe to the
view of Rao and Litzenberger (1971) that increase in debt up to a moderate level decreases the cost of capital, implying a
negative relationship between them. On the contrary, the results contradict the findings of Barniv and Bulmash (1988) who
found a positive relationship between financial leverage and the cost of capital, implying that an increase in financial leverage
increases the cost of capital.
Coming to the second issue, the results represent a mixed bag. The debt-equity ratio was found to have a statistically significant
negative association with market value added, residual income, and refined economic value added. This implies that financial
leverage (measured in terms of debt-equity ratio) does not have a positive correlation with shareholders' value. It confirms the
findings of Barakat (2015) that there is no significant positive relationship between leverage and stock value. This contradicts
the results of Ward and Price (2006); Sharma (2006); Matemilola, Bany-Ariffin and Azman-Saini (2012); and Adetunji, Akinyemi
and Rasheed (2016) who found a positive relation between leverage and shareholders' value. The results also contradict Jahfer
(2016); Pachori and Totala (2012); Niresh and Alfred (2014); and Ishari and Abeyrathna (2016), who found no relationship
between financial leverage and shareholders' wealth. The results are also inconsistent with Vijayalakshmi and Manoharan
(2015) who reported that financial leverage did not affect market value added. On the contrary, results are consistent with Al-
Hasan and Gupta (2013), Ramadan (2015), Pandey and Prabhavati (2016) who reported a strong association between financial
leverage and shareholders' wealth.
Interest cover was found to have a statistically significant positive correlation with residual income and refined economic value
added. However, it was not significantly correlated to market value added. This is inconsistent with Pandya (2016) and
Vijayalakshmi and Manoharan (2015) who found that interest cover is significantly related to market value added.
The models applied in the study could be considered useful while analyzing the relationship between financial leverage and
shareholders' wealth of the companies that are listed on the stock exchange as it is possible to calculate MVA, REIN and REVA
only if the company is listed on the stock exchange. It thus enriches the existing literature by providing empirical evidence
pertaining to financial leverage and its impact on cost of capital and shareholders' wealth.
5.1 Managerial Implications of the study
The results of this study thus advance the notion that financial leverage measured in terms of debt-equity ratio does affect the
cost of capital and shareholders' value, although negatively. This offers several implications for financial managers. One, by
raising debt in the capital structure of the company, managers can reduce the overall cost of capital. Second, a higher
proportion of debt need not necessarily increase shareholders' value. Managers may also be motivated to maintain higher
interest cover as it is positively related to refined economic value and residual income.
5.2 Limitations of the study
The study was confined to only 28 companies that were included in the Bombay Stock Exchange Sensex. The results of the study
would thus be limited to those companies that were included in the Sensex. Another limitation was that the study considered
only three measures of shareholders' wealth. It did not consider measures like Shareholder Value Added (SVA), Total
Shareholder Return (TSR) and Created Shareholder Value (CSV) that are equally important while measuring shareholders'
wealth.
5.3 Scope for future research
The study did not segregate the sample companies depending upon the sector to which they belong. The results of the study
will set out an overarching implication for the companies working across different sectors. However, to explore a sector-specific
association between financial leverage and cost of capital, and between financial leverage and shareholder value, sector-
specific studies are warranted.
bTable 4: Model Summary
Model R R Square Adjusted R Square Std. Error of the Estimate Durbin-Watson
1 .588a
.345 .337 3.53893 1.099
a. Predictors: (Constant), NRDER
b. Dependent Variable: NRWACC
aTable 5: ANOVA
Model Sum of Squares df Mean Square F Sig.
1 Regression 521.591 1 521.591 41.647 .000b
Residual 989.397 79 12.524
Total 1510.987 80
a. Dependent Variable: NRWACC
b. Predictors: (Constant), NRDER
NMIMS JOURNAL OF ECONOMICS AND PUBLIC POLICYVolume II • Issue 1 • April 2017
NMIMS JOURNAL OF ECONOMICS AND PUBLIC POLICYVolume II • Issue 1 • April 2017
22 23
mall farmers. Majority of the
farmers (82%) borrow less than
Rs 5 lakhs, and 18% borrow
between Rs 5 – 10 lakhs on a per
annum basis. Most farmers
(65.79%) ar
Table & Image source
sub heading table headingmain heading
4.3 Regression Analysis
In order to analyze the relationship between financial leverage (measured as NRDER and NRINTSCR) and cost of capital
(NRWACC), a step-wise regression model was performed. Similarly, to examine the association between financial leverage and
shareholder wealth (measured as NRMVA, NRREVA and NRREIN) step-wise regression models were performed.
Tables 4, 5, 6 and 7 present the results of stepwise regression run between measures of financial leverage and cost of capital. At
Step 1 of the analysis, NRDER was entered into the regression equation and was significantly related to NRWACC (F (1, 79)
=41.647, p<0.001). The multiple correlation coefficient was 0.588, indicating approximately 34.5% variance of the NAWACC
could be accounted for by NRDER. NRDER was negatively related to NRWACC (t = -6.453, p<0.001). NRINTSCR was not entered
into the equation in Step 2 of the analysis (t = -1.029, p>0.05). The results imply that only the debt-equity ratio has a negative
association with the cost of capital; interest cover does not seem to have any association with cost of capital.
As mentioned earlier, three regression models were run to assess the relationship between financial leverage and
shareholders' wealth. A step-wise regression was conducted to evaluate whether both NRDER and NRINTSCR were necessary
to predict NRMVA. Tables 8, 9 and 10 present the results of this regression. At Step 1 of the analysis, NRDER was entered into
the regression equation and was significantly related to NRMVA (F (1.79) = 13.081, p<0.05). At Step 2, both NRDER and
NRINTSCR were entered into the regression equation and were statistically related to NRMVA (F=10.144, p<0.001). In Step 1,
the multiple correlation coefficient was .377, indicating approximately 14.2% of the variance of the NRMVA could be accounted
for by NRDER. In Step 2, the multiple correlation coefficient increased to .454, indicating that approximately 20.6% variation in
NRMVA was explained by both NRDER and NRINTSCR. Both NRDER and NRINTSCR were negatively related to NRMVA (t= -
4.122, p<0.05, t = -2.515, p<0.05). The results thus imply that both the measures of financial leverage have a significant
negative association with MVA.
Using stepwise regression, a second model was run to test the association of NRDER and NRINTSCR with NRREIN. The results of
this model are presented in Tables 12, 13, 14 and 15 respectively. At Step 1, NRDER was entered into the regression equation
and was significantly related to NRREIN (F(1,79)= 14.867, p<0.001). The multiple correlation coefficient was .398, indicating
approximately 15.8% of the variance of the NRREIN could be explained by NRDER. NRDER was negatively related to NREIN (t = -
3.856, p<0.001). NRINTSCR was not entered into the equation at Step 2 of the analysis (t = 1.038, p>0.05).
Finally, the association of NRDER and NRINTSCR with NRREVA was examined. The results of the same are presented in Tables
16, 17, 18 and 19. At Step 1 of the stepwise regression analysis, NRINTSCR was entered into the regression equation and was
significantly related to NRREVA (F (1,79) =45.065, p<0.001). The multiple correlation coefficient was 0.603, indicating
approximately 36.3% of the variance of the NRREVA could be explained by NRINTSCR. NRINTSCR was significantly positively
related to NRREVA (t = 6.713, p<0.001). NRDER was not entered into the equation at Step 2 of the analysis (t = -.904, p>0.05).
5. Conclusion and SummaryThe study in this paper was aimed to investigate two important issues: (i) Relationship between financial leverage and cost of
capital, and (ii) Relationship between financial leverage and shareholders' value. With respect to the first issue, the results of
the study highlight that financial leverage and cost of capital are negatively related. This confirms the findings of Chatrath
(1994) who also found a negative association between financial leverage and cost of capital. The results also subscribe to the
view of Rao and Litzenberger (1971) that increase in debt up to a moderate level decreases the cost of capital, implying a
negative relationship between them. On the contrary, the results contradict the findings of Barniv and Bulmash (1988) who
found a positive relationship between financial leverage and the cost of capital, implying that an increase in financial leverage
increases the cost of capital.
Coming to the second issue, the results represent a mixed bag. The debt-equity ratio was found to have a statistically significant
negative association with market value added, residual income, and refined economic value added. This implies that financial
leverage (measured in terms of debt-equity ratio) does not have a positive correlation with shareholders' value. It confirms the
findings of Barakat (2015) that there is no significant positive relationship between leverage and stock value. This contradicts
the results of Ward and Price (2006); Sharma (2006); Matemilola, Bany-Ariffin and Azman-Saini (2012); and Adetunji, Akinyemi
and Rasheed (2016) who found a positive relation between leverage and shareholders' value. The results also contradict Jahfer
(2016); Pachori and Totala (2012); Niresh and Alfred (2014); and Ishari and Abeyrathna (2016), who found no relationship
between financial leverage and shareholders' wealth. The results are also inconsistent with Vijayalakshmi and Manoharan
(2015) who reported that financial leverage did not affect market value added. On the contrary, results are consistent with Al-
Hasan and Gupta (2013), Ramadan (2015), Pandey and Prabhavati (2016) who reported a strong association between financial
leverage and shareholders' wealth.
Interest cover was found to have a statistically significant positive correlation with residual income and refined economic value
added. However, it was not significantly correlated to market value added. This is inconsistent with Pandya (2016) and
Vijayalakshmi and Manoharan (2015) who found that interest cover is significantly related to market value added.
The models applied in the study could be considered useful while analyzing the relationship between financial leverage and
shareholders' wealth of the companies that are listed on the stock exchange as it is possible to calculate MVA, REIN and REVA
only if the company is listed on the stock exchange. It thus enriches the existing literature by providing empirical evidence
pertaining to financial leverage and its impact on cost of capital and shareholders' wealth.
5.1 Managerial Implications of the study
The results of this study thus advance the notion that financial leverage measured in terms of debt-equity ratio does affect the
cost of capital and shareholders' value, although negatively. This offers several implications for financial managers. One, by
raising debt in the capital structure of the company, managers can reduce the overall cost of capital. Second, a higher
proportion of debt need not necessarily increase shareholders' value. Managers may also be motivated to maintain higher
interest cover as it is positively related to refined economic value and residual income.
5.2 Limitations of the study
The study was confined to only 28 companies that were included in the Bombay Stock Exchange Sensex. The results of the study
would thus be limited to those companies that were included in the Sensex. Another limitation was that the study considered
only three measures of shareholders' wealth. It did not consider measures like Shareholder Value Added (SVA), Total
Shareholder Return (TSR) and Created Shareholder Value (CSV) that are equally important while measuring shareholders'
wealth.
5.3 Scope for future research
The study did not segregate the sample companies depending upon the sector to which they belong. The results of the study
will set out an overarching implication for the companies working across different sectors. However, to explore a sector-specific
association between financial leverage and cost of capital, and between financial leverage and shareholder value, sector-
specific studies are warranted.
bTable 4: Model Summary
Model R R Square Adjusted R Square Std. Error of the Estimate Durbin-Watson
1 .588a
.345 .337 3.53893 1.099
a. Predictors: (Constant), NRDER
b. Dependent Variable: NRWACC
aTable 5: ANOVA
Model Sum of Squares df Mean Square F Sig.
1 Regression 521.591 1 521.591 41.647 .000b
Residual 989.397 79 12.524
Total 1510.987 80
a. Dependent Variable: NRWACC
b. Predictors: (Constant), NRDER
NMIMS JOURNAL OF ECONOMICS AND PUBLIC POLICYVolume II • Issue 1 • April 2017
NMIMS JOURNAL OF ECONOMICS AND PUBLIC POLICYVolume II • Issue 1 • April 2017
22 23
mall farmers. Majority of the
farmers (82%) borrow less than
Rs 5 lakhs, and 18% borrow
between Rs 5 – 10 lakhs on a per
annum basis. Most farmers
(65.79%) ar
Table & Image source
sub heading table headingmain heading
aTable 6: Coefficients
Model Unstandardized Coefficients Standardized Coefficients
t Sig. Collinearity Statistics
B Std. Error Beta Tolerance VIF
1 (Constant) 11.254 .469 23.998 .000
NRDER
-.909 .141 -.588 -6.453 .000
1.000 1.000
a. Dependent Variable: NRWACC
aTable 7: Excluded Variables
Model Beta In t Sig. Partial Correlation
Collinearity Statistics
Tolerance VIF Minimum Tolerance
1 NRINTSCR -.178b
-1.029 .307 -.116 .276 3.627 .276
a. Dependent Variable: NRWACC
b. Predictors in the Model: (Constant), NRDER
cTable 8: Model Summary
Model R R Square Adjusted R Square Std. Error of the Estimate Durbin-Watson
1 .377a
.142 .131 74946.92877
2 .454b
.206 .186 72541.50629 .998
a. Predictors: (Constant), NRDER
b. Predictors: (Constant), NRDER, NRINTSCR
c. Dependent Variable: NRMVA
aTable 9: ANOVA
Model Sum of Squares df Mean Square F Sig.
1 Regression 73475208250.039 1 73475208250.039 13.081 .001b
Residual 443746328411.843 79 5617042131.795
Total 517221536661.882 80
2 Regression 106764466200.396 2 53382233100.198 10.144 .000c
Residual 410457070461.486 78 5262270134.122
Total 517221536661.882 80
a. Dependent Variable: NRMVA
b. Predictors: (Constant), NRDER
c. Predictors: (Constant), NRDER, NRINTSCR
aTable 10: Coefficients
Model Unstandardized Coefficients Standardized
Coefficients
t Sig. Collinearity Statistics
B Std. Error
Beta
Tolerance VIF
1 (Constant) 109321.293 9870.198 11.076 .000
NRDER
-10687.011
2954.879
-.377
-3.617
.001
1.000
1.000
2 (Constant) 136637.526
14464.480
9.446
.000
NRDER
-22080.439
5357.226
-.779
-4.122
.000
.285
3.509
NRINTSCR
-4.082
1.623
-.475
-2.515
.014
.285
3.509
a. Dependent Variable: NRMVA
aTable 11:Excluded Variables
Model Beta In t Sig. Partial Correlation Collinearity Statistics
Tolerance VIF Minimum Tolerance
1
NRINTSCR -.475b
-
2.515
.014
-.274
.285
3.509
.285
a. Dependent Variable: NRMVA
b. Predictors in the Model: (Constant), NRDER
bTable 12: Model Summary
Model R R Square Adjusted R Square
Std. Error of the Estimate Durbin-Watson
1 .398a
.158 .148 585711.38887 1.216
a. Predictors: (Constant), NRDER
b. Dependent Variable: NRREIN
aTable 13: ANOVA
Model Sum of Squares df Mean Square F Sig.
1 Regression 5100405321525.730 1 5100405321525.730 14.867 .000b
Residual 27101568652922.098 79 343057831049.647
Total 32201973974447.830 80
a. Dependent Variable: NRREIN
b. Predictors: (Constant), NRDER
NMIMS JOURNAL OF ECONOMICS AND PUBLIC POLICYVolume II • Issue 1 • April 2017
NMIMS JOURNAL OF ECONOMICS AND PUBLIC POLICYVolume II • Issue 1 • April 2017
24 25
mall farmers. Majority of the
farmers (82%) borrow less than
Rs 5 lakhs, and 18% borrow
between Rs 5 – 10 lakhs on a per
annum basis. Most farmers
(65.79%) ar
Table & Image source
sub heading table headingmain heading
aTable 14: Coefficients
Model Unstandardized Coefficients Standardized Coefficients
t Sig. Collinearity Statistics
B Std. Error Beta Tolerance VIF
1 (Constant) 308583.082 77135.750 4.001 .000
NRDER
-89040.623
23092.423
-.398
-3.856
.000 1.000 1.000
a. Dependent Variable: NRREIN
aTable 15: Excluded Variables
Model Beta In
t Sig. Partial Correlation
Collinearity Statistics
Tolerance
VIF Minimum Tolerance
1
NRINTSCR .201b
1.038
.303
.117
.285
3.509
.285
a. Dependent Variable: NRREIN
b. Predictors in the Model: (Constant), NRDER
bTable 16: Model Summary
Model R R Square Adjusted R Square Std. Error of the Estimate Durbin-Watson
1 .603a .363 .355 2749738.93629 1.042
a. Predictors: (Constant), NRINTSCR
b. Dependent Variable: NRREVA
aTable 17:ANOVA
Model Sum of Squares df Mean Square F Sig.
1 Regression 340736714327796.940 1 340736714327796.940 45.065 .000b
Residual 597324073200042.900 79 7561064217722.062
Total
938060787527839.800 80
a. Dependent Variable: NRREVA
b. Predictors: (Constant), NRINTSCR
aTable 18: Coefficients
Model Unstandardized Coefficients Standardized Coefficients
t Sig. Collinearity Statistics
B
Std. Error Beta
Tolera
nceVIF
1
(Constant) 1013147.528
310706.864
3.261
.002
NRINTSCR
219.713
32.729
.603
6.713
.000
1.000 1.000
a. Dependent Variable: NRREVA
aTable 19: Excluded Variables
Model Beta In
t Sig. Partial Correlation
Collinearity Statistics
Tolerance
VIF Minimum Tolerance
1 NRDER -.153b
-.904 .369 -.102 .283 3.529 .283
a. Dependent Variable: NRREVA
b. Predictors in the Model: (Constant), NRINTSCR
• Adetunji, A., Akinyemi, I., & Rasheed, K. (2016). Financial leverage and firms' value: a study of selected firms in Nigeria,
European Journal of Research and Reflection in Management Sciences, 4(1), 14-32.
• Al-Hasan, A. & Gupta, A. (2013). The effect of leverage on shareholders' return: an empirical study on some selected listed
companies in Bangladesh, European Journal of Business and Management, 5(3), 46-53.
• Ayeni, T. & Olaoye, B. (2015). Cost of capital theory and firm value: conceptual perspective, International Journal of
Multidisciplinary Research and Development, 2(10), 632-636.
• Barakat, A. (2015). The impact of financial structure, financial leverage, and profitability on industrial companies' shares
value (Applied study on a sample of Saudi industrial companies), Research Journal of Finance and Accounting, 5(1), 55-66.
• Barniv, R., & Bulmash, S. (1988). New public stock issues by seasoned and unseasoned firms: a comparative analysis in a
turbulent environment - The Case of Israel. Managerial and Decision Economics, 9(1), 27-34. Retrieved from
http://www.jstor.org/stable/2487690
• Brigham, E. & Jordon, M. (1968). Leverage, dividend policy, and the cost of capital, The Journal of Finance, 23(1), 85-103.
• Carpentier, C. (2006). The valuation effects of long-term changes in capital structure, International Journal of Managerial
Finance, 2(1), 4 – 18.
• Chatrath, A. (1994). Financial leverage and the cost of capital: a reexamination of the value-relevance of capital structure,
Cleveland State University, ProQuest Dissertations Publishing, 9520122.
• Davenport, M. (1971). Leverage and the cost of capital: some tests using British data. Economica, 38(150), new series, 136-
162. doi:10.2307/2552575.
• Gapenski, C. (1987). An empirical study of the relationships between financial leverage and capital costs for electric utilities,
Accessed on September 21, 2016, Retrieved from http://warrington.ufl.edu/centers/purc/purcdocs/papers/
8701_Gapenski_An_Empirical_Study.pdf
• Hall, J. & de Wet, J. (2003). The relationship between EVA, MVA, and leverage (November 30, 2003). Meditari Accountancy
Research, 13(1), 39-59.
• Jahfer, A. (2006). The impact of financial leverage on the wealth of shareholders relevant to the firms in Sri Lanka, Journal of
Management, 4(1), 10-18.
• Modigliani, F. & Miller, M. (1958). The cost of capital, corporation finance and the theory of investment. The American
Economic Review, 48(3), 261-297.
• Modigliani, F. & Miller, M. (1963). Corporate income taxes and the cost of capital: a correction, The American Economic
Review, 53(3), 433-444.
• Niresh, A and Alfred, M. (2014). The association between economic value added, market value added and leverage,
International Journal of Business and Management, 9(10), 126-133.
• Fernandez, P. (2014). Market risk premium used in 88 countries in 2014: a survey with 8,228 answers, Accessed April 4,
2015, Retrieved from http://ssrn.com/abstract=2450452
References
NMIMS JOURNAL OF ECONOMICS AND PUBLIC POLICYVolume II • Issue 1 • April 2017
NMIMS JOURNAL OF ECONOMICS AND PUBLIC POLICYVolume II • Issue 1 • April 2017
26 27
mall farmers. Majority of the
farmers (82%) borrow less than
Rs 5 lakhs, and 18% borrow
between Rs 5 – 10 lakhs on a per
annum basis. Most farmers
(65.79%) ar
Table & Image source
sub heading table headingmain heading

• Ishari, M. & Abeyrathna, S. (2016). The impact of financial leverage on firms' value (special reference to listed manufacturing
companies in Sri Lanka), International Journal Of Advancement In Engineering Technology, Management and Applied
Science, 3(7), 100-104.
• Matemilola, B., Bany-Ariffin, A. & Azamn-Saini, W. (2012). Financial leverage and shareholders' required returns: evidence
from South Africa corporate sector, Transit Stud Rev, 18, 601-612.
• Pachori, S. & Totala, N (2012). Influence of financial leverage on shareholders' return and market capitalization: a study of
automotive cluster companies of Pithampur, (M.P.), India, Paper Presented at 2nd International Conference on Humanities,
Geography and Economics (ICHGE'2012) Singapore, April 28-29, 2012.
• Pandey, N. & Prabhavathi, M (2016). The impact of leverage on shareholders' wealth of automobile industry in India: an
empirical analysis, Pacific Business Review International, 8(7), 79-92.
• Pandya. B. (2016). Impact of financial leverage on market value added: empirical evidence from India, Journal of
Entrepreneurship, Business and Economics, 4(2), 40–58.
• Sharma, A. (2006). Financial leverage and firm's value: a study of capital structure of selected manufacturing sector firms in
India. The Business Review, Cambridge, 6(2), 70-76.
• Solomon, E. (1963). Leverage and the cost of capital, The Journal of Finance, 18(2), 273-279.
• Templeton, G. (2011). A two-step approach for transforming continuous variables to normal: implications and
recommendations for IS research, Communications of the AIS, 28, 4.
• Ward, M. & Price, A. (2006). Turning Vision into Value. Pretoria: Van Schaik Publishers.
• Ramadan, I (2015). Leverage and the Jordanian firms' value: empirical evidence, International Journal of Economics and
Finance, 7(4), 75-81.
• Rao, C. & Litzenberger, R. (1971). Leverage and the cost of capital in a less developed capital market: comment, The Journal
of Finance, 26(3), 777-782.
• Venugopal, M. & Reddy, M. (2016). Impact of capital structure on firm's profitability and shareholder wealth maximization:
a study of listed Indian cement companies, IOSR Journal of Business and Management, 18(4), 21-27.
• Vijayalakshmi, D. & Manoharan, P. (2015). Corporate leverage and its impact on EVA and MVA, International Journal of
Multidisciplinary Research and Development, 2(2), 22-25.
Bhargav Pandya works as an Assistant Professor at Faculty of Management Studies, The Maharaja Sayajirao University
of Baroda, Vadodara. Dr Pandya is an MBA and Ph.D. in Finance. He possesses post graduate teaching experience of 11
years and one-year industry experience. He is a recognized Ph.D. guide in Management (Finance) at The Maharaja
Sayajirao University of Baroda. He was awarded Accredited Management Teacher Certification in the area of Financial
Management by All India Management Association, Centre for Management Services, New Delhi, in the year 2008. Till
date, his 25 research papers have been published in peer reviewed, refereed international and national journals,
including three in the conference proceedings bearing an ISSN / ISBN. His research interest lies in the areas of
shareholder value creation, corporate finance and strategic financial management. He may be reached at
A comparative study on stress levels amongworking women and housewives with
reference to the state of Kerala
HARILAL A
SANTHOSH V A
Abstract Women play a pivotal role in the decision making process of organisations and within the family. Indian culture bestows on
women the role of caretaker of the family. Women are increasingly moving out of their homes and into the work environment.
A greater number of women are also entering the workforce of restricted industries. Thus women play the dual role of
housewives and working women. A comparative study on the stress levels of women in this dual role of housewife and working
woman becomes significant. The study explores the stresses faced by women in society. The result indicates that the financial
position of the family makes an impact on the stress levels among both housewives and working women.
Key words: Stress, working women, housewives.
IntroductionA housewife's main duties are managing the family, caring for and educating her children, cooking and storing food, buying
goods, cleaning and maintaining the home, sewing clothes for the family, etc. It is ironical that a woman employed within the
home is referred to as a housewife, and outside the home, as a working woman. In both situations, the woman is working but
how the woman is referred to, is based on the working place. The duty of the housewife is to take care of the day-to-day chores
within the home. A woman who earns salary, wages, or other income through employment, outside the home, is termed as a
working woman. With globalization and improvement in education, the literacy rate among women is increasing; this has
resulted in more women taking up employment. In India, with women increasingly taking on jobs, the concept of the man being
'head of the family' is now changing. Working within and outside the home are the two phases of a woman's life. Balancing
work and family life has become a major issue for women. Dealing with family issues as well as work issues has resulted in
women dealing with an increasing amount of stress. This research study attempts to understand the stress among women as a
result of dealing with this dual role.
Literature ReviewThe concept of stress was introduced in life science by Selye Hans in 1936. Stress was defined as any external event or internal
drive which threatens to upset the organic equilibrium (Selye Hans, 1956). Stress was defined as causing a threat to the quality
of work life as well as physical and psychological well being (Cox, 1978). Stress is determined as generalised, patterned
unconscious mobilization of the body's natural ability (Yahaya et al., 2009). Stress is a consequence of or a general response to
an action or situation that places special physical or psychological demands, or both, on a person (Hogan, 1991). Job stress is “a
condition arising from the interaction of people and their jobs and is characterized by changes within people that force them to
deviate from their normal functioning” (Beehr and New man, 1978).
Job-related stress factors are adverse working conditions such as excessive noise, extreme temperature or overcrowding
(Mcgrath, 1978), role ambiguities, conflict, overload and under load (Arcold et al, 1986). Explored stress management
techniques used by working women are sleep and relaxation, exercise, time management, diet and yoga (Upamany 1997). The
research study has reported that supportive work and family policy, effective management, communication, health insurance
coverage for mental illness and chemical dependence, and fixed scheduling of work hours were effective in reducing job
burnout (Lawless, 1991). Work and family are two important parts of a person's life and both are closely related (Ford et al.,
2007). Since an increasing number of women are entering the work force and pursuing careers (Sevim, 2006), they have to
NMIMS JOURNAL OF ECONOMICS AND PUBLIC POLICYVolume II • Issue 1 • April 2017
NMIMS JOURNAL OF ECONOMICS AND PUBLIC POLICYVolume II • Issue 1 • April 2017
28 29
mall farmers. Majority of the
farmers (82%) borrow less than
Rs 5 lakhs, and 18% borrow
between Rs 5 – 10 lakhs on a per
annum basis. Most farmers
(65.79%) ar
Table & Image source
sub heading table headingmain heading