astronauts and robots 2015: randall friedl, jpl
TRANSCRIPT
Earth ScienceEarth Science
Presentation toPresentation toAmerican Astronautical SocietyAmerican Astronautical Society
Conference on Astronauts and Robots:Partners in Space Science and Exploration
May 13, 2015May 13, 2015
Randall R. FriedlRandall R. Friedl
Jet Propulsion LaboratoryCalifornia Institute of Technology
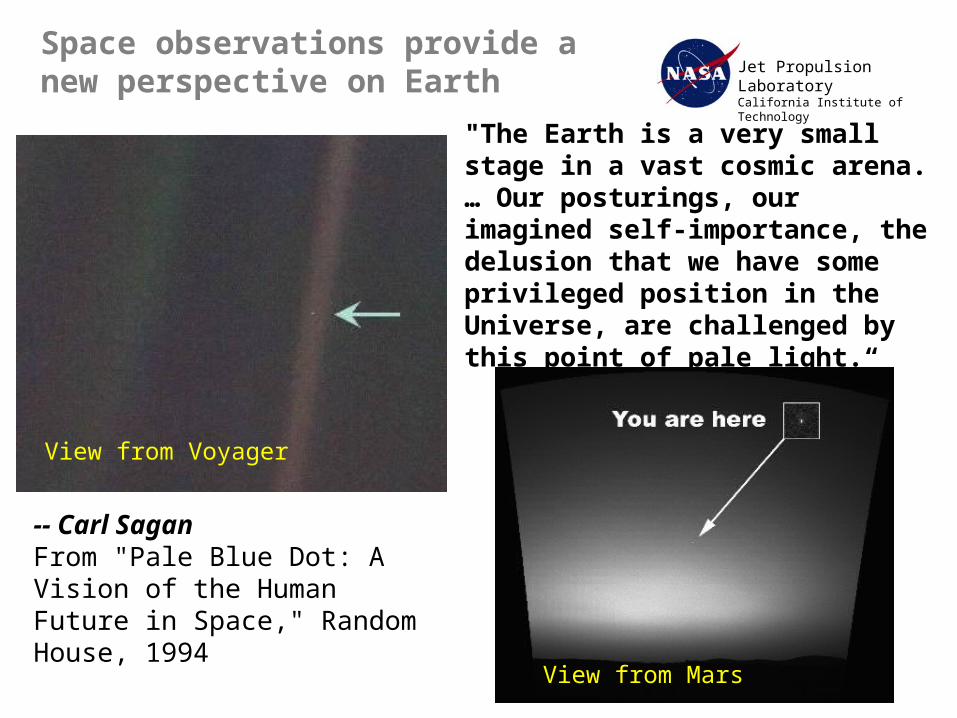
"The Earth is a very small stage in a vast cosmic arena. … Our posturings, our imagined self-importance, the delusion that we have some privileged position in the Universe, are challenged by this point of pale light.“
-- Carl SaganFrom "Pale Blue Dot: A Vision of the Human Future in Space," Random House, 1994
View from Voyager
View from Mars
Space observations provide a new perspective on Earth
Jet Propulsion LaboratoryCalifornia Institute of Technology
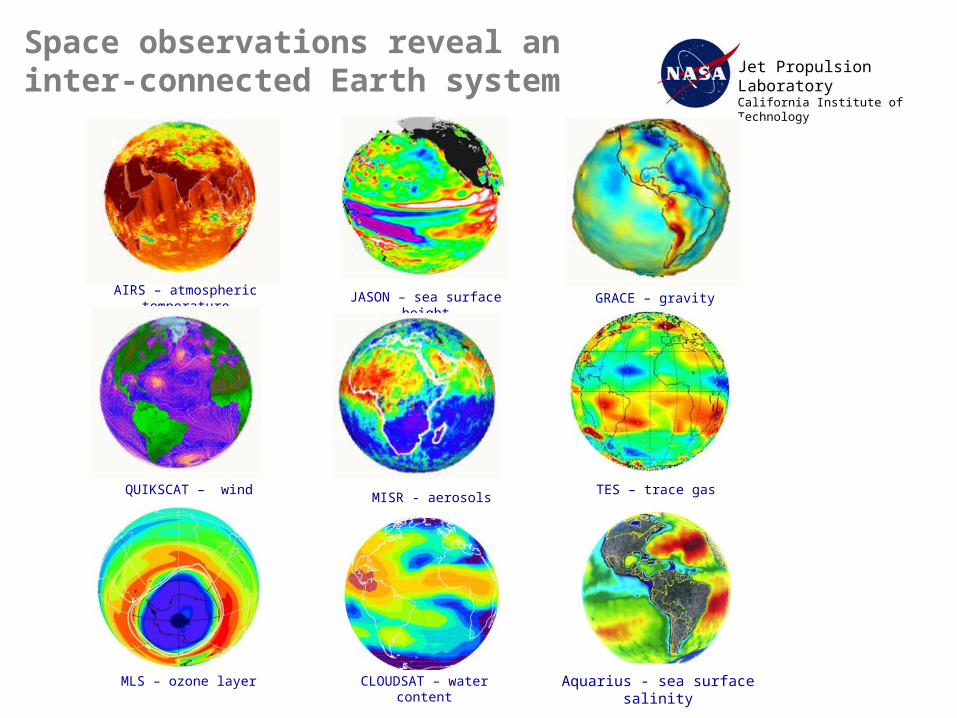
Space observations reveal an inter-connected Earth system
MISR - aerosols
MLS – ozone layer
TES – trace gas
AIRS – atmospheric temperature
CLOUDSAT – water content
JASON – sea surface height
QUIKSCAT – wind
GRACE – gravity
Aquarius - sea surface salinity
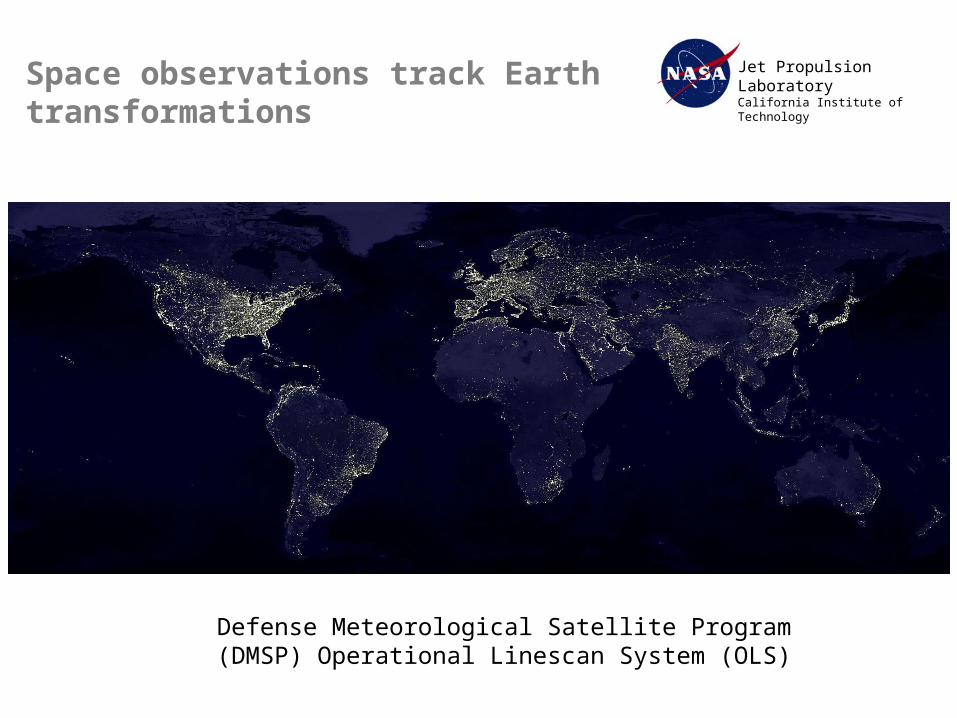
Jet Propulsion LaboratoryCalifornia Institute of TechnologySpace observations track Earth
transformations
Defense Meteorological Satellite Program (DMSP) Operational Linescan System (OLS)
Jet Propulsion LaboratoryCalifornia Institute of Technology
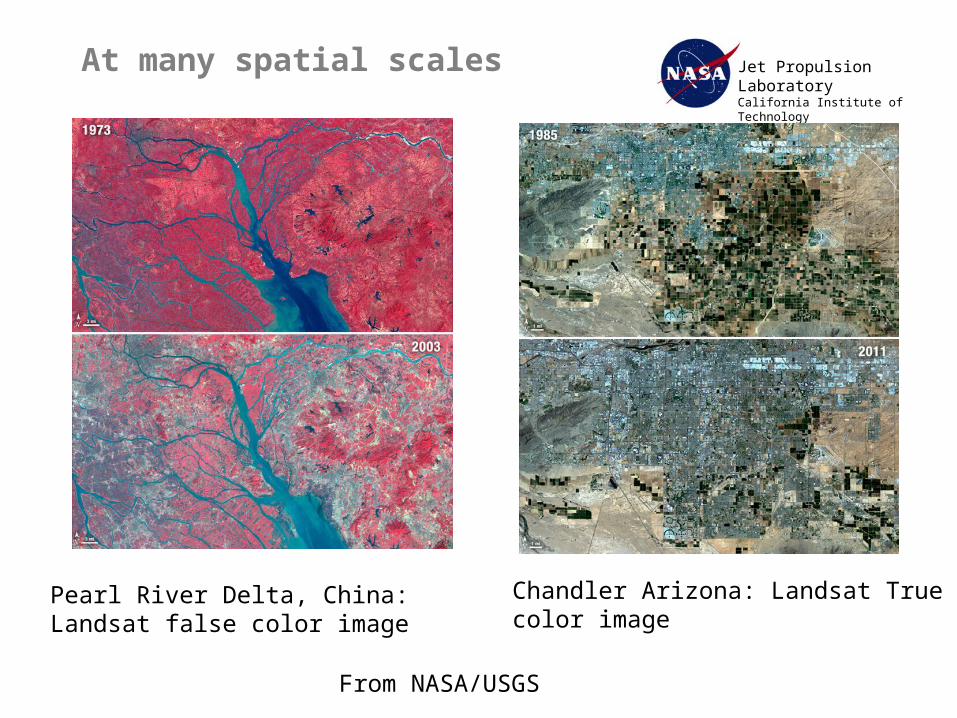
At many spatial scales
1988
Pearl River Delta, China: Landsat false color image
Chandler Arizona: Landsat True color image
From NASA/USGS
Jet Propulsion LaboratoryCalifornia Institute of Technology
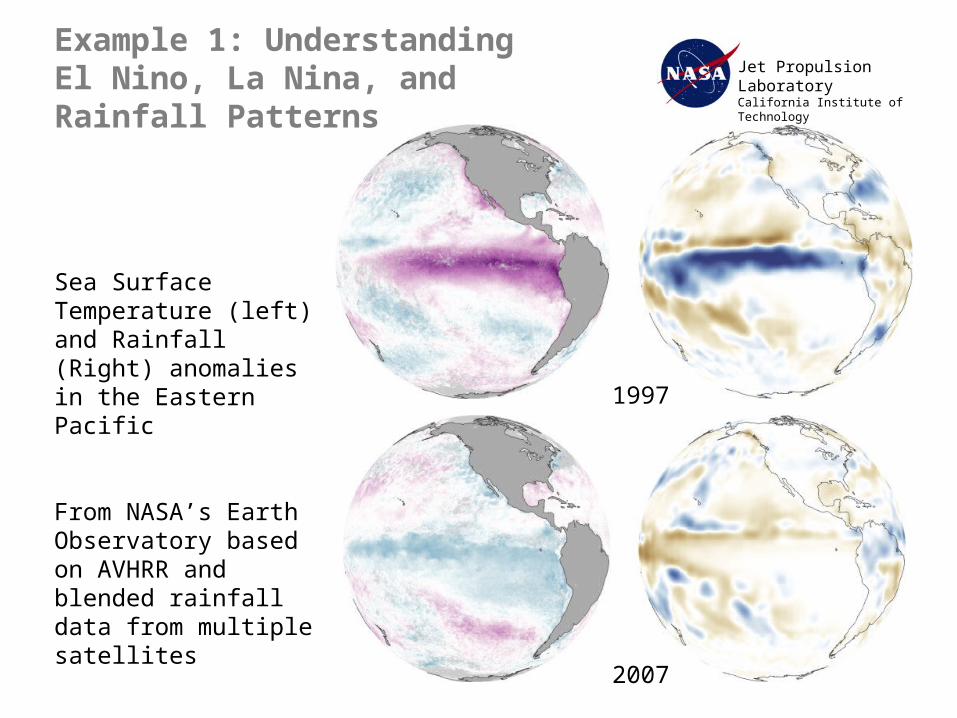
Sea Surface Temperature (left) and Rainfall (Right) anomalies in the Eastern Pacific
From NASA’s Earth Observatory based on AVHRR and blended rainfall data from multiple satellites
1997
2007
Example 1: Understanding El Nino, La Nina, and Rainfall Patterns
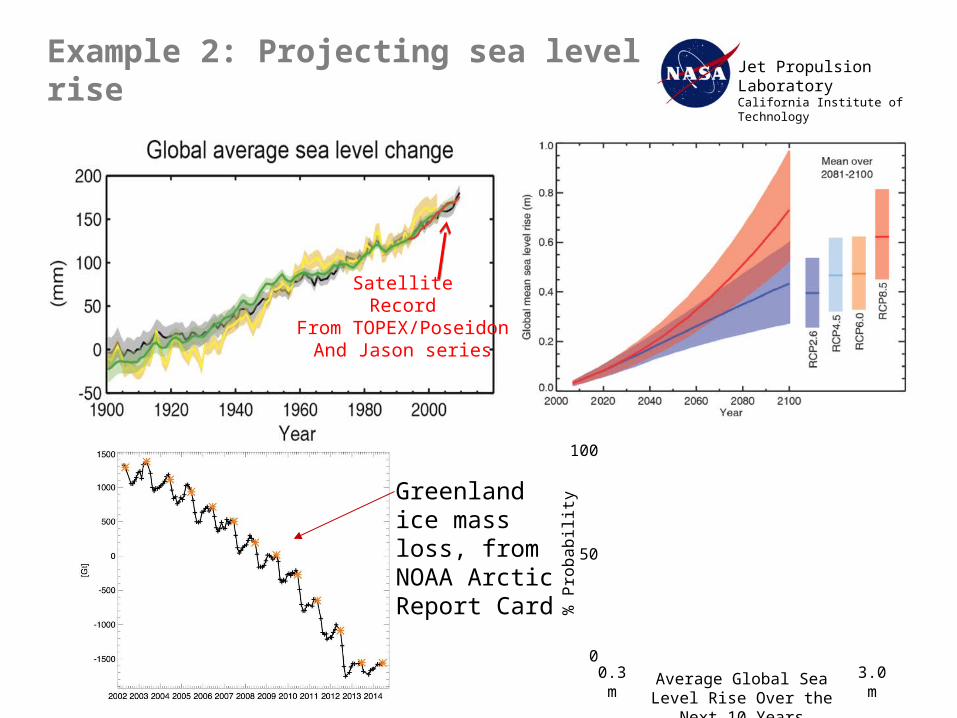
Jet Propulsion LaboratoryCalifornia Institute of TechnologyExample 2: Projecting sea level rise
SatelliteRecord
From TOPEX/PoseidonAnd Jason series
3.0 m0.3 m Average Global Sea Level Rise Over the Next 10 Years
100
50
0
% P
roba
bilit
y
Greenland ice mass loss, from NOAA Arctic Report Card
Jet Propulsion LaboratoryCalifornia Institute of Technology
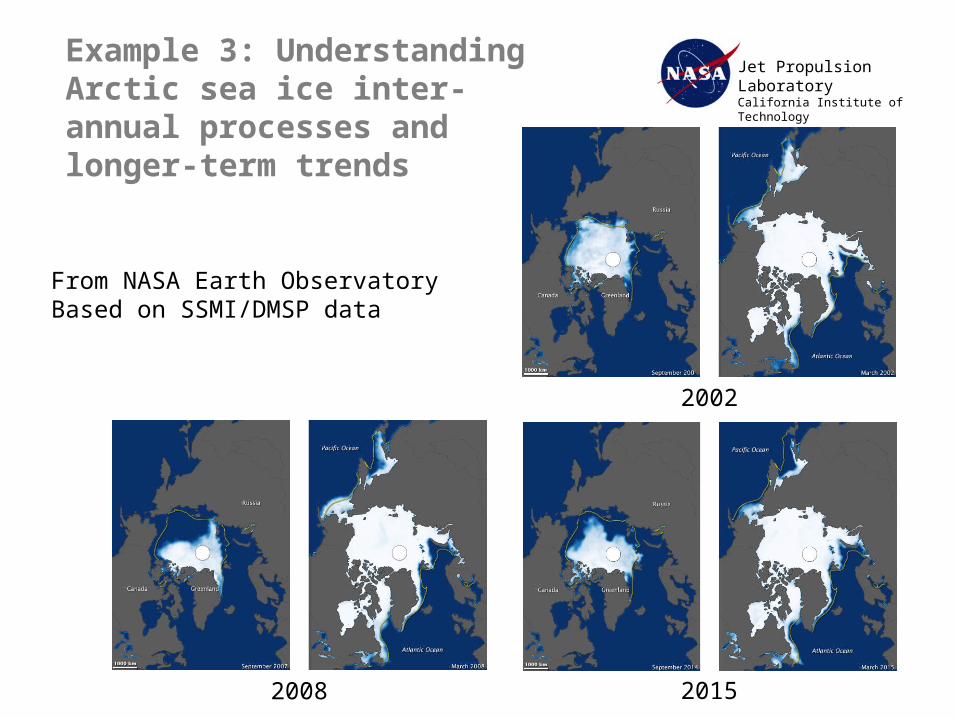
Example 3: Understanding Arctic sea ice inter-annual processes and longer-term trends
2002
2008 2015
From NASA Earth ObservatoryBased on SSMI/DMSP data
Jet Propulsion LaboratoryCalifornia Institute of Technology
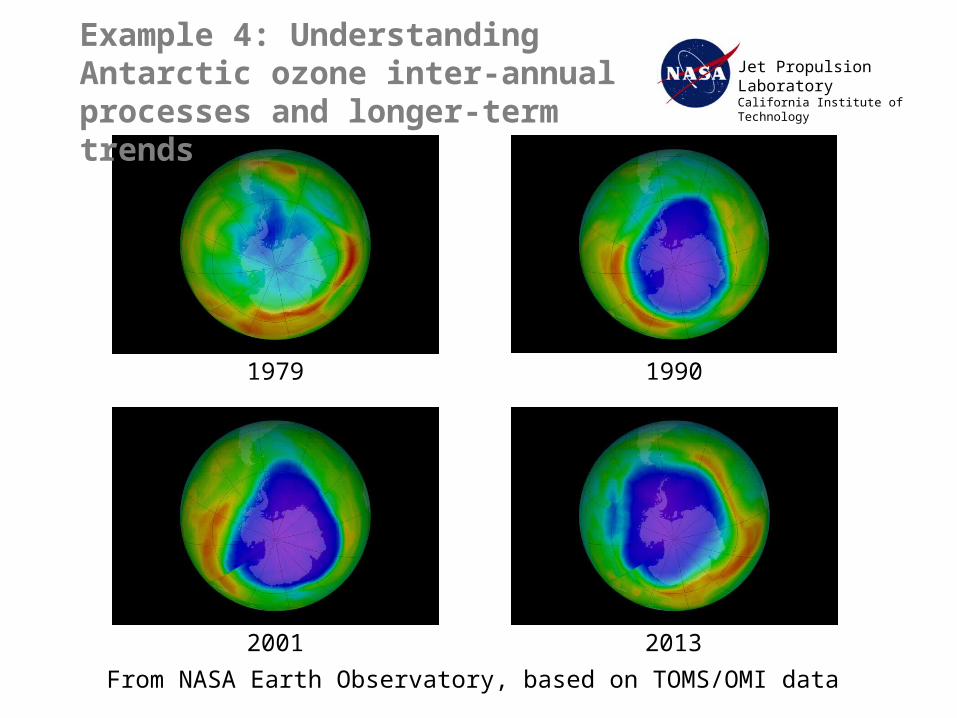
1979 1990
2001 2013
From NASA Earth Observatory, based on TOMS/OMI data
Example 4: Understanding Antarctic ozone inter-annual processes and longer-term trends
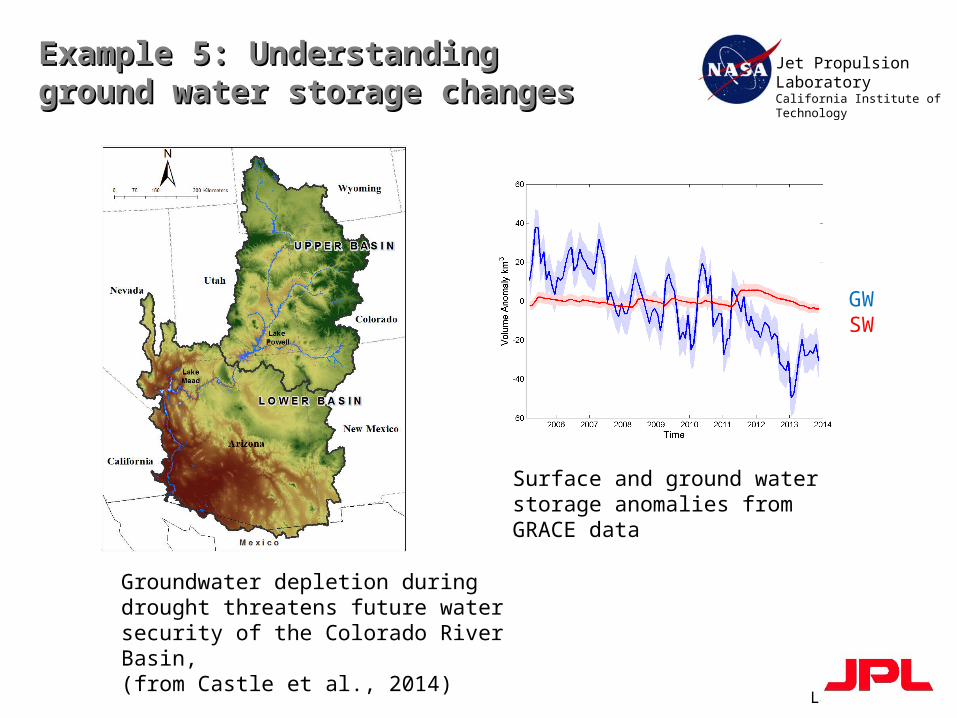
Example 5: Understanding ground water Example 5: Understanding ground water storage changes storage changes
Landerer, JPL
Jet Propulsion LaboratoryCalifornia Institute of Technology
GWSW
Groundwater depletion during drought threatens future water security of the Colorado River Basin, (from Castle et al., 2014)
Surface and ground water storage anomalies from GRACE data
Jet Propulsion LaboratoryCalifornia Institute of Technology
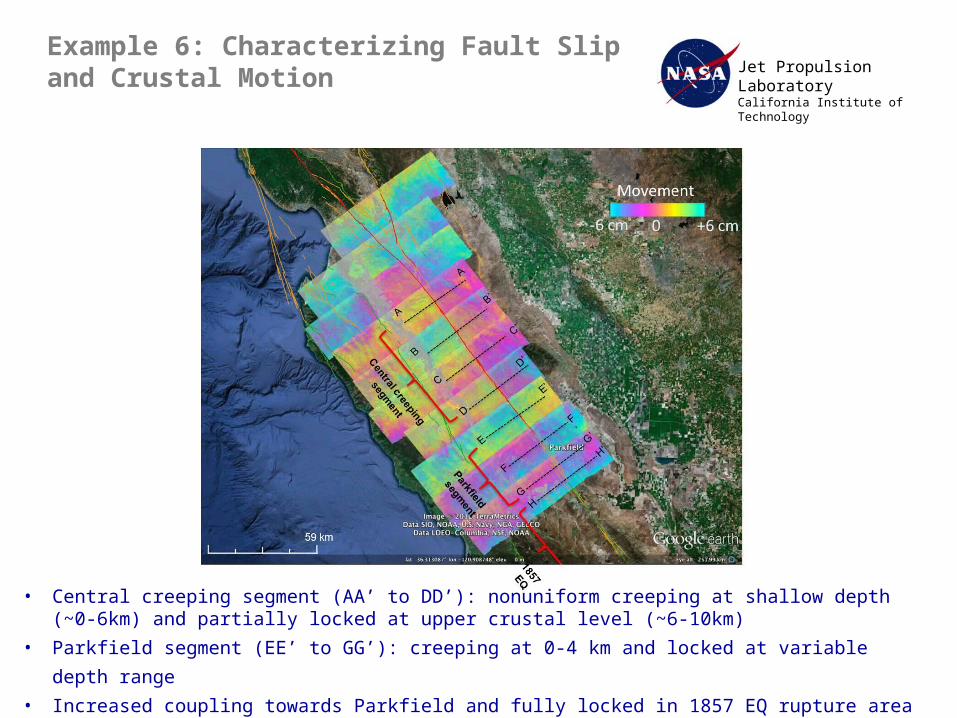
Example 6: Characterizing Fault Slip and Crustal Motion
• Central creeping segment (AA’ to DD’): nonuniform creeping at shallow depth (~0-6km) and partially locked at upper crustal level (~6-10km)
• Parkfield segment (EE’ to GG’): creeping at 0-4 km and locked at variable depth range• Increased coupling towards Parkfield and fully locked in 1857 EQ rupture area (HH’ and beyond)
(Liu, et al, 2011)