at a glance: the go365 five-year study
TRANSCRIPT

At a Glance:The Go365 Five-Year StudyGo365® recently completed a five-year study of how the program can help with employee health, cost savings, and productivity. Below are some highlights from the study1:
In an analysis of risk factors among Go365 members, we looked at data from more than 10,000 Humana employees over the course of five years. The first two years were used as a baseline period and the last three years made up the analysis period.
Similar to the Employee Health Analysis above, we looked at healthcare claims and usage trends among Go365 members over the course of five years, using the first two years as a base-line and the last three as the analysis period.
Lifestyle risk factorsBetween Years 3 and 5, members were more likely to report eating more fruits/ and vegetables, exercising more a week, experiencing lower levels of stress, and being non-smokers.
Healthcare claims costsIn Year 5, high-engaged members paid a PMPM* average of $116 less in healthcare than low-engaged members.
Clinical risk factorsBetween Years 3 and 5, biometric data showed that members were more likely to have healthy ranges of high-density lipoprotein (HDL) cholesterol, blood glucose, blood pressure, and triglycerides.
Healthcare usageIn Year 5, on average, high-engaged members had 35 percent fewer emergency room visits and 30 percent fewer hospital admissions than low-engaged members.
EMPLOYEE HEALTH
HEALTHCARE CLAIMS COSTS AND USAGE
BOTTOM LINE: There was an increase in the percentage of members who reported healthier lifestyle choices and received clinical results showing a healthy range for different risk factors linked to chronic conditions.
BOTTOM LINE:Higher engagement in Go365 was linked to minimized cost increases in healthcare, as well as fewer emergency room visits and hospital admissions.
*Per member per month
Go365 is not an insurance product. Not available with all Humana health plans.
For more information about the study, the Go365 program, how to improve employee health, cost savings, and productivity at your organization, go to go365.com/for-business.
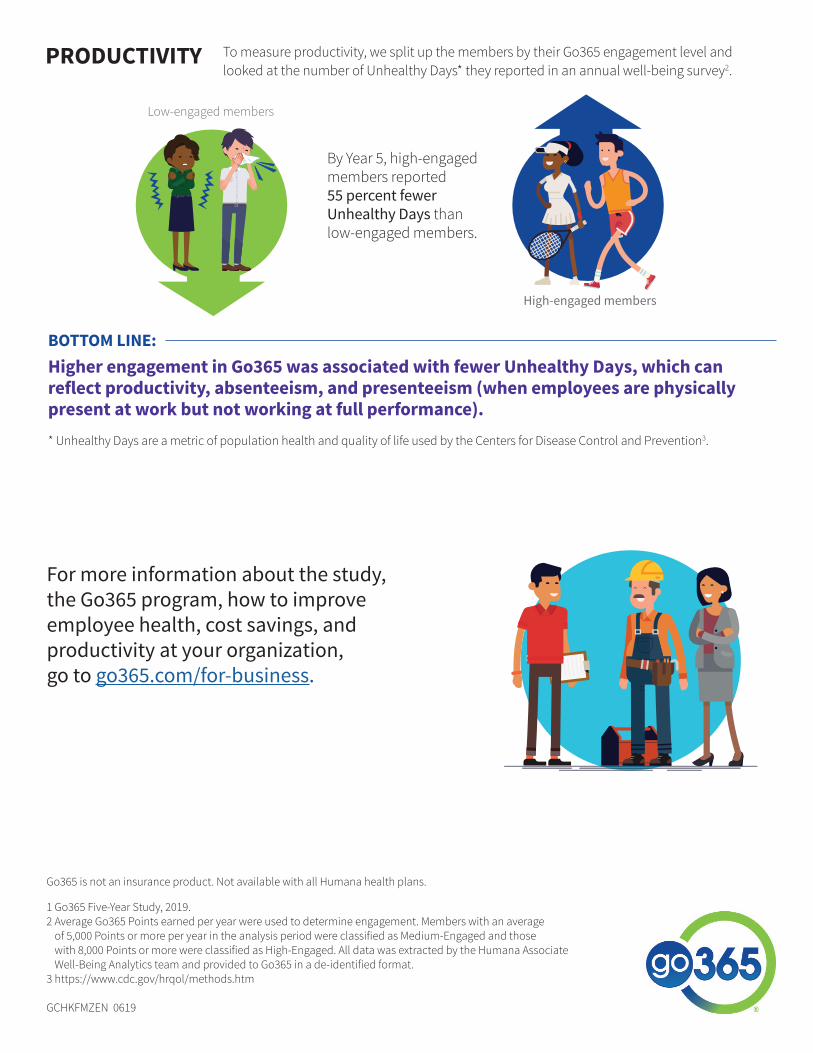
To measure productivity, we split up the members by their Go365 engagement level and looked at the number of Unhealthy Days* they reported in an annual well-being survey2.
* Unhealthy Days are a metric of population health and quality of life used by the Centers for Disease Control and Prevention3.
By Year 5, high-engaged members reported 55 percent fewer Unhealthy Days than low-engaged members.
PRODUCTIVITY
BOTTOM LINE: Higher engagement in Go365 was associated with fewer Unhealthy Days, which can reflect productivity, absenteeism, and presenteeism (when employees are physically present at work but not working at full performance).
Low-engaged members
High-engaged members
1 Go365 Five-Year Study, 2019.2 Average Go365 Points earned per year were used to determine engagement. Members with an average
of 5,000 Points or more per year in the analysis period were classified as Medium-Engaged and those with 8,000 Points or more were classified as High-Engaged. All data was extracted by the Humana Associate Well-Being Analytics team and provided to Go365 in a de-identified format.
3 https://www.cdc.gov/hrqol/methods.htm
GCHKFMZEN 0619

Go365 Five-year study Report
IntroductionA survey of employers in 2018 revealed that most organizations are continuing or further investing in their commitment to workplace wellness.1 That study also found that 98 percent of employers prioritized “managing healthcare costs,” as well as improving employee health and productivity.
However, the struggle to measure the success of wellness programs remains. For example, one study found “zero benefits” from a specific wellness program, but it shared results based on only one year.2 Realistically, organizations should expect to see value from a wellness program after three to five years.3
Go365® is a wellness and rewards program in which members earn Points for completing various healthy lifestyle activities, including online educational assessments, preventive screenings, and fitness activities. Points accumulated define a member’s Status in the program (Blue, Bronze, Silver, Gold, and Platinum) and some of these Points can be redeemed for rewards. The more members engage in Go365, the more Points they can earn.
Findings from the Go365 Five-Year Study are based on data collected from July 2011 through June 2016, the first five years the program was implemented company-wide at Humana, Inc.® The objective of the study was to examine engagement in the program and its impact on factors such as employee health, healthcare costs and usage, and productivity.
Employee Health Risk Factors Analysis
Background & methodology
For the portion of the study focused on measuring changes in lifestyle and clinical risk factors, the first two years of the program were defined as a baseline period, and the last three years were defined as the analysis period (referred to as the “analysis period” throughout this report). This is due to the fact that the first two years saw a lot of changes in engagement in the program as employees familiarized themselves with the program, and the last three years captured the members’ behaviors and health data more accurately. This also helped limit selection bias from early adopters.
GCHKFNHEN_0519

The risk factor cohort analysis sample included 10,598 Humana employees (98 percent of the eligible population). Data was collected through Go365 Health Assessment and biometric screening completions. Due to missing data, sample sizes varied slightly by risk factor, however, but on average there were around 10,400 responses per risk factor. Where available, verified data was prioritized over self-reported data for the clinical risk factors findings.
Lifestyle risk factors
Risk factors are actions or characteristics that increase the likelihood of disease. Wellness programs can and should focus on lifestyle risk factors, which are behaviors or habits that can contribute to the likelihood of disease and are more controllable than factors like genetics. For lifestyle risk factors related to nutrition, physical activity, stress, and tobacco use, we looked at self-reported data gathered from Health Assessments.
Improvements in nutrition and physical activity habits
When it came to daily fruit and vegetable intake, members were more likely to increase the number of servings of fruits and vegetables over the course of five years. During the baseline period, only 16.6 percent of members reported having five or more servings, but in the analysis period, 28.3 percent reported five or more servings.
Likewise, during the baseline period, only 36.2 percent reported exercising at least 150 minutes a week, but that percentage rose to 61.6 percent in the analysis period.
Bottom Line: As time progressed, daily fruit and vegetable consumption and weekly exercise increased overall among members.
GCHKFNHEN_0519
DAILY FRUIT AND VEGETABLE INTAKE & WEEKLY PHYSICAL ACTIVITY
0 to 2 <753 to 4 <1505+ >=150
% O
F M
EMBE
RS
70%
60%
50%
40%
30%
20%
10%
44.1%
39.4%39.3%
24.4%
16.6%
36.2%30.7%
16.1%
41.0%
22.3%
28.3%
61.6%
DAILY FRUIT AND VEGETABLES PHYSICAL ACTIVITY (MIN/WK)
Baseline Analysis

Improvements in stress levels and tobacco usage
The Kessler Psychological Distress Scale is a questionnaire designed to measure how much a person has experienced symptoms of anxiety and depression within the previous four weeks.4 Questions from the Scale were used to measure stress among members for this study.
Members were almost five percentage points more likely to report having low stress during the analysis period. Members were 2.3 percent more likely to be non-smokers in the analysis period.
Bottom Line: Overall, members were more likely to report experiencing low stress and to be non-smokers after five years with the Go365 program.
Clinical risk factors
Every program year, we ask Go365 members to take a biometric screening (mainly a blood test, weight/height measurement, and waist measurement) to measure clinical risk factors, such as levels of cholesterol, blood glucose, body mass index (BMI), blood pressure, and triglycerides. These are physiological indicators of health, which can be used to determine if a person is at risk for certain conditions, such as heart disease or diabetes. When interpreting the results below it is important to keep in mind that age is one of the biggest contributing factors to higher risk levels. Given that this was a cohort analysis and the underlying population was aging (the average duration between assessments was three years and 10 months), the results should be viewed in that context.
GCHKFNHEN_0519
Low Non-smokerMedium Ex-smokerHigh Current Smoker
% O
F M
EMBE
RS
84.91%
69.45%
9.15%
22.22%
5.94%8.43%
89.83%
71.16%
6.55%
22.73%
3.62% 5.61%
KESSLER STRESS SCORE TOBACCO
Baseline Analysis
STRESS LEVEL AND TOBACCO USAGE

Improvements in HDL cholesterol and blood glucose, mixed results for BMI
High-density lipoprotein (HDL) is sometimes known as the “good” cholesterol because higher levels of it are linked with a lower risk of heart disease.5 For men, having an HDL level of 50 or more mg/dL is considered to be “low risk” for heart disease. In the analysis period, 7.1 percent more male employees were in the desirable range compared to the baseline period. For women, having more than 60 mg/dL is considered ideal, and there was a 2.6 percent increase in the ideal range during the analysis period.
Blood glucose measures the amount of glucose (a type of sugar) in your blood, and very high levels indicate a risk for diabetes, heart disease, kidney disease, and other conditions.6 A level below 100 mg/dL is considered ideal and during the analysis period, there was a slight uptick among members in the ideal range.
Body mass index (BMI) is one of many risk factors for chronic conditions. The BMI of members in the study remained fairly consistent over the course of five years, except for a one percent increase in the higher-than-30 category, which is considered obese. This is not surprising, considering that weight control is a well-known challenge for many Americans, especially as they age due to slowing metabolism.7
Bottom Line: Our biometric data shows improvements in clinical risk factors, such as HDL and blood glucose levels after five years. Remember, age is an important factor that can drive clinical risk factors into unhealthy ranges, so these findings are promising.
GCHKFNHEN_0519
< 40 < 50 < 100 < 25
HDL CHOLESTEROL (MALE)
HDL CHOLESTEROL (FEMALE)
BLOOD GLUCOSE BMI BAND
48.6
%
40.5
%
77.6
%
26%
25.6
%
23.2
%
17.9
%
31%
25.6
%
36.4
%
4.6%
43%
37.9
%
36.0
%
78.5
%
26%29
.4%
25.0
%
17.0
%
30%
32.7
% 39.0
%
4.6%
44%
< 50 < 60 < 125 < 30>= 50 >= 60 >= 125 >= 30
Baseline Analysis
% O
F M
EMBE
RS
HDL CHOLESTEROL, BLOOD GLUCOSE, AND BMI RESULTS
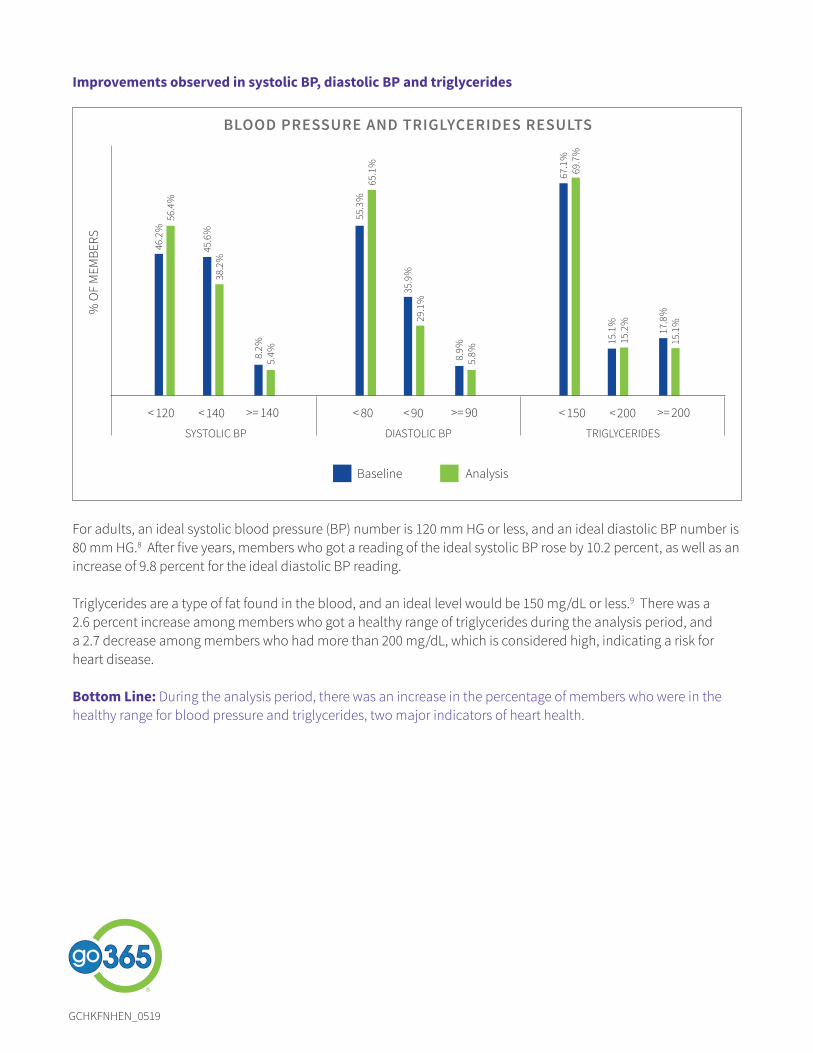
Improvements observed in systolic BP, diastolic BP and triglycerides
For adults, an ideal systolic blood pressure (BP) number is 120 mm HG or less, and an ideal diastolic BP number is 80 mm HG.8 After five years, members who got a reading of the ideal systolic BP rose by 10.2 percent, as well as an increase of 9.8 percent for the ideal diastolic BP reading.
Triglycerides are a type of fat found in the blood, and an ideal level would be 150 mg/dL or less.9 There was a 2.6 percent increase among members who got a healthy range of triglycerides during the analysis period, and a 2.7 decrease among members who had more than 200 mg/dL, which is considered high, indicating a risk for heart disease.
Bottom Line: During the analysis period, there was an increase in the percentage of members who were in the healthy range for blood pressure and triglycerides, two major indicators of heart health.
GCHKFNHEN_0519
< 120 < 80 < 150
SYSTOLIC BP DIASTOLIC BP TRIGLYCERIDES
46.2
%
55.3
%
67.1
%
45.6
%
35.9
%
15.1
%
8.2%
8.9%
17.8
%
56.4
%
65.1
% 69.7
%
38.2
%
29.1
%
15.2
%
5.4%
5.8%
15.1
%
< 140 < 90 < 200>= 140 >= 90 >= 200
Baseline Analysis
% O
F M
EMBE
RS
BLOOD PRESSURE AND TRIGLYCERIDES RESULTS

Claims, Usage and Productivity Analysis
Background & methodology
Similar to the risk factors cohort, the claims analysis was based on a timeframe of five years (July 2011 to June 2016) with the first two years defined as a baseline period, and the last three years defined as the analysis period. The total sample included 10,800 members that met the inclusion criteria (having 12 months of continuous medical and Go365 coverage in each year). Total claims per member were capped at $100,000 to minimize the impact of outliers on the results. Claims data included total allowed medical and pharmacy data.
To measure the engagement level of Go365 members, the average number of Go365 Points earned per year was used. Low-engaged members had an average of fewer than 5,000 Points per year. Medium-engaged members had an average of 5,000 Points or more per year, while high-engaged members earned at least 8,000 Points in each year during the analysis period.
Propensity score matching, a statistical method that normalizes for known imbalances in demographic and socioeconomic factors, was used to ensure that the comparisons between the low-, medium- and high-engaged members were valid. Matched triplets were created in which three employees (one low-, one medium- and one high-engaged member) with similar demographic and socio-economic characteristics were matched to each other to form the comparison groups. This minimized the impact of confounding factors in the results, such as age differences between the engagement groups. The total matched sample consisted of 1,462 matched triplets, i.e., 4,368 members.
Engagement was associated with favorable claims cost and utilization outcomes
GCHKFNHEN_0519
Baseline
HEA
LTH
CLA
IMS
COST
S
160%
140%
120%
100%
80%
60%
40%
20%
+ 4% ($16)
-9% (-$31)
-22% (-$116)
-5% (-$24)
Year 5
TOTAL ALLOWED CLAIMS COSTS (PMPM) BY ENGAGEMENT LEVEL
Low-engaged serves as the benchmark Low Medium High

Using the low-engaged members from the baseline period as a benchmark, in Year 5, the high-engaged members paid, on average, 22 percent less than low-engaged members. Low-engaged members paid 49 percent more than they paid during the baseline period.
Engagement % of Employees Avg. Annualized Trend
Low 21% 12.1%
Medium 55% 9.3%
High 24% 7.1%
The average annualized trend refers to how much more they are paying in claims costs per year. So although all associates are generally paying more, high-engaged members had the smallest increase.
Bottom Line: On average, all associates generally had increases in their claims costs (which is expected due to an aging population, and inflation in the cost of healthcare), but those increases varied by their level of engagement with Go365. High-engaged members experienced lower cost increases, relative to low- and medium-engaged members.
Engagement linked with favorable claims costs for members with lifestyle-related conditions
GCHKFNHEN_0519
0%
20%
40%
60%
80%
100%
120%
140%
100%
-18%
-31%
-22%
-54%
Baseline Year 5
TOTAL ALLOWED CLAIMS COSTS (PMPM) FOR LIFESTYLE-RELATED CHRONIC CONDITIONS
Low-engaged serves as the benchmark Low Medium High

We looked at the Per Member Per Month (PMPM) costs for certain lifestyle-related chronic conditions to see how much they varied by engagement level. For these conditions, during the analysis period high-engaged members paid 54 percent less than low-engaged members. By contrast, low-engaged members paid 32 percent more than they paid in the baseline period.
Bottom Line: For those with lifestyle-related conditions, claims costs were lower for the high-engaged members than they were for the low-engaged members. Since chronic conditions present a huge cost in healthcare, this is significant in how Go365 promotes cost savings.
In Year 3, we started looking at hospital admissions data. In Year 5, high-engaged members had 30 percent fewer hospital admissions than low-engaged members. Although Year 3 showed some variability, over the course of the analysis period, we found an overall downward trend of hospital admissions among high- and medium-engaged members when compared to low-engaged members.
Bottom Line: Compared with low engagement, higher engagement in Go365 is linked with fewer hospital admissions.
Year 3 Year 4 Year 5
50.6
64.3
84.1
+43%
+1% -24%
-13%
-14%-30%
Low Medium High
HOSPITAL ADMISSIONS PER 1,000
GCHKFNHEN_0519
Low-engaged serves as the benchmark
BENCHMARK

GCHKFNHEN_0519
We also started looking at emergency room (ER) visit data starting in Year 3. High-engaged members had 35 percent fewer ER visits than low-engaged members by Year 5.
Bottom Line: Higher engagement was associated with fewer ER visits, which bear high costs and amount to one-third of all healthcare costs.10 Lowering ER visits could reasonably ease costs for both the employer and the employee.
Year 3 Year 4 Year 5
190.8207.9
249
-9%-11%
-24%
-39%-31%
-35%
Low Medium High
EMERGENCY ROOM VISITS PER 1,000
Year 3 Year 4 Year 5
5,785.206,067.00 6,640.90
+23%+16%
+11%+21%
+22% +11%
Low Medium High
OFFICE VISITS PER 1,000
Low-engaged serves as the benchmark
Low-engaged serves as the benchmark
BENCHMARK
BENCHMARK
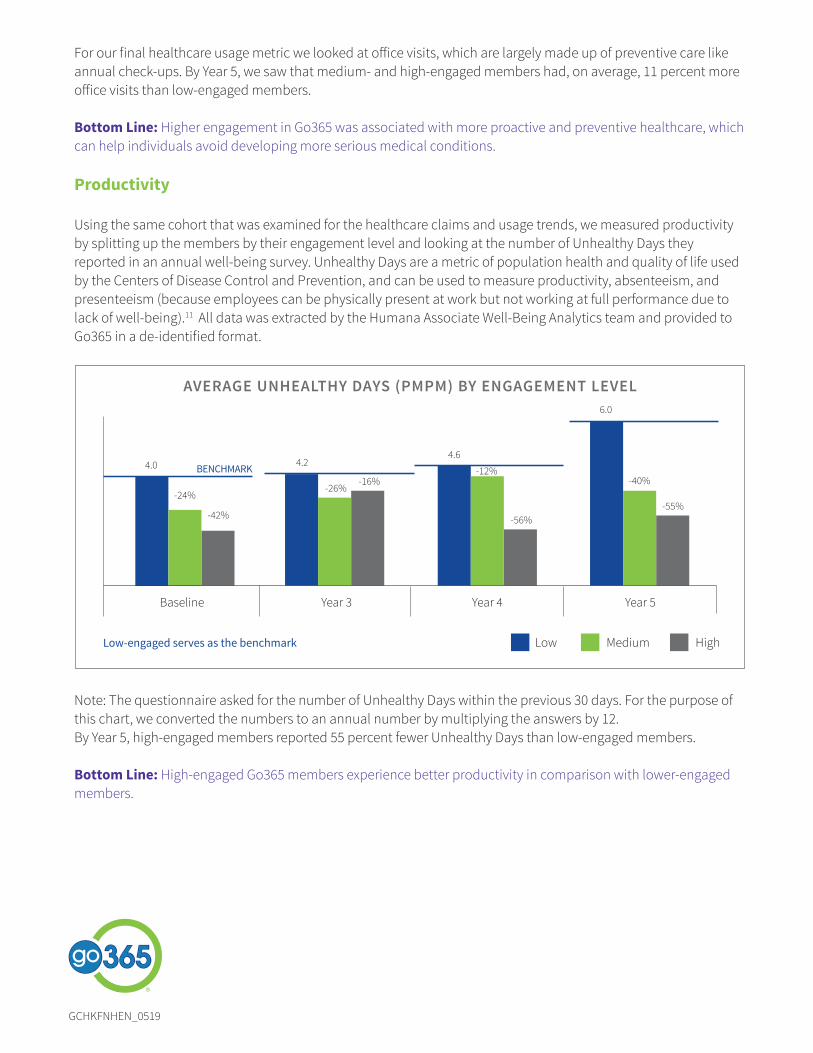
For our final healthcare usage metric we looked at office visits, which are largely made up of preventive care like annual check-ups. By Year 5, we saw that medium- and high-engaged members had, on average, 11 percent more office visits than low-engaged members.
Bottom Line: Higher engagement in Go365 was associated with more proactive and preventive healthcare, which can help individuals avoid developing more serious medical conditions.
Productivity
Using the same cohort that was examined for the healthcare claims and usage trends, we measured productivity by splitting up the members by their engagement level and looking at the number of Unhealthy Days they reported in an annual well-being survey. Unhealthy Days are a metric of population health and quality of life used by the Centers of Disease Control and Prevention, and can be used to measure productivity, absenteeism, and presenteeism (because employees can be physically present at work but not working at full performance due to lack of well-being).11 All data was extracted by the Humana Associate Well-Being Analytics team and provided to Go365 in a de-identified format.
Note: The questionnaire asked for the number of Unhealthy Days within the previous 30 days. For the purpose of this chart, we converted the numbers to an annual number by multiplying the answers by 12.By Year 5, high-engaged members reported 55 percent fewer Unhealthy Days than low-engaged members.
Bottom Line: High-engaged Go365 members experience better productivity in comparison with lower-engaged members.
GCHKFNHEN_0519
Baseline Year 3 Year 4 Year 5
4.0 4.24.6
6.0
-24%-26%
-12%-40%
-42%
-16%
-56%-55%
Low Medium High
AVERAGE UNHEALTHY DAYS (PMPM) BY ENGAGEMENT LEVEL
Low-engaged serves as the benchmark
BENCHMARK

ConclusionIn summary, the five-year study shows a link between long-term engagement in Go365 with employee health (as demonstrated by Health Assessment and biometric data), improvements in healthcare cost savings (as seen from claims costs and different types of healthcare consumption), and productivity (as measured by Unhealthy Days).
In summary, this study’s results continue to show a positive correlation between engagement in the Go365 program and lower healthcare costs, absenteeism, and biometric risk factors. There also seems to be a close response relationship between engagement in the program and health outcomes, with high-engaged members exhibiting the best results, followed by medium-engaged members, and low-engaged members having the worst results.
About the AuthorJaco Conradie is an associate director of financial analytics on the Humana Wellness Solutions product team. Conradie is a graduate of Pretoria University (South Africa) with a degree in actuarial mathematics.
Conradie is also the co-author of “Participation in Fitness-Related Activities of an Incentive-Based Health Promotion Program and Hospital Costs – A Retrospective Longitudinal Study” American Journal of Health Promotion May/June 2011, Vol. 25, No. 5.
AppendixFor a full overview of how a member on an employee-only plan can earn Points in Go365, click here.
Go365 is not an insurance product. Not available with all Humana health plans.
1 https://healthpayerintelligence.com/news/86-of-employers-use-financial-incentives-in-wellness-programs2 https://www.forbes.com/sites/alankohll/2018/02/27/are-you-measuring-the-real-impact-of-your-employee-
wellness-program/#19992e0123b53 https://www.shrm.org/resourcesandtools/hr-topics/benefits/pages/wellness-roi-design.aspx4 https://link.springer.com/referenceworkentry/10.1007%2F978-94-007-0753-5_36635 https://www.mayoclinic.org/diseases-conditions/high-blood-cholesterol/in-depth/hdl-cholesterol/art-200463886 https://medlineplus.gov/lab-tests/blood-glucose-test/7 https://health.usnews.com/wellness/aging-well/articles/2018-11-12/is-it-harder-to-lose-weight-as-you-age8 https://www.healthline.com/health/high-blood-pressure-hypertension/blood-pressure-reading-explained9 https://www.mayoclinic.org/diseases-conditions/high-blood-cholesterol/in-depth/triglycerides/art-2004818610 https://www.thebalance.com/causes-of-rising-healthcare-costs-406487811 https://www.cdc.gov/hrqol/methods.htm
GCHKFNHEN_0519