athletic fields and water conservationpublications.tamu.edu/turf_landscape/pub_turf_athletic fields...
TRANSCRIPT
AthleticFieldsand Water Conser vation
B-608810/99
Water Supply andConservation
EducationPrograms
Gene R. Taylor, II, Assistant Professor and Extension Turfgrass SpecialistRichard H. White, Associate Professor Turfgrass Physiology, Texas
Agricultural Experiment StationScott Abernathy, Former Turfgrass Extension Assistant David Smith, Former Extension Associate—Integrated Landscape Management
The Texas A&M University System

Water conservation must be considered by anyone working inturf and grounds maintenance. Athletic field managers must knowhow to conserve water, yet provide a safe and aestheticallypleasing facility for recreational use.
As an athletic field manager, you must know how yourirrigation system performs and understand all the factors thataffect turfgrass water use in order to develop a sound irrigationmanagement program. You must be able to answer the followingquestions.• How does your irrigation system operate?
Know how to program your irrigation controller.Know how much water is applied in a given amount of timefor each zone.Know the distribution pattern of the system.
• What is the soil type?• What is the rooting depth of the turf?
• What are the water requirements of the turfgrass as determinedby the specific turf species and varieties, the specific use of thegrass, and the level of management?
• What environmental conditions affect turf water use rates?
HOW does your irrigation system operate?To develop an efficient watering program, the first key is to
understand the performance and capabilities of your irrigationsystem. Thoroughly understand the features of your controllerincluding options such as dual programming, multiple start timesand sensor override capabilities. The controller should befrequently modified for seasonal changes in turfgrass growth andvariable environmental conditions. It is vital to know theapplication rate and distribution pattern of each sprinkler zone,and the soil type and the rooting depth to establish an effective andefficient irrigation schedule.
A Texas A&M certified landscape irrigation auditor canevaluate your system and provide a detailed report containing thisinformation. Your county Extension agent should have a directoryof certified irrigation auditors in your area. If you choose toperform your own irrigation audit, simply follow the 18-stepprocedure in “Performing an Irrigation Audit.”
Besides performing a complete irrigation audit, you shouldroutinely check your system to ensure that each sprinkler headoperates properly. Record any problems on the report form. Lookfor broken sprinkler heads, misaligned heads, sunken heads, highwater pressure, low water pressure, leaks in the lines, andimproper rotation.
1. To obtain the most accurate results, perform the audit at the same time of day the system normally operates. Avoid extremely windy or rainy conditions.
2. Determine the square foot area of irrigated turf and record this value on the audit report. Draw the area on graph paper to scale.
3. Turn the irrigation system on and flag each sprinkler head in individual zones. Use a different color flag to represent separate zones to eliminate confusion. Plot each sprinkler head on the graph and label it with a letter (a-b-c).
4. Measure and record the distance between each sprinkler head (head spacing).
5. Use a soil probe to pull multiple soil samples from across the irrigated area.
6. Examine the soil samples and determine the effective rooting depth. The plant’s effective rooting depth is the depth of soil, in inches, that contains a large number of live, growing roots. Find an average rooting depth from all soil samples. Record the average rooting depth on the report form.
7. Determine the soil type using the “feel method.” A clay soil willfeel sticky and form a ribbon when squeezed between the fingers. A sandy soil will feel gritty, and a loamy soil will be a mixture of sand, silt and clay. Record this information for later use.
8. Conduct the remaining steps of the audit individually on each irrigation zone, beginning with zone 1.
9. You will need 15 to 20 catch cans or devices to perform the irrigation audit (depending on the number of sprinkler heads in a zone). Straight-sided containers such as coffee cans, tuna and cat food cans work well, or rain gauges can be used.
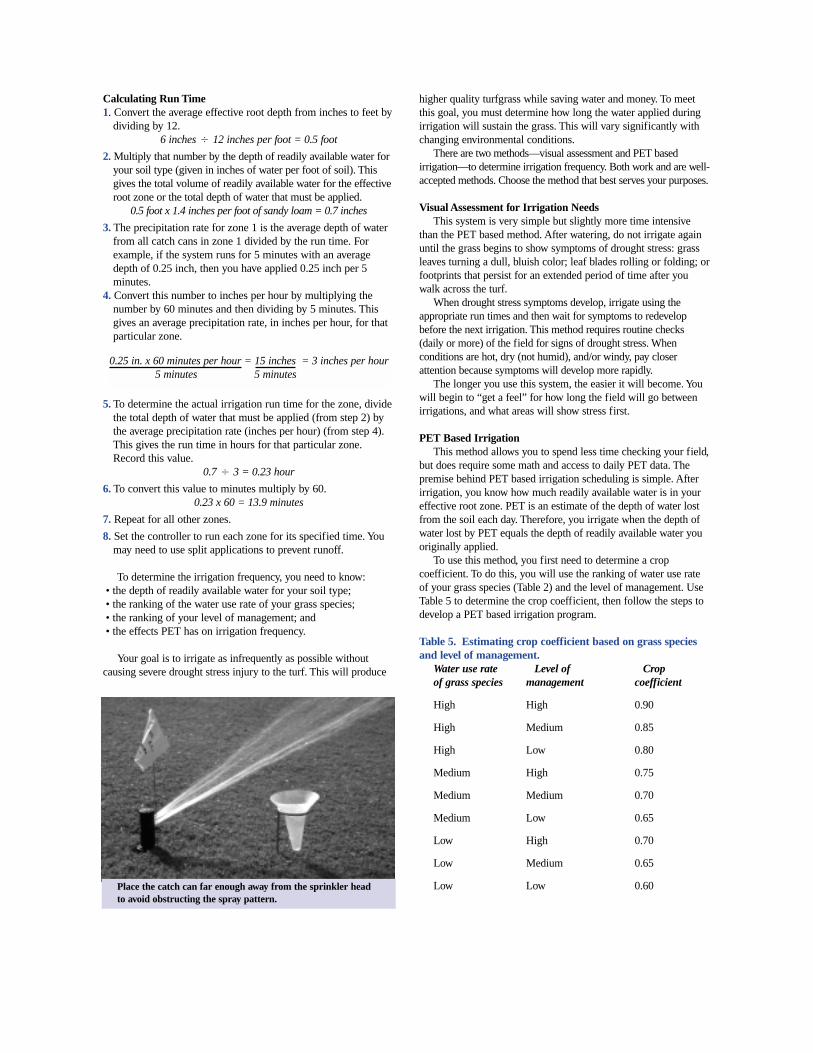
10. Place the catch cans at each sprinkler head and halfway between heads. This simple placement pattern requires the least number of catch cans while providing adequate coverage of the tested area. When placing catch cans at each head, make sure the cans are far enough away from the heads so as not to interfere with the spray pattern. Plot the location of each catch can on the graph and label with a number (1-2-3).
11. Irrigate the zone for a short period of time. The run time should be long enough to allow for five to 10 rotations of a geared rotor or impact sprinkler head. Normally, testing run times range from 10 to 30 minutes for large sprinklers. While shorter testing run times permit faster auditing, running the system longer will lead to more accurate results. Record the run time.
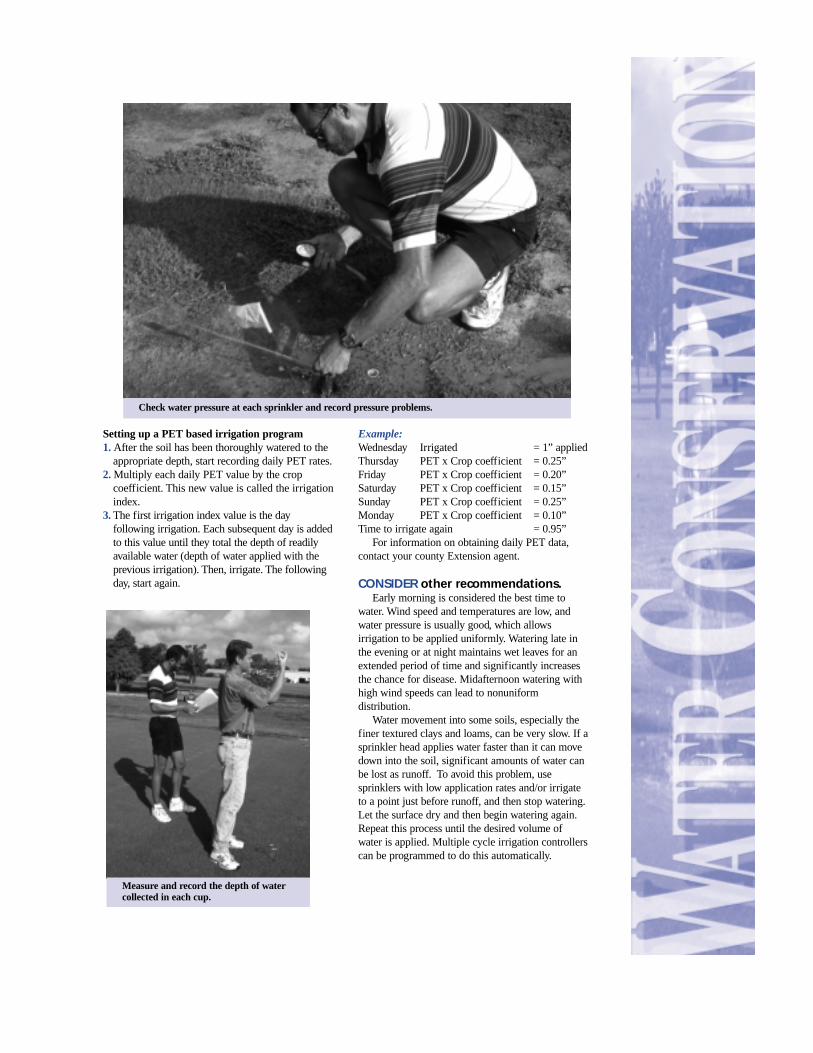
12. While the system is running, use a pressure gauge to check and record the water pressure at each sprinkler head.
13. After the zone designated run time is completed, measure and record the depth of water caught in each catch can. A ruler can be used to accurately determine the depth.
14. Record all individual catch depths and head pressures to their appropriate locations on the graph.
15. Average all catch can depths for the zone. Record this value.16. Look for distribution problems within the system. Keep in mind
that other heads not on that particular zone could add to the depth of some catch cans, especially those cans near each head.
17. If problems exist, determine the cause (pressure, wind, head alignment, etc.).
18. Repeat steps 10 through 17 for the remaining zones.
PERFORMING an irrigation audit
Water is rapidly becoming a limitedresource in Texas and will become more limited as the population
increases. Unless water conservation efforts are strengthened, water
rationing programs will become more prevalent across the state and
water prices will increase drastically.
WHAT is the soil type?To develop an effective irrigation schedule, it is
crucial to know and understand the characteristics ofyour specific soil type. Soil type influences howoften you need to water and how much water youneed to apply per application.
Soil types have different water holdingcapabilities. As soils dry, they hold onto theirremaining water more tightly. Eventually water isheld so tightly by the soil that the turfgrass roots areunable to extract it for use. The remaining water isunavailable to the grass. Available water is thefraction of water held by the soil that can beextracted by plant roots. When there is a high loss ofwater from the soil both by evaporation and bytranspiration from the plants (evapotranspiration orET), a percentage of the available water might not beavailable rapidly enough to prevent drought stress.Therefore, for irrigation scheduling, it is important tohave readily available water, or a volume of water inthe soil that will effectively prevent drought stressinjury regardless of environmental conditions.
Table 1 gives general approximations of theamount of readily available water held in each soiltype (given in inches of water per foot of soil). Withthe irrigation audit, you determined your soil type(see Irrigation Audit, step 7). Locate your soil type inTable 1 and record the volume of readily availablewater for your soil type on the Auditing Report.
Table 1. Estimates of readily available water fordifferent soils.
Soil Texture Readily Available Water (in./ft.)
Sand 0.9
Sandy Loam 1.4
Loam 1.7
Silt Loam 1.8
Clay Loam 2.0
Clay 2.1
WHAT is the rooting depth of the turf?To establish an effective irrigation schedule, you
must know the effective rooting depth, or the depthof actively growing roots. Use this depth todetermine how deeply to water each time youirrigate. Deeper water within the effective root zoneresults in less frequent irrigation. Water to a depthjust below the effective rooting depth. Irrigationwater below this depth is unavailable to the roots,and is wasted. Shallow irrigation significantly lessthan the effective rooting depth can lead to adecrease in rooting depth and will require morefrequent irrigation to prevent drought stress. Duringthe irrigation audit, an average effective rootingdepth for the irrigated area was determined (seeIrrigation Audit, step 6). This information will beused when establishing your irrigation schedule.
WHAT are the water requirements?Water requirements of turf can vary significantly
depending on species and variety, specific use of thegrass and its level of management.
Grass species and even varieties within eachspecies can vary significantly in their water userates. Table 2 gives a general ranking of the wateruse rates for the more common turfgrass species
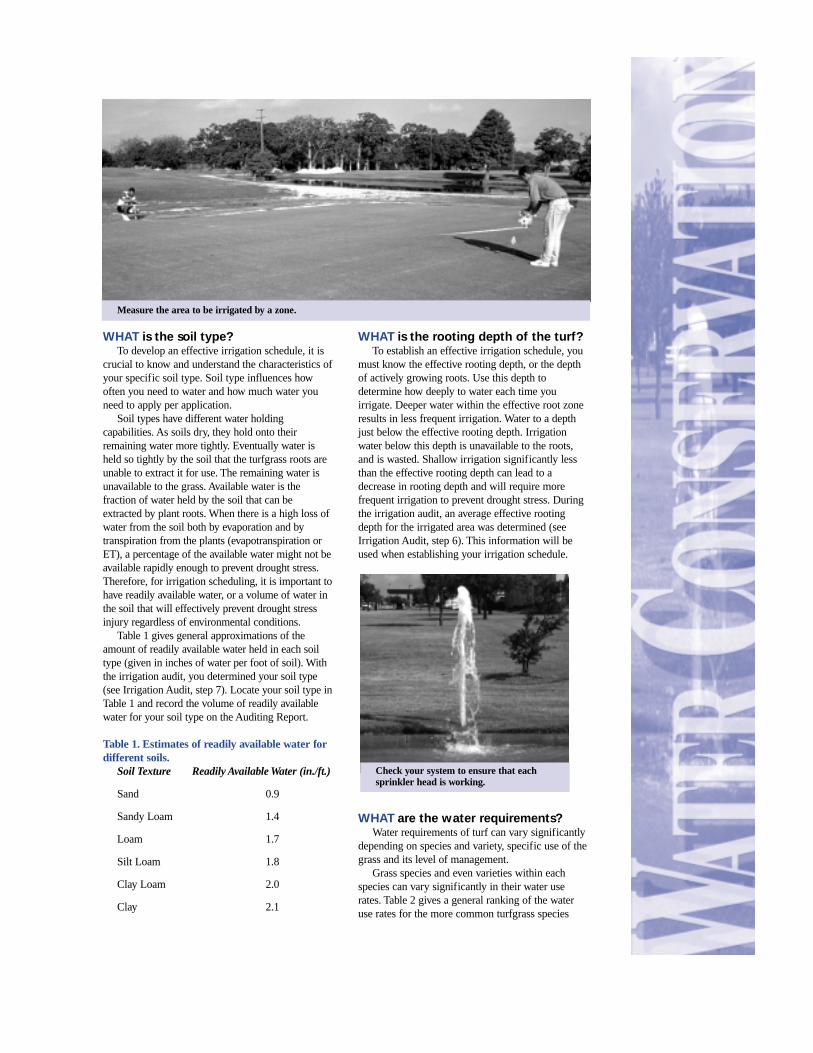
Measure the area to be irrigated by a zone.
Check your system to ensure that each sprinkler head is working.
used on Texas athletic fields. Record on the Auditing Reportwhich ranking your turfgrass species is given. For more specificinformation, contact your county Extension agent.
Table 2. Rankings of turfgrass water use rates by species.Ranking Turfgrass Species
High Perennial Ryegrass, Annual Ryegrass, Poa trivialis, Kentucky Bluegrass
Medium Tall Fescue, Hybrid Bermudagrass
Low Common Bermudagrass,Zoysia japonica
The specific use of the grass determines the level ofmanagement and directly influences the water use rates of turf andits irrigation requirements. An athletic field that receives heavytraffic or is a high priority field will require a high level ofmanagement to maintain an appropriate turfgrass quality. Theintensity of traffic also will affect the level of management. Collegefootball causes more stress and injury to turf than high schoolbaseball, and thus would require a higher level of management.
Fertilization, mowing and management of thatch and soilcompaction are all management practices that influence the waterrequirements of a turfgrass area. Specific use of the field and thefinancial operating budget dictate the frequency at which youperform each of these tasks. A good fertilization program providesall essential nutrients to the turf in the required amounts. Properfertilization helps promote optimum shoot and root development. Adeep root system enables a plant to use water held deep in the soil,significantly reducing the frequency of irrigation.
Fertilization programs that supply excess nutrients, especiallynitrogen, promote shoot growth at the expense of root development.This results in turf with a short, weak root system. Nutrientdeficiencies are equally as bad, increasing a turf’s susceptibility tostresses such as disease, insects, weed invasion and drought.Therefore, practice moderation when developing a fertilizationprogram. Table 3 provides recommended nitrogen rates for mostcommon athletic field turfgrass species used in Texas.
Table 3. Yearly nitrogen fertilizer requirements for commonTexas athletic field turfgrass species.
Grass Species Maintenance Needs(Pounds of N per 1,000 sq. ft. per year)
Tall Fescue 3-6
Common Bermudagrass 4-6
Hybrid Bermudagrass 4-8
Zoysia japonica 3-6
Kentucky Bluegrass 3-6
Perennial Ryegrass 3-6
Annual Ryegrass 2-5
Poa trivialis 2-5
Mowing also affects root and shoot development. Turf that ismaintained at a higher mowing height normally has a deeper, moreextensive root system. However, as the leaf area increases,
transpiration can increase and result in higher water userates. Therefore, moderate mowing heights should beused during high stress periods. Mowing frequencyshould be determined using the “one-third” rule. Nomore than one-third of the leaf area should be removedat any one time. Frequent mowing leads to thicker,denser turf. The higher the density, the lower theevaporative water loss from the soil. Also, denseturfgrass is more competitive against weed invasion.Table 4 gives recommended mowing heights forcommon athletic field turfgrass species.
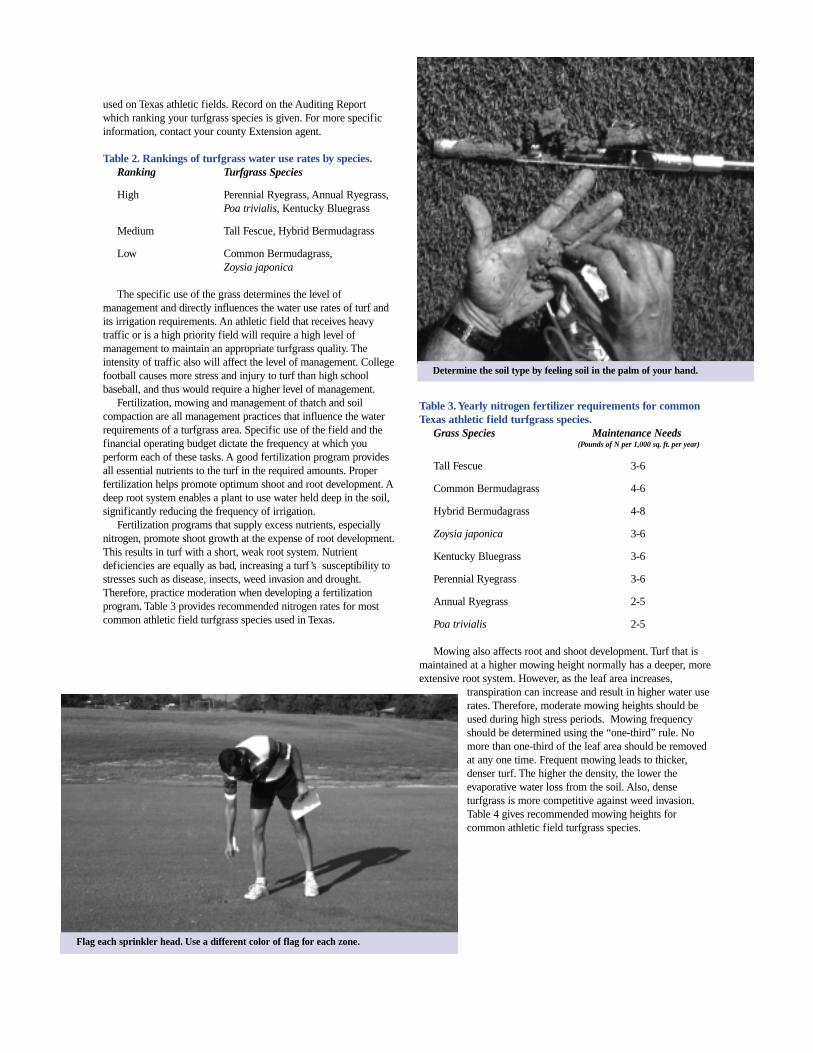
Determine the soil type by feeling soil in the palm of your hand.
Flag each sprinkler head. Use a different color of flag for each zone.
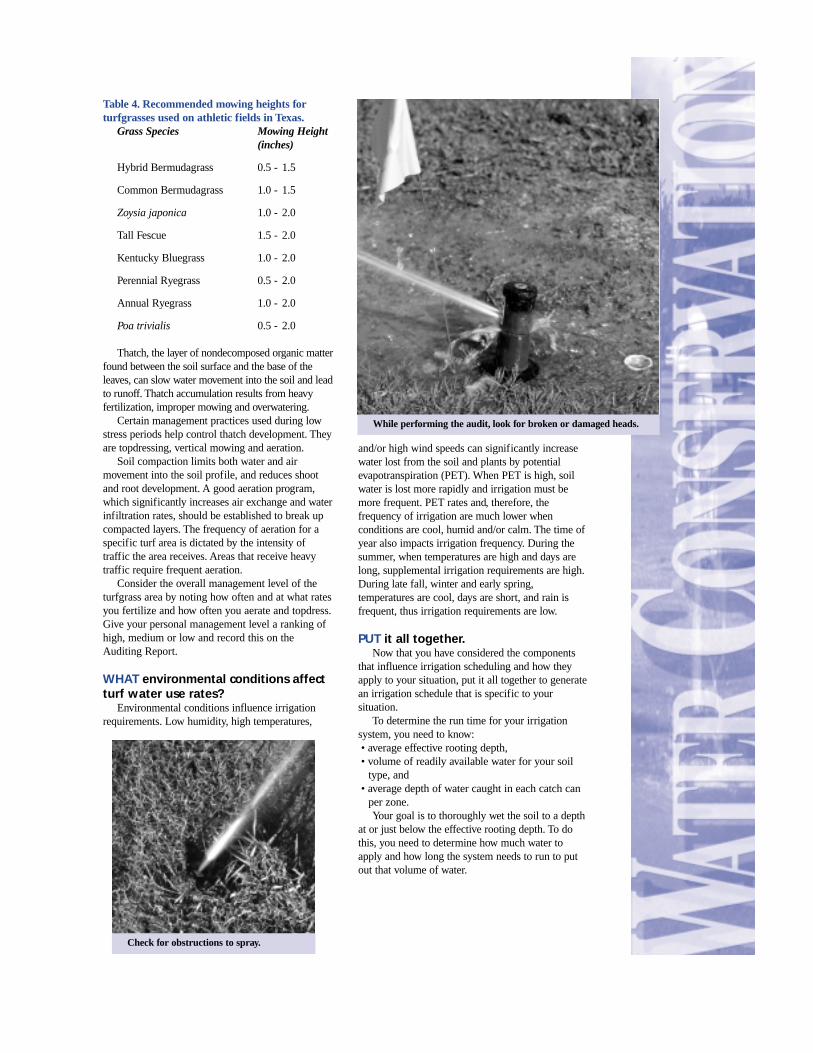
Table 4. Recommended mowing heights forturfgrasses used on athletic fields in Texas.
Grass Species Mowing Height(inches)
Hybrid Bermudagrass 0.5 - 1.5
Common Bermudagrass 1.0 - 1.5
Zoysia japonica 1.0 - 2.0
Tall Fescue 1.5 - 2.0
Kentucky Bluegrass 1.0 - 2.0
Perennial Ryegrass 0.5 - 2.0
Annual Ryegrass 1.0 - 2.0
Poa trivialis 0.5 - 2.0
Thatch, the layer of nondecomposed organic matterfound between the soil surface and the base of theleaves, can slow water movement into the soil and leadto runoff. Thatch accumulation results from heavyfertilization, improper mowing and overwatering.
Certain management practices used during lowstress periods help control thatch development. Theyare topdressing, vertical mowing and aeration.
Soil compaction limits both water and airmovement into the soil profile, and reduces shootand root development. A good aeration program,which significantly increases air exchange and waterinfiltration rates, should be established to break upcompacted layers. The frequency of aeration for aspecific turf area is dictated by the intensity oftraffic the area receives. Areas that receive heavytraffic require frequent aeration.
Consider the overall management level of theturfgrass area by noting how often and at what ratesyou fertilize and how often you aerate and topdress.Give your personal management level a ranking ofhigh, medium or low and record this on theAuditing Report.
WHAT environmental conditions affectturf water use rates?
Environmental conditions influence irrigationrequirements. Low humidity, high temperatures,
and/or high wind speeds can significantly increasewater lost from the soil and plants by potentialevapotranspiration (PET). When PET is high, soilwater is lost more rapidly and irrigation must bemore frequent. PET rates and, therefore, thefrequency of irrigation are much lower whenconditions are cool, humid and/or calm. The time ofyear also impacts irrigation frequency. During thesummer, when temperatures are high and days arelong, supplemental irrigation requirements are high.During late fall, winter and early spring,temperatures are cool, days are short, and rain isfrequent, thus irrigation requirements are low.
PUT it all together.Now that you have considered the components
that influence irrigation scheduling and how theyapply to your situation, put it all together to generatean irrigation schedule that is specific to yoursituation.
To determine the run time for your irrigationsystem, you need to know:• average effective rooting depth, • volume of readily available water for your soil
type, and• average depth of water caught in each catch can
per zone.Your goal is to thoroughly wet the soil to a depth
at or just below the effective rooting depth. To dothis, you need to determine how much water toapply and how long the system needs to run to putout that volume of water.
Check for obstructions to spray.
While performing the audit, look for broken or damaged heads.
Calculating Run Time1. Convert the average effective root depth from inches to feet by
dividing by 12.6 inches � 12 inches per foot = 0.5 foot
2. Multiply that number by the depth of readily available water foryour soil type (given in inches of water per foot of soil). Thisgives the total volume of readily available water for the effectiveroot zone or the total depth of water that must be applied.
0.5 foot x 1.4 inches per foot of sandy loam = 0.7 inches
3. The precipitation rate for zone 1 is the average depth of waterfrom all catch cans in zone 1 divided by the run time. Forexample, if the system runs for 5 minutes with an averagedepth of 0.25 inch, then you have applied 0.25 inch per 5minutes.
4. Convert this number to inches per hour by multiplying thenumber by 60 minutes and then dividing by 5 minutes. Thisgives an average precipitation rate, in inches per hour, for thatparticular zone.
5. To determine the actual irrigation run time for the zone, dividethe total depth of water that must be applied (from step 2) bythe average precipitation rate (inches per hour) (from step 4).This gives the run time in hours for that particular zone.Record this value.
0.7 � 3 = 0.23 hour
6. To convert this value to minutes multiply by 60.0.23 x 60 = 13.9 minutes
7. Repeat for all other zones.
8. Set the controller to run each zone for its specified time. Youmay need to use split applications to prevent runoff.
To determine the irrigation frequency, you need to know: • the depth of readily available water for your soil type;• the ranking of the water use rate of your grass species;• the ranking of your level of management; and• the effects PET has on irrigation frequency.
Your goal is to irrigate as infrequently as possible withoutcausing severe drought stress injury to the turf. This will produce
higher quality turfgrass while saving water and money. To meetthis goal, you must determine how long the water applied duringirrigation will sustain the grass. This will vary significantly withchanging environmental conditions.
There are two methods—visual assessment and PET basedirrigation—to determine irrigation frequency. Both work and are well-accepted methods. Choose the method that best serves your purposes.
Visual Assessment for Irrigation NeedsThis system is very simple but slightly more time intensive
than the PET based method. After watering, do not irrigate againuntil the grass begins to show symptoms of drought stress: grassleaves turning a dull, bluish color; leaf blades rolling or folding; orfootprints that persist for an extended period of time after youwalk across the turf.
When drought stress symptoms develop, irrigate using theappropriate run times and then wait for symptoms to redevelopbefore the next irrigation. This method requires routine checks(daily or more) of the field for signs of drought stress. Whenconditions are hot, dry (not humid), and/or windy, pay closerattention because symptoms will develop more rapidly.
The longer you use this system, the easier it will become. Youwill begin to “get a feel” for how long the field will go betweenirrigations, and what areas will show stress first.
PET Based Irrigation This method allows you to spend less time checking your field,
but does require some math and access to daily PET data. Thepremise behind PET based irrigation scheduling is simple. Afterirrigation, you know how much readily available water is in youreffective root zone. PET is an estimate of the depth of water lostfrom the soil each day. Therefore, you irrigate when the depth ofwater lost by PET equals the depth of readily available water youoriginally applied.
To use this method, you first need to determine a cropcoefficient. To do this, you will use the ranking of water use rateof your grass species (Table 2) and the level of management. UseTable 5 to determine the crop coefficient, then follow the steps todevelop a PET based irrigation program.
Table 5. Estimating crop coefficient based on grass speciesand level of management.
Water use rate Level of Crop of grass species management coefficient
High High 0.90
High Medium 0.85
High Low 0.80
Medium High 0.75
Medium Medium 0.70
Medium Low 0.65
Low High 0.70
Low Medium 0.65
Low Low 0.60
0.25 in. x 60 minutes per hour = 15 inches = 3 inches per hour5 minutes 5 minutes
Place the catch can far enough away from the sprinkler head to avoid obstructing the spray pattern.
Setting up a PET based irrigation program 1. After the soil has been thoroughly watered to the
appropriate depth, start recording daily PET rates.2. Multiply each daily PET value by the crop
coefficient. This new value is called the irrigationindex.
3. The first irrigation index value is the dayfollowing irrigation. Each subsequent day is addedto this value until they total the depth of readilyavailable water (depth of water applied with theprevious irrigation). Then, irrigate. The followingday, start again.
Example:Wednesday Irrigated = 1” appliedThursday PET x Crop coefficient = 0.25”Friday PET x Crop coefficient = 0.20”Saturday PET x Crop coefficient = 0.15”Sunday PET x Crop coefficient = 0.25”Monday PET x Crop coefficient = 0.10”Time to irrigate again = 0.95”
For information on obtaining daily PET data,contact your county Extension agent.
CONSIDER other recommendations.Early morning is considered the best time to
water. Wind speed and temperatures are low, andwater pressure is usually good, which allowsirrigation to be applied uniformly. Watering late inthe evening or at night maintains wet leaves for anextended period of time and significantly increasesthe chance for disease. Midafternoon watering withhigh wind speeds can lead to nonuniformdistribution.
Water movement into some soils, especially thefiner textured clays and loams, can be very slow. If asprinkler head applies water faster than it can movedown into the soil, significant amounts of water canbe lost as runoff. To avoid this problem, usesprinklers with low application rates and/or irrigateto a point just before runoff, and then stop watering.Let the surface dry and then begin watering again.Repeat this process until the desired volume ofwater is applied. Multiple cycle irrigation controllerscan be programmed to do this automatically.
Check water pressure at each sprinkler and record pressure problems.
Measure and record the depth of watercollected in each cup.
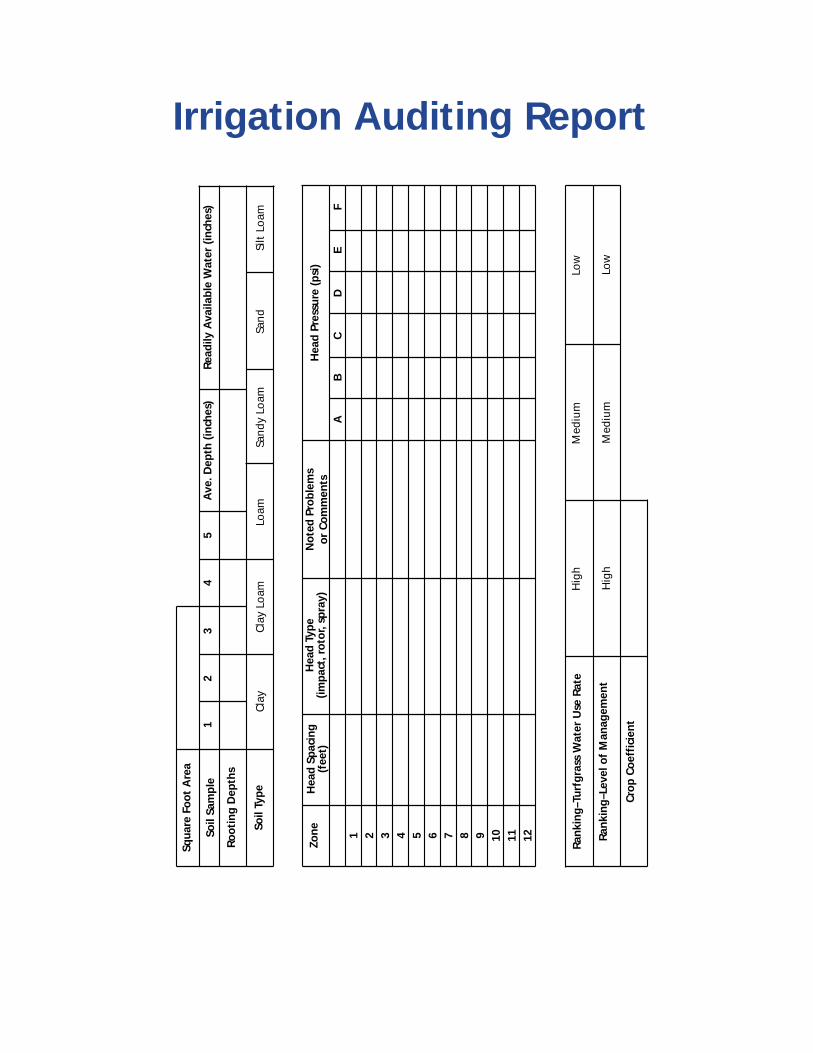
Irrigation Auditing Report
Squa
re F
oot
Are
a
Soil
Sam
ple
Root
ing
Dep
ths
Soil
Type
12
34
5A
ve. D
epth
(in
ches
)Re
adily
Ava
ilabl
e W
ater
(in
ches
)
Clay
Clay
Loa
mLo
amSa
ndy
Loam
Sand
Silt
Loa
m
Zone
Hea
d Sp
acin
g(f
eet)
Hea
d Ty
pe(im
pact
, rot
or, s
pray
)N
oted
Pro
blem
sor
Com
men
tsH
ead
Pres
sure
(ps
i)
AB
CD
EF
1 2 3 4 5 6 7 8 9 10 11 12
Rank
ing–
Turf
gras
s W
ater
Use
Rat
e
Rank
ing–
Leve
l of
Man
agem
ent
Crop
Coe
ffic
ient
Hig
hM
ediu
mLo
w
Hig
hM
ediu
mLo
w
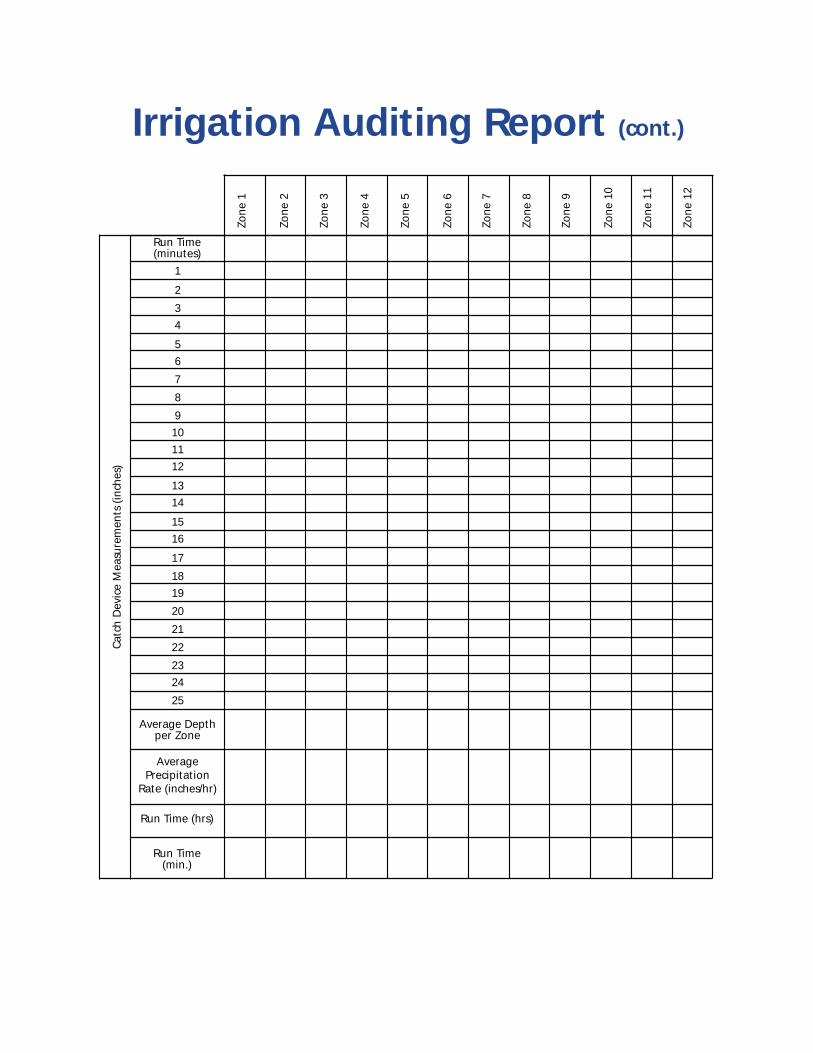
Irrigation Auditing Report (cont.)
Zone
1
Zone
2
Zone
3
Zone
4
Zone
5
Zone
6
Zone
7
Zone
8
Zone
9
Zone
10
Zone
11
Zone
12
Run Time(minutes)
1
2
3
4
5
6
7
8
9
10
11
12
13
14
15
16
17
18
19
20
21
22
23
24
25
Average Depthper Zone
AveragePrecipitation
Rate (inches/hr)
Run Time (hrs)
Run Time(min.)
Catc
h D
evic
e M
easu
rem
ents
(in
ches
)

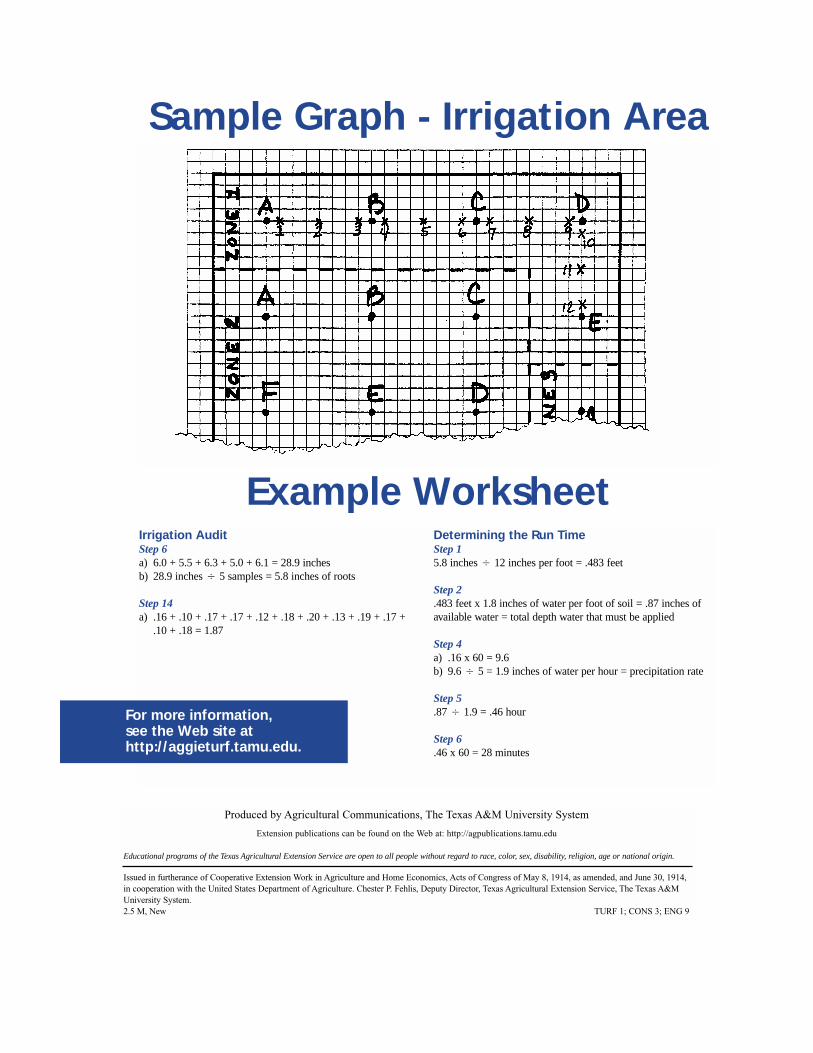
Graph - Irrigation Area
Head-Letter Catch Device-Number
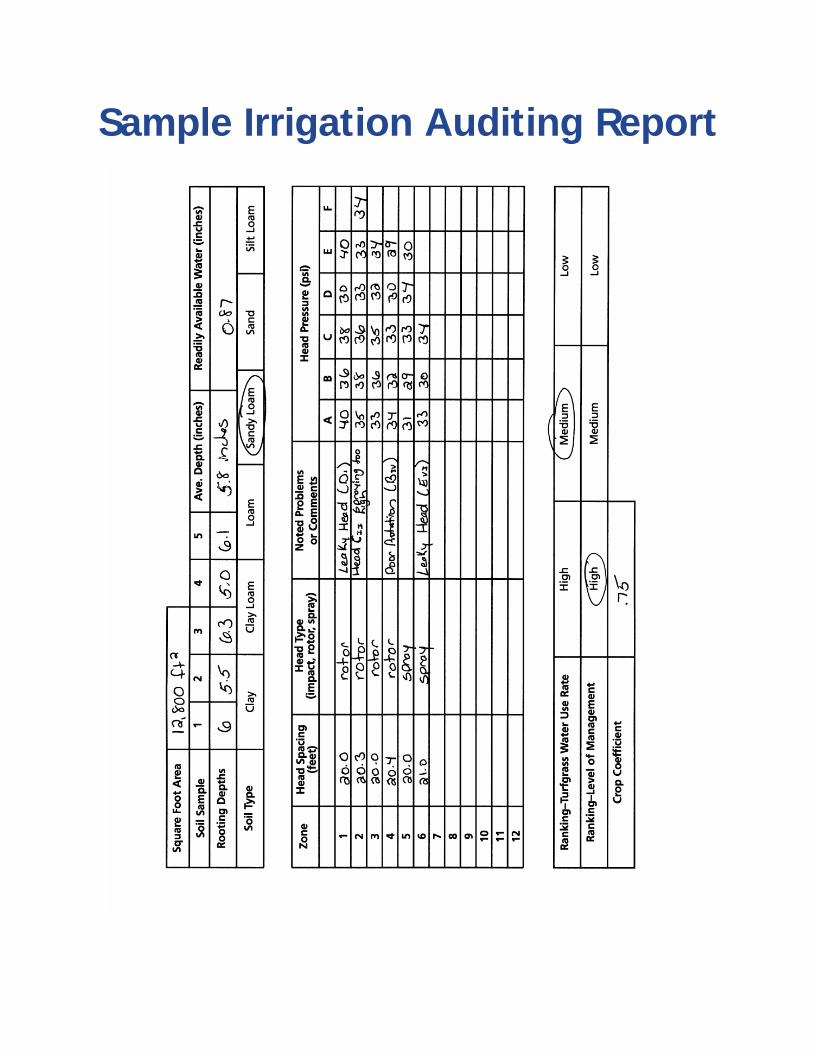
Sample Irrigation Auditing Report
Produced by Agricultural Communications, The Texas A&M University System
Extension publications can be found on the Web at: http://agpublications.tamu.edu
Educational programs of the Texas Agricultural Extension Service are open to all people without regard to race, color, sex, disability, religion, age or national origin.
Issued in furtherance of Cooperative Extension Work in Agriculture and Home Economics, Acts of Congress of May 8, 1914, as amended, and June 30, 1914,in cooperation with the United States Department of Agriculture. Chester P. Fehlis, Deputy Director, Texas Agricultural Extension Service, The Texas A&MUniversity System.2.5 M, New TURF 1; CONS 3; ENG 9
Sample Graph - Irrigation Area
Irrigation AuditStep 6a) 6.0 + 5.5 + 6.3 + 5.0 + 6.1 = 28.9 inchesb) 28.9 inches � 5 samples = 5.8 inches of roots
Step 14a) .16 + .10 + .17 + .17 + .12 + .18 + .20 + .13 + .19 + .17 +
.10 + .18 = 1.87
Determining the Run TimeStep 15.8 inches � 12 inches per foot = .483 feet
Step 2.483 feet x 1.8 inches of water per foot of soil = .87 inches ofavailable water = total depth water that must be applied
Step 4a) .16 x 60 = 9.6b) 9.6 � 5 = 1.9 inches of water per hour = precipitation rate
Step 5.87 � 1.9 = .46 hour
Step 6.46 x 60 = 28 minutes
Example Worksheet
For more information,see the Web site athttp://aggieturf.tamu.edu.