atlantic institute for market studies policy …€¦ · the atlantic institute for market studies...
TRANSCRIPT

1
© 2 0 1 6 A T L A N T I C I N S T I T U T E F O R M A R K E T S T U D I E S
1 3 t h A N N U A L D E M O G R A P H I A I N T E R N A T I O N A L H O U S I N G A F F O R A B I L I T Y S U R V E Y 2 0 1 7
FRONTIER CENTRE FOR PUBLIC POLICY
13th Annual Demographia International Housing Affordability
Survey 2017Rating Middle-Income Housing Affordability
Australia • Canada • China (Hong Kong) • Ireland • Japan • New Zealand Singapore • United Kingdom • United States
With comparisons to External Indexes for China and Malaysia
Introduction by
Oliver HartwichThe New Zealand Initiative
Data for 3rd Quarter 2016 • Co-published in Association with:
Halifax, Nova Scotia,
January 2017
ATLANTIC INSTITUTE FOR MARKET STUDIES
Policy Paper

2
© 2 0 1 6 A T L A N T I C I N S T I T U T E F O R M A R K E T S T U D I E S
1 3 t h A N N U A L D E M O G R A P H I A I N T E R N A T I O N A L H O U S I N G A F F O R A B I L I T Y S U R V E Y 2 0 1 7
The Atlantic Institute for Market Studies (AIMS)AIMS is a Canadian non-profit, non-partisan think tank that provides a distinctive Atlantic Canadian perspective on economic, political, and social issues. The Institute sets the benchmark on public policy by drawing together the most innovative thinking available from some of the world’s foremost experts and applying that thinking to the challenges facing Canadians.AIMS was incorporated as a non-profit corporation under Part II of the Canada Corporations Act and was granted charitable registration by Revenue Canada as of 3 October 1994. It received US charitable recognition under 501(c)(3), effective the same date.
287 Lacewood Drive, Suite 204, Halifax, Nova Scotia, Canada B3M 3Y7Telephone: (902) 429-1143
[email protected] facebook.com/AtlanticInstituteCA @aims_ca
www.AIMS.ca
/company/atlantic-institute-for-market-studies
Board of Directors Chairman: John Risley Former Chairman: John F. Irving President and CEO: Marco Navarro-Génie Vice-Chair: Laura Araneda (New Brunswick) Vice-Chair: Leo Power (Newfoundland and Labrador) Secretary: Fae Shaw Treasurer: Doug Hall Directors: Paul Antle, Lee Bragg, Robert Campbell, Stephen Emmerson, Richard Florizone, Nelson Hagerman, Mary Keith, Dennice Leahey, Scott McCain, Todd McDonald, Jonathan Meretsky, Don Mills, Andrew Oland, Bob Owens, Peter Woodward.
Advisory CouncilGeorge Bishop, Angus Bruneau, George Cooper, Ivan Duvar, Peter Godsoe, James Gogan, Frederick Hyndman, Bernard Imbeault, Phillip Knoll, Colin Latham, Norman Miller, James Moir, Jr.,Gerald L. Pond, Allan C. Shaw, Joseph Shannon.
Board of Research Advisors Advisors: Ian R. Brodie, Charles Colgan, J. Colin Dodds, Morley Gunderson, Doug May, Jim McNiven, Robert Mundell.
The author(s) of this document worked independently, and is solely responsible for the views presented here. The opinions are not necessarily those of the Atlantic Institute for Market Studies, its directors or supporters or of other organizations with which the author(s) may be affiliated. Any errors or omissions remain the responsibility of the author(s).
1700
1.D
1.RA
S.Fr
i.JA
20.1
7

Highlights from Previous Introductions to the
Demographia International Housing Affordability Survey
Senator Bob Day, AO,
Senate of Australia
(#12: 2016)
The distortion in the housing market… resulting from the
supply-demand imbalance is enormous … and affects every other area of a country’s economy. New home owners pay a much higher percentage of their income on house payments than they should.
However, the real culprit … was the refusal of … governments … to provide an adequate and affordable supply of land for new housing stock to meet demand. … the "scarcity" that drove up land prices is wholly contrived - it is a matter of political choice, not geographic reality. It is the product of restrictions imposed through planning regulation and zoning.
Dr. Shlomo Angel, New York University
(#11: 2015)
We all understand what it means to prepare adequate lands
for urban expansion, enough land to accommodate both residences and workplaces, so as to ensure that land—and particularly residential land—remains affordable for all.
Unfortunately, municipalities of many rapidly growing cities often underestimate the amount of land needed to accommodate urban expansion. In the minority of cases where expansion is effectively contained by draconian laws, it typically results in land supply bottlenecks that render housing unaffordable to the great majority of residents.
Alain Bertaud,
New York University
(#10: 2014)
It is time for planners to abandon abstract objectives and to
focus their efforts on two measurable outcomes that have always mattered since the growth of large cities during the 19th century’s industrial revolution: workers’ spatial mobility and housing affordability.
As a city develops, nothing is more important than maintaining mobility and housing affordability. Mobility takes two forms: first, the ability to travel in less than an hour from one part of a city to another; and second, the ability to trade dwellings easily with low transactions costs.
\
Hon. Bill English,
Deputy Prime Minister, New
Zealand (Now Prime Minister)
(#9: 2013)
Housing affordability is complex in the detail – governments
intervene in many ways – but is conceptually simple. It costs too much and takes too long to build a house in New Zealand. Land has been made artificially scarce by regulation that locks up land for development. This regulation has made land supply unresponsive to demand.
13th Annual Demographia International Housing Affordability Survey (2016: 3rd Quarter)

Robert Bruegmann, PhD, University of
Illinois, Chicago
(#8: 2012)
… I think it is fair to say that a growing number of people
who have looked at the figures have tended to agree that a good many well-meaning policies involving housing may be pushing up prices to such an extent that the negative side-effects are more harmful than the problems the policies were intended to correct.
Joel Kotkin, Chapman University
(#7: 2011)
Although usually thought of as “progressive” in the English
speaking world, the addiction to “smart growth” can more readily be seen as socially “regressive”. In contrast to the traditional policies of left of center governments that promoted the expansion of ownership and access to the suburban “dream” for the middle class, today regressive “progressives” actually advocate the closing off of such options for potential homeowners.
Dr. Tony Recsei, Save Our Suburbs,
Sydney
(#6: 2010)
During the 18th century, especially after the industrial
revolution, rural dwellers desperate to make a living streamed into the cities, converting many areas into overcrowded slums. However, as the new economic order began to generate wealth, standards of living improved, allowing an increase in personal living space.
Unless we are vigilant, high-density zealots will do their best to reverse centuries of gains and drive us back towards a Dickensian gloom.
Dr. Shlomo Angel, New York University
(#5: 2009)
For cities to expand outward at their current pace ─ to
accommodate their growing populations or the increased demand for space resulting from higher incomes ─ the supply of land must not be artificially constrained.
The more stringent the restrictions, the less is the housing market able to respond to increased demand, and the more likely house prices are to increase. And when residential land is very difficult to come by, housing becomes unaffordable.
Dr. Donald Brash, Fomer Governor, Reserve Bank of
New Zealand
(#4: 2008)
...the affordability of housing is overwhelmingly a function of
just one thing, the extent to which governments place artificial restrictions on the supply of residential land.
Australia is perhaps the least densely populated major country in the world, but state governments there have contrived to drive land prices in major urban areas to very high levels, with the result that in that country housing in major state capitals has become severely unaffordable...
2007: 3rd Edition 2006: 2nd Edition 2005: 1st Edition
13th Annual Demographia International Housing Affordability Survey (2016: 3rd Quarter)

TABLE OF CONTENTS Introduction: Housing Affordability: A Social Imperative
Oliver Hartwich, Executive Director, The New Zealand Initiative Highlights from Introductions to Previous Editions
Executive Summary 1
1: Rating Middle-Income Housing Affordability 5
1.1: The Median Multiple: Measuring Housing Affordability 7 1.2: Housing Affordability Ratings 7 1.3: The Median Multiple: Historical & International Consistency 8 1.4: Threat to Middle-Income Housing Affordability
2: Housing Affordability in 2016: International Summary 11
2.1: Major Housing Markets 11 2.2: All Housing Markets 15
3: Housing Affordability in 2016: Geographical Summaries 17 3.1: Australia 17 3.2: Canada 19 3.3: China 22 3.4: Ireland 23 3.5: Japan 23 3.6: New Zealand 24 3.7: Singapore 27 3.8: United Kingdom 29 3.9: United States 30
4: Other Housing Affordability Surveys: China & Malaysia 34 4.1: China 35 4.2: Malaysia 35 4.3: Comparisons Between the Surveys 36
5: Best Cities for Middle-Income Households 36
5.1: “Luxury” Livability and Middle-Income Livability 37 5.2: Urban Containment and Severely Unaffordable Housing 38 5.3: Impact on National Economies 39 5.4: Today’s World 40 5.5: People: A Higher Priority than Place 41
Schedule 1: Major Housing Markets Ranked by Affordability 43
13th Annual Demographia International Housing Affordability Survey (2016: 3rd Quarter)

Schedule 2: Major Housing Markets by Geography 46 Schedule 3: All Housing Markets Ranked by Affordability 49 Schedule 4: All Housing Markets Ranked by Geography 58 Annex: Uses, Methods and Sources 68 Biographies 72
FIGURES
1: House Price to Income Ratios 8 2: Urban Containment & Land Values 9
3: Housing Affordability: 2004-2015 13 4: Housing Affordability & Land Regulation 15 5: National Housing Affordability 16 6: Middle-Income Housing Affordability: Australia Capital City Markets 18
7: Middle-Income Housing Affordability: Canada Major Markets 20 8: History: Middle-Income Affordability: Canada Major Markets 21 9: Middle-Income Housing Affordability: New Zealand 3 Largest Markets 25 10: Post Earthquake Housing Consents: Christchurch 26 11: Middle-Income Housing Affordability: United Kingdom Major Markets 30 12: US Net Domestic Migration by Affordability 32 13: California & the United States Compared 33 14: 10 Largest United States Markets 34 15: International Affordability: Major Markets 35 16: Affordability in the Largest Housing Markets 36 17: Toronto & Dallas-Fort Worth 38 18: Kansas City & Economist Top 10 39
TABLES
ES-1: Demographia Housing Affordability Ratings 1 ES-2: Housing Affordability by Nation: Major Housing Markets 3 ES-3: Housing Affordability by Nation: All Housing Markets 3 1: What is Middle-Income Housing Affordability 6 2: Demographia Housing Affordability Ratings 7 3: Land Use Regulation Market Classifications 10 4: Distribution of Markets by Housing Affordability Rating Category 12 5: Housing Affordability by Nation: Major Housing Markets 12
6: Affordable Major Housing Markets 13 7: 10 Least Affordable Major Housing Markets 14 8: Housing Affordability Ratings by Nation: All Housing Markets 16
13th Annual Demographia International Housing Affordability Survey (2016: 3rd Quarter)

9: All Housing Markets: 10 Most Affordable 17 10: All Housing Markets: 10 Least Affordable 17 11: New House Affordability in Singapore 28 12: Affordable Housing Markets: Definition 41 13: Housing Market Selection Criteria 71
Permission granted to quote with attribution.
Permission granted for links to this report http://www.demographia.com/dhi.pdf
Permission granted for links to the websites
http://www.demographia.com/ http://www.performanceurbanplanning.org/
13th Annual Demographia International Housing Affordability Survey (2016: 3rd Quarter)

13th Annual Demographia International Housing Affordability Survey
Rating Middle-Income Housing Affordability (2017 Edition: Data from 3rd Quarter 2016)
By Wendell Cox (Demographia) & Hugh Pavletich (Performance Urban Planning)
EXECUTIVE SUMMARY
he 13th Annual Demographia International Housing Affordability Survey covers 406 metropolitan housing markets (metropolitan areas) in nine countries (Australia, Canada, China, Ireland, Japan, New Zealand, Singapore, the United Kingdom and the United States) for the third
quarter of 2016. A total of 92 major metropolitan markets (housing markets) --- with more than 1,000,000 population --- are included, including five megacities (Tokyo-Yokohama, New York, Osaka-Kobe-Kyoto, Los Angeles, and London). Rating Middle-Income Housing Affordability The Demographia International Housing Affordability Survey rates middle-income housing affordability using the “Median Multiple,” which is the median house price divided by the median household income. The Median Multiple is widely used for evaluating urban markets, and has been recommended by the World Bank and the United Nations and is used by the Joint Center for Housing Studies, Harvard University. The Median Multiple and other price-to-income multiples (housing affordability multiples) are used to compare housing affordability between markets by the Organization for Economic Cooperation and Development, the International Monetary Fund, The Economist, and other organizations. Historically, liberally regulated markets have exhibited median house prices that are three times or less that of median household incomes, for a Median Multiple of 3.0 or less. Demographia uses the following housing affordability ratings (Table ES-1).
Table ES-1 Demographia International Housing Affordability Survey
Housing Affordability Ratings Housing Affordability Rating Median Multiple Affordable 3.0 & Under Moderately Unaffordable 3.1 to 4.0 Seriously Unaffordable 4.1 to 5.0 Severely Unaffordable 5.1 & Over Median multiple: Median house price divided by median household income
T
13th Annual Demographia International Housing Affordability Survey (2016: 3rd Quarter) 1

Housing Affordability in 2016 There are 11 affordable major housing markets, all in the United States. There are 29 severely unaffordable major housing markets, including all in Australia (5), New Zealand (1) and China (1). There are 13 severely unaffordable major markets in the United States, out of 54. Seven of the United Kingdom’s 21 major markets are severely unaffordable and two of Canada’s six. The most affordable major housing markets in 2015 are in the United States, with a moderately unaffordable Median Multiple of 3.9, followed by Japan (4.1), the United Kingdom (4.5), Canada (4.7), Ireland (4.7) and Singapore (4.8). Overall, the major housing markets of Australia (6.6), New Zealand (10.0) and China (18.1) are severely unaffordable.(Table ES-2). There are 11 affordable major housing markets in 2016, all in the United States. Rochester is the most affordable, with a Median Multiple of 2.5, followed by Buffalo (2.6), Cincinnati (2.7), Cleveland (2.7), Pittsburgh (2.7), Oklahoma City (2.9), St. Louis (2.9) and four at 3.0, Detroit, Grand Rapids, Indianapolis and Kansas City. There are 26 severely unaffordable major housing markets in 2016. Again, Hong Kong is the least affordable, with a Median Multiple of 18.1, down from 19.0 last year. Sydney is again second, at 12.2 (the same Median Multiple as last year). Vancouver is third least affordable, at 11.8, where house prices rose the equivalent of a full year’s household income in only a year. Auckland is fourth least affordable, at 10.0 and San Jose has a Median Multiple of 9.6. The least affordable 10 also includes Melbourne (9.5), Honolulu (9.4), Los Angeles (9.3), where house prices rose the equivalent of 14 months in household income in only 12 months. San Francisco has a Median Multiple of 9.2 and Bournemouth & Dorsett is 8.9. San Diego has a Median Multiple of 8.6 and London 8.5, the same as last year. Toronto has a Median Multiple of 7.7, like Vancouver, showing a year-on-year house price increase equal to a year of household income. There are 99 affordable housing markets of all sizes including 82 in the United States, 10 in Canada, 4 in Australia and 3 in Ireland (Table ES-3). The most affordable market is Racine (WI) in the United States, with a Median Multiple of 1.8. There are 94 severely unaffordable markets, with 36 (of 262) in the United States, 33 (of 54) in Australia, 11 (of 33) in the United Kingdom, 7 (of 40) in Canada, 6 (of 8) in New Zealand and the one market in China. Singapore, Japan and Ireland have no severely unaffordable housing markets. The least affordable among the smaller markets is Santa Cruz (CA) in the United States, with a Median Multiple of 11.6.
13th Annual Demographia International Housing Affordability Survey (2016: 3rd Quarter) 2

Table ES-2
Housing Affordability Ratings by Nation: Major Housing Markets (Over 1,000,000 Population)
Nation
Affordable (3.0 &
Under)
Moderately Unaffordable
(3.1-4.0)
Seriously Unaffordable
(4.1-5.0)
Severely Unaffordable (5.1 & Over)
Total
Median Market
Australia 0 0 0 5 5 6.6 Canada 0 1 3 2 6 4.7 China: Hong Kong 0 0 0 1 1 18.1 Ireland 0 0 1 0 1 4.7 Japan 0 1 1 0 2 4.1 New Zealand 0 0 0 1 1 10.0 Singapore 0 0 1 0 1 4.8 United Kingdom 0 2 12 7 21 4.5 United States 11 22 8 13 54 3.9 TOTAL 11 26 26 29 92 4.2
Table ES-3 Housing Affordability Ratings by Nation: All Housing Markets
Nation
Affordable (3.0 &
Under)
Moderately Unaffordable
(3.1-4.0)
Seriously Unaffordable
(4.1-5.0)
Severely Unaffordable (5.1 & Over)
Total
Median Market
Australia 4 3 14 33 54 5.5 Canada 10 13 10 7 40 3.9 China (Hong Kong) 0 0 0 1 1 18.1 Ireland 3 1 1 0 5 3.4 Japan 0 1 1 0 2 4.1 New Zealand 0 0 2 6 8 5.9 Singapore 0 0 1 0 1 4.8 United Kingdom 0 4 18 11 33 4.6 United States 82 94 50 36 262 3.6 TOTAL 99 116 97 94 406 4.0
“Best Cities” for Middle-Income Households Every year, “best cities” and “most livable cities” lists are produced by various organizations. Aimed at the high end of the housing market, these surveys virtually never evaluate housing affordability. Yet, the media often mischaracterizes the findings as relevant to the majority of households. In fact, a city cannot be livable, nor can it be a best city to middle-income households that cannot afford to live there. Households need adequate housing. The “best cities” for housing affordability are often better on middle-income outcomes that the high-end best cities that attract media attention. This is illustrated by a comparison between Dallas-Fort Worth, where housing affordability is far better than in Toronto, which was rated as the “best city” by The Economist. In addition to better housing affordability, traffic congestion is better. This is
13th Annual Demographia International Housing Affordability Survey (2016: 3rd Quarter) 3

despite the fact that Toronto employs the most favored urban strategies, which Dallas-Fort Worth does not. This is not to dispute Toronto’s luxury rating, but it is of little use to the much larger number of middle-income households being priced out of home ownership. Another comparison shows that Kansas City has substantially better housing affordability than all of The Economist’s top 10 cities. Kansas City also is rated as having the best traffic conditions of any metropolitan area with more than 1,000,000 population in the world.
Prime Minister Bill English of New Zealand noted in his introduction to the 9th Annual Demographia International Housing Affordability Survey that “Land has been made artificially scarce by regulation” locking up land for development. “This regulation has made land supply unresponsive to demand” and “translates to higher prices rather than more houses. Excessive housing regulation has been identified as having significantly reduced economic growth in the United States and inequality internationally. It has made the job of central reserve banks more difficult by fueling inflation. Economic uncertainty is a substantial concern for households. It is important to keep housing affordable, so that households can have a better standard of living and poverty rates can be lower. This requires avoiding urban planning policies associated with artificially raising house prices, specifically urban containment. Failing that, housing affordability is likely to worsen further. Paul Cheshire, Max Nathan and Henry Overman of the London School of Economics recently suggested that “… that the ultimate objective of urban policy is to improve outcomes for people rather than places” and that “… improving places is a means to an end, rather than an end in itself.” Following that policy prescription, a number of cities (such as Dallas-Fort Worth, Kansas City and others) have achieved the objective of putting people over place. For most of society, middle-income households as well as lower income households, the best cities are where governments have overseen local housing markets competently, evidenced by housing that is affordable, all else equal. In such cities, the cost of living tends to be lower, as households are able to afford a more affluent life.
13th Annual Demographia International Housing Affordability Survey (2016: 3rd Quarter) 4

Without exception, severely unaffordable markets have severe
land use restrictions (usually "urban containment policies")
13th Annual Demographia International Housing Affordability Survey
(2017 Edition: Data from Third Quarter 2016)
By Wendell Cox (Demographia) & Hugh Pavletich (Performance Urban Planning)
1: RATING MIDDLE-INCOME HOUSING AFFORDABILITY
he 13th Annual Demographia International Housing Affordability Survey measures middle-income housing affordability in 92 major housing markets1 in Australia, Canada, Hong Kong, Ireland, Japan, New Zealand, Singapore, the United Kingdom and the United States (Table
1: What is Middle-Income Housing Affordability?). These include five of the largest metropolitan areas in the high income world, the megacities of Tokyo-Yokohama, New York, Osaka-Kobe-Kyoto, Los Angeles, and London.2 In total, the Annual Demographia International Housing Affordability Survey provides ratings for 406 housing markets located in the same nine geographies, with data from the third quarter (September quarter) of 2016.3 In addition, recent housing affordability results from other sources are summarized for China and Malaysia (Section 4). The Survey provides perhaps the largest collection of housing affordability data at the housing market level in the world. House price data is obtained or estimated from sources that account for the majority of existing dwellings sold in each of the geographies. The data is reported at the housing market level, unmasking significant differences in housing affordability within nations.4 1.1: The Median Multiple: Measuring Housing Affordability The Demographia International Housing Affordability Survey uses the “Median Multiple” (median house price divided by gross annual median household income5) to assess housing affordability. The Median Multiple (a house price to income ratio) is widely
1 Metropolitan areas with more than 1,000,000 population. 2 Metropolitan areas with more than 10 million population. 3 The perspective of the Demographia International Housing Affordability Survey is that domestic public policy should, first and foremost be focused on improving the standard of living and reducing poverty. 4 This is most evident in the United States, where there are many affordable housing markets and many severely unaffordable markets. 5 This is to be contrasted with median "family" income.
T
13th Annual Demographia International Housing Affordability Survey (2016: 3rd Quarter) 5

used for evaluating urban markets, and has been recommended by the World Bank6 and the United Nations and is used by the Joint Center for Housing Studies, Harvard University.7 Similar house price to income ratios (housing affordability multiples) are used to compare housing affordability between markets by the Organization for Economic Cooperation and Development, the International Monetary Fund, international credit rating services, media outlets (such as The Economist8) and others. More elaborate indicators, which often mix housing affordability and mortgage affordability can mask the structural elements of house pricing and are often not well understood outside the financial sector. The mixed indicators provide only a "snapshot," because interest rates can vary over the term of a mortgage; however the price paid for the house does not. The Median Multiple is a reliable, easily understood and essential structural indicator for measuring the health of residential markets and facilitates meaningful and transparent comparisons of housing affordability. Further to this, the Median Multiple provides a solid foundation for the consideration of structural policy options for restoring and maintaining housing affordability in local housing markets.
Table 1 WHAT IS MIDDLE-INCOME HOUSING AFFORDABILITY?
Housing affordability is measured in comparison to household incomes.9 According to the United Nations,10 “If there is a single indicator that conveys the greatest amount of information on the overall performance of housing markets, it is the house price-to-income ratio.” Middle-income housing affordability is different than luxury housing affordability, which is reported upon by a number of organizations (such as such as by Frank Knight, LLC. In the vernacular of this populist era, middle-income housing affordability might be characterized as relating to the 99 percent, rather than the luxury 1 percent of the market. . The Demographia International Housing Affordability Survey, uses a price-to-income ratio, the Median Multiple (Section 1.2) for measuring middle-income housing affordability in housing markets. Housing markets are metropolitan areas (or labor markets), which are the economic (or functional) dimension of cities.11 Housing
6 The Housing Indicators Program, http://siteresources.worldbank.org/INTURBANDEVELOPMENT/Resources/336387-1169578899171/rd-hs7.htm. Also see Shlomo Angel, Housing Policy Matters: A Global Analysis. Oxford University Press, 2000. 7Indicators of Sustainable Development: House Price-to-income Ratio: http://esl.jrc.it/envind/un_meths/UN_ME050.htm. 8 For example, The Economist publishes a housing affordability index for metropolitan areas in China (see Section 4). 9 See, for example, Jason Furman, Barriers to Shared Growth: The Case of Land Use Regulation and Economic Rents, Address to the Urban Institute, November 20, 2016. https://www.whitehouse.gov/sites/default/files/page/files/20151120_barriers_shared_growth_land_use_regulation_and_economic_rents.pdf. 10 Shlomo Angel, Stephen K. Mayo and William L. Stephens, Jr., “The Housing Indicators Program: A Report on Progress and Plans for the Future,” Netherlands Journal of Housing and the Built Environment 8, no. 1 (1993): 13-48. http://sollyangel.com/wp-content/uploads/2013/10/38.-1993-The-Housing-Indicators-Program.pdf. 11 The physical dimension of cities is the built-up urban area, which is surrounded by rural territory (see Demographia World Urban Areas (see: http://demographia.com/db-worldua.pdf). These definitions exclude the administrative unit or “municipality,”
13th Annual Demographia International Housing Affordability Survey (2016: 3rd Quarter) 6

markets are used, rather than neighborhoods or parts of housing markets, because they represent the selection of housing that is locally available to households and from which businesses draw their employees. Housing affordability is evaluated on two levels, between housing markets (such as between Adelaide and Melbourne) and historically within the same housing market (such as Adelaide from 1980 to 2015). Middle-income housing affordability is also evaluated in relation to a housing affordability standard (Section 1.3). Housing affordability between housing markets is an important consideration for households seeking better opportunities and to companies evaluating economic factors in making facility location decisions. For example, in the United States, severely unaffordable housing is strongly associated with net domestic out-migration.12 It has also been an important factor in business location decisions, especially as companies have left California for more affordable housing markets.13 1.2: Housing Affordability Ratings The Demographia International Housing Affordability Survey uses the housing affordability ratings are shown in Table 2.
Table 2 Demographia International Housing Affordability Survey
Housing Affordability Ratings Housing Affordability Rating Median Multiple Affordable 3.0 & Under Moderately Unaffordable 3.1 to 4.0 Seriously Unaffordable 4.1 to 5.0 Severely Unaffordable 5.1 & Over Median multiple: Median house price divided by median household income
1.3: The Median Multiple: Historical & International Consistency Historically, the Median Multiple has been remarkably similar among six surveyed nations, with median house prices from 2.0 to 3.0 times median household incomes (Australia, Canada, Ireland,
which is simply a political construct that may be smaller than the metropolitan area (generally in the West) or larger (such as in China). For further information see: Paul Cheshire, Max Nathan and Henry G. Overman of the London School of Economics in their recent book, Urban Economics and Urban Policy: Challenging Conventional Policy Wisdom 12 For example, since 2000, California’s generally unaffordable housing markets have suffered substantial net domestic migration losses. This is despite their reputations for strong consumer demand. Overall, the state has lost nearly a net 1,900,000 domestic migrants since 2000 (U.S. Census Bureau). 13 A classic case is the relocation of the North American headquarters of Toyota from Los Angeles to Dallas-Fort Worth. The trend of companies exiting California is documented by Joseph Vranich (2016), California Business Departures: An Eight-Year Review 2008 -2015, Spectrum Location Solutions, http://www.spectrumlocationsolutions.com/pdf/Businesses-Leave-California-.pdf
13th Annual Demographia International Housing Affordability Survey (2016: 3rd Quarter) 7

Historically, the Median Multiple has been remarkably similar … with
median house prices from 2.0 to 3.0 times median household incomes.
New Zealand, the United Kingdom and the United States). Housing affordability remained generally within this range until the late 1980s or late 1990s in each of these nations (Figure 1).14 Definitive historical data has not been identified for Hong Kong, Japan and Singapore. The Median Multiple of 3.0 continues to be evident in some markets of the United States, Canada and Ireland.15 1.4: Threat to Middle-Income Housing Affordability Demographia International Housing Affordability Survey focuses on middle-income housing affordability. Middle-income housing affordability is different from low – income affordable housing,16 which often relies on public subsidies. Even so, low-income housing costs and the demand for social housing are generally driven up by the failure to maintain middle-income housing affordability. In recent decades, house prices have escalated far above household incomes in many parts of the world. The Demographia International Housing Affordability Survey has been published for 13 years to highlight this trend and its consequences. Available data shows that house costs have generally risen at a rate similar to that of household incomes until comparatively recently. This is consistent with cost trends among other basic necessities, such as personal transport, food and clothing, which in some cases have even declined.
14 Anthony Richards, Some Observations on the Cost of Housing in Australia, Address to 2008 Economic and Social Outlook Conference The Melbourne Institute, 27 March 2008 http://www.rba.gov.au/speeches/2008/sp-so-270308.html. This research included all nations covered in the Demographia International Housing Affordability Survey except for Ireland. The Richards research is also illustrated in the of the National Housing Council of Australia, http://www.fahcsia.gov.au/sa/housing/pubs/housing/national_housing_supply/Documents/default.htm (Figure 1.1). 15 A value below 2.0 is affordable, but may indicate depressed economic conditions. 16 Including social housing.
13th Annual Demographia International Housing Affordability Survey (2016: 3rd Quarter) 8

However, in many housing markets, house prices have skyrocketed compared to household incomes. The most severe house price increases have been limited to housing markets where urban containment policy (or its equivalent) have been implemented. Generally, urban containment policy draws a development limit around the urban area and seriously limits or even prohibits greenfield development of housing tracts on the urban fringe. Consistent with the basics of economics, this is associated with higher land prices and, in consequence higher house prices (Figure 2).17 Virtually across the road land value gaps of ten or more times result.18 This destroys the competitive market for land by removing the “supply vent”19 necessary to maintain housing affordability (Table 3).
As Deputy Prime Minister (now Prime Minister) Bill English of New Zealand noted in his introduction to the 9th Annual Demographia International Housing Affordability Survey:
Housing affordability is complex in the detail – governments intervene in many ways – but is conceptually simple. It costs too much and takes too long to build a house in New Zealand. Land has been made artificially scarce by regulation that locks up land for development. This regulation has made land supply unresponsive to demand. When demand shocks occur, as they did in the mid-2000s in New Zealand and around the world, much of that shock translates to higher prices rather than more houses. It simply takes too long to make new land available for development.20
17 These house price increases are often exacerbated by excessively high development impact fees on new homes. 18 See: Wendell Cox. "A Question of Values: Middle-Income Housing Affordability and Urban Containment Policy." Frontier Centre for Public Policy, October 2015. https://www.fcpp.org/a_question_of_values. 19 See Table 3. 20 From the Introduction to the 9th Annual Demographia International Housing Affordability Survey.
1
3
5
Land
Valu
e
Distance from City Center
Urban Containment & Land ValuesVERSUS LIBERAL REGULATION (NO URBAN CONTAINMENT)
Adapted from Lincoln Institute of Land Use Policy Figure 2
City Center Exurbs
13th Annual Demographia International Housing Affordability Survey (2016: 3rd Quarter) 9

…it may be surprising that governments have not given
housing affordability a higher priority.
There are serious consequences for residents. The higher house prices reduce discretionary incomes, which reduces potential standards of living and raises relative poverty rates.21 This is a particular concern, because housing is the largest household expenditure in virtually all housing markets. Further, there has been substantial domestic migration away from the more costly housing markets. This is particularly true in the United States.22 In view of the importance of housing affordability to achievement and maintenance of a strong middle-class, it may be surprising that governments have not given it a higher priority. Indeed, as is shown by the data in this Survey, in many housing markets, governments have implemented public policies that do the opposite --- by severely reducing housing affordability. There has been no shortage of rhetorical concern, but serious initiatives have been absent. There are notable exceptions, such as Singapore’s half-century institutional initiative to keep housing affordable (Section 3.7) and the recent New Zealand government initiatives (Section 3.6). However, there has been little serious attention to the problem of severely unaffordable housing elsewhere, as governments have stood idly by as house prices doubled and tripled relative to incomes. In effect, governments implementing urban containment policy choose pursuit of a particular urban form at the expense of a better standard of living and less poverty. There has been a price. The declining financial situations of middle-income households, partly due to housing affordability losses, has contributed to the rise of populist political movements, 23 as people express their disaffection at more intense economic uncertainty.
Table 3 LAND USE REGULATION CLASSIFICATIONS
The Demographia International Housing Affordability Survey uses the following land use regulation classifications: Liberal Land Use Policy (Less Restrictive Markets) applies in markets not classified as having more restrictive land use regulation (where competitive land markets are permitted to operate on the urban fringe). In these markets, residential development is allowed to occur based upon consumer preferences, subject to basic environmental regulation.24 Generally, liberal land use regulation is “demand-driven” Land is allowed to be developed, except in limited areas, such as parks and environmentally sensitive areas. By allowing development on the urban fringe, liberal land use regulation allows the "supply vent" to operate, which keeps house prices affordable. Less restrictive regulation can also be called traditional or liberal regulation. In addition to lower housing costs relative to incomes, the lower population densities typical of liberal markets are associated with less intense traffic congestion and shorter average work trip journey times.
21 Poverty rates that are adjusted for the cost of living (unlike, for example the official poverty rate in the United States, which is based on a single schedule of incomes, without regard to geographical cost of living differences). 22 Peter Ganong and Daniel Shoag, “Why Has Regional Income Convergence in the U.S. Declined?” HKS Working Paper No. RWP12-028. 23 Among the geographies covered in the Survey, the most obvious examples have been the Brexit referendum in the United Kingdom and the 2016 United States presidential election. 24 Liberal land use policy may vary widely, from the near deregulation in some areas of Texas to the "light-handed" zoning regulations operating throughout much of the rest of the United States.
13th Annual Demographia International Housing Affordability Survey (2016: 3rd Quarter) 10

Liberal land use regulation has also been called “traditional” regulation. More Restrictive Land Use Regulation uses urban containment policy or other mechanisms (such as comprehensive plans or development limits) to such an extent that the competitive market for land is not permitted to operate on the urban fringe. More restrictive land use regulation seeks to outlaw the liberal regulation that produced middle-income housing affordability. Urban containment strategies25 are the most important of more restrictive land use regulation. Generally, urban containment regulation is “plan-driven,” as planning departments and governments determine where new housing is allowed to be built. There is a "negative presumption," with new development generally prohibited, except in limited areas where it is permitted by government plans. Typically, urban containment policies include urban containment boundaries and related variations (such as urban growth boundaries, green belts, urban service districts, “growth areas” and other strategies that substantially reduce the amount of land available for house building. Urban containment policy may also be characterized by terms such as "densification policy," “compact development”, “urban consolidation”, “growth management” “and "smart growth.” By severely limiting or even prohibiting development on the urban fringe, urban containment eliminates the "supply vent" of urban fringe development, by not allowing the supply of housing to keep up with demand, except at prices elevated well above historic norms. Urban containment policies are often accompanied by costly development impact fee regimes that disproportionately charge the cost of the necessary infrastructure for growth on new house buyers. There is particular concern about the cost increasing impacts of these fees and levies, especially in Australia, Canada (Canada Mortgage and Housing Corporation), New Zealand (New Zealand Productivity Commission) and California. Classification of Major Markets: The classification of major markets (metropolitan areas with more than 1,000,000 population) is described in the Annex and in Figure 4. 2: HOUSING AFFORDABILITY IN 2016: INTERNATIONAL SUMMARY
he 13th Annual Demographia International Housing Affordability Survey provides housing affordability ratings on 92 major housing markets (over 1,000,000 population) and an overall total of 406 markets. Markets in 9 nations are rated.
2.1: Major Housing Markets There was a reduction in the number of affordable major housing markets from 13 to 11 in 2016. At the same time, the number of severely unaffordable major housing markets rose from 26 to 29 (Table 4). Sacramento became severely unaffordable, with a Median Multiple of 5.1. Severely unaffordable Honolulu (9.4), was reclassified to major market status,26 having been severely unaffordable in all 13 editions of the Demographia International Housing Affordability Survey. Bournemouth & Dorset (8.9) and Warrington & Cheshire (5.1) were also added by reclassification. Bournemouth & Dorset has been severely unaffordable in previous Surveys. Among the seven cities rated by the UBS Global Real Estate Bubble Index with the most intense “bubble risk,” all five that are also rated in the Demographia International Housing Affordability Survey have severely unaffordable housing. This includes Vancouver, London, Sydney, Hong Kong and San
25 The term "urban containment" is used throughout the Survey to denote more restrictive land use regulation, because this particular strategy is most associated with huge housing affordability losses. 26 Honolulu is projected to have reached 1,000,000 population in 2016.
T
13th Annual Demographia International Housing Affordability Survey (2016: 3rd Quarter) 11
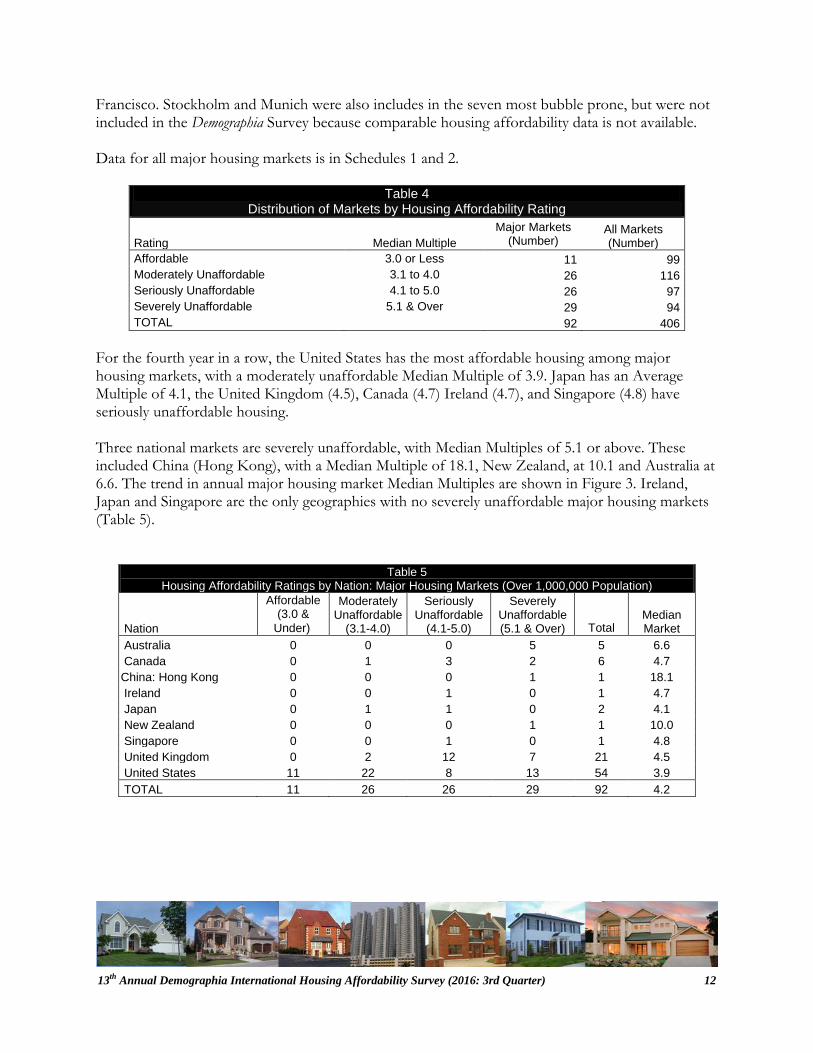
Francisco. Stockholm and Munich were also includes in the seven most bubble prone, but were not included in the Demographia Survey because comparable housing affordability data is not available. Data for all major housing markets is in Schedules 1 and 2.
Table 4 Distribution of Markets by Housing Affordability Rating
Rating Median Multiple Major Markets
(Number) All Markets (Number)
Affordable 3.0 or Less 11 99 Moderately Unaffordable 3.1 to 4.0 26 116 Seriously Unaffordable 4.1 to 5.0 26 97 Severely Unaffordable 5.1 & Over 29 94 TOTAL 92 406
For the fourth year in a row, the United States has the most affordable housing among major housing markets, with a moderately unaffordable Median Multiple of 3.9. Japan has an Average Multiple of 4.1, the United Kingdom (4.5), Canada (4.7) Ireland (4.7), and Singapore (4.8) have seriously unaffordable housing. Three national markets are severely unaffordable, with Median Multiples of 5.1 or above. These included China (Hong Kong), with a Median Multiple of 18.1, New Zealand, at 10.1 and Australia at 6.6. The trend in annual major housing market Median Multiples are shown in Figure 3. Ireland, Japan and Singapore are the only geographies with no severely unaffordable major housing markets (Table 5).
Table 5 Housing Affordability Ratings by Nation: Major Housing Markets (Over 1,000,000 Population)
Nation
Affordable (3.0 &
Under)
Moderately Unaffordable
(3.1-4.0)
Seriously Unaffordable
(4.1-5.0)
Severely Unaffordable (5.1 & Over)
Total
Median Market
Australia 0 0 0 5 5 6.6 Canada 0 1 3 2 6 4.7 China: Hong Kong 0 0 0 1 1 18.1 Ireland 0 0 1 0 1 4.7 Japan 0 1 1 0 2 4.1 New Zealand 0 0 0 1 1 10.0 Singapore 0 0 1 0 1 4.8 United Kingdom 0 2 12 7 21 4.5 United States 11 22 8 13 54 3.9 TOTAL 11 26 26 29 92 4.2
13th Annual Demographia International Housing Affordability Survey (2016: 3rd Quarter) 12

Most Affordable Major Housing Markets: The 11 affordable major housing markets are all in the United States (Table 6). Rochester is the most affordable, with a Median Multiple of 2.5, while Buffalo ranks second with a Median Multiple of 2.6. There is a three-way tie for third most affordable between Cincinnati, Cleveland and Pittsburgh, with Median Multiples of 2.7. Oklahoma City and St. Louis have Median Multiples of 2.9. Four major housing markets have affordable Median Multiples of 3.0, Detroit, Grand Rapids, Indianapolis and Kansas City. The affordable markets are generally characterized by more liberal land use regulation, which is associated with greater housing affordability.
Table 6
Affordable Major Housing Markets Affordability Rank (Out of
92) Nation Housing market Median Multiple 1 U.S. Rochester, NY 2.5 2 U.S. Buffalo, NY 2.6 3 U.S. Cincinnati, OH-KY-IN 2.7 3 U.S. Cleveland, OH 2.7 3 U.S. Pittsburgh, PA 2.7 6 U.S. Oklahoma City, OK 2.9 6 U.S. Saint Louis, MO-IL 2.9 8 U.S. Detroit, MI 3.0 8 U.S. Grand Rapids, MI 3.0 8 U.S. Indianapolis, IN 3.0 8 U.S. Kansas City, MO-KS 3.0
0
3
6
9
12
15
18
2004 2006 2008 2010 2012 2014 2016
Med
ian
Mul
tiple
: Med
ian
Mar
ket
AustraliaCanadaChina (Hong Kong)IrelandJapanNew ZealandSingaporeUnited KingdomUnited States
Housing Affordability: 2004-2016MAJOR MARKETS (OVER 1,000,000 POPULATION)
Figure 3
13th Annual Demographia International Housing Affordability Survey (2016: 3rd Quarter) 13

Vancouver and Toronto house prices increased the equivalent of annual
household incomes over the last year.
Los Angeles house prices increased the equivalent of 14 months annual
household incomes over the last year.
Least Affordable Major Housing Markets: The severely unaffordable major markets include all in Australia (5), New Zealand (1) and China (1). Two of Canada’s six markets are severely unaffordable. Seven of the 21 major markets in the United Kingdom are severely unaffordable, and 13 of the 54 markets in the United States. The 10 least affordable major housing markets are shown in Table 7. Hong Kong has least affordable housing, with a Median Multiple of 18.1, an improvement from last year’s worst ever recorded 19.0. Hong Kong has had the worst housing affordability in for all of the seven years it has been included in the Demographia International Housing Affordability Survey. Sydney is again the second least affordable market, repeating is 12.2 Median Multiple from last year. Vancouver remains the third least affordable major housing market, with a Median Multiple of 11.8, adding a full year’s household income to its house prices in a single year (from a Median Multiple of 10.8 last year). Auckland has the fourth worst housing affordability, with a Median Multiple of 10.0. The bottom 10 in major market housing affordability is rounded out by San Jose (9.6), Melbourne (9.5), Honolulu (9.4), Los Angeles (9.3), San Francisco (9.2) and Bournemouth and Dorset (8.9). The most significant deterioration among these is in Los Angeles, where the Median Multiple rose to 9.3 in 2016 from 8.1 last year, equaling more than 14 months of median household income.
Table 7 10 Least Affordable Major Housing Markets
Rank: Least
Affordable
Affordability Rank (Out of
92) Nation Housing market Median Multiple
1 92 China Hong Kong 18.1 2 91 Australia Sydney, NSW 12.2 3 90 Canada Vancouver, BC 11.8 4 89 N.Z. Auckland 10.0 5 88 U.S. San Jose, CA 9.6 6 87 Australia Melbourne, VIC 9.5 7 86 U.S. Honolulu, HI 9.4 8 85 U.S. Los Angeles, CA 9.3 9 84 U.S. San Francisco, CA 9.2 10 83 U.K. Bournemouth & Dorset 8.9
As in the past, each of the severely unaffordable major markets are characterized by urban containment policy or variations (Table 1, above and Figure 4).
13th Annual Demographia International Housing Affordability Survey (2016: 3rd Quarter) 14

2.2: All Housing Markets Among the 406 markets, Ireland has the most affordable housing with a national Median Multiple of 3.4 (moderately unaffordable). The United States is second (3.5), followed by Canada (3.9). Japan (4.1), the United Kingdom (4.6) and Singapore (4.8) are all rated seriously unaffordable. The least affordable markets are China (Hong Kong), at 18.1, Australia (5.5) and New Zealand (5.7), both severely unaffordable (Figure 5 and Table 8). Among all markets, 99 are affordable (Median Multiple of 3.0 or less). There are 116 moderately unaffordable markets (Median Multiple of 3.1 to 4.0) and 97 seriously unaffordable markets (Median Multiple of 4.1 to 5.0). A total of 94 markets are severely unaffordable, with a Median Multiple of 5.1 or higher. All 406 housing markets are ranked by housing affordability in Schedules 3 and 4. The 100 affordable markets (having a Median Multiple of 3.0 or below) are in Australia27 (4), Ireland (3), Canada (10) and the United States (83). There are no affordable markets in China (Hong Kong), Japan, New Zealand, Singapore or the United Kingdom. Due to an 11 way tie for 5th most affordable, the top 10 includes 14 entries. Twelve of these are in the United States, with Racine, WI (1.8), Bay City, MI (1.9), Decatur, IL (2.0) and Elmira, NY (2.0) being the most affordable. Canada has one entry in the top ten, Moncton, NB (2.1) as does Australia with Karratha (2.1), which with nine other housing markets are ranked fifth most affordable (Table 9).
27 See caution, Section 3.1.
0 3 6 9 12 15 18ClevelandPittsburgh
St. LouisDetroit
Kansas CityAtlanta
Minneapolis-STPOsaka-K-K
HoustonPhiladelphia
Baltimore, MDDallas-FTW
ChicagoSan Antonio
LeedsCharlotte
Tampa-STPPhoenix
Washington (DC)Orlando
Las VegasManchester
TokyoMontreal
Birmingham (UK)Singapore
SacramentoDenverBoston
PortlandSeattle
Riverside-SBNew York
MiamiBrisbane
London ExurbsToronto
London (GLA)San Diego
San FranciscoLos Angeles
MelbourneVancouver
SydneyHong Kong
Less Restrictive Land Use Regulation (Generally Liberal)
More Restrictive Land Use Regulation (Generally Urban Containment)
Housing Affordability & Land Regulation2+ MILLION METROPOLITAN AREAS: 2016
Figure 4MEDIAN MULTIPLE
13th Annual Demographia International Housing Affordability Survey (2016: 3rd Quarter) 15

Table 8
Housing Affordability Ratings by Nation: All Markets
Nation
Affordable (3.0 &
Under)
Moderately Unaffordable
(3.1-4.0)
Seriously Unaffordable
(4.1-5.0)
Severely Unaffordable (5.1 & Over)
Total
Median Market
Australia 4 3 14 33 54 5.5 Canada 10 13 10 7 40 3.9 China (Hong Kong) 0 0 0 1 1 18.1 Ireland 3 1 1 0 5 3.4 Japan 0 1 1 0 2 4.1 New Zealand 0 0 2 6 8 5.9 Singapore 0 0 1 0 1 4.8 United Kingdom 0 4 18 11 33 4.6 United States 82 94 50 36 262 3.6 TOTAL 99 116 97 94 406 4.0
Among the 94 severely unaffordable markets, 33 are in Australia, 36 in the United States, 11 in the United Kingdom, seven in both Canada and six in New Zealand. There is one severely unaffordable market in China (Hong Kong). Outside the major housing markets, the least affordable are Santa Cruz, CA, (Table 9) and Santa Barbara (CA), both in the United States. Santa Cruz has the worst housing affordability in the history of the Survey outside Hong Kong, Sydney and Vancouver. Wingcaribbee, NSW (9.8) and Tweed Heads (9.7) in Australia also among the 10 least affordable housing markets (Table 10).
0
3
6
9
12
15
18
Australia Canada HK Ireland Japan NZ Singapore UK US
Med
ian
Mul
tiple
National Housing Affordability: 2016ALL 406 MARKETS
Median MultipleMedian House PriceDivided by MedianHousehold Income
Figure 5
13th Annual Demographia International Housing Affordability Survey (2016: 3rd Quarter) 16

Table 9 All Housing Markets: 10 Most Affordable
Affordability Rank (Out of
406) Nation Housing market Median Multiple 1 U.S. Racine, WI 1.8 2 U.S. Bay City, MI 1.9 3 U.S. Decatur, IL 2.0 3 U.S. Elmira, NY 2.0 5 U.S. East Stroudsburg, PA 2.1 5 Australia Karratha, WA 2.1 5 U.S. Lima, OH 2.1 5 Canada Moncton, NB 2.1 5 U.S. Peoria, IL 2.1 5 U.S. Rockford, IL 2.1 5 U.S. Scranton-Wilkes Barre, PA 2.1 5 U.S. Springfield, OH 2.1 5 U.S. Terre Haute, IN 2.1 5 U.S. Youngstown, OH-PA 2.1
Table 10
All Housing Markets: 10 Least Affordable Rank: Least
Affordable
Affordability Rank (Out of
367) Nation Metropolitan Market Median Multiple
1 406 China Hong Kong 18.1 2 405 Australia Sydney, NSW 12.2 3 404 Canada Vancouver, BC 11.8 4 403 U.S. Santa Cruz, CA 11.6 5 402 U.S. Santa Barbara, CA 11.3 6 401 N.Z. Auckland 10.0 7 400 Australia Wingcaribbee, NSW 9.8 8 399 Australia Tweed Heads, NSW 9.7 9 398 U.S. San Jose, CA 9.6
10 397 Australia Melbourne, VIC 9.5
3: HOUSING AFFORDABILITY IN 2016: GEOGRAPHICAL SUMMARIES
he housing affordability situation is summarized by geography below for both major housing markets and all markets. The housing affordability data for each housing market is provided in Schedules 1 through 4.
3.1 Australia Again, as in each of the 13 annual Demographia International Housing Affordability Surveys all of Australia's five major housing markets are severely unaffordable (Figure 6)28 The overall major housing market Median Multiple is 6.6.
28 House price data for Australia is estimated or obtained from multiple sources, such as the Real Estate Industry Association of Queensland (Queensland Market Monitor), the Real Estate Institute of Victoria, the Real Estate Institute of South Australia, the Real Estate Institute of Western Australia, Australian Property Monitors, the Real Estate Institute of Australia and various real estate internet web sites. House price data for some smaller markets is year to date data.
T
13th Annual Demographia International Housing Affordability Survey (2016: 3rd Quarter) 17

Overall, Australia’s 54 housing markets have a severely unaffordable Median Multiple of 5.5. Four housing markets are affordable (see caution below), three are moderately unaffordable, 14 are seriously unaffordable and 33 are severely unaffordable. Major Markets: Sydney is again Australia’s least affordable market, with a Median Multiple of 12.2, the same as last year, and ranks second worst overall, trailing Hong Kong. Consistent with the experience in other overly expensive housing markets, Sydney is experiencing substantial domestic out-migration.29 In 2004 (the first Survey), Sydney’s Median Multiple is7.6, and has risen 60 percent since then. Sydney’s 12.2 Median Multiple (in the last two years) represents the poorest housing affordability ever recorded by the Survey outside Hong Kong. The UBS Global Real Estate Bubble Index rates Sydney as having the world’s fourth worst housing bubble risk. Melbourne has a Median Multiple of 9.5 and is the fifth least affordable major housing market. Only Hong Kong, Sydney, Vancouver, Auckland and San Jose are less affordable than Melbourne. Adelaide has a severely unaffordable 6.6 Median Multiple and is the 16th least affordable of the 92 major markets. Brisbane has a Median Multiple is 6.2 and is ranked 18th least affordable, while Perth, with a Median Multiple of 6.1 is the 20th least affordable major housing market. Other Housing Markets: Four smaller housing markets are affordable in Australia, including Karratha, WA (2.1), Port Hedland, WA (2.3), Kalgoorie, WA (2.6) and Gladstone, QLD (2.8). Each of these markets is heavily dependent upon resource extraction, which includes industries that have experienced a severe downturn in recent years. House prices have fallen substantially, however the
29 Wendell Cox. "A Question of Values: Middle-Income Housing Affordability and Urban Containment Policy." Frontier Centre for Public Policy, October 2015. https://www.fcpp.org/a_question_of_values.
0
3
6
9
12
15
1981 1986 1991 1996 2001 2006 2011 2016
Med
ian
Mul
tiple
SydneyMelbourneBrisbaneAdelaidePerthHobartCanberra
Figure 6
Middle-Income Housing AffordabilityAUSTRALIA: CAPITAL CITY HOUSING MARKETS: 1981-2016
13th Annual Demographia International Housing Affordability Survey (2016: 3rd Quarter) 18

As in all previous Surveys, all of Australia's five
major housing markets are severely unaffordable.
broader geographic income data may not sufficiently account for apparent downward trends. As a result, the Median Multiples in these markets could be could be higher. As a result, caution is suggested in interpreting these results. Outside of the major markets, 28 in Australia are rated severely unaffordable. The least affordable of these are Wingcaribbee, NSW (9.8), Tweed Head, NSW (9.7), Gold Coast, QLD (9.0) and Sunshine Coast, QLD (9.0).30 Historical Context: Australia’s generally unfavorable housing affordability is in significant contrast to the broad affordability that existed before implementation of urban containment (urban consolidation) policies. As is indicated in Figure 1, the price-to-income ratio in Australia was below 3.0 in the late 1980s. All of Australia’s major housing markets have severely unaffordable housing and all have urban containment policy. 3.2: Canada The health of the housing market has been deteriorating rapidly in Canada. Both international and national organizations have expressed concern about the damage that rising prices (some suggest a “housing bubble”) could do to the national economy.31 Among major markets, Canada has a seriously unaffordable Median Multiple of 4.7. There are no affordable major markets, one major markets is rated as moderately unaffordable, three are rated seriously unaffordable and two are rated severely unaffordable. The Median multiple for all housing markets in Canada is 3.9. Canada’s overall housing affordability trails only that of Ireland and the United States. Among the 40 markets in Canada, 10 are affordable, 13 are moderately unaffordable, 10 are seriously unaffordable and seven are severely unaffordable.32 Major Housing Markets: As in all of the previous Surveys, Vancouver is rated as having the worst housing affordability in Canada. Vancouver is rated severely unaffordable, with a Median Multiple of 11.8. Vancouver has also experienced modest net domestic out-migration. Toronto also has a severely unaffordable housing market, with the Median Multiple deteriorating to 7.7 in 2016, adding an equivalent of a year’s income to last year’s 6.7. Consistent with other high cost housing markets, Toronto has had substantial domestic outmigration. Montréal has seriously
30 Previously reported as Bowral-Mittagong. 31 See, for example, Organisation for Economic Co-operation and Development, “OECD Economic Surveys Canada,” June 2014. http://www.oecd.org/eco/surveys/Overview%20_CANADA_2014.pdf. International Monetary Fund, “2014 Article IV Consultation – Staff Report; Staff Statement; and Press Release,” IMF Country Report No. 15/22, January 2015. https://www.imf.org/external/pubs/ft/scr/2015/cr1522.pdf, Bank of Canada, “Financial System Review – December 2015.” http://www.bankofcanada.ca/2015/12/fsr-december-2015/. 32 Median house prices are estimated or obtained from the Canada Mortgage and Housing Corporation, national, provincial and metropolitan real estate associations and the Statistics Canada National Household Survey data.
13th Annual Demographia International Housing Affordability Survey (2016: 3rd Quarter) 19

Over 13 years, Toronto’s house prices have nearly
doubled compared to household incomes.
unaffordable housing (4.8), and has also experienced substantial net domestic out-migration.33 Calgary (4.6) and Edmonton (4.1) are also seriously unaffordable. Canada’s most affordable major market is Ottawa-Gatineau (3.9), which is rated as moderately unaffordable (Figure 7). Recently the federal government Canada Mortgage and Housing Corporation (CMHC) issued a “red warning” on the Toronto and Vancouver housing markets. CMHC noted that the rapidly rising house prices were speading from Toronto and Vancouver to nearby markets. This is confirmed by the data in this Survey, in severely unaffordable Hamilton and Oshawa as well as seriously unaffordable Barrie Brantford, Guelph, Kitchener and Peterborough. The Vancouver “ripple effect” is evident in severely unaffordable Victoria and the Fraser Valley. According to CMHC the red warnings are due to “strong evidence of problematic conditions for Canada overall. Home prices have risen ahead of economic fundamentals such as personal disposable income and population growth, resulting in overvaluation in many Canadian housing markets.” Indeed, house prices have been rising well above the economic fundamentals in Canada for at least a decade. Vancouver had already developed a severely unaffordable housing market in the first Survey (2004), which has been associated with its urban containment policy, adopted about five decades ago. Vancouver has experienced the greatest housing affordability deterioration among major markets in the Demographia Annual International Housing Affordability Survey, with its Median Multiple more than doubling, from 5.4 to 11.8. The UBS Global Real Estate Bubble Index rates Vancouver as having the world’s worst housing bubble risk.
33 Domestic migration data is summarized in Cox, A Question of Values.
0
3
6
9
12
2004 2006 2008 2010 2012 2014 2016
Med
ian
Mul
tiple
TorontoMontrealVancouverOttawaCalgaryEdmonton
Figure 7
Middle-Income Housing AffordabilityCANADA: MAJOR HOUSING MARKETS: 2004-2016
9
13th Annual Demographia International Housing Affordability Survey (2016: 3rd Quarter) 20

For the fifth year in a row, Moncton (NB) was the most
affordable market in Canada.
Vancouver’s rapid escalation in house prices has stalled since August, after the imposition by the British Columbia government of a foreign buyers tax. The most demanded market segment, detached houses, dropped 17 percent in average value in the first month, but recovered two-thirds of the loss in the following four months. Overall, the Real Estate Board of Greater Vancouver (REBGV) benchmark price has dropped about three percent since July. Even so, REBGV’s benchmark price was up 17 percent in 2016, up 48 percent over the past three years and up 84 percent over the past 10 years,34 far outstripping income growth. Toronto’s housing affordability deterioration has been much more recent. In 2004, Toronto had a moderately unaffordable Median Multiple of 3.9. By 2016, it nearly doubled to a severely unaffordable 7.7. In the years of the Demographia International Housing Affordability Survey, only Vancouver has experienced a greater Median Multiple percentage increase. In Toronto, the housing affordability loss has been associated with the middle-2000s adoption of urban containment policy (“Places to Grow”), which a Survey co-author predicted would lead to much worsened housing affordability.35 At the same time, other major markets in Canada are experiencing worsening housing affordability, such as Montréal, Calgary and Edmonton, which are seriously unaffordable and Ottawa-Gatineau, which is moderately unaffordable. Other Housing Markets: For the fifth year in a row, Moncton (NB) is the most affordable market in Canada. Moncton, with a Median Multiple of 2.1, is followed by Fredericton (NB), with an affordable Median Multiple of 2.2. The other affordable markets are Charlottetown (PEI), Moose
34 Data derived from Real Estate Board of Greater Vancouver data. 35 Wendell Cox (2004), Myths about Urban Growth and the Toronto Greenbelt, Fraser Institute.
0
3
6
9
12
1970 2004-2005 2016
Med
ian
Mul
tiple
TorontoMontrealVancouverOttawaCalgaryEdmonton
Figure 8
Middle-Income Affordability HistoryCANADA: MAJOR HOUSING MARKETS: 1970-2016
13th Annual Demographia International Housing Affordability Survey (2016: 3rd Quarter) 21

Hong Kong, had the least affordable housing for the
7th straight year, with a Median Multiple of 18.1.
Jaw (SK), Saguenay (QC) Saint John (NB), Sudbury (ON), Thunder Bay (ON), Trois-Rivières (QC) and Windsor (ON). The least affordable smaller housing markets are in British Columbia. This includes Victoria (8.1), the Fraser Valley (7.1), and Kelowna (6.4). Markets nearby Toronto are also severely uaffordable, including Hamilton (5.7) and Oshawa (5.1). Historical Context A 2016 Frontier Centre for Public Policy research report reviewed the strongly rising house prices relative to incomes in 35 markets across the nation.36 This represents a “sea change” from the decades of relatively stable housing affordability across Canada. From the early 1970s to their first inclusion in the Survey, there was virtually no housing affordability deterioration in the major markets, with the exception of Vancouver. The rapidly escalating prices of houses has been associated with wider adoption of urban containment policies. (Figures 8). 3.3: China Hong Kong is China's only market in the Demographia International Housing Affordability Survey. Hong Kong has the least affordable housing for the seventh straight year, with a Median Multiple of 18.1.37 This is an improvement from 2015, when Hong Kong had the least affordable Median Multiple ever recorded in the Survey (19.0). This improvement is a positive development. However, much greater improvement in housing affordability is needed. In 2010, Hong Kong’s Median Multiple was 11.4. Hong Kong’s Median Multiple of 18.1 represents a substantial deterioration in its housing affordability, The UBS Global Real Estate Bubble Index rates Hong Kong as having the world’s sixth worst housing bubble risk. Historical Context: Hong Kong's housing affordability was far better in the early 2000's. According to The Chinese University of Hong Kong's' Quality of Life Index the house price-to-income ratio rose approximately 275 percent between 2002 and 2014.38 Academic research has indicated that Hong Kong’s house prices have been driven considerably higher by restrictive land-use regulation.39
36 Wendell Cox and Ailin He (2016), Canada’s Middle-Income Housing Affordability Crisis, Frontier Centre for Public Policy, https://fcpp.org/wp-content/uploads/2016/06/Cox-He-Middle-Income-Housing-Crisis.pdf. 37 Estimated from Hong Kong Residential Units Consideration Range and Hong Kong Private Domestic Price Index. 38 Average house price divided by median income. 39 C. M. Hui & F. K. Wong (n.d.), "Dynamic Impact of Land Supply on Population Mobility with Evidence from Hong Kong," http://www.prres.net/Papers/Hui_Dynamic_impact_of_land_supply_on_population_mobility.pdf.
13th Annual Demographia International Housing Affordability Survey (2016: 3rd Quarter) 22

Tokyo-Yokohama and Osaka-Kobe-Kyoto have the most
favorable housing affordability of any megacities (over 10
million residents)
Dublin could be headed toward severe
unaffordability
3.4: Ireland For the fourth straight year, Ireland is the most affordable geography in the Survey, with a Median Multiple of 3.4, an affordable rating. Major Housing Market: Housing affordability continued to decline in Ireland’s only major metropolitan area market, Dublin, where the Median Multiple reached a seriously unaffordable 4.7 in 2016,up from 3.3 in 2011. Dublin could be headed toward the severe unaffordability reached during the housing bust in 2008.40 University College economist Colm McCarthy continues to warn that house prices are rising far too rapidly in the Dublin area. He suggests that a new housing “bubble” could be developing despite the market cooling policies of the Central Bank. Other Housing Markets: Galway (3.4) and Cork (3.5) are moderately unaffordable, while Waterford (2.6) and Limerick (2.3) are rated affordable. Historical Context: As is indicated in Figure 1, Ireland had a price-to-income multiple of less than 3.0 in the early 1990s. 3.5: Japan The Average Multiple (average house price divided by average household income) is used for the markets in Japan.41 Japan has a seriously unaffordable major market Median Multiple of 4.1 in 2016. Major Housing Markets: Data is available for only two of Japan's two major housing markets, Tokyo-Yokohama and Osaka-Kobe-Kyoto. Tokyo-Yokohama is the world's largest urban area (38 million).42 The metropolitan area covers all or part of four prefectures, Tokyo,43 as well as largely suburban Kanagawa, Saitama and Chiba. Osaka-Kobe-Kyoto ranks as the 14th largest urban area in the world (17 million) and the third largest housing market covered in the Demographia International Housing Affordability Survey (After
40 Median house prices calculated from the Residential Property Price Register of the Property Services Regulatory Authority. 41 Data for calculating Median Multiples is not available. The Average Multiple is generally comparable to the Median Multiple in the United States and Canada (see the 10th Annual Demographia Housing Affordability Survey). 42 Demographia World Urban Areas, http://demographia.com/db-worldua.pdf. 43 Tokyo prefecture is called the Tokyo metropolis, which can be misleading, because the prefecture has only one-third of the metropolitan area population. The failure to understand this distinction has resulted in invalid demographic analyses, not only popular but also academic. The 23 wards of the former city of Tokyo are within the prefecture of Tokyo and comprise approximately 70 percent of its population.
13th Annual Demographia International Housing Affordability Survey (2016: 3rd Quarter) 23

Auckland has been severely unaffordable in all 13 Demographia
Surveys
Tokyo and New York). Osaka-Kobe-Kyoto covers all or part of Osaka, Hyogo, Kyoto and Nara prefectures.44 Osaka-Kobe-Kyoto is the most affordable megacity (over 10 million population) in the Survey, with an Average Multiple of 3.4, earning a moderately unaffordable rating. Tokyo-Yokohama is the second most affordable megacity in the Survey, with a seriously unaffordable Average Multiple of 4.7. Historical Context: Historical price-to-income multiple data has not been identified for Japan. 3.6: New Zealand Overall, housing in New Zealand is rated as severely unaffordable, with a Median Multiple of 5.9. Major Housing Market: Auckland, New Zealand’s only major housing market has a severely unaffordable 10.0 Median Multiple. Housing affordability has deteriorated from a Median Multiple of 5.9 in the first Survey (2004). Auckland45 is the fourth least affordable among the 92 major housing markets, following only Hong Kong, Sydney and Vancouver and has been severely unaffordable in all 13 Demographia International Housing Affordability Surveys.46 Other Housing Markets: Christchurch has severe unaffordability, with a Median Multiple of 5.9, while Wellington is also severely unaffordable, at 5.7. Housing Affordability and the National Policy Agenda: Outside Singapore, New Zealand is the only nation in the Survey with a serious public policy priority to restore and maintain middle-income housing affordability. In New Zealand, as in Australia, housing had been rated as affordable until approximately a quarter century ago. However, across the nation, urban containment policies were adopted, and consistent with the international experience, housing became severely unaffordable in all three of New Zealand’s largest housing markets, Auckland, Christchurch and Wellington (Figure 9). Meanwhile, public opinion placed the issue of housing affordability near the top of the policy agenda. A new National Party government was elected in 2008 and committed itself to address the housing affordability crisis. The government set out a program to establish special housing areas to improve middle income housing affordability. There have been proposals to produce more efficient infrastructure for supporting the new housing. A Productivity Commission of New Zealand analysis was undertaken, preparatory to possible land use reforms. The Commission found that land use authorities have a responsibility to provide
44 See Demographia World Urban Areas: 2016, http://demographia.com/db-worldua.pdf. 45 The city of Auckland governs virtually the entire metropolitan area (housing market area or labor market area). Auckland and Honolulu are unique among cities in governing virtually all of their metropolitan areas with more than 1,000,000 population. 46 Median house prices are from the Real Estate Institute of New Zealand.
13th Annual Demographia International Housing Affordability Survey (2016: 3rd Quarter) 24

“capacity to house a growing population while delivering a choice of quality, affordable dwellings of the type demanded ….”47 Consistent with that finding, the Productivity Commission proposed a measure that would automatically expand the supply of greenfield land when housing affordability targets are not met. The Commission said, “Where large discontinuities emerge between the price of land that can be developed for housing and land that cannot be developed, this is indicative of the inadequacy of development capacity being supplied within the city.” The Productivity Commission expansion of greenfield land for development where the difference between land prices on either side of an urban containment boundary become too great.48 At the same time, the consensus for improving housing affordability has spread to opposition parties. The principal opposition, the Labour Party has developed a strong position on housing affordability. Coming from different sides of the political spectrum, the Labour Party’s Shadow Minister of Housing, Phil Twyford and the New Zealand Initiative’s Oliver Hartwich co-authored a New Zealand Herald commentary concluding that “Our own research leaves no doubt that planning rules are a root cause of the housing crisis, particularly in Auckland…” Local Government Leadership: Meanwhile, local government officials have been taking steps to improve housing affordability themselves.
47 Productivity Commission of New Zealand, “Using Land for Housing.” 48 The Productivity Commission did not propose a standard.
0
3
6
9
12
2004 2006 2008 2010 2012 2014 2016
Med
ian
Mul
tiple
AucklandChristchurchWellington
Figure 9
Middle-Income Housing AffordabilityNEW ZEALAND: 3 LARGEST HOUSING MARKETS: 2004-16
9
13th Annual Demographia International Housing Affordability Survey (2016: 3rd Quarter) 25

Outside Singapore, New Zealand is the only nation in the Survey with a public
policy priority to restore middle-income housing
affordability.
Auckland: In Auckland, the Chief Economist of the Auckland City Council recommended adoption of an objective to reduce the price-to-income ratio by approximately 50 per cent between 2015 and 2030. This would require various strategies, such as expanding greenfield land supply and allowing higher population densities in inner areas.49 (London School of Economics and Political Science economists Paul C. Cheshire, Max Nathan and Harry G. Overman have made a similar recommendation.)50 Christchurch: Suburban local governments have played an important role following the devastating 2011 earthquakes that devastated Christchurch, destroying many homes and making more uninhabitable. The resulting housing shortage needed to be eliminated quickly. Otherwise Christchurch, which was already severely unaffordable, could experience a substantial worsening in its housing affordability. Remarkably, the housing shortage was remedied within three years, and housing affordability did not deteriorate. Much of the credit goes to suburban districts51 (counties) of Selwyn and Waimakariri, which quickly authorized new middle-income housing construction. These small and independently governed local governments ramped up residential building consents to a rate more than five times that of New Zealand as a whole. Selwyn and Waimakariri accounted for approximately one half of the new housing in the Christchurch area between 2012 and 2014, despite having little more than one-fifth of the
49 Wendell Cox, “Auckland Tackles Housing Affordability Crisis,” newgeography.com, February 11, 2015. http://www.newgeography.com/content/005086-auckland-tackles-housing-affordability-crisis. 50 Cheshire, Nathan and Overman, Urban Economics and Urban Policy. 51 The term “suburban” in this context refers to its broad definition as used in much of the world, areas outside the urban core, as opposed to “neighborhood,” without respect to location in the urban area as it is often used in New Zealand and Australia.
3.2 3.44.9
10.111.5
14.7
22.7 23.2
19.017.0
0
5
10
15
20
25
2012 2013 2014 2015 2016
Cons
ents
per
1,0
00 P
opul
atio
n
Christchurch city (core)
Selwyn & Waimakariri (Suburban)
Post-Earthquake Housing ConsentsCHRISTCHURCH AREA
Derived from Statistics New Zealand Figure 10
13th Annual Demographia International Housing Affordability Survey (2016: 3rd Quarter) 26

Singapore’s unique success … appears to result from its long-
standing public commitment to keeping
house prices under control
population. Even after the housing lost during the earthquakes was replaced, the suburban districts continued a torrid pace of approvals through 2016, as the Christchurch city build rate has increased (Figure 10).52 Most new suburban housing has been the family-oriented single-family dwellings most demanded by New Zealanders 2016. The decentralized nature of governance in the Christchurch area aided these quick and important additions to the housing stock.53 Historical Context: As indicated in Figure 1, New Zealand’s price-to-income ratio was below 3.0 in the early 1990s. Since that time urban containment policy has been widely adopted. At the same time, house prices have skyrocketed compared to incomes. 3.7: Singapore The Median Multiple in Singapore is 4.8, for a seriously unaffordable rating. This is an improvement from the 5.1 Median Multiple in 2013, when Singapore was added to the report. Singapore has perhaps the most land constrained geography of any major metropolitan area in the world, occupying a highly developed island, with no mainland periphery within its national jurisdiction. As a result, there is virtually no potential for greenfield development and it is difficult to maintain a competitive supply of land.54 These unique circumstances led the Singapore government to establish a publicly sponsored housing construction program, which sells houses to consumers. The result of this public program is a vibrant private housing market. According to the Housing and Development Board (HDB), which administers the program, 83 percent of residents live in HDB housing.55 Further, Singapore has an overall 88 percent rate of home ownership, the highest of any country in the Survey. Buyers are free to sell their own houses as in other nations with private ownership. Further, there are restrictions on foreign ownership, which may have shielded Singapore from the heightened cost escalation occurring from globalization of the real estate markets in an environment of significant land supply restrictions (such as urban containment policy). HDB has materially increased the rate of construction, and the additional supply appears to have produced the expected result, better housing affordability. Moreover, housing affordability for new houses appears to be better (Table 11: New Houses in Singapore: Affordability).56
52 Calculated from Statistics New Zealand data. 53 The two suburban districts have had strong employment growth. In Selwyn, employment grew at seven times the national rate from 2005 to 2015 and in Waimakariri employment growth was more than four times the national rate (calculated from Ministry of Business & Innovation data). 54 Faced with a similar situation, treaties between Switzerland, France and Germany effectively create international metropolitan areas (labor markets) by the use of cross border commuting permits in the Basel and Geneva areas. 55 Housing Development Board, Key Statistics for FY 2015/2016, http://www10.hdb.gov.sg/eBook/AR2016/key-statistics.html. 56 Median house price is from the Singapore Real Estate Exchange (resale houses).
13th Annual Demographia International Housing Affordability Survey (2016: 3rd Quarter) 27

Singapore has been far more successful in controlling housing affordability than in markets that have followed the British urban containment model, which can be largely traced to the Town and Country Planning Act of 1947. Thus, Singapore has a highly regulated housing market, but has not had its affordability deteriorate to the acute levels of severe unaffordability reached in other highly regulated markets, such as Hong Kong, Vancouver, Auckland, San Francisco, Sydney, Melbourne, Auckland and London. Singapore’s rare success of regulation appears to result from the unique public commitment to keeping house prices under control. Singapore’s unique success relative to similar markets appears to result from its long-standing public commitment to keeping house prices under control. HDB has a government imposed mandate to ensure housing affordability: As HDB transitioned from a program principally aimed at rented social housing to one of home ownership, the 1964 HDB Annual Report, stated its intention to
...encourage a property-owning democracy in Singapore and to enable Singapore citizens in the lower middle income group to own their own homes57
In the intervening years, Singapore has succeeded in this objective. The contrast is great between the present situation and that of 50 years ago, when there were large squatter settlements.
Table 11 NEW HOUSE AFFORDABILITY IN SINGAPORE
In recent years, the Housing and Development Board has taken additional actions to improve housing affordability. One strategy has been to increase what are effectively “across the board” subsidies for all new houses (not counting special grants, such as for first home buyers). The result has been to reduce new house prices to levels well below those of existing houses. There is not a overall median price index for new HDB homes. However, data by type of unit from the Housing and Development Board Annual Report suggests that the Median Multiple for new houses is better than for existing houses.58 Should the present policy continue, it is likely that resale house prices will rise slower or even fall in the future, improving Singapore’s housing affordability. At the same time, price-reducing grants are available to eligible resale house buyers. As in other nations, the Survey does not account for these grants in measuring housing affordability. However, it is noted that the practice in Singapore may be substantially greater than in other nations, which would seem to have a positive influence on housing affordability. HDB indicates that if new houses and the various government incentives were included, Singapore’s Median Multiple would have been 4.4 last year, rather than the reported 5.0.59 Historical Context: Historical price-to-income multiple data has not been identified for Singapore.
57 Housing and Development Board 1964 Annual Report. http://www.globalurban.org/GUDMag07Vol3Iss1/Yuen.htm. 58 Estimated from data in Housing and Development Board, Key Statistics: 2014-2015. 59 Correspondence from the Housing Development Board to Demographia, November 21, 2016.
13th Annual Demographia International Housing Affordability Survey (2016: 3rd Quarter) 28

… the need to “…unblock supply and build more housing.”
(Financial Times)
3.8: United Kingdom The United Kingdom has a seriously unaffordable major market Median Multiple of 4.5 in 2016 and a severely unaffordable Median Multiple of 4.6 overall.60 Major Housing Markets: None of the United Kingdom’s 21 major housing markets is affordable. Two major markets are moderately unaffordable, 12 are seriously unaffordable and seven are severely unaffordable. The U.K.’s largest market, London (the Greater London Authority, inside the London greenbelt) has a severely unaffordable Median Multiple of 8.5. The UBS Global Real Estate Bubble Index rates London as having the world’s second worst housing bubble risk. Further, London has experienced substantial domestic out-migration, as its high house prices appear to be repelling population growth.61 Six other major markets are severely unaffordable, including Bournemouth & Dorset, at 8.9, Plymouth & Devon, at 7.1 and the London Exurbs (East and Southeast England, virtually all outside the London greenbelt) at 7.1, Bristol-Bath (6.2) as well as Liverpool & Merseyside (5.1) and Warrington & Cheshire (5.1). The most affordable major markets are rated as moderately unaffordable major markets, including Leeds & West Yorkshire, with a Median Multiple of 3.8, and Glasgow has a Median Multiple of 4.0. Other Housing Markets:. Outside the major housing markets, the most affordable are Falkirk (3.6) and Belfast (4.0), both rated moderately unaffordable. There are four severely unaffordable markets, including Swindon & Wiltshire (6.9), Telford & Shropshire (5.8), Warwickshire (5.6), and Northampton & Northamptonshire (5.1). Historical Context: Various analyses have documented the association between UK's urban containment policies and its excessively high house prices. For example, the Blair government commissioned reports by Kate Barker (2004 and 2006), and then a member of the Monetary Policy Committee of the Bank of England, which attributed much of the nation’s housing affordability loss to its urban containment policies (which have evolved from the Town and Country Planning Act of 1947). Sir Peter Hall, et al, expressed concerns about the housing affordability losses associated with urban containment in the early 1970s.62
60 Median house prices are calculated from the Land Registry of England and Wales, the Registers of Scotland and Northern Ireland Residential Property Price Index. 61 Cox, A Question of Values. 62 Hall, Peter Geoffrey, Ray Thomas, Harry Gracey and Roy Drewett. The Containment of Urban England: The Planning System: Objectives Operations, Impacts. Vol. 2 Allen and Unwin [for] PEP, 1973.
13th Annual Demographia International Housing Affordability Survey (2016: 3rd Quarter) 29

A report by the International Monetary Fund63 indicated the need to alleviate supply-side constraints, “notably pertaining to planning restrictions…”
In an article entitled "Britain's Self Perpetuating Property Racket," Financial Times Chief Financial Commentator Martin Wolf notes that “The restrictions on land availability are man-made.” A Financial Times editorial reiterated the need to “unblock supply and build more housing.” Recently, Paul C. Cheshire, Max Nathan and Henry G. Overman, all economists at the London School of Economics and Political Science published Urban Economics and Urban Policy: Challenging Conventional Policy Wisdom, which makes an urgent case for reversing the causes of lost housing affordability under urban containment policy (Section 4).64
As Figure 1 indicates, the price-to-income ratio was below 3.0 until after 2000 in the United Kingdom. The Town and Country Planning Act (1947) contained the first important urban containment restrictions and has been a model for such restrictions around the world. Land use restrictions were substantially strengthened during the 1990s and early 2000s. All markets have urban containment policy. The severely unaffordable housing in Liverpool-Merseyside and other northern housing markets are examples of how that urban containment policy produces severe or seriously unaffordability housing affordability even in metropolitan areas have experienced weak economies (Figure 11). 3.9: United States The United States has a moderately unaffordable Median Multiple of 3.9 in its major markets. This is the most favorable major market housing affordability in this year’s Survey. There are 11 affordable
63 International Monetary Fund, Country Report: United Kingdom: Selected Issues, http://www.imf.org/external/pubs/ft/scr/2015/cr14234.pdf, 2015. 64 Paul Cheshire, Max Nathan and Henry Overman. Urban Economics and Urban Policy.
0 2 4 6 8 10
Leeds & West YorkshireGlasgow
Blackpool & LancashireDerby & Derbyshire
Middlesborough & DurhamHull & Humber
Newcastle & TynesideNottingham & Nottinghamshire
Sheffield & South YorkshireEdinburgh
Manchester & Greater ManchesterBirmingham & West MidlandsStoke on Trent & Staffordshire
Leicester & LeicestershireLiverpool & MerseysideWarrington & Cheshire
Bristol-BathLondon Exurbs (E & SE England)
Plymouth & DevonLondon (GLA)
Bournemouth & Dorset
Median Multiple
London RegionNorth & MidlandsSouthwestScotland
Figure 11
Middle-Income Housing Affordability: 2016UNITED KINGDOM: MAJOR HOUSING MARKETS
13th Annual Demographia International Housing Affordability Survey (2016: 3rd Quarter) 30

The five markets with the poorest affordability are in California and Hawaii
major housing markets in the United States, 22 that are moderately unaffordable, eight that are seriously unaffordable and 13 that are severely unaffordable. Overall, the United States has a moderately unaffordable Median Multiple of 3.6, 65 the second most favorable after Ireland. Among all housing markets, 83 are rated affordable, 111 are rated moderately unaffordable, 56 are rated seriously unaffordable and 36 are rated severely unaffordable Major Housing Markets: The most affordable major housing market is Rochester, with a Median Multiple of 2.5, followed by Buffalo (2.6). Cincinnati, Cleveland and Pittsburgh each have Median Multiple of 2.7. St. Louis and Oklahoma City have a Median Multiple of 2.9. Three more major housing markets are affordable, including Indianapolis, Grand Rapids, Detroit and Kansas City, with a Median Multiple of 3.0. The five housing markets with the poorest housing affordability are in California and Hawaii. San Francisco Bay Area housing market San Jose is the least affordable, with a severely unaffordable Median Multiple of 9.8. Honolulu is the second least affordable, with a Median Multiple of 9.4. Los Angeles is the third least affordable, with a Median Multiple that deteriorated from 8.1 to 9.3. San Francisco is close behind, with a Median Multiple of 9.2. The UBS Global Real Estate Bubble Index rates San Francisco as having the world’s seventh worst housing bubble risk. San Diego is the fifth least affordable major housing market, with a Median Multiple of 8.6. There are eight additional severely unaffordable major housing markets in the United States, including Miami (6.1), New York (5.7) and Riverside-San Bernardino (5.6), which is adjacent to Los Angeles. Riverside-San Bernardino had achieved an affordable Median Multiple of 3.0 in 2009, but its trend since that time could indicate that housing affordability may well be a thing of the past throughout all of Southern California. Portland, Oregon’s housing affordability continued to deteriorate to a Median Multiple of 5.5, up from 3.2 in 2000. The severely unaffordable also include Seattle (5.5), Denver (5.4), and Boston (5.4), where housing affordability has deteriorated, but at a somewhat slower rate. Sacramento (5.1) is a new entrant to severe unaffordability, where a torrid pace of housing affordability losses have occurred since 2012, when there was an affordable 2.9 Median Multiple. Sacramento is more than halfway to its peak of 6.8, during the housing bubble.
65 Median house prices from the National Association of Realtors and the National Home Builders Association, Zillow and metropolitan area real estate associations.
13th Annual Demographia International Housing Affordability Survey (2016: 3rd Quarter) 31

Sacramento is a new entrant to severe unaffordability, where a
torrid pace of housing affordability losses have
occurred since 2012
Strong domestic out-migration trends have been associated with more serious housing affordability in the United States. Using the average of Median Multiples from 2000 to 2015, major housing markets with a Median Multiple of 3.666 or over have lost a net 4.8 million residents. Major housing markets with Median Multiples of 3.5 or less gained 3.2 net domestic migrants, an 8 million difference compared to more expensive markets. The balance of 1.6 million net domestic migrants settled in smaller markets, most of which were more affordable (Figure 12). Other Housing Markets: There are 82 affordable housing markets in the United States. The most affordable housing market in this year’s Survey is Racine, WI, with a Median Multiple of 1.8. Bay City, MI (1.9), Decatur, IL (2.0) and Elmira, NY (2.0) occupied the next three positions. Eight housing markets have Median Multiples of 2.1, including East Stroudsburg, PA, which is in exurban New York67 and Scranton-Wilkes Barre, PA, which is adjacent. Santa Cruz (CA), located in the San Francisco Bay Area, is the least affordable market in the in the United States. With a severely unaffordable Median Multiple of 11.6, Santa Cruz’s housing affordability has deteriorated to a level not before recorded in the United States.68 Outside the United States, only Hong Kong, Vancouver and Sydney have registered worse housing affordability. Close behind Santa Cruz is Santa Barbara (CA), with a Median Multiple of 11.3, a depth of housing affordability only reached by two housing markets in the United States, Santa Cruz and Los Angeles. Four other housing markets reached Median Multiples of 8.0 or more, Salinas-Monterey, CA (9.2),
66 The mid-point of the moderately unaffordable classification. 67 The New York combined statistical area. 68 During the housing bubble, Los Angeles reached a Median Multiple of 11.5 in 2007.
3,172,000
-4,781,000
1,609,000
-6,000,000
-5,000,000
-4,000,000
-3,000,000
-2,000,000
-1,000,000
0
1,000,000
2,000,000
3,000,000
4,000,000
Median Multiple 3.5 or Less
Median Multiple > 3.5 Outside Major Metropolitan Areas
Popu
latio
n Ch
ange
US Net Domestic Migration by AffordabilityUS MAJOR METROPOLITAN AREAS: 2000-2015
Derived from Census Bureau data & City Sector Model 2015 Revision Figure 12
13th Annual Demographia International Housing Affordability Survey (2016: 3rd Quarter) 32

San Luis Obispo, CA (9.0), as well as San Francisco Bay area housing markets Santa Rosa, CA (8.7) and Napa, CA (8.4). Historical Perspective: The United States had generally affordable housing through much of the period following World War II. The key was provision of tract housing on competitively priced inexpensive land in the suburbs, the beginnings of which have been credited to entrepreneurs such as William Leavitt, who built “Levittowns” and other similar developments in New York, New Jersey, Pennsylvania, Maryland and Puerto Rico. These communities were copied and improved upon, increasing the number of households able to live a middle-income quality of life. Similar communities emerged from Canada, Australia and New Zealand to other parts of the high income world, and now increasingly to other nations, including Mexico, the Philippines, Chile, Central America and elsewhere. Median Multiples in the United States were overwhelmingly below 3.0 until the 1970s and remained at that level in most housing markets until the early 2000s. The most important exception, however, was California, where decades of restrictive land use regulation, including court decisions and far stronger environmental regulation than in the rest of the nation, has been associated with huge housing affordability losses.69 This is illustrated in Figure 13 which shows California’s substantial housing affordability deterioration compared to the rest of the United States. There has also been deterioration among other more restrictively regulated housing markets, where more restrictive regulation typically occurred later. Liberally regulated housing markets have performed far better.
69 William A. Fischel, Regulatory Takings: Law, Economics, and Politics. Harvard University Press, 1995.
0
1
2
3
4
5
6
7
8
9
10
1950 1960 1970 1980 1985 1990 1995 2000 2005 2010 2015
Med
ian
Mul
tiple
Less Restrictive MarketsMore Restrictive Markets: Outside CaliforniaCalifornia (All More Restricted Markets)
Middle-Income Housing AffordabilityCALIFORNIA & THE UNITED STATES: 1950-2016
Derived from Census Bureau, Harvard University and Demographia.
13th Annual Demographia International Housing Affordability Survey (2016: 3rd Quarter) 33

More recent data on the 10 largest housing markets indicates the rising house costs in Los Angeles, which is indicative of other California housing markets. The figure also indicates other more restrictively regulated markets, such as New York, Miami and Boston which have also had severe losses in housing affordability. Other markets, Chicago, Philadelphia and Washington experienced large house price increases during the housing bubble, but have settled back into more affordable territory. Washington, with its county level urban containment efforts, had reached a severely unaffordable Median Multiple of 5.7 in 2006. Liberally regulated Dallas-Fort Worth, Houston and Atlanta experienced little in house price increases during the housing bubble and remain the most affordable (Figure 14). Prospects appear to be particularly bleak in California. Already, the new urban fringe housing, which drives housing affordability, is prohibited or severely limited by state and local policy. Further, there are proposals to further strengthen housing regulations. Already, there is an increase in short term investments (“speculation”) in California, which is not surprising given the potential for windfall profits as housing supply is kept to well below normal demand. 4: OTHER HOUSING AFFORDABILITY SURVEYS: CHINA AND MALAYSIA
ther organizations publish surveys using housing affordability multiples similar to the Median Multiple, including E-House in China and the Khazanah Research Institute in Malaysia.70 Demographia routinely features highlights from such surveys.
70 A similar analysis of external reports from China and Korea was included in the 11th Annual Demographia International Housing Affordability Survey.
O
0
3
6
9
12
1995 2000 2005 2010 2015
Med
ian
Mul
tiple
New YorkLos AngelesChicagoDallas-Fort WorthHoustonPhiladelphiaWashingtonMiamiAtlantaBoston
Figure 14
10 Largest United States MarketsMIDDLE-INCOME HOUSING AFFORDABILITY: 1995-2016
Source: Harvard Joint Housing Center and Demographia
13th Annual Demographia International Housing Affordability Survey (2016: 3rd Quarter) 34

4.10: China E-House in Shanghai has published annual reports on housing affordability in China, using price-to-income ratios. The latest E-House report (for 2015) provided data for all provinces, including three housing markets that coincide with provinces. Beijing was the least affordable at 14.5, which was below the 19.0 Median Multiple indicated for Hong Kong in the 2015 Demographia Survey. Shanghai had an Average Multiple of 14.0 and Tianjin had an Average Multiple of 10.0. The most affordable provincial level jurisdiction was Inner Mongolia, with a moderately unaffordable Average Multiple of 4.4. Among the three major markets for which data is available, China has a seriously unaffordable Median Multiple of 12.8. The overall Median Multiple for China was a severely unaffordable 10.2. 4.11: Malaysia The Khazannah Research Institute analyzed house prices and incomes in Malaysia found that the national Median Multiple was 4.4 in 2014, in its book Making Housing Affordable: 2015. Housing affordability was best in the state of Melaka, at an “affordable” 3.0. The national capital district, Kuala Lumpur had a severely unaffordable Median Multiple of 5.4. However, housing was considerably more affordable throughout the Kuala Lumpur metropolitan region, which includes the state of Selangor and the federal district of Putrajaya. Selangor had a population more than three times that of Kuala Lumpur, and a Median Multiple of 4.0. Using population weighted medians, it is estimated that the Median Multiple for the Kuala Lumpur metropolitan region was a seriously unaffordable 4.3 in 2014. Kuala Lumpur would have had the eighth best housing affordability out of the 18 metropolitan regions with more than 5 million population in the 2014 Demographia International Housing Affordability Survey. Another major housing market, Penang, had a severely unaffordable Median Multiple of 5.2. Across the Johor Straits from Singapore, major market Johor Bahru had a Median Multiple of 4.2. Malaysia’s major market Median Multiple was a seriously unaffordable 4.6.
0 3 6 9 12 15 18
United States
Japan
United Kingdom
Malaysia
Ireland
Canada
Singapore
Australia
New Zealand
China: Mainland
China: Hong Kong
Housing Affordability Multiple
Demographia 2016E-House 2015Khazannah Research Institute (2014)
Figure 15
International Affordability: Major MarketsE-HOUSE, KAZANNAH & DEMOGRAPHIA: 2016
Sources: E-House , Estimated from Khazannah, Demographia
13th Annual Demographia International Housing Affordability Survey (2016: 3rd Quarter) 35

Much of the initiative for the report is the result of the Malaysian government’s focus on housing affordability. 4.3: Comparisons between the Surveys The housing affordability multiples of E-House and the Khazanah Research Institute are compared to the 13th Annual Demographia International Housing Affordability Survey in Figure 15. Figure 16 compares housing affordability multiples from housing markets (metropolitan areas) with more than 5 million population from all three surveys. These data do not account for differences in house sizes (This issue is discussed in the (10th Annual Demographia International Housing Affordability Survey). 5: “BEST CITIES” FOR MIDDLE-INCOME HOUSEHOLDS
arious organizations, such as The Economist regularly publish international “best cities” and “most livable city” lists. The press and the public often misinterpret these rankings as indicating that these are generally the most “livable” metropolitan areas in the world. The
rankings are aimed at wealthy households, not middle-income households and at corporate relocation experts advising executives who might move to different housing markets. Housing affordability is not a principal concern and it is thus not surprising that the “Best Cities” routinely exclude evaluation of middle-income housing affordability. As a result, the “Best Cities” lists cannot genuinely rate livability for middle-income households. Indeed, the “best city” lists might be characterized as representing the “1 percent,” rather than the
V
0 5 10 15 20
AtlantaOsaka-Kobe-Kyoto
HoustonPhiladelphia
Dallas-Fort WorthChicago
Washington Kuala Lumpur
TokyoSingaporeNew York
MiamiLondon Exurbs
TorontoLondon (GLA)
Los AngelesTianjin
AucklandSydney
ShanghaiBeijing
Hong Kong
Housing Affordability Multiple
Demographia (2016)E-House (2015)Kazannah Research Institute (2014)
Figure 16
Affordability in the Largest Housing MarketsHOUSING MARKETS OVER 5,000,000 POPULATION
Sources: E-House , Estimated from Khazannah, Demographia
13th Annual Demographia International Housing Affordability Survey (2016: 3rd Quarter) 36

Luxury livability is different from middle-
income livability.
… middle-income outcomes in Dallas-Fort Worth are better
than in “best city” Toronto, with its severely unaffordable housing
“99 percent” that that is dominated by middle-income households and includes low-income households.71 5.1: “Luxury” Livability and “Middle-Income” Livability Luxury livability is different from middle-income livability. The first principle of livability is affordability. Middle-income households must be able to afford adequate housing. If they cannot, then a city cannot be livable. Indeed, such a city is anything but a “best city” or “most livable city” for households with insufficient wealth to afford middle-income housing. Middle-income households often face severe budgetary constraints. Their incomes and employment opportunities have become more constrained. As the largest household expenditure, housing, increases, there is less money left over for other needs and desires. Housing affordability is pivotal to living a middle-income lifestyle. The “best cities” are often among the most unaffordable for average households. This is illustrated by the 2015 Economist “best cities” list. Eight of the 10 “best cities” were rated in the 2016 Demographia International Housing Affordability Survey (ratings for 2015). Six housing markets were severely unaffordable and the other was seriously unaffordable. Three of the top 10 were not included (Zurich, Vienna and Helsinki) due to the lack of comparable information. Each of the seven Survey cities in The Economist top ten has strong urban containment policy, and since its implementation has evolved from much greater affordability to severe or serious unaffordability. The following examples illustrate the distinction between livability for the luxury market and middle-income livability. Toronto and Dallas-Fort Worth: The Economist rated Toronto as “the best city in the world” Yet, Toronto was the 13th least affordable city among the major metropolitan areas ranked in the last Survey, and housing affordability has deteriorated substantially in the subsequent year. Dallas-Fort Worth has nearly the same population as Toronto. Residents in Dallas-Fort Worth pay about one-half as much for houses than in Toronto. Dallas-Fort Worth has the least traffic congestion of any city in the world with more than 5,000,000 population.72 Traffic is 40 percent less congested than in Toronto, and average work trip travel times are less. This is in large measure because of the lower built-up urban area density and more dispersed employment pattern in Dallas-Fort Worth (Figure 17). In short, these middle-income outcomes in Dallas-Fort Worth are
71 Impact on low income and taxation and subsidies, etc. 72 Derived from Tom Tom 2015 traffic congestion ratings.
13th Annual Demographia International Housing Affordability Survey (2016: 3rd Quarter) 37

better than in “best city” Toronto, with its severely unaffordable housing.73 This is despite the fact that Toronto employs the most “in vogue” urban strategies, unlike Dallas-Fort Worth. This is not to dispute Toronto’s luxury rating, but it is of little use to the much larger number of middle-income households being priced out of home ownership. Kansas City and “The Economist Top 10: Another example is Kansas City, which is usually excluded from the “Best Cities” lists. Yet, Kansas City has better housing affordability that any of The Economist’s top 10 livable cities (Figure 18).74 Kansas City’s traffic is tied for best in the world with Richmond, VA and is less congested than any of The Economist’s, top 10 for which there is data. Middle-income outcomes in Kansas City compete very well with The Economist’s top 10.75 Moreover, there are many other cities with middle-income housing affordability superior to those of the “best cities.” 5.2: Urban Containment and Severely Unaffordable Housing Excessive land use regulation (housing regulation), principally urban containment policy, has been implemented in the major housing markets with severely unaffordable housing. Urban containment has been associated with much higher house prices, which is to be expected, because severe limitations on supply drive prices higher (as the experience with oil and OPEC shows).76
73 Dallas-Fort Worth also has a 35 percent higher gross domestic product per capita than Toronto. 74 The subject report does not include data for Vienna, Helsinki and Zurich. However, another source, indicates price to income ratios in all three cities that are more than three times that of Kansas City. This is for houses that are about one-half as large (90 square meters) in the three European cities, compared to 177 square meters in Kansas City (or 969 square feet compared to 1,900 square feet). Sources: https://www.numbeo.com/property-investment/rankings.jsp and American Housing Survey. 75 Kansas City also ranks well in incomes, with a gross domestic product per capita higher than that of all but three of the best 10 cities. 76 See Fischel, Regulatory Takings, Cheshire, Nathan and Overman, Urban Economics and Urban Policy, and Cox, A Question of Values.
Characteristics Toronto“Best City”
Dallas-Ft. Worth
DFW/Toronto
URBAN FORMUrban Area Population* 5,133,000 5,122,000 -0.2%Land Area (Square Miles) 1,751 4,605 +163.0%Density: 2011/2010 2,931 1,112 -62.1%MIDDLE-INCOME OUTCOMESMedian Multiple: 2015 7.7 3.7 -51.9%One Way Work Trip 2011 32.8 26.6 -18.9%Work Trip Under 30 Minutes 48% 58% +20.8%Excess Time in Traffic 28% 17% -39.3%Transit Work Trip Share 21.7% 1.4% -93.5%
Toronto & Dallas-Fort WorthURBAN FORM & MIDDLE-INCOME OUTCOMES
* Called “population centre” in Canada Sources: Statistics Canada, US Census Bureau, Brookings, Tom Tom Figure 17
13th Annual Demographia International Housing Affordability Survey (2016: 3rd Quarter) 38

A $2 trillion loss in US GDP…”almost entirely driven” by regulatory
constraints on housing
…middle-income outcomes of Kansas City compete
very well with The Economist’s top ten.
Now Prime Minister Bill English of New Zealand (then Deputy Prime Minister) noted in his introduction to the 9th Annual Demographia International Housing Affordability Survey that “Land has been made artificially scarce by regulation” locking up land for development. “This regulation has made land supply unresponsive to demand” and “translates to higher prices rather than more houses. 5.3: Impact on National Economies Strong housing regulation also has serious consequences for national economies.
This is illustrated by research in the United States. Higher house prices have been associated with an annual reduction of nearly $2-trillion US in the United States’ gross domestic product, according to Chang-Tai Hsieh of the University of Illinois and Enrico Moretti of the University of California. An economic loss of this magnitude would equal more than 10 per cent of the U.S. gross domestic product (2009). This was “almost entirely driven” by regulatory constraints on housing. They referred to the effect as a “large negative externality.” [emphasis in original]. 77
Matthew Rognlie of the Massachusetts Institute of Technology has shown that much of the rising inequality is from housing wealth. According to Rognlie, “... [T]he literature studying markets with high housing costs finds that these costs are driven in large part by artificial scarcity through land use regulation .... A natural first step to combat the increasing role of housing wealth would be to re-examine these regulations and expand the housing supply.”78 In reviewing the overpriced housing market, the Productivity Commission of New Zealand cited higher house prices for social consequences (negative externalities) such as lower home
77 Chang-Tai Hsieh and Enrico Moretti, “Why Do Cities Matter? Local Growth and Aggregate Growth,” The National Bureau of Economic Research, May 2015. http://www.nber.org/papers/w21154. 78 Matthew Rognlie, “A Note on Piketty and Diminishing Returns to Capital,” June 15, 2014. http://www.mit.edu/~mrognlie/piketty_diminishing_returns.pdf.
13th Annual Demographia International Housing Affordability Survey (2016: 3rd Quarter) 39

“…planning … has become the
externality.
ownership, greater overcrowding and increased low-income housing subsidy requirements.79
The higher house prices also have an impact on monetary policy. Cheshire, Nathan and Overman note that urban containment policy: “…makes monetary policy more difficult even for independent central bankers since it becomes increasingly difficult to ignore housing-market pressures rather than just inflation targeting.”80 According to New Zealand’s Prime Minister Bill English, urban planning has become a negative externality, by virtue of its impact on house prices, equality and the economy. 5.4: Today’s World Over the past year, the world has seen populist results at the ballot box. Only time will tell whether the “Brexit” vote to take the United Kingdom out of the European Union or the election of Donald Trump as US president will be more significant. There was also the populist rejection of constitutional revisions in Italy and populist political parties seem to be on the ascendancy in Europe and elsewhere. One of the most important issues driving this populism is economic uncertainty. For example, in the United States, median household incomes have only recently been restored to their 1998 level and remain below intermediate peaks since that time. Economic growth has not yet been sufficiently restored. At the recent G-20 conference in Hangzhou, leaders expressed concern that “growth is still weaker than desirable) and committed to inclusive economic growth and the eradication of poverty. The Role of Housing Affordability: Housing affordability is important to the achievement of such objectives. The economic uncertainty is not just about stagnant or slow income growth, but it is also characterized by a decline in discretionary incomes as households experience housing cost growth far in excess of income growth in many housing markets. Further, as prices have risen compared to incomes, households have been forced to accept smaller houses, with fewer amenities. Middle-income housing affordability is likely to continue worsening unless urban containment policy is either withdrawn or seriously liberalized.
“The problem is it is utterly unviable in the long term. With every passing decade the problems would get worse, the wider economic costs would become more penalising, the economy and monetary policy more unmanageable and the outcomes – the divide between the property haves and the property have-nots – more unacceptable.”81
79 New Zealand Productivity Commission, “Using Land for Housing,” September 2015. http://www.productivity.govt.nz/inquiry-content/2060?stage=4. 80 Cheshire, Nathan & Overman, Urban Economics and Urban Policy. 81 Cheshire, Nathan and Overman, Urban Economics and Urban Policy.
13th Annual Demographia International Housing Affordability Survey (2016: 3rd Quarter) 40

“…improving places is a means to an end, rather than an end in itself.”
“…the ultimate objective of urban policy is to improve outcomes for people rather
than places”
As co-author Hugh Pavletich indicates, the urban fringe is the “supply valve” that is necessary to preserve affordability in a housing market (Table 12). Moreover, there is little prospect that middle-income affordability in a housing market can be maintained or restored by higher densities, since removal of density restrictions, in itself, raises land values.82 The house price increasing result of severe restrictions on housing supply is fundamental to economics --- limiting supply leads to higher prices, all else equal.83 Moreover, the very creation of land scarcity induces well funded interests to invest for the extraordinary returns available markets “strangled” by an excess of demand over supply.
Table 12 AFFORDABLE HOUSING MARKETS: DEFINITION
For metropolitan areas to rate as 'affordable' and ensure that housing bubbles are not triggered, housing prices should not exceed three times gross annual household earnings. To allow this to occur, new starter housing of an acceptable quality to the purchasers, with associated commercial and industrial development, must be allowed to be provided on the urban fringes at 2.5 times the gross annual median household income of that urban market. The critically important “development ratios”84 for this new fringe starter housing should be 17 - 23% serviced lot / section cost - the balance the actual housing construction. Ideally through a normal building cycle, the Median Multiple should move from a Floor Multiple of 2.3, through a Swing Multiple of 2.5 to a Ceiling Multiple of 2.7 - to ensure maximum stability and optimal medium and long term performance of the residential construction sector.
-Hugh Pavletich Performance Urban Planning
5.5: People: A Higher Priority than Place Paul Cheshire, Nathan and Overman of the London School of Economics recently suggested that “… that the ultimate objective of urban policy is to improve outcomes for people rather than places” and that “… improving places is a means to an end, rather than an end in itself.”85 Cities like Dallas-Fort Worth, Kansas City and many others that have remained more affordable have put people over place. Their urban policy outcomes have been more favorable for the vast majority of the population, including both middle-income and lower income households.86
82 Also see Romem. 83 Cox, A Question of Values. 84 The development ratio is the cost of the finished land (underlying infrastructure complete) divided by the house construction cost plus the finished land. This issue is extensively discussed with respect to the United States market in the Demographia Residential Land & Regulation Cost Index. 85 Cheshire, Nathan and Overman, Urban Economics and Urban Policy.
13th Annual Demographia International Housing Affordability Survey (2016: 3rd Quarter) 41

The best cities for middle-income households are where governments have competently managed housing markets by keeping housing affordable
The best cities for middle-income and lower-income households are where governments have competently managed housing markets, by keeping housing affordable (all else equal). In such cities, housing takes up less of the household budget, the cost of living tend to be lower and households are able to afford a more affluent life. As The New Zealand Initiative’s Oliver Hartwich put it in the Introduction to this volume, “We should not accept extreme price levels in our housing markets. High house prices are not a sign of city’s success but a sign of failure to deliver the housing that its citizens need.”
86 Lower income housing affordability is largely driven by the cost structure of middle-income housing in a city. Better middle-income housing affordability means better lower-income housing.
13th Annual Demographia International Housing Affordability Survey (2016: 3rd Quarter) 42

SCHEDULE 1 MAJOR HOUSING MARKETS RANKED BY AFFORDABILITY: Most Affordable to Least Affordable
(Housing Markets over 1,000,000 Population) Median Multiple (Median House Price/Median Household Income): 2016 – 3rd Quarter
Demographia International Housing Affordability Survey International Affordability
Rank
Major Market Rank
National Rank Nation Housing market
Median Multiple* Median Price
Median Household
Income 33 1 27 U.S. Rochester, NY 2.5 $139,300 $54,800 45 2 38 U.S. Buffalo, NY 2.6 $138,900 $52,900 55 3 44 U.S. Cincinnati, OH-KY-IN 2.7 $157,000 $58,000 55 3 44 U.S. Cleveland, OH 2.7 $138,900 $52,100 55 3 44 U.S. Pittsburgh, PA 2.7 $150,000 $55,200 77 6 64 U.S. Oklahoma City, OK 2.9 $154,800 $53,300 77 6 64 U.S. Saint Louis, MO-IL 2.9 $170,000 $57,700 91 8 77 U.S. Detroit, MI 3.0 $163,500 $54,800 91 8 77 U.S. Grand Rapids, MI 3.0 $170,100 $56,600 91 8 77 U.S. Indianapolis, IN 3.0 $164,100 $55,500 91 8 77 U.S. Kansas City, MO-KS 3.0 $188,000 $61,800 99 12 83 U.S. Atlanta, GA 3.1 $191,500 $61,500 99 12 83 U.S. Columbus, OH 3.1 $181,600 $59,400
112 14 95 U.S. Louisville, KY-IN 3.2 $171,800 $54,000 116 15 99 U.S. Hartford, CT 3.3 $241,200 $73,800 116 15 99 U.S. Memphis, TN-MS-AR 3.3 $161,900 $49,600 116 15 99 U.S. Minneapolis-St. Paul, MN-WI 3.3 $240,300 $72,500 130 18 1 Japan Osaka-Kobe-Kyoto* 3.4 ¥20,110,000 ¥5,920,000 138 19 119 U.S. Houston, TX 3.5 $217,400 $62,800 138 19 119 U.S. Philadelphia, PA-NJ-DE-MD 3.5 $234,800 $66,500 148 21 126 U.S. Baltimore, MD 3.6 $264,300 $74,100 148 21 126 U.S. Birmingham, AL 3.6 $187,300 $52,600 148 21 126 U.S. Virginia Beach-Norfolk, VA-NC 3.6 $220,000 $61,400 162 24 137 U.S. Dallas-Fort Worth, TX 3.7 $230,500 $63,000 162 24 137 U.S. Raleigh, NC 3.7 $250,200 $67,200 176 26 148 U.S. Chicago, IL 3.8 $244,100 $64,500 176 26 2 U.K. Leeds & West Yorkshire 3.8 £145,000 £37,900 176 26 148 U.S. San Antonio, TX 3.8 $212,300 $56,300 190 29 159 U.S. Charlotte, NC-SC 3.9 $215,900 $56,000 190 29 159 U.S. Nashville, TN 3.9 $230,000 $59,200 190 29 159 U.S. New Orleans, LA 3.9 $191,300 $49,400 190 29 20 Canada Ottawa-Gatineau, ON-QC 3.9 $315,300 $81,800 190 29 159 U.S. Richmond, VA 3.9 $239,800 $62,000 204 34 3 U.K. Glasgow 4.0 £131,800 £32,600 204 34 168 U.S. Jacksonville, FL 4.0 $219,000 $54,300 204 34 168 U.S. Salt Lake City, UT 4.0 $271,800 $67,200 204 34 168 U.S. Tucson, AZ 4.0 $193,300 $48,100 216 38 177 U.S. Austin, TX 4.1 $284,000 $68,600 216 38 5 U.K. Blackpool & Lancashire 4.1 £131,100 £32,100 216 38 5 U.K. Derby & Derbyshire 4.1 £150,000 £36,300 216 38 24 Canada Edmonton, AB 4.1 $356,000 $87,000 216 38 5 U.K. Middlesbrough & Durham 4.1 £117,300 £28,400 216 38 177 U.S. Milwaukee, WI 4.1 $238,000 $57,400 216 38 177 U.S. Phoenix, AZ 4.1 $235,300 $56,700
13th Annual Demographia International Housing Affordability Survey (2016: 3rd Quarter) 43

SCHEDULE 1 MAJOR HOUSING MARKETS RANKED BY AFFORDABILITY: Most Affordable to Least Affordable
(Housing Markets over 1,000,000 Population) Median Multiple (Median House Price/Median Household Income): 2016 – 3rd Quarter
Demographia International Housing Affordability Survey International Affordability
Rank
Major Market Rank
National Rank Nation Housing market
Median Multiple* Median Price
Median Household
Income 216 38 177 U.S. Tampa-St. Petersburg, FL 4.1 $205,000 $49,900 216 38 177 U.S. Washington, DC-VA-MD-WV 4.1 $393,500 $95,300 246 47 9 U.K. Hull & Humber 4.3 £145,000 £33,900 246 47 9 U.K. Newcastle & Tyneside 4.3 £133,000 £30,700 246 47 9 U.K. Nottingham & Nottinghamshire 4.3 £149,500 £34,400 246 47 9 U.K. Sheffield & South Yorkshire 4.3 £128,000 £30,000 255 51 13 U.K. Edinburgh 4.4 £169,100 £38,700 255 51 198 U.S. Orlando, FL 4.4 $229,900 $52,200 265 53 206 U.S. Las Vegas, NV 4.5 $236,400 $52,600 265 53 14 U.K. Manchester & Greater Manchester 4.5 £145,000 £32,500 265 53 206 U.S. Providence, RI-MA 4.5 $273,700 $60,200 273 56 28 Canada Calgary, AB 4.6 $427,700 $93,100 276 57 5 Ireland Dublin 4.7 €276,000 €58,400 276 57 2 Japan Tokyo-Yokohama* 4.7 ¥31,620,000 ¥6,760,000 285 59 18 U.K. Birmingham & West Midlands 4.8 £154,000 £32,400 285 59 30 Canada Montréal, QC 4.8 $284,700 $59,500 285 59 1 Singapore Singapore 4.8 $412,500 $85,400 285 59 18 U.K. Stoke on Trent & Staffordshire 4.8 £154,500 £31,900 300 63 21 U.K. Leicester & Leicestershire 5.0 £175,000 £35,200 312 64 23 U.K. Liverpool & Merseyside 5.1 £137,500 £27,200 312 64 227 U.S. Sacramento, CA 5.1 $327,000 $64,100 312 64 23 U.K. Warrington & Cheshire 5.1 £185,000 £36,200 325 67 231 U.S. Boston, MA-NH 5.4 $435,300 $80,500 325 67 231 U.S. Denver, CO 5.4 $386,800 $71,800 329 69 234 U.S. Portland, OR-WA 5.5 $358,500 $65,200 329 69 234 U.S. Seattle, WA 5.5 $422,100 $76,900 340 71 238 U.S. Riverside-San Bernardino, CA 5.6 $319,000 $57,300 345 72 241 U.S. New York, NY-NJ-PA 5.7 $397,600 $70,200 355 73 245 U.S. Miami, FL 6.1 $315,000 $51,500 355 73 35 Australia Perth, WA 6.1 $528,300 $87,300 357 75 36 Australia Brisbane, QLD 6.2 $495,000 $79,400 357 75 28 U.K. Bristol-Bath 6.2 £255,000 £41,200 363 77 39 Australia Adelaide, SA 6.6 $435,000 $66,000 372 78 30 U.K. London Exurbs (E & SE England) 7.1 £285,000 £40,400 372 78 30 U.K. Plymouth & Devon 7.1 £215,000 £30,400 378 80 38 Canada Toronto, ON 7.7 $615,800 $79,700 383 81 32 U.K. London (Greater London Authority) 8.5 £440,000 £51,800 384 82 253 U.S. San Diego, CA 8.6 $589,300 $68,700 386 83 33 U.K. Bournemouth & Dorset 8.9 £265,000 £29,900 393 84 256 U.S. San Francisco, CA 9.2 $835,400 $90,400 395 85 258 U.S. Los Angeles, CA 9.3 $593,900 $63,900 396 86 259 U.S. Honolulu, HI 9.4 $745,300 $78,900 397 87 51 Australia Melbourne, VIC 9.5 $740,000 $78,200 398 88 260 U.S. San Jose, CA 9.6 $1,000,000 $104,100
13th Annual Demographia International Housing Affordability Survey (2016: 3rd Quarter) 44

SCHEDULE 1 MAJOR HOUSING MARKETS RANKED BY AFFORDABILITY: Most Affordable to Least Affordable
(Housing Markets over 1,000,000 Population) Median Multiple (Median House Price/Median Household Income): 2016 – 3rd Quarter
Demographia International Housing Affordability Survey International Affordability
Rank
Major Market Rank
National Rank Nation Housing market
Median Multiple* Median Price
Median Household
Income 401 89 8 N.Z. Auckland 10.0 $830,800 $83,000 404 90 40 Canada Vancouver, BC 11.8 $830,100 $70,500 405 91 54 Australia Sydney, NSW 12.2 $1,077,000 $88,000 406 92 1 China Hong Kong 18.1 $5,422,000 $300,000
Financial data in local currency. *Average Multiple (Japan)
13th Annual Demographia International Housing Affordability Survey (2016: 3rd Quarter) 45

SCHEDULE 2
MAJOR HOUSING MARKETS BY GEOGRAPHY (Over 1,000,000 Population) Median Multiple (Median House Price/Median Household Income): 2016 – 3rd Quarter
Demographia International Housing Affordability Survey International Affordability
Rank
Major Market Rank
National Rank Nation Housing market
Median Multiple* Median Price
Median Household
Income 363 77 39 Australia Adelaide, SA 6.6 $435,000 $66,000 357 75 36 Australia Brisbane, QLD 6.2 $495,000 $79,400 397 87 51 Australia Melbourne, VIC 9.5 $740,000 $78,200 355 73 35 Australia Perth, WA 6.1 $528,300 $87,300 405 91 54 Australia Sydney, NSW 12.2 $1,077,000 $88,000 273 56 28 Canada Calgary, AB 4.6 $427,700 $93,100 216 38 24 Canada Edmonton, AB 4.1 $356,000 $87,000 285 59 30 Canada Montréal, QC 4.8 $284,700 $59,500 190 29 20 Canada Ottawa-Gatineau, ON-QC 3.9 $315,300 $81,800 378 80 38 Canada Toronto, ON 7.7 $615,800 $79,700 404 90 40 Canada Vancouver, BC 11.8 $830,100 $70,500 406 92 1 China Hong Kong 18.1 $5,422,000 $300,000 276 57 5 Ireland Dublin 4.7 €276,000 €58,400 130 18 1 Japan Osaka-Kobe-Kyoto* 3.4 ¥20,110,000 ¥5,920,000 276 57 2 Japan Tokyo-Yokohama* 4.7 ¥31,620,000 ¥6,760,000 401 89 8 N.Z. Auckland 10.0 $830,800 $83,000 285 59 1 Singapore Singapore 4.8 $412,500 $85,400 285 59 18 U.K. Birmingham & West Midlands 4.8 £154,000 £32,400 216 38 5 U.K. Blackpool & Lancashire 4.1 £131,100 £32,100 386 83 33 U.K. Bournemouth & Dorset 8.9 £265,000 £29,900 357 75 28 U.K. Bristol-Bath 6.2 £255,000 £41,200 216 38 5 U.K. Derby & Derbyshire 4.1 £150,000 £36,300 255 51 13 U.K. Edinburgh 4.4 £169,100 £38,700 204 34 3 U.K. Glasgow 4.0 £131,800 £32,600 246 47 9 U.K. Hull & Humber 4.3 £145,000 £33,900 176 26 2 U.K. Leeds & West Yorkshire 3.8 £145,000 £37,900 300 63 21 U.K. Leicester & Leicestershire 5.0 £175,000 £35,200 312 64 23 U.K. Liverpool & Merseyside 5.1 £137,500 £27,200 383 81 32 U.K. London (Greater London Authority) 8.5 £440,000 £51,800 372 78 30 U.K. London Exurbs (E & SE England) 7.1 £285,000 £40,400 265 53 14 U.K. Manchester & Greater Manchester 4.5 £145,000 £32,500 216 38 5 U.K. Middlesbrough & Durham 4.1 £117,300 £28,400 246 47 9 U.K. Newcastle & Tyneside 4.3 £133,000 £30,700 246 47 9 U.K. Nottingham & Nottinghamshire 4.3 £149,500 £34,400 372 78 30 U.K. Plymouth & Devon 7.1 £215,000 £30,400 246 47 9 U.K. Sheffield & South Yorkshire 4.3 £128,000 £30,000 285 59 18 U.K. Stoke on Trent & Staffordshire 4.8 £154,500 £31,900 312 64 23 U.K. Warrington & Cheshire 5.1 £185,000 £36,200 99 12 83 U.S. Atlanta, GA 3.1 $191,500 $61,500
216 38 177 U.S. Austin, TX 4.1 $284,000 $68,600 148 21 126 U.S. Baltimore, MD 3.6 $264,300 $74,100 148 21 126 U.S. Birmingham, AL 3.6 $187,300 $52,600 325 67 231 U.S. Boston, MA-NH 5.4 $435,300 $80,500 45 2 38 U.S. Buffalo, NY 2.6 $138,900 $52,900
190 29 159 U.S. Charlotte, NC-SC 3.9 $215,900 $56,000
13th Annual Demographia International Housing Affordability Survey (2016: 3rd Quarter) 46

SCHEDULE 2 MAJOR HOUSING MARKETS BY GEOGRAPHY (Over 1,000,000 Population)
Median Multiple (Median House Price/Median Household Income): 2016 – 3rd Quarter Demographia International Housing Affordability Survey
International Affordability
Rank
Major Market Rank
National Rank Nation Housing market
Median Multiple* Median Price
Median Household
Income 176 26 148 U.S. Chicago, IL 3.8 $244,100 $64,500 55 3 44 U.S. Cincinnati, OH-KY-IN 2.7 $157,000 $58,000 55 3 44 U.S. Cleveland, OH 2.7 $138,900 $52,100 99 12 83 U.S. Columbus, OH 3.1 $181,600 $59,400
162 24 137 U.S. Dallas-Fort Worth, TX 3.7 $230,500 $63,000 325 67 231 U.S. Denver, CO 5.4 $386,800 $71,800 91 8 77 U.S. Detroit, MI 3.0 $163,500 $54,800 91 8 77 U.S. Grand Rapids, MI 3.0 $170,100 $56,600
116 15 99 U.S. Hartford, CT 3.3 $241,200 $73,800 396 86 259 U.S. Honolulu, HI 9.4 $745,300 $78,900 138 19 119 U.S. Houston, TX 3.5 $217,400 $62,800 91 8 77 U.S. Indianapolis, IN 3.0 $164,100 $55,500
204 34 168 U.S. Jacksonville, FL 4.0 $219,000 $54,300 91 8 77 U.S. Kansas City, MO-KS 3.0 $188,000 $61,800
265 53 206 U.S. Las Vegas, NV 4.5 $236,400 $52,600 395 85 258 U.S. Los Angeles, CA 9.3 $593,900 $63,900 112 14 95 U.S. Louisville, KY-IN 3.2 $171,800 $54,000 116 15 99 U.S. Memphis, TN-MS-AR 3.3 $161,900 $49,600 355 73 245 U.S. Miami, FL 6.1 $315,000 $51,500 216 38 177 U.S. Milwaukee, WI 4.1 $238,000 $57,400 116 15 99 U.S. Minneapolis-St. Paul, MN-WI 3.3 $240,300 $72,500 190 29 159 U.S. Nashville, TN 3.9 $230,000 $59,200 190 29 159 U.S. New Orleans, LA 3.9 $191,300 $49,400 345 72 241 U.S. New York, NY-NJ-PA 5.7 $397,600 $70,200 77 6 64 U.S. Oklahoma City, OK 2.9 $154,800 $53,300
255 51 198 U.S. Orlando, FL 4.4 $229,900 $52,200 138 19 119 U.S. Philadelphia, PA-NJ-DE-MD 3.5 $234,800 $66,500 216 38 177 U.S. Phoenix, AZ 4.1 $235,300 $56,700 55 3 44 U.S. Pittsburgh, PA 2.7 $150,000 $55,200
329 69 234 U.S. Portland, OR-WA 5.5 $358,500 $65,200 265 53 206 U.S. Providence, RI-MA 4.5 $273,700 $60,200 162 24 137 U.S. Raleigh, NC 3.7 $250,200 $67,200 190 29 159 U.S. Richmond, VA 3.9 $239,800 $62,000 340 71 238 U.S. Riverside-San Bernardino, CA 5.6 $319,000 $57,300 33 1 27 U.S. Rochester, NY 2.5 $139,300 $54,800
312 64 227 U.S. Sacramento, CA 5.1 $327,000 $64,100 77 6 64 U.S. Saint Louis, MO-IL 2.9 $170,000 $57,700
204 34 168 U.S. Salt Lake City, UT 4.0 $271,800 $67,200 176 26 148 U.S. San Antonio, TX 3.8 $212,300 $56,300 384 82 253 U.S. San Diego, CA 8.6 $589,300 $68,700 393 84 256 U.S. San Francisco, CA 9.2 $835,400 $90,400 398 88 260 U.S. San Jose, CA 9.6 $1,000,000 $104,100 329 69 234 U.S. Seattle, WA 5.5 $422,100 $76,900 216 38 177 U.S. Tampa-St. Petersburg, FL 4.1 $205,000 $49,900 204 34 168 U.S. Tucson, AZ 4.0 $193,300 $48,100 148 21 126 U.S. Virginia Beach-Norfolk, VA-NC 3.6 $220,000 $61,400
13th Annual Demographia International Housing Affordability Survey (2016: 3rd Quarter) 47

SCHEDULE 2 MAJOR HOUSING MARKETS BY GEOGRAPHY (Over 1,000,000 Population)
Median Multiple (Median House Price/Median Household Income): 2016 – 3rd Quarter Demographia International Housing Affordability Survey
International Affordability
Rank
Major Market Rank
National Rank Nation Housing market
Median Multiple* Median Price
Median Household
Income 216 38 177 U.S. Washington, DC-VA-MD-WV 4.1 $393,500 $95,300
Financial data in local currency. *Average Multiple (Japan)
13th Annual Demographia International Housing Affordability Survey (2016: 3rd Quarter) 48

SCHEDULE 3
ALL HOUSING MARKETS RANKED BY AFFORDABILITY: Most Affordable to Least Affordable Median Multiple (Median House Price/Median Household Income): 2016 – 3rd Quarter
Demographia International Housing Affordability Survey International Affordability
Rank
Major Market Rank
National Rank Nation Housing market
Median Multiple* Median Price
Median Household
Income 1
1 U.S. Racine, WI 1.8 $104,000 $58,400
2
2 U.S. Bay City, MI 1.9 $91,000 $47,500 3
3 U.S. Decatur, IL 2.0 $99,400 $49,100
3
3 U.S. Elmira, NY 2.0 $109,400 $54,200 5
5 U.S. East Stroudsburg, PA 2.1 $123,000 $58,500
5
1 Australia Karratha, WA 2.1 $363,000 $171,900 5
5 U.S. Lima, OH 2.1 $110,000 $51,400
5
1 Canada Moncton, NB 2.1 $134,900 $65,200 5
5 U.S. Peoria, IL 2.1 $123,100 $57,500
5
5 U.S. Rockford, IL 2.1 $111,900 $52,100 5
5 U.S. Scranton-Wilkes Barre, PA 2.1 $109,000 $50,700
5
5 U.S. Springfield, OH 2.1 $102,000 $49,000 5
5 U.S. Terre Haute, IN 2.1 $88,000 $41,800
5
5 U.S. Youngstown, OH-PA 2.1 $90,300 $44,000 15
13 U.S. Binghamton, NY 2.2 $111,900 $50,400
15
2 Canada Fredericton, NB 2.2 $151,000 $68,800 15
13 U.S. Utica, NY 2.2 $110,000 $50,000
18
15 U.S. Cumberland, MD-WV 2.3 $94,400 $40,200 18
15 U.S. Davenport, IA-IL 2.3 $128,700 $56,700
18
1 Ireland Limerick 2.3 €128,300 €55,900 18
2 Australia Port Hedland, WA 2.3 $390,000 $168,700
18
15 U.S. Saginaw, MI 2.3 $100,000 $44,300 18
15 U.S. Springfield, IL 2.3 $135,800 $59,100
24
19 U.S. Bloomington, IL 2.4 $158,300 $65,200 24
19 U.S. Homosassa Springs, FL 2.4 $100,000 $41,100
24
19 U.S. Kankakee, IL 2.4 $129,700 $55,000 24
19 U.S. Mansfield, OH 2.4 $110,000 $46,100
24
3 Canada Saint John, NB 2.4 $161,900 $68,000 24
19 U.S. Syracuse, NY 2.4 $137,000 $57,600
24
19 U.S. Topeka, KS 2.4 $127,100 $52,800 24
19 U.S. Waterloo, IA 2.4 $127,400 $53,400
24
19 U.S. Wheeling, WV 2.4 $115,000 $48,700 33
27 U.S. Akron, OH 2.5 $131,500 $52,700
33
27 U.S. Appleton, WI 2.5 $156,900 $62,500 33
27 U.S. Canton, OH 2.5 $125,000 $50,400
33
27 U.S. Carbondale, IL 2.5 $110,000 $43,200 33
27 U.S. Evansville, IN 2.5 $125,000 $49,700
33
27 U.S. Ft. Wayne, IN 2.5 $127,700 $51,900 33
27 U.S. Muskegon, MI 2.5 $120,000 $48,500
33
27 U.S. Odessa, TX 2.5 $169,000 $66,800 33
27 U.S. Oshkosh, WI 2.5 $134,300 $53,200
33 1 27 U.S. Rochester, NY 2.5 $139,300 $54,800
13th Annual Demographia International Housing Affordability Survey (2016: 3rd Quarter) 49

SCHEDULE 3 ALL HOUSING MARKETS RANKED BY AFFORDABILITY: Most Affordable to Least Affordable
Median Multiple (Median House Price/Median Household Income): 2016 – 3rd Quarter Demographia International Housing Affordability Survey
International Affordability
Rank
Major Market Rank
National Rank Nation Housing market
Median Multiple* Median Price
Median Household
Income 33
4 Canada Saguenay, QC 2.5 $170,000 $66,700
33
27 U.S. Toledo, OH 2.5 $119,800 $48,100 45
38 U.S. Battle Creek, MI 2.6 $116,000 $44,000
45 2 38 U.S. Buffalo, NY 2.6 $138,900 $52,900 45
5 Canada Charlottetown, PEI 2.6 $174,700 $67,500
45
38 U.S. Erie, PA 2.6 $127,400 $48,400 45
3 Australia Kalgoorlie, WA 2.6 $312,000 $118,100
45
38 U.S. Lansing, MI 2.6 $138,300 $52,900 45
38 U.S. Monroe, MI 2.6 $145,000 $55,500
45
5 Canada Trois-Rivières, QC 2.6 $148,300 $56,400 45
2 Ireland Waterford 2.6 €125,000 €48,100
45
38 U.S. Wichita, KS 2.6 $135,700 $52,700 55 3 44 U.S. Cincinnati, OH-KY-IN 2.7 $157,000 $58,000 55 3 44 U.S. Cleveland, OH 2.7 $138,900 $52,100 55
44 U.S. Dayton, OH 2.7 $134,100 $50,600
55
44 U.S. Elizabethtown, KY 2.7 $135,000 $50,000 55 3 44 U.S. Pittsburgh, PA 2.7 $150,000 $55,200 55
44 U.S. Roanoke, VA 2.7 $139,000 $51,600
55
44 U.S. South Bend, IN 2.7 $128,500 $48,200 55
44 U.S. Wichita Falls, TX 2.7 $127,000 $46,600
55
7 Canada Windsor, ON 2.7 $187,100 $68,800 64
52 U.S. Cedar Rapids, IA 2.8 $166,700 $59,200
64
52 U.S. Champaign, IL 2.8 $146,700 $52,700 64
52 U.S. Duluth, MN 2.8 $147,000 $51,600
64
52 U.S. Flint, MI 2.8 $126,000 $45,000 64
52 U.S. Gainesville, GA 2.8 $155,000 $56,200
64
4 Australia Gladstone, QLD 2.8 $275,000 $98,600 64
52 U.S. Green Bay, WI 2.8 $157,100 $56,000
64
52 U.S. Gulfport, MS 2.8 $126,200 $45,300 64
52 U.S. Harrisburg, PA 2.8 $164,800 $59,400
64
52 U.S. Kalamazoo, MI 2.8 $145,000 $52,300 64
52 U.S. Little Rock, AR 2.8 $138,600 $50,100
64
52 U.S. Omaha, NE-IA 2.8 $175,100 $62,300 64
52 U.S. Reading, PA 2.8 $162,100 $57,300
77
64 U.S. Beaumont, TX 2.9 $145,200 $50,800 77
64 U.S. Decatur, AL 2.9 $137,100 $47,100
77
64 U.S. Elkhart, IN 2.9 $149,000 $50,600 77
64 U.S. Lexington, KY 2.9 $157,300 $54,200
77
64 U.S. Montgomery, AL 2.9 $133,700 $46,600 77
64 U.S. New London, CT 2.9 $191,600 $67,200
77 6 64 U.S. Oklahoma City, OK 2.9 $154,800 $53,300 77
64 U.S. Rochester, MN 2.9 $193,000 $67,000
77 6 64 U.S. Saint Louis, MO-IL 2.9 $170,000 $57,700 77
64 U.S. Sierra Vista, AZ 2.9 $128,000 $44,200
77
64 U.S. Sioux City, IA, NE, SD 2.9 $154,000 $53,800 77
64 U.S. Springfield, MO 2.9 $132,000 $45,700
13th Annual Demographia International Housing Affordability Survey (2016: 3rd Quarter) 50

SCHEDULE 3 ALL HOUSING MARKETS RANKED BY AFFORDABILITY: Most Affordable to Least Affordable
Median Multiple (Median House Price/Median Household Income): 2016 – 3rd Quarter Demographia International Housing Affordability Survey
International Affordability
Rank
Major Market Rank
National Rank Nation Housing market
Median Multiple* Median Price
Median Household
Income 77
8 Canada Sudbury, ON 2.9 $221,600 $77,100
77
64 U.S. York, PA 2.9 $170,900 $59,600 91 8 77 U.S. Detroit, MI 3.0 $163,500 $54,800 91 8 77 U.S. Grand Rapids, MI 3.0 $170,100 $56,600 91
77 U.S. Hagerstown, MD-WV 3.0 $167,300 $56,300
91 8 77 U.S. Indianapolis, IN 3.0 $164,100 $55,500 91 8 77 U.S. Kansas City, MO-KS 3.0 $188,000 $61,800 91
9 Canada Moose Jaw, SK 3.0 $187,700 $62,000
91
9 Canada Thunder Bay, ON 3.0 $207,500 $69,600 91
77 U.S. Tulsa, OK 3.0 $156,500 $52,400
99
83 U.S. Allentown, PA 3.1 $194,400 $62,000 99
83 U.S. Amarillo, TX 3.1 $161,700 $52,800
99 12 83 U.S. Atlanta, GA 3.1 $191,500 $61,500 99 12 83 U.S. Columbus, OH 3.1 $181,600 $59,400 99
83 U.S. Des Moines, IA 3.1 $193,100 $63,300
99
83 U.S. Glens Falls, NY 3.1 $172,300 $56,400 99
83 U.S. Huntsville, AL 3.1 $183,900 $59,000
99
83 U.S. Killeen , TX 3.1 $152,000 $49,600 99
83 U.S. Lancaster, PA 3.1 $185,000 $60,500
99
83 U.S. Mobile, AL 3.1 $135,400 $43,600 99
11 Canada North Bay, ON 3.1 $212,200 $68,200
99
83 U.S. Sioux Falls, SD 3.1 $192,300 $61,100 99
83 U.S. Yuma, AZ 3.1 $127,000 $41,400
112
95 U.S. Columbia, SC 3.2 $165,900 $52,500 112
95 U.S. Fairbanks, AK 3.2 $236,000 $74,500
112
95 U.S. Lincoln, NE 3.2 $174,500 $55,100 112 14 95 U.S. Louisville, KY-IN 3.2 $171,800 $54,000 116
99 U.S. Abilene, TX 3.3 $157,500 $48,400
116
99 U.S. Albany, NY 3.3 $212,100 $64,400 116
99 U.S. Charleston, WV 3.3 $141,700 $43,400
116
99 U.S. Greensboro, NC 3.3 $155,000 $46,700 116 15 99 U.S. Hartford, CT 3.3 $241,200 $73,800 116
99 U.S. McAllen, TX 3.3 $120,000 $36,500
116 15 99 U.S. Memphis, TN-MS-AR 3.3 $161,900 $49,600 116 15 99 U.S. Minneapolis-St. Paul, MN-WI 3.3 $240,300 $72,500 116
99 U.S. Ocala, FL 3.3 $135,000 $40,900
116
99 U.S. Ogden, UT 3.3 $220,000 $66,900 116
99 U.S. Pensacola, FL 3.3 $172,000 $51,600
116
99 U.S. Sherman, TX 3.3 $160,000 $49,100 116
99 U.S. Waco, TX 3.3 $154,000 $47,300
116
99 U.S. Winston-Salem, NC 3.3 $151,500 $46,100 130
113 U.S. Columbia, MO 3.4 $173,400 $51,600
130
113 U.S. Dover, DE 3.4 $200,000 $58,000 130
113 U.S. El Paso, TX 3.4 $151,200 $44,600
130
3 Ireland Galway 3.4 €170,000 €49,600 130
113 U.S. Kingston, NY 3.4 $205,200 $61,000
13th Annual Demographia International Housing Affordability Survey (2016: 3rd Quarter) 51

SCHEDULE 3 ALL HOUSING MARKETS RANKED BY AFFORDABILITY: Most Affordable to Least Affordable
Median Multiple (Median House Price/Median Household Income): 2016 – 3rd Quarter Demographia International Housing Affordability Survey
International Affordability
Rank
Major Market Rank
National Rank Nation Housing market
Median Multiple* Median Price
Median Household
Income 130
113 U.S. Knoxville, TN 3.4 $169,600 $49,400
130 18 1 Japan Osaka-Kobe-Kyoto* 3.4 ¥20,110,000 ¥5,920,000 130
113 U.S. Tyler, TX 3.4 $168,000 $50,100
138
119 U.S. Atlantic City, NJ 3.5 $195,200 $55,200 138
119 U.S. Baton Rouge, LA 3.5 $193,400 $55,900
138
119 U.S. Chattanooga, TN-GA 3.5 $170,100 $48,800 138
4 Ireland Cork 3.5 €185,000 €53,500
138
119 U.S. Fayetteville, AR-MO 3.5 $180,100 $51,900 138 19 119 U.S. Houston, TX 3.5 $217,400 $62,800 138
5 Australia Mackay, QLD 3.5 $319,800 $90,300
138
12 Canada Medicine Hat, AB 3.5 $246,900 $70,600 138 19 119 U.S. Philadelphia, PA-NJ-DE-MD 3.5 $234,800 $66,500 138
119 U.S. Spartanburg, SC 3.5 $155,900 $45,000
148 21 126 U.S. Baltimore, MD 3.6 $264,300 $74,100 148 21 126 U.S. Birmingham, AL 3.6 $187,300 $52,600 148
126 U.S. Charlottesville, VA 3.6 $235,000 $65,300
148
1 U.K. Falkirk 3.6 £115,500 £32,300 148
126 U.S. Fargo, ND-MN 3.6 $204,100 $57,200
148
126 U.S. Farmington, NM 3.6 $180,600 $50,700 148
126 U.S. Florence, SC 3.6 $138,800 $38,900
148
126 U.S. Kennewick, WA 3.6 $224,900 $62,700 148
126 U.S. Lake Havasu City, AZ 3.6 $151,000 $41,800
148
126 U.S. Manchester, NH 3.6 $271,500 $75,900 148
126 U.S. New Haven, CT 3.6 $229,600 $63,100
148
13 Canada Québec, QC 3.6 $234,100 $65,300 148
13 Canada Regina, SK 3.6 $284,800 $79,600
148 21 126 U.S. Virginia Beach-Norfolk, VA-NC 3.6 $220,000 $61,400 162
137 U.S. Albany, OR 3.7 $180,000 $48,500
162
137 U.S. Anchorage, AK 3.7 $293,000 $79,900 162
137 U.S. Brownsville, TX 3.7 $129,000 $34,800
162
137 U.S. Corpus Christi, TX 3.7 $189,800 $51,300 162 24 137 U.S. Dallas-Fort Worth, TX 3.7 $230,500 $63,000 162
137 U.S. Ithaca, NY 3.7 $219,000 $59,300
162
137 U.S. Jackson, MS 3.7 $176,500 $47,700 162
137 U.S. Lakeland, FL 3.7 $167,000 $45,000
162
15 Canada Lethbridge, AB 3.7 $262,400 $70,200 162 24 137 U.S. Raleigh, NC 3.7 $250,200 $67,200 162
15 Canada Red Deer, AB 3.7 $292,800 $80,200
162
137 U.S. Trenton, NJ 3.7 $276,900 $74,000 162
15 Canada Winnipeg, MB 3.7 $257,400 $69,800
162
137 U.S. Worcester, MA 3.7 $249,600 $66,800 176
148 U.S. Bismarck, ND 3.8 $251,000 $66,600
176 26 148 U.S. Chicago, IL 3.8 $244,100 $64,500 176
148 U.S. Fayetteville, NC 3.8 $162,100 $42,800
176
148 U.S. Great Falls, MT 3.8 $177,000 $46,600 176
148 U.S. Laredo, TX 3.8 $155,000 $40,600
13th Annual Demographia International Housing Affordability Survey (2016: 3rd Quarter) 52

SCHEDULE 3 ALL HOUSING MARKETS RANKED BY AFFORDABILITY: Most Affordable to Least Affordable
Median Multiple (Median House Price/Median Household Income): 2016 – 3rd Quarter Demographia International Housing Affordability Survey
International Affordability
Rank
Major Market Rank
National Rank Nation Housing market
Median Multiple* Median Price
Median Household
Income 176 26 2 U.K. Leeds & West Yorkshire 3.8 £145,000 £37,900 176
18 Canada London, ON 3.8 $249,400 $66,400
176
148 U.S. Midland, TX 3.8 $229,000 $60,500 176
148 U.S. Palm Bay, FL 3.8 $197,000 $51,500
176
148 U.S. Salisbury, MD 3.8 $209,000 $55,400 176 26 148 U.S. San Antonio, TX 3.8 $212,300 $56,300 176
148 U.S. Shreveport, LA 3.8 $170,000 $44,200
176
148 U.S. Springfield, MA 3.8 $209,700 $54,500 176
18 Canada St. John's, NL 3.8 $274,900 $72,900
190
159 U.S. Albuquerque, NM 3.9 $193,800 $50,000 190
159 U.S. Ann Arbor, MI 3.9 $247,100 $63,300
190
159 U.S. Boise, ID 3.9 $209,000 $53,000 190 29 159 U.S. Charlotte, NC-SC 3.9 $215,900 $56,000 190
159 U.S. Greenville, SC 3.9 $191,900 $49,200
190
20 Canada Halifax, NS 3.9 $270,000 $68,700 190
20 Canada Kingston, ON 3.9 $272,900 $69,800
190
159 U.S. Madison, WI 3.9 $254,700 $65,500 190 29 159 U.S. Nashville, TN 3.9 $230,000 $59,200 190 29 159 U.S. New Orleans, LA 3.9 $191,300 $49,400 190 29 20 Canada Ottawa-Gatineau, ON-QC 3.9 $315,300 $81,800 190
6 Australia Port Augusta, SA 3.9 $225,000 $58,200
190 29 159 U.S. Richmond, VA 3.9 $239,800 $62,000 190
20 Canada St. Catharine’s-Niagara, ON 3.9 $242,500 $62,900
204
3 U.K. Belfast 4.0 £133,600 £33,800 204
7 Australia Bunbury, WA 4.0 $340,000 $84,300
204
168 U.S. Daytona Beach, FL 4.0 $175,000 $44,200 204
168 U.S. Gainesville, FL 4.0 $193,300 $47,900
204 34 3 U.K. Glasgow 4.0 £131,800 £32,600 204 34 168 U.S. Jacksonville, FL 4.0 $219,000 $54,300 204
168 U.S. Panama City, FL 4.0 $195,000 $49,100
204
168 U.S. Pittsfield, MA 4.0 $207,800 $51,800 204 34 168 U.S. Salt Lake City, UT 4.0 $271,800 $67,200 204 34 168 U.S. Tucson, AZ 4.0 $193,300 $48,100 204
168 U.S. Vero Beach, FL 4.0 $200,000 $50,400
204
168 U.S. Yakima, WA 4.0 $192,200 $48,200 216 38 177 U.S. Austin, TX 4.1 $284,000 $68,600 216
177 U.S. Bakersfield, CA 4.1 $215,000 $52,400
216 38 5 U.K. Blackpool & Lancashire 4.1 £131,100 £32,100 216
177 U.S. Bremerton, WA 4.1 $275,000 $67,500
216 38 5 U.K. Derby & Derbyshire 4.1 £150,000 £36,300 216
5 U.K. Dundee 4.1 £133,300 £32,700
216 38 24 Canada Edmonton, AB 4.1 $356,000 $87,000 216
177 U.S. Greeley, CO 4.1 $294,000 $71,700
216
24 Canada Kitchener, ON 4.1 $333,400 $82,100 216 38 5 U.K. Middlesbrough & Durham 4.1 £117,300 £28,400 216 38 177 U.S. Milwaukee, WI 4.1 $238,000 $57,400
13th Annual Demographia International Housing Affordability Survey (2016: 3rd Quarter) 53

SCHEDULE 3 ALL HOUSING MARKETS RANKED BY AFFORDABILITY: Most Affordable to Least Affordable
Median Multiple (Median House Price/Median Household Income): 2016 – 3rd Quarter Demographia International Housing Affordability Survey
International Affordability
Rank
Major Market Rank
National Rank Nation Housing market
Median Multiple* Median Price
Median Household
Income 216
8 Australia Murray Bridge, SA 4.1 $239,500 $58,800
216
177 U.S. Myrtle Beach, SC 4.1 $198,000 $48,400 216
177 U.S. Olympia, WA 4.1 $259,000 $63,500
216 38 177 U.S. Phoenix, AZ 4.1 $235,300 $56,700 216
177 U.S. Portland, ME 4.1 $260,800 $63,400
216
177 U.S. Provo, UT 4.1 $273,000 $66,500 216
177 U.S. Punta Gorda, FL 4.1 $189,300 $46,500
216
8 Australia Rockhampton, QLD 4.1 $287,000 $69,700 216 38 177 U.S. Tampa-St. Petersburg, FL 4.1 $205,000 $49,900 216
8 Australia Townsville, QLD 4.1 $330,000 $79,900
216 38 177 U.S. Washington, DC-VA-MD-WV 4.1 $393,500 $95,300 216
8 Australia Whyalla, SA 4.1 $227,000 $55,700
239
190 U.S. Hanford, CA 4.2 $197,000 $46,700 239
12 Australia Latrobe, VIC 4.2 $233,000 $55,300
239
190 U.S. Port St. Lucie, FL 4.2 $205,000 $49,000 239
26 Canada Sherbrooke, QC 4.2 $223,500 $52,800
239
190 U.S. St. George, UT 4.2 $236,000 $56,100 239
190 U.S. Wilmington, NC 4.2 $226,700 $53,800
245
13 Australia Alice Springs, NT 4.3 $459,000 $107,700 245
194 U.S. Burlington, VT 4.3 $296,000 $68,200
245
194 U.S. College Station, TX 4.3 $205,000 $47,300 245
194 U.S. Colorado Springs, CO 4.3 $264,700 $61,700
245 47 9 U.K. Hull & Humber 4.3 £145,000 £33,900 245 47 9 U.K. Newcastle & Tyneside 4.3 £133,000 £30,700 245 47 9 U.K. Nottingham & Nottinghamshire 4.3 £149,500 £34,400 245 47 9 U.K. Sheffield & South Yorkshire 4.3 £128,000 £30,000 245
194 U.S. Tallahassee, FL 4.3 $193,900 $45,200
254
198 U.S. Bridgeport, CT 4.4 $387,100 $88,200 254
198 U.S. Cape Coral, FL 4.4 $225,000 $51,700
254
198 U.S. Charleston, SC 4.4 $252,800 $57,600 254
198 U.S. Durham, NC 4.4 $244,400 $55,300
254 51 13 U.K. Edinburgh 4.4 £169,100 £38,700 254
198 U.S. Hilton Head, SC 4.4 $251,000 $57,100
254
14 Australia Mount Gambier, SA 4.4 $244,300 $55,400 254
198 U.S. Mount Vernon, WA 4.4 $259,000 $58,300
254 51 198 U.S. Orlando, FL 4.4 $229,900 $52,200 254
198 U.S. Spokane, WA 4.4 $214,400 $48,600
264
206 U.S. Fresno, CA 4.5 $215,000 $47,900 264 53 206 U.S. Las Vegas, NV 4.5 $236,400 $52,600 264 53 14 U.K. Manchester & Greater Manchester 4.5 £145,000 £32,500 264
14 U.K. Perth 4.5 £166,500 £37,400
264 53 206 U.S. Providence, RI-MA 4.5 $273,700 $60,200 264
206 U.S. Salem, OR 4.5 $240,700 $53,600
264
27 Canada Saskatoon, SK 4.5 $345,000 $77,000 264
206 U.S. The Villages, FL 4.5 $235,000 $52,400
272
16 U.K. Aberdeen 4.6 £182,500 £40,100
13th Annual Demographia International Housing Affordability Survey (2016: 3rd Quarter) 54

SCHEDULE 3 ALL HOUSING MARKETS RANKED BY AFFORDABILITY: Most Affordable to Least Affordable
Median Multiple (Median House Price/Median Household Income): 2016 – 3rd Quarter Demographia International Housing Affordability Survey
International Affordability
Rank
Major Market Rank
National Rank Nation Housing market
Median Multiple* Median Price
Median Household
Income 272 56 28 Canada Calgary, AB 4.6 $427,700 $93,100 272
16 U.K. Newport 4.6 £158,000 £34,200
275 57 5 Ireland Dublin 4.7 €276,000 €58,400 275
211 U.S. El Centro, CA 4.7 $196,000 $41,700
275
211 U.S. Fort Walton Beach, FL 4.7 $254,500 $54,600 275
15 Australia Geraldton, WA 4.7 $345,000 $73,700
275
29 Canada Guelph, ON 4.7 $400,300 $85,300 275
1 N.Z. Palmerston North-Manawatu 4.7 $255,800 $54,900
275
211 U.S. Prescott, AZ 4.7 $230,000 $49,100 275
211 U.S. Sarasota, FL 4.7 $259,000 $54,800
275
15 Australia Shepparton, VIC 4.7 $268,000 $56,800 275 57 2 Japan Tokyo-Yokohama* 4.7 ¥31,620,000 ¥6,760,000 285 59 18 U.K. Birmingham & West Midlands 4.8 £154,000 £32,400 285
17 Australia Darwin, NT 4.8 $550,000 $114,900
285 59 30 Canada Montréal, QC 4.8 $284,700 $59,500 285 59 1 Singapore Singapore 4.8 $412,500 $85,400 285 59 18 U.K. Stoke on Trent & Staffordshire 4.8 £154,500 £31,900 285
215 U.S. Visalia, CA 4.8 $210,000 $43,300
285
215 U.S. Yuba City, CA 4.8 $250,000 $52,300 292
217 U.S. Asheville, NC 4.9 $226,000 $45,800
292
31 Canada Brantford, ON 4.9 $332,000 $67,700 292
18 Australia Devonport, TAS 4.9 $240,000 $48,500
292
217 U.S. Flagstaff, AZ 4.9 $265,000 $54,300 292
18 Australia Orange, NSW 4.9 $347,000 $70,600
292
217 U.S. Santa Fe, NM 4.9 $281,000 $56,900 292
20 U.K. Swansea 4.9 £127,000 £25,900
292
18 Australia Wagga Wagga, NSW 4.9 $340,000 $69,400 300
32 Canada Barrie, ON 5.0 $401,900 $80,300
300
220 U.S. Bellingham, WA 5.0 $280,000 $56,200 300
21 U.K. Cardiff 5.0 £152,000 £30,300
300
220 U.S. Eugene, OR 5.0 $240,100 $48,300 300 63 21 U.K. Leicester & Leicestershire 5.0 £175,000 £35,200 300
220 U.S. Madera, CA 5.0 $240,000 $48,200
300
220 U.S. Merced, CA 5.0 $214,000 $42,900 300
21 Australia Mildura, VIC 5.0 $257,000 $51,800
300
220 U.S. Modesto, CA 5.0 $270,000 $53,500 300
220 U.S. Ocean City, NJ 5.0 $290,000 $58,300
300
32 Canada Peterborough, ON 5.0 $331,300 $66,200 300
220 U.S. Redding, CA 5.0 $239,000 $47,700
312
22 Australia Albury-Wodonga, NSW-VIC 5.1 $310,800 $61,000 312
227 U.S. Fort Collins, CO 5.1 $335,000 $66,300
312
22 Australia Launceston, TAS 5.1 $280,000 $54,800 312 64 23 U.K. Liverpool & Merseyside 5.1 £137,500 £27,200 312
23 U.K. Northampton & Northamptonshire 5.1 £190,000 £37,400
312
34 Canada Oshawa, ON 5.1 $469,700 $91,700 312 64 227 U.S. Sacramento, CA 5.1 $327,000 $64,100
13th Annual Demographia International Housing Affordability Survey (2016: 3rd Quarter) 55

SCHEDULE 3 ALL HOUSING MARKETS RANKED BY AFFORDABILITY: Most Affordable to Least Affordable
Median Multiple (Median House Price/Median Household Income): 2016 – 3rd Quarter Demographia International Housing Affordability Survey
International Affordability
Rank
Major Market Rank
National Rank Nation Housing market
Median Multiple* Median Price
Median Household
Income 312 64 23 U.K. Warrington & Cheshire 5.1 £185,000 £36,200 320
229 U.S. Hilo, HI 5.2 $316,200 $61,300
321
230 U.S. Bend, OR 5.3 $310,000 $58,600 321
24 Australia Dubbo, NSW 5.3 $345,000 $65,600
323 67 231 U.S. Boston, MA-NH 5.4 $435,300 $80,500 323 67 231 U.S. Denver, CO 5.4 $386,800 $71,800 323
2 N.Z. Dunedin 5.4 $322,000 $59,700
323
231 U.S. Reno, NV 5.4 $314,400 $57,800 323
25 Australia Warrnambul, VIC 5.4 $325,000 $60,300
328
26 Australia Ballarat, VIC 5.5 $320,000 $58,000 328
26 Australia Bathurst, NSW 5.5 $381,000 $69,100
328
234 U.S. Carson City, NV 5.5 $239,000 $43,100 328
26 Australia Hobart, TAS 5.5 $338,700 $61,200
328
234 U.S. Medford, OR 5.5 $246,000 $44,900 328 69 234 U.S. Portland, OR-WA 5.5 $358,500 $65,200 328 69 234 U.S. Seattle, WA 5.5 $422,100 $76,900 328
26 Australia Tamworth, NSW 5.5 $325,000 $59,500
328
26 Australia Toowoomba, QLD 5.5 $330,000 $60,100 337
238 U.S. Barnstable Town, MA 5.6 $375,200 $67,500
337
31 Australia Bundaberg, QLD 5.6 $270,800 $48,200 337
238 U.S. Corvallis, OR 5.6 $300,000 $54,000
337 71 238 U.S. Riverside-San Bernardino, CA 5.6 $319,000 $57,300 337
26 U.K. Warwickshire 5.6 £226,500 £40,800
342
32 Australia Baw Baw, VIC 5.7 $340,000 $59,700 342
32 Australia Bendigo, VIC 5.7 $335,000 $58,300
342
35 Canada Hamilton, ON 5.7 $426,200 $74,400 342
3 N.Z. Napier-Hastings 5.7 $340,500 $59,300
342 72 241 U.S. New York, NY-NJ-PA 5.7 $397,600 $70,200 342
241 U.S. Vallejo, CA 5.7 $389,500 $68,900
348
27 U.K. Telford & Shropshire 5.8 £183,000 £31,500 348
4 N.Z. Wellington 5.8 $463,700 $79,600
350
34 Australia Cairns, QLD 5.9 $395,000 $66,500 350
243 U.S. Chico, CA 5.9 $275,000 $46,600
350
5 N.Z. Christchurch 5.9 $435,300 $73,900 350
243 U.S. Stockton, CA 5.9 $322,000 $54,800
354 73 245 U.S. Miami, FL 6.1 $315,000 $51,500 354 73 35 Australia Perth, WA 6.1 $528,300 $87,300 356 75 36 Australia Brisbane, QLD 6.2 $495,000 $79,400 356 75 28 U.K. Bristol-Bath 6.2 £255,000 £41,200 356
36 Australia Canberra, ACT 6.2 $661,900 $106,400
356
6 N.Z. Hamilton-Waikato 6.2 $444,900 $72,100 356
246 U.S. Naples, FL 6.2 $395,000 $63,400
361
36 Canada Kelowna, BC 6.4 $450,600 $70,100 361
38 Australia Lismore, NSW 6.4 $335,000 $52,500
363 77 39 Australia Adelaide, SA 6.6 $435,000 $66,000 363
39 Australia Albany, WA 6.6 $393,000 $59,500
13th Annual Demographia International Housing Affordability Survey (2016: 3rd Quarter) 56

SCHEDULE 3 ALL HOUSING MARKETS RANKED BY AFFORDABILITY: Most Affordable to Least Affordable
Median Multiple (Median House Price/Median Household Income): 2016 – 3rd Quarter Demographia International Housing Affordability Survey
International Affordability
Rank
Major Market Rank
National Rank Nation Housing market
Median Multiple* Median Price
Median Household
Income 363
39 Australia Newcastle-Maitland, NSW 6.6 $463,900 $70,800
366
42 Australia Fraser Coast, QLD 6.7 $300,000 $44,600 367
43 Australia Mandurah, WA 6.8 $402,000 $59,400
368
29 U.K. Swindon & Wiltshire 6.9 £230,000 £33,200 369
247 U.S. Boulder, CO 7.0 $515,200 $73,500
369
247 U.S. Eureka, CA 7.0 $290,000 $41,300 369
37 Canada Fraser Valley 7.0 $545,400 $78,200
372
249 U.S. Kahului (Maui), HI 7.1 $510,000 $72,000 372 78 30 U.K. London Exurbs (E & SE England) 7.1 £285,000 £40,400 372 78 30 U.K. Plymouth & Devon 7.1 £215,000 £30,400 375
44 Australia Geelong, VIC 7.2 $440,000 $61,500
376
250 U.S. Kapaa (Maui), HI 7.3 $577,800 $78,800 377
45 Australia Hawksbury, NSW 7.4 $620,000 $84,200
378
251 U.S. Oxnard, CA 7.7 $629,400 $81,700 378 80 38 Canada Toronto, ON 7.7 $615,800 $79,700 380
46 Australia Coff's Harbour, NSW 7.9 $430,000 $54,600
381
39 Canada Victoria, BC 8.1 $542,400 $67,300 382
252 U.S. Napa, CA 8.4 $650,000 $77,100
383 81 32 U.K. London (Greater London Authority) 8.5 £440,000 £51,800 384 82 253 U.S. San Diego, CA 8.6 $589,300 $68,700 385
254 U.S. Santa Rosa, CA 8.7 $590,000 $68,100
386 83 33 U.K. Bournemouth & Dorset 8.9 £265,000 £29,900 386
47 Australia Wollongong, NSW 8.9 $601,800 $67,700
388
48 Australia Gold Coast, QLD 9.0 $579,000 $64,300 388
48 Australia Port Macquarie, NSW 9.0 $459,000 $50,900
388
255 U.S. San Luis Obispo, CA 9.0 $574,800 $64,000 388
48 Australia Sunshine Coast, QLD 9.0 $520,000 $57,800
392
256 U.S. Salinas-Monterey, CA 9.2 $566,500 $61,800 392 84 256 U.S. San Francisco, CA 9.2 $835,400 $90,400 394 85 258 U.S. Los Angeles, CA 9.3 $593,900 $63,900 395 86 259 U.S. Honolulu, HI 9.4 $745,300 $78,900 396 87 51 Australia Melbourne, VIC 9.5 $740,000 $78,200 397 88 260 U.S. San Jose, CA 9.6 $1,000,000 $104,100 398
7 N.Z. Tauranga-Western Bay of Plenty 9.7 $591,900 $61,200
398
52 Australia Tweed Heads, NSW 9.7 $490,000 $50,300 400
53 Australia Wingcaribbee, NSW 9.8 $650,000 $66,500
401 89 8 N.Z. Auckland 10.0 $830,800 $83,000 402
261 U.S. Santa Barbara, CA 11.3 $732,500 $65,000
403
262 U.S. Santa Cruz, CA 11.6 $774,500 $66,500 404 90 40 Canada Vancouver, BC 11.8 $830,100 $70,500 405 91 54 Australia Sydney, NSW 12.2 $1,077,000 $88,000 406 92 1 China Hong Kong 18.1 $5,422,000 $300,000
Financial data in local currency. *Average Multiple (Japan)
13th Annual Demographia International Housing Affordability Survey (2016: 3rd Quarter) 57

SCHEDULE 4 ALL HOUSING MARKETS BY GEOGRAPHY
Median Multiple (Median House Price/Median Household Income): 2016 – 3rd Quarter Demographia International Housing Affordability Survey
International Affordability
Rank
Major Market Rank
National Rank Nation Housing market
Median Multiple* Median Price
Median Household
Income 363 77 39 Australia Adelaide, SA 6.6 $435,000 $66,000 363
39 Australia Albany, WA 6.6 $393,000 $59,500
312
22 Australia Albury-Wodonga, NSW-VIC 5.1 $310,800 $61,000 245
13 Australia Alice Springs, NT 4.3 $459,000 $107,700
328
26 Australia Ballarat, VIC 5.5 $320,000 $58,000 328
26 Australia Bathurst, NSW 5.5 $381,000 $69,100
342
32 Australia Baw Baw, VIC 5.7 $340,000 $59,700 342
32 Australia Bendigo, VIC 5.7 $335,000 $58,300
356 75 36 Australia Brisbane, QLD 6.2 $495,000 $79,400 204
7 Australia Bunbury, WA 4.0 $340,000 $84,300
337
31 Australia Bundaberg, QLD 5.6 $270,800 $48,200 350
34 Australia Cairns, QLD 5.9 $395,000 $66,500
356
36 Australia Canberra, ACT 6.2 $661,900 $106,400 380
46 Australia Coff's Harbour, NSW 7.9 $430,000 $54,600
285
17 Australia Darwin, NT 4.8 $550,000 $114,900 292
18 Australia Devonport, TAS 4.9 $240,000 $48,500
321
24 Australia Dubbo, NSW 5.3 $345,000 $65,600 366
42 Australia Fraser Coast, QLD 6.7 $300,000 $44,600
375
44 Australia Geelong, VIC 7.2 $440,000 $61,500 275
15 Australia Geraldton, WA 4.7 $345,000 $73,700
64
4 Australia Gladstone, QLD 2.8 $275,000 $98,600 388
48 Australia Gold Coast, QLD 9.0 $579,000 $64,300
377
45 Australia Hawksbury, NSW 7.4 $620,000 $84,200 328
26 Australia Hobart, TAS 5.5 $338,700 $61,200
45
3 Australia Kalgoorlie, WA 2.6 $312,000 $118,100 5
1 Australia Karratha, WA 2.1 $363,000 $171,900
239
12 Australia Latrobe, VIC 4.2 $233,000 $55,300 312
22 Australia Launceston, TAS 5.1 $280,000 $54,800
361
38 Australia Lismore, NSW 6.4 $335,000 $52,500 138
5 Australia Mackay, QLD 3.5 $319,800 $90,300
367
43 Australia Mandurah, WA 6.8 $402,000 $59,400 396 87 51 Australia Melbourne, VIC 9.5 $740,000 $78,200 300
21 Australia Mildura, VIC 5.0 $257,000 $51,800
254
14 Australia Mount Gambier, SA 4.4 $244,300 $55,400 216
8 Australia Murray Bridge, SA 4.1 $239,500 $58,800
363
39 Australia Newcastle-Maitland, NSW 6.6 $463,900 $70,800 292
18 Australia Orange, NSW 4.9 $347,000 $70,600
354 73 35 Australia Perth, WA 6.1 $528,300 $87,300 190
6 Australia Port Augusta, SA 3.9 $225,000 $58,200
18
2 Australia Port Hedland, WA 2.3 $390,000 $168,700 388
48 Australia Port Macquarie, NSW 9.0 $459,000 $50,900
216
8 Australia Rockhampton, QLD 4.1 $287,000 $69,700 275
15 Australia Shepparton, VIC 4.7 $268,000 $56,800
388
48 Australia Sunshine Coast, QLD 9.0 $520,000 $57,800 405 91 54 Australia Sydney, NSW 12.2 $1,077,000 $88,000 328
26 Australia Tamworth, NSW 5.5 $325,000 $59,500
13th Annual Demographia International Housing Affordability Survey (2016: 3rd Quarter) 58

SCHEDULE 4 ALL HOUSING MARKETS BY GEOGRAPHY
Median Multiple (Median House Price/Median Household Income): 2016 – 3rd Quarter Demographia International Housing Affordability Survey
International Affordability
Rank
Major Market Rank
National Rank Nation Housing market
Median Multiple* Median Price
Median Household
Income 328
26 Australia Toowoomba, QLD 5.5 $330,000 $60,100
216
8 Australia Townsville, QLD 4.1 $330,000 $79,900 398
52 Australia Tweed Heads, NSW 9.7 $490,000 $50,300
292
18 Australia Wagga Wagga, NSW 4.9 $340,000 $69,400 323
25 Australia Warrnambul, VIC 5.4 $325,000 $60,300
216
8 Australia Whyalla, SA 4.1 $227,000 $55,700 400
53 Australia Wingcaribbee, NSW 9.8 $650,000 $66,500
386
47 Australia Wollongong, NSW 8.9 $601,800 $67,700
Median Market 5.5
filler 300
32 Canada Barrie, ON 5.0 $401,900 $80,300
292
31 Canada Brantford, ON 4.9 $332,000 $67,700 272 56 28 Canada Calgary, AB 4.6 $427,700 $93,100 45
5 Canada Charlottetown, PEI 2.6 $174,700 $67,500
216 38 24 Canada Edmonton, AB 4.1 $356,000 $87,000 369
37 Canada Fraser Valley 7.0 $545,400 $78,200
15
2 Canada Fredericton, NB 2.2 $151,000 $68,800 275
29 Canada Guelph, ON 4.7 $400,300 $85,300
190
20 Canada Halifax, NS 3.9 $270,000 $68,700 342
35 Canada Hamilton, ON 5.7 $426,200 $74,400
361
36 Canada Kelowna, BC 6.4 $450,600 $70,100 190
20 Canada Kingston, ON 3.9 $272,900 $69,800
216
24 Canada Kitchener, ON 4.1 $333,400 $82,100 162
15 Canada Lethbridge, AB 3.7 $262,400 $70,200
176
18 Canada London, ON 3.8 $249,400 $66,400 138
12 Canada Medicine Hat, AB 3.5 $246,900 $70,600
5
1 Canada Moncton, NB 2.1 $134,900 $65,200 285 59 30 Canada Montréal, QC 4.8 $284,700 $59,500 91
9 Canada Moose Jaw, SK 3.0 $187,700 $62,000
99
11 Canada North Bay, ON 3.1 $212,200 $68,200 312
34 Canada Oshawa, ON 5.1 $469,700 $91,700
190 29 20 Canada Ottawa-Gatineau, ON-QC 3.9 $315,300 $81,800 300
32 Canada Peterborough, ON 5.0 $331,300 $66,200
148
13 Canada Québec, QC 3.6 $234,100 $65,300 162
15 Canada Red Deer, AB 3.7 $292,800 $80,200
148
13 Canada Regina, SK 3.6 $284,800 $79,600 33
4 Canada Saguenay, QC 2.5 $170,000 $66,700
24
3 Canada Saint John, NB 2.4 $161,900 $68,000 264
27 Canada Saskatoon, SK 4.5 $345,000 $77,000
239
26 Canada Sherbrooke, QC 4.2 $223,500 $52,800 190
20 Canada St. Catharine’s-Niagara, ON 3.9 $242,500 $62,900
176
18 Canada St. John's, NL 3.8 $274,900 $72,900 77
8 Canada Sudbury, ON 2.9 $221,600 $77,100
91
9 Canada Thunder Bay, ON 3.0 $207,500 $69,600 378 80 38 Canada Toronto, ON 7.7 $615,800 $79,700 45
5 Canada Trois-Rivières, QC 2.6 $148,300 $56,400
13th Annual Demographia International Housing Affordability Survey (2016: 3rd Quarter) 59

SCHEDULE 4 ALL HOUSING MARKETS BY GEOGRAPHY
Median Multiple (Median House Price/Median Household Income): 2016 – 3rd Quarter Demographia International Housing Affordability Survey
International Affordability
Rank
Major Market Rank
National Rank Nation Housing market
Median Multiple* Median Price
Median Household
Income 404 90 40 Canada Vancouver, BC 11.8 $830,100 $70,500 381
39 Canada Victoria, BC 8.1 $542,400 $67,300
55
7 Canada Windsor, ON 2.7 $187,100 $68,800 162
15 Canada Winnipeg, MB 3.7 $257,400 $69,800
Median Market 3.9
filler 406 92 1 China Hong Kong 18.1 $5,422,000 $300,000
filler
138
4 Ireland Cork 3.5 €185,000 €53,500 275 57 5 Ireland Dublin 4.7 €276,000 €58,400 130
3 Ireland Galway 3.4 €170,000 €49,600
18
1 Ireland Limerick 2.3 €128,300 €55,900 45
2 Ireland Waterford 2.6 €125,000 €48,100
Median Market 3.4
filler 275 57 2 Japan Tokyo-Yokohama* 4.7 ¥31,620,000 ¥6,760,000
130 18 1 Japan Osaka-Kobe-Kyoto* 3.4 ¥20,110,000 ¥5,920,000
Median Market* 4.1
filler 401 89 8 N.Z. Auckland 10.0 $830,800 $83,000
350
5 N.Z. Christchurch 5.9 $435,300 $73,900 323
2 N.Z. Dunedin 5.4 $322,000 $59,700
356
6 N.Z. Hamilton-Waikato 6.2 $444,900 $72,100 342
3 N.Z. Napier-Hastings 5.7 $340,500 $59,300
275
1 N.Z. Palmerston North-Manawatu 4.7 $255,800 $54,900 398
7 N.Z. Tauranga-Western Bay of Plenty 9.7 $591,900 $61,200
348
4 N.Z. Wellington 5.8 $463,700 $79,600
Median Market 5.9
filler 285 59 1 Singapore Singapore 4.8 $412,500 $85,400
filler
272
16 U.K. Aberdeen 4.6 £182,500 £40,100 204
3 U.K. Belfast 4.0 £133,600 £33,800
285 59 18 U.K. Birmingham & West Midlands 4.8 £154,000 £32,400 216 38 5 U.K. Blackpool & Lancashire 4.1 £131,100 £32,100 386 83 33 U.K. Bournemouth & Dorset 8.9 £265,000 £29,900 356 75 28 U.K. Bristol-Bath 6.2 £255,000 £41,200 300
21 U.K. Cardiff 5.0 £152,000 £30,300
216 38 5 U.K. Derby & Derbyshire 4.1 £150,000 £36,300 216
5 U.K. Dundee 4.1 £133,300 £32,700
254 51 13 U.K. Edinburgh 4.4 £169,100 £38,700 148
1 U.K. Falkirk 3.6 £115,500 £32,300
204 34 3 U.K. Glasgow 4.0 £131,800 £32,600 245 47 9 U.K. Hull & Humber 4.3 £145,000 £33,900 176 26 2 U.K. Leeds & West Yorkshire 3.8 £145,000 £37,900 300 63 21 U.K. Leicester & Leicestershire 5.0 £175,000 £35,200
13th Annual Demographia International Housing Affordability Survey (2016: 3rd Quarter) 60

SCHEDULE 4 ALL HOUSING MARKETS BY GEOGRAPHY
Median Multiple (Median House Price/Median Household Income): 2016 – 3rd Quarter Demographia International Housing Affordability Survey
International Affordability
Rank
Major Market Rank
National Rank Nation Housing market
Median Multiple* Median Price
Median Household
Income 312 64 23 U.K. Liverpool & Merseyside 5.1 £137,500 £27,200 383 81 32 U.K. London (Greater London Authority) 8.5 £440,000 £51,800 372 78 30 U.K. London Exurbs (E & SE England) 7.1 £285,000 £40,400 264 53 14 U.K. Manchester & Greater Manchester 4.5 £145,000 £32,500 216 38 5 U.K. Middlesbrough & Durham 4.1 £117,300 £28,400 245 47 9 U.K. Newcastle & Tyneside 4.3 £133,000 £30,700 272
16 U.K. Newport 4.6 £158,000 £34,200
312
23 U.K. Northampton & Northamptonshire 5.1 £190,000 £37,400 245 47 9 U.K. Nottingham & Nottinghamshire 4.3 £149,500 £34,400 264
14 U.K. Perth 4.5 £166,500 £37,400
372 78 30 U.K. Plymouth & Devon 7.1 £215,000 £30,400 245 47 9 U.K. Sheffield & South Yorkshire 4.3 £128,000 £30,000 285 59 18 U.K. Stoke on Trent & Staffordshire 4.8 £154,500 £31,900 292
20 U.K. Swansea 4.9 £127,000 £25,900
368
29 U.K. Swindon & Wiltshire 6.9 £230,000 £33,200 348
27 U.K. Telford & Shropshire 5.8 £183,000 £31,500
312 64 23 U.K. Warrington & Cheshire 5.1 £185,000 £36,200 337
26 U.K. Warwickshire 5.6 £226,500 £40,800
Median Market 4.6
filler 116
99 U.S. Abilene, TX 3.3 $157,500 $48,400
33
27 U.S. Akron, OH 2.5 $131,500 $52,700 116
99 U.S. Albany, NY 3.3 $212,100 $64,400
162
137 U.S. Albany, OR 3.7 $180,000 $48,500 190
159 U.S. Albuquerque, NM 3.9 $193,800 $50,000
99
83 U.S. Allentown, PA 3.1 $194,400 $62,000 99
83 U.S. Amarillo, TX 3.1 $161,700 $52,800
162
137 U.S. Anchorage, AK 3.7 $293,000 $79,900 190
159 U.S. Ann Arbor, MI 3.9 $247,100 $63,300
33
27 U.S. Appleton, WI 2.5 $156,900 $62,500 292
217 U.S. Asheville, NC 4.9 $226,000 $45,800
99 12 83 U.S. Atlanta, GA 3.1 $191,500 $61,500 138
119 U.S. Atlantic City, NJ 3.5 $195,200 $55,200
216 38 177 U.S. Austin, TX 4.1 $284,000 $68,600 216
177 U.S. Bakersfield, CA 4.1 $215,000 $52,400
148 21 126 U.S. Baltimore, MD 3.6 $264,300 $74,100 337
238 U.S. Barnstable Town, MA 5.6 $375,200 $67,500
138
119 U.S. Baton Rouge, LA 3.5 $193,400 $55,900 45
38 U.S. Battle Creek, MI 2.6 $116,000 $44,000
2
2 U.S. Bay City, MI 1.9 $91,000 $47,500 77
64 U.S. Beaumont, TX 2.9 $145,200 $50,800
300
220 U.S. Bellingham, WA 5.0 $280,000 $56,200 321
230 U.S. Bend, OR 5.3 $310,000 $58,600
15
13 U.S. Binghamton, NY 2.2 $111,900 $50,400 148 21 126 U.S. Birmingham, AL 3.6 $187,300 $52,600 176
148 U.S. Bismarck, ND 3.8 $251,000 $66,600
13th Annual Demographia International Housing Affordability Survey (2016: 3rd Quarter) 61

SCHEDULE 4 ALL HOUSING MARKETS BY GEOGRAPHY
Median Multiple (Median House Price/Median Household Income): 2016 – 3rd Quarter Demographia International Housing Affordability Survey
International Affordability
Rank
Major Market Rank
National Rank Nation Housing market
Median Multiple* Median Price
Median Household
Income 24
19 U.S. Bloomington, IL 2.4 $158,300 $65,200
190
159 U.S. Boise, ID 3.9 $209,000 $53,000 323 67 231 U.S. Boston, MA-NH 5.4 $435,300 $80,500 369
247 U.S. Boulder, CO 7.0 $515,200 $73,500
216
177 U.S. Bremerton, WA 4.1 $275,000 $67,500 254
198 U.S. Bridgeport, CT 4.4 $387,100 $88,200
162
137 U.S. Brownsville, TX 3.7 $129,000 $34,800 45 2 38 U.S. Buffalo, NY 2.6 $138,900 $52,900
245
194 U.S. Burlington, VT 4.3 $296,000 $68,200 33
27 U.S. Canton, OH 2.5 $125,000 $50,400
254
198 U.S. Cape Coral, FL 4.4 $225,000 $51,700 33
27 U.S. Carbondale, IL 2.5 $110,000 $43,200
328
234 U.S. Carson City, NV 5.5 $239,000 $43,100 64
52 U.S. Cedar Rapids, IA 2.8 $166,700 $59,200
64
52 U.S. Champaign, IL 2.8 $146,700 $52,700 254
198 U.S. Charleston, SC 4.4 $252,800 $57,600
116
99 U.S. Charleston, WV 3.3 $141,700 $43,400 190 29 159 U.S. Charlotte, NC-SC 3.9 $215,900 $56,000 148
126 U.S. Charlottesville, VA 3.6 $235,000 $65,300
138
119 U.S. Chattanooga, TN-GA 3.5 $170,100 $48,800 176 26 148 U.S. Chicago, IL 3.8 $244,100 $64,500 350
243 U.S. Chico, CA 5.9 $275,000 $46,600
55 3 44 U.S. Cincinnati, OH-KY-IN 2.7 $157,000 $58,000 55 3 44 U.S. Cleveland, OH 2.7 $138,900 $52,100
245
194 U.S. College Station, TX 4.3 $205,000 $47,300 245
194 U.S. Colorado Springs, CO 4.3 $264,700 $61,700
130
113 U.S. Columbia, MO 3.4 $173,400 $51,600 112
95 U.S. Columbia, SC 3.2 $165,900 $52,500
99 12 83 U.S. Columbus, OH 3.1 $181,600 $59,400 162
137 U.S. Corpus Christi, TX 3.7 $189,800 $51,300
337
238 U.S. Corvallis, OR 5.6 $300,000 $54,000 18
15 U.S. Cumberland, MD-WV 2.3 $94,400 $40,200
162 24 137 U.S. Dallas-Fort Worth, TX 3.7 $230,500 $63,000 18
15 U.S. Davenport, IA-IL 2.3 $128,700 $56,700
55
44 U.S. Dayton, OH 2.7 $134,100 $50,600 204
168 U.S. Daytona Beach, FL 4.0 $175,000 $44,200
77
64 U.S. Decatur, AL 2.9 $137,100 $47,100 3
3 U.S. Decatur, IL 2.0 $99,400 $49,100
323 67 231 U.S. Denver, CO 5.4 $386,800 $71,800 99
83 U.S. Des Moines, IA 3.1 $193,100 $63,300
91 8 77 U.S. Detroit, MI 3.0 $163,500 $54,800 130
113 U.S. Dover, DE 3.4 $200,000 $58,000
64
52 U.S. Duluth, MN 2.8 $147,000 $51,600 254
198 U.S. Durham, NC 4.4 $244,400 $55,300
5
5 U.S. East Stroudsburg, PA 2.1 $123,000 $58,500 275
211 U.S. El Centro, CA 4.7 $196,000 $41,700
13th Annual Demographia International Housing Affordability Survey (2016: 3rd Quarter) 62

SCHEDULE 4 ALL HOUSING MARKETS BY GEOGRAPHY
Median Multiple (Median House Price/Median Household Income): 2016 – 3rd Quarter Demographia International Housing Affordability Survey
International Affordability
Rank
Major Market Rank
National Rank Nation Housing market
Median Multiple* Median Price
Median Household
Income 130
113 U.S. El Paso, TX 3.4 $151,200 $44,600
55
44 U.S. Elizabethtown, KY 2.7 $135,000 $50,000 77
64 U.S. Elkhart, IN 2.9 $149,000 $50,600
3
3 U.S. Elmira, NY 2.0 $109,400 $54,200 45
38 U.S. Erie, PA 2.6 $127,400 $48,400
300
220 U.S. Eugene, OR 5.0 $240,100 $48,300 369
247 U.S. Eureka, CA 7.0 $290,000 $41,300
33
27 U.S. Evansville, IN 2.5 $125,000 $49,700 112
95 U.S. Fairbanks, AK 3.2 $236,000 $74,500
148
126 U.S. Fargo, ND-MN 3.6 $204,100 $57,200 148
126 U.S. Farmington, NM 3.6 $180,600 $50,700
138
119 U.S. Fayetteville, AR-MO 3.5 $180,100 $51,900 176
148 U.S. Fayetteville, NC 3.8 $162,100 $42,800
292
217 U.S. Flagstaff, AZ 4.9 $265,000 $54,300 64
52 U.S. Flint, MI 2.8 $126,000 $45,000
148
126 U.S. Florence, SC 3.6 $138,800 $38,900 312
227 U.S. Fort Collins, CO 5.1 $335,000 $66,300
275
211 U.S. Fort Walton Beach, FL 4.7 $254,500 $54,600 264
206 U.S. Fresno, CA 4.5 $215,000 $47,900
33
27 U.S. Ft. Wayne, IN 2.5 $127,700 $51,900 204
168 U.S. Gainesville, FL 4.0 $193,300 $47,900
64
52 U.S. Gainesville, GA 2.8 $155,000 $56,200 99
83 U.S. Glens Falls, NY 3.1 $172,300 $56,400
91 8 77 U.S. Grand Rapids, MI 3.0 $170,100 $56,600 176
148 U.S. Great Falls, MT 3.8 $177,000 $46,600
216
177 U.S. Greeley, CO 4.1 $294,000 $71,700 64
52 U.S. Green Bay, WI 2.8 $157,100 $56,000
116
99 U.S. Greensboro, NC 3.3 $155,000 $46,700 190
159 U.S. Greenville, SC 3.9 $191,900 $49,200
64
52 U.S. Gulfport, MS 2.8 $126,200 $45,300 91
77 U.S. Hagerstown, MD-WV 3.0 $167,300 $56,300
239
190 U.S. Hanford, CA 4.2 $197,000 $46,700 64
52 U.S. Harrisburg, PA 2.8 $164,800 $59,400
116 15 99 U.S. Hartford, CT 3.3 $241,200 $73,800 320
229 U.S. Hilo, HI 5.2 $316,200 $61,300
254
198 U.S. Hilton Head, SC 4.4 $251,000 $57,100 24
19 U.S. Homosassa Springs, FL 2.4 $100,000 $41,100
395 86 259 U.S. Honolulu, HI 9.4 $745,300 $78,900 138 19 119 U.S. Houston, TX 3.5 $217,400 $62,800 99
83 U.S. Huntsville, AL 3.1 $183,900 $59,000
91 8 77 U.S. Indianapolis, IN 3.0 $164,100 $55,500 162
137 U.S. Ithaca, NY 3.7 $219,000 $59,300
162
137 U.S. Jackson, MS 3.7 $176,500 $47,700 204 34 168 U.S. Jacksonville, FL 4.0 $219,000 $54,300 372
249 U.S. Kahului (Maui), HI 7.1 $510,000 $72,000
64
52 U.S. Kalamazoo, MI 2.8 $145,000 $52,300
13th Annual Demographia International Housing Affordability Survey (2016: 3rd Quarter) 63

SCHEDULE 4 ALL HOUSING MARKETS BY GEOGRAPHY
Median Multiple (Median House Price/Median Household Income): 2016 – 3rd Quarter Demographia International Housing Affordability Survey
International Affordability
Rank
Major Market Rank
National Rank Nation Housing market
Median Multiple* Median Price
Median Household
Income 24
19 U.S. Kankakee, IL 2.4 $129,700 $55,000
91 8 77 U.S. Kansas City, MO-KS 3.0 $188,000 $61,800 376
250 U.S. Kapaa (Maui), HI 7.3 $577,800 $78,800
148
126 U.S. Kennewick, WA 3.6 $224,900 $62,700 99
83 U.S. Killeen , TX 3.1 $152,000 $49,600
130
113 U.S. Kingston, NY 3.4 $205,200 $61,000 130
113 U.S. Knoxville, TN 3.4 $169,600 $49,400
148
126 U.S. Lake Havasu City, AZ 3.6 $151,000 $41,800 162
137 U.S. Lakeland, FL 3.7 $167,000 $45,000
99
83 U.S. Lancaster, PA 3.1 $185,000 $60,500 45
38 U.S. Lansing, MI 2.6 $138,300 $52,900
176
148 U.S. Laredo, TX 3.8 $155,000 $40,600 264 53 206 U.S. Las Vegas, NV 4.5 $236,400 $52,600 77
64 U.S. Lexington, KY 2.9 $157,300 $54,200
5
5 U.S. Lima, OH 2.1 $110,000 $51,400 112
95 U.S. Lincoln, NE 3.2 $174,500 $55,100
64
52 U.S. Little Rock, AR 2.8 $138,600 $50,100 394 85 258 U.S. Los Angeles, CA 9.3 $593,900 $63,900 112 14 95 U.S. Louisville, KY-IN 3.2 $171,800 $54,000 300
220 U.S. Madera, CA 5.0 $240,000 $48,200
190
159 U.S. Madison, WI 3.9 $254,700 $65,500 148
126 U.S. Manchester, NH 3.6 $271,500 $75,900
24
19 U.S. Mansfield, OH 2.4 $110,000 $46,100 116
99 U.S. McAllen, TX 3.3 $120,000 $36,500
328
234 U.S. Medford, OR 5.5 $246,000 $44,900 116 15 99 U.S. Memphis, TN-MS-AR 3.3 $161,900 $49,600 300
220 U.S. Merced, CA 5.0 $214,000 $42,900
354 73 245 U.S. Miami, FL 6.1 $315,000 $51,500 176
148 U.S. Midland, TX 3.8 $229,000 $60,500
216 38 177 U.S. Milwaukee, WI 4.1 $238,000 $57,400 116 15 99 U.S. Minneapolis-St. Paul, MN-WI 3.3 $240,300 $72,500 99
83 U.S. Mobile, AL 3.1 $135,400 $43,600
300
220 U.S. Modesto, CA 5.0 $270,000 $53,500 45
38 U.S. Monroe, MI 2.6 $145,000 $55,500
77
64 U.S. Montgomery, AL 2.9 $133,700 $46,600 254
198 U.S. Mount Vernon, WA 4.4 $259,000 $58,300
33
27 U.S. Muskegon, MI 2.5 $120,000 $48,500 216
177 U.S. Myrtle Beach, SC 4.1 $198,000 $48,400
382
252 U.S. Napa, CA 8.4 $650,000 $77,100 356
246 U.S. Naples, FL 6.2 $395,000 $63,400
190 29 159 U.S. Nashville, TN 3.9 $230,000 $59,200 148
126 U.S. New Haven, CT 3.6 $229,600 $63,100
77
64 U.S. New London, CT 2.9 $191,600 $67,200 190 29 159 U.S. New Orleans, LA 3.9 $191,300 $49,400 342 72 241 U.S. New York, NY-NJ-PA 5.7 $397,600 $70,200 116
99 U.S. Ocala, FL 3.3 $135,000 $40,900
13th Annual Demographia International Housing Affordability Survey (2016: 3rd Quarter) 64

SCHEDULE 4 ALL HOUSING MARKETS BY GEOGRAPHY
Median Multiple (Median House Price/Median Household Income): 2016 – 3rd Quarter Demographia International Housing Affordability Survey
International Affordability
Rank
Major Market Rank
National Rank Nation Housing market
Median Multiple* Median Price
Median Household
Income 300
220 U.S. Ocean City, NJ 5.0 $290,000 $58,300
33
27 U.S. Odessa, TX 2.5 $169,000 $66,800 116
99 U.S. Ogden, UT 3.3 $220,000 $66,900
77 6 64 U.S. Oklahoma City, OK 2.9 $154,800 $53,300 216
177 U.S. Olympia, WA 4.1 $259,000 $63,500
64
52 U.S. Omaha, NE-IA 2.8 $175,100 $62,300 254 51 198 U.S. Orlando, FL 4.4 $229,900 $52,200 33
27 U.S. Oshkosh, WI 2.5 $134,300 $53,200
378
251 U.S. Oxnard, CA 7.7 $629,400 $81,700 176
148 U.S. Palm Bay, FL 3.8 $197,000 $51,500
204
168 U.S. Panama City, FL 4.0 $195,000 $49,100 116
99 U.S. Pensacola, FL 3.3 $172,000 $51,600
5
5 U.S. Peoria, IL 2.1 $123,100 $57,500 138 19 119 U.S. Philadelphia, PA-NJ-DE-MD 3.5 $234,800 $66,500 216 38 177 U.S. Phoenix, AZ 4.1 $235,300 $56,700 55 3 44 U.S. Pittsburgh, PA 2.7 $150,000 $55,200
204
168 U.S. Pittsfield, MA 4.0 $207,800 $51,800 239
190 U.S. Port St. Lucie, FL 4.2 $205,000 $49,000
216
177 U.S. Portland, ME 4.1 $260,800 $63,400 328 69 234 U.S. Portland, OR-WA 5.5 $358,500 $65,200 275
211 U.S. Prescott, AZ 4.7 $230,000 $49,100
264 53 206 U.S. Providence, RI-MA 4.5 $273,700 $60,200 216
177 U.S. Provo, UT 4.1 $273,000 $66,500
216
177 U.S. Punta Gorda, FL 4.1 $189,300 $46,500 1
1 U.S. Racine, WI 1.8 $104,000 $58,400
162 24 137 U.S. Raleigh, NC 3.7 $250,200 $67,200 64
52 U.S. Reading, PA 2.8 $162,100 $57,300
300
220 U.S. Redding, CA 5.0 $239,000 $47,700 323
231 U.S. Reno, NV 5.4 $314,400 $57,800
190 29 159 U.S. Richmond, VA 3.9 $239,800 $62,000 337 71 238 U.S. Riverside-San Bernardino, CA 5.6 $319,000 $57,300 55
44 U.S. Roanoke, VA 2.7 $139,000 $51,600
77
64 U.S. Rochester, MN 2.9 $193,000 $67,000 33 1 27 U.S. Rochester, NY 2.5 $139,300 $54,800
5
5 U.S. Rockford, IL 2.1 $111,900 $52,100 312 64 227 U.S. Sacramento, CA 5.1 $327,000 $64,100 18
15 U.S. Saginaw, MI 2.3 $100,000 $44,300
77 6 64 U.S. Saint Louis, MO-IL 2.9 $170,000 $57,700 264
206 U.S. Salem, OR 4.5 $240,700 $53,600
392
256 U.S. Salinas-Monterey, CA 9.2 $566,500 $61,800 176
148 U.S. Salisbury, MD 3.8 $209,000 $55,400
204 34 168 U.S. Salt Lake City, UT 4.0 $271,800 $67,200 176 26 148 U.S. San Antonio, TX 3.8 $212,300 $56,300 384 82 253 U.S. San Diego, CA 8.6 $589,300 $68,700 392 84 256 U.S. San Francisco, CA 9.2 $835,400 $90,400 397 88 260 U.S. San Jose, CA 9.6 $1,000,000 $104,100
13th Annual Demographia International Housing Affordability Survey (2016: 3rd Quarter) 65

SCHEDULE 4 ALL HOUSING MARKETS BY GEOGRAPHY
Median Multiple (Median House Price/Median Household Income): 2016 – 3rd Quarter Demographia International Housing Affordability Survey
International Affordability
Rank
Major Market Rank
National Rank Nation Housing market
Median Multiple* Median Price
Median Household
Income 388
255 U.S. San Luis Obispo, CA 9.0 $574,800 $64,000
402
261 U.S. Santa Barbara, CA 11.3 $732,500 $65,000 403
262 U.S. Santa Cruz, CA 11.6 $774,500 $66,500
292
217 U.S. Santa Fe, NM 4.9 $281,000 $56,900 385
254 U.S. Santa Rosa, CA 8.7 $590,000 $68,100
275
211 U.S. Sarasota, FL 4.7 $259,000 $54,800 5
5 U.S. Scranton-Wilkes Barre, PA 2.1 $109,000 $50,700
328 69 234 U.S. Seattle, WA 5.5 $422,100 $76,900 116
99 U.S. Sherman, TX 3.3 $160,000 $49,100
176
148 U.S. Shreveport, LA 3.8 $170,000 $44,200 77
64 U.S. Sierra Vista, AZ 2.9 $128,000 $44,200
77
64 U.S. Sioux City, IA, NE, SD 2.9 $154,000 $53,800 99
83 U.S. Sioux Falls, SD 3.1 $192,300 $61,100
55
44 U.S. South Bend, IN 2.7 $128,500 $48,200 138
119 U.S. Spartanburg, SC 3.5 $155,900 $45,000
254
198 U.S. Spokane, WA 4.4 $214,400 $48,600 18
15 U.S. Springfield, IL 2.3 $135,800 $59,100
176
148 U.S. Springfield, MA 3.8 $209,700 $54,500 77
64 U.S. Springfield, MO 2.9 $132,000 $45,700
5
5 U.S. Springfield, OH 2.1 $102,000 $49,000 239
190 U.S. St. George, UT 4.2 $236,000 $56,100
350
243 U.S. Stockton, CA 5.9 $322,000 $54,800 24
19 U.S. Syracuse, NY 2.4 $137,000 $57,600
245
194 U.S. Tallahassee, FL 4.3 $193,900 $45,200 216 38 177 U.S. Tampa-St. Petersburg, FL 4.1 $205,000 $49,900
5
5 U.S. Terre Haute, IN 2.1 $88,000 $41,800 264
206 U.S. The Villages, FL 4.5 $235,000 $52,400
33
27 U.S. Toledo, OH 2.5 $119,800 $48,100 24
19 U.S. Topeka, KS 2.4 $127,100 $52,800
162
137 U.S. Trenton, NJ 3.7 $276,900 $74,000 204 34 168 U.S. Tucson, AZ 4.0 $193,300 $48,100 91
77 U.S. Tulsa, OK 3.0 $156,500 $52,400
130
113 U.S. Tyler, TX 3.4 $168,000 $50,100 15
13 U.S. Utica, NY 2.2 $110,000 $50,000
342
241 U.S. Vallejo, CA 5.7 $389,500 $68,900 204
168 U.S. Vero Beach, FL 4.0 $200,000 $50,400
148 21 126 U.S. Virginia Beach-Norfolk, VA-NC 3.6 $220,000 $61,400 285
215 U.S. Visalia, CA 4.8 $210,000 $43,300
116
99 U.S. Waco, TX 3.3 $154,000 $47,300 216 38 177 U.S. Washington, DC-VA-MD-WV 4.1 $393,500 $95,300 24
19 U.S. Waterloo, IA 2.4 $127,400 $53,400
24
19 U.S. Wheeling, WV 2.4 $115,000 $48,700 55
44 U.S. Wichita Falls, TX 2.7 $127,000 $46,600
45
38 U.S. Wichita, KS 2.6 $135,700 $52,700 239
190 U.S. Wilmington, NC 4.2 $226,700 $53,800
116
99 U.S. Winston-Salem, NC 3.3 $151,500 $46,100
13th Annual Demographia International Housing Affordability Survey (2016: 3rd Quarter) 66

SCHEDULE 4 ALL HOUSING MARKETS BY GEOGRAPHY
Median Multiple (Median House Price/Median Household Income): 2016 – 3rd Quarter Demographia International Housing Affordability Survey
International Affordability
Rank
Major Market Rank
National Rank Nation Housing market
Median Multiple* Median Price
Median Household
Income 162
137 U.S. Worcester, MA 3.7 $249,600 $66,800
204
168 U.S. Yakima, WA 4.0 $192,200 $48,200 77
64 U.S. York, PA 2.9 $170,900 $59,600
5
5 U.S. Youngstown, OH-PA 2.1 $90,300 $44,000 285
215 U.S. Yuba City, CA 4.8 $250,000 $52,300
99
83 U.S. Yuma, AZ 3.1 $127,000 $41,400
Median Market 3.6
Financial data in local currency. *Average Multiple (Japan)
13th Annual Demographia International Housing Affordability Survey (2016: 3rd Quarter) 67

ANNEX: USES, METHODS AND SOURCES Most international housing affordability sources and "city" rating sources focus on higher end housing that would be demanded by executives who might be transferred from one nation to another (expatriates). The Demographia International Housing Affordability Survey is unique in focusing on the middle of the market --- housing affordability for average households. Further, the focus is on housing markets, rather than higher-cost inner areas or expensive neighborhoods. This is an important distinction. The data in the Demographia International Housing Affordability Survey does not relate, for example to Belgravia in London, New York's Upper East Side or Beverly Hills in Los Angeles. It rather encompasses entire metropolitan markets, which for example, in the New York metropolitan area includes more than 20 counties in the states of New York, New Jersey and Pennsylvania87 (where included housing can be 75 miles [120 kilometers] or more from the upscale areas of the urban core, where prices are the highest). Geographical Coverage: The nine nations and corresponding housing markets that are included in the 13th Annual Demographia International Housing Affordability Survey have sufficient current sources of house prices and household income data to estimate housing affordability using the Median Multiple (the similar "Average Multiple” is used in Japan). Demographia receives periodic requests to expand its coverage to other nations. The addition of continental European nations, mainland China and India has been most frequently requested. Demographia would be pleased to add other nations and will do so wherever consistent data of sufficient quality can be identified. Readers are encouraged to contact the authors with any such information. House Characteristics: The indexes and data on which the Survey is based reflect the majority of existing housing in each of the national markets. At the same time, there are differences in house types, housing characteristics and lot size between the geographies covered. The Demographia International Housing Affordability Survey does not adjust the Median Multiples to reflect these differences. For example, the average size of housing, particularly new housing, is abnormally small by New World standards in the United Kingdom and Hong Kong.88 Methods: Median house price information is obtained from leading metropolitan reporting agencies and includes the housing stock as reported upon. Where only average house prices are available, median house prices are estimated from historic conversion factors, except in Japan. The principal sources are real estate time series that have become established as authoritative, national sales transaction registries and other government sources. Median household income data is estimated for each housing markets using national census data or other national surveys. The income base is then adjusted to account for changes to produce an up-
87 As defined by the United States Bureau of Management and the Budget. 88 See 2nd Annual Demographia International Housing Affordability Survey, Pages 16-18.
13th Annual Demographia International Housing Affordability Survey (2016: 3rd Quarter) 68

to-date estimate, using the best available indicators of annual income changes. This requires periodic recalibration of base year data to reflect the latest available data. Caution is urged in time-series comparisons in individual markets. Changes in data sources, base year income information, housing data sources and geographical definitions can make precise year to year comparisons less reliable. Comparisons should be generally limited to the housing affordability rating categories of "affordable," moderately unaffordable," "seriously unaffordable" and "severely unaffordable."89 Sources: The following principal sources have been consulted:
Australian Bureau of Statistics Australian Property Monitors Bank of Canada Bank of England Bank of Ireland Calgary Real Estate Board Canada Mortgage and Housing Corporation Canadian Home Builders Association Canadian Real Estate Association Census and Statistical Office: Government of Hong Kong Central Statistics Office, Ireland Chambre immobilière du Grand Montréal City Wire (Arkansas) Communities and Local Government (Ministry), United Kingdom Conference Board of Canada Department of the Environment, Heritage and Local Government (Ireland) Domain.com.au (Australia) Edmonton Real Estate Board Federal Reserve Board (United States) Fédération des chambres immobilières du Québec Harvard University Joint Center on Housing Hawaii Information Service Housing and Development Board (Singapore) Housing Industry Association (Australia) Ireland Environment, Heritage and Local Government Japan Statistics Bureau John Burns Real Estate Consulting The Land Institute of Japan Land Registry of England and Wales The Land Registry (Hong Kong)
89 Demographia attempts to use the most reliable available data at the time of report preparation. This necessitates adopting more representative sources as they become available, including new sources and updates.
13th Annual Demographia International Housing Affordability Survey (2016: 3rd Quarter) 69

National Association of Home Builders (USA) National Association of Realtors (USA) National Statistics (United Kingdom) Northern Ireland Research and Statistics Agency Real Estate Institute of Australia Real Estate Institute of New South Wales Real Estate Institute of New Zealand Real Estate Institute of Northern Territory Real Estate Institute of Queensland Real Estate Institute of Tasmania Real Estate Institute of Victoria Real Estate Institute of Western Australia Realestateview.com.au Registers of Scotland Reserve Bank of Australia Reserve Bank of New Zealand Residential Property Price Register of the Property Services Regulatory Authority (Ireland) RP Data (realestate.com.au) Singapore Department of Statistics Singapore Real Estate Exchange (SRX) Statistics Canada Statistics New Zealand Toronto Real Estate Board United Kingdom Department of Communities and Local Government United States Department of Commerce: Bureau of Economic Analysis United States Department of Commerce: Bureau of the Census United States Department of Housing and Urban Development Urban Development Institute of Australia Wells Fargo Bank Zillow.com
Expanded Notes on Selected Figures: Figure 1: House Price-to-income Ratios: Reserve Bank of Australia data. Figure courtesy of Frontier Centre for Public Policy (https://www.fcpp.org/posts/housing-affordability-and-the-standard-of-living-in-toronto) Figure 3: Housing Affordability & Land Regulation: In the United States, more restrictive regulation markets (Table 1) include those classified as “growth management,” “growth control,” “containment” and “contain-lite” in From Traditional to Reformed A Review of the Land Use Regulations in the Nation’s 50 largest Metropolitan Areas (Brookings Institution, 2006) as well as additional markets Demographia has determined other U.S. metropolitan areas to have urban containment policy or other policies that have similar effects (New York, Boston, Chicago, Minneapolis-St. Paul,
13th Annual Demographia International Housing Affordability Survey (2016: 3rd Quarter) 70

Washington and Honolulu). Outside the United States, more restrictively regulated markets are identified based upon the extent of their use of urban containment strategies (significant restriction or prohibition of urban fringe development). This includes all markets in the United Kingdom (principally under the Town and Country Planning Act), Ireland (under the National Spatial Strategy), Hong Kong and all of the markets of Australia and New Zealand. In Canada, urban containment policy has been adopted in Toronto, Montréal, Vancouver, Ottawa and Calgary. Markets not classified as more restrictively regulated are classified as liberal (see Table 3).
Table 13 Housing Market Selection Criteria
Nation Markets Included (Where Sufficient Data is Available) Australia Housing markets corresponding to urban centres over 50,000 population & Pilbara housing markets Canada Housing markets over 75,000 population China Hong Kong Ireland Housing markets over 50,000 population Japan Two largest markets (only markets available) New Zealand Markets corresponding to urban areas over 75,000 population Singapore Singapore United Kingdom Markets corresponding to urban areas over 150,000 population and London Exurbs (E & SE England). United States Housing markets over 75,000 population Selected additional markets. Housing markets are metropolitan areas (labour market areas) or their equivalent.
Footer Illustrations: New Houses (Left to Right): Suburban Kansas City, United States
Suburban Montréal, Canada East of England (London Exurbs), United Kingdom Suburban Tseung Kwan O (Hong Kong) Suburban Dublin, Ireland Suburban Auckland, New Zealand Suburban Adelaide, Australia
13th Annual Demographia International Housing Affordability Survey (2016: 3rd Quarter) 71

BIOGRAPHIES Wendell Cox Wendell Cox is co-author of the Demographia International Housing Affordability Survey. He is a public policy consultant and principal of Demographia, an international public policy firm.. He is a senior fellow at the Center for Opportunity Urbanism (Houston headquarters), senior fellow for housing affordability and municipal policy at the Frontier Centre for Public Policy in Canada (Winnipeg headquarters) and a member of the advisory board of the Center for Demographics and Policy at Chapman University in California. Wendell Cox has also served as a visiting professor at the Conservatoire National des Arts et Metiers in Paris (a national university). He has served as vice-president of CODATU, a Lyon (France) based international research organization dedicated to improving transport in developing world urban areas. He is a contributing editor at newgeography.com and author of the Evolving Urban Form series, which provides development profiles of individual world urban areas. Among his most recent policy reports were A Question of Values: Urban Containment Policy and Middle-Income Housing Affordability and Canada’s Middle-Income Housing Affordability Crisis, for the Frontier Centre for Public Policy, Putting People First: An Alternative Perspective with and Evaluation of the NCE Cities “Trillion Dollar” Report Best Cities for Minorities: Gauging the Economics of Opportunity (co-author with Joel Kotkin) for the Center for Opportunity Urbanism, Improving the Competitiveness of Metropolitan Areas for the Frontier Centre for Public Policy Evaluation of Plan Bay Area for the Pacific Research Institute and a "framing essay" entitled Toward More Prosperous Cities. Wendell Cox has lectured widely, including a month long tour to all Australian state and territory capitals and university lectures in the United Kingdom, France, China, Egypt and Australia. He has also conducted transport and urban planning training seminars in Romania, Togo and Ethiopia, He has completed projects in the United States, Western Europe, Canada, Australia and New Zealand in urban policy, demographics and transport. He was appointed to three terms on the Los Angeles County Transportation Commission by Mayor Tom Bradley and to the Amtrak Reform Council by Speaker of the U. S. House of Representatives Newt Gingrich. Demographia annually publishes Demographia World Urban Areas, the only annual list of world urban areas (agglomerations) over 500,000 population with coordinate urban land area, population and population density estimates. Demographia sponsors three internet web sites, including demographia.com, www.publicpurpose.com and www.rentalcartours.net. The www.publicpurpose.com website has been twice honored by the National Journal as one of the nation’s top internet transport sites. He is also author of the Demographia Residential Land and Regulation Cost Index.
13th Annual Demographia International Housing Affordability Survey (2016: 3rd Quarter) 72

In 2004 he teamed with Hugh Pavletich of Performance Urban Planning to develop the Demographia International Housing Affordability Survey. Hugh Pavletich Hugh Pavletich, the co-author of the Demographia International Housing Affordability Survey, resides in “severely unaffordable” (6.1 Median Multiple) Christchurch, New Zealand, which since 4 September 2010 has experienced in excess of 13,000 earthquakes. He has written extensively on these issues. He operates the archival website Performance Urban Planning and is the Managing Director of Pavletich Properties Ltd, a commercial property development and investment company. He commenced his working life as a farm worker and wool classer (wool classifier) in 1967 and moved to Christchurch in 1980, where he started developing small factory units and has developed commercial and industrial property on freehold and Maori leasehold land in other centers of the South Island as well. His industry involvement commenced when elected President of the South Island Division of the Property Council of New Zealand (then the Building Owners & Managers Association – BOMA) soon after its inception in 1991, which he led for four years. He has had extensive involvement with public policy issues of local authority financial management, land use regulation and heritage. In 2004, he was elected a fellow of the Urban Development Institute of Australia (UDIA) for services to the industry. He felt there was a need for an international measure of housing affordability and teamed up with Wendell Cox in 2004, to develop the annual Demographia International Housing Affordability Survey.
Demographia (Wendell Cox Consultancy)
P.O. Box 841 Belleville, Illinois 62269 USA
(St. Louis Metropolitan Region) www.demographia.com
[email protected] Contact: Wendell Cox
+1.618.632.8507: United States
13th Annual Demographia International Housing Affordability Survey (2016: 3rd Quarter) 73

Performance Urban Planning Christchurch, New Zealand
www.performanceurbanplanning.org/ [email protected] Contact: Hugh Pavletich
+64.3.343.9944
13th Annual Demographia International Housing Affordability Survey (2016: 3rd Quarter) 74

3
© 2 0 1 6 A T L A N T I C I N S T I T U T E F O R M A R K E T S T U D I E S
1 3 t h A N N U A L D E M O G R A P H I A I N T E R N A T I O N A L H O U S I N G A F F O R A B I L I T Y S U R V E Y 2 0 1 7
Making a Donation
AIMS is a registered charity that operates with the financial support of foundations, corporations and individuals and offers tax receipts for donations. AIMS does not receive government funding or contract itself for specific research projects. These policies enhance the Institute’s ability to think freely, hold decision-makers to account for their choices, and maintain its professional integrity and intellectual independence.
Cost of Research: Each research project has its own parameters with respect to the amount and quality of the information available, the level of expertise required by the researcher and the amount of time that it takes to complete the paper. The total cost tends to range between $10,000 - $20,000+ which includes the author’s fee, oversight and guidance by our Director of Research, proofreading, time, peer review, formatting, communications, radio ads, and media relations.
AIMS would like to invite you to join our group of valued supporters by filling in the form below. AIMS has been an influential voice in Canada for over 20 years and those who support our mission and believe in moving it forward are integral to AIMS’s continued success.
Please mail this form to:
287 Lacewood Drive, Suite 204, Halifax, NS B3M 3Y7
Name:
Organization:
Address:
Telephone:
Email:
Payment Method: Visa Mastercard Cheque
$50 $75 $100 Other
Card Number: Expiry Date:
Card Holder: Signature:
ATLANTIC INSTITUTE FOR MARKET STUDIES
Or you may email it to [email protected]
If you wish to donate using our online portal, go to the Contribute to Atlantic Prosperity page on our website: aims.ca/donate