ats company reports: ambuja cements ltd
TRANSCRIPT

Current price 242.00
Sector Cement
No of shares 1549988086
52 week high 286.85
52 week low 192.35
BSE Sensex 27490.59
Nifty 8331.95
Average Volume 1669019
BSE Code 500425
NSE Symbol AMBUJACEM
Ambuja Cements Ltd.
Recommendation
– BUY/HOLD
Date – 04/05/2015

Company Overview
Ambuja Cements Ltd, a part of Holcim, is an India-based cement manufacturing company. Holcim is a supplier
of cement and aggregates (crushed stone, gravel and sand). Its activities include the manufacture and
distribution of cement, and the production, processing and distribution of aggregates, ready-mix concrete and
asphalt. It also offers consulting, research, trading, engineering and other services. The Company has five
integrated cement manufacturing plants and eight cement grinding units. Its cement capacity is approximately
28.75 million tons. The Company manufactures Portland Pozollana cement and ordinary Portland cement. The
Company operates in cementitious materials segment. The Company’s subsidiaries include M.G.T. Cements
(Private) Limited, Chemical Limes Mundwa (Private) Limited, Kakinada Cements Limited, Dirk India (Private)
Limited, Dirk Pozzocrete (MP) Private Limited and Dang Cement Industries (Private) Limited.
The company was formerly known as Gujarat Ambuja Cements Ltd. and changed its name to Ambuja
Cements Limited in April 2007. The company was incorporated in 1981 and is headquartered in Mumbai,
India. Ambuja Cements Limited is a subsidiary of Holderind Investments Limited. It is the first Indian cement
manufacturer having a captive port with three terminals along the country's western coastline to facilitate
timely, cost effective and environmentally cleaner shipments of bulk cement to its customer. The company has
its own fleet of ships.
Ambuja Cements is the most profitable cement company in India, and the lowest cost producer of cement in
the world. One of the major reasons that Ambuja Cements is the lowest cost producer of cement in the world
is its emphasis on efficiency. Power consists over 40% of the production cost of cement. The company
improved efficiency of its kilns to get more output for less power. Thereafter Ambuja Cements set up a captive
power plant at a substantially lower cost than the national grid. The company sourced a cheaper and higher
quality coal from South Africa, and a better furnace oil from the Middle East. As a result, today, the company is
in a position to sell its excess power to the local state government.

Category No. of Shares Percentage
Other Companies 5,496,157 0.35
Foreign Promoters 780,308,553 50.34
Foreign Institutions 471,312,822 30.41
Financial
Institutions135,719,665 8.76
General Public 96,856,010 6.25
Foreign - NRI 13,740,196 0.89
NBFC and Mutual
Funds12,989,826 0.84
Others 1,402,994 0.09
Foreign - OCB 12,870 0.00
Foreign Industries 3,850 0.00
Market Cap (Rs Cr) – 36824.39
Company P/E (x) – 23.80
Industry P/E (x) – 32.36
Book Value (Rs) – 65.16
Price / BV (x) – 3.64
Dividend (%) – 250 %
EPS (TTM) – 8.35
Dividend Yield (%) – 2.11 %
Face Value (Rs) – 2
Share Holding Pattern Financial Details
Industry Overview
India's cement industry is a vital part of its economy, providing employment to more than a million people,
directly or indirectly. Ever since it was deregulated in 1982, the Indian cement industry has attracted huge
investments, from both Indian and foreign investors, making it the second largest in the world. The industry is
currently in a turnaround phase, trying to achieve global standards in production, safety, and energy-efficiency.
India has a lot of potential for development in the infrastructure and construction sector and the cement sector
is expected to largely benefit from it. Some of the recent major government initiatives such as development of
100 smart cities are expected to provide a major boost to the sector. The cement market in India is expected
to grow at a compound annual growth rate (CAGR) of 8.96 percent during the period 2014-2019. In India, the
housing sector is the biggest demand driver of cement, accounting for about 67 per cent of the total
consumption. The other major consumers of cement include infrastructure at 13 per cent, commercial
construction at 11 per cent and industrial construction at nine per cent. To meet the rise in demand, cement
companies are expected to add 56 million tonnes (MT) capacity over the next three years. The cement
capacity in India may register a growth of eight per cent by next year end to 395 MT from the current level of
366 MT. It may increase further to 421 MT by the end of 2017. The country's per capita consumption stands at
around 190 kg.
A total of 188 large cement plants together account for 97 per cent of the total installed capacity in the country,
while 365 small plants account for the rest. Of these large cement plants, 77 are located in the states of
Andhra Pradesh, Rajasthan and Tamil Nadu. The Indian cement industry is dominated by a few companies.
The top 20 cement companies account for almost 70 per cent of the total cement production of the country.
The eastern states of India along with the border states will be the newer and virgin markets for cement
companies and will contribute to their bottom line in future. In the next 10 years, India will become the main
exporter of clinker and gray cement to the Middle East, Africa, and other developing nations of the world. A
large number of foreign players are also expected to enter the cement sector in the next 10 years, owing to the
profit margins, constant demand, and right valuation.
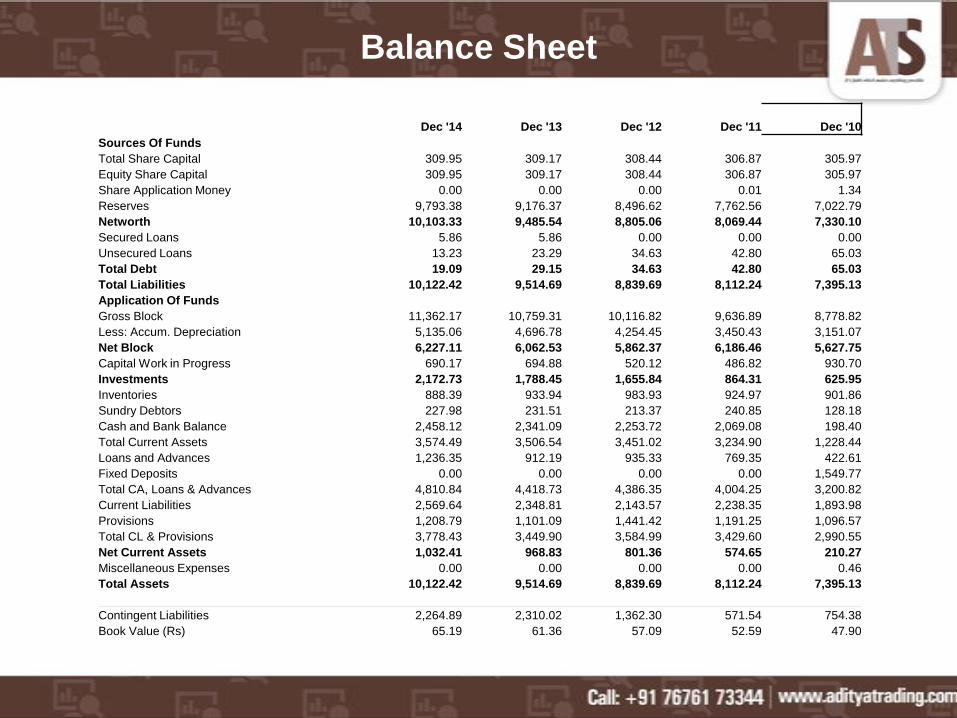
Balance Sheet
Dec '14 Dec '13 Dec '12 Dec '11 Dec '10
Sources Of Funds
Total Share Capital 309.95 309.17 308.44 306.87 305.97
Equity Share Capital 309.95 309.17 308.44 306.87 305.97
Share Application Money 0.00 0.00 0.00 0.01 1.34
Reserves 9,793.38 9,176.37 8,496.62 7,762.56 7,022.79
Networth 10,103.33 9,485.54 8,805.06 8,069.44 7,330.10
Secured Loans 5.86 5.86 0.00 0.00 0.00
Unsecured Loans 13.23 23.29 34.63 42.80 65.03
Total Debt 19.09 29.15 34.63 42.80 65.03
Total Liabilities 10,122.42 9,514.69 8,839.69 8,112.24 7,395.13
Application Of Funds
Gross Block 11,362.17 10,759.31 10,116.82 9,636.89 8,778.82
Less: Accum. Depreciation 5,135.06 4,696.78 4,254.45 3,450.43 3,151.07
Net Block 6,227.11 6,062.53 5,862.37 6,186.46 5,627.75
Capital Work in Progress 690.17 694.88 520.12 486.82 930.70
Investments 2,172.73 1,788.45 1,655.84 864.31 625.95
Inventories 888.39 933.94 983.93 924.97 901.86
Sundry Debtors 227.98 231.51 213.37 240.85 128.18
Cash and Bank Balance 2,458.12 2,341.09 2,253.72 2,069.08 198.40
Total Current Assets 3,574.49 3,506.54 3,451.02 3,234.90 1,228.44
Loans and Advances 1,236.35 912.19 935.33 769.35 422.61
Fixed Deposits 0.00 0.00 0.00 0.00 1,549.77
Total CA, Loans & Advances 4,810.84 4,418.73 4,386.35 4,004.25 3,200.82
Current Liabilities 2,569.64 2,348.81 2,143.57 2,238.35 1,893.98
Provisions 1,208.79 1,101.09 1,441.42 1,191.25 1,096.57
Total CL & Provisions 3,778.43 3,449.90 3,584.99 3,429.60 2,990.55
Net Current Assets 1,032.41 968.83 801.36 574.65 210.27
Miscellaneous Expenses 0.00 0.00 0.00 0.00 0.46
Total Assets 10,122.42 9,514.69 8,839.69 8,112.24 7,395.13
Contingent Liabilities 2,264.89 2,310.02 1,362.30 571.54 754.38
Book Value (Rs) 65.19 61.36 57.09 52.59 47.90

Profit and Loss Account
Dec '14 Dec '13 Dec '12 Dec '11 Dec '10
Income
Sales Turnover 9,978.12 9,160.35 9,730.30 8,554.26 8,286.20
Excise Duty 0.00 0.00 0.00 0.00 914.68
Net Sales 9,978.12 9,160.35 9,730.30 8,554.26 7,371.52
Other Income 428.98 418.44 69.74 223.62 214.58
Stock Adjustments -15.91 -118.33 200.83 -57.00 54.28
Total Income 10,391.19 9,460.46 10,000.87 8,720.88 7,640.38
Expenditure
Raw Materials 1,565.20 1,361.36 1,337.38 1,170.06 1,475.20
Power & Fuel Cost 2,265.22 2,062.92 2,329.07 2,001.37 1,697.34
Employee Cost 581.58 502.41 478.51 433.20 344.91
Other Manufacturing Expenses 0.00 0.00 0.00 0.00 227.03
Selling and Admin Expenses 0.00 0.00 0.00 0.00 1,633.14
Miscellaneous Expenses 3,621.77 3,464.50 3,313.20 2,915.60 199.42
Total Expenses 8,033.77 7,391.19 7,458.16 6,520.23 5,565.68
Operating Profit 1,928.44 1,650.83 2,472.97 1,977.03 1,860.12
PBDIT 2,357.42 2,069.27 2,542.71 2,200.65 2,074.70
Interest 64.48 65.08 75.66 52.63 48.69
PBDT 2,292.94 2,004.19 2,467.05 2,148.02 2,026.01
Depreciation 509.53 490.07 565.22 445.15 387.19
Profit Before Tax 1,783.41 1,514.12 1,901.83 1,702.87 1,638.21
Extra-ordinary items 0.00 0.00 0.00 0.00 64.22
PBT (Post Extra-ord Items) 1,783.41 1,514.12 1,901.83 1,702.87 1,702.43
Tax 287.05 219.55 604.77 474.01 435.55
Reported Net Profit 1,496.36 1,294.57 1,297.06 1,228.86 1,263.61
Total Value Addition 6,468.57 6,029.83 6,120.78 5,350.17 4,090.48
Equity Dividend 774.61 556.34 554.80 490.69 397.22
Corporate Dividend Tax 146.51 94.55 90.00 79.60 65.27
Per share data (annualised)
Shares in issue (lakhs) 15,497.46 15,458.60 15,421.84 15,343.69 15,298.59
Earning Per Share (Rs) 9.66 8.37 8.41 8.01 8.26
Equity Dividend (%) 250.00 180.00 180.00 160.00 130.00

Dividend and Bonus History

Index and Company Price Movement Comparison
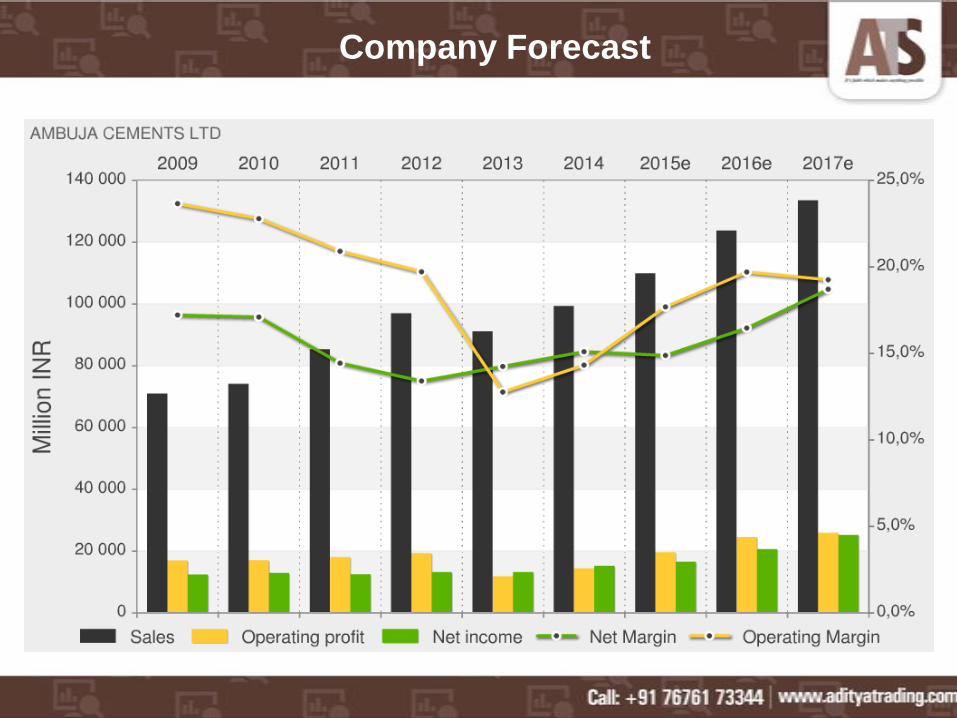
Company Forecast

Name Value Action
RSI(14) 56.331 Buy
STOCH(9,6) 62.822 Buy
STOCHRSI(14) 75.322 Overbought
MACD(12,26) 0.740 Buy
ADX(14) 32.955 Buy
Williams %R -40.230 Buy
CCI(14) 57.3596 Buy
ATR(14) 1.6643 Less Volatility
Highs/Lows(14) 0.6143 Buy
Ultimate Oscillator 59.720 Buy
ROC -1.064 Sell
Bull/Bear Power(13) 2.7740 Buy
Technical Indicators

PBIT – 13.63 v/s 12.14
RoCE – 18.25 v/s 16.33
RoE – 14.87 v/s 12.96
Net Profit Margin – 14.37 v/s 13.55
Inventory Turnover – 11.23 v/s 9.81
D/E Ratio – Nil
Interest Cover – 28.66 v/s 23.88
Current Ratio – 1.27 v/s 1.28
Reserves – 9793.38 cr v/s 9176.37 cr
PAT – 1496.36 cr v/s 1294.57 cr
Total assets – 10122.42 cr v/s 9514.69 cr
Net sales – 9978.12 cr v/s 9160.35 cr
Book Value – 65.19 v/s 61.36
Important Ratios (YoY)
Days BSE NSE
30 249.57 249.76
50 256.10 256.27
150 237.21 237.33
200 231.38 231.48
Simple Moving Average
Investment Rationalize
Ambuja Cements Ltd, is the most profitable and third largest cement company in India, which is owned by
Holcim Ltd. and it is the lowest cost producer of cement in the world.
ACL is a debt free company with good dividend payout history with a good marketing and distribution
network with more than 8700 dealers and 29000 retailers all across India.
Government initiative of “Make in India” and improvements in real estate and construction industry will act as
a trigger to the growth of the company. Having manufacturing facilities across will help to reduce the logistics
expenses to a minimal level.
ACL have an attractive financial ratios with a very positive cash flow with help of successful business and
manufacturing model.
With the picking up of demand for the products ACL will be able to utilize the installed capacity to the fullest
and work in progress for expanding manufacturing capacity to the fullest.
Having Holcim Ltd. as promoter help s the company to reduce the material cost and having power
generation facility inside plants will help the company to reduce costs as well as improving profits margins.
Governmental initiative to build smart cities across India, Budget homes plans, construction of industrial
corridors and emphasis of development in North East India, will provide a big business potential to the ACL.
Potential merger of Ambuja Cements and Acc and income from subsidiaries M.G.T. Cements (Private)
Limited, Chemical Limes Mundwa Limited, Kakinada Cements Limited, Dirk India Limited, Dirk Pozzocrete
(MP) Private Limited and Dang Cement Industries Limited will act a game changer for the company.