at&s quarterly financial report q3 2016/17
TRANSCRIPT

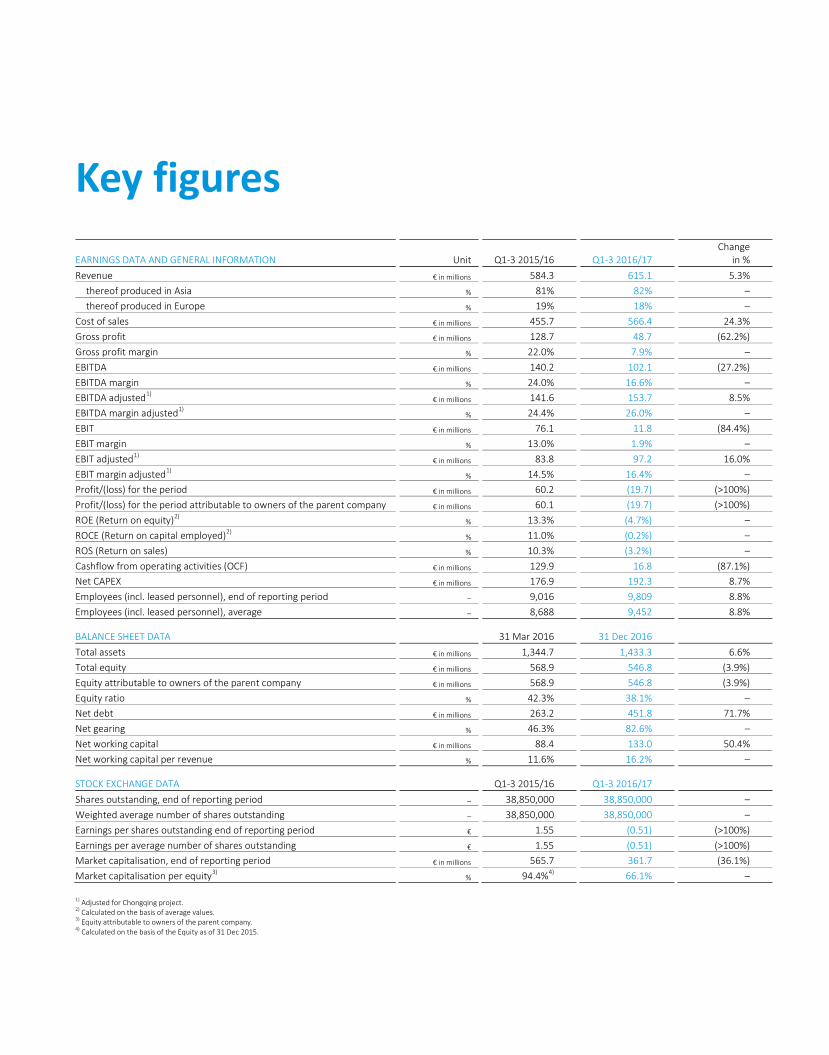
EARNINGS DATA AND GENERAL INFORMATION
Unit
Q1-3 2015/16
Q1-3 2016/17
Change in %
Revenue
€ in millions
584.3
615.1
5.3% thereof produced in Asia
%
81%
82%
–
thereof produced in Europe
%
19%
18%
– Cost of sales
€ in millions
455.7
566.4
24.3%
Gross profit
€ in millions
128.7
48.7
(62.2%) Gross profit margin
%
22.0%
7.9%
–
EBITDA
€ in millions
140.2
102.1
(27.2%) EBITDA margin
%
24.0%
16.6%
–
EBITDA adjusted
1)
€ in millions
141.6
153.7
8.5% EBITDA margin adjusted
1)
%
24.4%
26.0%
– EBIT
€ in millions
76.1
11.8
(84.4%)
EBIT margin
%
13.0%
1.9%
– EBIT adjusted
1)
€ in millions
83.8
97.2
16.0% EBIT margin adjusted
1)
%
14.5%
16.4%
– Profit/(loss) for the period
€ in millions
60.2
(19.7)
(>100%)
Profit/(loss) for the period attributable to owners of the parent company
€ in millions
60.1
(19.7)
(>100%) ROE (Return on equity)
2)
%
13.3%
(4.7%)
– ROCE (Return on capital employed)
2)
%
11.0%
(0.2%)
– ROS (Return on sales)
%
10.3%
(3.2%)
–
Cashflow from operating activities (OCF)
€ in millions
129.9
16.8
(87.1%) Net CAPEX
€ in millions
176.9
192.3
8.7%
Employees (incl. leased personnel), end of reporting period
–
9,016
9,809
8.8% Employees (incl. leased personnel), average
–
8,688
9,452
8.8%
BALANCE SHEET DATA
31 Mar 2016
31 Dec 2016
Total assets
€ in millions
1,344.7
1,433.3
6.6%
Total equity
€ in millions
568.9
546.8
(3.9%) Equity attributable to owners of the parent company
€ in millions
568.9
546.8
(3.9%)
Equity ratio %
42.3% 38.1% – Net debt € in millions
263.2 451.8 71.7%
Net gearing %
46.3% 82.6% – Net working capital € in millions
88.4 133.0 50.4%
Net working capital per revenue
%
11.6%
16.2%
–
STOCK EXCHANGE DATA
Q1-3 2015/16
Q1-3 2016/17
Shares outstanding, end of reporting period
–
38,850,000
38,850,000
– Weighted average number of shares outstanding
–
38,850,000
38,850,000
–
Earnings per shares outstanding end of reporting period
€
1.55
(0.51)
(>100%) Earnings per average number of shares outstanding
€
1.55
(0.51)
(>100%)
Market capitalisation, end of reporting period
€ in millions
565.7
361.7
(36.1%) Market capitalisation per equity
3)
%
94.4%
4)
66.1%
– 1) Adjusted for Chongqing project. 2) Calculated on the basis of average values. 3) Equity attributable to owners of the parent company. 4) Calculated on the basis of the Equity as of 31 Dec 2015.
Key figures
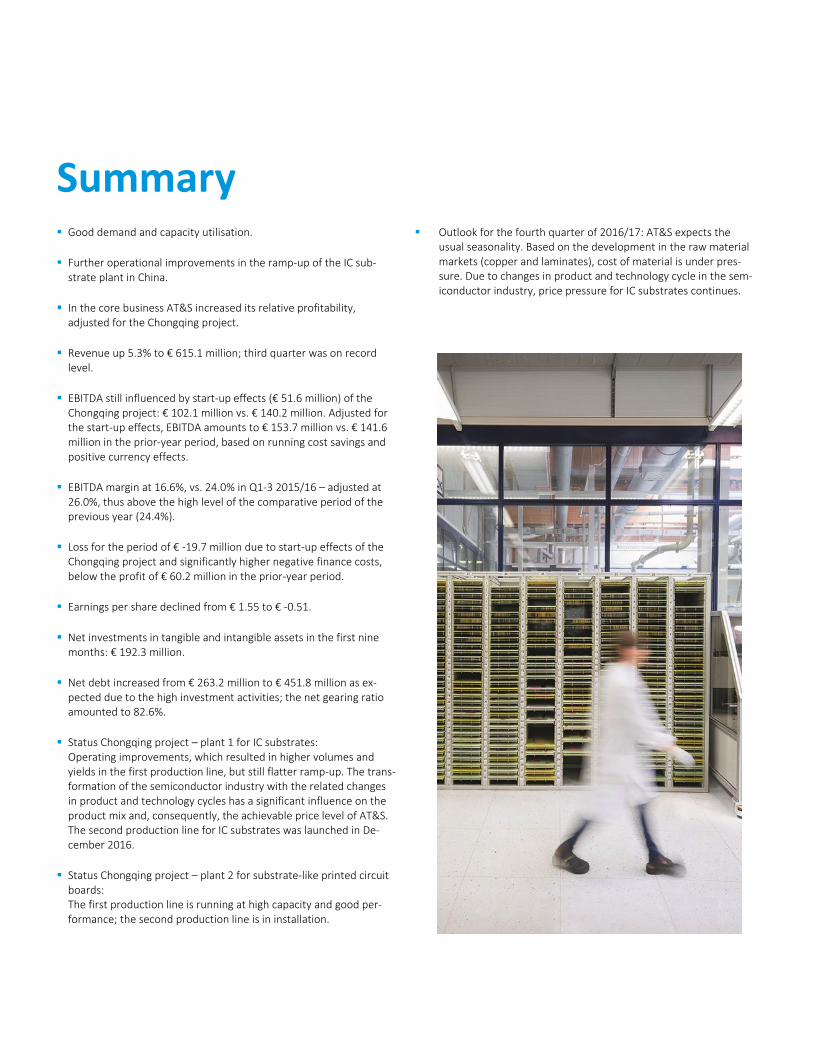
Good demand and capacity utilisation.
Further operational improvements in the ramp-up of the IC sub-strate plant in China.
In the core business AT&S increased its relative profitability, adjusted for the Chongqing project.
Revenue up 5.3% to € 615.1 million; third quarter was on record level.
EBITDA still influenced by start-up effects (€ 51.6 million) of the Chongqing project: € 102.1 million vs. € 140.2 million. Adjusted for the start-up effects, EBITDA amounts to € 153.7 million vs. € 141.6 million in the prior-year period, based on running cost savings and positive currency effects.
EBITDA margin at 16.6%, vs. 24.0% in Q1-3 2015/16 – adjusted at 26.0%, thus above the high level of the comparative period of the previous year (24.4%).
Loss for the period of € -19.7 million due to start-up effects of the Chongqing project and significantly higher negative finance costs, below the profit of € 60.2 million in the prior-year period.
Earnings per share declined from € 1.55 to € -0.51.
Net investments in tangible and intangible assets in the first nine months: € 192.3 million.
Net debt increased from € 263.2 million to € 451.8 million as ex-pected due to the high investment activities; the net gearing ratio amounted to 82.6%.
Status Chongqing project – plant 1 for IC substrates: Operating improvements, which resulted in higher volumes and yields in the first production line, but still flatter ramp-up. The trans-formation of the semiconductor industry with the related changes in product and technology cycles has a significant influence on the product mix and, consequently, the achievable price level of AT&S. The second production line for IC substrates was launched in De-cember 2016.
Status Chongqing project – plant 2 for substrate-like printed circuit boards: The first production line is running at high capacity and good per-formance; the second production line is in installation.
Outlook for the fourth quarter of 2016/17: AT&S expects the usual seasonality. Based on the development in the raw material markets (copper and laminates), cost of material is under pres-sure. Due to changes in product and technology cycle in the sem-iconductor industry, price pressure for IC substrates continues.
Summary

04
SHAREHOLDER STRUCTURE
DEVELOPMENTS IN THE CAPITAL MARKET IN THE FIRST NINE MONTHS OF 2016/17 The positive development in the international capital markets of the past months also continued in the third quarter of the AT&S financial year 2016/17. Especially after the surprising outcome of the US presidential election, the most important markets recorded significant gains. A positive impetus was also provided when the US Federal Reserve raised the interest rate in mid-December as generally expected, which was considered a sign of a good economic development.
In the USA, the lead index Dow Jones Industrial (DJI) reached another all-time high in the past quarter. The performance in the calendar year was clearly positive at +13.4%. In Europe, the Euro Stoxx 50 was up 9.6% in the past quarter and thus ended the year on the slightly positive side overall. In the Austrian capital market, the lead index ATX and the broader-based ATX Prime gained 8.9% and 8.7% respectively in the past quarter. For the calendar year 2016 this means a performance of 9.2% for the ATX and 8.1% for the ATX Prime.
AT&S AGAINST ATX PRIME AND TEC DAX
AT&S share
05
PERFORMANCE AND LIQUIDITY OF THE AT&S SHARE In the course of the third quarter of the financial year, the AT&S share price showed a negative trend and dropped down to € 9.07. The previous high of the current financial year of € 13.43 was not reached anymore. The share price was adversely affected by subdued forecasts regarding the development of certain customer segments as well as the currently low visibility of the new plants in Chongqing regarding revenue, profitability and another investment phase. The closing price of € 9.31 on the last trading day of the year results in a performance of -27.8% in the nine months since the beginning of the financial year, excluding the dividend of € 0.36 per share paid out in July.
The daily volume of the AT&S share traded on the Vienna Stock Exchange in the first three quarters of the financial year increased significantly by roughly a third compared with the prior-year period and amounted to an average of 78,841 shares per day (previous year: 58,915 shares). In contrast, the average daily trading turnover remained constant at € 842,713 (previous year: € 862,799), which is attributable to the lower aver-age share price.
In the first nine months of the financial year 2016/17 AT&S once again carried out a comprehensive program of road shows and conferences for existing and potential investors at European financial centres. In addition, the dialogue with existing and potential private and institutional investors was maintained through a number of talks, phone calls and e-mails. The main topics discussed included the current developments of the cus-tomer segments, the progress of the further establishment of the new plants in Chongqing and the position-ing of AT&S in the future. Currently, analysts of six investment banks cover the AT&S share. At the time of publication of this quarterly report, all recommendations were either “hold” or “neutral”.
KEY SHARE FIGURES FOR THE FIRST NINE MONTHS € 31 December 2016 31 December 2015 Earnings per share (0.51) 1.55 High 13.43 16.35 Low 9.07 12.80 Close 9.31 14.56
AT&S SHARE Vienna Stock Exchange Shares outstanding 38,850,000 Security ID number 922230 ISIN-Code AT0000969985 Symbol ATS Thomson Reuters ATSV.VI Bloomberg ATS:AV Indices ATX Prime, ATX GP, WBI, VÖNIX
FINANCIAL CALENDAR 09 May 2017 Annual results 2016/17 26 June 2017 Record date Annual General Meeting 06 July 2017 23rd Annual General Meeting
CONTACT INVESTOR RELATIONS Elke Koch Phone: +43 (0)3842 200-5925 Email: [email protected]

06
BUSINESS DEVELOPMENTS AND SITUATION In the first nine months of 2016/17 AT&S exceed-ed the good revenue figures of the previous year. At € 615.1 million, revenue surpassed the very strong level of € 584.3 million in the previous year. While revenue from mobile devices nearly matched the high level of the previous year, first revenues from IC substrates and substrate-like printed circuit boards contributed to the growth of the Mobile Devices & Substrates segment. The Automotive, Industrial, Medical segment con-tinued to increase its revenue. The activities of the business unit Advanced Packaging, which are included in the Others segment, recorded a decline. Negative currency developments had little influence on revenue. The portion of revenue from products made in Asia rose from 81% in the previous year to 82% in the current financial year.
Result key data € in millions (unless otherwise stated)
Q1-3 2016/17
Q1-3 2015/16
Change
in % Revenue
615.1 584.3
5.3%
Operating result before interest, tax, depreciation and amortisation (EBITDA)
102.1
140.2
(27.2%)
EBITDA margin (%) 16.6%
24.0%
EBITDA adjusted1) 153.7
141.6
8.5%
EBITDA margin adjusted (%)1) 26.0%
24.4%
Operating result (EBIT) 11.8
76.1
(84.4%)
EBIT margin (%) 1.9%
13.0%
EBIT adjusted1) 97.2
83.8
16.0%
EBIT margin adjusted (%)1) 16.4%
14.5%
Profit/(loss) for the period (19.7)
60.2
(>100%)
Earnings per share (€) (0.51)
1.55
(>100%)
Additions to property, plant and equipment and intangible assets 186.3
224.2
(16.9%)
Average number of staff (incl. leased personnel) 9,452
8,688
8.8%
1) Adjusted for Chongqing project
EBITDA declined by € 38.1 million or -27.2% in the first nine months, from € 140.2 million to € 102.1 million. The reduction primarily results from the start-up effects of the Chongqing project, which burdened EBITDA with € 51.6 million in the first nine months. Adjusted for these start-up effects, EBITDA amounted to € 153.7 million, thus exceeding the high level of the previous year by € 12.1 million or 8.5%. The pressure on profitability due to price/product mix effects in the Mobile Devices & Substrates segment was compensated by the ongoing cost-saving measures and positive currency translation effects. The cost reductions also in-clude an adjustment of the variable remuneration components to the expected target achievement level.
The EBITDA margin amounted to 16.6% in the first nine months, down -7.4 percentage points on the very high level of 24.0% in the previous year. Adjusted for the Chongqing project, the margin, at 26.0%, exceeds the high adjusted prior-year level of 24.4%. AT&S increased its relative profitability in the core business de-spite the challenging market environment.
Depreciation and amortisation including write-ups rose € 26.1 million or 40.7% from € 64.2 million to € 90.3 million. This resulted from an increase in depreciation by € 29.6 million for the Chongqing project. The increase in depreciation and amortisation in the core business amounted to € 2.2 million. Changes in ex-change rates reduced depreciation and amortisation by € 5.7 million.
EBIT declined by € 64.3 million from € 76.1 million to € 11.8 million. Adjusted for the Chongqing project, EBIT amounted to € 97.2 million, up € 13.4 million on the adjusted prior-year figure.
Group Interim Management Report
Development of revenue € in millions
Development of EBITDA € in millions
EBITDA margin in %
584.
3
615.
1
Q1-3 2015/16 Q1-3 2016/17
140.
2
102.
1
Q1-3 2015/16 Q1-3 2016/17
24.0
16.6
Q1-3 2015/16 Q1-3 2016/17

07
The EBIT margin amounted to 1.9% (previous year: 13.0%). The adjusted margin was 16.4%, thus exceeding the adjusted prior-year level of 14.5% by 1.9 percentage points.
Finance costs dropped significantly from € -2.7 million to € -18.6 million. Despite higher average gross debt, gross interest expenses, at € 12.2 million, were only 8.0% higher than in the previous year, at € 11.3 million due to the optimisation measures implemented. Capitalised interest declined by € 2.5 million from € 4.7 million to € 2.2 million. Interest income amounted to € 1.2 million, down € 1.1 million on the prior-year level of € 2.3 million. Currency translation effects had an impact of € 8.2 million on finance costs in the first nine months, thus leading to additional expenses of € 11.3 million compared with the prior-year period (pre-vious year: income of € 3.1 million).
Based on earnings before tax, tax expenses of € 13.0 million were recorded (previous year: tax expense of € 13.2 million). Tax expenses of € 13.9 million were offset by deferred tax income of € 0.9 million. The change of the effective tax rate on the consolidated level mainly results from losses of AT&S (Chongqing) Company Limited for which, based on current estimates, no deferred taxes have been capitalised. Furthermore, it was affected by the discontinuation of the reduced tax rate at AT&S (China) Company Limited as of 31.12.2016 (efforts to a return to the favoured tax scheme started). In addition, there was a change in the expected dividend payout rate for the shares in subsidiaries, which resulted in tax income.
The profit for the period fell by € 79.9 million from € 60.2 million to a loss for the period of € -19.7 million due to the start-up effects of the Chongqing project and the significantly higher negative finance costs. As a result, earnings per share declined from € 1.55 to € -0.51.
FINANCIAL POSITION Total assets increased by € 88.6 million or 6.6% from € 1,344.7 million to € 1,433.3 million in the first nine months. The increase due to additions to assets for the new plants in Chongqing amounting to € 118.5 million and technology upgrades at the other sites amounting to € 67.8 million (the additions to assets led to cash CAPEX of € 195.2 million) was offset by an increase in de-preciation and amortisation including write-ups by € 26.1 million to a total of € 90.3 million. The increase in inventories from € 83.4 million to € 100.9 million results primarily from the ramp-up of the production of substrate-like printed circuit boards and IC substrates at the Chongqing site. The increase in receivables is due to seasonal factors as lower revenue due to the Chinese New Year’s celebrations combined with the season-ality of sales in the Mobile Devices segment usually leads to a lower level of receivables at the end of the year. Input tax receivables increased total assets by € 27.4 million (thereof € 9.4 million in the short-term range).
Due to the scheduled repayment of the bond in November 2016, the financial assets invested with matching maturities decreased by € 83.6 million to € 4.2 million. Together with cash and cash equivalents of € 161.8 million (31 March 2016: € 171.9 million), AT&S thus has cash and cash equivalents of € 166.0 million available or available in the short term. The further financing of the start-up phase of the plants in Chongqing and the necessary investments in the last quarter are thus secured. In addition, AT&S has unused credit lines of € 223.8 million as a financial reserve.
Equity declined by € 22.1 million or -3.9% from € 568.9 million to € 546.8 million. The decline resulted from the loss for the period of € 19.7 million and the dividend payout of € 14.0 million, which was partially com-pensated by positive currency differences of € 11.6 million from the translation of the net asset position of subsidiaries as well as the translation of long-term loans to subsidiaries. The resulting equity ratio, at 38.1%, was -4.2 percentage points lower than at 31 March 2016 due to the increase in total assets.
Development of EBIT in %
EBIT margin in %
76.1
11.8
Q1-3 2015/16 Q1-3 2016/17
13.0
1.9
Q1-3 2015/16 Q1-3 2016/17

08
Net debt rose by € 188.6 million or 71.7% from € 263.2 million to € 451.8 million. This expected increase resulted from high investment activities and the increase in working capital, which cannot be financed from the operating result.
The net gearing ratio, at 82.6%, was at a higher level than at 31 March 2016, at 46.3%. This increase results from higher net debt on the one hand and from the slight decrease in equity due to the above-mentioned effects on the other hand.
In the first nine months, further optimisation measures were implemented in the treasury area. In addition to the payout of € 100.0 million from the bilateral promissory note loan with a term of 7 years, which had been signed at the end of March 2016, another bilateral promissory note loan of € 50.0 million, with a term of 5 years, was signed and paid out in May 2016. In addition, an OeKB equity financing transaction of € 75.0 million was concluded with a consortium of Austrian banks at the end of June 2016. Of this total, € 25.0 million can be drawn until 31 December 2017 and € 50.0 million until 31 March 2018. After a grace period, the repayments will be made from 30 September 2018 to 30 June 2026. In addition to these three major transactions, several smaller transactions were carried out, which led to new loans or credit lines and to an improvement of existing credit lines. The funds received will on the one hand be used for the optimisa-tion of the existing loan structure; on the other hand, they enable AT&S to take advantage of the low interest level compared to the past years. The scheduled repayment of the bond with a nominal value of € 75.5 million, which carried 5.0% interest, leads to a significant reduction of financing costs.
BUSINESS DEVELOPMENT BY SEGMENTS The AT&S Group breaks its operating activities down into three segments: Mobile Devices & Substrates, Automotive, Industrial, Medical, and Others. For further information on the segments and the segment reporting please refer to the Annual Report 2015/16.
AT&S has successfully positioned itself as a high-end manufacturer in all three segments. The share of the Mobile Devices & Substrates segment in total external revenue rose from 60.2% to 60.6%. The share of the Automotive, Industrial, Medical segment declined to 38.9% (previous year: 39.4%) despite an increase in absolute terms. The significance of the Others segment remained approximately constant at 0.5%.
MOBILE DEVICES & SUBSTRATES SEGMENT Demand for high-end printed circuit boards for mobile devices was good in the first nine months, but was characterised by substantially stronger seasonality in the first quarter compared with the prior-year period. Revenue from IC substrates overcompensated this development significantly. As a result, revenue rose by € 19.0 million or 4.5%, from € 419.6 million to € 438.6 million. Slightly negative currency developments burdened revenue growth.
Revenue from external customers by segment
in %
Mobile Devices & Substrates Development of revenue
€ in millions
60.2% 60.6%
39.4% 38.9%
0.4% 0.5%
Q1-3 2015/16 Q1-3 2016/17
419.
6
438.
6
Q1-3 2015/16 Q1-3 2016/17

09
Mobile Devices & Substrates segment – overview € in millions (unless otherwise stated)
Q1-3 2016/17
Q1-3 2015/16
Change
in %
Segment revenue 438.6
419.6
4.5%
Revenue from external customers 372.9
351.5
6.1%
Operating result before interest, tax, depreciation and amortisation (EBITDA)
56.1
109.1
(48.6%)
EBITDA margin (%) 12.8%
26.0%
EBITDA adjusted
1) 103.7
111.5
(7.0%)
EBITDA margin adjusted (%)
1) 25.0%
26.7%
Operating result (EBIT) (21.9)
53.9
(>100%)
EBIT margin (%) (5.0%)
12.9%
EBIT adjusted
1) 55.8
61.6
(9.4%)
EBIT margin adjusted (%)
1) 13.5%
14.8%
Additions to property, plant and equipment and intangible assets 169.2
202.1
(16.3%)
Employees (incl. leased personnel), average 6,624
5,916
12.0%
1) Adjusted for Chongqing project
EBITDA dropped by € 53.0 million or -48.6% from € 109.1 million to € 56.1 million and was primarily influ-enced by the start-up effects of the Chongqing project and the significantly increased price pressure for IC Substrates, due to major technology and product mix changes. Adjusted for the segment’s share of the start-up effects, EBITDA amounts to € 103.7 million (previous year: € 111.5 million), resulting in an adjusted EBITDA margin of 25.0%, which is lower than the adjusted prior-year level of 26.7%. This decrease in the EBITDA margin results from price/product mix effects, which were not fully compensated by the current cost-saving measures and positive currency translation effects.
The segment’s depreciation and amortisation rose by € 22.7 million or 41.1% from € 55.2 million to € 77.9 million. The increase was primarily to depreciation of the new plants for IC substrates and substrate-like printed circuit boards in Chongqing. As a result, EBIT amounted to € -21.9 million, down € 75.8 million on the figure of the previous year. Adjusted for the effects of the Chongqing project, EBIT amounts to € 55.8 million (previous year: € 61.6 million). The resulting adjusted EBIT margin is 13.5% (previous year: 14.8%).
At the Chongqing site, additions to assets of € 118.5 million were recorded in the first nine months (previous year: € 154.5 million). The other additions were related to technology upgrades at the Shanghai site. The increase in the number of employees by 708 persons is primarily attributable to the establishment of the Chongqing plant.
Mobile Devices & Substrates EBITDA Development € in millions
109.
1
56.1
Q1-3 2015/16 Q1-3 2016/17
10
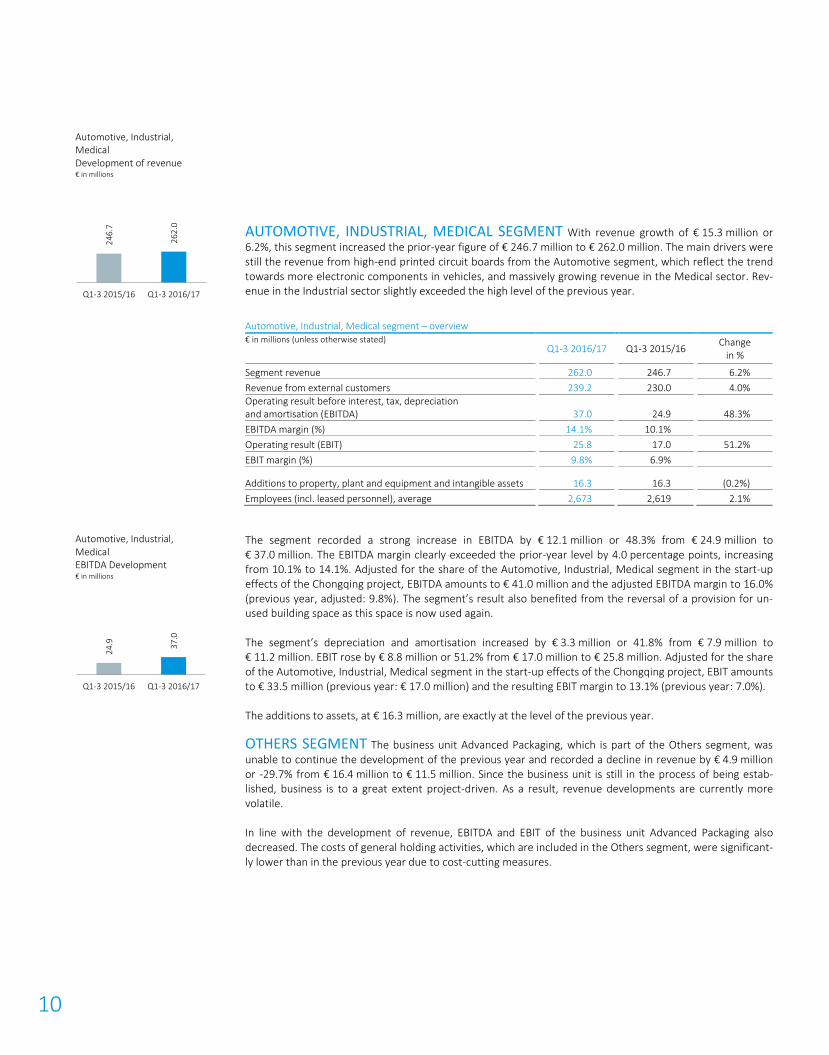
AUTOMOTIVE, INDUSTRIAL, MEDICAL SEGMENT With revenue growth of € 15.3 million or 6.2%, this segment increased the prior-year figure of € 246.7 million to € 262.0 million. The main drivers were still the revenue from high-end printed circuit boards from the Automotive segment, which reflect the trend towards more electronic components in vehicles, and massively growing revenue in the Medical sector. Rev-enue in the Industrial sector slightly exceeded the high level of the previous year.
Automotive, Industrial, Medical segment – overview € in millions (unless otherwise stated)
Q1-3 2016/17
Q1-3 2015/16
Change
in %
Segment revenue 262.0
246.7
6.2%
Revenue from external customers 239.2
230.0
4.0%
Operating result before interest, tax, depreciation and amortisation (EBITDA)
37.0
24.9
48.3%
EBITDA margin (%) 14.1%
10.1%
Operating result (EBIT) 25.8
17.0
51.2%
EBIT margin (%) 9.8%
6.9%
Additions to property, plant and equipment and intangible assets 16.3
16.3
(0.2%)
Employees (incl. leased personnel), average 2,673
2,619
2.1%
The segment recorded a strong increase in EBITDA by € 12.1 million or 48.3% from € 24.9 million to € 37.0 million. The EBITDA margin clearly exceeded the prior-year level by 4.0 percentage points, increasing from 10.1% to 14.1%. Adjusted for the share of the Automotive, Industrial, Medical segment in the start-up effects of the Chongqing project, EBITDA amounts to € 41.0 million and the adjusted EBITDA margin to 16.0% (previous year, adjusted: 9.8%). The segment’s result also benefited from the reversal of a provision for un-used building space as this space is now used again.
The segment’s depreciation and amortisation increased by € 3.3 million or 41.8% from € 7.9 million to € 11.2 million. EBIT rose by € 8.8 million or 51.2% from € 17.0 million to € 25.8 million. Adjusted for the share of the Automotive, Industrial, Medical segment in the start-up effects of the Chongqing project, EBIT amounts to € 33.5 million (previous year: € 17.0 million) and the resulting EBIT margin to 13.1% (previous year: 7.0%).
The additions to assets, at € 16.3 million, are exactly at the level of the previous year.
OTHERS SEGMENT The business unit Advanced Packaging, which is part of the Others segment, was unable to continue the development of the previous year and recorded a decline in revenue by € 4.9 million or -29.7% from € 16.4 million to € 11.5 million. Since the business unit is still in the process of being estab-lished, business is to a great extent project-driven. As a result, revenue developments are currently more volatile.
In line with the development of revenue, EBITDA and EBIT of the business unit Advanced Packaging also decreased. The costs of general holding activities, which are included in the Others segment, were significant-ly lower than in the previous year due to cost-cutting measures.
Automotive, Industrial, Medical Development of revenue € in millions
Automotive, Industrial, Medical EBITDA Development € in millions
246.
7
262.
0
Q1-3 2015/16 Q1-3 2016/17
24.9 37
.0
Q1-3 2015/16 Q1-3 2016/17

11
Others segment – overview € in millions (unless otherwise stated)
Q1-3 2016/17
Q1-3 2015/16
Change
in %
Segment revenue 11.5
16.4
(29.7%)
Revenue from external customers 3.0
2.9
4.7%
Operating result before interest, tax, depreciation and amortisation (EBITDA)
9.1
6.1
48.8%
EBITDA margin (%) 78.7%
37.2%
Operating result (EBIT) 7.9
5.0
58.2%
EBIT margin (%) 68.8%
30.6%
Additions to property, plant and equipment and intangible assets 0.9
5.8
(85.3%)
Employees (incl. leased personnel), average 155
153
1.7%
SIGNIFICANT EVENTS AFTER THE INTERIM REPORTING PERIOD No significant events occurred after the end of the interim reporting period.
SIGNIFICANT RISKS, UNCERTAINTIES AND OPPORTUNITIES In the Group Management Report of the consolidated financial statements 2015/16 the relevant risk categories are explained in detail under section 6 “Risk and opportunities management”, which still apply at the reporting date. As described in this chapter, incorrect assessments of technological developments, changes in demand and negative price developments can have severe adverse effects on the intrinsic value of investments. This may have an im-pact, in particular, on entry into the substrate business, but also to all current AT&S business activities in general.
OUTLOOK For the fourth quarter 2016/17 AT&S expects the usual seasonality. Based on the development of the raw material markets (copper and laminates), a higher pressure on material costs is expected. In the case of IC substrates, there is still a high price pressure due to the changes in market and technology devel-opments.
Provided that the macroeconomic environment remains stable, the USD-EUR currency relation stays at a similar level as in the past financial year 2015/16 and demand is stable in the core business, the management expects an increase in revenue of 4-6% for the current financial year 2016/17. The EBITDA margin should range between 15-16% primarily due to the expected burdens related to the further ramp-up in Chongqing. However, the EBITDA margin in the core business should be at a similar level as in the financial year 2015/16. Higher depreciation and amortisation of an additional € 40 million for the Chongqing project in the financial year 2016/17 will have a significant influence on EBIT.
Leoben-Hinterberg, 30 January 2017
Management Board
Andreas Gerstenmayer m.p. Karl Asamer m.p. Heinz Moitzi m.p.

12
€ in thousands 01 Oct - 31 Dec 2016 01 Oct - 31 Dec 2015 01 Apr - 31 Dec 2016 01 Apr - 31 Dec 2015
Revenue 228,553
197,204
615,063
584,333
Cost of sales (201,938)
(153,407)
(566,396)
(455,662)
Gross profit 26,615
43,797
48,667
128,671
Distribution costs (7,777)
(8,923)
(21,725)
(26,115)
General and administrative costs (6,918)
(8,251)
(20,023)
(21,789)
Other operating result 5,738
(1,291)
4,921
(4,693)
Operating result 17,658
25,332
11,840
76,074
Finance income 758
1,279
1,855
6,174
Finance costs (9,263)
(3,968)
(20,406)
(8,838)
Finance costs – net (8,505)
(2,689)
(18,551)
(2,664)
Profit/(loss) before tax 9,153
22,643
(6,711)
73,410
Income taxes (14,063)
(4,552)
(13,038)
(13,182)
Profit/(loss) for the period (4,910)
18,091
(19,749)
60,228
Attributable to owners of the parent company (4,910)
18,067
(19,749)
60,133
Attributable to non-controlling interests –
24
–
95
Earnings per share attributable to equity holders of the parent company (in € per share):
– basic (0.13)
0.47
(0.51)
1.55
– diluted (0.13)
0.47
(0.51)
1.55
Weighted average number of shares outstanding – basic (in thousands)
38,850
38,850
38,850
38,850
Weighted average number of shares outstanding – diluted (in thousands)
38,850
38,850
38,850
38,850
Consolidated Statement of Comprehensive Income € in thousands 01 Oct - 31 Dec 2016 01 Oct - 31 Dec 2015 01 Apr - 31 Dec 2016 01 Apr - 31 Dec 2015
Profit/(loss) for the period (4,910) 18,091 (19,749) 60,228 Items to be reclassified:
Currency translation differences 19,773 7,257 11,590 (50,484)
(Losses) from the fair value measurement of hedging instruments for cash flow hedges, net of tax – (825) – (467)
Other comprehensive income for the period 19,773 6,432 11,590 (50,951) Total comprehensive income for the period 14,863 24,523 (8,159) 9,277
Attributable to owners of the parent company 14,863 24,489 (8,159) 9,198 Attributable to non-controlling interests – 34 – 79
Interim Financial Report (IFRS) Consolidated Statement of Profit or Loss

13
€ in thousands 31 Dec 2016 31 Mar 2016
ASSETS Property, plant and equipment 794,563
689,161
Intangible assets 95,857
103,736
Financial assets 173
96
Deferred tax assets 30,740
33,826
Other non-current assets 57,995
39,519
Non-current assets 979,328
866,338
Inventories 100,939
83,438
Trade and other receivables 186,674
134,687
Financial assets 4,193
87,817
Current income tax receivables 362
504
Cash and cash equivalents 161,810
171,866
Current assets 453,978
478,312
Total assets 1,433,306
1,344,650
EQUITY
Share capital 141,846
141,846
Other reserves 85,278
73,688
Retained earnings 319,667
353,402
Equity attributable to owners of the parent company 546,791
568,936
Total equity 546,791
568,936
LIABILITIES
Financial liabilities 527,951
361,558
Provisions for employee benefits 38,223
36,293
Other provisions 4,014
6,957
Deferred tax liabilities 4,532
8,844
Other liabilities 11,832
7,755
Non-current liabilities 586,552
421,407
Trade and other payables 194,741
180,257
Financial liabilities 90,034
161,413
Current income tax payables 10,727
7,557
Other provisions 4,461
5,080
Current liabilities 299,963
354,307
Total liabilities 886,515
775,714
Total equity and liabilities 1,433,306
1,344,650
Consolidated Statement of Financial Position

14
€ in thousands 01 Apr - 31 Dec 2016 01 Apr - 31 Dec 2015
Operating result 11,840
76,074
Depreciation, amortisation and impairment of property, plant and equipment and intangible assets incl. write-ups
90,269
64,159
Gains/losses from the sale of fixed assets (6)
279
Changes in non-current provisions (1,112)
1,611
Non-cash expense/(income), net (4,147)
(4,282)
Interest paid (12,833)
(10,151)
Interest received 1,204
2,308
Income taxes paid (10,706)
(6,575)
Cash flow from operating activities before changes in working capital 74,509
123,423
Inventories (16,315)
(3,811)
Trade and other receivables (64,400)
10,679
Trade and other payables 23,705
(542)
Other provisions (695)
149
Cash flow from operating activities 16,804
129,898
Capital expenditure for property, plant and equipment and intangible assets (195,184)
(177,022)
Proceeds from the sale of property, plant and equipment and intangible assets 2,907
105
Capital expenditure for financial assets (82,001)
(221)
Proceeds from the sale of financial assets 165,628
1,471
Cash flow from investing activities (108,650)
(175,667)
Proceeds from borrowings 207,807
244,148
Repayments of borrowings (121,765)
(29,746)
Proceeds from government grants 6,384
3,701
Dividends paid (13,986)
(13,986)
Cash flow from financing activities 78,440
204,117
Change in cash and cash equivalents (13,406)
158,348
Cash and cash equivalents at beginning of the year 171,866
273,919
Exchange gains/(losses) on cash and cash equivalents 3,350
(6,034)
Cash and cash equivalents at end of the period 161,810
426,233
Consolidated Statement of Cash Flows
15
€ in thousands Share capital
Other reserves
Retained earnings
Equity attributable to owners
of the parent company
Non- controlling interests
Total equity
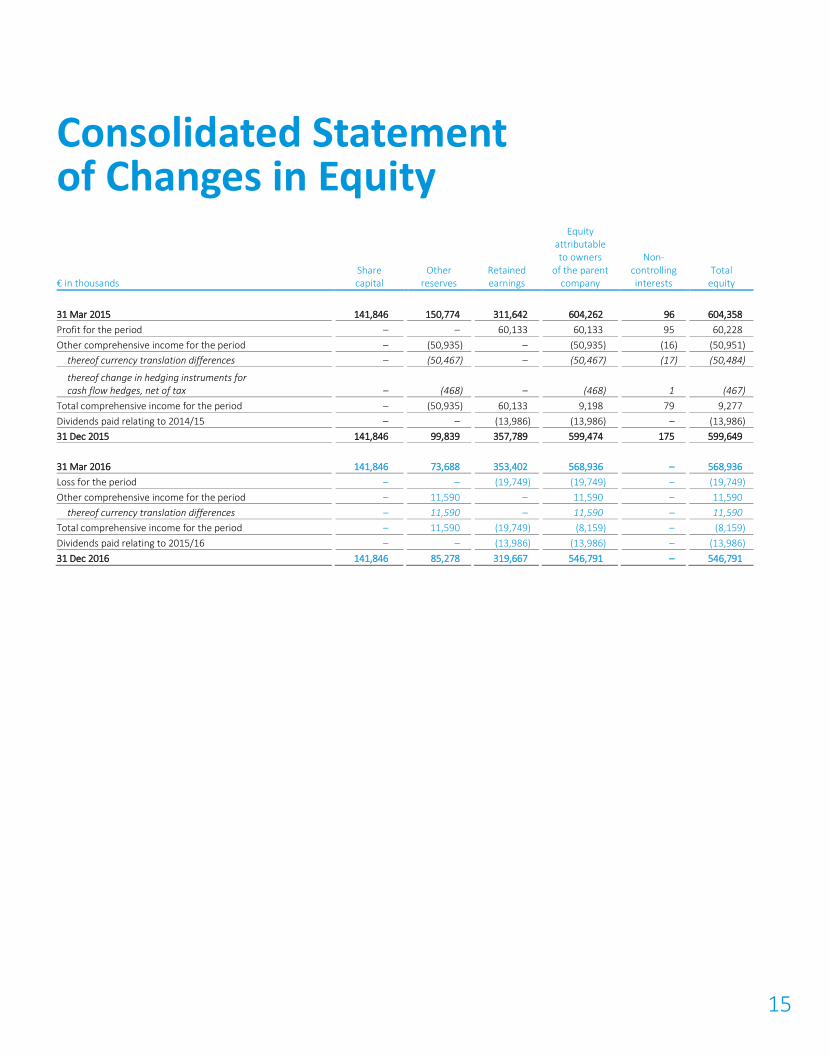
31 Mar 2015 141,846
150,774
311,642
604,262
96
604,358
Profit for the period –
–
60,133
60,133
95
60,228
Other comprehensive income for the period –
(50,935)
–
(50,935)
(16)
(50,951)
thereof currency translation differences –
(50,467)
–
(50,467)
(17)
(50,484)
thereof change in hedging instruments for cash flow hedges, net of tax
–
(468)
–
(468)
1
(467)
Total comprehensive income for the period –
(50,935)
60,133
9,198
79
9,277
Dividends paid relating to 2014/15 –
–
(13,986)
(13,986)
–
(13,986)
31 Dec 2015 141,846
99,839
357,789
599,474
175
599,649
31 Mar 2016 141,846
73,688
353,402
568,936
–
568,936
Loss for the period –
–
(19,749)
(19,749)
–
(19,749)
Other comprehensive income for the period –
11,590
–
11,590
–
11,590
thereof currency translation differences –
11,590
–
11,590
–
11,590
Total comprehensive income for the period –
11,590
(19,749)
(8,159)
–
(8,159)
Dividends paid relating to 2015/16 –
–
(13,986)
(13,986)
–
(13,986)
31 Dec 2016 141,846
85,278
319,667
546,791
–
546,791
Consolidated Statement of Changes in Equity
16
€ in thousands
Mobile Devices & Substrates
Automotive, Industrial, Medical
Others
Elimination/ Consolidation
Group
01 Apr - 31 Dec 2016
01 Apr - 31 Dec 2015
01 Apr - 31 Dec 2016
01 Apr - 31 Dec 2015
01 Apr - 31 Dec 2016
01 Apr - 31 Dec 2015
01 Apr - 31 Dec 2016
01 Apr - 31 Dec 2015
01 Apr - 31 Dec 2016
01 Apr - 31 Dec 2015
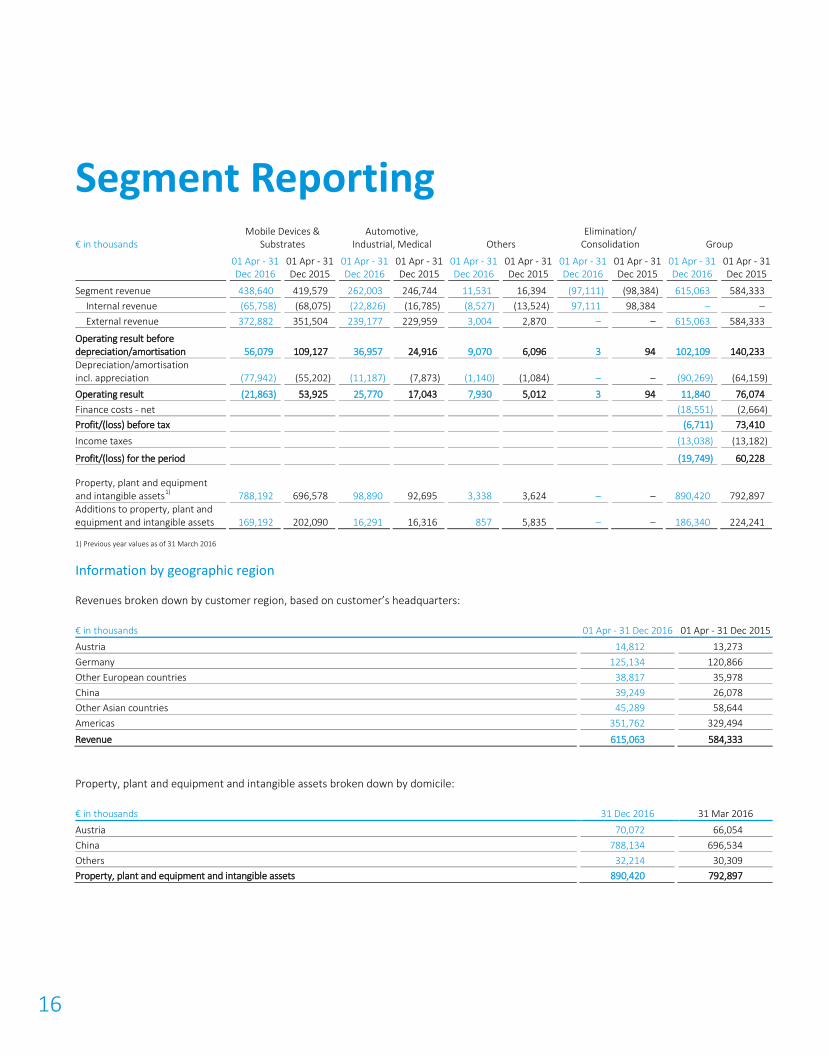
Segment revenue 438,640
419,579
262,003
246,744
11,531
16,394
(97,111)
(98,384)
615,063
584,333
Internal revenue (65,758)
(68,075)
(22,826)
(16,785)
(8,527)
(13,524)
97,111
98,384
–
–
External revenue 372,882
351,504
239,177
229,959
3,004
2,870
–
–
615,063
584,333
Operating result before depreciation/amortisation
56,079
109,127
36,957
24,916
9,070
6,096
3
94
102,109
140,233
Depreciation/amortisation incl. appreciation
(77,942)
(55,202)
(11,187)
(7,873)
(1,140)
(1,084)
–
–
(90,269)
(64,159)
Operating result (21,863)
53,925
25,770
17,043
7,930
5,012
3
94
11,840
76,074
Finance costs - net
(18,551)
(2,664)
Profit/(loss) before tax
(6,711)
73,410
Income taxes
(13,038)
(13,182)
Profit/(loss) for the period
(19,749)
60,228
Property, plant and equipment and intangible assets
1) 788,192
696,578
98,890
92,695
3,338
3,624
–
–
890,420
792,897
Additions to property, plant and equipment and intangible assets
169,192
202,090
16,291
16,316
857
5,835
–
–
186,340
224,241
1) Previous year values as of 31 March 2016
Information by geographic region
Revenues broken down by customer region, based on customer’s headquarters:
€ in thousands 01 Apr - 31 Dec 2016 01 Apr - 31 Dec 2015 Austria
14,812
13,273
Germany 125,134
120,866
Other European countries 38,817
35,978
China 39,249
26,078
Other Asian countries 45,289
58,644
Americas 351,762
329,494
Revenue 615,063
584,333
Property, plant and equipment and intangible assets broken down by domicile:
€ in thousands 31 Dec 2016 31 Mar 2016 Austria
70,072
66,054
China 788,134
696,534
Others 32,214
30,309
Property, plant and equipment and intangible assets 890,420
792,897
Segment Reporting

17
GENERAL INFORMATION ACCOUNTING AND MEASUREMENT POLICIES The interim report for the nine months ended 31 December 2016 has been prepared in accordance with the standards (IFRS and IAS) and interpretations (IFRIC and SIC) of the International Accounting Standards Board (IASB), taking IAS 34 into account, as adopted by the European Union.
The interim consolidated financial statements do not include all the information contained in the annual consolidated financial statements and should be read in conjunction with the consolidated annual financial statements for the year ended 31 March 2016.
The interim consolidated statements ended 31 December 2016 are unaudited and have not been the subject of external audit review.
NOTES TO THE STATEMENT OF PROFIT OR LOSS REVENUE Group revenue in the first nine months of the current financial year increased by 5.3% from € 584.3 million in the same period last year to € 615.1 million.
GROSS PROFIT The current gross profit of € 48.7 million was 62.2% lower than the € 128.7 million achieved in the same period last year. This unsatisfactory outcome results from start-up costs for the Chong-qing project and an increase in cost of sales.
OPERATING RESULT On the basis of the decreased gross profit, the consolidated operating result of AT&S declined to € 11.8 million or 1.9% of revenue. In contrast, lower administration and distribution costs, an adjustment of variable remuneration components to the expected target achievement level as well as the reversal of a provision for unused building space amounting to € 3.3 million because these spaces are used again had a positive effect.
FINANCE COSTS - NET The finance costs of € 20.4 million were above the prior-year level due to foreign exchange losses and higher interest costs. The financial income from the investment of free cash basically was € 1.9 million. As a consequence, net finance costs decreased by € 15.9 million in comparison to the same period of the previous year and amounted to € -18.6 million. The net finance costs include gains from capital-ised interest of € 2.2 million (previous year: € 4.7 million). Net interest expense on personnel-related liabili-ties of € 0.6 million is recognised in “finance costs – net” (previous year: € 0.5 million).
INCOME TAXES The change of the effective tax rate on the consolidated level compared with the same period of the previous year mainly results from losses of AT&S (Chongqing) Company Limited for which, based on current estimates, no deferred taxes have been capitalised as they are not expected to be realised within the provided statutory period. Furthermore, it was affected by the discontinuation of the reduced tax rate at AT&S (China) Company Limited on 31.12.2016 (efforts to a return to the favoured tax scheme started). In addition, there was a change in the expected dividend payout rate for the shares in subsidiaries, which resulted in tax income.
NOTES TO THE STATEMENT OF COMPREHENSIVE INCOME CURRENCY TRANSLATION DIFFERENCES The increase in the foreign currency translation reserves in the current financial year by € 11.6 million was the result of the change in exchange rate of the Group’s func-tional currency, the Chinese yuan renminbi, against the Group’s reporting currency, the euro, and the US dollar.
Notes to the Interim Financial Report
18
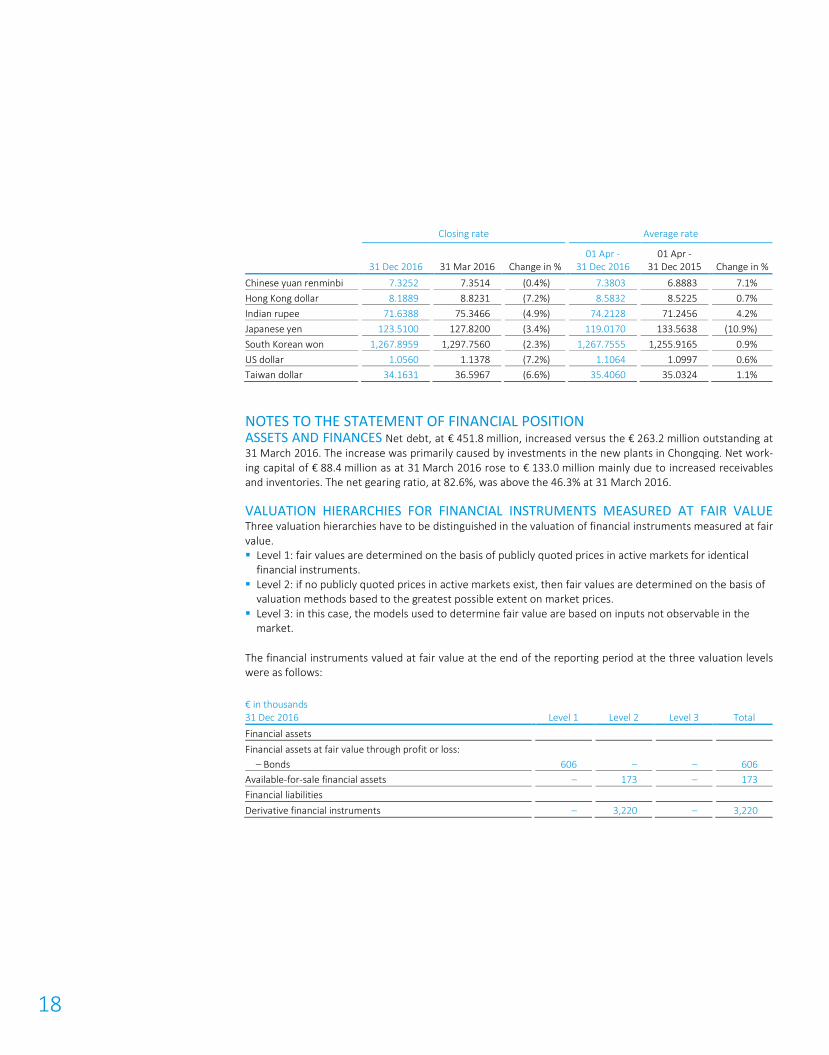
Closing rate
Average rate
31 Dec 2016 31 Mar 2016 Change in % 01 Apr -
31 Dec 2016 01 Apr -
31 Dec 2015 Change in % Chinese yuan renminbi
7.3252
7.3514
(0.4%)
7.3803
6.8883
7.1%
Hong Kong dollar 8.1889
8.8231
(7.2%)
8.5832
8.5225
0.7%
Indian rupee 71.6388
75.3466
(4.9%)
74.2128
71.2456
4.2%
Japanese yen 123.5100
127.8200
(3.4%)
119.0170
133.5638
(10.9%)
South Korean won 1,267.8959
1,297.7560
(2.3%)
1,267.7555
1,255.9165
0.9%
US dollar 1.0560
1.1378
(7.2%)
1.1064
1.0997
0.6%
Taiwan dollar 34.1631
36.5967
(6.6%)
35.4060
35.0324
1.1%
NOTES TO THE STATEMENT OF FINANCIAL POSITION ASSETS AND FINANCES Net debt, at € 451.8 million, increased versus the € 263.2 million outstanding at 31 March 2016. The increase was primarily caused by investments in the new plants in Chongqing. Net work-ing capital of € 88.4 million as at 31 March 2016 rose to € 133.0 million mainly due to increased receivables and inventories. The net gearing ratio, at 82.6%, was above the 46.3% at 31 March 2016.
VALUATION HIERARCHIES FOR FINANCIAL INSTRUMENTS MEASURED AT FAIR VALUE Three valuation hierarchies have to be distinguished in the valuation of financial instruments measured at fair value. Level 1: fair values are determined on the basis of publicly quoted prices in active markets for identical
financial instruments. Level 2: if no publicly quoted prices in active markets exist, then fair values are determined on the basis of
valuation methods based to the greatest possible extent on market prices. Level 3: in this case, the models used to determine fair value are based on inputs not observable in the
market.
The financial instruments valued at fair value at the end of the reporting period at the three valuation levels were as follows:
€ in thousands 31 Dec 2016 Level 1 Level 2 Level 3 Total Financial assets
Financial assets at fair value through profit or loss:
– Bonds 606
–
–
606
Available-for-sale financial assets –
173
–
173
Financial liabilities
Derivative financial instruments –
3,220
–
3,220

19
€ in thousands 31 Mar 2016 Level 1 Level 2 Level 3 Total Financial assets
Financial assets at fair value through profit or loss:
– Bonds 631
–
–
631
Available-for-sale financial assets –
96
–
96
Financial liabilities
Derivative financial instruments –
3,871
–
3,871
Bonds, export loans, government loans and other bank borrowings amounting to € 614.8 million (31 March 2016: € 519.1 million) are measured at amortised cost. The fair value of these liabilities was € 620.6 million (31 March 2016: € 526.0 million).
OTHER FINANCIAL COMMITMENTS At 31 December 2016 the Group had other financial commit-ments amounting to € 96.4 million in connection with contractually binding investment commitments, the greater part of which related to the continuing construction of the new site in Chongqing and investments in the Shanghai and Leoben plants. As at 31 March 2016 other financial commitments stood at € 80.1 million.
EQUITY Consolidated equity decreased from € 568.9 million at 31 March 2016 to € 546.8 million due to the dividend payment of € -14.0 million, the consolidated loss for the period of € -19.7 million and positive im-pacts from currency translation differences of € 11.6 million.
At the 20th Annual General Meeting on 3 July 2014 the Management Board was authorised until 2 July 2019 to increase the share capital of the Company, subject to the approval of the Supervisory Board, by up to € 21,367,500 by way of issuing up to 19,425,000 no-par value bearer shares, for contributions in cash or kind, in one or more tranches, including issue by means of an indirect share offering via banks in accordance with section 153 para 6 Austrian Stock Corporation Act (AktG). The Management Board was authorised, subject to the approval of the Supervisory Board, to determine the detailed terms and conditions of issue (in particular, issue price, nature of contributions in kind, rights related to shares, exclusion of subscription rights, etc.) (authorised capital). The Supervisory Board was authorised to approve changes in the Articles of Association required by the issue of shares out of authorised capital. The Annual General Meeting approved a resolution amending Section 4 (Nominal Capital) of the Articles of Association to reflect this change.
In addition, at the 20th Annual General Meeting of 3 July 2014 the resolution of the Annual General Meeting of 7 July 2010 authorising the issue of convertible bonds was rescinded and at the same time the Manage-ment Board was authorised until 2 July 2019, subject to the approval of the Supervisory Board, to issue con-vertible bearer bonds up to a maximum nominal value of € 150,000,000 in one or more tranches, and to grant the holders of the convertible bond subscription and/or conversion rights for up to 19,425,000 new no-par value bearer shares in the Company in accordance with the terms and conditions of the convertible bond to be determined by the Management Board. For this purpose, in accordance with section 159 para 2 item 1 AktG, the share capital of the Company was also conditionally increased by up to € 21,367,500 in the form of up to 19,425,000 new no-par value bearer shares. This capital increase will only take place to the extent that holders of convertible bonds exercise their conversion or subscription rights in accordance with the resolu-tion of the Annual General Meeting of 3 July 2014. The Management Board was also authorised, subject to the approval of the Supervisory Board, to determine further details of the conditional capital increase (in particular, the amount of the issue and the rights related to shares).
With respect to the authorised share capital increase and/or the conditional capital increase, the following restrictions on the amounts of the increases are to be observed, as required under the resolutions passed at

20
the 20th Annual General Meeting of 3 July 2014: The total of (i) the number of new shares actually issued or potentially issuable out of conditional capital under the terms and conditions of the convertible bonds, and (ii) the number of shares issued out of authorised capital may not exceed 19,425,000 (definition of amount of authorisations).
TREASURY SHARES At the 21st Annual General Meeting of 9 July 2015 the Management Board was again authorised for a period of 30 months from the date of the resolution to acquire and retire the Company’s own shares up to a maximum amount of 10% of the share capital at a lowest price that may be no more than 30% lower than the average unweighted closing price of the previous 10 trading days and at a highest price per share of a maximum of up to 30% above the average unweighted closing price of the previous 10 trading days. The Management Board was also authorised to withdraw repurchased treasury shares as well as treas-ury shares already held by the Company without any further resolution of the Annual General Meeting. The Management Board was also again authorised – for a period of five years (i.e., until 8 July 2020), upon ap-proval of the Supervisory Board – to sell or use the repurchased treasury shares or treasury shares already held by the Company otherwise than through the stock exchange or by means of public offerings, and in particular for the purpose of enabling the exercise of employee stock options or the conversion of convertible bonds, or as consideration for the acquisition of businesses or other assets, or for any other legally permissi-ble purpose.
On 31 December 2016, the Group held no treasury shares.
NOTES TO THE STATEMENT OF CASH FLOWS Cash flow from operating activities amounted to € 16.8 million compared with € 129.9 million in the same period last year. The decrease is mainly due to the losses for the period and the increased net working capital.
The cash flow from investing activities of € -108.6 million is below the level of € -175.7 million reached in the same period last year. Thereof capital expenditure for property, plant and equipment and intangible assets accounts for € 195.2 million. This year’s capital expenditures are predominantly in the new plants in Chong-qing and technology upgrades in the other plants. Capital expenditure for financial assets amounts to € 82.0 million, and proceeds from the sale of financial assets amount to € 165.6 million for investment and reinvestments of liquid funds. At 31 December, payables for capex amount to € 44.6 million, which will be-come payable in the coming period.
Cash flow from financing activities amounted to € 78.4 million and is mainly attributable to the obtaining of two promissory note loans at an amount of € 150.0 million in April and May 2016 as well as the scheduled repayment of the bond in November 2016 at an amount of € 75.5 million.
The non-cash expense/income is as follows:
€ in thousands 01 Apr - 31 Dec 2016 01 Apr - 31 Dec 2015 Release of government grants
(1,141)
(1,067)
Other non-cash expense/(income), net (3,006)
(3,215)
Non-cash expense/(income), net (4,147)
(4,282)
OTHER INFORMATION DIVIDENDS The Annual General Meeting of 7 July 2016 resolved on a dividend payment of € 0.36 per share out of retained earnings as at 31 March 2016. The dividend distribution of € 14.0 million took place on 28 July 2016.

21
RELATED PARTY TRANSACTIONS In connection with various projects, the Group received consulting services from companies where Supervisory Board chairman Mr. Androsch (AIC Androsch International Man-agement Consulting GmbH) and Supervisory Board deputy chairman Mr. Dörflinger (Dörflinger Management & Beteiligungs GmbH) are managing directors with the power of sole representation. The fees charged are as follows:
€ in thousands 01 Apr - 31 Dec 2016 01 Apr - 31 Dec 2015 AIC Androsch International Management Consulting GmbH
284
304
Dörflinger Management & Beteiligungs GmbH 4
4
Total fees 288
308
At the balance sheet date, there are no outstanding balances or obligations to the above mentioned legal and consulting companies.
Leoben-Hinterberg, 30 January 2017
Management Board
Andreas Gerstenmayer m.p. Karl Asamer m.p. Heinz Moitzi m.p.

22
We confirm to the best of our knowledge that the interim financial statements give a true and fair view of the assets, liabilities, financial position and profit or loss of the group as required by the applicable accounting standards and that the group interim management report gives a true and fair view of important events that have occurred during the first nine months of the financial year and their impact on the interim financial statements, of the principal risks and uncertainties for the remaining three months of the financial year and of the major related party transactions to be disclosed.
Leoben-Hinterberg, 30 January 2017
The Management Board
Andreas Gerstenmayer m.p. Chief Executive Officer
Karl Asamer m.p. Chief Financial Officer
Heinz Moitzi m.p. Chief Operations Officer
Statement of all Legal Representatives
23
CONTACT AT & S Austria Technologie & Systemtechnik Aktiengesellschaft Fabriksgasse 13 8700 Leoben Austria Phone: +43 (0)3842 200-0 www.ats.net
INVESTOR RELATIONS & COMMUNICATIONS Elke Koch Phone: +43 (0)3842 200-5925 [email protected]
PUBLISHED BY AND RESPONSIBLE FOR CONTENT AT & S Austria Technologie & Systemtechnik Aktiengesellschaft Fabriksgasse 13 8700 Leoben Austria www.ats.net
PHOTOS/ILLUSTRATIONS Andreas Jakwerth: page 24 Klaus Vyhnalek: page 3 Werbeagentur DMP: page 4 DISCLAIMER This report contains forward-looking statements which were made on the basis of the information available at the time of publication. These can be identified by the use of such expressions as “expects”, “plans”, “an-ticipates”, “intends”, “could”, “will”, “aim” and “estimation” or other similar words. These statements are based on current expectations and assumptions. Such statements are by their very nature subject to known and unknown risks and uncertainties. As a result, actual developments may vary significantly from the for-ward-looking statements made in this report. Recipients of this report are expressly cautioned not to place undue reliance on such statements. Neither AT&S nor any other entity accept any responsibility for the cor-rectness and completeness of the forward-looking statements contained in this report. AT&S undertakes no obligation to update or revise any forward-looking statements, whether as a result of changed assumptions or expectations, new information or future events.
Percentages and individual items presented in this report are rounded which may result in rounding differences.
Formulations attributable to people are to be understood as gender-neutral.
This report in no way represents an invitation or recommendation to buy or sell shares in AT&S.
The report is published in German and English. In case of doubt, the German version is binding.
No responsibility accepted for errors or omissions.
Contact/Publication details
24