attachment a - sae international...2013/06/25 · 1) th t t i di t th t c l t h ld b id d iti ti f...
TRANSCRIPT

Attachment A
OEM Data on Refrigerant Distribution in AC System Components
(Example 1)

Refrigerant Distribution Analysis
Updated Jun 25, 2013

Refrigerant Distribution for Three Configurations
• System On data from A/C Simulation software and bench data • System off data assumes Evaporator ambient is 12°C and is the
refrigerant is superheated • All other components/lines are saturated at 10°C
ambient
Component
Description
System Off
(10°C)
System On
High Load
(30°C/80%RH)
System On
Low Load
(10°C/60%RH)
Discharge Line 11% 2% 1%
Condenser/Receiver 47% 72% 70%
Liquid Line 6% 20% 22%
Evaporator 3% 4% 5%
Suction Line 31% 1% 2%
Compressor 2% <1% <1%
Total 100% 100% 100%
Refrigerant Distribution HEV Sedan
Component
Description
System Off
(10°C)
System On
High Load
(30°C/80%RH)
System On Low
Load
(10°C/60%RH)
Discharge Line 12% 2% 1%
Condenser/Receiver 39% 74% 73%
Liquid Line (Main) 4% 14% 15%
Evaporator (Main) 5% 7% 9%
Suction Line (Main) 29% 2% 2%
Compressor 11% 1% 1%
Total 100% 100% 100%
Refrigerant Distribution Van Front Only
Component
Description
System Off
(10°C)
System On
High Load
(30°C/80%RH)
System On Low
Load
(10°C/60%RH)
Discharge Line 7% 2% 1%
Condenser/Receiver 22% 45% 44%
Liquid Line (Main) 2% 8% 9%
Liquid Line (Aux) 8% 29% 32%
Evaporator (Main) 2% 5% 6%
Evaporator (Aux) 2% 6% 6%
Suction Line (Main) 16% 1% 1%
Suction Line (Aux) 33% 3% 2%
Compressor 6% 1% <1%
Total 100% 100% 100%
Refrigerant Distribution Van Front & Aux

Attachment B
OEM Data on Refrigerant Distribution in AC System Components
(Example 2)

Refrigerant distribution per component:

Oil Distribution per component:

Refrigerant Distribution and Oil Distribution in percentage per Component:
High and medium ambient condition summary
Refrigerant and Compressor Oil Distribution Single evaporator system Oil Distribution (%)
Refrigerant Distribution (%)
Compressor / S ction line 44 1 2 2Compressor / Suction line 44.1 2.2
Condenser / Discharge line 33.8 77.5
Evaporator / TXV 21.4 9.0
AC liquid line 0.7 11.4
TOTAL: 100.0 100.0
Compressor / Suction line 41.8 3.1
Condenser / Discharge line 40.3 69.4
Evaporator / TXV 17.2 14.5
AC liquid line 0.7 13.0
TOTAL: 100.0 100.0

Attachment C
OEM Data on the Impact of Steam Release During Collision on Refrigerant Ignition and Fire Propagation (Example 1)

Coolant Behavior Consideration

Problem Definition
Question: What impact does the release of coolant have on the mitigation of refrigerant ignitions? Hypothesis: Releasing coolant will generate vapor aerosolized water particles (steam) that will displace oxygen, replacing it with a non-combustible material. The presence of steam would therefore tend to quench ignition and any propagation that may occur. Methodology:
1) Summarize theory of coolant release relating to oxygen
2) Rate of occurrence of radiator breach through CAE & crashed vehicles
3) Impact of steam during actual vehicle testing
4) Relevance of timing: steam generation vs presence of refrigerant
5) Conclusions

Theory of Coolant Release

Coolant Release Impact • When a radiator breaches, coolant is released under hood. This calculation
is performed at equilibrium vapor conditions and ideal gas assumptions. Does not consider aerosol effect.
• Plot shows
• R-1234yf @ 7.75 vol-% (stoich.)
• Dry air (79 vol-% N2 & 21 vol-% O2)
With a radiator breach containing
• 50:50 mix C2H6O2 and H2O
• Key Facts/Observations
• 15 vol-% O2 needed for ignition
• US Bureau of Mines Bulletin 627
• O2 < 15% occurs when coolant 70°C – 80°C
• Coolant temperature always > 80°C when exhaust surface > 700°C
• This analysis very conservative
• Not consider heat capacity of water vapor and aerosol
• Does not consider displacement of refrigerant by steam
• Heat sink to pull heat from ignition kernel of weak flame
Calculations suggest ignitions mitigated whenever coolant breach occurs

Rate of Occurrence of Coolant Breach - CAE and Crashed Vehicles -

Radiator Breach Behavior
Question: Coolant expected to have significant mitigating impact, but how often radiator breach occur during collision?
Vehicle Component Speed (kph)
20 25 30 35 40 45 50 55
Vehicle #1 Condenser n/a n/a
Radiator n/a n/a
Vehicle #2 Condenser
Radiator
Vehicle #3 Condenser
Radiator
Breach
No Breach
Uncertain CAE Analysis – front-end collision
CAE analysis indicates that radiator will always breach - at lower speeds than that required to breach the A/C system or - during a collision severe enough to breach A/C system

Radiator Breach Behavior (2)
Question: Coolant expected to have significant mitigating impact, but how often radiator breach occur during collision?
Vehicle Speed (kph) Radiator Condenser
Vehicle #1 56
Vehicle #2 42.5
Vehicle #3
45
45
45
50
50
Breach
No Breach
Vehicle Data– front-end collision
Vehicle data from actual crash tests validate CAE analysis radiator always breached - at lower speeds than that required to breach the A/C system or - during a collision severe enough to breach A/C system

Impact of steam during actual vehicle testing

Coolant release always mitigated ignition of refrigerant
Test Setup: - Daimler nozzle, fully tuned system for ignition, > 790°C surface temps, fan off
Sample of release test showing steam impact:
Steam Impact – Release Testing
Configuration # tests Result
No coolant release 5 Ignition (5/5)
Coolant Release 5 No Ignitions (0/5)

Coolant release always occurred. Refrigerant ignition never occurred
Test Setup: - Production level vehicle, all fluids, 750 - 790°C surface temps, 45kph - 50kph Sample of release test showing steam impact:
Steam Impact – full hot/wet crash tests
Under hood picture showing steam

Relevance of Timing - steam generation vs presence of refrigerant -

Timing of Steam Generation vs Refrigerant Release
Question: Calculations may show that coolant has a mitigating effect, but do the 2 occur at the same time and in the same location?
Steam generated in same location and for longer time than refrigerant concentration
Evidence:
Refrigerant often leaks out < 60sec Steam generated for minutes
This picture is 125 sec after collision (continues for many more minutes)

• Coolant release significantly mitigate refrigerant ignitions
– Calculations show O2 levels not high enough to support ignition
– CAE simulations indicate radiator will always breach
• At lower speeds than A/C system breach occur or
• During collision severe enough to damage A/C system
– Real crash data validate CAE simulations
– Release tests demonstrated coolant always mitigate refrigerant ignition
– Crash testing showed
• Coolant always released during testing
• No ignitions observed
Conclusions
All data collected by GM has shown that coolant release has a significant mitigating effect on refrigerant ignition/propagation

Attachment D
OEM Data on the Impact of Steam Release During Collision on Refrigerant Ignition and Fire Propagation (Example 2)

Executive Summary
Purpose1) Conduct Crash tests with production fluids in order to better understand input parameters and probabilities for the
CRP1234-4 Risk Assessment
Scope
1) Conduct Crash Tests on a C & D Segment Size Vehiclea) Crash Test Type is a 64kph Right Hand 40% Offset Rigid Barrierb) Engine RPM set to Maximum in order to achieve high exhaust temps with Air Conditioning Onc) All vehicle fluids filled to standard production levels, which includes R-1234yf & PAG Oil for the Air
Conditioning System
1) Both C & D Segment vehicle crash tests resulted in no Refrigerant Ignitiona) The maximum exhaust manifold surface temperature at impact was approximately 542 C
Conditioning System
Analysis
b) All A/C components (Compressor, Condenser and A/C Lines) were all brokenc) Considerable amount of steam was observed for more than 60 seconds after impact
i. Even if the exhaust surface temps were above 800C this would allow enough time for surface temps to drop below the refrigerant ignition temperature of 700 C, which is the conservative value that is used for the CRP1234-4 Risk Assessment
1. Exhaust Surface temps typically cool at a rate of 3 to 5 C per second at these extreme temperatures
1) Th t t i di t th t C l t h ld b id d iti ti f t i th F lt T A l i Ri kConclusion 1) These tests indicate that Coolant should be considered as a mitigating factor in the Fault Tree Analysis Risk assessment due to the considerable amount of steam observed after impact.

Details2
1 Crash Test Information1 Crash Test Information
1) Pre-conditiona) Ambient temperature: 15 ~ 20b) Engine RPM set to Maximum in order to achieve high exhaust temps with Air
Conditioning OnConditioning Onc) All vehicle fluids filled to standard production levels, which includes R-1234yf & PAG Oil
for the Air Conditioning SystemItems C SEG Passenger D SEG SUVEngine Gasoline I4 1.6L Gasoline V6 3.3LExhaust manifold position Rear side of eng. room Front/rear side of eng. roomp g gExhaust gas temperature( ) - 760Exhaust manifold surface temperature( ) 495~542 520Engine room air temperature ( ) 80~100 105Coolant temperature( ) 102 117Engine oil temperature( ) 136 144High pressure(psi) 207 218
2) Crash Test Typea) 64kph Right Hand 40% Offset Rigid Barrier
High pressure(psi) 207 218Low pressure(psi) - 23High pressure side temp.( ) 97 114~130Low pressure side temp.( ) 15 29
a) 64kph Right Hand 40% Offset Rigid Barrier
3) Test Results
Items C SEG Passenger D SEG SUVResult NO ignite NO igniteA/C C B k B kA/C components Compressor Broken Broken
Condenser Broken BrokenA/C plumbing Broken Broken

3
Details
2 Vehicle Layout
Items C SEG Passenger D SEG SUVLayout LHD LHD
2 Vehicle Layout
Layout LHD LHD
TXV
TXV
Engine T/M
Ex-mani
Engine T/M
Ex-mani
Engine T/M
Comp
Engine T/M
CompEx-mani
Cond Cond

Attachment E
OEM Test Data on Effect of Surface Temperature on Refrigerant Ignition (Example 1)

Graphical Summary of Flammability Testing of Refrigerant-Oil Mixtures
No ignitions
R-1
23
4yf
R-1
23
4yf
+ P
AG
oil
Veh #1 Veh #2 Veh #3
= Ignition Observed
= No Ignition
= Mixed Behavior Lab Tests Vehicle Tests (R-1234yf + PAG oil)
No ignitions
No ignitions
Veh #4 Veh #5
R-1
34
a +
PAG
oil
A
C
B
H
D
F E
G
Note: - Each data point represents a separate release on the subject vehicle - ‘hollow’ data points represent non-ignition releases
All data supports use of 700°C as minimum relevant temperature. No data supports use of auto-ignition temperature (405°C) as being relevant

Detailed Test Data (Lab Testing)
Figure Legend
Configuration Ignition Temperature Source
A R-134a + PAG oil > 800°C (no ignition observed) Ignition of refrigerant oil mixtures on hot Surfaces – Ineris (Jan 15, 2009) – CRP1234
B R-134a + PAG oil ≥ 700°C (ignition observed after
discharge completed. Fire continued until extinguished and spread to cabin inlet)
Refrigerant Decomposition Tests Part II: Passenger Car Engine Compartment Tests – Hughes (Aug 24, 2009)
C R-134a + PAG oil ≥ 837°C (ignition observed due to
combustion of PAG oil)
Hot Surface Ignition and Fire Propagation Characteristics of R134a and R1234yf Refrigerants – Ford SAE2012-01-0984
R-134a
Figure Legend
Configuration Ignition Temperature Source
D R-1234yf + PAG oil ≥ 750°C (ignition observed) Ignition of refrigerant oil mixtures on hot Surfaces – Ineris (Jan 15, 2009) – CRP1234
E R-1234yf + PAG oil ≥ 700°C (ignition observed but was
a short flash lasting 1-2 seconds )
Refrigerant Decomposition Tests Part II: Passenger Car Engine Compartment Tests – Hughes (Aug 24, 2009)
F R-1234yf + PAG oil ≥ 710°C (ignition observed) Ignition sensitivity and toxics generation by a refrigerant when submitted to a high temperature – Ineris (Nov 26, 2011) – MRB CRP G Pure R-1234yf ≥ 860°C (ignition observed)
H R-1234yf + PAG oil ≥ 845°C (ignition observed due to
combustion of PAG and refrigerant)
Hot Surface Ignition and Fire Propagation Characteristics of R134a and R1234yf Refrigerants – Ford SAE2012-01-0984
R-1234yf

Detailed Test Data (Vehicle Testing)
Configuration Ignition Temperature Source
Vehicle #1 No ignition observed (vehicle not capable of exceeding 700°C)
OEM Testing (front takedown, gasoline non-turbo)
Vehicle #2 No ignition observed (includes max exhaust surface temperature 810°C)
OEM Testing (front takedown, gasoline turbo)
Vehicle #3 ≥ 700°C OEM Testing (longitudinal, gasoline turbo)
Vehicle #4 ≥ 695°C OEM Testing (front takedown, gasoline turbo)
Vehicle #5 No ignition observed (includes max surface temperature 775°C)
OEM Testing (rear takedown, gasoline non-turbo)
R-1234yf (each row represents the results of multiple tests using a given vehicle)

Attachment F
OEM Test Data on Effect of Surface Temperature on Refrigerant Ignition (Example 2)

Background
Our purpose is to clarify the conditions of refrigerant ignition.
OEM
Daimler

※Pd/Ps/OCR detail is shown in list

CAT Temperature
CAT cover Bonnet Under
coverCooling Fan
Injecting position
Injecting Height
Injection pressure OCR Result Result
650 No Close Yes OFF High side(60mm) Low 1.5MPaG 3.5% No ignition No Propagation
700 ↑ ↑ ↑ ↑ ↑ ↑ ↑ ↑ No ignition No Propagation
760 ↑ ↑ ↑ ↑ ↑ ↑ ↑ ↑ No ignition No Propagation
↑ ↑ ↑ ↑ ↑ ↑ ↑ 1.0MPaG ↑ No ignition No Propagation
↑ ↑ ↑ ↑ ↑ ↑ ↑ 0.5MPaG ↑ No ignition No Propagation
↑ ↑ ↑ ↑ ↑ ↑ High 1.0MPaG ↑ Oil ignition No Propagation
↑ ↑ ↑ ↑ ↑ ↑ ↑ 0.5MPaG ↑ Oil ignition? No Propagation
↑ ↑ OPEN ↑ ↑ ↑ ↑ 1.0MPaG ↑ No ignition No Propagation
↑ ↑ OPEN No ↑ ↑ ↑ ↑ ↑ No ignition No Propagation
↑ ↑ Close ↑ ↑ ↑ ↑ ↑ ↑ Oil ignition No Propagation
↑ ↑ ↑ ↑ ↑ ↑ ↑ 0.5MPaG ↑ Oil ignition No Propagation
Flammability Test Results
We found some oil ignition phenomenon, but could not find refrigerant ignition condition.

Comparison of Daimler and Realistic Case<Oil change>We verified PAG and POE both oil.<The difference in heat shield structure>
Daimler B-Class
Structure where a refrigerant stagnates easily
- Realistic-
Extension
Without slit
A heat shield is modified to make a condition close to Daimler.<Nozzle Structure>
Daimler Nozzle We validated Daimler and realistic both nozzle.
Daimler Nozzle Realistic Nozzle
OR

Test No.
Temp OilOCR=3.5%
Nozzle Heat shield Pd Fan Hood
1 ≧800℃ PAG Straight Mass production*with slit
2.0MPa(gage) OFF Close
2 ↑ ↑ Daimler Mass production+without slit+Extension
↑ ↑ ↑
3 ↑ ↑ ↑ Without Heat shield
↑ ↑ ↑
4 ↑ POE ↑ Mass production+without slit+Extension
↑ ↑ ↑
Test Condition

700
800
600
500
400
Temp(℃)
760
850
Oil only(Without 1234yf)
No.1
With 1234yf
No.2 No.3 No.4
450
Validation Result
No ignition Area
Tested 800℃max
850℃ : Equipment maximum temperature

Attachment G
OEM Data from Vehicle Thermal Testing (Example 1)

Thermal Analysis of Exhaust SurfacesM h d d R l‐Methods and Results ‐

Introduction
Background:• The CRP team has had numerous discussions to establish conservative inputs into the• The CRP team has had numerous discussions to establish conservative inputs into the
fault trees• One of the significant inputs to the trees is the % of time that an average customer will
spend above a relevant exhaust surface temperature (i.e. 700°C)• To date, numerous estimates have been put forward by members of the team but
questions remain regarding the right method.
Purpose:Purpose: • Provide clarification on a method for determining % of time at temperature > 700°C. • Substantiate the values currently included in the fault tree
Method• Identify relevant conditions where temperatures can exceed 700°C using thermal
validation procedure• Relevant Conditions identified as grades, WOT, VmaxRelevant Conditions identified as grades, WOT, Vmax• Analyze real customer data for 4 cyl, V6, V8 to understand drive behavior
• Data collected from total of 57 vehicles and > 1,270,650miles• 2 regions used: United States and Germany/Europe
W ib ll lt d d t i % ti t d t d WOT V• Weibull results and determine % time average customer spend at grade, WOT, Vmax• Sum % for each to obtain overall % > 700°C

Example of European Study
Due to grade operationA C (50%) 0 06% f i 700°C• Average Customer (50%) = 0.06% of time > 700°C
• Severe Customer (90%) = 0.35% of time > 700°C
Due to WOT operationA C (50%) 0 03% f i 700°C• Average Customer (50%) = 0.03% of time > 700°C
• Severe Customer (90%) = 0.40% of time > 700°C
Due to Vmax operation( ) f i °• Average Customer (50%) = 0.03% of time > 700°C
• Severe Customer (90%) = 0.78% of time > 700°C
Aggregate Time > 700°C: US + Europe• Average Customer (50%) = 0.06% + 0.03% + 0.03% = 0.12% > 700°C• Severe Customer (90%) = 0.35% + 0.40% + 0.78% = 1.53% > 700°C

Comments on Assessment Method:
This assessment was deemed to be conservative for the followingThis assessment was deemed to be conservative for the following reasons:
• Assumed every vehicle can achieve exhaust surface > 700°C• Not reduce occurrence % for diesel or NA vehicles
• Assumed a WOT of any duration resulted in temp > 700°C• Profile data suggests multiple back‐to‐back WOTs necessarygg p y
• Assumed top 3 speed bands same as Vmax resulting in temp > 700°C• Assumed Vmax is relevant for all regions of globe – no reduction in
occurrence %occurrence %• Data suggests not a relevant consideration for US
• Assumed that continuous driving at grade > 4% for 90s results in temp > 700°C700 C
• Adding across 90% bands for grade, WOT, Vmax overinflates 90% result• Likely reporting 99% result

Backup

Grade Consideration:
Grades:• Analyzed grade profile data from thermal testing and found that the user needs to• Analyzed grade profile data from thermal testing and found that the user needs to
operate continuously at a grade to exceed 700°C• The relevant continuous time was determined to be 90 seconds
• Sorting condition used was• Measured grade > X% (used 4%, 7%, 12%)• Vehicle speed > 0kph• Continuous time > 90 seconds
• Number of occurrences determined Weibull resultsNumber of occurrences determined, Weibull results• Select average (50%) customer and a severe (90%) customer to determine time at
grade
Conservative Assumptions:• Any time that grade > X% for continuous 90s (speed > 0kph) assume exhaust surface
> 700°C• All vehicles can achieve 700°C no consideration for diesels or NA vehicles thatAll vehicles can achieve 700 C no consideration for diesels or NA vehicles that
cannot reach 700°C

WOT Consideration:
Wide Open Throttle (WOT):• Analyzed thermal profile data from thermal testing and found that the user needs to• Analyzed thermal profile data from thermal testing and found that the user needs to
operate back‐to‐back WOTs to exceed 700°C• Determined that need to be > 10s long within 20s of each other
• Initial Result• Analyzed 24 vehicles (309,601 miles) and did not find 1 occurrence of this
• Modified Criteria• Considered that whenever WOT occurs, temperature > 700°C
Conservative Assumptions:• Any time that WOT occurs, even momentary, assumed that temp > 700°C
• Data suggests that continuous preconditioning is required• Necessary preconditioning never occurred in all vehicles analyzed
• All vehicles can achieve 700°C no consideration for diesels or NA vehicles that cannot reach 700°C

Vmax Consideration:
Vmax:• Analyzed thermal profile data from thermal testing and found that the user needs to• Analyzed thermal profile data from thermal testing and found that the user needs to
operate continuously at Vmax to exceed 700°C• Determined that need to be > 30s long
• Initial Result• Analyzed 33 vehicles (>550,000 miles) in US and did not find Vmax occurrence• 24 analyzed (706,000 miles) 4 cyl in Germany
• Modified Criteria• Considered that whenever Vmax occurs for any period temperature > 700°CConsidered that whenever Vmax occurs, for any period, temperature > 700 C• Considered speeds in 2 bands below Vmax as > 700°C
Conservative Assumptions:• Any time that Vmax occurs, even momentary, assumed that temp > 700°C
• Data suggests that continuous preconditioning is required• All vehicles can achieve 700°C no consideration for diesels or NA vehicles that
cannot reach 700°Ccannot reach 700 C• Expanded to lower speed bands and included as “Vmax”

Attachment H
OEM Data from Vehicle Thermal Testing (Example 2)

June 20, 2013
1
Thermal Testing Summary
June 20, 2013

Thermal Testing Summary
• Vehicle: Small CUV
– 2.0L Turbocharged Direct Injection Gas Engine
– Automatic Transmission
• Testing Location:
– Location was Southwestern USA (north of Phoenix, AZ)
– Two circular routes West and East of I-17
– Conducted in both clockwise & counterclockwise directions
– Location was selected based on worst case routes in
Arizona for grades and loads on vehicle
– Location was not selected for highest possible ambient
June 20, 2013
2

Thermal Testing Summary
• Testing Methodology:
– Testing objective was to produce highest possible
underhood exhaust temperatures
– Highest temperatures are not seen under more modest
loads or more normal driving profiles
– Vehicle had to be driven at or near load limits to produce
highest temperatures
– “Base” testing w/o a trailer was at near max vehicle load
(98% GVWR)
– “Trailer” testing was at max rating for vehicle plus trailer;
combined weight rating (100% GCWR),
June 20, 2013
3

West Route
June 20, 2013
4

June 20, 2013
5
East Route

June 20, 2013
6
Chart Title Key: Base or Trailer_West or East_CW or CCW direction_Date yyyymmdd

June 20, 2013
7
Chart Title Key: Base or Trailer_West or East_CW or CCW direction_Date yyyymmdd

June 20, 2013
8
Chart Title Key: Base or Trailer_West or East_CW or CCW direction_Date yyyymmdd

June 20, 2013
9
Chart Title Key: Base or Trailer_West or East_CW or CCW direction_Date yyyymmdd

June 20, 2013
10
Chart Title Key: Base or Trailer_West or East_CW or CCW direction_Date yyyymmdd

June 20, 2013
11
Chart Title Key: Base or Trailer_West or East_CW or CCW direction_Date yyyymmdd

June 20, 2013
12
Chart Title Key: Base or Trailer_West or East_CW or CCW direction_Date yyyymmdd

June 20, 2013
13
Chart Title Key: Base or Trailer_West or East_CW or CCW direction_Date yyyymmdd

Summary Table
June 20, 2013
14 Considering the severity of the routes and the amount of time customers tow trailers, use of 1%
for time greater than 700°C in the SAE CRP FTA is reasonable
Route Direction
Test Condition
(Base or Trailer)
Percent Time
>700°C
Longest Time
>700°C
(h:mm:ss)
Maximum
(°C)
West CW Base 0.8% 0:01:17 734
West CCW Base 0.3% 0:00:16 713
East CW Base 1.6% 0:01:41 738
East CCW Base 0.9% 0:01:04 724
Base 0.9% 0:01:04 727
West CW Trailer 8.8% 0:03:24 772
West CCW Trailer 5.7% 0:01:43 753
East CW Trailer 11.9% 0:03:34 775
East CCW Trailer 15.7% 0:03:02 773
Trailer 10.5% 0:02:56 768
Trailer <0.1% 0:02:56 768
* Customer Trailer Usage is less the 1% of total operating hours
Highest Exhaust Surface Temperature
Thermal Testing Summary of Results
Average
Average
Average Adjusted for
Customer Usage *

Attachment I
Analysis of GIDAS Database Regarding Fires and Fuel Releases

April 2013
FUEL LEAKAGE & CARS CAUGHT FIRE
AFTER FRONTAL/SIDE IMPACT
IN GIDAS*
* GIDAS: German In-Depth Accidents Study
current status July 2012 (22.347 Accidents)

Year of 1st
Reg. EES n % n % n %
< 16 Km/h 3696 98,1% 73 1,9% 3769 100%
16-50 Km/h 3047 92,0% 266 8,0% 3313 100%
> 50 Km/h 102 62,6% 61 37,4% 163 100%
6845 94,5% 400 5,5% 7245 100%
< 16 Km/h 2123 98,9% 23 1,1% 2146 100%
16-50 Km/h 1381 95,5% 65 4,5% 1446 100%
> 50 Km/h 49 77,8% 14 22,2% 63 100%
3553 97,2% 102 2,8% 3655 100%
< 16 Km/h 551 97,0% 17 3,0% 568 100%
16-50 Km/h 423 93,6% 29 6,4% 452 100%
> 50 Km/h 28 65,1% 15 34,9% 43 100%
1002 94,3% 61 5,7% 1063 100%
11400 95,3% 563 4,7% 11963 100%
No / Unknown Yes All
Fuel Leakage
Sub Total of <2000
Sub Total of 2000+
Sub Total of "Unknown"
Total
Year of 1st Registration & EES
<2000
2000+
Unknown
2
Fuel leakage of cars after frontal impact in GIDAS
Case Selection: - 1st collision
- only cars
- frontal impacts (PDOF=11,12,1)
- EES<>”unknown” * % per column
** % per row of All
n % * n % **
<2000 7245 60,6% 400 5,5%
2000+ 3655 30,6% 102 2,8%
Unknown 1063 8,9% 61 5,7%
Total 11963 100% 563 4,7%
AllYear of 1st registration
Fuel Leakage (FL)

3
Fuel leakage of cars after side impact in GIDAS
Case Selection: - 1st collision
- only cars
- side impacts (PDOF=2,3,4&8,9,10)
- EES<>”unknown” * % per column
** % per row of All
Year of 1st
Reg. EES n % n % n %
< 16 Km/h 1692 98,0% 35 2,0% 1727 100%
16-50 Km/h 1051 94,9% 56 5,1% 1107 100%
> 50 Km/h 19 52,8% 17 47,2% 36 100%
2762 96,2% 108 3,8% 2870 100%
< 16 Km/h 1092 99,1% 10 0,9% 1102 100%
16-50 Km/h 457 95,6% 21 4,4% 478 100%
> 50 Km/h 6 60,0% 4 40,0% 10 100%
1555 97,8% 35 2,2% 1590 100%
< 16 Km/h 229 100,0% 0 0,0% 229 100%
16-50 Km/h 161 100,0% 0 0,0% 161 100%
> 50 Km/h 10 100,0% 0 0,0% 10 100%
400 100,0% 0 0,0% 400 100%
4717 97,1% 143 2,9% 4860 100%
Unknown
Sub Total of "Unknown"
Total
Year of 1st Registration & EESFuel Leakage
No / Unknown Yes All
<2000
Sub Total of <2000
2000+
Sub Total of 2000+
n % * n % **
<2000 2870 59,1% 108 3,8%
2000+ 1590 32,7% 35 2,2%
Unknown 400 8,2% 0 0,0%
Total 4860 100% 143 2,9%
Year of 1st registrationAll Fuel Leakage (FL)
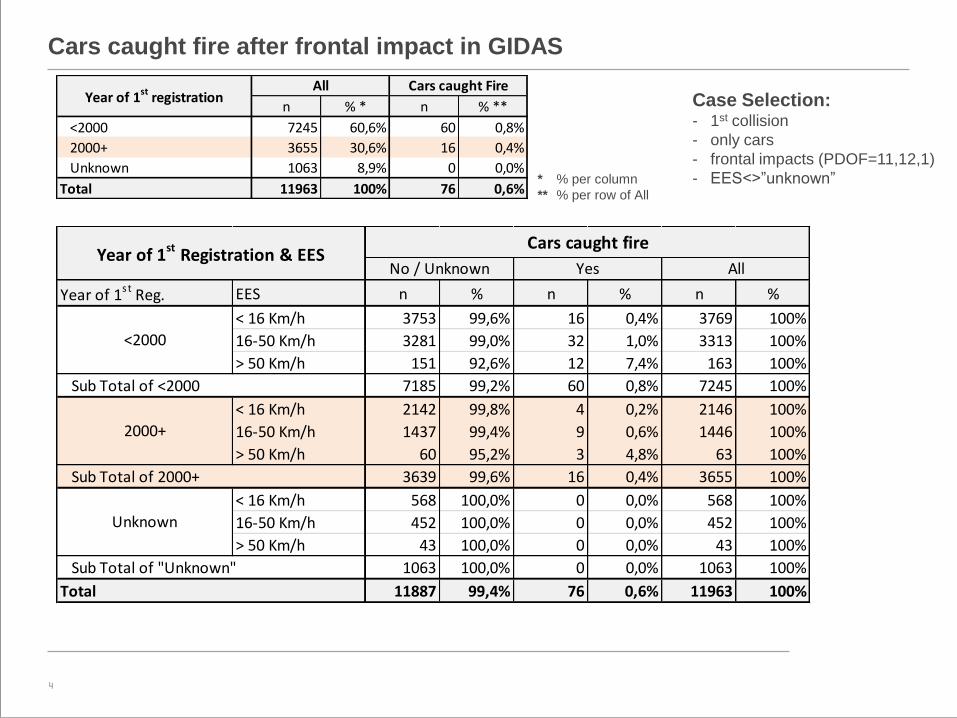
Year of 1st
Reg. EES n % n % n %
< 16 Km/h 3753 99,6% 16 0,4% 3769 100%
16-50 Km/h 3281 99,0% 32 1,0% 3313 100%
> 50 Km/h 151 92,6% 12 7,4% 163 100%
7185 99,2% 60 0,8% 7245 100%
< 16 Km/h 2142 99,8% 4 0,2% 2146 100%
16-50 Km/h 1437 99,4% 9 0,6% 1446 100%
> 50 Km/h 60 95,2% 3 4,8% 63 100%
3639 99,6% 16 0,4% 3655 100%
< 16 Km/h 568 100,0% 0 0,0% 568 100%
16-50 Km/h 452 100,0% 0 0,0% 452 100%
> 50 Km/h 43 100,0% 0 0,0% 43 100%
1063 100,0% 0 0,0% 1063 100%
11887 99,4% 76 0,6% 11963 100%
Sub Total of 2000+
Sub Total of "Unknown"
Total
<2000
2000+
Unknown
Year of 1st Registration & EESCars caught fire
No / Unknown Yes All
Sub Total of <2000
4
Case Selection: - 1st collision
- only cars
- frontal impacts (PDOF=11,12,1)
- EES<>”unknown” * % per column
** % per row of All
n % * n % **
<2000 7245 60,6% 60 0,8%
2000+ 3655 30,6% 16 0,4%
Unknown 1063 8,9% 0 0,0%
Total 11963 100% 76 0,6%
AllYear of 1st registration
Cars caught Fire
Cars caught fire after frontal impact in GIDAS

5
* % per column
** % per row of All
Cars caught fire after side impact in GIDAS
Case Selection: - 1st collision
- only cars
- side impacts (PDOF=2,3,4&8,9,10)
- EES<>”unknown”
Year of 1st
Reg. EES n % n % n %
< 16 Km/h 1724 99,8% 3 0,2% 1727 100%
16-50 Km/h 1099 99,3% 8 0,7% 1107 100%
> 50 Km/h 36 100,0% 0 0,0% 36 100%
2859 99,6% 11 0,4% 2870 100%
< 16 Km/h 1102 100,0% 0 0,0% 1102 100%
16-50 Km/h 477 99,8% 1 0,2% 478 100%
> 50 Km/h 10 100,0% 0 0,0% 10 100%
1589 99,9% 1 0,1% 1590 100%
< 16 Km/h 229 100,0% 0 0,0% 229 100%
16-50 Km/h 161 100,0% 0 0,0% 161 100%
> 50 Km/h 10 100,0% 0 0,0% 10 100%
400 100,0% 0 0,0% 400 100%
4848 99,8% 12 0,2% 4860 100%
Sub Total of <2000
2000+
Sub Total of 2000+
Unknown
Sub Total of "Unknown"
Total
Year of 1st Registration & EESCars caught fire
No / Unknown Yes All
<2000
n % * n % **
<2000 2870 59,1% 11 0,4%
2000+ 1590 32,7% 1 0,1%
Unknown 400 8,2% 0 0,0%
Total 4860 100% 12 0,2%
Year of 1st registrationAll Cars caught Fire

Year of 1st
Reg. EES n % n % n %
< 16 Km/h 3760 99,8% 9 0,2% 3769 100%
16-50 Km/h 3294 99,4% 19 0,6% 3313 100%
> 50 Km/h 153 93,9% 10 6,1% 163 100%
7207 99,5% 38 0,5% 7245 100%
< 16 Km/h 2143 99,9% 3 0,1% 2146 100%
16-50 Km/h 1441 99,7% 5 0,3% 1446 100%
> 50 Km/h 61 96,8% 2 3,2% 63 100%
3645 99,7% 10 0,3% 3655 100%
< 16 Km/h 568 100,0% 0 0,0% 568 100%
16-50 Km/h 452 100,0% 0 0,0% 452 100%
> 50 Km/h 43 100,0% 0 0,0% 43 100%
1063 100,0% 0 0,0% 1063 100%
11915 99,6% 48 0,4% 11963 100%
2000+
Sub Total of 2000+
Unknown
Sub Total of "Unknown"
Total
Year of 1st Registration & EESCars with fuel leakage + Cars caught fire
No / Unknown Yes All
<2000
Sub Total of <2000
6
Case Selection: - 1st collision
- only cars
- frontal impacts (PDOF=11,12,1)
- EES<>”unknown” * % per column
** % per row of All
n % * n % **
<2000 7245 60,6% 38 0,5%
2000+ 3655 30,6% 10 0,3%
Unknown 1063 8,9% 0 0,0%
Total 11963 100% 48 0,4%
AllYear of 1st registration
FL + Caught Fire
Fuel leakage & cars caught fire after frontal impact in GIDAS

Year of 1st
Reg. EES n % n % n %
< 16 Km/h 1724 100,0% 0 0,0% 1724 100%
16-50 Km/h 1100 99,8% 2 0,2% 1102 100%
> 50 Km/h 33 100,0% 0 0,0% 33 100%
2857 99,9% 2 0,1% 2859 100%
< 16 Km/h 1102 100,0% 0 0,0% 1102 100%
16-50 Km/h 475 100,0% 0 0,0% 475 100%
> 50 Km/h 9 100,0% 0 0,0% 9 100%
1586 100,0% 0 0,0% 1586 100%
< 16 Km/h 232 100,0% 0 0,0% 232 100%
16-50 Km/h 169 100,0% 0 0,0% 169 100%
> 50 Km/h 14 100,0% 0 0,0% 14 100%
415 100,0% 0 0,0% 415 100%
4858 100,0% 2 0,0% 4860 100%
<2000
Sub Total of <2000
2000+
Sub Total of 2000+
Unknown
Sub Total of "Unknown"
Total
Year of 1st Registration & EESCars with fuel leakage + Cars caught fire
No / Unknown Yes All
7
* % per column
** % per row of All
Fuel leakage & cars caught fire after side impact in GIDAS
Case Selection: - 1st collision
- only cars
- side impacts (PDOF=2,3,4&8,9,10)
- EES<>”unknown”
n % * n % **
<2000 2870 59,1% 2 0,07%
2000+ 1590 32,7% 0 0,0%
Unknown 400 8,2% 0 0,0%
Total 4860 100% 2 0,04%
Year of 1st registrationAll FL + Caught Fire

8
Back-Up

n % n % n % n %
Engine Compartment 16 0,2% 4 0,1% 0 0,0% 20 0,2%
Engine & Passenger Comp. 3 0,0% 2 0,1% 0 0,0% 5 0,0%
Total Vehicle 19 0,3% 4 0,1% 0 0,0% 23 0,2%
Sub Total 38 0,5% 10 0,3% 0 0,0% 48 0,4%
Total 7245 61% 3655 30% 1063 9% 11963 100%
Fuel Leakage & cars caught fire
after frontal impact <2000 2000+ Unknown All
Year of first registration
n % n % n % n %
Yes, nfs 171 2,4% 42 1,1% 31 2,9% 244 2,0%
Fuel Tank 13 0,2% 2 0,1% 3 0,3% 18 0,2%
Fuel Lines (Engine Comp.) 204 2,8% 55 1,5% 26 2,4% 285 2,4%
Fuel Lines (not EngComp.) 9 0,1% 3 0,1% 1 0,1% 13 0,1%
Other 3 0,0% 0 0,0% 0 0,0% 3 0,0%
Sub Total 400 5,5% 102 2,8% 61 5,7% 563 4,7%
Total 7245 61% 3655 30% 1063 9% 11963 100%
Fuel Leakage (FL)
after frontal impact <2000 2000+ Unknown All
Year of first registration
n % * n % ** n % **
<2000 7245 60,6% 400 5,5% 38 0,5%
2000+ 3655 30,6% 102 2,8% 10 0,3%
Unknown 1063 8,9% 61 5,7% 0 0,0%
Total 11963 100% 563 4,7% 48 0,4%
AllYear of 1st registration
Fuel Leakage (FL) FL + Caught Fire
9
1
1 2
2
Case Selection: - 1st collision
- only cars
- frontal impacts (PDOF=11,12,1)
- EES<>”unknown”
* % per column
Details of fuel leakage & fire magnitude after frontal impact in GIDAS
** % per row of All

Cars with Front Impacts in GIDAS Split by Speed Range
10
n % n % n %
< 16 Km/h 6483 54,2% 113 1,7% 12 0,2%
16-50 Km/h 5211 43,6% 360 6,9% 24 0,5%
> 50 Km/h 269 2,2% 90 33,5% 12 4,5%
Total 11963 100% 563 4,7% 48 0,4%
Fuel Leakage (FL) FL+FireEES by Frontal Impact
(VDI1=11,12,1)
Total
n % n % n % n %
Yes, nfs 47 0,6% 151 4,1% 46 4,3% 244 2,0%
Tank 6 0,1% 12 0,3% 0 0% 18 0,2%
Fuel Lines (Engine Comp.) 56 0,8% 187 5,1% 42 4,0% 285 2,4%
Fuel Lines (not EComp.) 3 0,0% 8 0,2% 2 0,2% 13 0,1%
Other 1 0,0% 2 0,1% 0 0% 3 0,0%
Sub Total 113 1,6% 360 9,8% 90 8,5% 563 4,7%
Total 7245 61% 3655 30% 1063 9% 11963 100%
Fuel Leakage (FL)
after frontal impact
16-50 Km/h > 50 Km/h All Speeds< 16 Km/h
n % n % n % n %
Engine Compartment 4 0,1% 12 0,3% 4 0,4% 20 0,2%
Engine & Occupant Comp. 1 0,0% 4 0,1% 0 0% 5 0,0%
Entire Vehicle 7 0,1% 8 0,2% 8 0,8% 23 0,2%
Sub Total 12 0,2% 24 0,7% 12 1,1% 48 0,4%
Total 7245 61% 3655 30% 1063 9% 11963 100%
< 16 Km/hFuel Leakage & cars caught
fire after frontal impact
16-50 Km/h > 50 Km/h All Speeds

11
Back-Up

Attachment J
Supporting Data for the Probability Vehicle Occupants are Unable to Leave the Vehicle Post‐Collision

Question: What is the probability that occupants are unable to leave the vehicle in the event of a crash Funk et al. 2002. "Necessity of fire department response to the scene of motor vehicle crashes" American Journal of Emergency Medicine -20(7) The authors conducted a review of accident records for a township located in New York state. They reported that 38 of 14,450 motor vehicle collisions (the total number reported during the time period of study) required some extrication (0.3%, 0.0026). This number would apply to the overall frequency of entrapment in collisions of any severity. The authors also reported that 38 of 2,095 collisions which involved personal injury required extrication (2%, 0.018). Because this subset of collisions (14% of the total) involved injury, they would be more characteristic of mid-to high severity collisions. Note that the 38 extrications required when there was injury is the same number of extrications required among all collisions, meaning that the number of extrications required when there is no personal injury was 0. Finally, the authors reported that 38 of 198 motor vehicle crashes to which a fire department responded, suggesting the most serious type of crash, required some extrication (20% or 0.19). It is probably reasonable to suggest that this number would be most characteristic of high severity collisions. US State of Tennessee, Department of Safety, data for 2007 www.tn.gov/safety/stats/CrashData/default.shtml 2007 total collisions– 172,130 2007 – total number of individuals trapped in motor vehicle accidents – 3,448 (whether successfully extricated or not) This is the total number of individuals, not the number of collisions, involving extrication. If we divide this by the typical number of passengers per vehicle in the US (approximately 1.5), we get ~2300 collisions which involved/required extrication. The ratio, 2,300/172,130 yields an extrication frequency of 1.3% or 0.013. Note that this number pertains to all crashes, regardless of severity. US State of Nebraska, State Fire Marshall, data for 2000 http://www.sfm.ne.gov/statistics/pdf/2000/detailedstats-2000.pdf Number of vehicle accidents with injuries which involved a response = 2,662 Cases requiring extrication of victim(s) from vehicle = 26 This is equivalent to 0.01 or 1% of vehicle collisions which involved injuries severe enough to require emergency services involvement. City of Minneapolic, MN http://uclue.com/?xq=1812 Motor vehicle accidents with injuries = 679 Cases requiring extrication of victim(s) from vehicle = 22 Overall frequency: 3% (0.032)

City of Midland, MI http://www.midland-mi.org/government/departments/fire/Fire2003-2004.pdf Accidents with injuries where EMS/fire department is called in = 135 Cases requiring occupant extrication = 5 Overall frequency: 4% (0.037) Data for Orange County FL (www.orangecountyfl.net/.../Orange%20Spiel%20Feb-Mar%202011.pdf ) It was reported that for 1 day (Sept 24, 2010) fire and rescue services responded to 27 vehicle accidents of which 1 involved extrication 4% (0.037). However, the same size is quite small. However, it was also reported for Orange County (http://uclue.com/?xq=1812): "for one year, 13,313 traffic accidents, and 531 entrapments". Level of severity was not specified but will be assumed to mean all accident types. This equates to a frequency of 4% (0.04) per accident. Taken together these data suggest that for all collisions combined (dominated by low speed collisions, many of which will not involve emergency responders), the risk the occupants are unable to leave the vehicle post-collision is probably less than 1% (based on Funk et al. and data from Tenneseee). The smaller datasets (Midland MI, Orange County FL, Minneapolis MN) suggest slightly higher percentages (3-4%) but these do not reflect very low speed collisions where EMS or the fire department are not called. It is more likely that such collisions only involve police services, e.g., for filling out a report for insurance purposes. For collisions involving injuries (consistent with a medium or high severity collision) the risk of needing extrication is probably more on the order of 1-4% (data for Nebraska, Midland MI, Minneapolis MN, and Orange County FL all of which reflect fire department/EMS statistics). For even more serious crashes (i.e., high severity crashes) the risk may be as high as 20% (based primarily on Funk et al.). Based on an average probability of occupants being unable to leave the vehicle post-collision of 1% (for all crashes), the CRP chose to use a value of 5% for high severity front collisions, 20% for high severity side collisions (which have greater potential for damaging vehicle doors), 0.1% for mid severity front, 5% for mid severity side, and 0.01 % for low severity front and side collisions.

Attachment K
OEM Test Data on Vehicle Operating Temperatures

Vehicle/ Powertrain Description > 600°C > 700°C >600 <=700°C > 600°C > 700°C >600 <700°CMedium Size Van FWD Turbo Diesel 2.6% 0.0335% 2.5% 4.4% 0.0197% 4.4%Small Van FWD Gas Non‐Turbo 3.9% 1.8% 2.1% 5.3% 2.4% 2.9%Small Cross Utility FWD Gas Turbo Direct Injection 6.2% 3.1% 3.2% 10.9% 5.7% 5.2%*Based on Standard Thermal Test Results and Customer Use profile
The results of this analysis incorporated into the SAE CRP FTA Sensitivity Analysis
50th Percentile CustomerPercent of Customer Hours
90th Percentile CustomerPercent of Customer Hours
Percent of Time Exhaust Surface Temperatures are above 600°C and 700°C*