n t i th a d i i t llinurturing the academic intelligence ... · n t i th a d i i t llinurturing...
TRANSCRIPT

N t i th A d i I t lliNurturing the Academic Intelligenceof Children
Joshua Aronson, Ph.D.k i iNew York University

The Minority-White GapThe Minority White GapPrison: Prison:
Blacks and Latinos vastly overrepresentedBlacks and Latinos vastly overrepresentedBlacks and Latinos vastly overrepresentedBlacks and Latinos vastly overrepresented
College College Blacks 1/2 as likel to go; 2 as likel to drop o tBlacks 1/2 as likel to go; 2 as likel to drop o tBlacks 1/2 as likely to go; 2x as likely to drop outBlacks 1/2 as likely to go; 2x as likely to drop out
High School: High School: 50% drop out rate; 250% drop out rate; 2--4 year reading gap4 year reading gap
KK--12 12 Lower standardized test scores and gradesLower standardized test scores and grades
BirthBirth--PreschoolPreschoolBirthBirth PreschoolPreschoolNearly equal ability test scoresNearly equal ability test scores
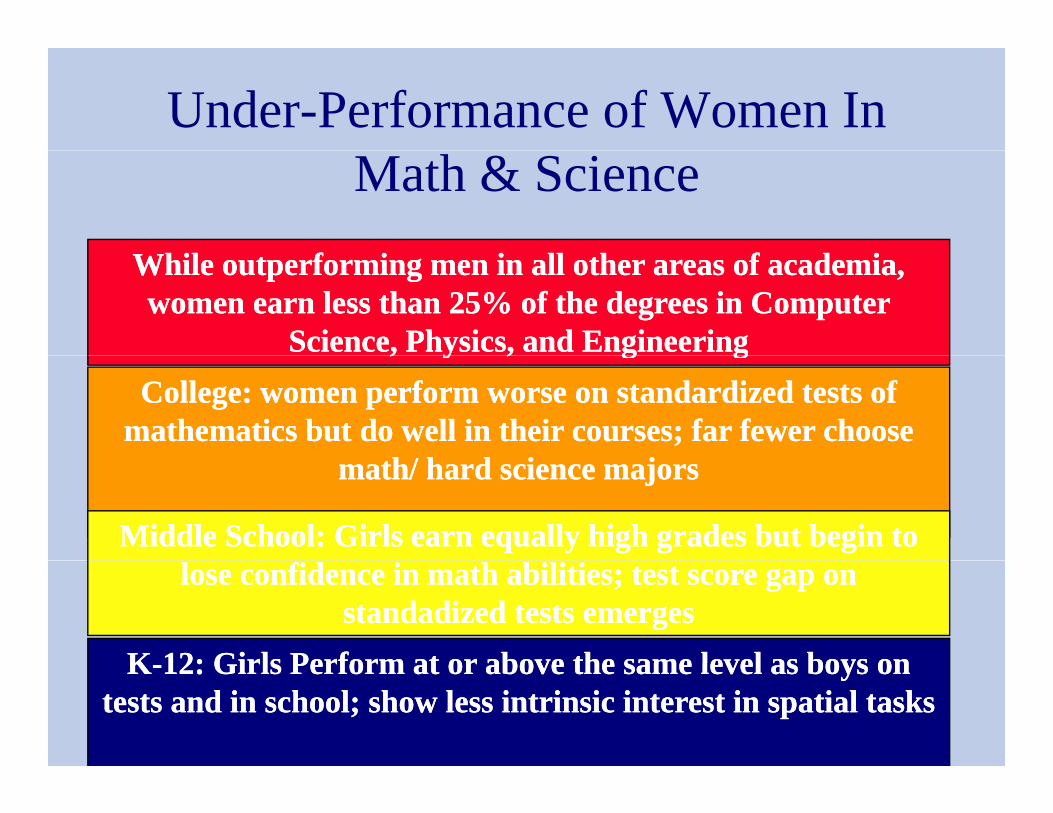
Under-Performance of Women In Math & Science
While outperforming men in all other areas of academia, While outperforming men in all other areas of academia, women earn less than 25% of the degrees in Computer women earn less than 25% of the degrees in Computer
Science, Physics, and EngineeringScience, Physics, and Engineering, y , g g, y , g gCollege: women perform worse on standardized tests of College: women perform worse on standardized tests of
mathematics but do well in their courses; far fewer choose mathematics but do well in their courses; far fewer choose / i j/ i jmath/ hard science majorsmath/ hard science majors
Middle School: Girls earn equally high grades but begin to Middle School: Girls earn equally high grades but begin to lose confidence in math abilities; test score gap on lose confidence in math abilities; test score gap on
standadized tests emergesstandadized tests emergesKK 12: Girls Perform at or above the same level as boys on12: Girls Perform at or above the same level as boys onKK--12: Girls Perform at or above the same level as boys on 12: Girls Perform at or above the same level as boys on
tests and in school; show less intrinsic interest in spatial taskstests and in school; show less intrinsic interest in spatial tasks

Common Explanations for Group Differences
1. Lower innate intelligence
Th B ll C--The Bell Curve
--Biological differences in math ability
2. Poverty (lower skills and preparation)
3 S b l h di d i3. Subculture that discourages academic success
“Acting White”g
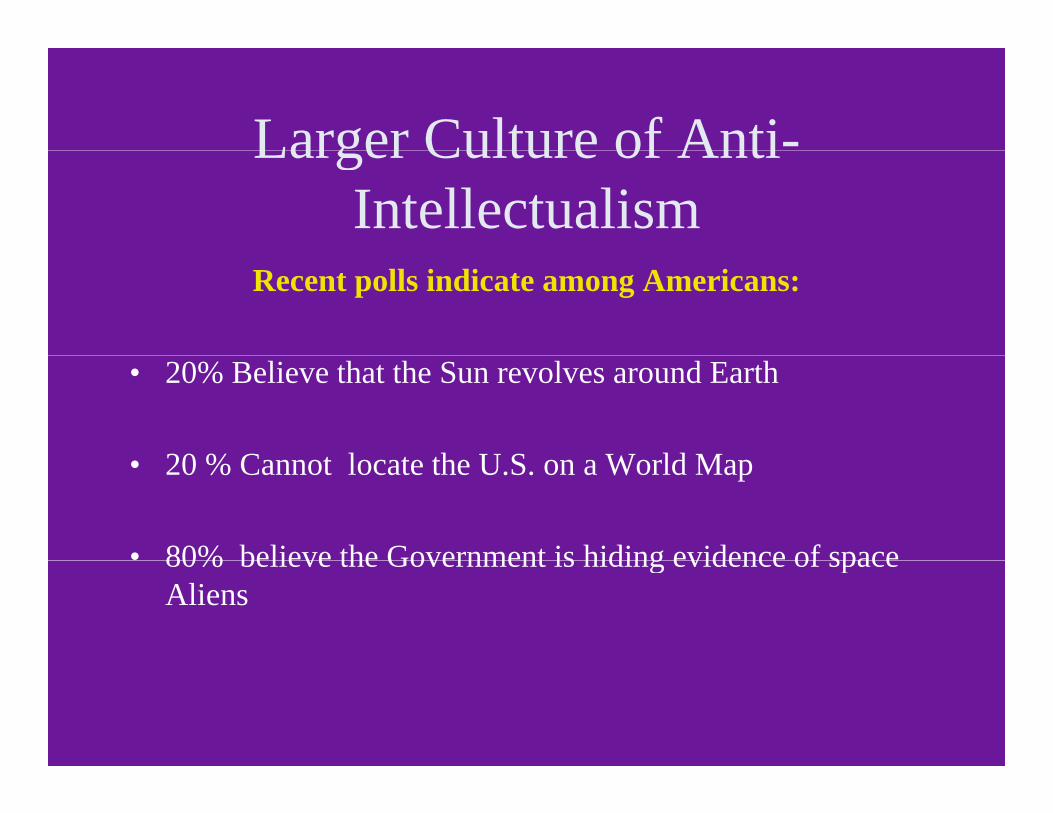
Larger Culture of Anti-intellectualism

Larger Culture of Anti-Larger Culture of AntiIntellectualism
Larger Culture of Anti-Larger Culture of AntiIntellectualism
Recent polls indicate among Americans:
• 20% Believe that the Sun revolves around Earth
20 % C t l t th U S W ld M• 20 % Cannot locate the U.S. on a World Map
• 80% believe the Government is hiding evidence of space80% believe the Government is hiding evidence of space Aliens
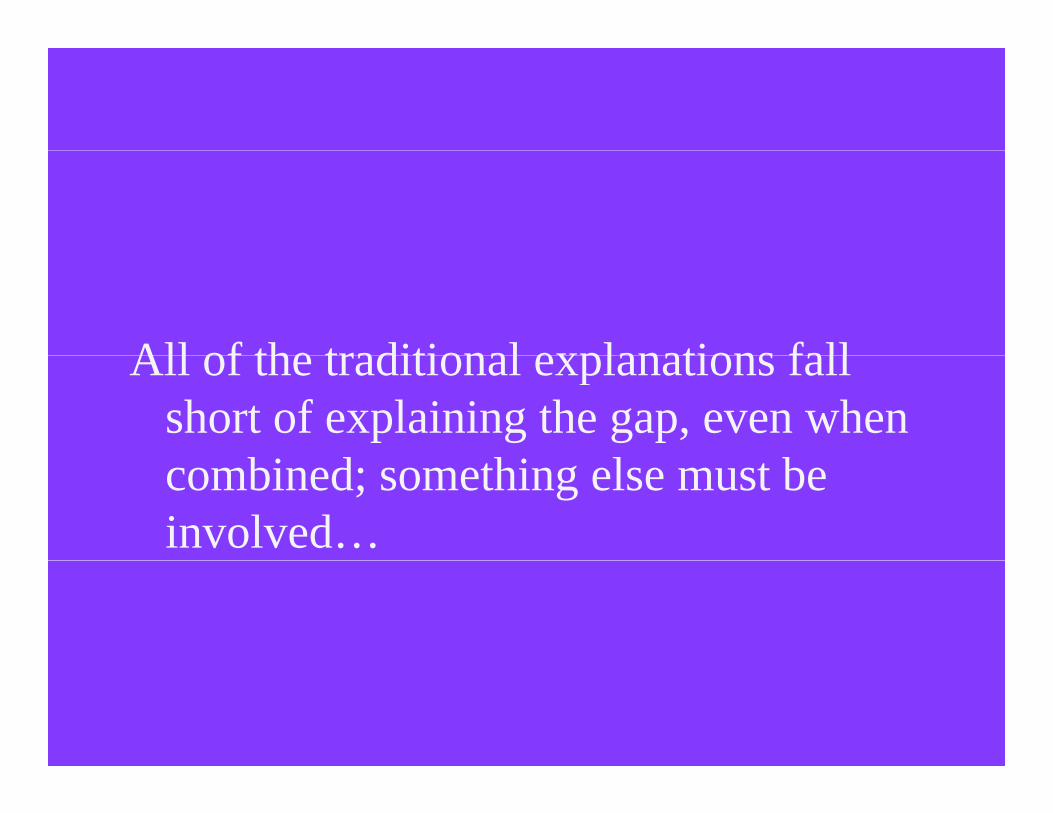
All of the traditional explanations fallAll of the traditional explanations fall short of explaining the gap, even when
bi d hi l bcombined; something else must be involved…

Part One:Intelligence is FragileIntelligence is Fragile
Operational Definition: Intelligence = IQ Scores, Performance in School, Verbal
Fluency, etc.

“Human intelligence is among the most fragile things in nature. It doesn’t take g gmuch to distract it, suppress it, or even annihilate it.”
Neil Postman--Neil Postman

The Fragility of IntelligenceSome social factors:
• Interpersonal Intimidation (being smarter, funnier etc with some people)funnier, etc with some people)
• Threatened Belongingness (Baumeister, 2002)
• Stereotype Threat/ Identity threat (Steele & Aronson, 1995), )

Identity ThreatIdentity Threat
Apprehension arising from the awareness of a negative stereotype or personal reputation in anegative stereotype or personal reputation in a situation where the stereotype or identity is relevant and thus confirmablerelevant, and thus confirmable
i thi i f– everyone experiences this in some form

Examples of Identity ThreatExamples of Identity Threat
• Jewish person in the Bible Belt
• African American Taking an IQ test
• Woman called upon in math classp
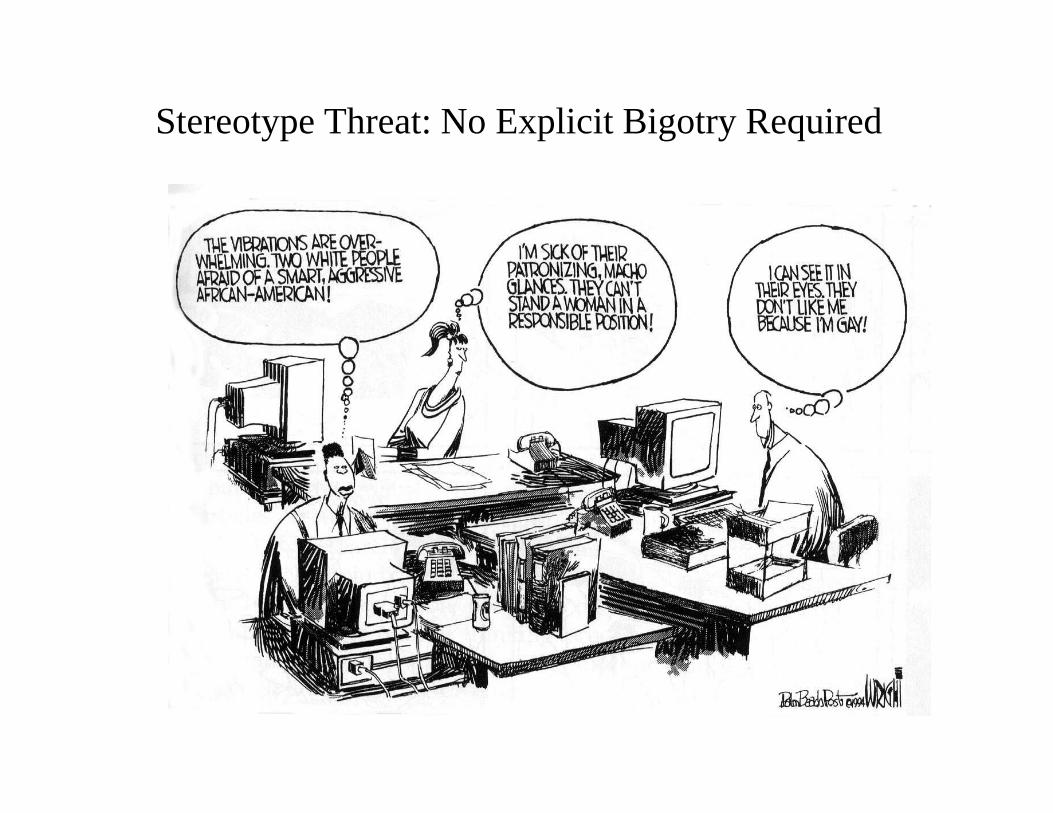
Stereotype Threat: No Explicit Bigotry Required
Stereotype ThreatAnecdotal EvidenceAnecdotal Evidence
“When I talk in class, I feel as though I’m totally on lik ’ hi ki ‘ h h ’ h l kstage, like everyone’s thinking, ‘oh what’s the Black
girl going to say?’ But I don’t speak up in class much anymore so I guess it’s not a big deal ”anymore, so I guess it s not a big deal.
—Stanford Undergraduate
Stereotype ThreatAnecdotal EvidenceAnecdotal Evidence
“Group work was a nightmare. I could tell that no one h h id d b ’ i ”thought my ideas were any good because I’m Latina.”
—NYU Undergraduate
Stereotype ThreatAnecdotal EvidenceAnecdotal Evidence
“Everyone expects me to be good at math because I’m A i f l id b ’ dAsian, so I feel extra stupid because I’m not so good at math.”
—NYU Undergradg

Stereotype ThreatyAnecdotal Evidence
“I knew I was just as intelligent as everyone else... but f did ’ ll bfor some reason I didn’t score well on tests. Maybe I was just nervous. There’s a lot of pressure on you, knowing that if you fail you fail your race ”knowing that if you fail, you fail your race.
State Senator Rodney Ellis (TX)—State Senator, Rodney Ellis (TX)
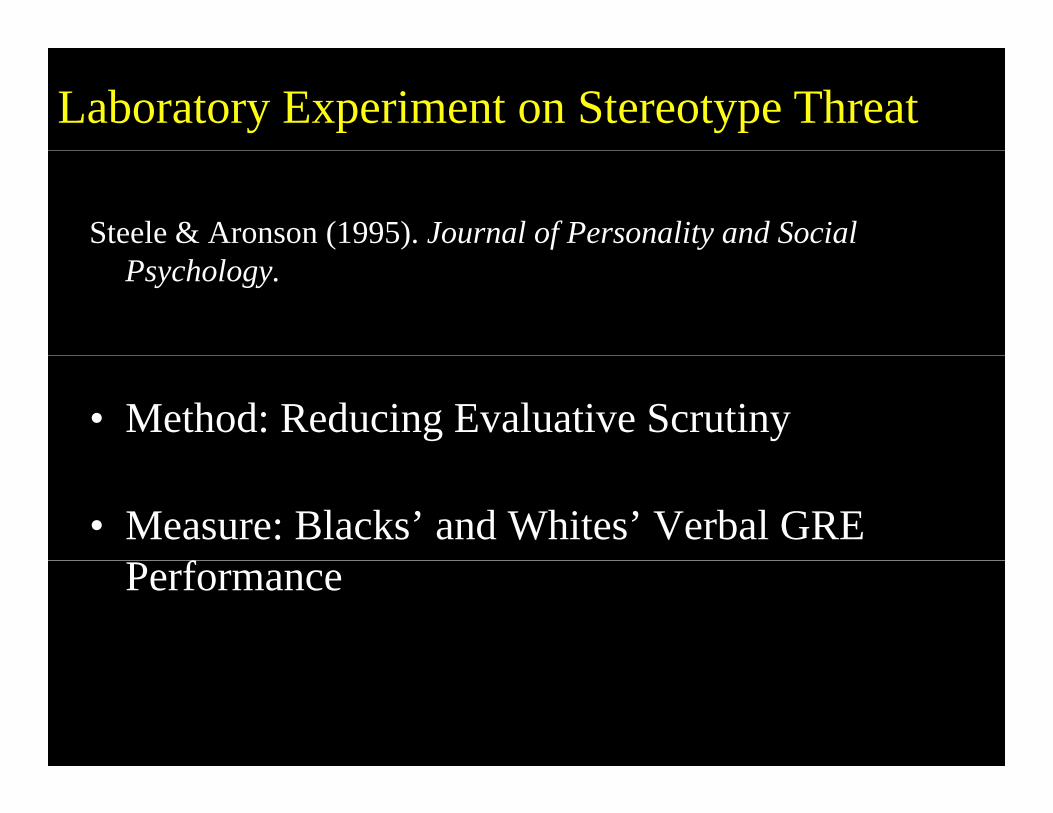
Laboratory Experiment on Stereotype Threat
Steele & Aronson (1995). Journal of Personality and Social Psychology.
• Method: Reducing Evaluative Scrutiny
• Measure: Blacks’ and Whites’ Verbal GRE Performance

Verbal Test Performance
13
15
whites
9
11
lved
7
9
item
s so
l
blacks
3
5
# of
1
"Measuring Your Ability" "Not Measuring Your Ability"

Verbal Test Performance
13
15
whiteswhites
9
11
lved
blacks
7
9
item
s so
l
blacks
3
5
# of
1
"Measuring Your Ability" "Not Measuring Your Ability"
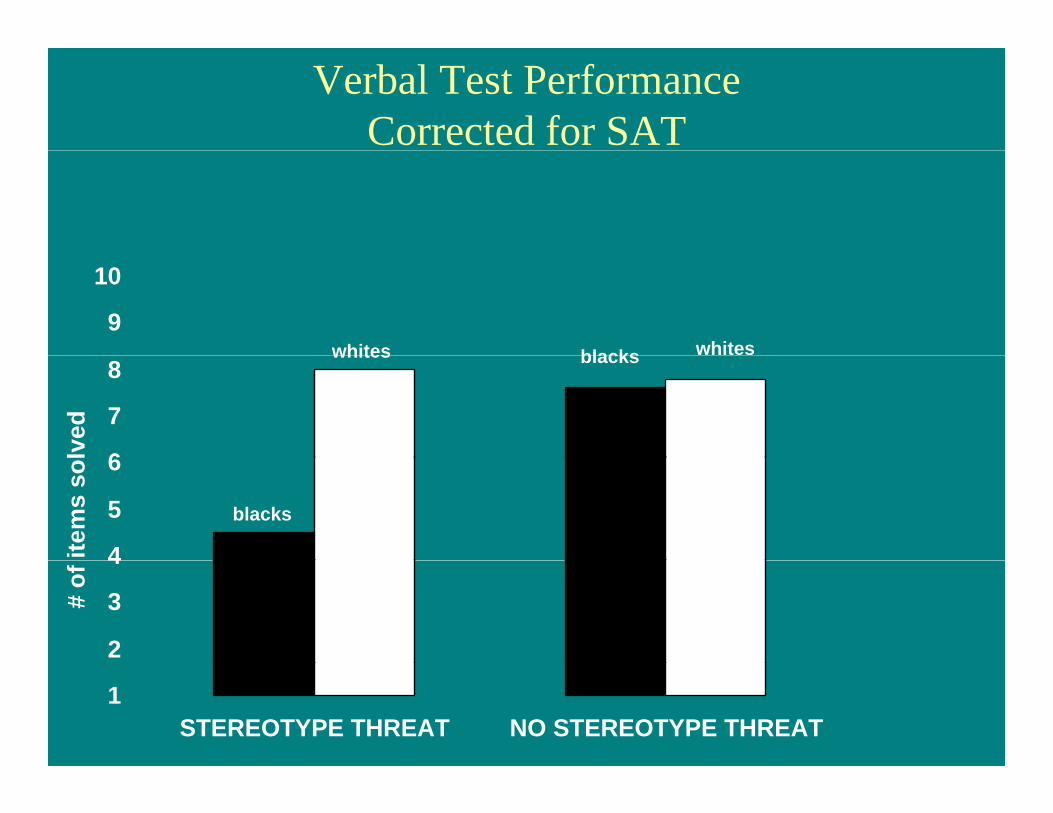
Verbal Test PerformanceCorrected for SAT
blackswhites whites9
10
blackswhites
6
7
8
lved
blacks
4
5
6
item
s so
2
3
4
# of
1STEREOTYPE THREAT NO STEREOTYPE THREAT
Laboratory Experiment on Stereotype Threat
Steele & Aronson (1995)
Method: Inducing the Relevance of Race
Measure: Blacks’ and Whites’ Verbal GRE Performance

Verbal Test Performance
blackswhites whites8
9
10
6
7
8
lved
blacks4
5
6
item
s so
2
3
4
# of
1Asked to Indicate Race Not Asked to Indicate Race
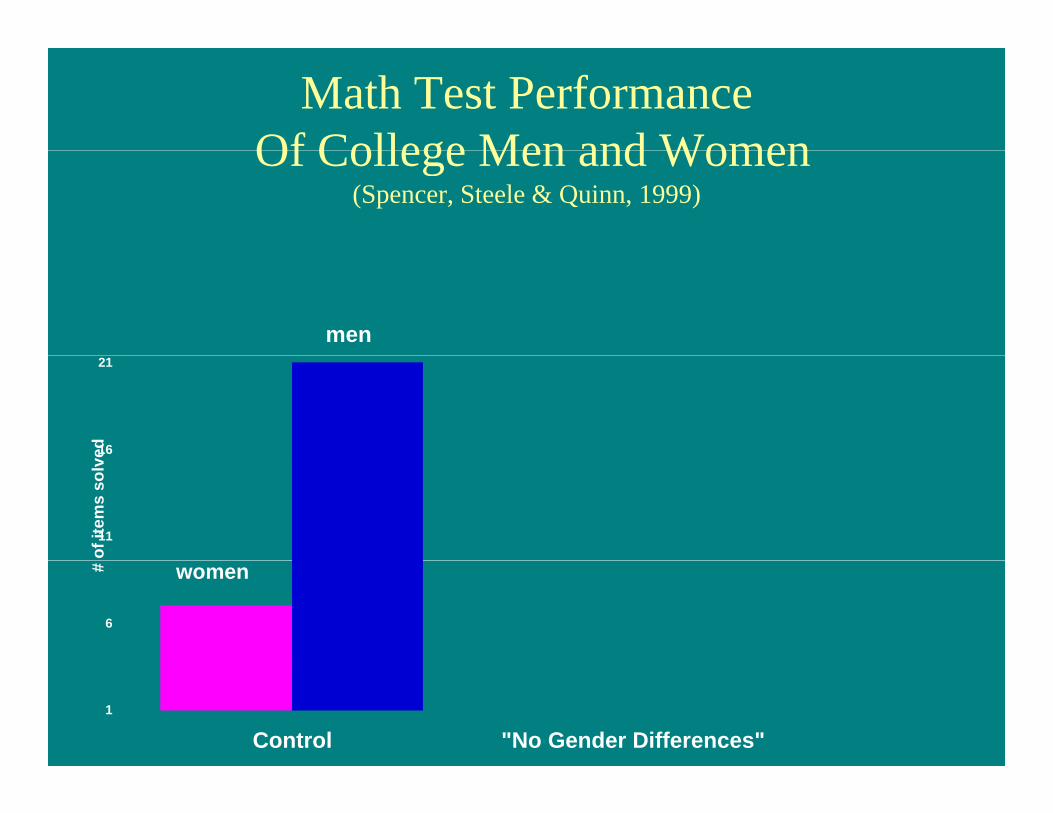
Math Test PerformanceOf College Men and WomenOf College Men and Women
(Spencer, Steele & Quinn, 1999)
men
16
21
ed
11
of it
ems
solv
6
# women
1
Control "No Gender Differences"
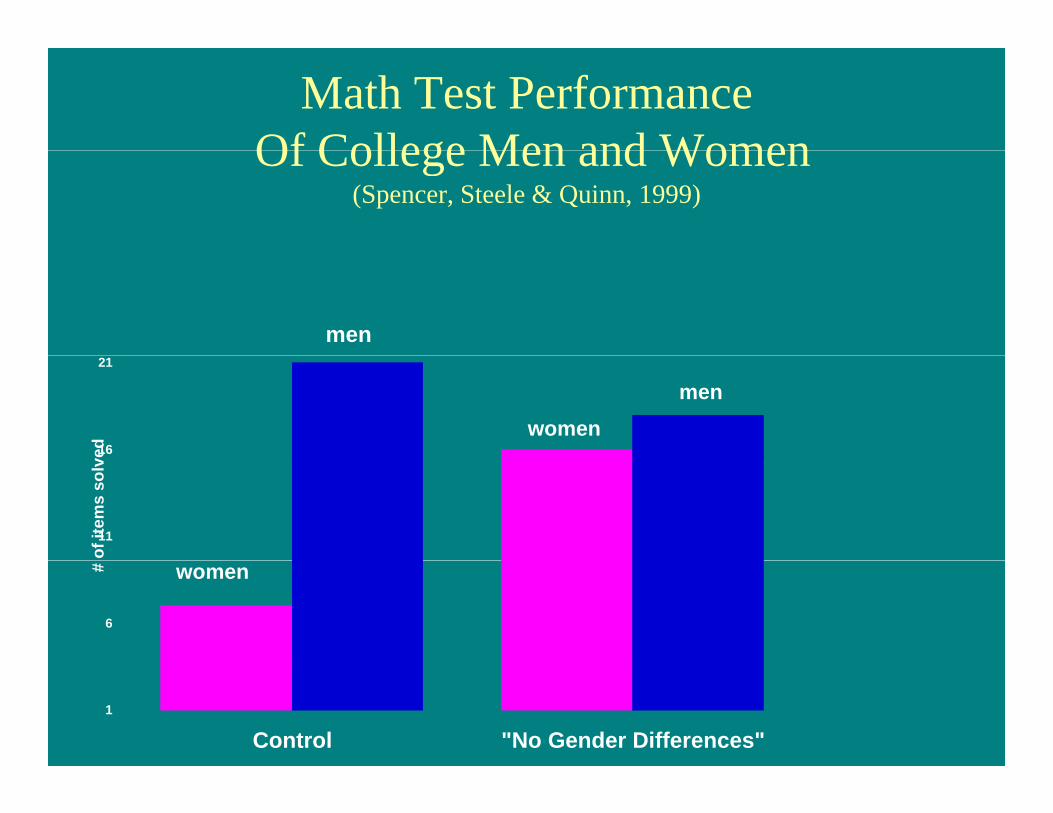
Math Test PerformanceOf College Men and WomenOf College Men and Women
(Spencer, Steele & Quinn, 1999)
men
16
21
ed
menwomen
11
of it
ems
solv
6
# women
1
Control "No Gender Differences"
Additional Studies Finding Performance Effectsg
• Latinos taking verbal tests
• Elderly taking short-term memory tests
• Low SES Students taking verbal tests
• Blacks and Miniature Golf
• Women taking tests of Political Knowledge, Driving, Chess
• White males taking tests of social sensitivity
• White Males Taking Math Tests

When White Men Can’t Do MathAronson et al (1999) Journal of Experimental Social PsychologyAronson, et al., (1999). Journal of Experimental Social Psychology.
12
9
1011
12
d
5
67
8
tem
s So
lved
1
23
4
It
1
Test of Your Math AbilityTest of Your Math AbilityRelative to Asians

When White Men Can’t Do MathAronson, et al., (1999). Journal of Experimental Social Psychology.
12
9
1011
12
d
d = .93
5
67
8
tem
s So
lved
1
23
4
It
1
Test of Your Math AbilityTest of Your Math Ability Relativeto Asians
Stereotype Threat in the “Real World”

Educational Testing ServiceField Study:Field Study:
Asking About Gender before or After Before Taking APg

ETS Field Study:Asking Gender Before Taking AP Calculus
Test Hurts Girls
16
17
14
15
rmul
a S
core Female
Male
12
13
AP
For
11
Inquiry Before Inquiry After
(Stricker, 2002). Journal of Applied Social Psychology.
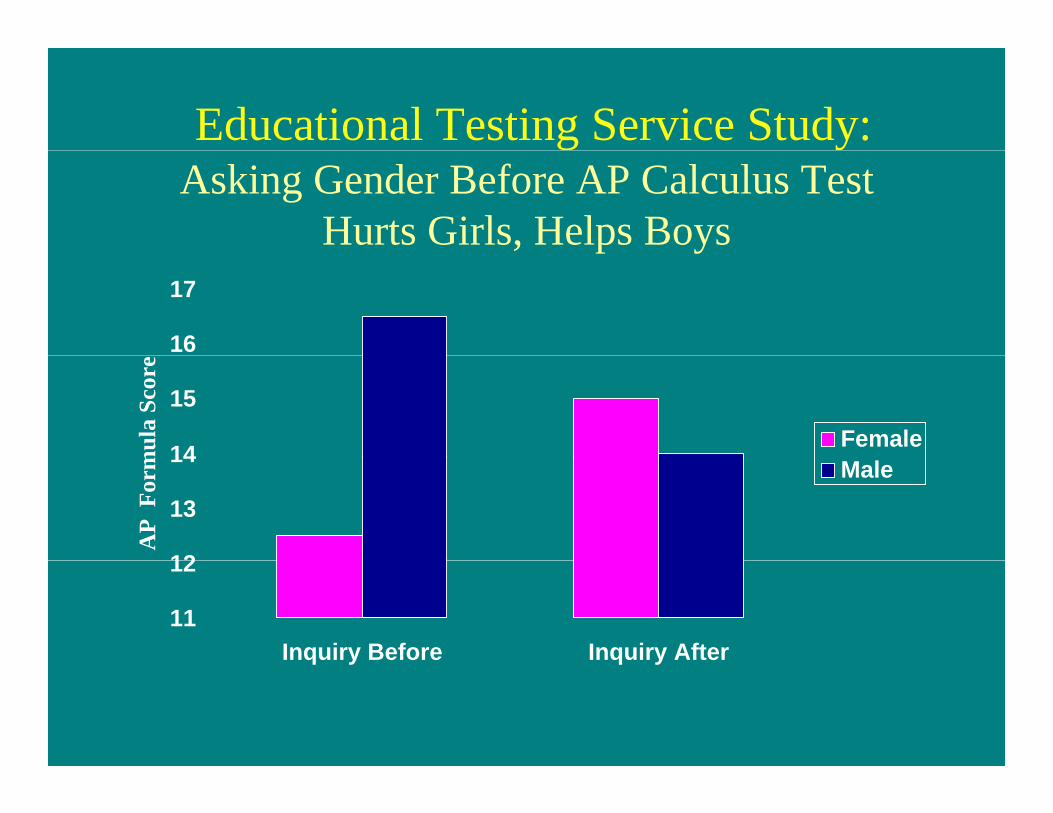
Educational Testing Service Study:Asking Gender Before AP Calculus Test
Hurts Girls, Helps Boysp y
16
17
14
15
mul
a Sc
ore
Female
12
13
14
AP
For
m Male
11
12
Inquiry Before Inquiry Afterq y q y

Danaher and Crandall (2008)Danaher and Crandall (2008)Reanalysis of ETS Study
“Women benefited substantially on the calculus test when demographics were g pasked after testing rather than before. This simple, small, and inexpensive change p , , p gcould increase U.S. women receiving AP Calculus AB credit by more than 4,700 y ,every year.”

Field Experiment: Women in the Science Pipeline
Highest Level Calculus Students

Field Study: Women in the Science Pipeline
Highest Level College Calculus Students
44.5
5
ved
2.53
3.54
item
s sol
v
FemaleMale
0 51
1.52
Cal
culu
s Male
00.5
CONTROL "NO GENDERDIFFERENCES"
Good, Aronson, & Harder (in press) Journal of Applied Developmental Psychology
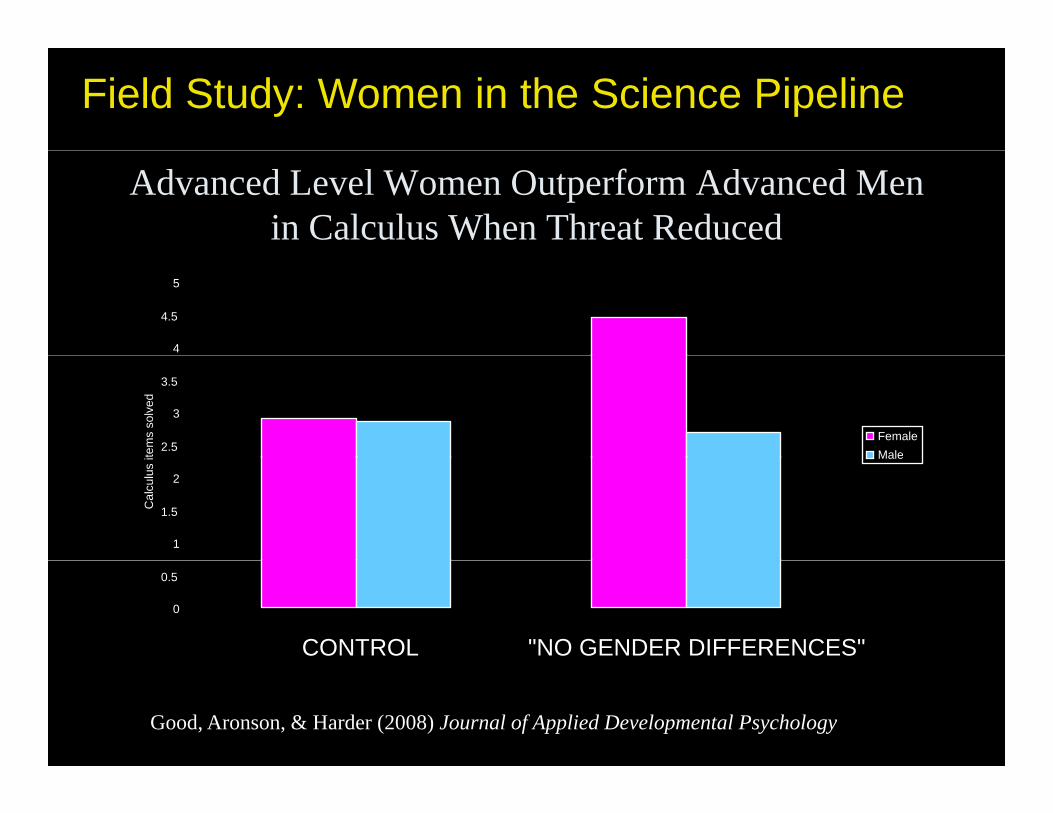
Field Study: Women in the Science Pipeline
Advanced Level Women Outperform Advanced Men in Calculus When Threat Reduced
4
4.5
5
2.5
3
3.5
tem
s so
lved
FemaleMale
1
1.5
2
Cal
culu
s i Male
0
0.5
CONTROL "NO GENDER DIFFERENCES"
Good, Aronson, & Harder (2008) Journal of Applied Developmental Psychology

California Exit Study Experiment:Comparing performance on HighComparing performance on High
and Low Stakes Tests
High Stakes Tests Hurt Minorities and Girls
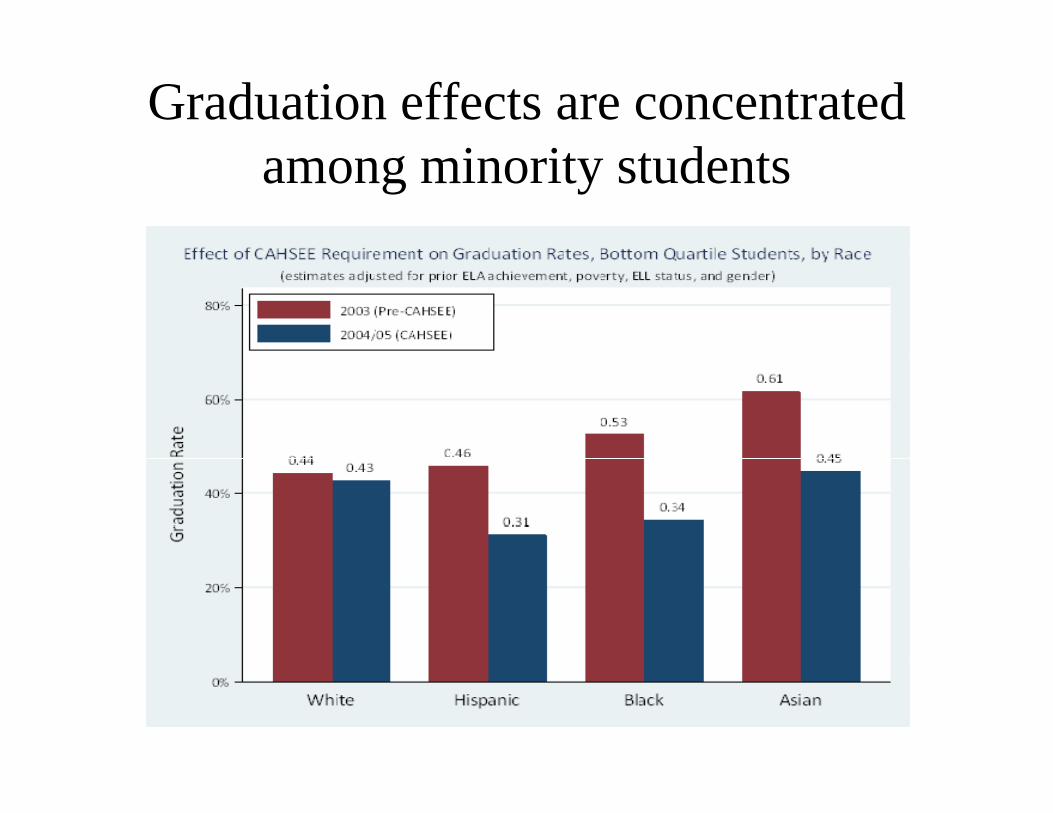
Graduation effects are concentrated i i damong minority students
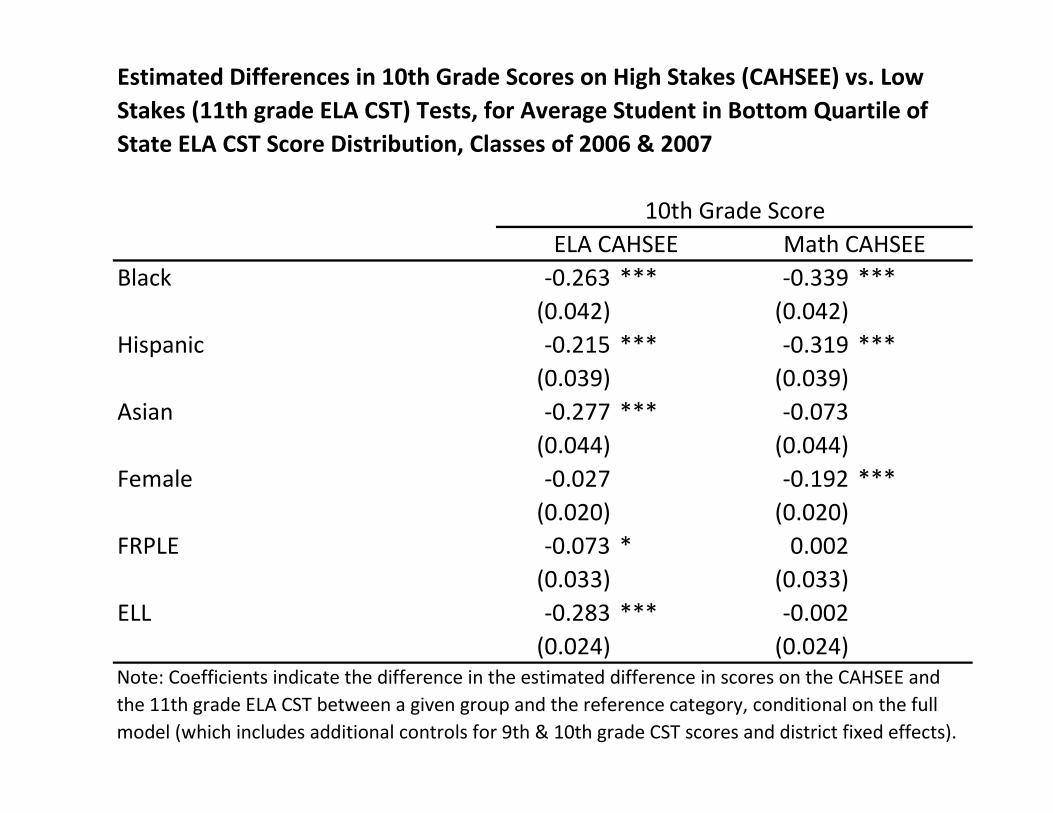
Estimated Differences in 10th Grade Scores on High Stakes (CAHSEE) vs. Low Stakes (11th grade ELA CST) Tests, for Average Student in Bottom Quartile of State ELA CST Score Distribution, Classes of 2006 & 2007State ELA CST Score Distribution, Classes of 2006 & 2007
10th Grade ScoreELA CAHSEE Math CAHSEE
Black ‐0.263 *** ‐0.339 ***(0.042) (0.042)
Hispanic ‐0.215 *** ‐0.319 ***p(0.039) (0.039)
Asian ‐0.277 *** ‐0.073(0.044) (0.044)
Female ‐0.027 ‐0.192 ***(0.020) (0.020)
FRPLE ‐0.073 * 0.002(0.033) (0.033)
ELL ‐0.283 *** ‐0.002(0.024) (0.024)
Note: Coefficients indicate the difference in the estimated difference in scores on the CAHSEE and the 11th grade ELA CST between a given group and the reference category, conditional on the full model (which includes additional controls for 9th & 10th grade CST scores and district fixed effects).

Conclusions from 300 Studies
• develops around age 10 in most children
• can affect even those students with lots of ability and lots of confidence in their abilities, from any group, y g p
• can arise as a function of grouping alone, integrated groups trigger ittrigger it.
• mediated by anxiety, reduced working memory capacity, and reduced self-regulation capacity.
• Stereotype threat influences GPA as well as immediate• Stereotype threat influences GPA as well as immediate performance: Accounts for about 10% of the GPA Gap

Chronic Stereotype VulnerabilityChronic Stereotype Vulnerability Can lead to Lower Ability

Chronic Stereotype VulnerabilityChronic Stereotype Vulnerability Can lead to Lower Ability
•Avoidance of Challenge/practiceg p
•Disengagement

From Vulnerability to Inabilityy y
"No circle is more vicious than the one having to do with intelligence. Children who may be only a little behind their peerswho may be only a little behind their peers to begin with tend to avoid those things that could have made them a little smarter. As a result they fall further and further behind. Meanwhile the kids who started out a little ahead are doing push ups without a little ahead are doing push-ups with their brains.”
Judith Rich HarrisJud t c a s
Part Two:Part Two:
Reducing ThreatMindset MattersMindset Matters
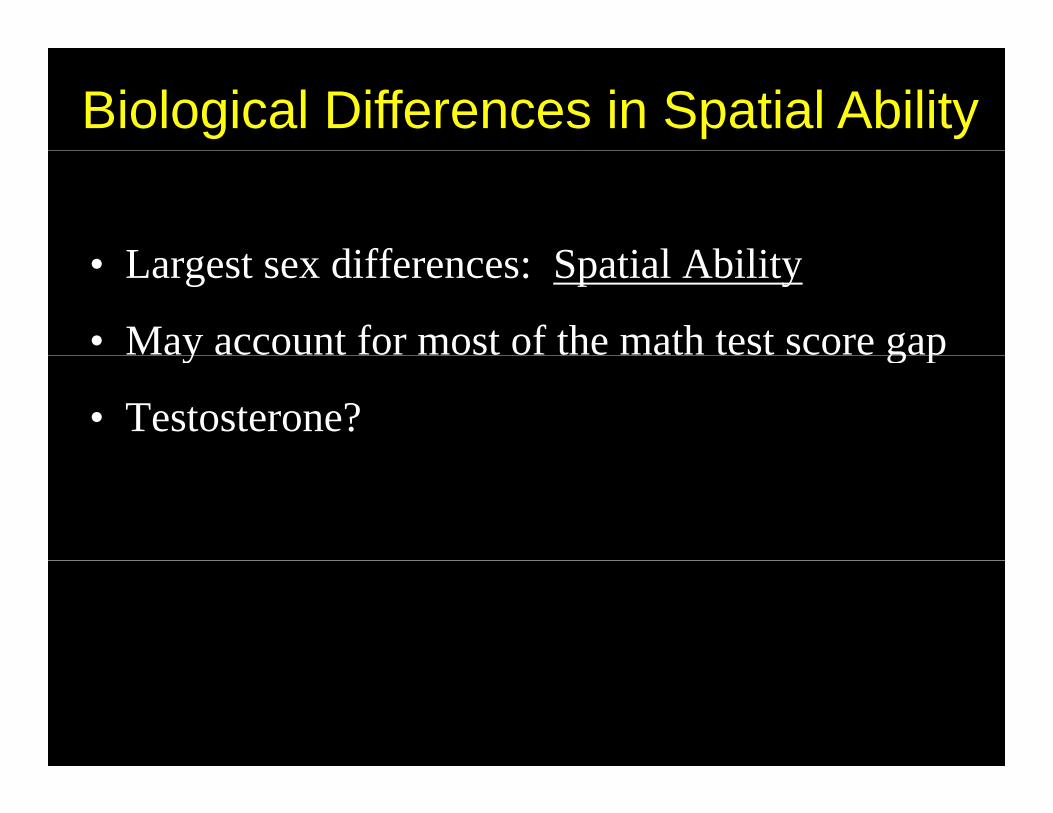
Biological Differences in Spatial Ability
L t diff S ti l Abilit• Largest sex differences: Spatial Ability
• May account for most of the math test score gapy g p
• Testosterone?

Vandenberg Mental RotationVandenberg Mental Rotation Task
A t l i t i i 286 d t t d 100 000A meta-analysis containing 286 data sets and 100,000 subjects found a highly significant male advantage for mental rotation; this pattern remains stable across age and has not decreased in recent yearsdecreased in recent years.
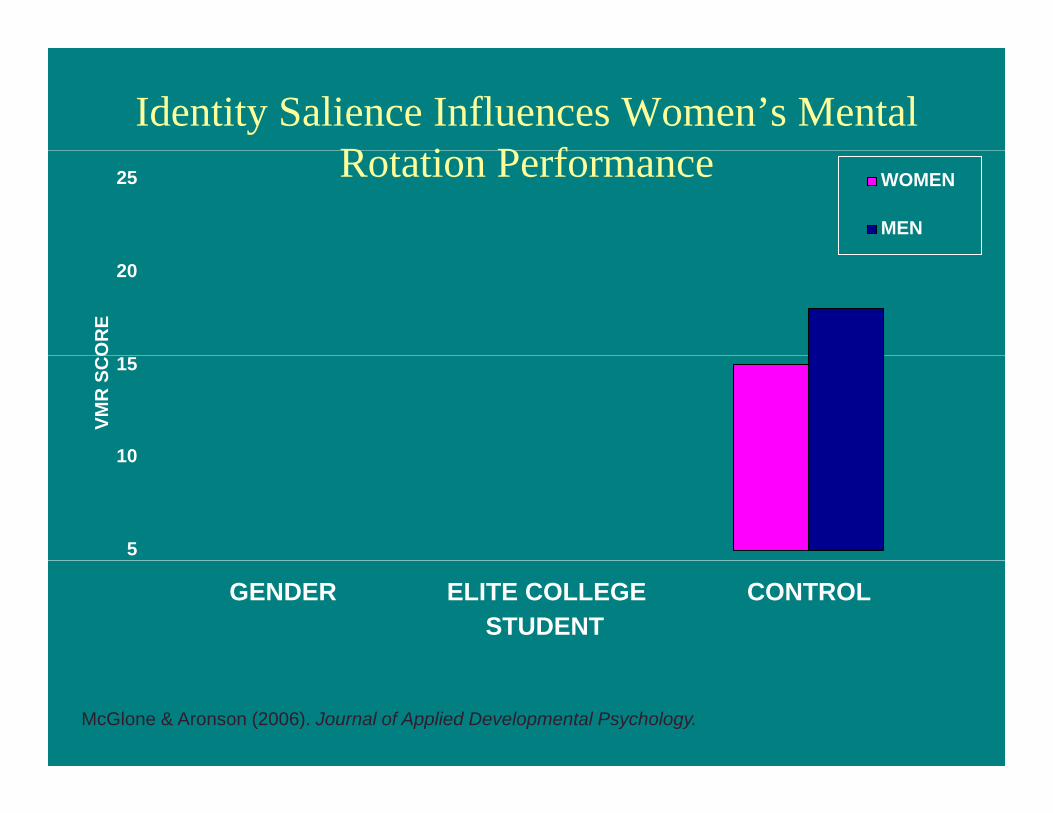
Identity Salience Influences Women’s Mental R i P fRotation Performance25 WOMEN
MEN
20
OR
E
10
15
VMR
SC
O
5
10
GENDER ELITE COLLEGESTUDENT
CONTROL
McGlone & Aronson (2006). Journal of Applied Developmental Psychology.

Identity Salience Influences Women’s Mental R i P fRotation Performance
25 WOMEN
MEN
20
E
MEN
15
VMR
SC
OR
E
10
V
5
GENDER ELITE COLLEGESTUDENT
CONTROLSTUDENT
McGlone & Aronson (2006). Journal of Applied Developmental Psychology.
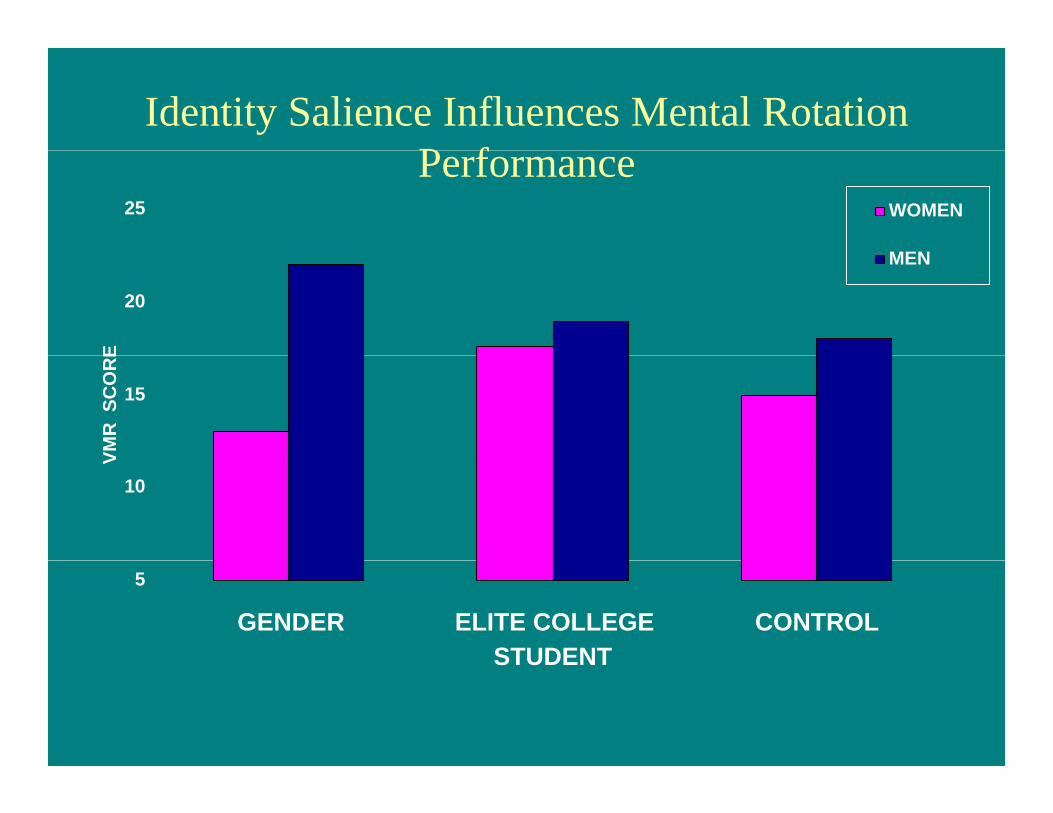
Identity Salience Influences Mental Rotation P fPerformance
25 WOMEN
MEN
20
E
MEN
15
VMR
SC
OR
E
10
V
5
GENDER ELITE COLLEGESTUDENT
CONTROLSTUDENT

Reducing Stereotype Threat:Reducing Stereotype Threat:The role of conceptions of intelligence
“The mind is much more like a muscle than we’ve ever realized… it needs to get cognitive exercise. It’s not some piece of clay on which you put an indeliblesome piece of clay on which you put an indelible mark.”
James Flynn, intelligence expert, 2007


ExperimentAAronson (in preparation)
Question:What if you were led to believe ability is
malleable? Would it reduce effects of stereotype threat?
Method: Framing test as a measure of a fixed or a malleable ability
M Bl k ’ d Whit ’ T t P fMeasure: Blacks’ and Whites’ Test Performance

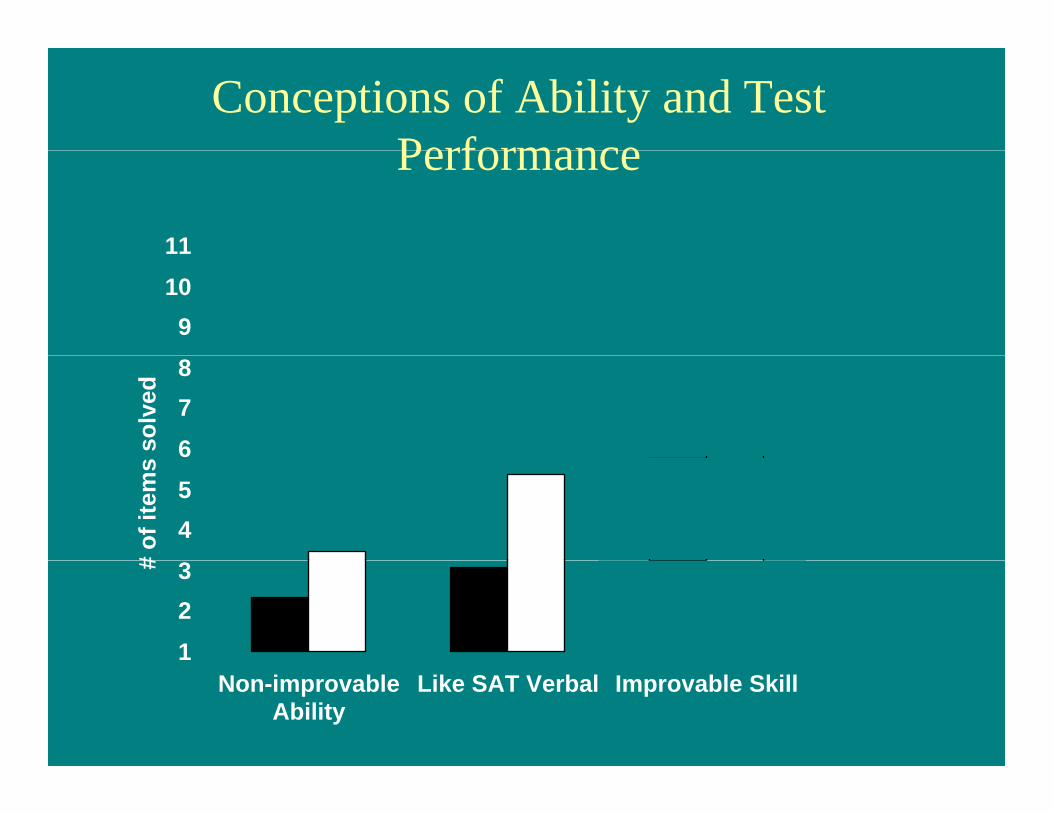
Conceptions of Ability and Test PerformancePerformance
11
91011
678
solv
ed
45
# of
item
s
123#
Non-improvableAbility
Like SAT Verbal Improvable Skill
Conceptions of Ability and Test PerformancePerformance
11
91011
678
solv
ed
45
# of
item
s
123#
Non-improvableAbility
Like SAT Verbal Improvable Skill

Conceptions of Ability and Test PerformancePerformance
1011
African Americans Whites
789
olve
d
African Americans Whites
456
of it
ems
s
123#
o
"Non-improvable
Ability"
"Like SATVerbal"(control)
"ImprovableSkill"
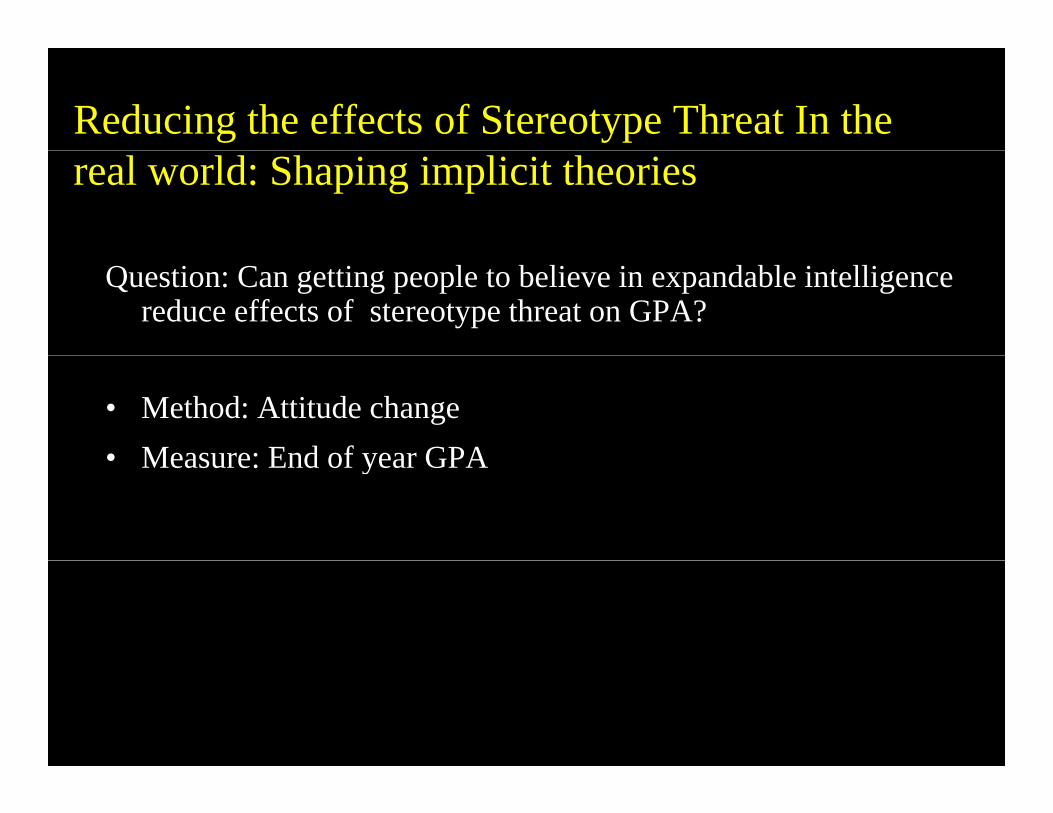
Reducing the effects of Stereotype Threat In the real world: Shaping implicit theories
Question: Can getting people to believe in expandable intelligence reduce effects of stereotype threat on GPA?
• Method: Attitude change• Measure: End of year GPA• Measure: End of year GPA

Year End Follow-Up:
GPA
3.553 34
4 MALLEABLECONTROL
3.32
3.05
3.34
3GPA
2
Blacks Whites
Aronson, Fried & Good (2002). Journal of Experimental Social Psychology.

Reducing Stereotype Threat in Middle School: A field Intervention
Question: Can psychological intervention raise test scores of minority students?
• Method: mentoring study; attitude change• Method: mentoring study; attitude change• Conditions:
– Malleability of intelligence– Role Models: senior students who stress the normality of early difficulty– Control (drug abuse message)
• Measure: Texas Assessment of Academic Skills (TAAS)( )
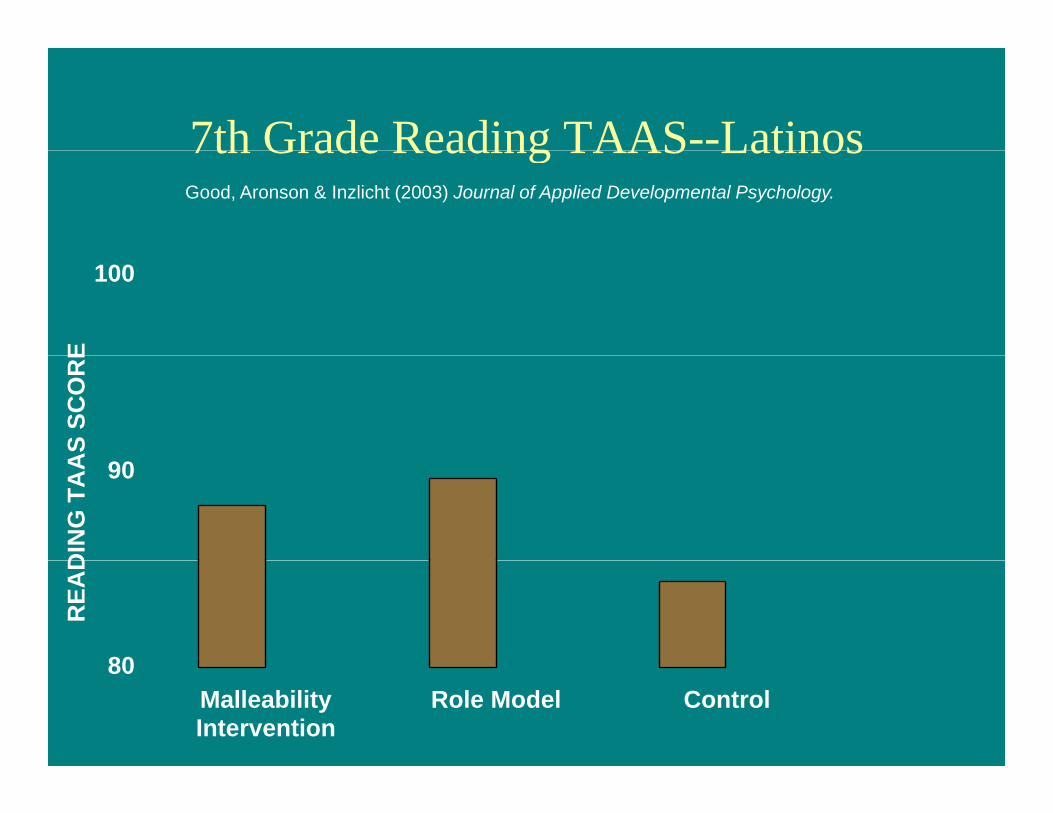
7th Grade Reading TAAS--Latinos7th Grade Reading TAAS LatinosGood, Aronson & Inzlicht (2003) Journal of Applied Developmental Psychology.
100
EA
S SC
OR
E
90
DIN
G T
AA
80
REA
D
80MalleabilityIntervention
Role Model Control
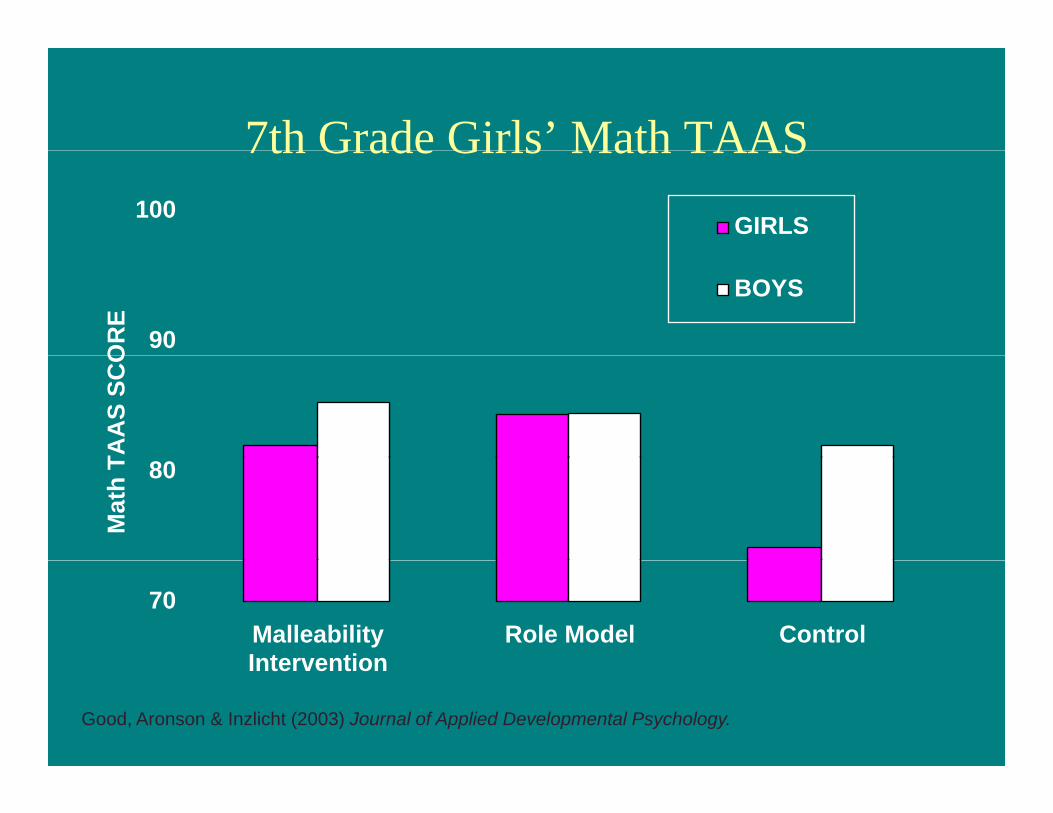
7th Grade Girls’ Math TAAS7th Grade Girls Math TAAS100 GIRLS
90OR
E
BOYS
TAA
S SC
O
80
Mat
h T
70MalleabilityIntervention
Role Model ControlIntervention
Good, Aronson & Inzlicht (2003) Journal of Applied Developmental Psychology.

Cooperative Learning
Slavin & Oilicke (1981)
Method: Study Cooperatively or Alone
Measure: Test performancep

Verbal Test Performance
blackswhites whites
75
80
blacks70
OR
E
60
65
TEST
SC
O
55
60T
50Individual Learning Cooperative Learning

Some Policy Implications
• Strict, high stakes testing regimes may be hurting minorities; some believe exit exams should be discontinued
• If they are kept steps need to be taken to reduce their• If they are kept, steps need to be taken to reduce their harmful effects
• Psychological interventions are far cheaper and often more effective than large expensive ones
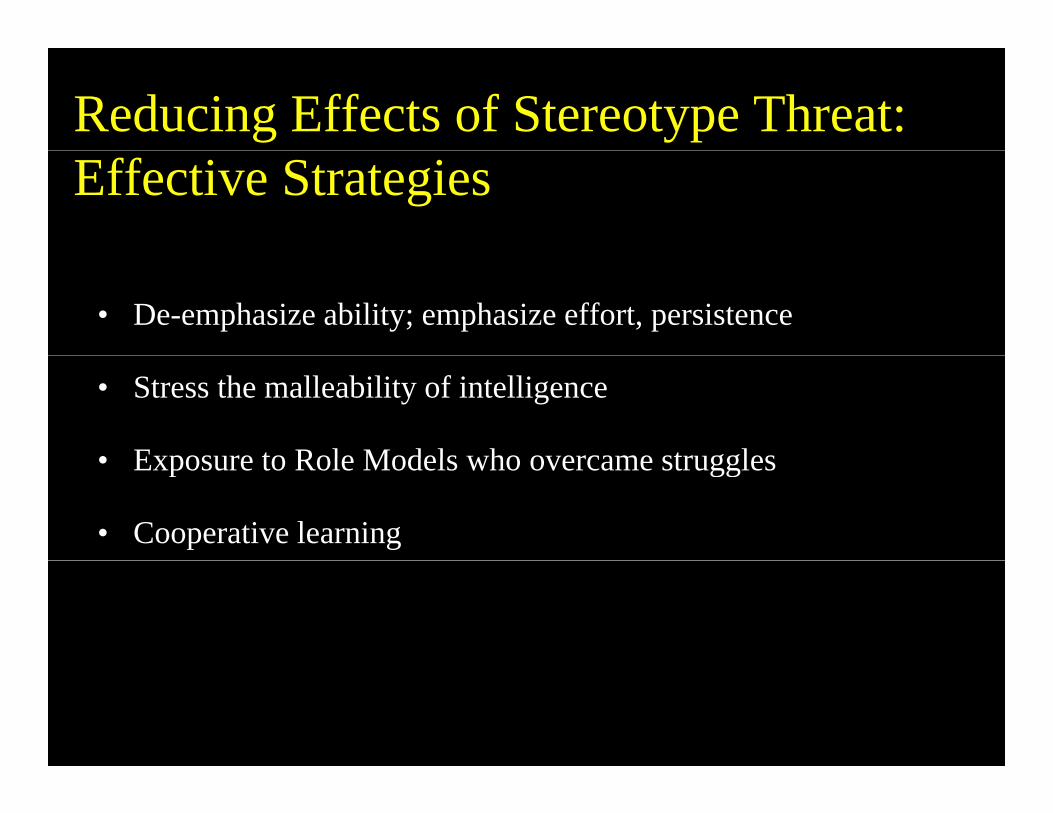
Reducing Effects of Stereotype Threat: Effective Strategies
• De-emphasize ability; emphasize effort, persistence
• Stress the malleability of intelligence
• Exposure to Role Models who overcame struggles• Exposure to Role Models who overcame struggles
• Cooperative learning

"By nature emplanted, for nurture to enlarge"enlarge
Richard Mulcaster, 1581First Headmaster of Merchant Taylors' School in London
