attachment b, part 5 - phase i bird and bat conservation ... · radar has a range of 2 to 5 miles...
TRANSCRIPT

APPENDIX A


APPENDIX B
1
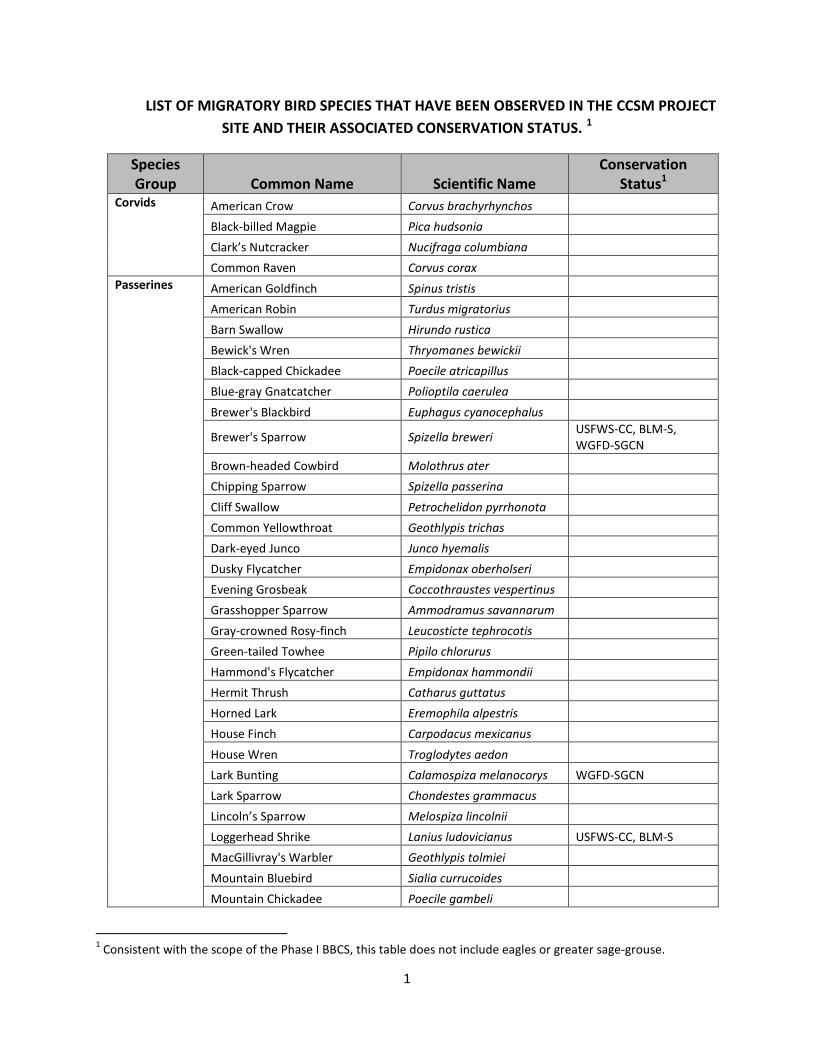
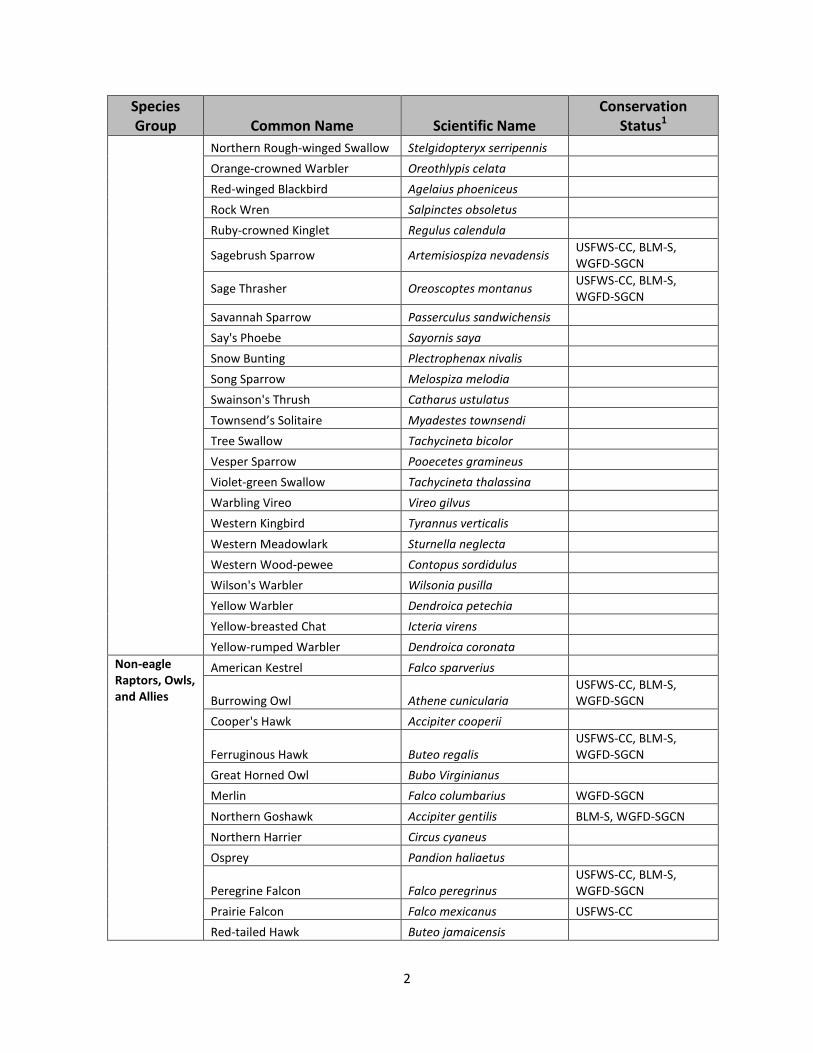
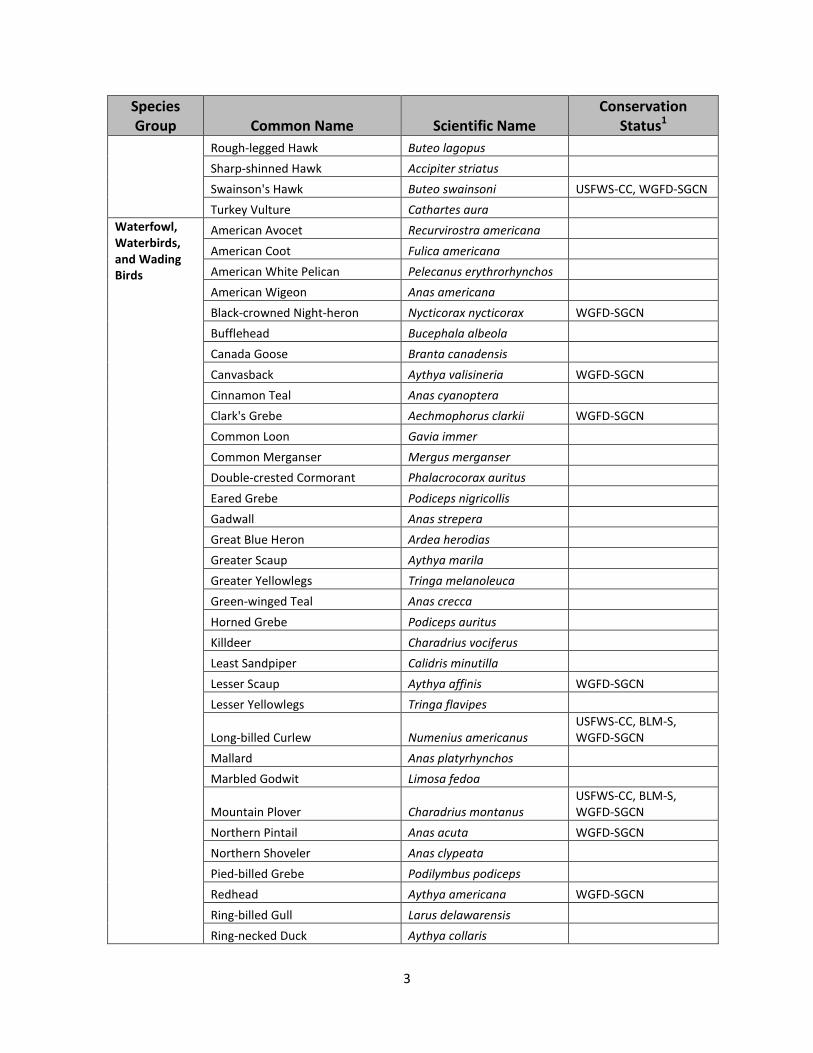
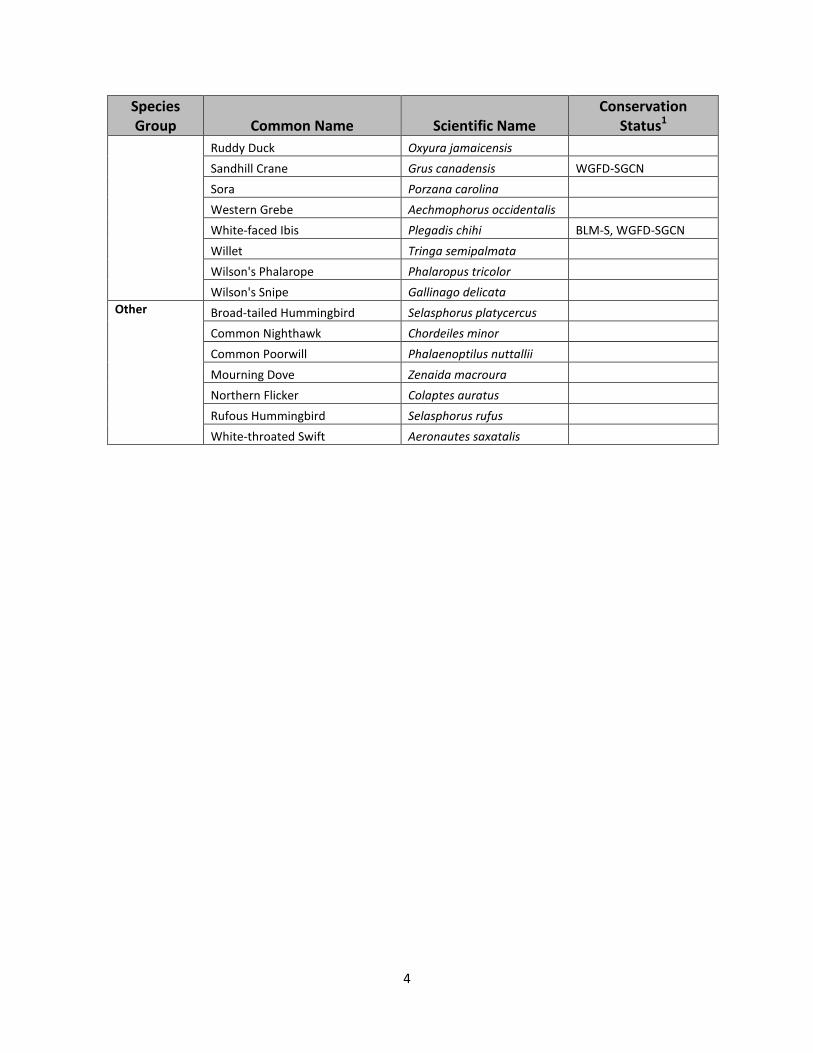
LIST OF MIGRATORY BIRD SPECIES THAT HAVE BEEN OBSERVED IN THE CCSM PROJECT SITE AND THEIR ASSOCIATED CONSERVATION STATUS. 1
Species Group Common Name Scientific Name
Conservation Status1
Corvids
American Crow Corvus brachyrhynchos Black-billed Magpie Pica hudsonia Clark’s Nutcracker Nucifraga columbiana
Common Raven Corvus corax Passerines
American Goldfinch Spinus tristis American Robin Turdus migratorius Barn Swallow Hirundo rustica Bewick's Wren Thryomanes bewickii Black-capped Chickadee Poecile atricapillus Blue-gray Gnatcatcher Polioptila caerulea Brewer's Blackbird Euphagus cyanocephalus
Brewer's Sparrow Spizella breweri USFWS-CC, BLM-S, WGFD-SGCN
Brown-headed Cowbird Molothrus ater Chipping Sparrow Spizella passerina Cliff Swallow Petrochelidon pyrrhonota Common Yellowthroat Geothlypis trichas Dark-eyed Junco Junco hyemalis Dusky Flycatcher Empidonax oberholseri Evening Grosbeak Coccothraustes vespertinus Grasshopper Sparrow Ammodramus savannarum
Gray-crowned Rosy-finch Leucosticte tephrocotis Green-tailed Towhee Pipilo chlorurus Hammond's Flycatcher Empidonax hammondii Hermit Thrush Catharus guttatus Horned Lark Eremophila alpestris House Finch Carpodacus mexicanus House Wren Troglodytes aedon Lark Bunting Calamospiza melanocorys WGFD-SGCN
Lark Sparrow Chondestes grammacus Lincoln’s Sparrow Melospiza lincolnii
Loggerhead Shrike Lanius ludovicianus USFWS-CC, BLM-S MacGillivray's Warbler Geothlypis tolmiei
Mountain Bluebird Sialia currucoides Mountain Chickadee Poecile gambeli
1 Consistent with the scope of the Phase I BBCS, this table does not include eagles or greater sage-grouse.
2
Species Group Common Name Scientific Name
Conservation Status1
Northern Rough-winged Swallow Stelgidopteryx serripennis Orange-crowned Warbler Oreothlypis celata Red-winged Blackbird Agelaius phoeniceus Rock Wren Salpinctes obsoletus Ruby-crowned Kinglet Regulus calendula
Sagebrush Sparrow Artemisiospiza nevadensis USFWS-CC, BLM-S, WGFD-SGCN
Sage Thrasher Oreoscoptes montanus USFWS-CC, BLM-S, WGFD-SGCN
Savannah Sparrow Passerculus sandwichensis Say's Phoebe Sayornis saya Snow Bunting Plectrophenax nivalis Song Sparrow Melospiza melodia Swainson's Thrush Catharus ustulatus Townsend’s Solitaire Myadestes townsendi
Tree Swallow Tachycineta bicolor Vesper Sparrow Pooecetes gramineus Violet-green Swallow Tachycineta thalassina Warbling Vireo Vireo gilvus Western Kingbird Tyrannus verticalis Western Meadowlark Sturnella neglecta Western Wood-pewee Contopus sordidulus Wilson's Warbler Wilsonia pusilla Yellow Warbler Dendroica petechia Yellow-breasted Chat Icteria virens Yellow-rumped Warbler Dendroica coronata
Non-eagle Raptors, Owls, and Allies
American Kestrel Falco sparverius
Burrowing Owl Athene cunicularia USFWS-CC, BLM-S, WGFD-SGCN
Cooper's Hawk Accipiter cooperii
Ferruginous Hawk Buteo regalis USFWS-CC, BLM-S, WGFD-SGCN
Great Horned Owl Bubo Virginianus Merlin Falco columbarius WGFD-SGCN
Northern Goshawk Accipiter gentilis BLM-S, WGFD-SGCN Northern Harrier Circus cyaneus
Osprey Pandion haliaetus
Peregrine Falcon Falco peregrinus USFWS-CC, BLM-S, WGFD-SGCN
Prairie Falcon Falco mexicanus USFWS-CC Red-tailed Hawk Buteo jamaicensis
3
Species Group Common Name Scientific Name
Conservation Status1
Rough-legged Hawk Buteo lagopus Sharp-shinned Hawk Accipiter striatus Swainson's Hawk Buteo swainsoni USFWS-CC, WGFD-SGCN
Turkey Vulture Cathartes aura Waterfowl, Waterbirds, and Wading Birds
American Avocet Recurvirostra americana American Coot Fulica americana American White Pelican Pelecanus erythrorhynchos American Wigeon Anas americana Black-crowned Night-heron Nycticorax nycticorax WGFD-SGCN
Bufflehead Bucephala albeola Canada Goose Branta canadensis Canvasback Aythya valisineria WGFD-SGCN
Cinnamon Teal Anas cyanoptera Clark's Grebe Aechmophorus clarkii WGFD-SGCN
Common Loon Gavia immer Common Merganser Mergus merganser Double-crested Cormorant Phalacrocorax auritus Eared Grebe Podiceps nigricollis Gadwall Anas strepera Great Blue Heron Ardea herodias Greater Scaup Aythya marila Greater Yellowlegs Tringa melanoleuca Green-winged Teal Anas crecca Horned Grebe Podiceps auritus Killdeer Charadrius vociferus Least Sandpiper Calidris minutilla Lesser Scaup Aythya affinis WGFD-SGCN
Lesser Yellowlegs Tringa flavipes
Long-billed Curlew Numenius americanus USFWS-CC, BLM-S, WGFD-SGCN
Mallard Anas platyrhynchos Marbled Godwit Limosa fedoa
Mountain Plover Charadrius montanus USFWS-CC, BLM-S, WGFD-SGCN
Northern Pintail Anas acuta WGFD-SGCN Northern Shoveler Anas clypeata
Pied-billed Grebe Podilymbus podiceps Redhead Aythya americana WGFD-SGCN
Ring-billed Gull Larus delawarensis Ring-necked Duck Aythya collaris
4
Species Group Common Name Scientific Name
Conservation Status1
Ruddy Duck Oxyura jamaicensis Sandhill Crane Grus canadensis WGFD-SGCN
Sora Porzana carolina Western Grebe Aechmophorus occidentalis White-faced Ibis Plegadis chihi BLM-S, WGFD-SGCN
Willet Tringa semipalmata Wilson's Phalarope Phalaropus tricolor Wilson's Snipe Gallinago delicata Other Broad-tailed Hummingbird Selasphorus platycercus Common Nighthawk Chordeiles minor
Common Poorwill Phalaenoptilus nuttallii Mourning Dove Zenaida macroura Northern Flicker Colaptes auratus Rufous Hummingbird Selasphorus rufus White-throated Swift Aeronautes saxatalis

APPENDIX C

APPENDIX D

Avian and Bat Monitoring Protocols
for the
Chokecherry and Sierra Madre Wind Energy Project
Prepared for:
Power Company of Wyoming, LLC
555 17th Street, Suite 2400
Denver, CO 80202
Prepared by:
SWCA Environmental Consultants
295 Interlocken Blvd, Suite 300
Broomfield, CO 80021
303.487.1183 Fax: 303.487.1245
www.swca.com
March 2011
Avian Monitoring Protocols 2
Chokecherry and Sierra Madre Wind Energy Project
Review of Agency Recommendations
The following protocols have been developed in accordance with the following agency
recommendations:
U.S. Fish and Wildlife Service (USFWS)
Wind Turbine Guidelines Advisory Committee Recommendations on Developing Effective
Measures to Mitigate Impacts to Wildlife and Their Habitats Related to Land-Based
Wind Energy Facilities (USFWS 2010)
USFWS Draft Land-Based Wind Energy Guidelines (USFWS 2011a)
Draft Eagle Conservation Plan Guidance (USFWS 2011b)
Wyoming Department of Game and Fish (WGFD)
Wildlife Protection Recommendations for Wind Energy Development in Wyoming (WGFD 2010)
Bureau of Land Management (BLM)
Rawlins Field Office Wildlife Survey Protocols for Wind Energy Development,
Generally, UFWS survey recommendations (USFWS 2010, 2011a, and 2011b) include using
standard sampling methods to determine avian use of a project area, fatality risk in a project area,
the presence of sensitive species and other species of interest, and to provide a baseline for
assessing displacement effects and habitat loss. USFWS recommends that sampling frequency,
type, and duration be sufficient to account for variability of avian use between and within
sampling periods. When more precise estimates of density are required for a special status
species, other methods, including radar or nocturnal surveys have been recommended when risks
for collision are expected.
Similarly, the Bureau of Land Management (BLM) Rawlins Field Office Wildlife Survey
Protocols for Wind Energy Development recommends that surveys be sufficient to detect
temporal and spatial use patterns within the project area. Special emphasis is placed on surveys
for raptors and sensitive avian species. BLM survey protocols recommend weekly, 20-minute
point counts to record avian use of a project area. Survey times are recommended to be varied
weekly to ensure that avian use during daylight hours is adequately documented. In addition to
weekly surveys, marine radar is recommended to better define avian foraging, dispersal, and
migration paths.
Wyoming Game and Fish Department’s (WGFD) Wildlife Protections Recommendations for
Wind Energy Development in Wyoming recommend sufficient numbers of weekly point count
surveys during spring and fall migration periods following similar protocols as specific by BLM
with survey periods of twenty minutes at each point. WGFD recommends that four surveys be
conducted during winter months to capture overwintering avian species. For raptor species,
WGFD recommends nest surveys and weekly day-long surveys during spring and fall migration
periods.
Avian Monitoring Protocols 3
Chokecherry and Sierra Madre Wind Energy Project
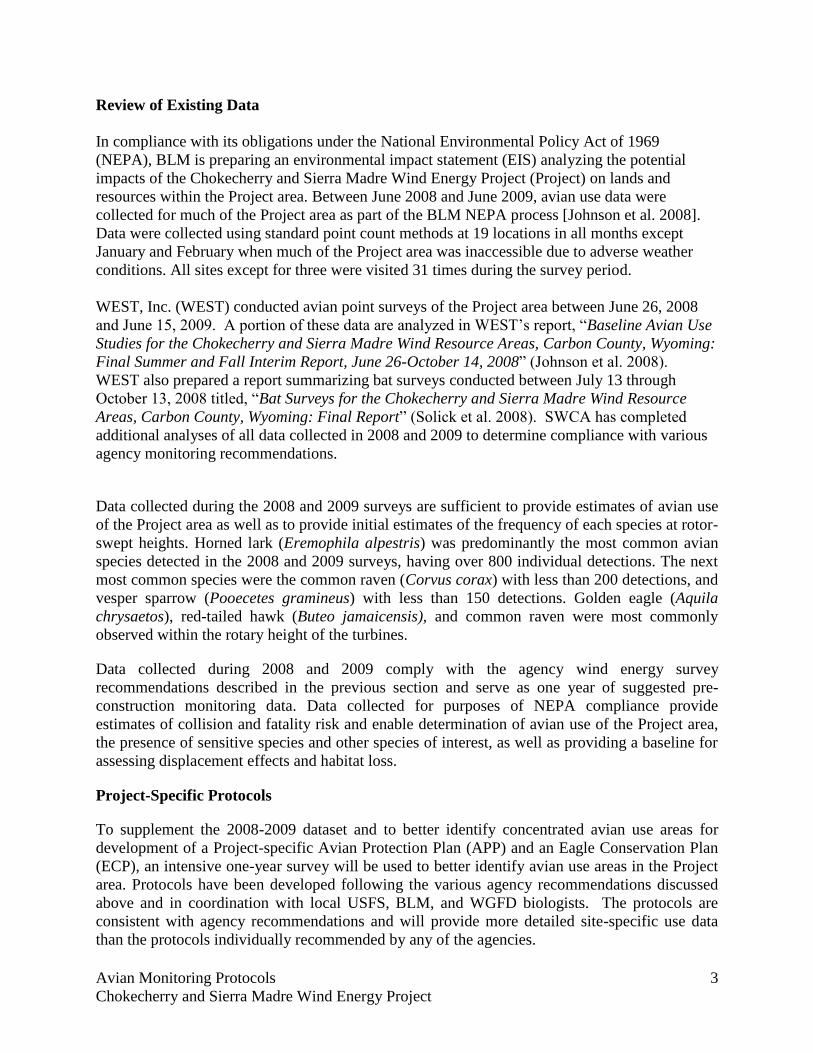
Review of Existing Data
In compliance with its obligations under the National Environmental Policy Act of 1969
(NEPA), BLM is preparing an environmental impact statement (EIS) analyzing the potential
impacts of the Chokecherry and Sierra Madre Wind Energy Project (Project) on lands and
resources within the Project area. Between June 2008 and June 2009, avian use data were
collected for much of the Project area as part of the BLM NEPA process [Johnson et al. 2008].
Data were collected using standard point count methods at 19 locations in all months except
January and February when much of the Project area was inaccessible due to adverse weather
conditions. All sites except for three were visited 31 times during the survey period.
WEST, Inc. (WEST) conducted avian point surveys of the Project area between June 26, 2008
and June 15, 2009. A portion of these data are analyzed in WEST’s report, “Baseline Avian Use
Studies for the Chokecherry and Sierra Madre Wind Resource Areas, Carbon County, Wyoming:
Final Summer and Fall Interim Report, June 26-October 14, 2008” (Johnson et al. 2008).
WEST also prepared a report summarizing bat surveys conducted between July 13 through
October 13, 2008 titled, “Bat Surveys for the Chokecherry and Sierra Madre Wind Resource
Areas, Carbon County, Wyoming: Final Report” (Solick et al. 2008). SWCA has completed
additional analyses of all data collected in 2008 and 2009 to determine compliance with various
agency monitoring recommendations.
Data collected during the 2008 and 2009 surveys are sufficient to provide estimates of avian use
of the Project area as well as to provide initial estimates of the frequency of each species at rotor-
swept heights. Horned lark (Eremophila alpestris) was predominantly the most common avian
species detected in the 2008 and 2009 surveys, having over 800 individual detections. The next
most common species were the common raven (Corvus corax) with less than 200 detections, and
vesper sparrow (Pooecetes gramineus) with less than 150 detections. Golden eagle (Aquila
chrysaetos), red-tailed hawk (Buteo jamaicensis), and common raven were most commonly
observed within the rotary height of the turbines.
Data collected during 2008 and 2009 comply with the agency wind energy survey
recommendations described in the previous section and serve as one year of suggested pre-
construction monitoring data. Data collected for purposes of NEPA compliance provide
estimates of collision and fatality risk and enable determination of avian use of the Project area,
the presence of sensitive species and other species of interest, as well as providing a baseline for
assessing displacement effects and habitat loss.
Project-Specific Protocols
To supplement the 2008-2009 dataset and to better identify concentrated avian use areas for
development of a Project-specific Avian Protection Plan (APP) and an Eagle Conservation Plan
(ECP), an intensive one-year survey will be used to better identify avian use areas in the Project
area. Protocols have been developed following the various agency recommendations discussed
above and in coordination with local USFS, BLM, and WGFD biologists. The protocols are
consistent with agency recommendations and will provide more detailed site-specific use data
than the protocols individually recommended by any of the agencies.

Avian Monitoring Protocols 4
Chokecherry and Sierra Madre Wind Energy Project
A combination of avian radar, raptor count stations, standard grid sampling, and point count
surveys will be used to determine avian use across the Project area with emphasis on large
raptors including golden eagles. Avian radar technology has been identified by the BLM and
USFWS as a desired method to map areas of high avian use. The sampling design will follow
recommendations made by the USFWS, BLM, and WGFD by combining radar surveys with
standard point count and breeding bird methodologies. The radar technology will also enable
better identification of bat use areas and relative densities of bats in the Project area.
A DeTect Merlin Avian Radar System will be used to map avian use across the Project area. The
DeTect Merlin radar system is a trailer-mounted system with a 200-watt horizontal solid-state S-
band radar and a 10–kilowatt (kW) vertically operating X-band open array radar. The horizontal
radar has a range of 2 to 5 miles in a 360-degree pattern around the unit. The vertical radar has a
24-degree beam width and detects flight paths 0.75 to 2.00 miles above the unit.
The avian radar system requires weekly maintenance and fueling and cannot be moved over
extremely rough terrain on a regular basis. Additionally, the system will not differentiate
between large raptors such as golden eagles and other large birds including geese, other large
raptors, and possibly even ravens and; therefore, will be used in conjunction with field surveys to
validate radar recorded data. However, the radar system, when coupled with point count
verification of avian use, will allow for accurate horizontal and vertical mapping of avian use in
the Project area. The radar system will also enable mapping of high use areas for bat species.
A combination of raptor and point surveys and breeding bird grid surveys will be conducted in
concert with the radar survey. This design will provide intensive survey information regarding
avian use patterns within the radar survey perimeter for each season. Raptor count stations, point
counts, and breeding bird surveys will be used to validate the radar data and provide estimates of
species-specific use patterns. Raptor stations and point count surveys will record the location,
flight path, approximate height, and time of use for any individual observed from the count
location. Raptor count locations will be surveyed for 8-12 hours per day during periods with the
highest likelihood for detection of migrating birds and/or large raptors. Standard 20-minute
point counts will be completed at each raptor count location. Timing of point count surveys at
each location will be varied to determine patterns of avian use during daylight hours.
In addition to the raptor, point count, and radar surveys, breeding bird surveys will be completed
at 15 locations across the Project area. Breeding bird surveys will be conducted following the
grid monitoring protocols published by the Rocky Mountain Bird Observatory (RMBO) (Hanni
et al. 2010). Grid survey locations will be randomly selected using a generalized random
tessellation stratified design to ensure a spatially balanced design stratified by major vegetation
and habitat types in the Project area. Data collected as part of the grid monitoring efforts will
also be used to validate radar data and better determine avian species use. As part of the
breeding bird surveys, waterfowl and water bird use surveys will be conducted three times
annually (springs, summer, and fall) to identify migrating and resident species.
Locations for placement of the radar and for conducting point count surveys (Figure 1) and
breeding bird surveys were determined using a four-tiered approach:
Tier 1 – Survey areas should determine avian use within the Project area.

Avian Monitoring Protocols 5
Chokecherry and Sierra Madre Wind Energy Project
Tier 2 – Survey areas should overlap possible foraging areas for large raptors (winter
range areas, prairie dog towns, waterfowl use areas, etc.).
Tier 3 – Survey areas should be in locations to allow for detection of avian movement
into and out of the Project area.
Tier 4 – Survey areas should capture variability in habitat and topography.
Locations of radar placement were refined following attendance at DeTect’s radar training
courses and during coordination with DeTect’s radar placement specialists. Figure 1 reflects the
revised radar locations. Final placement of the radar unit and final point locations for survey will
be determine in early spring 2011 following radar unit delivery.
Avian Monitoring Protocols 6
Chokecherry and Sierra Madre Wind Energy Project
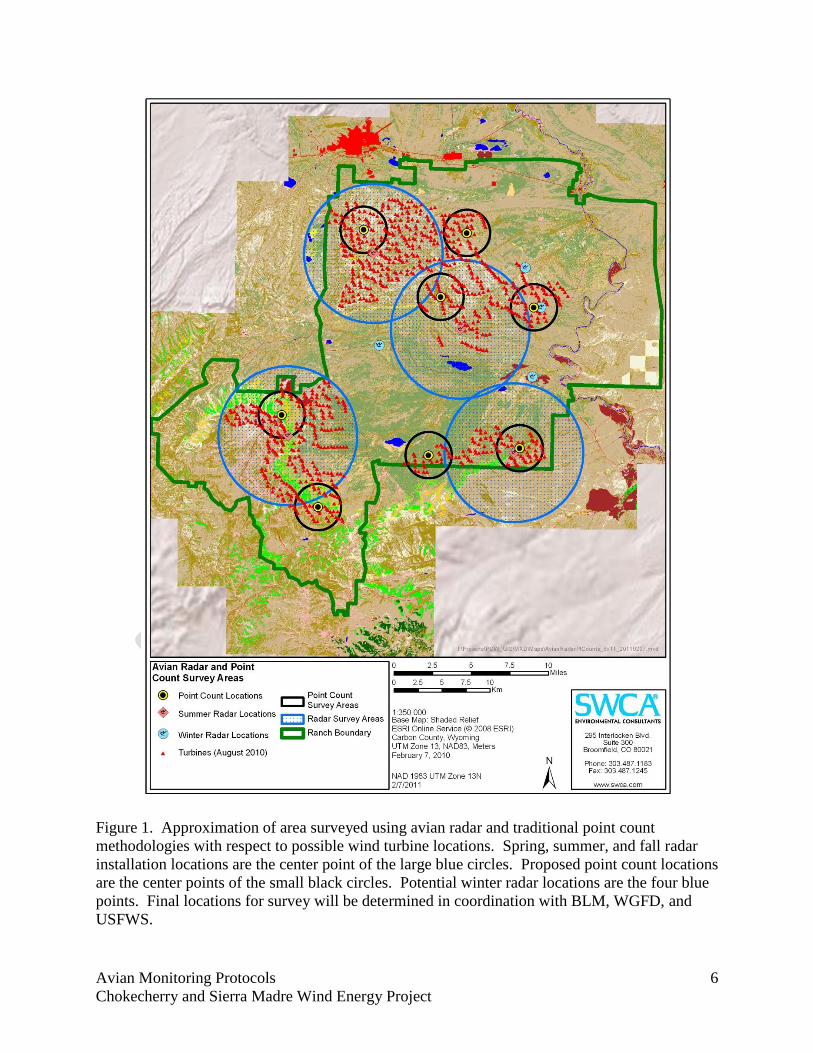
Figure 1. Approximation of area surveyed using avian radar and traditional point count
methodologies with respect to possible wind turbine locations. Spring, summer, and fall radar
installation locations are the center point of the large blue circles. Proposed point count locations
are the center points of the small black circles. Potential winter radar locations are the four blue
points. Final locations for survey will be determined in coordination with BLM, WGFD, and
USFWS.

Avian Monitoring Protocols 7
Chokecherry and Sierra Madre Wind Energy Project
The radar unit will be placed at five locations within the Project area (Figure 1). Point counts
will be completed at nine additional locations to map avian use patterns where radar coverage is
not possible. Eight of these point counts will be completed at permanent sampling locations.
The ninth point count location will be completed at the radar site to validate the data being
collected by the radar unit. During winter months, the radar will be placed in a location that has
high probability of access on a weekly basis. Much of the project area is covered in snow and
large drifts during winter; therefore, radar placement in winter will likely be near the Bolton
Ranch headquarters, south of I-80 near the North Platte River, on the Bolton Road east of Teton
Reservoir, or on the north side of the Chokecherry project area (Figure 1). Winter point count
survey locations will also be adjusted as needed to account for winter weather conditions, access
issues, and safety concerns.
Based on a four mile radius for radar surveys and a one mile radius for point count surveys,
approximately 90-93% of the turbine locations, depending on winter radar placement, will be
directly surveyed. It is likely that this percentage is higher than 90-93% for large raptors
including bald and golden eagles as many of the point count locations have visibility of several
miles and recent radar advancements may allow for detection of large raptors out to 5+ miles.
Point count locations outside of the radar survey perimeters have been placed to allow for
detection of raptors moving into the Project area and between radar surveyed zones.
Helicopter flights will be completed in mid-April or early May to document eagle nesting
activity as well as nesting activity of other raptors that are incidentally observed. Aerial nest
activity surveys will be completed in accordance with the recent draft eagle guidance (USFWS
2011b). Following identification of active eagle nests, follow-up productivity surveys will be
completed from the ground above/below the nest to determine nesting and fledging success.
The protocols and schedule outlined below will be followed for monitoring and mapping avian
and bat use across the Project area using the marine radar system, point counts, and breeding bird
surveys.
1. Winter 2010/2011 – Radar construction, programming, and training. The Draft APP/ECP
will be delivered to USFWS, BLM, and WGFD for review in late winter/early spring.
Among other descriptive sections, the preliminary plan will contain the detailed sampling
protocols, preliminary mitigation and avoidance measures, and detailed adaptive
management protocols. Monthly reconnaissance surveys will be completed to document
eagle use of the Project area during winter months and to help determine best locations
for winter 2011/2012 deployment of the radar system.
2. Spring and Early Summer 2011 – Radar surveys will begin in the southern portion of the
Project area. The radar system will be moved once during the spring migration period to
capture as much data as possible during this period. During the migration period, weekly
migratory bird counts and raptor use surveys will be conducted at the eight point counts
identified in Figure 1 as well as at the point where the radar system is placed. Breeding
bird surveys will be completed at 15 locations across the Project area. Surveys for
waterfowl and other waterbirds will be conducted once during the spring migration at
Kindt, Rasmussen, Sage Creek, and Teton reservoirs. Analysis of the radar data will be
Avian Monitoring Protocols 8
Chokecherry and Sierra Madre Wind Energy Project
used to identify areas with high avian and bat use. The following schedule will be used
for spring and early summer 2011 surveys:
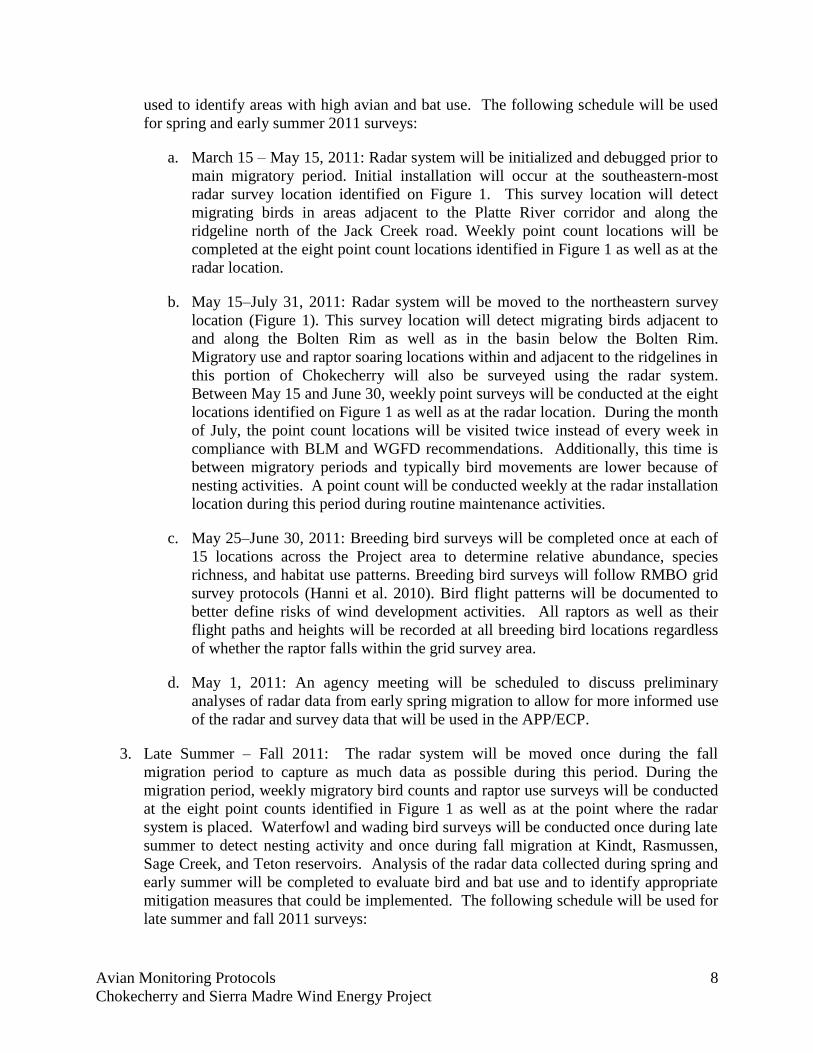
a. March 15 – May 15, 2011: Radar system will be initialized and debugged prior to
main migratory period. Initial installation will occur at the southeastern-most
radar survey location identified on Figure 1. This survey location will detect
migrating birds in areas adjacent to the Platte River corridor and along the
ridgeline north of the Jack Creek road. Weekly point count locations will be
completed at the eight point count locations identified in Figure 1 as well as at the
radar location.
b. May 15–July 31, 2011: Radar system will be moved to the northeastern survey
location (Figure 1). This survey location will detect migrating birds adjacent to
and along the Bolten Rim as well as in the basin below the Bolten Rim.
Migratory use and raptor soaring locations within and adjacent to the ridgelines in
this portion of Chokecherry will also be surveyed using the radar system.
Between May 15 and June 30, weekly point surveys will be conducted at the eight
locations identified on Figure 1 as well as at the radar location. During the month
of July, the point count locations will be visited twice instead of every week in
compliance with BLM and WGFD recommendations. Additionally, this time is
between migratory periods and typically bird movements are lower because of
nesting activities. A point count will be conducted weekly at the radar installation
location during this period during routine maintenance activities.
c. May 25–June 30, 2011: Breeding bird surveys will be completed once at each of
15 locations across the Project area to determine relative abundance, species
richness, and habitat use patterns. Breeding bird surveys will follow RMBO grid
survey protocols (Hanni et al. 2010). Bird flight patterns will be documented to
better define risks of wind development activities. All raptors as well as their
flight paths and heights will be recorded at all breeding bird locations regardless
of whether the raptor falls within the grid survey area.
d. May 1, 2011: An agency meeting will be scheduled to discuss preliminary
analyses of radar data from early spring migration to allow for more informed use
of the radar and survey data that will be used in the APP/ECP.
3. Late Summer – Fall 2011: The radar system will be moved once during the fall
migration period to capture as much data as possible during this period. During the
migration period, weekly migratory bird counts and raptor use surveys will be conducted
at the eight point counts identified in Figure 1 as well as at the point where the radar
system is placed. Waterfowl and wading bird surveys will be conducted once during late
summer to detect nesting activity and once during fall migration at Kindt, Rasmussen,
Sage Creek, and Teton reservoirs. Analysis of the radar data collected during spring and
early summer will be completed to evaluate bird and bat use and to identify appropriate
mitigation measures that could be implemented. The following schedule will be used for
late summer and fall 2011 surveys:
Avian Monitoring Protocols 9
Chokecherry and Sierra Madre Wind Energy Project
a. August 1: A revised APP/ECP will be delivered to the agencies for review and
approval. The revised APPECP will contain the mitigation measures that will be
applied to remove or minimize risks to avian species. The revised APP/ECP will
also identify the adaptive management process that will be followed to update the
APP/ECP and apply additional site-specific mitigation measures as additional
data are obtained prior to, during and after construction. An interim report of
radar data trends and observations will also be provided with the revised
APP/ECP.
b. August 1– September 30, 2011: Radar system will be installed at the western
radar location in the Chokecherry project area radar survey location identified on
Figure 1. This survey location will detect migrating birds in the western portion
of Chokecherry as well as along the rim of Chokecherry and the basin between
Chokecherry and Atlantic Rim. During the month of August, the point count
locations will be visited twice instead of every week. A point count will be
conducted weekly at the radar installation location during August as part of
routine maintenance activities. During September, weekly point count locations
will be completed at the eight point count locations identified in Figure 1 as well
as at the radar location.
c. October 1–November 15, 2011: Radar system will be moved to a location along
the rim of Miller Hill in the southwestern portion of the project area (Figure 1).
This survey location will detect birds in the Miller Hill area and below the Miller
Hill rim in the Sage Creek Basin. Weekly point count surveys will be conducted
at the eight locations identified on Figure 1 as well as at the radar location.
4. Winter 2011/2012 (November 16, 2011–March 30, 2012) – A final APP/ECP will be
delivered to the agencies for review. The final APP/ECP will identify the avoidance,
minimization, and mitigation measures to reduce threats to eagles and other avian
species. The radar system will be deployed in a suitable location to ensure weekly
maintenance is possible during winter months. Weekly bird observations will be recorded
during routine maintenance activities at the radar location. Weather permitting, monthly
counts will be conducted at the point count locations in Figure 1.
5. Spring 2012 – PCW and the agencies will initiate the adaptive management process
identified and approved in the final APP to incorporate site-specific mitigation and
avoidance measures into final project designs and the Final Environmental Impact
Statement and Record of Decision. A final report documenting the results of the radar
and point count efforts will be provided at least two weeks prior to the initiation of the
adaptive management process to ensure adequate review time prior to discussions.

Avian Monitoring Protocols 10
Chokecherry and Sierra Madre Wind Energy Project
LITERATURE CITED
Detmers, R., D.A. Buehler, J.G. Bartlett, and N.A. Klaus. 1999. Influence of point count length
and repeated visits on habitat model performance. Journal of Wildlife Management 63:815-823.
Gerrodette, T. 1987. A power analysis for detecting trends. Ecology 68:1364–1372.
Hester, S.G. and M.B. Grenier. 2005. A conservation plan for bats in Wyoming. Wyoming Game
and Fish Department, Nongame Program, Lander, WY.
Johnson, G., T. Rintz, M.D. Strickland, and K. Bay. 2008. Baseline avian use studies for the
Chokecherry and Sierra Madre Wind Resource Areas, Carbon County, Wyoming: final summer
and fall interim report, June 26-October 14, 2008. Submitted to ENSR, Golden, CO by Western
Ecosystems Technology, Inc., Cheyenne, Wyoming.
Reynolds, R.T., J.M. Scott, and R.A. Nussbaum. 1980. A Variable Circular-Plot Method for
Estimating Bird Numbers. Condor 82:309-313.
Solick, D., Johnson, G., T. Rintz, and M.D. Strickland. 2008. Bat surveys for the Chokecherry
and Sierra Madre Wind Resource Areas, Carbon County, Wyoming. Submitted to ENSR,
Golden, CO by Western Ecosystems Technology, Inc., Cheyenne, Wyoming.
U.S. Fish and Wildlife Service [USFWS]. 2010. Recommendations on developing effective
measures to mitigate impacts to wildlife and their habitats related to land-based wind energy
facilities. Submitted to the Secretary of the Interior by the Wind Turbine Guidelines Advisory
Committee.
USFWS. 2011a. Draft Land-Based Wind Energy Guidelines, Recommendations on measures to
avoid, minimize, and compensate for effects to fish, wildlife, and their habitats
USFWS. 2011b. Draft eagle conservation plan guidance. January 2011.
Wyoming Game and Fish Department [WGFD]. 2010. Wildlife protection recommendations for
wind development in Wyoming. Commission approved version (4-23-2010). 70pp.

2012 – 2013 800-meter Raptor Survey Protocols
Chokecherry and Sierra Madre Wind Energy Project
Prepared for:
Power Company of Wyoming, LLC
555 17th Street, Suite 2400
Denver, CO 80202
Prepared by:
SWCA Environmental Consultants
295 Interlocken Blvd., Suite 300
Broomfield, CO 80021
(303) 487-1183 / Fax (303) 487-1245
August 31, 2012
1 SWCA
Introduction
The Power Company of Wyoming LLC (PCW) recently initiated revisions to the
methodologies currently used to survey for raptors at the Chokecherry and Sierra Madre Wind
Energy Project (Project). Based on conversations with U.S. Fish and Wildlife Service
(Service) personnel, and in an effort to collect data that are appropriate for use in the Service’s
model that predicts the potential fatality rate of eagles for wind energy projects (hereafter, the
Service’s model), raptor survey protocols were revised for the fall 2012 season and for future
raptor survey efforts. These survey methodology revisions are fully compliant with the
recommendations for raptor surveys set forth by the Service in their Draft Eagle Conservation
Plan Guidance (Draft ECP Guidance), the Eagle Conservation Plan Guidance Module 1 –
Land-based Wind Energy Technical Appendices (Technical Appendices; as received from
Kevin Kritz, Service Region 6, on August 4, 2012), and the Land-Based Wind Energy
Guidelines, while still maintaining expansive coverage of the Project site.
Year Two and Year Three 4,000-meter-radius long-watch raptor surveys were fully compliant
with the recommendations set forth by the Service’s Draft ECP Guidance (Service 2011) and
Land-Based Wind Energy Guidelines (Service 2012a), the Bureau of Land Management’s
(BLM’s) Wildlife Survey Protocols for Wind Energy Development (BLM 2008), and the
Wyoming Game and Fish Department’s (WGFD’s) Wildlife Protection Recommendations for
Wind Energy Development (WGFD 2010). These surveys were successful in identifying
concentrated raptor use areas across the Project that could be used to design avoidance areas
in order to minimize avian impacts. Additionally, 4,000-meter data were instructive in
showing the Project site is not a strong migratory corridor for raptors, and the flight paths
digitized from these data were used to identify high eagle-use areas as recommended by the
Service’s Technical Appendices (Service 2012b).
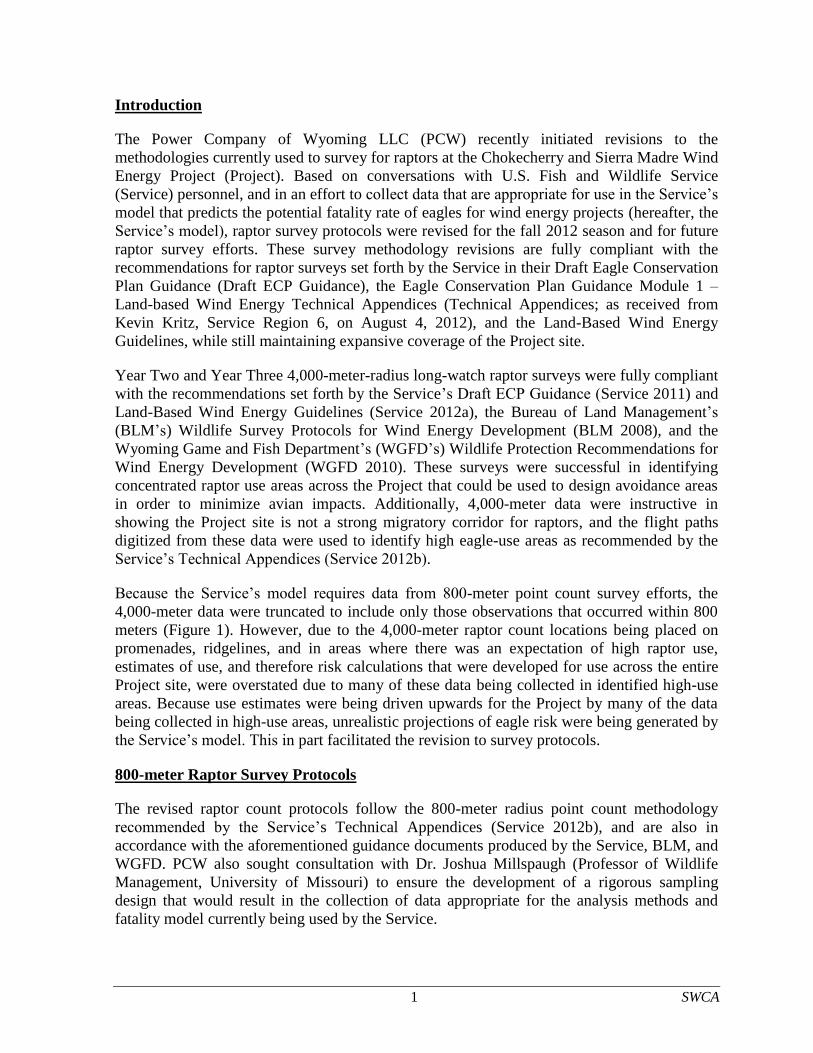
Because the Service’s model requires data from 800-meter point count survey efforts, the
4,000-meter data were truncated to include only those observations that occurred within 800
meters (Figure 1). However, due to the 4,000-meter raptor count locations being placed on
promenades, ridgelines, and in areas where there was an expectation of high raptor use,
estimates of use, and therefore risk calculations that were developed for use across the entire
Project site, were overstated due to many of these data being collected in identified high-use
areas. Because use estimates were being driven upwards for the Project by many of the data
being collected in high-use areas, unrealistic projections of eagle risk were being generated by
the Service’s model. This in part facilitated the revision to survey protocols.
800-meter Raptor Survey Protocols
The revised raptor count protocols follow the 800-meter radius point count methodology
recommended by the Service’s Technical Appendices (Service 2012b), and are also in
accordance with the aforementioned guidance documents produced by the Service, BLM, and
WGFD. PCW also sought consultation with Dr. Joshua Millspaugh (Professor of Wildlife
Management, University of Missouri) to ensure the development of a rigorous sampling
design that would result in the collection of data appropriate for the analysis methods and
fatality model currently being used by the Service.
2 SWCA
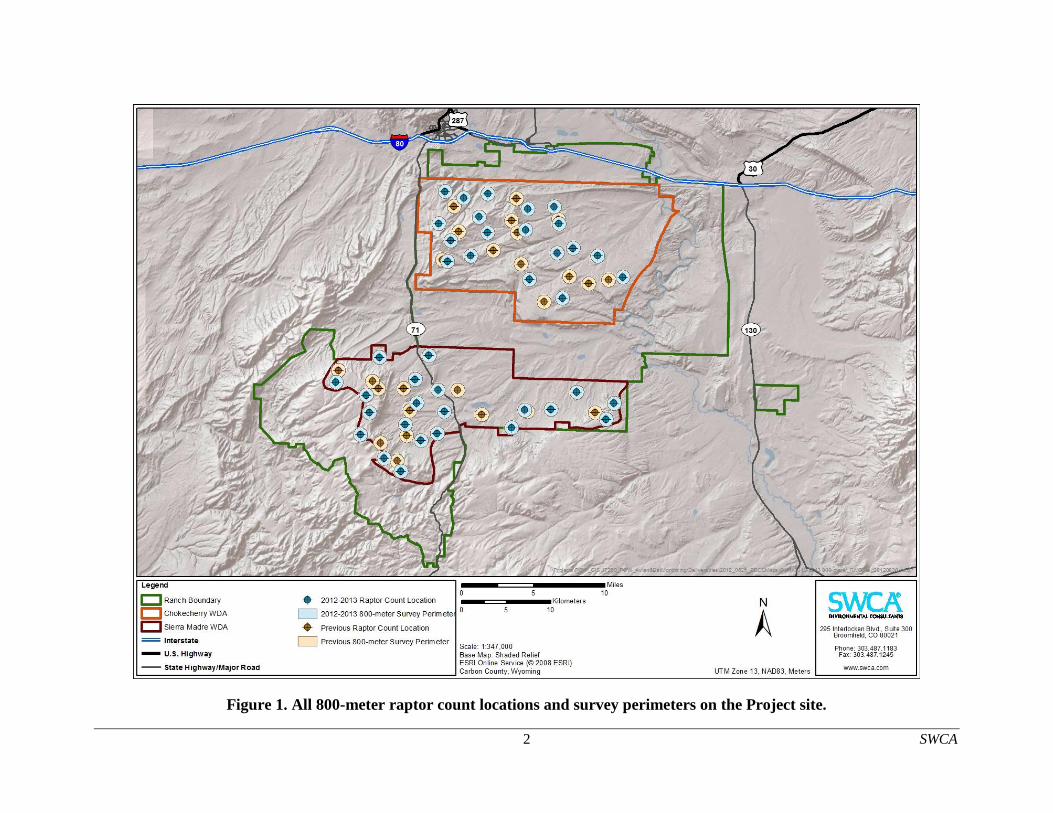
Figure 1. All 800-meter raptor count locations and survey perimeters on the Project site.
3 SWCA
Based upon agency guidance and logistical considerations, the revised protocols were
designed to include 40, 800-meter raptor count locations throughout areas of the Project site
where turbine development was likely (Figure 1). Locations were selected using a spatially
balanced random selection process with the number of 800-meter raptor count locations per
area determined by the relative turbine density in the different areas of the Project. Raptor
count locations were selected such that no overlap occurs between survey locations or with
the avoidance areas that PCW has committed to as part of the Project Eagle Conservation Plan
(ECP). Once the initial 800-meter raptor count locations were selected, some minimal
micrositing of the locations was conducted to ensure full visibility of the survey areas and safe
and consistent accessibility on the part of field personnel. Coordinates for each of the final
800-meter raptor survey locations are listed in Table 1. Landmarks and lathe stakes were
located within each survey location perimeter to provide distance references for field
personnel completing survey efforts. When the 800-meter radius survey areas of the new 40
point count locations are combined with the 800-meter radius survey areas of the Year Two
and Year Three sites, 34.7% of the probable development areas are covered by raptor count
surveys, which is greater than the 30% recommendation made by the Service (Service 2012b).
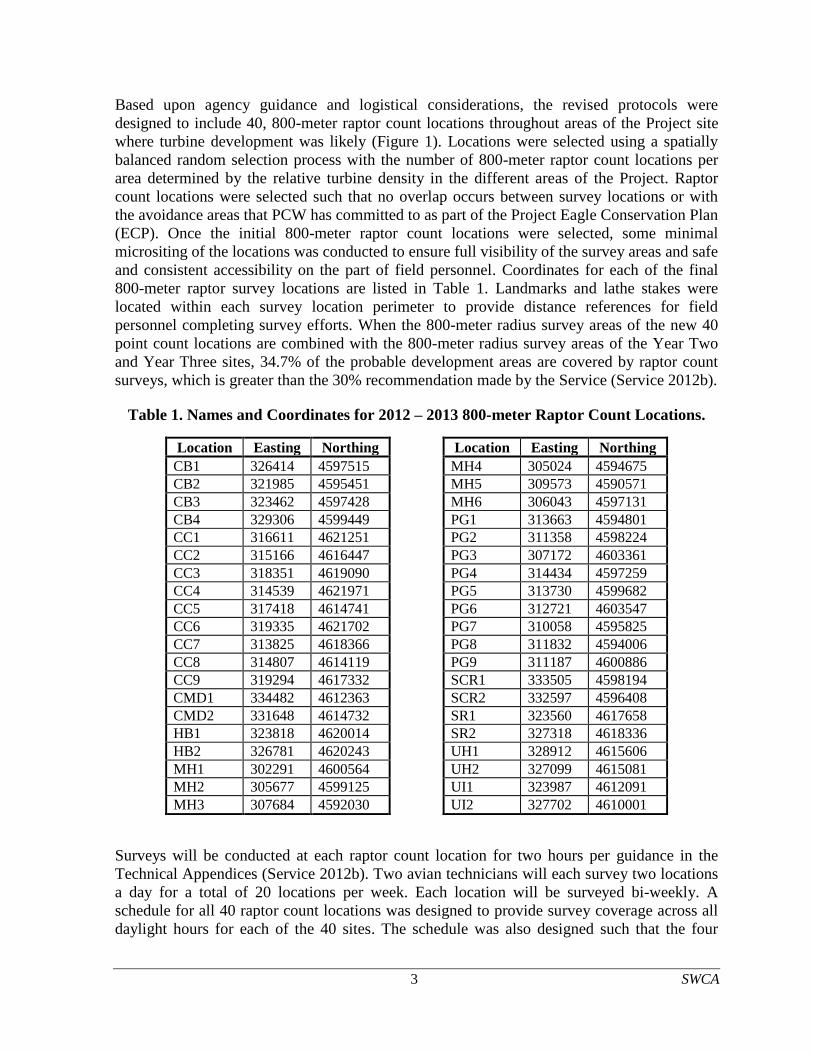
Table 1. Names and Coordinates for 2012 – 2013 800-meter Raptor Count Locations.
Location Easting Northing Location Easting Northing
CB1 326414 4597515 MH4 305024 4594675
CB2 321985 4595451 MH5 309573 4590571
CB3 323462 4597428 MH6 306043 4597131
CB4 329306 4599449 PG1 313663 4594801
CC1 316611 4621251 PG2 311358 4598224
CC2 315166 4616447 PG3 307172 4603361
CC3 318351 4619090 PG4 314434 4597259
CC4 314539 4621971 PG5 313730 4599682
CC5 317418 4614741 PG6 312721 4603547
CC6 319335 4621702 PG7 310058 4595825
CC7 313825 4618366 PG8 311832 4594006
CC8 314807 4614119 PG9 311187 4600886
CC9 319294 4617332 SCR1 333505 4598194
CMD1 334482 4612363 SCR2 332597 4596408
CMD2 331648 4614732 SR1 323560 4617658
HB1 323818 4620014 SR2 327318 4618336
HB2 326781 4620243 UH1 328912 4615606
MH1 302291 4600564 UH2 327099 4615081
MH2 305677 4599125 UI1 323987 4612091
MH3 307684 4592030 UI2 327702 4610001
Surveys will be conducted at each raptor count location for two hours per guidance in the
Technical Appendices (Service 2012b). Two avian technicians will each survey two locations
a day for a total of 20 locations per week. Each location will be surveyed bi-weekly. A
schedule for all 40 raptor count locations was designed to provide survey coverage across all
daylight hours for each of the 40 sites. The schedule was also designed such that the four
4 SWCA
raptor count surveys conducted on any given day are separated temporally and spatially to
provide independence of any observations that are made.
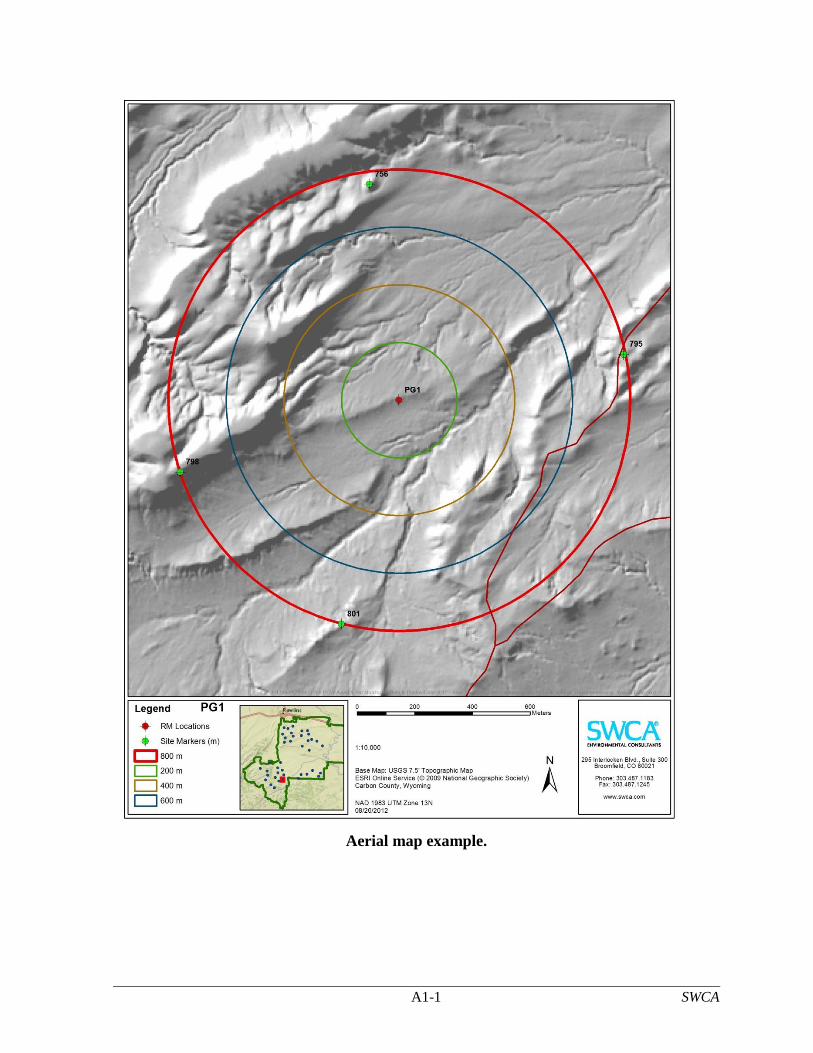
Avian technicians are equipped with binoculars, spotting scopes, laser rangefinders, and aerial
maps to assist with accurate detection and documentation of all raptors observed within the
800-meter survey area. Each aerial map is displayed with relevant landforms occurring in the
area, locations of lathe stakes, and concentric rings at each 200-meter interval to facilitate
accurate distance estimation (Attachment 1). Each raptor flight path is recorded by technicians
on the provided aerial maps. Additional data collected include species, number of individuals
per observation, age, sex, behavior, bearing to bird, distance to bird, heading of bird, altitude
of bird, the beginning and ending time for each observation, and hourly weather data
(Attachment 2).
At present, the 800-meter raptor counts are scheduled to continue bi-weekly at each location
through the fall migration period (November 15). Surveys are tentatively slated to occur once
per month at each location during the winter season (December 2012 through March 2013)
due to accessibility and safety concerns. The end of winter surveys in March 2013 will
complete three full years of data collection for the Project. Consultations are ongoing with
Service personnel to determine the scope of potential survey efforts beyond March 2013.
References
Bureau of Land Management (BLM). 2008. Wildlife Survey Protocols for Wind Energy
Development.
U.S. Fish and Wildlife Service (Service). 2011. Draft Eagle Conservation Plan Guidance.
Available online at http://www.fws.gov/windenergy/. Accessed December 2011.
———. 2012a. Land Based Wind Energy Guidelines. Wind Turbine Guidelines Advisory
Committee. U.S. Fish and Wildlife Service, Department of the Interior, Washington D.C.
Available online at http://www.fws.gov/windenergy/docs/WEG_final.pdf. Accessed
August 2012.
———. 2012b. Eagle Conservation Plan Guidance Module 1 – Land-based Wind Energy
Technical Appendices. Received from Kevin Kritz, Service Region 6, on August 4, 2012.
Wyoming Game and Fish Department (WGFD). 2010. Wildlife Protection Recommendations
for Wind Energy Development in Wyoming. Wyoming Game and Fish Commission
Approved November 17, 2010. Wyoming Game and Fish Department, Cheyenne, WY.

SWCA
ATTACHMENT 1
Example Aerial Map Used to Map Flight Paths during 800-meter Raptor
Count Surveys
A1-1 SWCA
Aerial map example.

SWCA
ATTACHMENT 2
Data Sheets Used to Collect Data during 800-meter Raptor Count Surveys

A2-1 SWCA
PCW 2011 Raptor Survey
Field Observer:
Survey Location:
Start time:
End time:
Date:
Page: ____ of _____
Target
# Obs
# Species
# Birds
Age Sex Behav Bearing
to Bird (°) Distance
to Bird (m) Angle of Bird (°)
Heading of Bird
0- 30
30-150
150+ Time Begin
Time End

A2-2 SWCA
PCW 2011 Raptor Survey Notes
Field Observer:
Survey Pt:
Date:
Page: _____ of _____
Other species and Notes:
Weather Conditions
Wind
Time Sky Dir Spd Temp (°F)
Incidental Species Observations

Revised 2012-2013 800-meter Raptor Survey Protocols
Chokecherry and Sierra Madre Wind Energy Project
Prepared for:
Power Company of Wyoming, LLC
555 17th Street, Suite 2400
Denver, CO 80202
Prepared by:
SWCA Environmental Consultants
295 Interlocken Blvd., Suite 300
Broomfield, CO 80021
(303) 487-1183 / Fax (303) 487-1245
November 2012
1 SWCA
The Power Company of Wyoming (PCW) recently initiated revisions to the methodologies
currently used to survey for raptors at their Chokecherry and Sierra Madre Wind Energy
Project (Project). Based on conversations with U.S. Fish and Wildlife Service (Service)
personnel, and in an effort to collect data that are appropriate for use in the Service’s model
that predicts the potential fatality rate of eagles for wind energy projects (hereafter, the
Service’s model), raptor survey protocols were revised for the fall 2012 season and for future
raptor survey efforts. On August 31, 2012, PCW provided the Service with a revised protocol
for conducting eagle and raptor surveys at 40 800-meter point count survey sites throughout
the Project. PCW began surveying the 40 locations at the beginning of the autumn 2012
survey season and it is anticipated that those survey efforts will continue through October
2012 at which time the revised protocols discussed in this document will be initiated. On
September 28, 2012, the Service issued a letter recommending slight modifications to the
August 31, 2012 protocols. This revised protocol addresses the comments made by the
Service and specific responses to each comment made are provided in Attachment 1.
These survey methodology revisions are fully consistent with the recommendations for raptor
surveys set forth by the Service in their Draft Eagle Conservation Plan Guidance (Draft ECP
Guidance), the Eagle Conservation Plan Guidance Module 1 – Land-based Wind Energy
Technical Appendices (Technical Appendices; as received from Kevin Kritz, Service Region
6, on August 4, 2012), and the Land-Based Wind Energy Guidelines, while still maintaining
expansive coverage of the Project Site.
Year Two and Year Three long-watch raptor surveys were fully consistent with the
recommendations set forth by the Service’s Draft ECP Guidance (Service 2011) and Land-
Based Wind Energy Guidelines (Service 2012a), the Bureau of Land Management’s (BLM’s)
Wildlife Survey Protocols for Wind Energy Development (BLM 2008), and the Wyoming
Game and Fish Department’s (WGFD’s) Wildlife Protection Recommendations for Wind
Energy Development (WGFD 2010). These surveys were very successful in identifying
concentrated raptor use areas across the Project that could be used to design avoidance areas
to minimize avian impacts. Additionally, long-watch survey data were instructive in showing
the Project Site is not a strong migratory corridor for raptors, and the flight paths digitized
from these data were used to identify high eagle use areas as recommended by the Service’s
Technical Appendices (Service 2012b).
The revised raptor count protocols follow the 800-meter radius point count methodology
recommended by the Service’s Technical Appendices (Service 2012b), and are also in
accordance with the aforementioned guidance documents produced by the Service, BLM, and
WGFD. PCW also sought consultation with Dr. Joshua Millspaugh (Professor of Wildlife
Management, University of Missouri) to ensure the development of a rigorous sampling
design that would result in the collection of data appropriate for the analysis methods and
fatality model currently being used by the Service.
Based upon agency guidance and logistical considerations, the revised protocols were
designed to include 60, 800-meter raptor count survey sites throughout the Chokecherry and
Sierra Madre Wind Development Areas (WDAs) where turbine development is likely
(Figures 1 and 2). Most of the 60 survey sites are identical to the original 40 sites identified in
the August 31, 2012 protocols. However, some of those 40 sites were shifted slightly to
2 SWCA
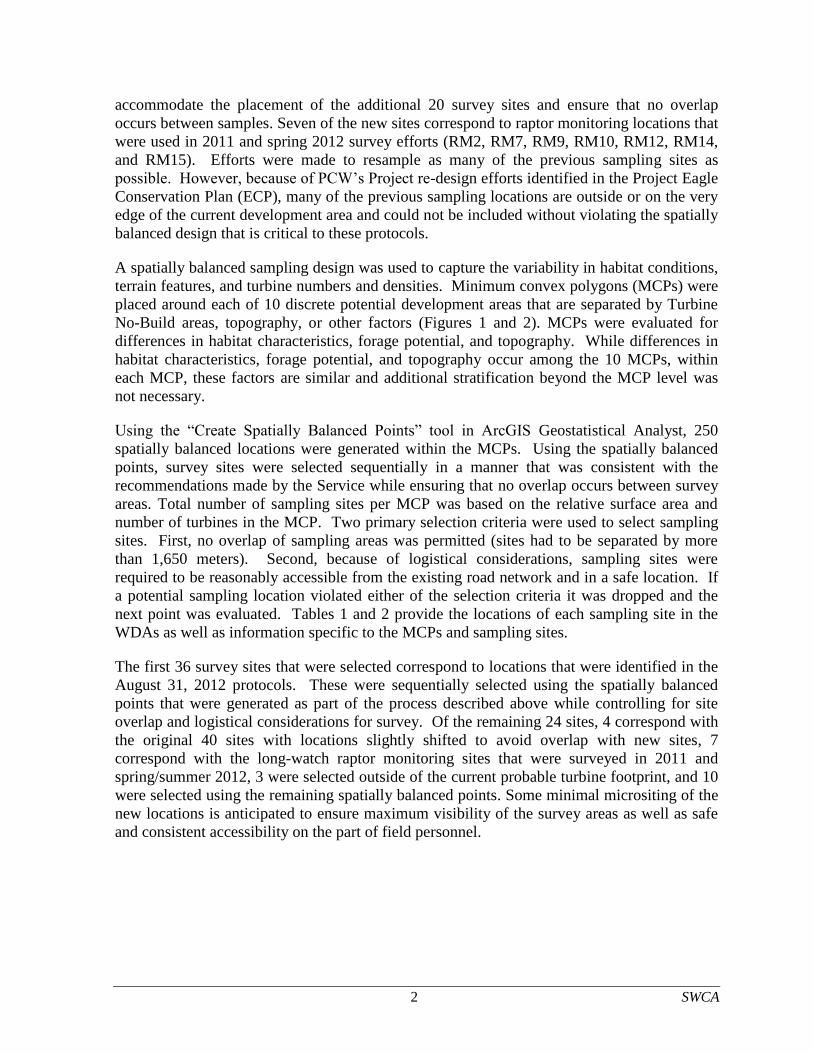
accommodate the placement of the additional 20 survey sites and ensure that no overlap
occurs between samples. Seven of the new sites correspond to raptor monitoring locations that
were used in 2011 and spring 2012 survey efforts (RM2, RM7, RM9, RM10, RM12, RM14,
and RM15). Efforts were made to resample as many of the previous sampling sites as
possible. However, because of PCW’s Project re-design efforts identified in the Project Eagle
Conservation Plan (ECP), many of the previous sampling locations are outside or on the very
edge of the current development area and could not be included without violating the spatially
balanced design that is critical to these protocols.
A spatially balanced sampling design was used to capture the variability in habitat conditions,
terrain features, and turbine numbers and densities. Minimum convex polygons (MCPs) were
placed around each of 10 discrete potential development areas that are separated by Turbine
No-Build areas, topography, or other factors (Figures 1 and 2). MCPs were evaluated for
differences in habitat characteristics, forage potential, and topography. While differences in
habitat characteristics, forage potential, and topography occur among the 10 MCPs, within
each MCP, these factors are similar and additional stratification beyond the MCP level was
not necessary.
Using the “Create Spatially Balanced Points” tool in ArcGIS Geostatistical Analyst, 250
spatially balanced locations were generated within the MCPs. Using the spatially balanced
points, survey sites were selected sequentially in a manner that was consistent with the
recommendations made by the Service while ensuring that no overlap occurs between survey
areas. Total number of sampling sites per MCP was based on the relative surface area and
number of turbines in the MCP. Two primary selection criteria were used to select sampling
sites. First, no overlap of sampling areas was permitted (sites had to be separated by more
than 1,650 meters). Second, because of logistical considerations, sampling sites were
required to be reasonably accessible from the existing road network and in a safe location. If
a potential sampling location violated either of the selection criteria it was dropped and the
next point was evaluated. Tables 1 and 2 provide the locations of each sampling site in the
WDAs as well as information specific to the MCPs and sampling sites.
The first 36 survey sites that were selected correspond to locations that were identified in the
August 31, 2012 protocols. These were sequentially selected using the spatially balanced
points that were generated as part of the process described above while controlling for site
overlap and logistical considerations for survey. Of the remaining 24 sites, 4 correspond with
the original 40 sites with locations slightly shifted to avoid overlap with new sites, 7
correspond with the long-watch raptor monitoring sites that were surveyed in 2011 and
spring/summer 2012, 3 were selected outside of the current probable turbine footprint, and 10
were selected using the remaining spatially balanced points. Some minimal micrositing of the
new locations is anticipated to ensure maximum visibility of the survey areas as well as safe
and consistent accessibility on the part of field personnel.
3 SWCA
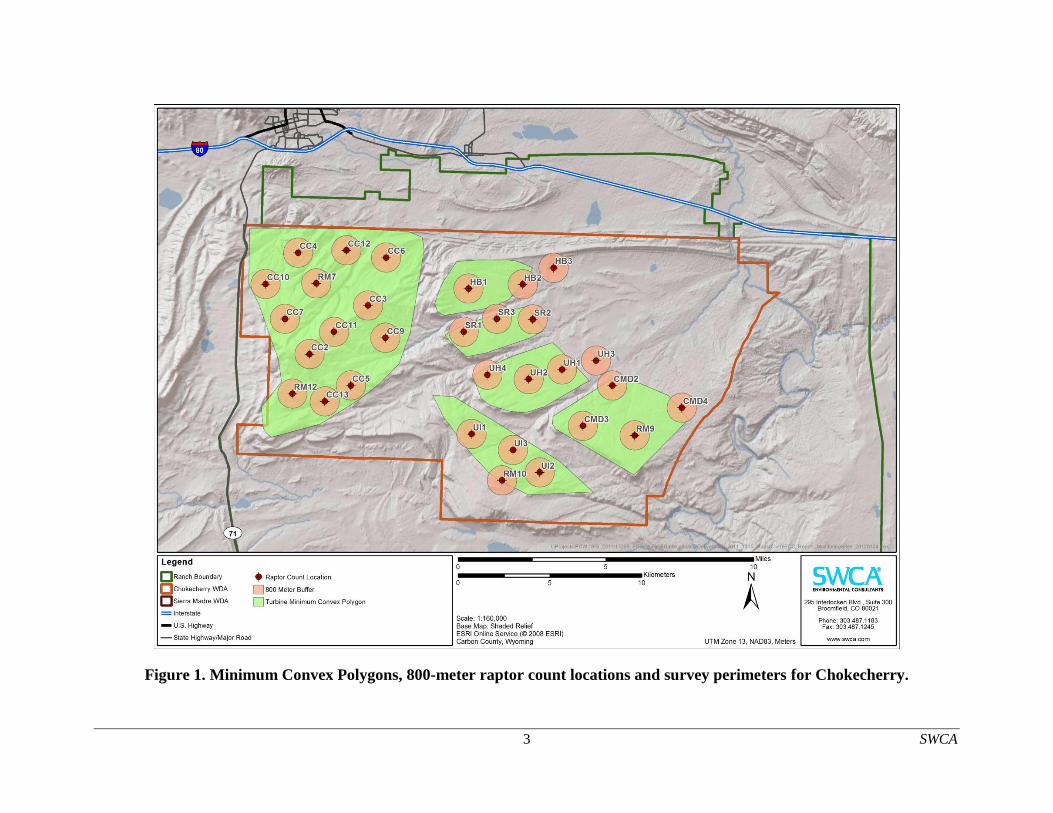
Figure 1. Minimum Convex Polygons, 800-meter raptor count locations and survey perimeters for Chokecherry.
4 SWCA
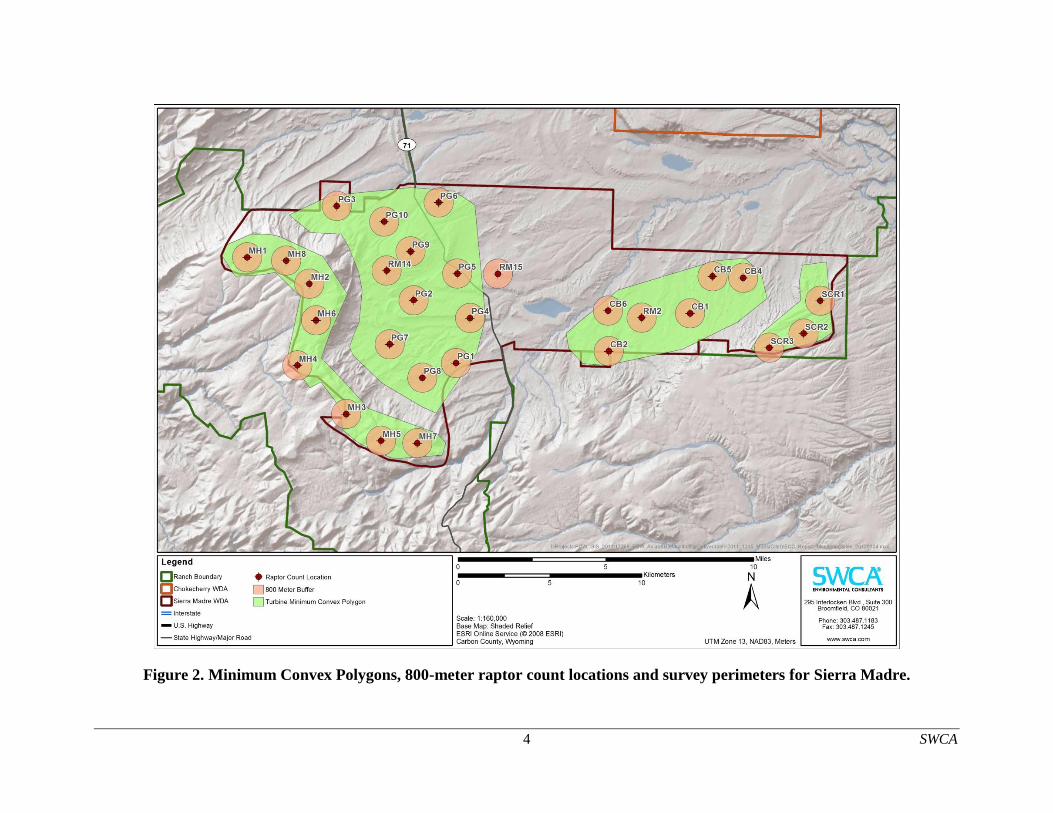
Figure 2. Minimum Convex Polygons, 800-meter raptor count locations and survey perimeters for Sierra Madre.
5 SWCA
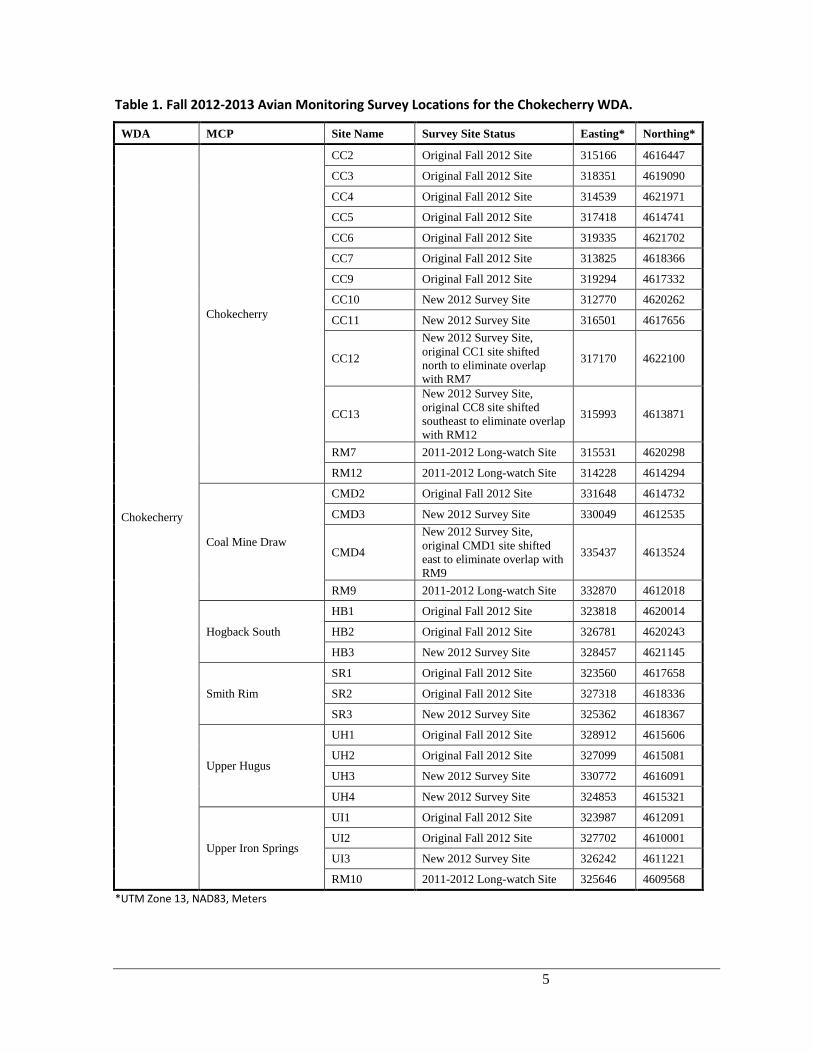
Table 1. Fall 2012-2013 Avian Monitoring Survey Locations for the Chokecherry WDA.
WDA MCP Site Name Survey Site Status Easting* Northing*
Chokecherry
Chokecherry
CC2 Original Fall 2012 Site 315166 4616447
CC3 Original Fall 2012 Site 318351 4619090
CC4 Original Fall 2012 Site 314539 4621971
CC5 Original Fall 2012 Site 317418 4614741
CC6 Original Fall 2012 Site 319335 4621702
CC7 Original Fall 2012 Site 313825 4618366
CC9 Original Fall 2012 Site 319294 4617332
CC10 New 2012 Survey Site 312770 4620262
CC11 New 2012 Survey Site 316501 4617656
CC12
New 2012 Survey Site,
original CC1 site shifted
north to eliminate overlap
with RM7
317170 4622100
CC13
New 2012 Survey Site,
original CC8 site shifted
southeast to eliminate overlap
with RM12
315993 4613871
RM7 2011-2012 Long-watch Site 315531 4620298
RM12 2011-2012 Long-watch Site 314228 4614294
Coal Mine Draw
CMD2 Original Fall 2012 Site 331648 4614732
CMD3 New 2012 Survey Site 330049 4612535
CMD4
New 2012 Survey Site,
original CMD1 site shifted
east to eliminate overlap with
RM9
335437 4613524
RM9 2011-2012 Long-watch Site 332870 4612018
Hogback South
HB1 Original Fall 2012 Site 323818 4620014
HB2 Original Fall 2012 Site 326781 4620243
HB3 New 2012 Survey Site 328457 4621145
Smith Rim
SR1 Original Fall 2012 Site 323560 4617658
SR2 Original Fall 2012 Site 327318 4618336
SR3 New 2012 Survey Site 325362 4618367
Upper Hugus
UH1 Original Fall 2012 Site 328912 4615606
UH2 Original Fall 2012 Site 327099 4615081
UH3 New 2012 Survey Site 330772 4616091
UH4 New 2012 Survey Site 324853 4615321
Upper Iron Springs
UI1 Original Fall 2012 Site 323987 4612091
UI2 Original Fall 2012 Site 327702 4610001
UI3 New 2012 Survey Site 326242 4611221
RM10 2011-2012 Long-watch Site 325646 4609568
*UTM Zone 13, NAD83, Meters
6 SWCA
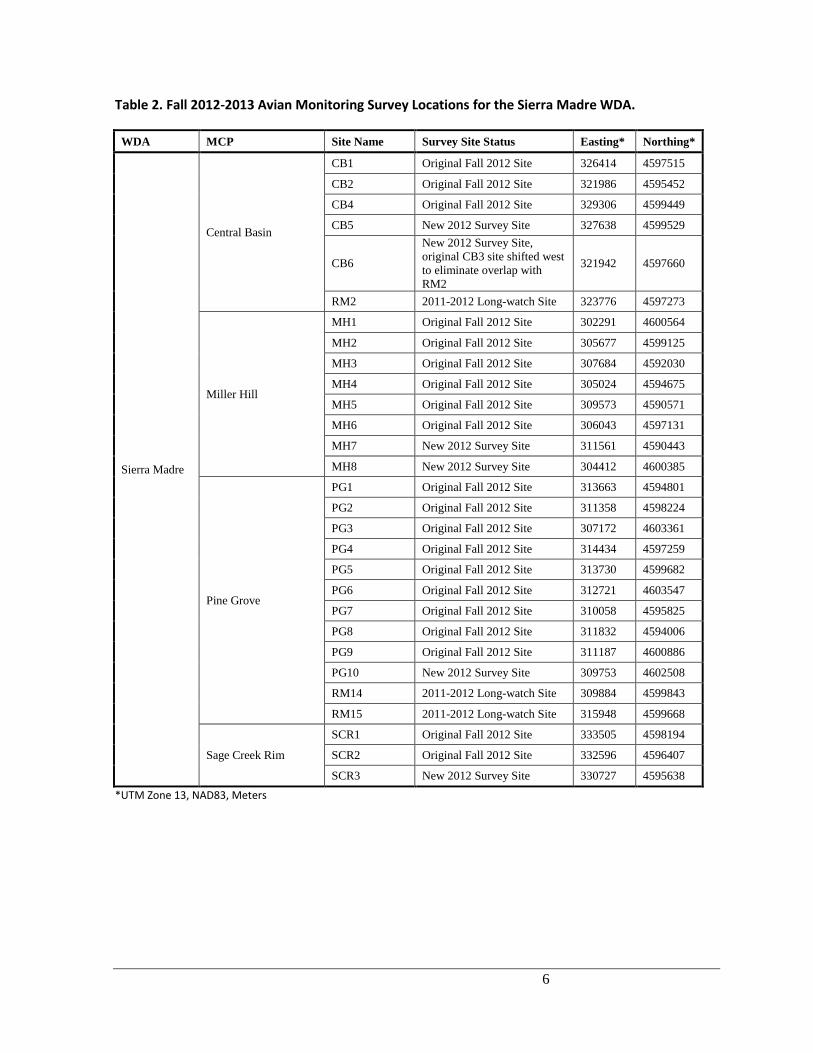
Table 2. Fall 2012-2013 Avian Monitoring Survey Locations for the Sierra Madre WDA.
WDA MCP Site Name Survey Site Status Easting* Northing*
Sierra Madre
Central Basin
CB1 Original Fall 2012 Site 326414 4597515
CB2 Original Fall 2012 Site 321986 4595452
CB4 Original Fall 2012 Site 329306 4599449
CB5 New 2012 Survey Site 327638 4599529
CB6
New 2012 Survey Site,
original CB3 site shifted west
to eliminate overlap with
RM2
321942 4597660
RM2 2011-2012 Long-watch Site 323776 4597273
Miller Hill
MH1 Original Fall 2012 Site 302291 4600564
MH2 Original Fall 2012 Site 305677 4599125
MH3 Original Fall 2012 Site 307684 4592030
MH4 Original Fall 2012 Site 305024 4594675
MH5 Original Fall 2012 Site 309573 4590571
MH6 Original Fall 2012 Site 306043 4597131
MH7 New 2012 Survey Site 311561 4590443
MH8 New 2012 Survey Site 304412 4600385
Pine Grove
PG1 Original Fall 2012 Site 313663 4594801
PG2 Original Fall 2012 Site 311358 4598224
PG3 Original Fall 2012 Site 307172 4603361
PG4 Original Fall 2012 Site 314434 4597259
PG5 Original Fall 2012 Site 313730 4599682
PG6 Original Fall 2012 Site 312721 4603547
PG7 Original Fall 2012 Site 310058 4595825
PG8 Original Fall 2012 Site 311832 4594006
PG9 Original Fall 2012 Site 311187 4600886
PG10 New 2012 Survey Site 309753 4602508
RM14 2011-2012 Long-watch Site 309884 4599843
RM15 2011-2012 Long-watch Site 315948 4599668
Sage Creek Rim
SCR1 Original Fall 2012 Site 333505 4598194
SCR2 Original Fall 2012 Site 332596 4596407
SCR3 New 2012 Survey Site 330727 4595638
*UTM Zone 13, NAD83, Meters
7 SWCA
Landmarks will be identified and visible stakes will be placed around each survey location
perimeter to provide distance references for field personnel completing survey efforts. The
800-meter radius survey areas of the new 60 point count locations provide coverage for
approximately 35% of the probable turbine locations, which is greater than the 30%
recommendation made by the Service (Service 2012b). Additionally, 46.7% of the raptor
monitoring sites that were surveyed in 2011 will be resurveyed as part of the 60 point counts.
Resurvey of 50% of all previous survey sites was not possible because many fall outside of
the current project layout in Turbine No-Build areas and use of those sites would violate the
spatially balanced study design in addition to sampling areas that are already known as high
use areas for eagles and other raptors. Additionally, several sites that were only surveyed in
spring/summer 2012 do not have a full year of data and would not be appropriate for
comparison with ongoing and future data collection efforts. However, many of the 60 new
survey sites overlap with areas previously surveyed as part of 2011 and 2012 raptor
monitoring efforts. When these areas are included, 50.3% of the area surveyed as part of
previous raptor monitoring efforts is within the perimeter of the 60 new point count survey
sites.
Surveys will be conducted at each site for one hour per guidance in the ECP Technical
Appendices (Service 2012b). Three avian technicians will each survey two locations per day
for a total of 6 locations per day and 60 locations in a 10 day period. Each location will be
surveyed twice per month. A schedule for all 60 raptor count locations was designed to
provide survey coverage across all daylight hours for each of the 60 sites. The schedule was
also designed such that the six raptor count surveys conducted on any given day are separated
temporally and spatially to ensure independence of any observations that are made.
Avian technicians will be equipped with binoculars, spotting scopes, laser rangefinders, and
aerial maps to assist with accurate detection and documentation of all raptors observed within
the 800-meter survey area. Each aerial map is displayed with relevant landforms occurring in
the area, locations of stakes, and concentric rings at each 200-meter interval to facilitate
accurate distance estimation (Attachment 2). Each raptor flight path is recorded by technicians
on the provided aerial maps. Additional data collected include species, number of individuals
per observation, age, sex, behavior, bearing to bird, distance to bird, heading of bird, altitude
of bird, the beginning and ending time for each observation, interactions with other birds, and
hourly weather data among other variables (Attachment 3).
Surveys at the 60 800-meter raptor counts will begin in November 2012 and are scheduled to
continue bi-weekly at each location through August of 2013. Surveys during winter months
will be completed on the same schedule as the remainder of the year and efforts will be made
to survey at least 50% of all locations twice per month during winter. However, winter
surveys are subject to cancellation or delay based on weather conditions and safety of the field
technicians.
8 SWCA
REFERENCES
Bureau of Land Management (BLM). 2008. Wildlife Survey Protocols for Wind Energy
Development.
U.S. Fish and Wildlife Service (Service). 2011. Draft Eagle Conservation Plan Guidance.
Available online at http://www.fws.gov/windenergy/. Accessed December 2011.
———. 2012a. Land Based Wind Energy Guidelines. Wind Turbine Guidelines Advisory
Committee. U.S. Fish and Wildlife Service, Department of the Interior, Washington D.C.
Available online at http://www.fws.gov/windenergy/docs/WEG_final.pdf. Accessed
August 2012.
———. 2012b. Eagle Conservation Plan Guidance Module 1 – Land-based Wind Energy
Technical Appendices. Received from Kevin Kritz, Service Region 6, on August 4, 2012.
Wyoming Game and Fish Department (WGFD). 2010. Wildlife Protection Recommendations
for Wind Energy Development in Wyoming. Wyoming Game and Fish Commission
Approved November 17, 2010. Wyoming Game and Fish Department, Cheyenne, WY.

SWCA
ATTACHMENT 1
Response to Survey Recommendations Made in the Service’s
September 28, 2012 Letter

SWCA
The following recommendations were made by the Service in the September 28, 2012 letter to
Garry Miller (PCW) regarding Eagle Use Sampling Considerations and Recommendations for
the proposed Chokecherry-Sierra Madre Wind Energy Development Project. A response is
provided to document how each recommendation has been incorporated into the revised 800-
meter point count survey protocols. Recommendations are presented in italics below.
1. We recommend focusing sampling efforts within the most recently proposed project
footprint in order to quantify eagle use in areas where turbines are planned for
location. By collecting eagle and raptor use data in areas of likely development, we
believe it will be easier to obtain a more reliable estimate of risk to eagles in these
areas, from which more informed, site-specific, predictions can be made.
Response: The revised protocols and placement of the 60 point count sites are based
on the most recent proposed Project footprint and probable turbine locations. The
most recent Project footprint reflects PCW’s commitment to the Turbine No-Build
areas identified in the Project ECP.
2. Although we recommend concentrating sampling effort within the project footprint as
stated above, we believe it also would be prudent to establish additional sample points
outside of the currently proposed footprint in areas of potential development. Adding
points in areas of possible alternative turbine layouts will provide data to assess the
impact of those alternatives, which may be necessary if survey results identify areas of
high eagle use within areas currently proposed for development. Without eagle use
data outside of the proposed footprint, it would be difficult to show that the relocation
of turbines outside of the currently proposed project footprint would avoid and
minimize impacts to eagles. Without these data, the only likely alternatives would be a
reduction in the total number of turbines, or a reduction in the spacing between
turbines in areas where avian and raptors surveys were conducted.
Response: Three of the 60 point count survey sites (RM15, HB3, and UH3) are placed
outside of the most current probable turbine locations. Several additional locations
(e.g., CMD2, HB2, RM10, SR2) have a substantial portion of their survey areas that
fall outside of the current probable turbine locations. Each of these sites provides
survey coverage in areas of the Project Site where turbines could be located if the
current probable turbine location footprint changes.
3. We recommend resampling at least fifty percent of the raptor point counts from
previous years: this will help distinguish between apparent changes in documented
eagle use caused by different point locations and associated differences in
detectability, versus actual changes in habitat use. This is an important consideration,
because the number of eagles and their location on the landscape is likely to vary
across years (e.g., not every nest is active every year), making it difficult to account
for inter-annual variability, which might lead to inaccurate conclusions about the risk
of eagle fatalities. For example, observing fewer eagles at a second set of survey
points could be misinterpreted as an area of lower eagle use, when in fact the number
of eagles and eagle use across the landscape decreased due to other factors. In this

SWCA
example, the use (and hence risk) might have been the same for all survey points, but
sampling different points across years would lead to the erroneous conclusion.
Resampling some points across years can reduce this uncertainty by creating an index
or allow for scaling of observations across years.
Response: Nearly 50% (46.7%) of the raptor monitoring sites that were surveyed in
2011 will be resurveyed as part of the 60 point counts. Resurvey of 50% of previous
survey sites is not possible because many fall outside of the current project layout in
Turbine No-Build areas. Additionally, several sites that were only surveyed in
spring/summer 2012 do not have a full year of data and would not be appropriate for
comparison with ongoing and future data collection efforts. Many of the 60 new
survey sites overlap with areas previously surveyed as part of 2012 raptor monitoring
efforts. When those areas are included, 50.3% of the area surveyed as part of 2012
raptor monitoring efforts is within the perimeter of the 60 new point count survey
sites.
4. Previous long-watch raptor surveys were based on an unlimited radius, and analysis
of data from these surveys suggests that the detectability of eagles dropped off after
600 to 800 meters. We recommend using a distance of no more than 800 meters for
point counts intended to collect data on eagles and other large raptors. This
recommendation is found in our draft Eagle Conservation Plan Guidance (Service
2012, Appendix C, p. 18) and in other literature (e.g., Strickland et al. 2011). While it
is acceptable to collect data on eagles and other raptors beyond 800 meters (e.g.,
location, flight height, flight path)—since they may be useful to identify travel
corridors and areas of eagle use—the collection of this information should not distract
surveyors from collecting data within the 800-meter point count. In addition, because
only those data collected within 800 meters will be used in the models to predict eagle
fatalities, data collected at distances more than 800 meters should be separated from
data collected within 800 meters.
Response: Previous long-watch raptor surveys recorded any eagle observed to help
identify high use areas per the protocols developed collaboratively between the
Service, BLM, and PCW. The analysis of detectability of eagles presented in the
Service’s comments does not consider that the reason eagle use was higher within 800
meters of previously sampled sites is because those sites were placed on ridgelines and
terrain features known to attract or concentrate eagle use, making the likelihood of
observing an eagle within 800 meters of a survey site higher than if the point was
placed randomly in the landscape where varying terrain features may or may not
occur. The implementation of the previous surveys was extremely successful and
resulted in the development of Turbine No-Build areas that will avoid impacts to
eagles and other avian species in the majority of the high use areas that were
identified. To be consistent with with the Service’s Draft ECP Guidance, the
Service’s eagle risk model, and the recommendation made above, all surveys will be
conducted using a distance of 800-meters.
SWCA
5. Based on recommendations in the draft Eagle Conservation Plan Guidance, the
sampling goal should provide a “minimal spatial coverage of at least 30% of the
project footprint” (i.e., the total area sampled in any given year should be thirty
percent of the total project footprint) (Service 2012, Appendix C, p. 1 8). We recognize
that even this level of effort will not provide specific information for seventy percent of
the project area; however, it may be assumed that the information is representative of
the remaining project area, provided the sample points are appropriately located
(e.g., stratified and spatially balanced). To achieve the desired goal of at least 30
percent coverage of the Chokecherry Sierra Madre Proposed Project footprint, we
calculate up to 70 survey points are needed, depending on how the project footprint is
portrayed.
Response: Using the conceptual turbine footprint that PCW provided to the Service,
35% of all turbine locations fall within the 800-meter survey perimeters of the 60
point count sites. As stated above, the entirety of 3 sites and substantial portions of 3
others fall outside of the probable Project footprint in areas where turbines could be
placed. These provide adequate coverage of areas outside of the current probable
turbine footprint. When combined with the 800-meter radius surveyed areas from
previous survey events (2011 and spring/summer 2012), 42% of probable turbine
locations are included within the perimeter of 800-meter point count sites.
6. We recommend sample locations be stratified by features of the landscape that may
influence eagle and raptor activity, such as distinct geographic/topographic elements
(e.g., escarpments), vegetation (if appropriate), and concentrated prey base. Doing so
will allocate sampling points across the project in proportion to their occurrence on
the landscape. A common sampling design in use today is the generalized random
tessellation stratified sampling design (GRTS). We remain concerned that there is
insufficient information about eagle habitat use associated with important eagle use
areas including: active nests; concentrated prey base including grouse leks, prairie
dog colonies, and reservoirs; as well as topographic features such as Miller Hill.
Therefore, we recommend that some sample points be located near these important
eagle use areas. Doing so would help with identifying additional avoidance areas or
alleviating concerns for increased risk associated with these areas.
Response: The spatially balanced design that is discussed in the revised protocols
above is reflective of the variability in habitat conditions, terrain features, and turbine
numbers and densities. The revised protocols describe the methods used to select sites
and the sampling strata and selection criteria that were used to place sites. The 60
sampling sites described in the revised protocols provide coverage in areas that
provide some level of foraging, contain sage-grouse leks, and have variable
topography that could influence eagle and raptor behavior. Site placement near active
eagle nests is difficult because most nests have been avoided and are within the
Turbine No-Build areas along the Bolten Rim or North Platte River corridor and, as
seen in the data previously collected for the Project, active nests locations change each
year.

SWCA
7. Based on recommendations in the Service’s Eagle Conservation Plan Guidance, count
periods should be one to two hours long (Service 2012, Appendix C, p. 18). If longer
survey periods are used (e.g., four to six hours), the surveys should be divided into
smaller units such as one or two hour blocks (or the actual time of eagle observations
recorded), so that the influence of time of day can be evaluated (e.g., in relation to
when turbines are inactive).
Response: Surveys will be conducted at each site for one hour per guidance in the
ECP Technical Appendices (Service 2012b). As stated in the revised protocols, the
survey methods follow the 800-meter radius point count methodology recommended
by the Service’s Technical Appendices to the Draft ECP Guidance, and are consistent
with other guidance documents produced by the Service, BLM, and WGFD.
8. We recommend the protocol include a representative distribution of sampling events
across all daylight hours across all point locations and seasons. Collecting data
“evenly” across time and space should reduce any potential bias associated with
locations, seasons, and time of day. This may also make it possible to evaluate how
time of day influences eagle use of the site or when eagles are more likely to use
specific topographic features. In addition, surveys should include multiple sampling
events in each season per point.
Response: As stated in the revised protocols, the survey methods follow the 800-
meter radius point count methodology recommended by the Service’s Technical
Appendices to the Draft ECP Guidance, and are consistent with other guidance
documents produced by the Service, BLM, and WGFD. The sampling schedule will
provide survey coverage across all daylight hours for each of the 60 sites. The
schedule also makes certain that the six raptor count surveys conducted on any given
day are separated temporally and spatially to ensure independence of any observations
that are made.
9. We recommend locating survey sampling points at least 800 meters (0.5 mile) from
active eagle and ferruginous hawk nests to limit disturbance. It may be possible to
reduce this distance if topographic features create a visual barrier between observers
and the nest.
Response: Should an eagle or ferruginous hawk nest become active within 800 meters
of a survey site, PCW will coordinate with the Service and BLM to evaluate the most
appropriate methods to take to ensure that survey activities do not disrupt nesting.
With PCW’s Turbine No-Build areas and Project re-design efforts, most eagle and
raptor nests in the Project Site have been avoided by 800 meters or more. However,
some survey sites are located within 800 meters of historically active nests. As stated
above, sampling locations have been selected in a spatially balanced, stratified manner
using methods recommended by the Service. Maintaining the sites that are located
within 800 meters of historically active nests is necessary to maintain this spatially
balanced design. Since Project survey efforts began in 2008, no active ferruginous
hawk nests have been identified.

SWCA
10. We recommend data collection include identification of eagle species and their flight
minutes within the 800-meter point count. Additional data collection could include,
but should not necessarily be limited to (in relative order of importance): age and sex
(if possible), flight path, flight behavior (e.g., soaring, kiting), activity (e.g., territory
defense, foraging), interactions with other birds, flight height, obvious prey items, time
observed outside of the 800-meter point count, and time perched. It is acceptable to
record detections beyond 800-meters as these can provide additional information
about eagle and raptor use of the project area. However, collecting data beyond 800-
meters should not detract from observations made within the 800-meter point count.
Response: Only those observations occurring within 800 meters of the survey sites
will be recorded. As described in the protocols and illustrated on the data collection
forms in Attachment 3, data collection efforts will provide all of the information
recommended by the Service.
11. We recommend collecting data on all raptors to the extent feasible; however,
collecting data on other raptors should not preclude the collection of data on eagles.
Response: Data on all raptors and other species of interest will be collected in a
manner identical as that used for eagles unless those efforts interfere with data
collection for eagles.
12. Based on eagle use data collected between April of 2011 and April of 2012, eagle
activity relative to sampling effort appears to be higher in the winter and summer
periods (Table 1). Higher eagle activity in the summer likely corresponds to the time
during which adults are actively feeding young and when young are learning to fly.
Higher eagle activity in the winter may be related to the presence of migrant eagles,
or could be due to the location of survey points. Because data were not collected
following the above recommendations during the summer of 2012, we recommend the
collection of eagle and raptor use data continue through the 2013 nesting season (at
least through August of 2013) to evaluate this potential season of higher use.
Response: Data will be collected through August of 2013. Our interpretation of eagle
use in winter and summer periods differs from the Service’s interpretation. The
Service’s interpretation assumes that each minute of eagle use is independent and
evenly distributed across the landscape. Based on the survey data, it is clear that most
of the eagle minutes recorded across all seasons are not independent and that the
simple statistic of flight minutes per survey minute does not consider that observations
are not independent in space or time and therefore mischaracterizes seasonal use and
risk. As an example, 72 of the 141 minutes (51%) of winter use observed in the
Project Site occurred at two sites on two days. On December 8, 2011, 35 eagle flight
minutes were recorded at RM11 and on March 9, 2012 37 minutes of eagle use were
recorded at RM14. On both days, field technicians wrote on datasheets that the use
was associated with 2-3 individuals who were using the area for a long period of time.
If the three eagles at RM14 had not been observed on March 9, no winter use would
SWCA
have been observed within 800 meters of that sampling site. Similarly, if the use at
RM11 would not have been observed on December 8, only 3 minutes of eagle use
over would have been observed at that site during winter months and use would have
been decreased by 95%. The observed activity on December 8 and March 9 is
indicative of short duration, concentrated use by a few individuals rather than of high
eagle use of the Project throughout the entire winter period. The data also indicate
that for most of the Project Site there is no risk or very low risk to eagles during
winter. Summer data are very similar to winter data. During summer 2011, only 71
eagle minutes were recorded. Nearly 60% of these minutes were associated with only
3 observations of individual circle soaring birds at RM14 and RM5. This indicates
that the high use the Service cites is not from adults feeding young or young learning
to fly. Rather, the behavior observed indicates that this is localized use by individual
birds utilizing thermals created by warm summer temperatures.
13. In several locations, the document states that it was “fully compliant” with
recommendations by the U.S. Fish and Wildlife Service (Service). First, it is important
to understand that the draft Eagle Conservation Plan Guidance is voluntary;
consequently we prefer to use the term “consistent with” rather than “compliant
with” when describing recommendations found within the Eagle Conservation Plan
Guidance. Second, we do not believe that the protocol provided by PCW is, in fact,
consistent with the Eagle Conservation Plan Guidance for numerous reasons, one key
reason being that the limited number of 800-meter survey points do not provide the
recommended minimum 30 percent coverage of the project footprint. Additionally, we
do not believe it is scientifically justifiable to combine survey points from multiple
years in order to meet the minimum recommended standard of 30 percent coverage:
the minimum 30 percent coverage should occur within each individual year.
Response: The recommended changes have been made. The term “compliant” has
been changed to “consistent”. As stated above, 35% of the probable turbine locations
will be surveyed using the revised protocols.
14. The document makes a definitive statement about “unrealistic projections”
concerning eagle risk. This statement is based on several assumptions, including that
previous survey efforts correctly identified areas of high eagle use. One of the reasons
for increasing the spatial coverage in 2012-2013 is to increase our confidence in
understanding eagle and raptor use across the Project area. Because substantial
uncertainty exists as a result of the limited amount of spatial and temporal survey
coverage used to document impacts and relative risk to eagles, the Service believes
our projections concerning risk to eagles are realistic and clearly demonstrate the
need for increased coverage. In addition, our letter of August 10, 2012, identified
numerous areas of potential high eagle use that are not currently included in the
avoidance areas, such as the golden eagle nest in the southwest corner of Sierra
Madre. Our letter also identified the presence of high density prey base, proximity of
sage grouse leks and other habitat features that are used by eagles. Because these
habitat features (and others) are not included in the proposed avoidance areas, the
projections of risk and high eagle fatalities identified by the Service are possible.

SWCA
Response: The comments made above have been addressed in the revised protocols,
the prey-base report submitted to the Service, and the Project ECP. We concur that
within the context of the Service’s eagle fatality model, the revised protocols will help
address uncertainties.
15. The data sheet attached to the protocol provided by PCW does not appear to have a
means of recording flight path in data. It should be clear how flight path data will be
collected on the existing data sheet, or additional datasheets should be included if
there is more than one.
Response: Attachment 2 contains an example figure that is used to record flight paths
for eagles and other raptors. Additionally, multiple rows of data are recorded for each
eagle observed which results in multiple spatial points per individual bird. Fitting a
line between each point for each observed eagle provides another mechanism to create
flight paths. The methods used to collect data are described in the revised protocols.
SWCA
ATTACHMENT 2
Example Aerial Map Used to Map Flight Paths during 800-meter Raptor
Count Surveys
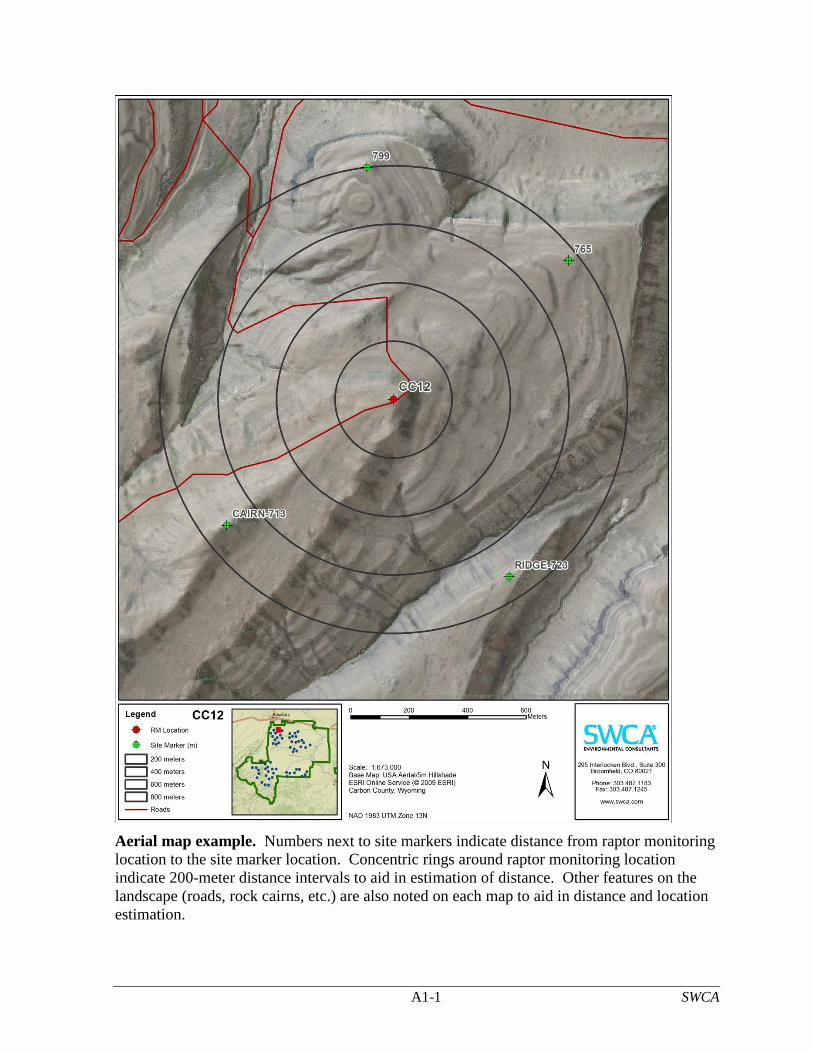
A1-1 SWCA
Aerial map example. Numbers next to site markers indicate distance from raptor monitoring
location to the site marker location. Concentric rings around raptor monitoring location
indicate 200-meter distance intervals to aid in estimation of distance. Other features on the
landscape (roads, rock cairns, etc.) are also noted on each map to aid in distance and location
estimation.

SWCA
ATTACHMENT 3
Data Sheets Used to Collect Data during 800-meter Raptor Count Surveys

A2-1 SWCA
PCW 2012-2013 Raptor Survey
Field Observer:
Survey Location:
Start time:
End time:
Date:
Page: ____ of _____
Target
# Obs
# Species
# Birds
Age Sex Behav Bearing
to Bird (°) Distance
to Bird (m) Angle of Bird (°)
Heading of Bird
0- 30
30-150
150+ Time Begin
Time End

A2-2 SWCA
PCW 2012-2013 Raptor Survey Notes
Field Observer:
Survey Pt:
Date:
Page: _____ of _____
Other species and Notes.
Weather Conditions
Wind
Time Sky Dir Spd Temp (°F)
Incidental Species Observations for eagles and raptors note distance and bearing