attrition cost model instruction manual - eric · attrition cost model instruction manual | 1...
TRANSCRIPT
Delta Cost Project
at American Institutes for Research
September 2012
Attrition cost Model
Instruction Manual

This material is based on research funded by the Bill & Melinda Gates Foundation. The findings and
conclusions contained within are those of the authors and do not necessarily reflect positions or
policies of the Bill & Melinda Gates Foundation.
Attrition Cost Model Instruction Manual
September 2012
Takeshi Yanagiura
Commissioned by the Delta Cost Project
1000 Thomas Jefferson Street, NWWashington, DC 20007-3835202-403-5000 • 800-356-2735

CoNTeNTSIntroduction . . . . . . . . . . . . . . . . . . . . . . . . . . . . . . . . . . . . . . . . . . . . . . . . . . . . . . . . . . . . . . . 1
What is the “Cost of Attrition”?. . . . . . . . . . . . . . . . . . . . . . . . . . . . . . . . . . . . . . . . . . . . . . . 1
How is the “Cost of Attrition” Calculated? . . . . . . . . . . . . . . . . . . . . . . . . . . . . . . . . . . . . . . . 1
Why is the Cost of Attrition Important? . . . . . . . . . . . . . . . . . . . . . . . . . . . . . . . . . . . . . . . . . 1
Technical Requirements . . . . . . . . . . . . . . . . . . . . . . . . . . . . . . . . . . . . . . . . . . . . . . . . . . . . 1
Before Getting Started . . . . . . . . . . . . . . . . . . . . . . . . . . . . . . . . . . . . . . . . . . . . . . . . . . . . . . . 2
Year 1 enrollment File and Year 2 enrollment File. . . . . . . . . . . . . . . . . . . . . . . . . . . . . . . . . . 2
Degree File . . . . . . . . . . . . . . . . . . . . . . . . . . . . . . . . . . . . . . . . . . . . . . . . . . . . . . . . . . . . . 3
Instructional Cost per Credit Hour . . . . . . . . . . . . . . . . . . . . . . . . . . . . . . . . . . . . . . . . . . . . . 4
Getting Started . . . . . . . . . . . . . . . . . . . . . . . . . . . . . . . . . . . . . . . . . . . . . . . . . . . . . . . . . . . . . 5
Interpreting the outputs. . . . . . . . . . . . . . . . . . . . . . . . . . . . . . . . . . . . . . . . . . . . . . . . . . . . . . . 8
“Attrition Cost” Table . . . . . . . . . . . . . . . . . . . . . . . . . . . . . . . . . . . . . . . . . . . . . . . . . . . . . . 8
“Cumulative Attrition Rate by Student Level” Table . . . . . . . . . . . . . . . . . . . . . . . . . . . . . . . . . 8
“Retention and Graduation Summary” Table . . . . . . . . . . . . . . . . . . . . . . . . . . . . . . . . . . . . . 9
“enrollment Summary—Year 1 Students” and “enrollment Summary— Year 2 Students” Tables. . . . . . . . . . . . . . . . . . . . . . . . . . . . . . . . . . . . . . . . . . . . . . . . . . 10
Appendixes
Appendix A. How is the “Cost of Attrition” Calculated? . . . . . . . . . . . . . . . . . . . . . . . . . . . . . 11
Appendix B. SAS Procedure outline. . . . . . . . . . . . . . . . . . . . . . . . . . . . . . . . . . . . . . . . . . . 16
Appendix C. Assumptions and Limitations . . . . . . . . . . . . . . . . . . . . . . . . . . . . . . . . . . . . . . 17

Attrition cost Model Instruction Manual | 1
INTRoDUCTIoNThis instruction manual explains in detail how to use the Attrition Cost Model program, which estimates
the cost of student attrition for a state’s higher education system. Programmed with SAS, this model
allows users to instantly calculate the cost of attrition and the cumulative attrition rate that is based on
the most recent retention and graduation behaviors of students. This document provides readers with a
step-by-step guide to use this program while allowing them to learn the concept of attrition cost, its
calculation method, and its policy implications.
What is the “Cost of Attrition”?The cost of student attrition is defined as the proportion of annual education and related higher education
expenditures that is spent on undergraduate students who do not complete a degree at any institution.
How is the “Cost of Attrition” Calculated?The calculation of attrition cost begins with determining the cumulative attrition rate for each student level
(e.g., freshmen, sophomore). An attrition rate is an inverse statistic of the sum of one-year retention and
graduation rates, adjusted by the returning rate for students who have stopped attending higher education
in that year. The model assumes that the one-year attrition rate for each student level will remain constant
over time, calculating the longitudinal percentage of current-year students who will withdraw from the
system over the next seven years (i.e., cumulative attrition rate). The model then multiplies the cumulative
attrition rate by the annual cost of education and related expenses, producing the cost of attrition for the
state’s higher education system. Appendix A provides a detailed explanation of the calculation process
that derives the attrition cost.
Why is the Cost of Attrition Important?An attrition cost is a conceptual figure, representing the estimated expenditures that will not result in
“success,” which is defined as obtaining a degree from any institution. Although calculated in a relatively
straightforward fashion, attrition costs have implications for the efficiency of states’ higher education
systems in producing degrees. A lower attrition cost indicates greater efficiency, implying that investment
in the higher education system yields a higher rate of success. It goes without saying, however, that any
single indicator cannot fully explain the efficiency of a state’s higher education system. Nevertheless, the
cost of attrition sheds light on one aspect of system effectiveness—providing policymakers with a
framework to better understand the financial efficiency of their higher education system.
Technical RequirementsThis program requires Base SAS 9.1 or above.
2 | Delta Cost Project
BeFoRe GeTTING STARTeD In order to run the SAS program, users must prepare three comma-separated value (CSV) files (comma
delimited): 1) Year 1 enrollment file, 2) Year 2 enrollment file, and 3) Degree file. Null values should not be
included in these files.
Year 1 enrollment File and Year 2 enrollment FileUsers must prepare two separate enrollment data files for the most recent two academic years that data
are available. The “Year 1 enrollment” file must contain individual-level data for all undergraduate students
for all terms of the first academic year. The “Year 2 enrollment” file should include the same enrollment
data for all terms of the subsequent academic year. For example, if the “Year 1 enrollment” file contained
enrollment data for academic year (AY) 2009–10, the “Year 2 enrollment” file must have data for AY 2010–
11. Graduate and high school students should not be included in either file. However, undergraduate
students who took graduate-level courses before graduation must be included in the enrollment files.
Users can make a choice whether to include certificate-seeking students. If certificate-seekers were
included in the enrollment files, the degree file also must include students who earned a certificate. Users
can also choose whether to include non-degree-seeking students, but should be consistent in all files.
The enrollment files also include “FirstYear,” which indicates the academic year when the student
appeared in the state’s database for the first time as a college student, regardless of his/her cumulative
credit hours earned at the time of matriculation.
examples:
1. A student who enrolled in the state’s higher education system in AY 2007–08 as a dually enrolled
high school student and in AY 2008–09 as a college student.
The first academic year of enrollment: AY 2008–09
entered in the file as “2008” (the calendar year of the fall term in the academic year in which the
student enrolled)
2. A student transferred from an out-of-state institution in spring 2006. This student attended the
out-of-state institution in fall 2003 as a first-time freshman.
The first academic year of enrollment: AY 2005–06
entered in the file as “2005” (the calendar year of the fall term in the academic year in which the
student enrolled)
Attrition cost Model Instruction Manual | 3
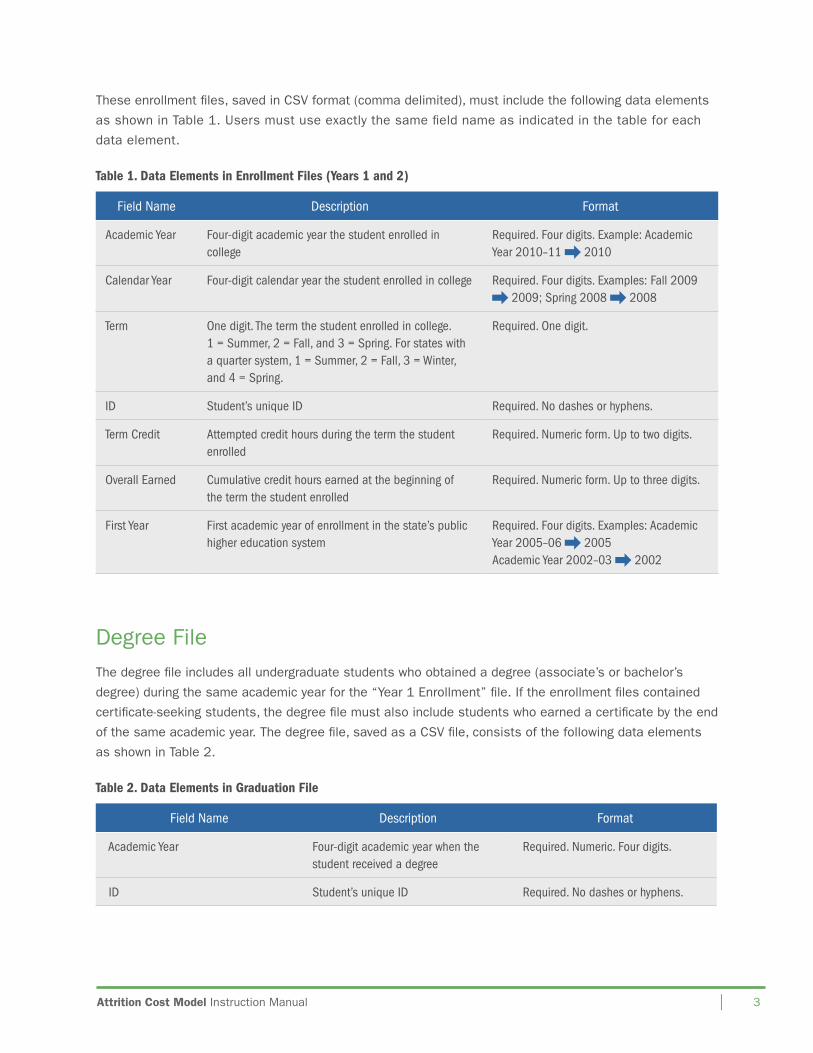
These enrollment files, saved in CSV format (comma delimited), must include the following data elements
as shown in Table 1. Users must use exactly the same field name as indicated in the table for each
data element.
Table 1. Data Elements in Enrollment Files (Years 1 and 2)
Field Name Description Format
Academic Year Four-digit academic year the student enrolled in college
Required. Four digits. Example: Academic Year 2010–11 2010
Calendar Year Four-digit calendar year the student enrolled in college Required. Four digits. Examples: Fall 2009 2009; Spring 2008 2008
Term One digit. The term the student enrolled in college. 1 = Summer, 2 = Fall, and 3 = Spring. For states with a quarter system, 1 = Summer, 2 = Fall, 3 = Winter, and 4 = Spring.
Required. One digit.
ID Student’s unique ID Required. No dashes or hyphens.
Term Credit Attempted credit hours during the term the student enrolled
Required. Numeric form. Up to two digits.
Overall Earned Cumulative credit hours earned at the beginning of the term the student enrolled
Required. Numeric form. Up to three digits.
First Year First academic year of enrollment in the state’s public higher education system
Required. Four digits. Examples: Academic Year 2005–06 2005 Academic Year 2002–03 2002
Degree FileThe degree file includes all undergraduate students who obtained a degree (associate’s or bachelor’s
degree) during the same academic year for the “Year 1 enrollment” file. If the enrollment files contained
certificate-seeking students, the degree file must also include students who earned a certificate by the end
of the same academic year. The degree file, saved as a CSV file, consists of the following data elements
as shown in Table 2.
Table 2. Data Elements in Graduation File
Field Name Description Format
Academic Year Four-digit academic year when the student received a degree
Required. Numeric. Four digits.
ID Student’s unique ID Required. No dashes or hyphens.

4 | Delta Cost Project
Instructional Cost per Credit HourThis program cannot run without an education and related expense per credit hour. Users may enter their
own data, using state or institutional information that distinguishes cost by level of instruction. They may
also enter an average education and related expense derived from the Delta Cost Project methodology,
and available for each institution from the Trends in College Spending (TCS) online system (http://www.
tcs-online.org). The program will derive the attrition cost based on the cost information entered by the user.
Attrition cost Model Instruction Manual | 5
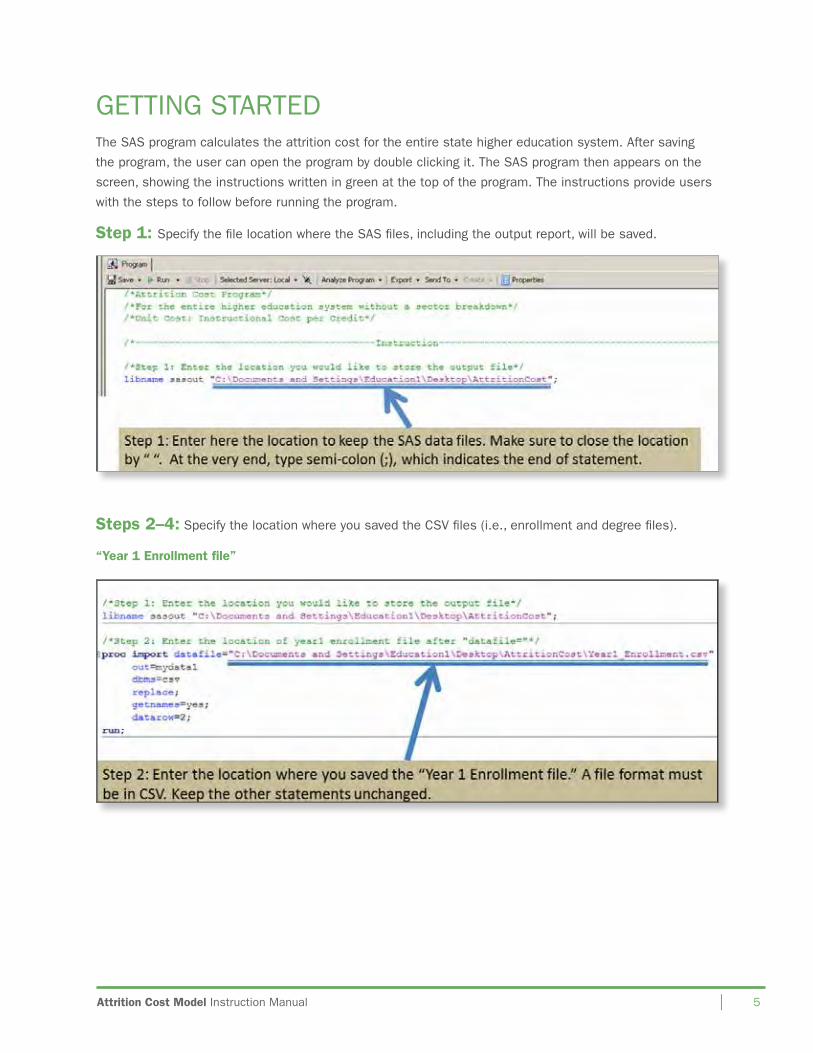
GeTTING STARTeDThe SAS program calculates the attrition cost for the entire state higher education system. After saving
the program, the user can open the program by double clicking it. The SAS program then appears on the
screen, showing the instructions written in green at the top of the program. The instructions provide users
with the steps to follow before running the program.
Step 1: Specify the file location where the SAS files, including the output report, will be saved.
Steps 2–4: Specify the location where you saved the CSV files (i.e., enrollment and degree files).
“Year 1 enrollment file”
6 | Delta Cost Project
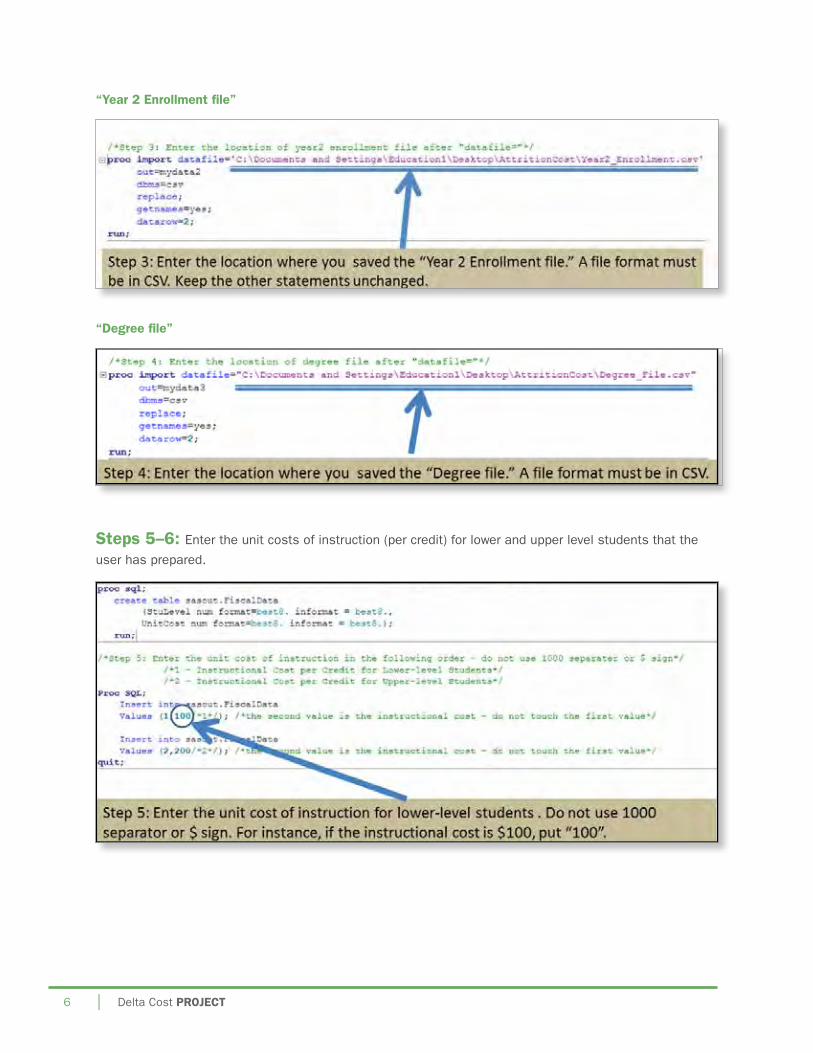
“Year 2 enrollment file”
“Degree file”
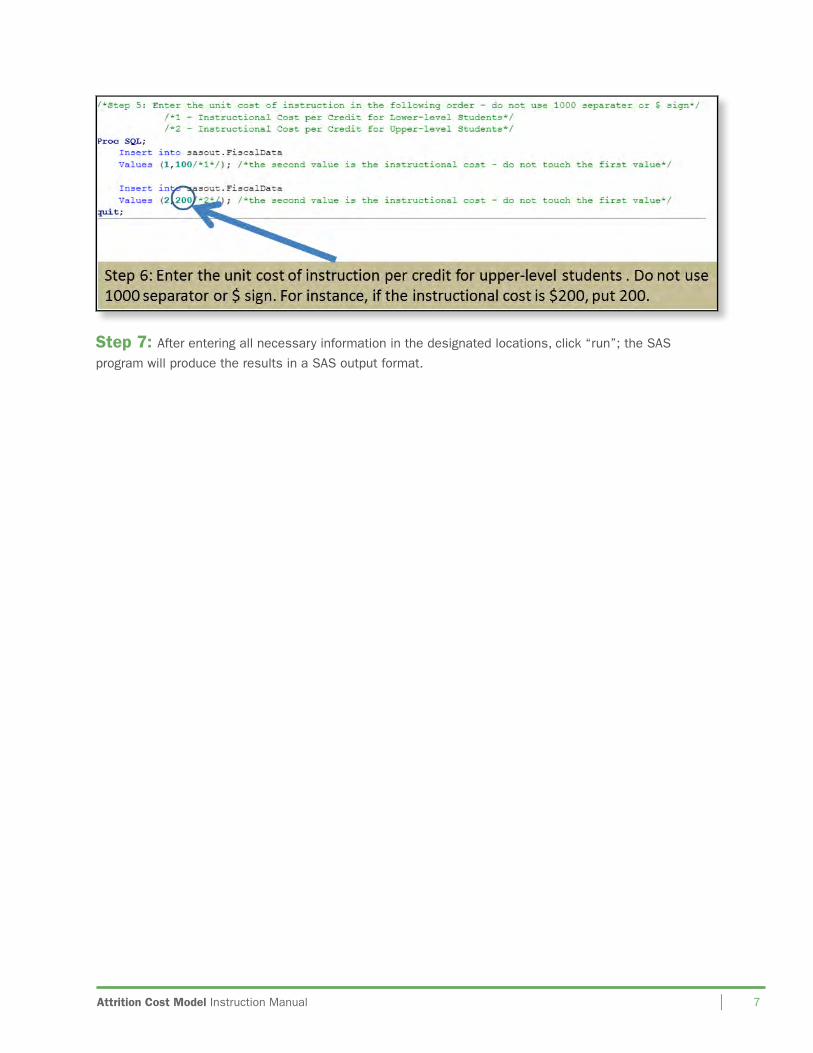
Steps 5–6: enter the unit costs of instruction (per credit) for lower and upper level students that the
user has prepared.
Attrition cost Model Instruction Manual | 7
Step 7: After entering all necessary information in the designated locations, click “run”; the SAS
program will produce the results in a SAS output format.
8 | Delta Cost Project
INTeRPReTING THe oUTPUTSThe SAS program will generate the following outcomes in HTML form:
¡ Attrition Cost
¡ Cumulative Attrition Rate by Student Level
¡ Retention and Graduation Summary
¡ enrollment Summary—Year 1 Students
¡ enrollment Summary—Year 2 Students
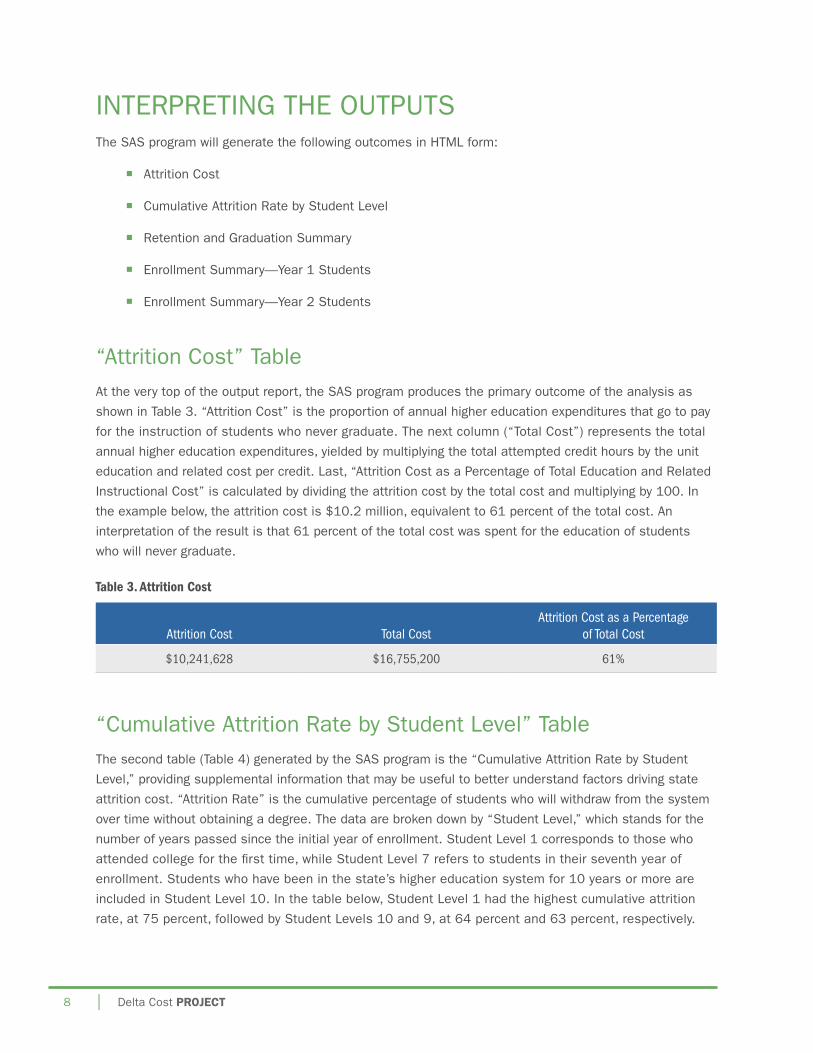
“Attrition Cost” TableAt the very top of the output report, the SAS program produces the primary outcome of the analysis as
shown in Table 3. “Attrition Cost” is the proportion of annual higher education expenditures that go to pay
for the instruction of students who never graduate. The next column (“Total Cost”) represents the total
annual higher education expenditures, yielded by multiplying the total attempted credit hours by the unit
education and related cost per credit. Last, “Attrition Cost as a Percentage of Total education and Related
Instructional Cost” is calculated by dividing the attrition cost by the total cost and multiplying by 100. In
the example below, the attrition cost is $10.2 million, equivalent to 61 percent of the total cost. An
interpretation of the result is that 61 percent of the total cost was spent for the education of students
who will never graduate.
Table 3. Attrition Cost
Attrition Cost Total CostAttrition Cost as a Percentage
of Total Cost
$10,241,628 $16,755,200 61%
“Cumulative Attrition Rate by Student Level” TableThe second table (Table 4) generated by the SAS program is the “Cumulative Attrition Rate by Student
Level,” providing supplemental information that may be useful to better understand factors driving state
attrition cost. “Attrition Rate” is the cumulative percentage of students who will withdraw from the system
over time without obtaining a degree. The data are broken down by “Student Level,” which stands for the
number of years passed since the initial year of enrollment. Student Level 1 corresponds to those who
attended college for the first time, while Student Level 7 refers to students in their seventh year of
enrollment. Students who have been in the state’s higher education system for 10 years or more are
included in Student Level 10. In the table below, Student Level 1 had the highest cumulative attrition
rate, at 75 percent, followed by Student Levels 10 and 9, at 64 percent and 63 percent, respectively.
Attrition cost Model Instruction Manual | 9
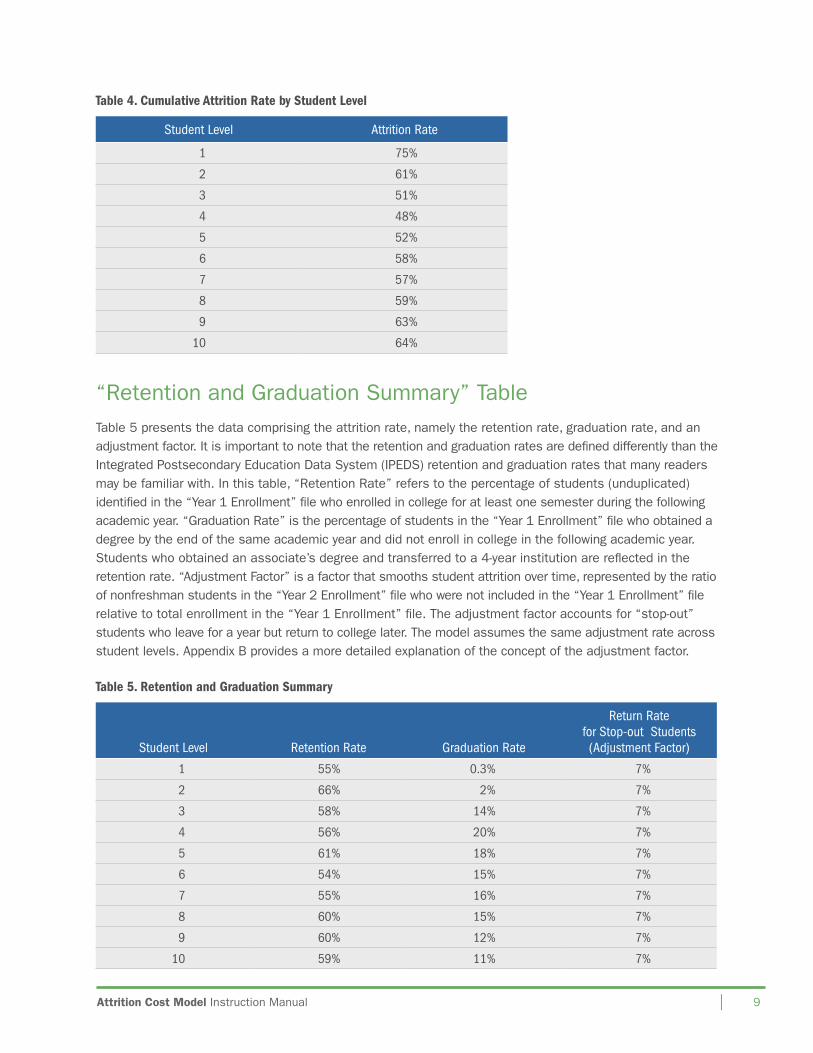
Table 4. Cumulative Attrition Rate by Student Level
Student Level Attrition Rate
1 75%
2 61%
3 51%
4 48%
5 52%
6 58%
7 57%
8 59%
9 63%
10 64%
“Retention and Graduation Summary” TableTable 5 presents the data comprising the attrition rate, namely the retention rate, graduation rate, and an adjustment factor. It is important to note that the retention and graduation rates are defined differently than the Integrated Postsecondary education Data System (IPeDS) retention and graduation rates that many readers may be familiar with. In this table, “Retention Rate” refers to the percentage of students (unduplicated) identified in the “Year 1 enrollment” file who enrolled in college for at least one semester during the following academic year. “Graduation Rate” is the percentage of students in the “Year 1 enrollment” file who obtained a degree by the end of the same academic year and did not enroll in college in the following academic year. Students who obtained an associate’s degree and transferred to a 4-year institution are reflected in the retention rate. “Adjustment Factor” is a factor that smooths student attrition over time, represented by the ratio of nonfreshman students in the “Year 2 enrollment” file who were not included in the “Year 1 enrollment” file relative to total enrollment in the “Year 1 enrollment” file. The adjustment factor accounts for “stop-out” students who leave for a year but return to college later. The model assumes the same adjustment rate across student levels. Appendix B provides a more detailed explanation of the concept of the adjustment factor.
Table 5. Retention and Graduation Summary
Student Level Retention Rate Graduation Rate
Return Rate for Stop-out Students (Adjustment Factor)
1 55% 0.3% 7%
2 66% 2% 7%
3 58% 14% 7%
4 56% 20% 7%
5 61% 18% 7%
6 54% 15% 7%
7 55% 16% 7%
8 60% 15% 7%
9 60% 12% 7%
10 59% 11% 7%
10 | Delta Cost Project
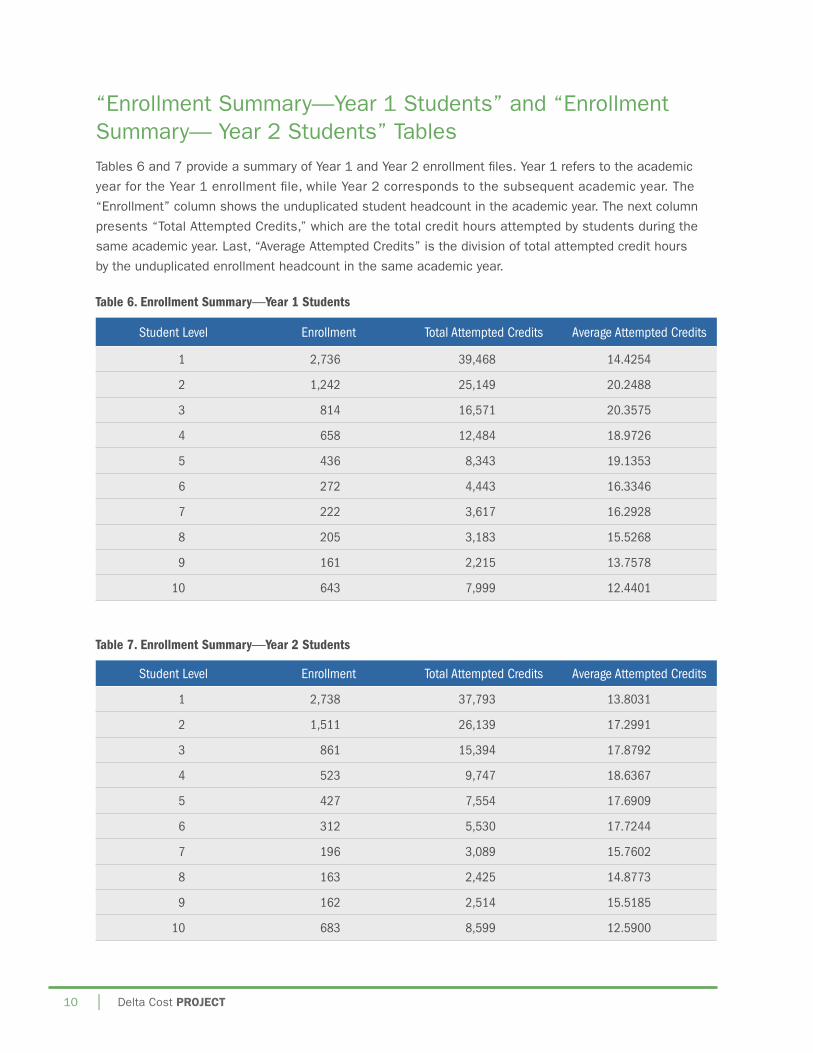
“enrollment Summary—Year 1 Students” and “enrollment Summary— Year 2 Students” TablesTables 6 and 7 provide a summary of Year 1 and Year 2 enrollment files. Year 1 refers to the academic
year for the Year 1 enrollment file, while Year 2 corresponds to the subsequent academic year. The
“enrollment” column shows the unduplicated student headcount in the academic year. The next column
presents “Total Attempted Credits,” which are the total credit hours attempted by students during the
same academic year. Last, “Average Attempted Credits” is the division of total attempted credit hours
by the unduplicated enrollment headcount in the same academic year.
Table 6. Enrollment Summary—Year 1 Students
Student Level Enrollment Total Attempted Credits Average Attempted Credits
1 2,736 39,468 14.4254
2 1,242 25,149 20.2488
3 814 16,571 20.3575
4 658 12,484 18.9726
5 436 8,343 19.1353
6 272 4,443 16.3346
7 222 3,617 16.2928
8 205 3,183 15.5268
9 161 2,215 13.7578
10 643 7,999 12.4401
Table 7. Enrollment Summary—Year 2 Students
Student Level Enrollment Total Attempted Credits Average Attempted Credits
1 2,738 37,793 13.8031
2 1,511 26,139 17.2991
3 861 15,394 17.8792
4 523 9,747 18.6367
5 427 7,554 17.6909
6 312 5,530 17.7244
7 196 3,089 15.7602
8 163 2,425 14.8773
9 162 2,514 15.5185
10 683 8,599 12.5900
Attrition cost Model Instruction Manual | 11
APPeNDIxeS
Appendix A. How is the “Cost of Attrition” Calculated?Tables A-1 through A-6 below provide a detailed description of how an attrition cost is calculated. First,
Table A-1 shows fictitious data of undergraduate enrollment in academic year (AY) 2009–10 in State x.
During that year, the state’s total undergraduate enrollment was 97,175. The student level represents the
number of year(s) passed since initial enrollment, treated as a “cohort” in this model. For instance, the
state had 30,000 students at Student Level 1, meaning their first year of enrollment was AY 2009–10. As
another example, the table shows 21,000 students at Student Level 2, indicating that they were in the
system in AY 2008–09 for the first time and remained enrolled in AY 2009–10. Students who have been
enrolled for more than 10 years are grouped into the student level of “10 or above.”
Table A-1 also shows retention and graduation rates. It is important to note that these rates are different
from the metrics that the public may be familiar with, such as the Integrated Postsecondary education
Data System (IPeDS) retention and graduation rates. In this model, retention rate refers to the percentage
of AY 2009–10 students (including both full-time and part-time) who returned in AY 2010–11, while
graduation rate is the percentage of AY 2009–10 students who exited the system with a degree by the
end of the same academic year. Both rates are calculated for each cohort group. For instance, the
retention and graduation rates for Student Level 4 were 55 percent and 30 percent, respectively. The
interpretation of these rates is that 55 percent of 10,290 students in their fourth year of enrollment in
AY 2009–10 remained enrolled in the next academic year, and 30 percent of them graduated by the end
of AY 2009–10. Students who transferred from the state’s 2-year sector into the 4-year sector with an
associate’s degree are reflected in the retention rate, not in the graduation rate, to avoid double counting.
For the sector-level attrition cost model, however, such students are reflected in the graduation rate for the
2-year sector.
Not returning to college in the next year does not necessarily equate to complete withdrawal from college.
Some students may stop attending college temporarily and return to school after a few years of absence.
The model must account for such “stop-out” behaviors, otherwise it would overstate student attrition. This
model is built on only two years of student data, thus it does not project the number of stop-out students.
To address this technical limitation, the model employs an adjustment factor, which is the percentage of
stop-out students in AY 2010–11 relative to total enrollment in AY 2009–10. The adjustment factor is a
proxy measure that represents expected stop-out behaviors of students in the database. The model
assumes the same adjustment rate across the cohorts. In AY 2010–11, the system enrolled 3,887
stop-out students, equivalent to 4 percent of total enrollment in AY 2009–10. Subtracting the sum of the
retention, graduation, and adjustment rates from 1, the model yields the one-year attrition rate for each
cohort group.

12 | Delta Cost Project
Table A-1. Student Enrollment, Retention, Graduation, and Attrition Rates in AY 2009–10 and AY 2010–11 in State X
Student Level
2009–10 2010–11
Enrolled Enrolled Graduated AdjustmentRetention
RateGraduation
RateAdjustment
RateAttrition
Rate
1 30,000 24,000 - 1,200 80% 0% 4% 16%
2 21,000 17,430 1,050 840 83% 5% 4% 8%
3 14,700 12,054 1,470 588 82% 10% 4% 4%
4 10,290 5,660 3,087 412 55% 30% 4% 11%
5 7,203 3,602 2,521 288 50% 35% 4% 11%
6 5,042 2,269 1,714 202 45% 34% 4% 17%
7 3,529 1,518 1,271 141 43% 36% 4% 17%
8 2,471 1,186 766 99 48% 31% 4% 17%
9 1,729 865 605 69 50% 35% 4% 11%
10 or Above
1,211 569 400 48 47% 33% 4% 16%
Total 97,175 69,153 12,884 3,887 71% 13% 4% 12%
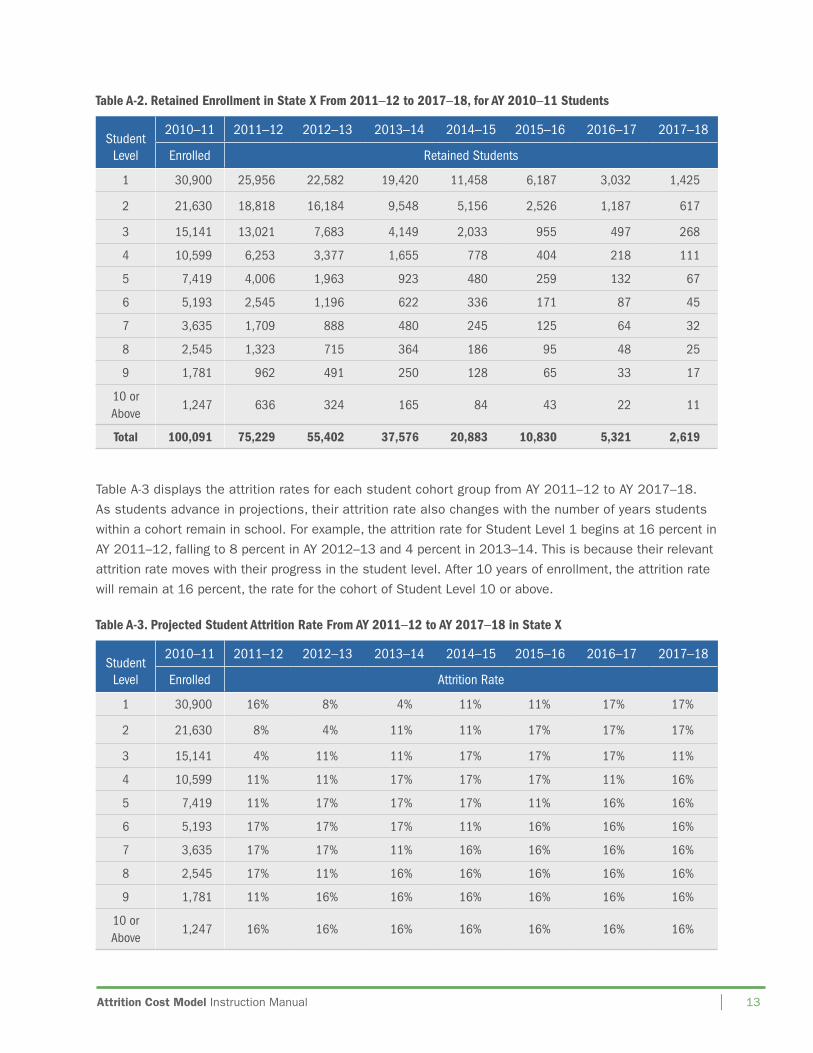
Next, the model produces enrollment projections for AY 2010–11 students based on the retention and
adjustment rates, estimating the number of students who will continue their enrollment from AY 2011–12
to AY 2017–18 (Table A-2). The model first produces an enrollment projection for each cohort group, then
adds them up for total enrollment. For example, the model projects that the enrollment of Student Level 1
will decrease from 30,900 in AY 2010–11 to 25,956 in AY 2011–12. This projection resulted from
multiplying the original student headcount of Student Level 1 in AY 2010–11 by the sum of the 1-year
retention rate (80 percent) and the adjustment rate (4 percent). In the following year, 2012–13, the model
projected a further decline in enrollment to 22,582, after multiplying the 25,956 students (those who
remained enrolled in 2011–12) by the sum of the retention and adjustment rates for Student Level 2.
The model repeats this calculation process seven times for all student cohort groups. Consequently,
overall enrollment will decline from 100,091 in AY 2010–11 to 2,619 in AY 2017–18.
Attrition cost Model Instruction Manual | 13
Table A-2. Retained Enrollment in State X From 2011–12 to 2017–18, for AY 2010–11 Students
Student Level
2010–11 2011–12 2012–13 2013–14 2014–15 2015–16 2016–17 2017–18
Enrolled Retained Students
1 30,900 25,956 22,582 19,420 11,458 6,187 3,032 1,425
2 21,630 18,818 16,184 9,548 5,156 2,526 1,187 617
3 15,141 13,021 7,683 4,149 2,033 955 497 268
4 10,599 6,253 3,377 1,655 778 404 218 111
5 7,419 4,006 1,963 923 480 259 132 67
6 5,193 2,545 1,196 622 336 171 87 45
7 3,635 1,709 888 480 245 125 64 32
8 2,545 1,323 715 364 186 95 48 25
9 1,781 962 491 250 128 65 33 17
10 or Above
1,247 636 324 165 84 43 22 11
Total 100,091 75,229 55,402 37,576 20,883 10,830 5,321 2,619
Table A-3 displays the attrition rates for each student cohort group from AY 2011–12 to AY 2017–18.
As students advance in projections, their attrition rate also changes with the number of years students
within a cohort remain in school. For example, the attrition rate for Student Level 1 begins at 16 percent in
AY 2011–12, falling to 8 percent in AY 2012–13 and 4 percent in 2013–14. This is because their relevant
attrition rate moves with their progress in the student level. After 10 years of enrollment, the attrition rate
will remain at 16 percent, the rate for the cohort of Student Level 10 or above.
Table A-3. Projected Student Attrition Rate From AY 2011–12 to AY 2017–18 in State X
Student Level
2010–11 2011–12 2012–13 2013–14 2014–15 2015–16 2016–17 2017–18
Enrolled Attrition Rate
1 30,900 16% 8% 4% 11% 11% 17% 17%
2 21,630 8% 4% 11% 11% 17% 17% 17%
3 15,141 4% 11% 11% 17% 17% 17% 11%
4 10,599 11% 11% 17% 17% 17% 11% 16%
5 7,419 11% 17% 17% 17% 11% 16% 16%
6 5,193 17% 17% 17% 11% 16% 16% 16%
7 3,635 17% 17% 11% 16% 16% 16% 16%
8 2,545 17% 11% 16% 16% 16% 16% 16%
9 1,781 11% 16% 16% 16% 16% 16% 16%
10 or Above
1,247 16% 16% 16% 16% 16% 16% 16%
14 | Delta Cost Project
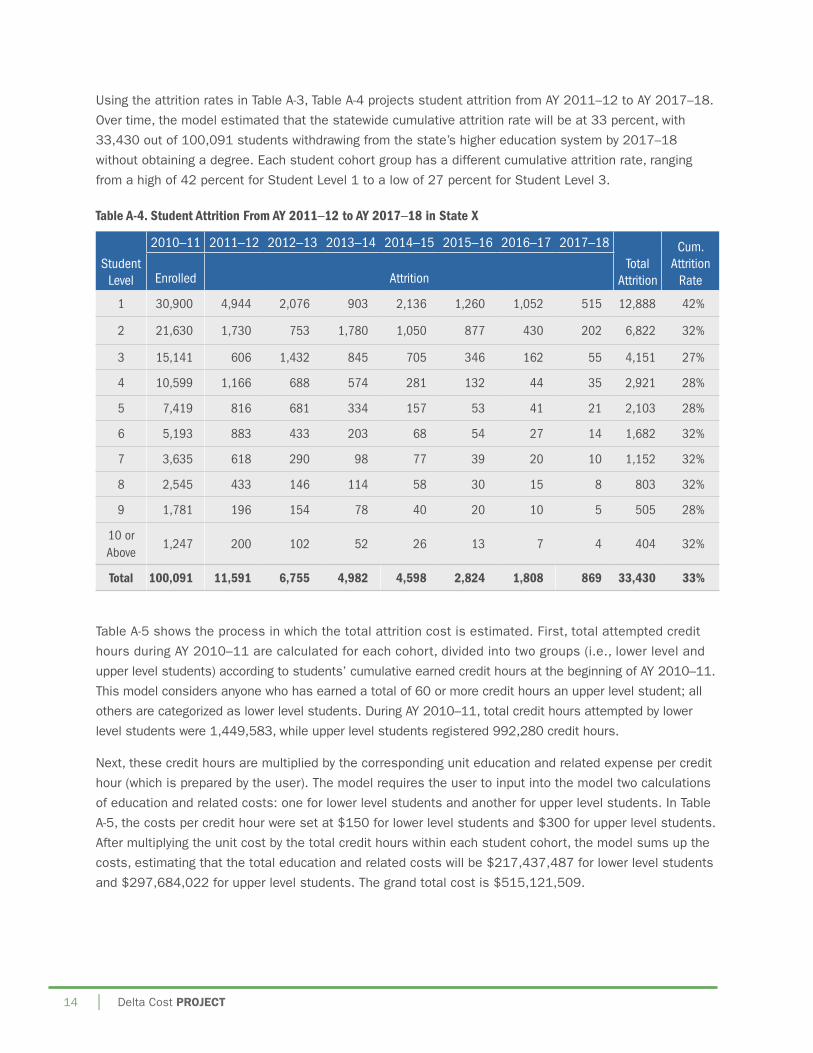
Using the attrition rates in Table A-3, Table A-4 projects student attrition from AY 2011–12 to AY 2017–18.
over time, the model estimated that the statewide cumulative attrition rate will be at 33 percent, with
33,430 out of 100,091 students withdrawing from the state’s higher education system by 2017–18
without obtaining a degree. each student cohort group has a different cumulative attrition rate, ranging
from a high of 42 percent for Student Level 1 to a low of 27 percent for Student Level 3.
Table A-4. Student Attrition From AY 2011–12 to AY 2017–18 in State X
Student Level
2010–11 2011–12 2012–13 2013–14 2014–15 2015–16 2016–17 2017–18
Total Attrition
Cum. Attrition
RateEnrolled Attrition
1 30,900 4,944 2,076 903 2,136 1,260 1,052 515 12,888 42%
2 21,630 1,730 753 1,780 1,050 877 430 202 6,822 32%
3 15,141 606 1,432 845 705 346 162 55 4,151 27%
4 10,599 1,166 688 574 281 132 44 35 2,921 28%
5 7,419 816 681 334 157 53 41 21 2,103 28%
6 5,193 883 433 203 68 54 27 14 1,682 32%
7 3,635 618 290 98 77 39 20 10 1,152 32%
8 2,545 433 146 114 58 30 15 8 803 32%
9 1,781 196 154 78 40 20 10 5 505 28%
10 or Above
1,247 200 102 52 26 13 7 4 404 32%
Total 100,091 11,591 6,755 4,982 4,598 2,824 1,808 869 33,430 33%
Table A-5 shows the process in which the total attrition cost is estimated. First, total attempted credit
hours during AY 2010–11 are calculated for each cohort, divided into two groups (i.e., lower level and
upper level students) according to students’ cumulative earned credit hours at the beginning of AY 2010–11.
This model considers anyone who has earned a total of 60 or more credit hours an upper level student; all
others are categorized as lower level students. During AY 2010–11, total credit hours attempted by lower
level students were 1,449,583, while upper level students registered 992,280 credit hours.
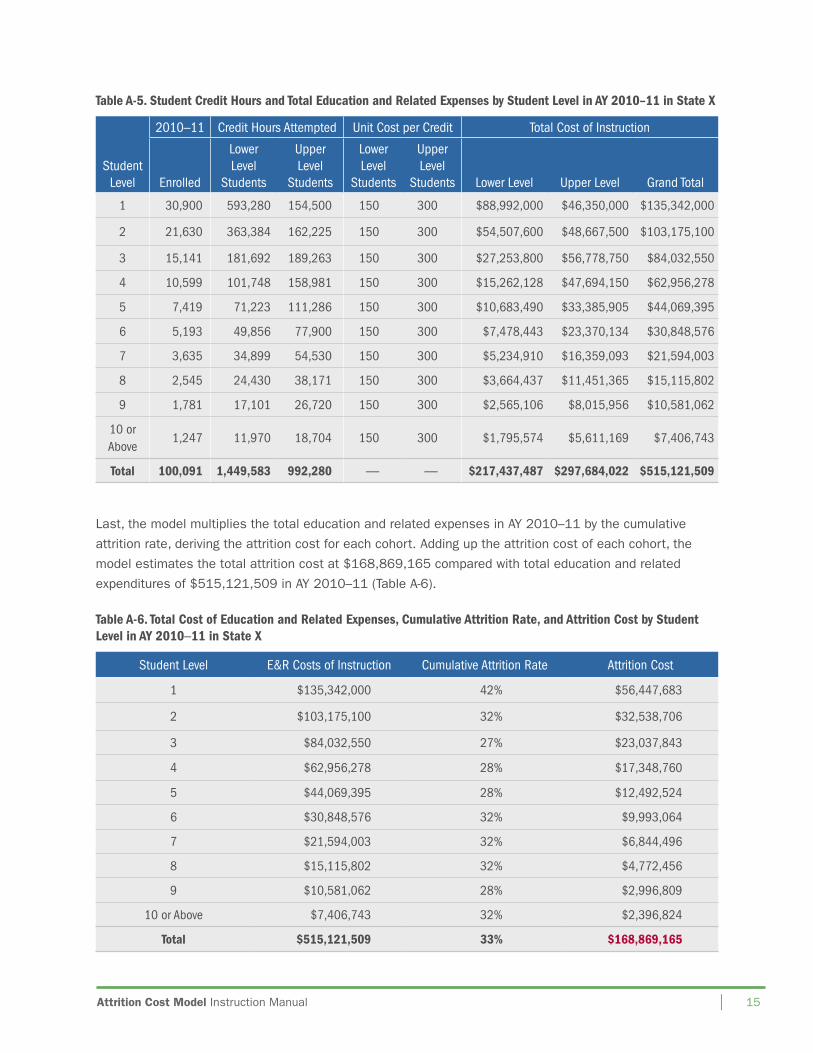
Next, these credit hours are multiplied by the corresponding unit education and related expense per credit
hour (which is prepared by the user). The model requires the user to input into the model two calculations
of education and related costs: one for lower level students and another for upper level students. In Table
A-5, the costs per credit hour were set at $150 for lower level students and $300 for upper level students.
After multiplying the unit cost by the total credit hours within each student cohort, the model sums up the
costs, estimating that the total education and related costs will be $217,437,487 for lower level students
and $297,684,022 for upper level students. The grand total cost is $515,121,509.
Attrition cost Model Instruction Manual | 15
Table A-5. Student Credit Hours and Total Education and Related Expenses by Student Level in AY 2010–11 in State X
Student Level
2010–11 Credit Hours Attempted Unit Cost per Credit Total Cost of Instruction
Enrolled
Lower Level
Students
Upper Level
Students
Lower Level
Students
Upper Level
Students Lower Level Upper Level Grand Total
1 30,900 593,280 154,500 150 300 $88,992,000 $46,350,000 $135,342,000
2 21,630 363,384 162,225 150 300 $54,507,600 $48,667,500 $103,175,100
3 15,141 181,692 189,263 150 300 $27,253,800 $56,778,750 $84,032,550
4 10,599 101,748 158,981 150 300 $15,262,128 $47,694,150 $62,956,278
5 7,419 71,223 111,286 150 300 $10,683,490 $33,385,905 $44,069,395
6 5,193 49,856 77,900 150 300 $7,478,443 $23,370,134 $30,848,576
7 3,635 34,899 54,530 150 300 $5,234,910 $16,359,093 $21,594,003
8 2,545 24,430 38,171 150 300 $3,664,437 $11,451,365 $15,115,802
9 1,781 17,101 26,720 150 300 $2,565,106 $8,015,956 $10,581,062
10 or Above
1,247 11,970 18,704 150 300 $1,795,574 $5,611,169 $7,406,743
Total 100,091 1,449,583 992,280 — — $217,437,487 $297,684,022 $515,121,509
Last, the model multiplies the total education and related expenses in AY 2010–11 by the cumulative
attrition rate, deriving the attrition cost for each cohort. Adding up the attrition cost of each cohort, the
model estimates the total attrition cost at $168,869,165 compared with total education and related
expenditures of $515,121,509 in AY 2010–11 (Table A-6).
Table A-6. Total Cost of Education and Related Expenses, Cumulative Attrition Rate, and Attrition Cost by Student Level in AY 2010–11 in State X
Student Level E&R Costs of Instruction Cumulative Attrition Rate Attrition Cost
1 $135,342,000 42% $56,447,683
2 $103,175,100 32% $32,538,706
3 $84,032,550 27% $23,037,843
4 $62,956,278 28% $17,348,760
5 $44,069,395 28% $12,492,524
6 $30,848,576 32% $9,993,064
7 $21,594,003 32% $6,844,496
8 $15,115,802 32% $4,772,456
9 $10,581,062 28% $2,996,809
10 or Above $7,406,743 32% $2,396,824
Total $515,121,509 33% $168,869,165
16 | Delta Cost Project
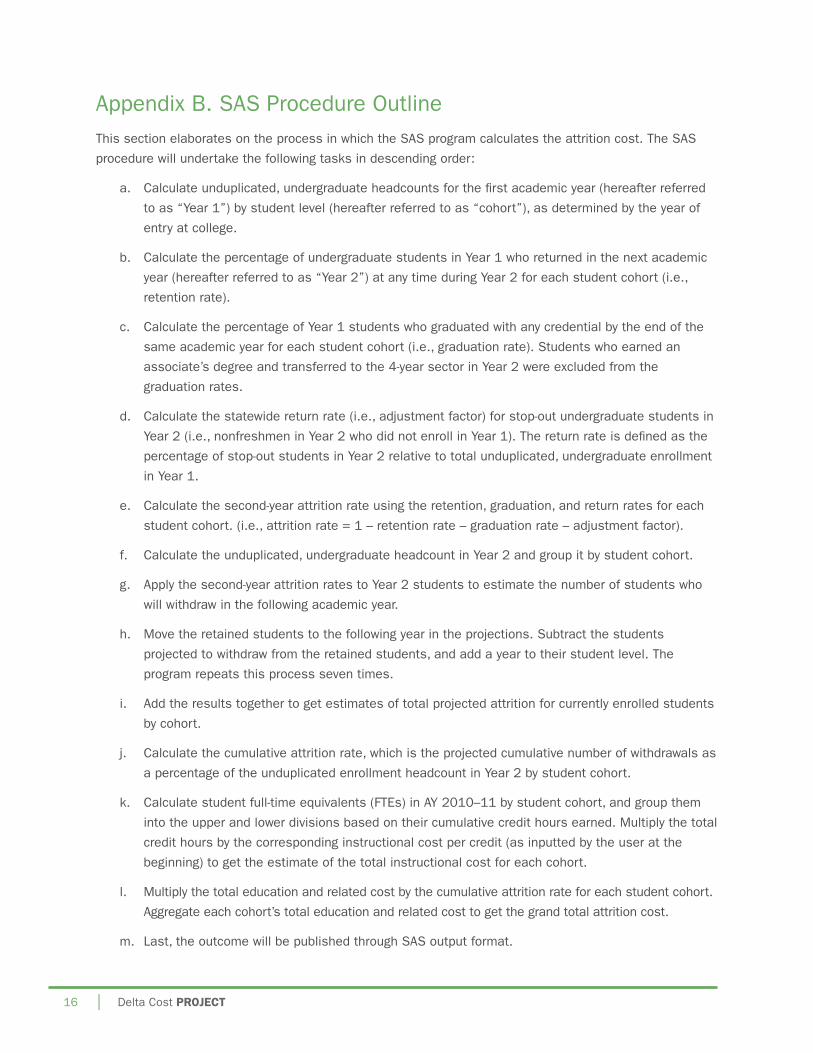
Appendix B. SAS Procedure outlineThis section elaborates on the process in which the SAS program calculates the attrition cost. The SAS
procedure will undertake the following tasks in descending order:
a. Calculate unduplicated, undergraduate headcounts for the first academic year (hereafter referred
to as “Year 1”) by student level (hereafter referred to as “cohort”), as determined by the year of
entry at college.
b. Calculate the percentage of undergraduate students in Year 1 who returned in the next academic
year (hereafter referred to as “Year 2”) at any time during Year 2 for each student cohort (i.e.,
retention rate).
c. Calculate the percentage of Year 1 students who graduated with any credential by the end of the
same academic year for each student cohort (i.e., graduation rate). Students who earned an
associate’s degree and transferred to the 4-year sector in Year 2 were excluded from the
graduation rates.
d. Calculate the statewide return rate (i.e., adjustment factor) for stop-out undergraduate students in
Year 2 (i.e., nonfreshmen in Year 2 who did not enroll in Year 1). The return rate is defined as the
percentage of stop-out students in Year 2 relative to total unduplicated, undergraduate enrollment
in Year 1.
e. Calculate the second-year attrition rate using the retention, graduation, and return rates for each
student cohort. (i.e., attrition rate = 1 – retention rate – graduation rate – adjustment factor).
f. Calculate the unduplicated, undergraduate headcount in Year 2 and group it by student cohort.
g. Apply the second-year attrition rates to Year 2 students to estimate the number of students who
will withdraw in the following academic year.
h. Move the retained students to the following year in the projections. Subtract the students
projected to withdraw from the retained students, and add a year to their student level. The
program repeats this process seven times.
i. Add the results together to get estimates of total projected attrition for currently enrolled students
by cohort.
j. Calculate the cumulative attrition rate, which is the projected cumulative number of withdrawals as
a percentage of the unduplicated enrollment headcount in Year 2 by student cohort.
k. Calculate student full-time equivalents (FTes) in AY 2010–11 by student cohort, and group them
into the upper and lower divisions based on their cumulative credit hours earned. Multiply the total
credit hours by the corresponding instructional cost per credit (as inputted by the user at the
beginning) to get the estimate of the total instructional cost for each cohort.
l. Multiply the total education and related cost by the cumulative attrition rate for each student cohort.
Aggregate each cohort’s total education and related cost to get the grand total attrition cost.
m. Last, the outcome will be published through SAS output format.

Attrition cost Model Instruction Manual | 17
Appendix C. Assumptions and LimitationsThis program assumes the following factors in projections:
¡ Students who graduated but remained enrolled for the next year are counted in the retention rate
(e.g., obtained an associate’s degree and transferred to a 4-year institution).
¡ Students who moved on to graduate school without completing a degree are counted in the
retention rate.
¡ The returning rate for stop-out students is at the same level across cohorts.
¡ Note that the program cannot distinguish students who move to an institution not included in the
data set from those who drop out of higher education. Therefore the results will be more accurate
as more institutions (e.g., private, out-of-state) are included in the data.

18 | Delta Cost Project

Copyright © 2012 American Institutes for Research. All rights reserved. 2579_08/12
1000 Thomas Jefferson Street, NWWashington, DC 20007-3835202.403.5000 | 800.356.2735
About American Institutes for ResearchEstablished in 1946, with headquarters in Washington, D.C., and
offices across the country, American Institutes for Research (AIR) is
an independent, nonpartisan, not-for-profit organization that conducts
behavioral and social science research, and delivers technical assistance
both domestically and internationally in the areas of health, education,
and workforce productivity. As one of the largest behavioral and social
science research organizations in the world, AIR is committed to
empowering communities and institutions with innovative solutions
to the most critical education, health, workforce, and international
development challenges.
AIR currently stands as a national leader in teaching and learning
improvement, providing the research, assessment, evaluation, and
technical assistance to ensure that all students—particularly those
facing historical disadvantages—have access to a high-quality,
effective education. For more information about American Institutes
for Research, visit www.air.org.
About the Delta Cost ProjectThe Delta Cost Project at American Institutes for Research provides
data and tools to help higher education administrators and
policymakers improve college affordability by controlling institutional
costs and increasing productivity. The work is animated by the belief
that college costs can be contained without sacrificing access or
educational quality through better use of data to inform strategic
decision making. For more information about the Delta Cost Project,
visit www.deltacostproject.org.