auckland plan technical documents - business land and
TRANSCRIPT

These papers are a summary of technical work undertaken to assist with the preparation of the draft Auckland Plan. They are one input informing the draft Auckland Plan.
technical Paper: Business land and Employment_
DrAftAucklAnDPlAn_

Draft Auckland Plan
1
DRAFT AUCKLAND PLAN Technical Paper Business Land and Employment Growth September 2011

Draft Auckland Plan
2
1. Introduction The Auckland Plan (‘AP’) discussion document highlights Auckland’s important role within the national economy, states the goal of “an outward-looking global city with a productive, high value economy, supported by a world class international city centre”, and presents a chapter on the economy that outlines key priorities for economic development. Much of this relates to the development of an Economic Development Strategy (‘EDS’) for the region which will directly feed into the development of the plan and future integration work with this workstream (see the Economic Development workstream). This report is focused on land use issues related to economic activity, and in this respect focuses on demand for business land (arising from forecasted employment growth for defined sectors) and the potential supply of business land (defined by centres, corridors and business areas). However, given the proposed approach to a quality, compact city for the AP, which will see growth (in terms of new dwellings and jobs) focused on centres, corridors and areas for intensification across the region, this workstream is mainly concerned with the distinct business land requirements of industrial activities, as these activities do not lend themselves as well to intensification and usually require large land parcels. As noted in the initial workstream outputs in Phase 1 of the Auckland Plan development, some of the broad issues affecting business activity in Auckland include the competition for employment land, availability and cost of business land and greenfield allocation1. It was noted that the AP and EDS will need to plan for employment land, business precincts and sector clusters as platforms for future growth. 2. Existing Strategic Policy Approach The existing policy direction for business land in Auckland is largely based on the outcomes of collaborations between the former territorial authorities and the regional council. Much of this is encapsulated within the Auckland Business Land Strategy (‘BLS’) of 20062. This strategy provides the strategic framework for future business growth in the region to 2031 and was consistent with the direction outlined in the Auckland Regional Growth Strategy. The Business Land Strategy divides business activities between Group 1 and Group 2 classifications. Group 1 comprised the sectors of manufacturing, construction, wholesale trade, transport and storage – these sectors are typically industrial activities which require land extensive sites and can contribute to reverse sensitivity issues due to noise, odour and other emissions3. Group 2 comprised retail ICT, finance and insurance, and other service sectors – these sectors are typically commercial activities that can afford relatively high land prices/rents, and locate well in town centres4. The Business Land Strategy recommended that strategic planning activities look separately at Group 1 activities which are land extensive and Group 2 activities which are usually not.
1 Auckland Council (January 2011). Task 18 Economic Development, in Auckland Plan – Draft 1 preparation, reports for sub-‐workstream Tasks, Page 330. 2 Auckland Regional Growth Forum (2006). The Auckland Regional Business Land Strategy. Auckland Regional Council. 3 Page 40, Ibid 4 Page 40, Ibid
Draft Auckland Plan
3
Business locations in the region have been generally divided between town centres and business areas. Town centres are characterised by a dominance of commercial activities (i.e. office and retail sectors), and business areas are characterised by production activities (i.e. industrial sectors)5. For the most up to date reference, the ARC’s New Planning Framework report summaries the current policy direction as follows6: A centres first approach, achieved by focusing commercial growth and other Group 2 business
activities into a network of high density centres and corridors.
Providing for Group 1 industrial activities in specific business areas outside high density centres and corridors, and in new greenfield areas.
Recent approaches to region wide planning have taken this policy direction forward, namely the recent changes to the Auckland Regional Policy Statement (‘ARPS’) in Plan Change 6 (‘PC6’). The following summary is also from the New Planning Framework report7: “...PC6 pursues a ‘centres first’ approach in which commercial activity growth is directed primarily into high density centres and corridors in the region. Non-commercial activities (specifically Group1 business activities) are directed away from centres and corridors into specific business areas and into new greenfield locations as required. This policy approach reflects the findings of the BLS (above) by:
Focusing commercial growth and other Group 2 business activities in a network of high density centres and corridors
Providing for Group 1 industrial activities (called here ‘land extensive business activities) in specific business areas outside high density centres and corridors, and in new greenfield areas.
The development of PC6 meant that for the first time in the region, there is a policy approach that specifically recognises and provides for a growth of business activities via the above two pronged approach. This approach reflects the desire for high quality, well designed, mixed use environments, based around centres and corridors that can be supported through investments in passenger transport and other core infrastructure.”
A key omission from this approach is a clear direction on possible locations for new business activities including an indication of size and/or capacity8. This is especially that case for Group 1 industrial activities. The territorial authorities individually attempted to answer this question in their own local context, and the ARC through the Business Land and Economy Group (‘BLEG’), also
5 Business Areas Specialist Group (2008). Regional Classification Project: Making the most of Auckland’s centres, business areas and corridors – Officer working paper on Business Areas. Auckland Regional Council. 6 Auckland Regional Council (2010). New Planning Framework working paper. Auckland Regional Council, Page 56 7 Page 58, ibid 8 Other omissions related to large format retail activities will be addressed in other workstreams.
Draft Auckland Plan
4
sought to identify possible sites across the region. However, as noted in the New Planning Framework report9: “The regional policy approach for industrial activities has general support across the region. In particular there is strong support for the identification and development of additional greenfield land for Group 1 business activities. However in recent years a number of Auckland’s local authorities have sought to re-zone land in their local area in an attempt to address this land shortage. There has been little attempt to work collaboratively to identify the optimal greenfield sites in the region.”
The recent review of the ARPS sought to clarify the issues surrounding business land, particularly industrial land, by the inclusion of schedules that identify the high density centres and corridors where business activities are to be encouraged, along with a specific schedule of potential future greenfield areas for Group 1 industrial activities. Work on the draft ARPS has now been superseded by the development of the Auckland Plan and a new Unitary Plan for the region, however this existing policy approach remains an important basis for developing an effective approach to business land provision in the Auckland Plan. Further detail is outlined in the New Planning Framework report and the draft Auckland Regional Policy Statement10. A number of other reports also provide a useful outline of the past policy approach and an outline of business land issues in Auckland (please refer to the Bibliography section). 3. Issues and Opportunities The AP discussion document outlines many relevant statistics that describe the Auckland economy including key spatial planning drivers relating to employment growth. In particular some key statistics and information is outlined from page 44: “Labour force participation was 67.3% at the year ending in December 2010, translating into a work force of approximately 663,000 people.
As at February 2010 Auckland had:
158,752 businesses – 31.4% of all businesses in New Zealand
611,510 employees – 32.3% of all employees in New Zealand
Auckland’s economy has contracted in the last two years, in line with the global and national economic recession. Prior to this, Auckland experienced a period of consistent and rapid growth for much of a decade, particularly in the property and business services and the financial sector. These sectors have experienced sharp declines in employment as have manufacturing and construction and professional, scientific and technical services.
9 Page 61, ibid 10 Auckland Regional Council (2010). Draft Proposed ARPS Final Version: 210 08 31. Auckland Regional Council.

Draft Auckland Plan
5
Although it has contracted, manufacturing remains the largest employer in the region - 11.8% of regional employment at February 2010. In 2010, Auckland’s manufacturing sector generated $5,764 million in gross regional product (GRP), or 35.0% of the national manufacturing contribution to gross domestic product (GDP). This equates to 12.1% of GRP in Auckland, the second largest sector in terms of GRP contribution in the region behind property and business services.
Other key contributors to Auckland’s GRP in 2010 were:
• Finance and insurance – 9.8%
• Wholesale trade – 9.7%
• Communication services – 7.9%
• Retail trade – 6.2%.
Auckland's employment demand is projected to increase from 720,626 in 2007 to over one million people in 2030, based on medium-variant projections. This is an increase of 292,000 or 40%.
The projected percentage increase in demand for employment is similar to the projected 42% increase of the total population for Auckland in the same period.”
These statistics describe the nature of employment and its projected growth in the region and highlight implications for future land use. The statistics also present inconsistencies (i.e. 611,510 employees in 2010 versus 720,626 in 2007) and highlight the need for up to date and consistent employment figures (including projections) on which to base the AP. The following figures use outputs from the Auckland Growth Model (‘AGM’)11 which was commissioned to update future growth projections for population, households, dwellings and employment for use by the new Council. The results of the model outline anticipated levels of growth, the distribution across the region and timing of the growth from a 2007 base. Region wide employment forecasts by broad industry type are currently available from the AGM12, however, forecasts at a finer spatial resolution and for gross floor area are subject to further checking and possible refinement. Further work will be required to analyse and interpret these projections at different spatial scales and to evaluate the implications for the AP’s spatial approach to growth and development. 3.1 Demand Issues The available results for the latest regional wide employment projections are as follows. Using the medium projections the anticipated growth of employment may be up to 192,300 employees between 2011 and 2031 (growth of 29%). This takes the total number of employees to 874,800 by 2031. The high and low projections for 2031 are 931,600 and 818,500 respectively.
11 At the time of writing, further work was underway to check and refine the modelling results. 12Market Economics (2011). Auckland Growth Model: Top Line Information. Auckland Council.

Draft Auckland Plan
6
By 2051 the region may have 1.05 million employees, based on the medium projection, which accounts for growth of 368,900 jobs from 2011 (54%). Please see Table 1.1 and Figure 1.1 below. Table 1.1 - Auckland Employment Projections (2007 – 2051)
Figure 1.1 - Auckland Employment Growth (2007 – 2051)
The region wide employment growth can be broken down and aggregated by different spatial units, for example sub regional areas. Table 1.2 below shows employment growth over the period 2011 to 2031 by sub region13 (please note this analysis produces slight changes to the total growth estimate). The modelling outputs to date show substantial growth in the central area and the remainder in the North West and Southern areas. These figures highlight the predominance of the central area as the key employment location for Auckland, notwithstanding its decline over the last two decades as employment has decentralised and spread around the region. The South and the North West sub regions each account for similar proportions of employment, however combined they are still equate to less than the total for the Central sub region. Employment in the Rural/Island area (i.e. the Rural North, Rural South and Hauraki Island) is much less significant.
13 Please see Assumptions below for the structure of each sub region.

Draft Auckland Plan
7
Table 1.2 Distribution of regional employment growth (2011 – 2031)
Sub region Employee
growth Percentage of regional total
North West 41,000 21%
Central 101,000 52%
South 46,700 24%
Rural/Island 6,700 3%
Total 195,400 100%
Table 1.3 below further breaks down the projected growth across the sub regions by time bands from the base year of 2007. Overall this shows an annual average growth rate of 1.44% for the Central area from 2007. The concentration of the central area raises a number of issues for the spatial planning of the region and should inform the preferred approach to business land provision. It particularly highlights the issue of sub regional balance and whether a more sustainable jobs/housing balance can be achieved within the region. Table 1.3 - Auckland Employment Projections by sub region (2007 – 2031)
Sub region 2007 2011 2021 2031 Net Change
Net Change
%
Annual average
Central 313,400 340,400 393,200 441,400 128,000 41% 1.44%
South 147,500 159,200 183,500 205,900 58,400 40% 0.99%
North West 133,500 143,200 163,500 179,300 45,800 34% 0.87%
Rural South 18,800 20,200 23,600 26,600 7,800 41% 1.03%
Rural North 13,000 14,000 16,600 18,900 5,900 45% 1.11% Hauraki Islands 2,300 2,400 2,700 2,700 400 17% 0.47%
Auckland total 628,500 679,400 783,100 874,800 246,300 39% 1.39% Note - due to minor errors these figures do no add up correctly In addition to the regional employment forecasts, the Auckland Growth Model has produced some preliminary14 forecasts of gross floor area across four key industry groups. These forecasts suggest that floorspace demand (thousands of square meters) will increase from around 36,700sqm in 2011 to 49,200sqm at 2041. Retail and education and health areas
14 Please note: these are in the process of being checked and confirmed. All floorspace figures should be considered draft and may be subject to change.

Draft Auckland Plan
8
may be the areas that experience large increases in the amount of floor space. Further detail will be reported in future technical work published by the Research, Information and Monitoring Unity of the Auckland Council. Employment projections have been grouped into four broad industry groupings to highlight the relative growth of different employment sectors. These are outlined in Figure 1.2 below and cover the following four groupings:
1. Production and Distribution 2. Retail, Hospitality and Recreation 3. Commercial 4. Education and Health
Of note is the total employment growth in the production and distribution sectors (i.e. those which are often land hungry) which is the largest sector by employment count. It is expected this sector may grow by 23% by 2031 and grow by a total of 31% by 2041. Figure 1.2 Sector based employment growth (EC’s) (2007 to 2031)
A fuller analysis of the outputs of the Auckland Growth Model will be provided to support this report and to provide further evidence base information as part of the final Auckland Plan15. 3.2 Supply Issues The growth of Auckland continues to put pressure on the limited supply of business land in the region. These pressures largely arise from the demands for land from new business 15 To be completed by the Auckland Council Research, Information and Monitoring Unit.
0
50,000
100,000
150,000
200,000
250,000
300,000
350,000
2007 2011 2016 2021 2026 2031
Produc^on and Distribu^on Retail, Hospitality and Recrea^on Commercial Educa^on and Health

Draft Auckland Plan
9
activities and competing residential activities as the region intensifies. Between 1996 and 2006, 1,135 hectares of vacant business land was consumed in the metropolitan area for various uses, which equated to an average annual uptake 113 hectares over that period. The current supply of business land in the region is outlined in the most recent pan Auckland Capacity for Growth Study16 (please see Appendix 1 for the data that underpins the following statistics). This study highlighted that Auckland has a total of 7,910 hectares of business zoned land, as provided by the district plans in the region. Of this total 2,406 hectares have capacity for further development as vacant land, vacant potential or brownfield redevelopment. This represented approximately 19 years of available capacity within the metropolitan area, based on the average annual uptake 113 hectares. Further modifications were made to the identified capacity to account for the market perspective that some of capacity is highly constrained. This reduced the assumed capacity by 453 hectares, and the assumed supply within the metropolitan area to approximately 15 years of available capacity. In terms of the estimated 6,814 hectares of business zoned land in the Auckland metropolitan area, just over half is available for Group 1 activities (53% or 3,585ha), 35% is available for Group 2 Activities (2,405ha) and 10% is available for a mix of Group 1 and Group 2 (680ha). A further 144 hectares was not classifiable. The capacity study also investigated the redevelopment potential of current business land. This showed that business zoned land in the region’s centres could theoretically increase capacity by 144% and business zoned land in non-centre areas could increase capacity by 97%. Although this analysis is based on many assumptions and redevelopment of this scale is unlikely to happen in full, it shows that current district plan rules could allow for significant uplift in the intensity of business land use, particularly for Group 2 uses. It should be noted that in both cases (centres and non centres) the Auckland city and Manukau city areas had the most business land capacity and therefore redevelopment potential (please see Figure 1.3 below).
16 Auckland Regional Council (2010). Capacity for Growth Study 2006, Auckland Regional Council.

Draft Auckland Plan
10
Figure 1.3 Redevelopment Capacity (Potential) - Metropolitan Business Land (2006)
The key conclusions that came out of the business land capacity results for the metropolitan area are as follows17:
The Modified Capacity assumptions identify that there is 15 years of capacity available (as at 2006). This is the minimum required by the Auckland Regional Policy Statement (‘ARPS’).
There is significantly less Group 2 vacant land available than Group 1. However, existing Group 2 land has significant potential (> 100% increase) for further intensification (multi storey development), which it is well suited to, unlike Group 1 activities.
There is a limited supply of large Group 1 land parcels remaining.
The majority of Future and Special zoned business land is Group 1 (81% or 382ha) as is the majority of Pipeline Capacity. Additional Group 2 land is planned for the new town centres at Westgate, Hingaia and Takanini.
Brownfield land provides significant capacity within the existing urban area. It is typically well located in terms of the regional freight network and a large proportion is in parcels greater than 0.5 hectares. However, constraints to the development of this land have also been observed and will need to be addressed before the brownfield land supply can be considered ‘readily realisable’ (the Modified Capacity assumption is 30% of brownfield is readily realisable).
Some metropolitan locations now have very limited stocks of vacant business land (North Shore 6 years and Waitakere city 13 years). A significant component of Auckland city capacity (75%) is by way of brownfield land.
17 Page 68, Ibid
Draft Auckland Plan
11
The inclusion of Brownfield Land Capacity is new to the 2006 Study. The 2006 Study identified that while some brownfield land could be readily redeveloped, other parcels would face significant obstacles to redevelopment; e.g. potential contamination, existing industrial or commercial activities and site reconfiguration. To account for these uncertainties capacity could be modified to 30% of the surveyed total.
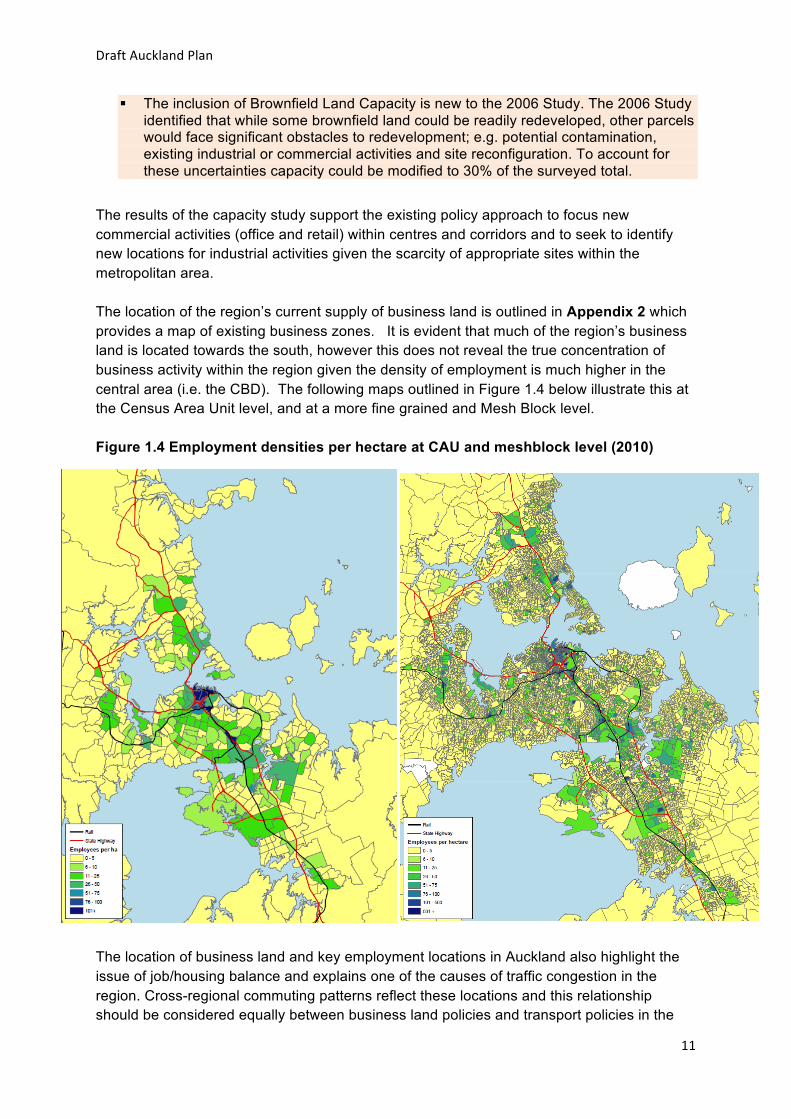
The results of the capacity study support the existing policy approach to focus new commercial activities (office and retail) within centres and corridors and to seek to identify new locations for industrial activities given the scarcity of appropriate sites within the metropolitan area. The location of the region’s current supply of business land is outlined in Appendix 2 which provides a map of existing business zones. It is evident that much of the region’s business land is located towards the south, however this does not reveal the true concentration of business activity within the region given the density of employment is much higher in the central area (i.e. the CBD). The following maps outlined in Figure 1.4 below illustrate this at the Census Area Unit level, and at a more fine grained and Mesh Block level. Figure 1.4 Employment densities per hectare at CAU and meshblock level (2010)
The location of business land and key employment locations in Auckland also highlight the issue of job/housing balance and explains one of the causes of traffic congestion in the region. Cross-regional commuting patterns reflect these locations and this relationship should be considered equally between business land policies and transport policies in the

Draft Auckland Plan
12
AP. Transport and accessibility are also key considerations in business location decisions (see below). 3.3 Supply Influences The locational decisions of business are complex, however, there are quite discernable patterns of employment clusters in the region. Office based employment tends to centre around the central business district and sub regional centres, and since the 1990’s there has been decentralisation towards new office parks, such as Ellerslie and Smales Farm, and to the CBD fringe. There is also a trend towards business parks with a mix of office and industrial activity, such as Albany and Interplex on the North Shore. Retail tends to be located within centres however there has also been considerable decentralisation over the last two decades with a rise in large retail areas outside of centres, such as Westgate and Botany Downs. Industrial activity is largely centred around traditional locations such as Penrose to Otahuhu and pockets of West and South Auckland, but there have also been a number of new areas take prominence such as East Tamaki, Wiri, Aiport Oaks and the development of the North Harbour area. The provision of new business land should be made in recognition of existing business locations and should serve to support these functions as key employment locations. In addition there are other locational factors that must be taken into account. A convenient summary of such factors, based on a stock take of research, is outlined in the discussion paper Auckland Region Employment, Business and Centres Location by the ARC18:
General Requirements for Business Location
Access, including to transport facilities such as motorways, airports and ports; to infrastructure such as utility services and Information and Communication Technology; to a suitable workforce and other associated social service and intellectual resources; and to clients, customers and the market.
Space, including suitable land for (re)development including parking, and suitable buildings for the business function.
Quality environment, including the physical, social and cultural environment and encompassing factors such as amenity and safety of an area and recreational opportunities for the workforce.
Market environment, including associated business and industrial linkages in the location catchments to facilitate networking, clustering or agglomeration opportunities; transport distribution and rental and land costs in the area; and visibility and proximity factors to attract clients.
18 Auckland Regional Council (2003). Auckland Region Employment, Business and Centres Location – a discussion paper on patterns, trends, requirements and policy implications for the Growth Strategy Update 2004/5. Auckland Regional Council, Page 8,
Draft Auckland Plan
13
Access to employment opportunities is also a significant issue for the AP to address given the high concentration of car based commuting in the region. The technical paper for the Sub Regional Approach provides a useful summary of recent travel to work information that should be read in conjunction with this paper. The geography of Auckland’s business locations is well documented and has been effectively presented in the Business Area work of the former Regional Growth Forum. In particular the Business Areas Specialist Group undertook a comprehensive assessment of all business areas, outside of centres and corridors, and classified them according to their functions. This work is a useful indication of current business locations and their functions, please refer to Appendix 3 for a summary of this work. 4. Focus on Industrial The AP Discussion Document outlines some specific issues relating to employment and business land on Page 83, and highlights the particular issue of Group 1 industrial land demand. The activities that are defined as industrial (‘Group 1’) are made of the following business sectors:
Manufacturing Construction Wholesale Trade Transport and Storage
4.1 Industrial Land Demand The only comprehensive region wide evidence base that has estimated the future demand for industrial land is the Market Economics report of 200719. This study took a view on future land demand based on employment projections for the business sectors outlined above and compared this to vacant land estimates and proposals for new business land coming forward through the planning system. The study assumed that at the time of writing there will be between 1,189 and 1,063 hectares available for new industrial activity in the region20. Based on estimates of future employment growth and land supply this study established a potential short fall in land supply and estimated that the Auckland region could require additional greenfield land of between 680 to 720 hectares by 2031 in order to sustain the growth of industrial activities in the region. This was based on an assumption of average development density at 38 FTEs/Ha, and a assumed split between industrial uses supporting ancillary uses21. The 680 hectares is based on an assumption of 75% of land being used for industrial activities and 25% being used of ancillary activities. The 720 hectares is based on an assumption of 60% of land being used for industrial activities and 40% being used of ancillary activities. Following this study, the Auckland Region Greenfield Business Land Report22 of 2007 made recommendations that future greenfield areas for industrial activities should strive to contain
19 Market Economics (May 20070. Group 1 Additional Greenfield Land Requirements, 2001-‐2031. Auckland Regional Council. 20 Page 12, ibid, this is based on a decreasing range from theoretical supply to practical supply. 21 Appendix 2, ibid. 22 BLEG (June 2007) Auckland Region Greenfield Business Land Report. Auckland Regional Council, Page 11.

Draft Auckland Plan
14
75% of the net area for industrial use and the remaining 25% be used of ancillary activities to make the best use of the land resource. Therefore based on the market Economics estimates, the provision of 680 hectares to 2031 could be sufficient to meet future needs (noting 720 hectares if only 60% of the net area is used on average). The achievement of 75% industrial use has policy implications and should be considered in the overall approach to new industrial land in Auckland (i.e. potentially a land use requirement to be considered in the development of the Unitary Plan). The Auckland Region Greenfield Business Land Report also suggested that that future greenfield sites should be a minimum of 100 hectares to achieve ‘critical mass’ and to ensure maximum efficiencies with ancillary activities, however smaller sites may also be appropriate to suit other circumstances23. Again this has policy implications that should be considered in the overall policy approach for industrial activities. Brownfield opportunities were also assumed to be accounted for the Market Economics analysis through the use of the 2006 Capacity Study results (specifically the vacant potential business land). A further study24 attempted to identify brownfield land that may not have been accounted for in the 2006 Capacity Study and concluded that 612 hectares of brownfield land exists in the urban area, however, a large proportion of this potential would be utilised by other land uses. It was estimated that approximately 370 hectares could be further available for Group 1 activities on top of what had been assumed previously, although much of this land is small fragmented sites. This does however highlight the importance of utilising brownfield land to meet future demand for industrial land. Notwithstanding the estimate of additional greenfield land was established at a time of positive economic growth and preceded the credit crunch and the subsequent financial crash of 2008, it is considered that this demand figure serves as a reasonable proxy of the scale of additional industrial land required leading to 2031. However, this is largely due to a variety of factors driving demand for industrial land (namely the redevelopment of the existing urban area by higher value land uses which is displacing some industrial activities), given the employment projections the estimates where based on have not been completely realised25 and land demand has slowed. The slow down in the national economy, the stalling recovery due to the Christchurch earthquake and the ongoing instability of the global economy is contributing to the relative slow down in land take up. The latest quarterly report from CBRE26 shows the take up of vacant industrial land by new development has been subdued, averaging 30 hectares per annum 2009 to 2010, compared to around 110 hectares per annum during 2006 to 2008. CBRE surveys also indicate that there is approx 930 hectares of vacant industrial zoned land left in the region27. However, there are quite clearly pressures on the availability of industrial land in Auckland, as evidenced by many industry commentators, and further work is required to accurately quantify this and to support proposals for future greenfield land release. In the same way the 2007 Market Economics report provided a useful proxy for future land demand, the employment projections outlined in Section 3 above provide an indication of potential 23 BLEG (June 2007). Auckland Region Greenfield Business Land Report. Auckland Regional Council, Page 11. 24 Urbanista (August 2007). Brownfield Land Identification for the Auckland Regional Metropolitan Area 2006. Auckland Regional Council. 25 Based on employee count observations up to 2010. 26 MarketView – Auckland Office, Retail, Industrial: First Quarter 2011. CB Richard Ellis, 2011 27 MarketView – Auckland Office, Retail, Industrial: First Quarter 2011. CB Richard Ellis, 2011

Draft Auckland Plan
15
growing future demand for new industrial land. To clearly establish future demand pressures an active monitoring programme is required that assesses a variety of factors (i.e. not only employment growth, but also changes in the industrial sector, land use, etc) to support proposals for future greenfield land release where and when it is required. 4.2 Potential Greenfield Areas As a response to demand for industrial land that was established in 2007, an initial assessment of potential greenfield areas that could be converted to industrial use was undertaken in 2010. This was primarily intended to inform the Auckland Regional Policy Statement review28. Using a set of agreed criteria (see Appendix 5) this assessment tested the merits of 6 broad areas across the region that had been suggested for industrial use. These areas (and approximate gross number of hectares estimated for industrial use) included:
Silverdale (226 ha) Kumeu (41 ha) Whenuapai (382 ha) Dury (360 ha) Paerata (214 ha) Glenbrook (112 ha)
The results of the assessment did not prioritise potential areas or sites, however, it provided a useful test of regional criteria for choosing new greenfield sites. Since then further work has emerged from the ex territorial authority’s legacy planning frameworks and structure planning processes that have highlighted other potential sites for assessment. A further assessment has been commissioned to look at 6 additional areas and to pull together the results of both assessments to inform the development of the Auckland Plan. The new areas (including the approximate gross number of hectares and source of the proposal) include:
Warkworth (42 ha) - Draft Structure Plan Huapai (85 ha) - Draft Structure Plan Whenuapai North, a.k.a. Brigham Creek North (190 ha) – Waitakere City Council
Growth Strategy Puhinui/Wiri (150 ha) - Private Plan Change Proposal Takanini (30 ha) - Existing Structure Plan Hingaia (50 ha) - Existing Structure Plan
Appendix 6 outlines a composite map of all of the potential greenfield areas assessed. It should be noted that a number of these areas have particular issues or constraints that could prevent their development potential, and all would be subject to relevant resource management policy requirements before any land release could be considered. The size, location and nature of these sites also indicates the significant constraints in the region with regard to providing further industrial zoned land. The results of the latest assessment, combined with the 2010 assessment will be outlined in a separate report to be prepared by independent consultants. This assessment will inform the drafting of the AP’s approach to industrial land provision, however, further work and up to date monitoring will be required to establish and recommend preferred areas for potential new industrial land and their sequenced release over time.
28 Harrison Grierson (2010). Group 1 Industrial Land Assessment. Auckland Regional Council.

Draft Auckland Plan
16
5. Proposals for the Auckland Plan The AP will need to ensure growth pressures are made clear and that sufficient land is provided to accommodate business growth and to support economic development in the region. In particular:
• Future office and retail floorspace should be focused in existing metropolitan areas in accordance with a ‘centres first’ approach. This should help achieve intensification of particular business activities to support agglomeration and appropriate sector clusters.
• Future industrial land should be provided primarily in existing industrial locations (again to achieve intensification of business activities) and through a managed approach to greenfield land release.
• A managed approach to greenfield land release should adopt a plan-monitor-manage methodology:
o Plan for potential new locations; o Monitor the uptake of land, capacities and vacancy rates, and economic
and employment growth; and o Manage provision of land as it is required (avoiding oversupply and
undersupply of greenfield land which may distort the market). o This approach could also potentially take on a sub regional dimension to
achieve a sustainable balance of land supply across the region. This will have implications for the current geography of business land in the region (please see Appendices 2 and 3), and a critical outcome will be to safeguard current employment zoned land, and to encourage the more effective use of brownfield land. Key business locations should be outlined in a regional scale map showing Auckland’s economic directions and the spatial implications of these. Further work is required to establish the extend to which new greenfield industrial land could be depicted on such a map given further investigations are required. In addition the AP should:
• Provide authoritative, region wide employment statistics for use by all stakeholders (based on the outcomes of the Auckland Growth Model – to be published separately).
• Provide the basis for monitoring employment growth and business land uptake across the region (including vacancy rates and yields, etc).
• Support the development of a brownfield database for monitoring redevelopment (dynamically as opposed to 5 yearly capacity studies).
• Support the investigation and preparation of structure plans for significant new areas of greenfield development that can accommodate industrial activity.
Further work is required in relation to the Unitary Plan to develop:
• Strategic directions for the provision of new business floorspace to support employment growth, retail need and business land requirements.
Draft Auckland Plan
17
• Strategic directions requiring the management of existing business locations (i.e. centres), the safeguarding strategic business locations (i.e. business areas), and a positive approach to utilising existing brownfield locations
• A managed approach for the appropriate release and sequencing of new greenfield land for industrial activities. This may require:
− A schedule of potential greenfield industrial locations and an outline of sequencing;
− Requirements for the appropriate and efficient use of sites and the amount of ancillary activities allowed for (to ensure industrial activities are the primary land use); and
− Provision of agreed greenfield criteria for future land assessments. The provision of new industrial land may require plan changes to current operative District Plans in the short term and the provision of appropriate zoning in the Unitary Plan for the longer term. Based on the above it is recommended that the Auckland Plan build on current planning policy to provide for business land, but to provide more certainty in regard to the expected quantum of employment growth, it’s timing and the potential locations of business land to meet this growth. This should be closely integrated with the workstreams that are focused on Centres and Corridors, Urban Form and Rural. It is recommended that responses are divided between commercial (office and retail) and industrial sectors to provide sufficient clarity to the market in terms of these business sectors, and to reflect the distinct land use responses required for each. Rural production should also be recognised and considered through the integration phase (currently the subject of a separate Rural workstream). The approach to office and retail will be developed further through the integration phase with other workstreams (namely Centres and Corridors) and should assess the potential for new business precincts and sector clusters. Potential locations for new industrial land should be outlined and existing areas safeguarded for continued industrial use. The discussion document provides an outline of Auckland’s significant economic directions which highlights key employment areas and economic corridors, along with potential innovation clusters (please see Appendix 4). This approach could be retained and updated to provide the spatial expression of business and employment growth policies. A sub regional approach could also be followed within the Auckland Plan, particularly for business and employment policy areas, and the sub regions provide a useful basis for presenting employment and floorspace statistics at the pan Auckland scale. Finally, for the purposes of land use decisions it is recommended that a detailed planning horizon to 2031 (20 years) should be used, whilst acknowledging longer term planning horizon of the AP to plan for 30 years (to 2041) and beyond (to 2051). The use of 20 year projections is a more stable and confident basis for land use planning purposes (as opposed to 30 - 40 year projections) as it provides more certainty for decision makers. It is expected

Draft Auckland Plan
18
that this type of forward planning will also be supported by a process of ongoing monitoring and review. A process of monitoring employment growth, changes to the economy, land use, business land uptake and capacity will be required to support the implementation of the AP. This will become critically important has Auckland transitions to a more quality compact city, and lower value land uses are displaced in favour of residential and commercial intensification. In accordance with the Auckland Capacity for Growth Study it is recommended that the Auckland Council develop more effective monitoring processes for business land, including the following:
Business land survey: Report on the Business land survey as a separate and more regular report (suggest annually). During periods of high economic activity business land can be consumed very quickly and so it is important to maintain an up to date knowledge base.
Vacant land: Identify any long term vacant land (i.e. five years plus) and examine the constraints affecting this land coming to the development market.
Brownfield land: Monitor and understand the development dynamics associated with Brownfield land.
Strategic land holdings. Identify large strategic land-holdings that have likely short to medium term redevelopment potential. Examine the possible uses and capacity potential of these holdings.
Draft Auckland Plan
19
6. Assumptions The following assumptions have been made:
• Centres (and related Corridors) will provide the key focus for office and retail growth, thereby supporting the quality, compact city approach.
• Mixed use development will be positively promoted in centres and corridors to promote residential development opportunities, but not at the expense of business development capacity.
• The use of Business Improvement Districts will help support the centres approach in particular locations that require public investment.
• This workstream is based on the outcomes of the Auckland Growth Model which is intended to provide an updated baseline for regional projections to support the council’s forward planning activities.
• Retail need will be assessed separately as an outcome of the Centres and Corridors workstream.
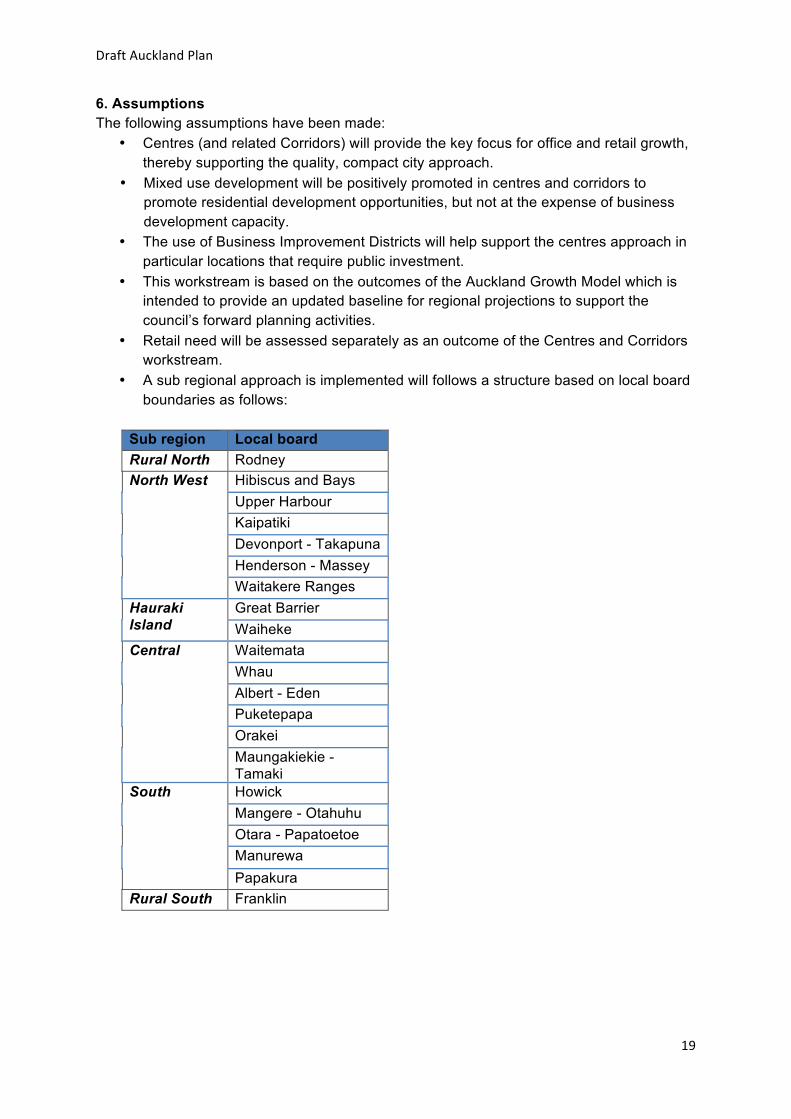
• A sub regional approach is implemented will follows a structure based on local board boundaries as follows:
Sub region Local board Rural North Rodney North West Hibiscus and Bays
Upper Harbour Kaipatiki Devonport - Takapuna Henderson - Massey Waitakere Ranges
Hauraki Island
Great Barrier Waiheke
Central Waitemata Whau Albert - Eden Puketepapa Orakei Maungakiekie - Tamaki
South Howick Mangere - Otahuhu Otara - Papatoetoe Manurewa Papakura
Rural South Franklin

Draft Auckland Plan
20
7. Bibliography
• Auckland Regional Council (October 2006). The Auckland Region Business Land Strategy. Auckland Regional Council
• Market Economics (May 2007). Group 1 Additional Greenfield Land Requirements, 2001-2031. Auckland Regional Council.
• BLEG (June 2007). Auckland Region Greenfield Business Land Report. Auckland Regional Council
• Urbanista (August 2007). Brownfield Land Identification for the Auckland Regional Metropolitan Area 2006 . Auckland Regional Council
• BLEG (September 2007). Report on findings of the Business Land and Economy Group . Auckland Regional Council
• Business Ares Specialist Group (2008). Regional Classification Project: Making the most of Auckland’s centres, Business Areas and Corridors. Auckland Regional Council
• Market Economic and Osborne Hay (February 2009). Industrial Land in the Southern Sector: A strategic Assessment of Requirements and Opportunities.
• Auckland Regional Council (March 2010). Capacity for Growth Study 2006 (Business Land Capacity). Auckland Regional Council
• Waitakere City Council (March 2010). Best for the West: Growth Management Strategy for Waitakere. Waitakere City Council
• Manukau City Council (May 2010). Draft Towards 2060: Manukau’s Spatial Plan. Manukau City Council
• Rodney District Council (September 2010) Industrial Land Strategy. Rodney District Council
• Harrison Grierson (January 2010) Group 1 Business Land Assessment. Auckland Regional Council
Draft Auckland Plan
21
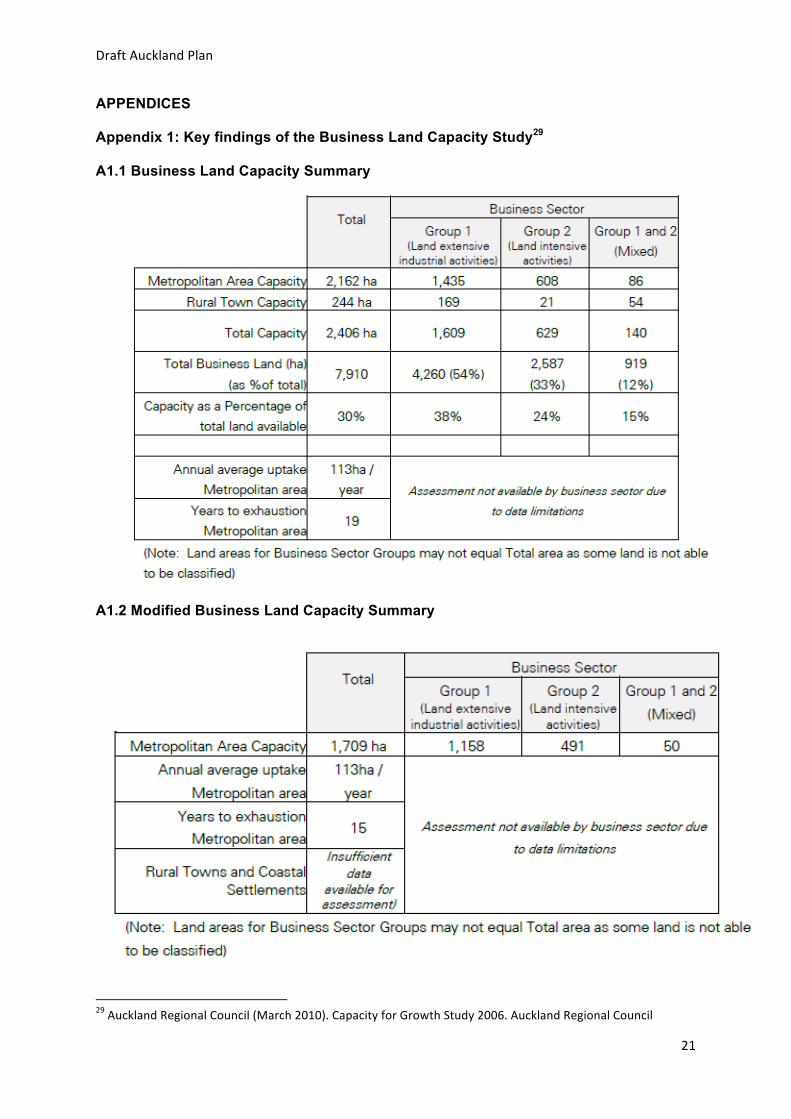
APPENDICES Appendix 1: Key findings of the Business Land Capacity Study29 A1.1 Business Land Capacity Summary
A1.2 Modified Business Land Capacity Summary
29 Auckland Regional Council (March 2010). Capacity for Growth Study 2006. Auckland Regional Council

Draft Auckland Plan
22
A1.3 Vacant Business Land Uptake 1996 to 2006
A1.4 Business land by Group 1 and Group 2 classification

Draft Auckland Plan
23
Appendix 2: Existing Business Zoned Land
Based on aggregating this zoning information the total amount of business zoned land in Auckland is a total of 7,186 hectares of business land in the region (need to verify the source of this). This breaks down to 3,420 hectares for Group 1 activities, 2,872 hectares for Group 2 activities and 893 for mixed Group 1 and 2 activities.

Draft Auckland Plan
24
Appendix 3.Indicative ‘Business Areas’

Draft Auckland Plan
25
Appendix 4. Auckland’s Significant Economic Directions (from AP Discussion Document)

Draft Auckland Plan
26
Appendix 5. Criteria for greenfield industrial site assessments
Group 1 Business Land Assessment Assessment Criteria 1. Access to major road / transport routes 2. Proximity to ports (sea port, inland port, airport) 3. Appropriate Land Features:
Flat land Not on a floodplain 100ha minimum contiguous site
4. Service infrastructure in place or proposed 5. The site:
Has potential for co-location and/or clustering with associated business activities
Is contiguous with existing business land zoned for Group 1 sectors 6. Access to rail 7. Proximity to labour 8. Ability to buffer adverse effects from residential and sensitive activities 9. Low level of traffic in the vicinity 10.Exposure / profile / visibility 11. Existing or proposed public transport 12. Access to complementary / supporting business services

Draft Auckland Plan
27
Appendix 6. Indicative greenfield industrial sites (for investigation)