audit financial - flauditor.gov · secretary of the department of the lottery the state of florida,...
TRANSCRIPT

Sherrill F. Norman, CPA
Auditor General
Report No. 2016-080
January 2016
DEPARTMENT OF THE LOTTERY
For the Fiscal Years Ended
June 30, 2015, and 2014
Financial Audit

Secretary of the Department of the Lottery
The State of Florida, Department of the Lottery (Lottery) was established as a State agency with
the enactment of the Florida Public Education Lottery Act, Chapter 24, Florida Statutes, in 1987.
The head of the Lottery is the Secretary, who, pursuant to Section 20.317, Florida Statutes, is
appointed by the Governor subject to the confirmation of the Senate. During the period of our audit,
Cynthia F. O’Connell served as Department Secretary. Effective November 23, 2015, Thomas R.
Delacenserie was appointed Department Secretary.
The Auditor General conducts audits of governmental entities to provide the Legislature, Florida’s citizens, public entity
management, and other stakeholders unbiased, timely, and relevant information for use in promoting government
accountability and stewardship and improving government operations.
The team leader was Jon M. Bardin, CPA, and the audit was supervised by Allen G. Weiner, CPA.
For the information technology portion of this audit, the team leader was Earl M. Butler, CISA, CFE, and the supervisor
was Arthur Hart, CPA.
Please address inquiries regarding this report to Kathryn D. Walker, CPA, Audit Manager, by e-mail at
[email protected] or by telephone at (850) 412-2781.
Please address inquiries regarding the information technology portion of this report to Arthur Hart, CPA, Audit Manager, by
e-mail at [email protected] or by telephone at (850) 412-2923.
This report and other reports prepared by the Auditor General are available at:
www.myflorida.com/audgen
Printed copies of our reports may be requested by contacting us at:
State of Florida Auditor General
Claude Pepper Building, Suite G74 ∙ 111 West Madison Street ∙ Tallahassee, FL 32399-1450 ∙ (850) 412-2722

DEPARTMENT OF THE LOTTERY
TABLE OF CONTENTS
Page No.
SUMMARY ........................................................................................................................................... i
INDEPENDENT AUDITOR’S REPORT ............................................................................................... 1
MANAGEMENT’S DISCUSSION AND ANALYSIS .............................................................................. 4
BASIC FINANCIAL STATEMENTS
Statements of Net Position ............................................................................................................... 14
Statements of Revenues, Expenses, and Changes in Net Position ................................................ 16
Statements of Cash Flows ............................................................................................................... 17
Notes to Financial Statements ......................................................................................................... 18
OTHER REQUIRED SUPPLEMENTARY INFORMATION .................................................................. 43
INDEPENDENT AUDITOR’S REPORT ON INTERNAL CONTROL OVER FINANCIAL REPORTING AND ON COMPLIANCE AND OTHER MATTERS BASED ON AN AUDIT OF FINANCIAL STATEMENTS PERFORMED IN ACCORDANCE WITH GOVERNMENT AUDITING STANDARDS ................................................ 45
MANAGEMENT’S REPORT ON INTERNAL CONTROL OVER FINANCIAL REPORTING ................ 48
SCHEDULE OF FINDINGS .................................................................................................................. 49
MANAGEMENT’S RESPONSE ............................................................................................................ 50
Report No. 2016-080 January 2016 Page i
SUMMARY
SUMMARY OF REPORT ON FINANCIAL STATEMENTS
Our audit disclosed that the basic financial statements prepared by the Department of the Lottery (Lottery)
present fairly, in all material respects, the net position of the Lottery as of June 30, 2015, and 2014, and
the changes in the financial position and cash flows thereof for the years then ended in accordance with
prescribed financial reporting standards.
SUMMARY OF REPORT ON INTERNAL CONTROL AND COMPLIANCE
In our opinion, Lottery management maintained, in all material respects, effective internal control over
financial reporting.
The results of our tests disclosed no instances of noncompliance or other matters that are required to be
reported under Government Auditing Standards issued by the Comptroller General of the United States;
however, we noted certain additional matters as summarized below.
ADDITIONAL MATTERS
Information Technology Controls
Finding 1: During our audit, we identified the need for an enhancement to the Lottery’s information
technology control practices. Specific details of this issue are not disclosed in this report to avoid the
possibility of compromising Lottery information. However, the appropriate Lottery personnel have been
notified of this issue.
Minority Retailer Participation
Finding 2: Section 24.113, Florida Statutes, requires that 15 percent of the Lottery’s retailers be
minority business enterprises, as defined in Section 288.703(3), Florida Statutes; however, no more than
35 percent of such retailers shall be owned by the same type of minority person, as defined by Section
288.703(4), Florida Statutes. Our audit disclosed that as of July 1, 2015, retailers comprising one minority
type totaled 67 percent of the total number of minority retailers. A similar finding has been included in
prior reports.
AUDIT OBJECTIVES AND SCOPE
Our audit objectives were to determine whether the Lottery had:
Presented the Lottery’s basic financial statements in accordance with generally accepted accounting principles;
Established and implemented internal control over financial reporting and compliance with requirements that could have a direct and material effect on the financial statements;
Complied with the various provisions of laws, rules, regulations, and contracts that are material to the financial statements; and
Taken corrective actions for findings included in our report No. 2015-092.

Report No. 2016-080 Page ii January 2016
The scope of this audit included an examination of the Lottery’s basic financial statements as of and for
the fiscal years ended June 30, 2015, and 2014, and an examination of the effectiveness of the Lottery’s
internal control over financial reporting. With respect to internal control over financial reporting, our
examination included obtaining an understanding of the internal control over financial reporting, testing
and evaluating the design and operating effectiveness of the internal control, and performing such other
procedures as we considered necessary in the circumstances. We also examined various transactions
to determine whether they were executed, both in manner and in substance, in accordance with
governing provisions of laws, rules, regulations, and contracts.
AUDIT METHODOLOGY
The audit methodology used to develop the findings in this report included the examination of pertinent
Lottery records in connection with the application of procedures required by auditing standards generally
accepted in the United States of America and applicable standards contained in Government Auditing
Standards, issued by the Comptroller General of the United States.

Report No. 2016-080 January 2016 Page 1
Phone: (850) 412-2722 Fax: (850) 488-6975
Sherrill F. Norman, CPA Auditor General
AUDITOR GENERAL STATE OF FLORIDA Claude Denson Pepper Building, Suite G74
111 West Madison Street Tallahassee, Florida 32399-1450
The President of the Senate, the Speaker of the House of Representatives, and the Legislative Auditing Committee
INDEPENDENT AUDITOR’S REPORT
Report on the Financial Statements
We have audited the accompanying financial statements of the Department of the Lottery (Lottery), an
enterprise fund of the State of Florida, as of and for the fiscal years ended June 30, 2015, and 2014, and
the related notes to the financial statements which collectively comprise the Lottery’s basic financial
statements as listed in the table of contents.
Management’s Responsibility for the Financial Statements
Management is responsible for the preparation and fair presentation of these financial statements in
accordance with accounting principles generally accepted in the United States of America; this includes
the design, implementation, and maintenance of internal control relevant to the preparation and fair
presentation of financial statements that are free from material misstatement, whether due to fraud or
error.
Auditor’s Responsibility
Our responsibility is to express opinions on these financial statements based on our audits. We
conducted our audits in accordance with auditing standards generally accepted in the United States of
America and the standards applicable to financial audits contained in Government Auditing Standards,
issued by the Comptroller General of the United States. Those standards require that we plan and
perform the audits to obtain reasonable assurance about whether the financial statements are free from
material misstatement.
An audit involves performing procedures to obtain audit evidence about the amounts and disclosures in
the financial statements. The procedures selected depend on the auditor’s judgment, including the
assessment of the risks of material misstatement of the financial statements, whether due to error or
fraud. In making those risk assessments, the auditor considers internal control relevant to the entity’s
preparation and fair presentation of the financial statements in order to design audit procedures that are
appropriate in the circumstances. An audit also includes evaluating the appropriateness of accounting
policies used and the reasonableness of significant accounting estimates made by management, as well
as evaluating the overall presentation of the financial statements.

Report No. 2016-080 Page 2 January 2016
We believe that the audit evidence we have obtained is sufficient and appropriate to provide a basis for
our audit opinions.
Opinions
In our opinion, the financial statements referred to above, present fairly, in all material respects, the
respective financial position of the Lottery as of June 30, 2015, and 2014, and the respective changes in
financial position and cash flows, for the years then ended in accordance with accounting principles
generally accepted in the United States of America.
Emphasis of Matters
As discussed in Note I. to the financial statements, the financial statements of the Lottery are intended to
present the financial position, the changes in financial position, and cash flows of only that portion of the
business-type activities and major funds of the State that is attributable to the transactions of the Lottery.
They do not purport to, and do not, present fairly the operations of the State of Florida as of June 30, 2015,
and 2014, or the changes in its financial position and its cash flows for the years then ended in conformity
with accounting principles generally accepted in the United States of America. Our opinion is not modified
with respect to this matter.
As discussed in Notes I.U. and IX. to the financial statements, the Lottery implemented Governmental
Accounting Standards Board (GASB) Statement No. 68, Accounting and Financial Reporting for
Pensions, an amendment of GASB Statement No. 27, which is a change in accounting principle that
requires an employer participating in a cost-sharing multiple-employer defined benefit pension plan to
report the employer’s proportionate share of the net pension liability of the defined benefit pension plan.
This affects the comparability of amounts reported in the 2014-15 fiscal year with the amounts reported
for the 2013-14 fiscal year. Our opinion is also not modified with respect to this matter.
Other Matters
Required Supplementary Information
Accounting principles generally accepted in the United States of America require that MANAGEMENT’S
DISCUSSION AND ANALYSIS (pages 4 through 12) and the other required supplementary schedules
of the Lottery’s proportionate share of the net pension liability and contributions (pages 43 through 44)
be presented to supplement the basic financial statements. Such information, although not a part of the
basic financial statements, is required by the Governmental Accounting Standards Board who considers
it to be an essential part of financial reporting for placing the basic financial statements in an appropriate
operational, economic, or historical context. We have applied certain limited procedures to the required
supplementary information in accordance with auditing standards generally accepted in the United States
of America, which consisted of inquiries of management about the methods of preparing the information
and comparing the information for consistency with management’s responses to our inquiries, the basic
financial statements, and other knowledge we obtained during our audit of the basic financial statements.
We do not express an opinion or provide any assurance on the information because the limited
procedures do not provide us with sufficient evidence to express an opinion or provide any assurance.
Other Reporting Required by Government Auditing Standards
In accordance with attestation standards established by the American Institute of Certified Public
Accountants and applicable Government Auditing Standards, we have also issued a report on our
examination of the Lottery’s internal control over financial reporting, and on our tests of the Lottery’s

Report No. 2016-080 January 2016 Page 3
compliance with certain provisions of laws, rules, regulations, contracts, and other matters included under
the heading INDEPENDENT AUDITOR'S REPORT ON INTERNAL CONTROL OVER FINANCIAL
REPORTING AND ON COMPLIANCE AND OTHER MATTERS BASED ON AN AUDIT OF FINANCIAL
STATEMENTS PERFORMED IN ACCORDANCE WITH GOVERNMENT AUDITING STANDARDS. As
noted by that report dated January 29, 2016, we have examined, in accordance with attestation
standards established by the American Institute of Certified Public Accountants and the standards
applicable to attestation engagements in Government Auditing Standards, the Lottery’s internal control
over financial reporting as of June 30, 2015, based on criteria established in Internal Control – Integrated
Framework issued by the Committee of Sponsoring Organizations of the Treadway Commission (COSO),
and expressed an unqualified opinion. With respect to compliance, the purpose of that report is not to
provide an opinion on compliance, but rather to describe the scope of our testing of compliance and the
results of that testing. That report is an integral part of an audit performed in accordance with Government
Auditing Standards in considering the Lottery’s internal control over financial reporting and compliance.
Respectfully submitted,
Sherrill F. Norman, CPA Tallahassee, Florida January 29, 2016

Report No. 2016-080 Page 4 January 2016
MANAGEMENT’S DISCUSSION AND ANALYSIS
YEARS ENDED JUNE 30, 2015, AND JUNE 30, 2014
The information presented in the Management’s Discussion and Analysis (MD&A) introduces the Florida
Lottery’s (Lottery) financial statements and provides readers an analytical overview of the Lottery’s
financial activities and performance for the fiscal years ended June 30, 2015, and 2014. We encourage
readers to consider the information presented here in conjunction with the financial statements and notes
to the financial statements, which begin on page 14.
FINANCIAL HIGHLIGHTS
The Lottery has as its mission the maximization of revenues for the benefit of education in a manner
consistent with the dignity of the State of Florida and the welfare of its citizens. The Lottery is considered
a mature lottery and offers its players a full range of both Scratch-Off and Terminal products. The Lottery
has been successful in sustaining ticket sales in excess of $2 billion for the twenty-sixth consecutive fiscal
year, with the past three fiscal years exceeding $5 billion. During the same twenty-six year period, the
transfer to the Educational Enhancement Trust Fund (EETF) has been a minimum of $800 million
annually, with the fiscal year 2015 transfer exceeding $1 billion for the thirteenth consecutive year.
For the fiscal year ended June 30, 2015:
Transfers to the EETF were approximately $1.5 billion this fiscal year, as well as the prior fiscal year.
The Lottery’s ticket sales increased by 4.01 percent over the prior fiscal year from approximately $5.37 billion to $5.58 billion.
Approximately 66.7 percent of total sales were provided by the Scratch-Off product line. This shift in product mix from the higher profit-margin Terminal product to the lower profit-margin Scratch-Off product directly impacts the amount transferred to the EETF.
Prize expense increased $196.8 million, which represents a 5.74 percent increase during fiscal year 2015. The Lottery has the authority to vary the prize expense in order to maximize transfers. This expense typically increases or decreases in proportion to ticket sales and represented approximately 64.98 percent of ticket sales.
The gaming vendors’ fees and retailer commissions are based on sales and therefore fluctuate in direct correlation with sales revenue. Fiscal year 2015 expenses for these items increased 4.77 percent over the prior fiscal year expenses in conjunction with the increase in sales.
Administrative operating expenses, which include advertising, salaries and benefits, rent, utilities and maintenance, professional fees, depreciation, and other administrative expenses, experienced an increase of $1.17 million. Administrative operating expenses for fiscal years 2015 and 2014 were $75.70 million and $74.53 million, respectively.
Nonoperating income increased $4.40 million over the prior fiscal year. The increase was primarily due to a decrease of $3.76 million in amortization of grand prizes.
EETF transfers from unclaimed prize money decreased $9.75 million over the prior fiscal year. Transfers from unclaimed Terminal games increased $3.27 million while transfers from unclaimed Scratch-Off games decreased $13.02 million compared to fiscal year 2014. This decrease can be attributed to the fact that during fiscal year 2015 the Lottery closed 18 games compared to 46 games closed during fiscal year 2014.

Report No. 2016-080 January 2016 Page 5
OVERVIEW OF THE FINANCIAL STATEMENTS
The Lottery is accounted for as an enterprise fund, reporting transactions using the accrual basis of
accounting similar to the method used by business entities. This MD&A is intended to serve as an
introduction to the Lottery’s basic financial statements, including the notes to the financial statements.
The Statements of Net Position on page 14, the Statements of Revenues, Expenses, and Changes in
Net Position on page 16, and the Statements of Cash Flows on page 17 report the Lottery’s net position
and changes therein. The notes to the financial statements provide additional information that is essential
to a reader’s understanding of the data provided in the financial statements.
The Lottery transfers its net profits each fiscal year to the EETF. As a result, the Lottery’s net position
consists of funds invested in capital assets, unrestricted net position, and restricted net position.
Unrestricted net position consists of liabilities for which no cash payments will be made. The restricted
net position consists of the investments being held by the Lottery to fund deferred prize payouts,
20 percent of unclaimed prizes designated for future prize payouts or promotions, and the Multi-State
Lottery Association (MUSL) deposit amounts. The financial statements do include the cumulative effect
of periodic adjustments to recognize the fair value of the grand prize investments despite the fact that the
Lottery purchased the investments with the intention of holding the investments until maturity in order to
meet the future obligations and, therefore, would not realize any gains or losses related to these
investments for distribution as net proceeds.
SUMMARY OF NET POSITION
Table 1 presents a comparative summary of the Lottery’s Statements of Net Position for fiscal years
2015, 2014, and 2013.
Table 1 Condensed Statements of Net Position
As of June 30, 2015, 2014, and 2013 (In Thousands)
2015 2014 2013
Current Assets 205,746$ 175,627$ 195,874$ Restricted Assets 732,727 841,406 1,053,576 Capital Assets, Net of Depreciation 5,820 4,243 3,215 Total Assets 944,293 1,021,276 1,252,665 Total Deferred Outflows of Resources 3,969 - -
Current Liabilities 206,321 167,804 190,498 Current Liabilities Payable from Restricted Assets 383,503 450,147 607,554 Noncurrent Liabilities 271,186 305,664 349,312 Total Liabilities 861,010 923,615 1,147,364 Total Deferred Inflows of Resources 5,709 - -
Net Position:Net Investment in Capital Assets 5,820 4,243 3,215 Restricted Net Position 95,094 93,418 102,086 Unrestricted Net Position (19,371) - - Total Net Position 81,543$ 97,661$ 105,301$

Report No. 2016-080 Page 6 January 2016
FINANCIAL ANALYSIS
Assets
Total assets at the end of fiscal year 2015 decreased $76.98 million from $1.02 billion at June 30, 2014,
to $944.29 million at June 30, 2015. At the end of fiscal year 2014, total assets were $231.39 million less
than the $1.25 billion at the end of fiscal year 2013.
Current assets increased from $175.63 million in 2014 to $205.75 million in 2015, representing an increase of $30.12 million. The increase was primarily due to an increase of $18.64 million in accounts receivable for fiscal year 2015, which was related to timing in the weekly sweeps at June 30, 2015.
Restricted assets decreased $108.68 million from $841.41 million in 2014 to $732.73 million in 2015. This decrease was predominately due to the continued decrease in the deferred payment investment portfolio as the preference in payout options for jackpot prizewinners progressively shifted toward the cash option instead of the alternative annuity option. There were $86.15 million in payouts of annuities and $5.9 million in purchases of new investments in fiscal year 2015 in comparison to fiscal year 2014, which had annuity payouts of $112.60 million, and purchases of new investments of $18.12 million. The amount of invested collateral and time deposits from the lending of those securities also continues to decline. The Lottery held $317.06 million in invested collateral and time deposits at June 30, 2015, $363.98 million at June 30, 2014, and $494.32 million at June 30, 2013.
Deferred Outflows of Resources
Total deferred outflows of resources as of June 30, 2015, were $3.97 million for pension related items
(Refer to Note IX. to the financial statements for additional details).
Liabilities
Total liabilities at June 30, 2015, were $861.01 million, which was approximately $62.61 million lower
than the total liabilities of $923.62 million at June 30, 2014. The total liabilities at June 30, 2014, were
$223.75 million lower than the June 30, 2013, amount of $1.15 billion.
Current liabilities increased from $167.80 million on June 30, 2014, to $206.32 million on June 30, 2015. This increase can be attributed to a Powerball® jackpot that was won at the end of June 2015 and paid in July 2015. As expected, current liabilities payable from restricted assets decreased $66.65 million from $450.15 million at June 30, 2014, to $383.50 million at June 30, 2015. The amount of grand prizes payable due within one year and the obligations under securities lending, which are the two primary components of this liability class, are associated with the amounts payable to jackpot winners, who have chosen the deferred payment option. The obligations under securities lending decreased by $46.91 million and the current portion of grand prizes payable decreased by $19.74 million. At June 30, 2014, current liabilities payable from restricted assets balance of $450.15 million was $157.40 million less than the balance of $607.55 million at June 30, 2013.
Noncurrent liabilities principally consist of the long-term portion of grand prizes payable, which represents the amount to be paid to grand prizewinners in future years. Correlative to current grand prizes payable, the long-term grand prizes payable decreased $44.31 million from June 30, 2014, to June 30, 2015, and decreased $44.98 million from June 30, 2013, to June 30, 2014.
Deferred Inflows of Resources
Total deferred inflows of resources as of June 30, 2015, were $5.71 million for pension related items
(Refer to Note IX. to the financial statements for additional details).

Report No. 2016-080 January 2016 Page 7
Net Position
Net position decreased $16.12 million from June 30, 2014, to June 30, 2015. Net position at
June 30, 2015, 2014, and 2013 were $81.54 million, $97.66 million, and $105.30 million, respectively.
The decline at June 30, 2015, can be attributed to a $6.21 million decrease in the amount restricted for
undistributed appreciation on restricted investments and the $19.4 million impact of recording a new net
pension liability with the implementation of GASB Statement No. 68, Accounting and Financial Reporting
for Pensions, an amendment of GASB Statement No. 27, for the fiscal year ended June 30, 2015. Refer
to Note I.U. for further details.
The Lottery joined MUSL six years ago in order to participate in the Powerball® with Powerplay® game
and on May 15, 2013, the Lottery began participating in Mega Millions® with Megaplier®. In accordance
with MUSL’s rules, the Lottery must contribute to various prize reserve funds maintained by MUSL for
unforeseen prize payouts related to the Powerball with Powerplay and Mega Millions with Megaplier
games. The Lottery’s deposits in reserve funds with MUSL totaled $21.77 million and $19.82 million as
of June 30, 2015, and June 30, 2014, respectively. Refer to Note VI., Multi-State Lottery Association, for
further details.
SUMMARY OF REVENUES, EXPENSES, AND CHANGES IN NET POSITION
The most important element demonstrated with the Lottery’s financial statements is the transfer to the
EETF. Accordingly, the primary focus of these financial statements is determining net income available
for transfer, rather than the change in net position of the Lottery, which primarily reflects the changes in
fair value of restricted investments.
Table 2 presents the condensed Statements of Revenues, Expenses, and Changes in Net Position for
the fiscal year ended June 30, 2015, and the prior fiscal years ended June 30, 2014, and June 30, 2013,
as derived from the Lottery’s Statements of Revenues, Expenses, and Changes in Net Position.

Report No. 2016-080 Page 8 January 2016
Table 2 Condensed Statements of Revenues, Expenses, and Changes in Net Position
As of June 30, 2015, 2014, and 2013 (In Thousands)
2015 2014 2013
Operating Revenues: Ticket Sales $ 5,583,331 $ 5,368,230 $ 5,012,996 Bad Debt Expense (1,263) (1,337) (912) Terminal & Retailer Fees and Miscellaneous 7,652 7,817 7,979 Total Operating Revenues 5,589,720 5,374,710 5,020,063
Operating Expenses: Prizes 3,627,939 3,431,092 3,162,889 Retailer Commissions 311,981 298,651 278,493 Vendor Commissions 81,635 77,052 75,205 Other Expenses 75,696 74,528 72,653 Total Operating Expenses 4,097,251 3,881,323 3,589,240 Income from Operations 1,492,469 1,493,387 1,430,823
Nonoperating Revenue, Net of Expenses (1,218) (5,618) (37,816)
Income Before Operating Transfers 1,491,251 1,487,769 1,393,007
Total Transfers to EETF (1,496,371) (1,495,409) (1,424,307)
Change in Net Position (5,120) (7,640) (31,300)Net Position, Beginning Restated 86,663 105,301 136,601 Net Position, End of Year $ 81,543 $ 97,661 $ 105,301
FINANCIAL ANALYSIS
Sales
For the fiscal year ended June 30, 2015, ticket sales increased by $215.10 million over fiscal year 2014,
which experienced a sales increase of $355.23 million over fiscal year 2013. The Terminal game ticket
sales decreased 4.70 percent from the prior year. To offset the impact of the slow economic recovery
on sales, the Lottery not only continued to utilize proven techniques, but also created new promotions for
players.
The daily games, CASH 3™ and Play 4™, reflect increases over the prior year. The total sales from these two games reached $639.47 million making up 34.39 percent of total Terminal game ticket sales.
On July 2, 2014, Lucky Money replaced Mega Money. The game provided a 29.83 percent ($23.7 million) increase in sales over the prior year.
A total of 500 Full Service Vending Machines (FSVMs) were installed at the Lottery’s top Instant Ticket Vending Machine (ITVM) locations during fiscal years 2013 and 2014. The FSVM allows players to purchase both Terminal and Scratch-Off tickets. Total sales from FSVMs reached $257.31 million during fiscal year 2015.
Sales of Scratch-Off tickets increased from $3.42 billion or 63.65 percent of total sales in fiscal year 2014
to $3.72 billion, or 66.70 percent of total sales in fiscal year 2015.

Report No. 2016-080 January 2016 Page 9
Scratch-Off ticket sales experienced an increase of 8.98 percent over prior year sales with increases being reflected in most price points. The largest increases were seen in the $10 and $25 price points. The $25 price point was dominated by the 100X THE CASH ticket with sales totaling $374.68 million.
ITVMs have proven successful in increasing the visibility of Scratch-Off ticket products and offering a convenience to players. There were 1,500 machines in use during the year. Total sales from the ITVMs accounted for $311.63 million of the Scratch-Off sales.
Bad debt expense is reported as a reduction in gross revenue in accordance with Governmental
Accounting Standards Board requirements. The amount of bad debt expense for the fiscal years ended
June 30, 2015, and 2014, was $1.26 million and $1.34 million, respectively.
The following charts show sales by product for the various Lottery games during the fiscal years 2015
and 2014:
Sales by Product for Fiscal Year 2014-15 Sales by Product for Fiscal Year 2013-14
* Mega Money was replaced by Lucky Money on July 2, 2014. ** Monopoly Millionaires’ Club launched October 19, 2014, but was discontinued December 26, 2014.
Scratch-Off 67%
LOTTO 5%
CASH 3 6%
FANTASY 55%
PLAY 4 5%
POWER BALL with Power Play
7%
*LUCKY MONEY
2%
MEGA MILLIONS
with Megaplier
3%**Monopoly Millionaires
< 1%
Scratch-Off 64%
LOTTO 7%
CASH 3 6%
FANTASY 55%
PLAY 4 5%
POWER BALL with Power Play
9%
MEGA MONEY
1%
MEGA MILLIONS
with Megaplier
3%

Report No. 2016-080 Page 10 January 2016
The following chart and table show sales by game for the last ten fiscal years:
Department of the Lottery Historical Lottery Sales by Game
(In Thousands)
Table 3 Department of the Lottery
Historical Lottery Sales by Game Last Ten Fiscal Years
(In Thousands)
Fiscal Year
Ended June 30 LOTTO FANTASY 5 PLAY 4 CASH 3
LUCKY MONEY /
MEGA MONEY RAFFLE
LUCKY LINES
POWERBALLwith
Power Play
MEGA MILLIONS
with Megaplier
Monopoly Millionaires Scratch-Off
Combined Sales
2006 835,028$ 306,679$ 215,529$ 343,174$ 128,502$ -$ -$ -$ -$ -$ 2,100,118$ 3,929,030$
2007 735,585 326,241 225,285 348,694 130,142 72,549 - - - - 2,283,620 4,122,116
2008 778,954 309,445 227,940 336,096 122,742 30,818 - - - - 2,368,781 4,174,776
2009 650,603 287,285 238,957 320,157 102,190 41,314 - 233,396 - - 2,064,135 3,938,037
2010 445,881 281,963 235,027 304,039 92,060 29,334 - 434,062 - - 2,078,133 3,900,499
2011 411,389 282,777 235,692 313,270 88,971 12,603 45,369 392,969 - - 2,225,676 4,008,716
2012 419,040 290,672 244,711 314,747 92,346 - 17,692 503,697 - - 2,566,991 4,449,896
2013 352,375 281,492 244,141 324,539 89,500 12,879 8,582 654,263 16,698 - 3,028,527 5,012,996
2014 349,114 288,237 257,752 339,636 79,483 - - 469,292 167,573 - 3,417,143 5,368,230
2015 300,961 287,803 276,217 363,251 103,196 - - 375,057 147,370 5,481 3,723,995 5,583,331
Expenses
Section 24.121, Florida Statutes, stipulates that funds remaining in the Operating Trust Fund after the
transfer to the EETF shall be used for the payment of administrative expenses of the Lottery. These
expenses include Terminal game expenses, Scratch-Off ticket expenses, advertising, and other
expenses required for the day-to-day operations of the Lottery.
$1,500,000
$2,000,000
$2,500,000
$3,000,000
$3,500,000
$4,000,000
$4,500,000
$5,000,000
$5,500,000
$6,000,000
2006 2007 2008 2009 2010 2011 2012 2013 2014 2015
POWERBALL withPower PlayMEGA MILLIONSwith MegaplierMonopolyMillionairesLOTTO
LUCKY LINES
RAFFLE
MEGA MONEY/LUCKY MONEYCASH 3
PLAY 4
FANTASY 5
Scratch-Off
Report No. 2016-080 January 2016 Page 11
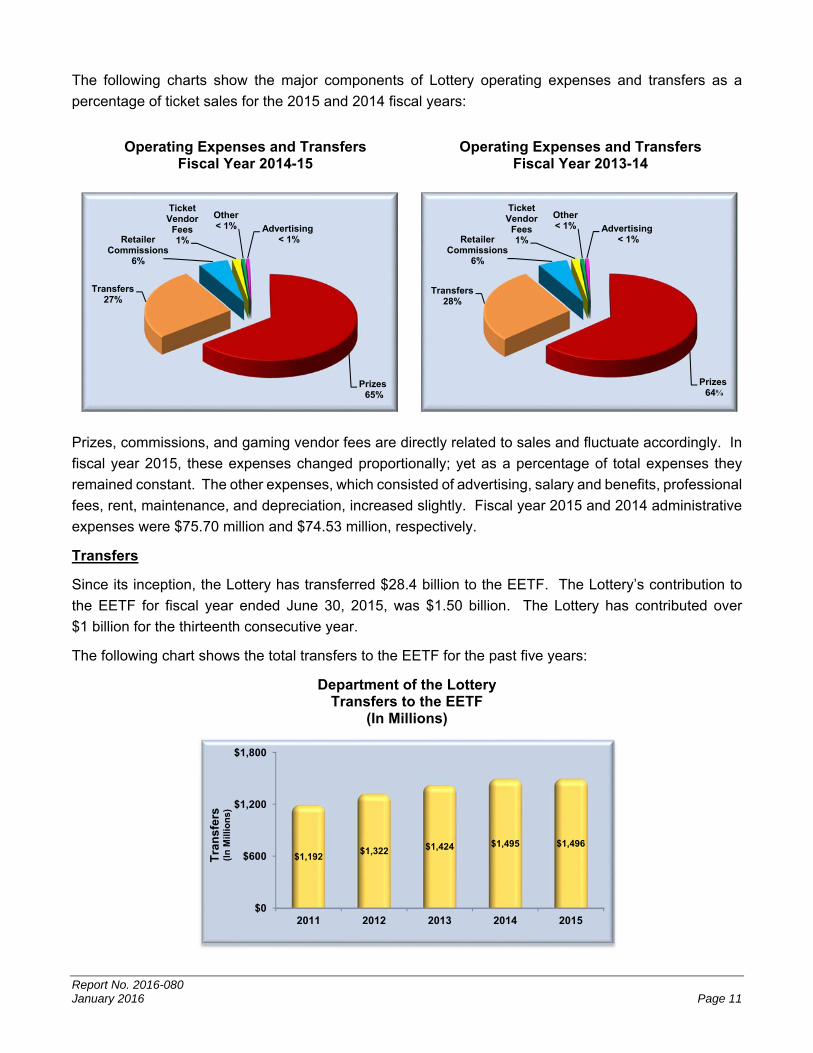
The following charts show the major components of Lottery operating expenses and transfers as a
percentage of ticket sales for the 2015 and 2014 fiscal years:
Operating Expenses and Transfers Operating Expenses and Transfers Fiscal Year 2014-15 Fiscal Year 2013-14
Prizes, commissions, and gaming vendor fees are directly related to sales and fluctuate accordingly. In
fiscal year 2015, these expenses changed proportionally; yet as a percentage of total expenses they
remained constant. The other expenses, which consisted of advertising, salary and benefits, professional
fees, rent, maintenance, and depreciation, increased slightly. Fiscal year 2015 and 2014 administrative
expenses were $75.70 million and $74.53 million, respectively.
Transfers
Since its inception, the Lottery has transferred $28.4 billion to the EETF. The Lottery’s contribution to
the EETF for fiscal year ended June 30, 2015, was $1.50 billion. The Lottery has contributed over
$1 billion for the thirteenth consecutive year.
The following chart shows the total transfers to the EETF for the past five years:
Department of the Lottery Transfers to the EETF
(In Millions)
$0
$600
$1,200
$1,800
2011 2012 2013 2014 2015
$1,192$1,322 $1,424 $1,495 $1,496
Tra
nsf
ers
(In
Mil
lion
s)
Prizes64%
Transfers 28%
Retailer Commissions
6%
Ticket Vendor
Fees1%
Other < 1% Advertising
< 1%
Prizes65%
Transfers 27%
Retailer Commissions
6%
Ticket Vendor
Fees1%
Other < 1% Advertising
< 1%

Report No. 2016-080 Page 12 January 2016
ECONOMIC FACTORS AND FUTURE IMPACTS
The main economic factors affecting lottery sales are population growth, personal income changes,
tourism, and competition for discretionary consumer spending. Florida’s unemployment rate dropped
from 6.2 percent in fiscal year 2014 to 5.6 percent during fiscal year 2015. In fiscal year 2015, Lottery
sales exceeded $5.58 billion, setting new sales records for Scratch-Off and total game sales. The
Lottery’s strategies have revolved around enhancing Terminal and Scratch-Off games, increasing retailer
penetration in the State, and refreshing the Lottery’s brand.
FINANCIAL CONTACT
The Lottery’s financial statements and this MD&A are designed to give a general overview to the reader.
If you have any questions regarding this report or require additional information, please contact the State
of Florida, Department of the Lottery, Chief Financial Officer, 250 Marriott Drive, Capitol Complex,
Tallahassee, Florida 32399.

Report No. 2016-080 January 2016 Page 13
THIS PAGE INTENTIONALLY LEFT BLANK

Report No. 2016-080 Page 14 January 2016
BASIC FINANCIAL STATEMENTS
Department of the Lottery Statements of Net Position
As of June 30, 2015, and June 30, 2014 (In Thousands)
June 30, 2015 June 30, 2014AssetsCurrent Assets: Cash and cash equivalents 136,697$ 124,629$ Interest receivable 62 35 Accounts receivable, net 65,645 47,003 Prepaid expenses 148 8 Inventories 1,090 1,735 Security deposits 2,104 2,217 Total Current Assets 205,746 175,627
Noncurrent Assets: Restricted Assets Cash and cash equivalents 35,159 30,609 Securities lending income receivable 76 496 Deposit with MUSL 21,766 19,817 Investments, grand prize 372,266 441,503 Investments, security lending collateral 303,460 348,981 Total Restricted Assets 732,727 841,406 Capital assets, net 5,820 4,243 Total Noncurrent Assets 738,547 845,649
Total Assets 944,293 1,021,276
Deferred Outflows of ResourcesPension related items 3,969 -
Total Deferred Outflows of Resources 3,969 -
Total Assets and Deferred Outflows of Resources 948,262$ 1,021,276$
The notes to the financial statements are an integral part of these statements. (Continued)

Report No. 2016-080 January 2016 Page 15
Department of the Lottery Statements of Net Position
As of June 30, 2015, and June 30, 2014 (In Thousands)
June 30, 2015 June 30, 2014
LiabilitiesCurrent Liabilities: Accounts payable and accrued liabilities 7,729$ 5,513$ Prizes payable 128,514 104,078 Due to Educational Enhancement Trust Fund 67,371 55,409 Deposits payable 2,106 2,219 Compensated absences payable 409 585 Net pension liability 192 - Total Current Liabilities 206,321 167,804
Current Liabilities Payable from Restricted Assets: Securities lending fees payable 47 40 Obligations under securities lending 317,044 363,953 Grand prizes payable 66,412 86,154 Total Current Liabilities Payable from Restricted Assets 383,503 450,147
Noncurrent Liabilities: Grand prizes payable from restricted assets 254,154 298,466 Compensated absences payable 3,455 3,189 Net pension liability 8,492 - Other long-term liabilities 5,085 4,009 Total Noncurrent Liabilities 271,186 305,664
Total Liabilities 861,010 923,615
Deferred Inflows of ResourcesPension related items 5,709 -
Total Deferred Inflows of Resources 5,709 -
Net Position Invested in capital assets 5,820 4,243 Restricted for undistributed appreciation on restricted investments 51,800 58,009 Restricted for MUSL 21,766 19,817 Restricted for future prizes or special prize promotions 21,528 15,592 Unrestricted (19,371) -
Total Net Position 81,543 97,661
Total Liabilities, Deferred Inflows of Resources, and Net Position 948,262$ 1,021,276$
The notes to the financial statements are an integral part of these statements.

Report No. 2016-080 Page 16 January 2016
Department of the Lottery Statements of Revenues, Expenses, and Changes in Net Position
Years Ended June 30, 2015, and June 30, 2014 (In Thousands)
June 30, 2015 June 30, 2014
Operating Revenues Ticket sales 5,583,331$ 5,368,230$
Bad debt expense (1,263) (1,337)
Terminal fees and miscellaneous 7,456 7,611
Retailer fees 196 206
Total Operating Revenues 5,589,720 5,374,710
Operating Expenses Prizes 3,627,939 3,431,092
Retailer commissions 311,981 298,651
Scratch-Off tickets 51,665 48,157
Terminal games 29,970 28,895
Advertising 37,513 37,486
Personal services 27,320 27,614
Other contractual services 8,344 7,656
Materials and supplies 2,078 1,057
Depreciation 441 715
Total Operating Expenses 4,097,251 3,881,323
Operating Income 1,492,469 1,493,387
Nonoperating Revenues (Expenses) Interest 4,032 2,776
Securities lending income 997 1,534
Securities lending fees (505) (327)
Investment management fees (370) (532)
Net appreciation (depreciation) in fair value of investments 12,604 13,718
Property disposition (loss) 64 124
Amortization of grand prizes payable (18,040) (22,911)
Total Nonoperating Revenues (Expenses), Net (1,218) (5,618)
Income Before Operating Transfers 1,491,251 1,487,769
Transfers to Educational Enhancement Trust Fund (1,496,371) (1,495,409)
Change in Net Position (5,120) (7,640)
Net Position, Beginning of Year, as originally reported 97,661 105,301
Implementation effect of GASB Statement No. 68 (10,998) -
Net Position, Beginning Restated 86,663 105,301
Net Position, End of Year 81,543$ 97,661$
The notes to the financial statements are an integral part of these statements.
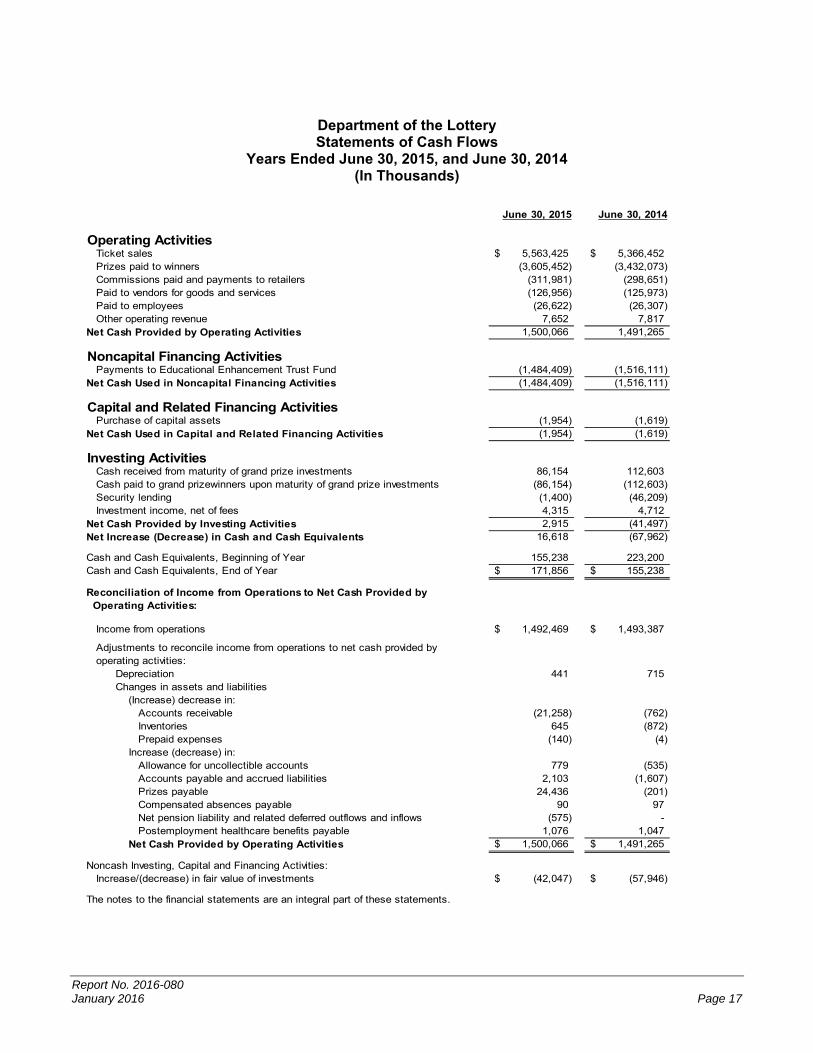
Report No. 2016-080 January 2016 Page 17
Department of the Lottery Statements of Cash Flows
Years Ended June 30, 2015, and June 30, 2014 (In Thousands)
June 30, 2015 June 30, 2014
Operating Activities Ticket sales 5,563,425$ 5,366,452$ Prizes paid to winners (3,605,452) (3,432,073) Commissions paid and payments to retailers (311,981) (298,651) Paid to vendors for goods and services (126,956) (125,973) Paid to employees (26,622) (26,307) Other operating revenue 7,652 7,817 Net Cash Provided by Operating Activities 1,500,066 1,491,265
Noncapital Financing Activities Payments to Educational Enhancement Trust Fund (1,484,409) (1,516,111) Net Cash Used in Noncapital Financing Activities (1,484,409) (1,516,111)
Capital and Related Financing Activities Purchase of capital assets (1,954) (1,619) Net Cash Used in Capital and Related Financing Activities (1,954) (1,619)
Investing Activities Cash received from maturity of grand prize investments 86,154 112,603 Cash paid to grand prizewinners upon maturity of grand prize investments (86,154) (112,603) Security lending (1,400) (46,209) Investment income, net of fees 4,315 4,712 Net Cash Provided by Investing Activities 2,915 (41,497) Net Increase (Decrease) in Cash and Cash Equivalents 16,618 (67,962)
Cash and Cash Equivalents, Beginning of Year 155,238 223,200 Cash and Cash Equivalents, End of Year 171,856$ 155,238$
Reconciliation of Income from Operations to Net Cash Provided by Operating Activities:
Income from operations 1,492,469$ 1,493,387$
Adjustments to reconcile income from operations to net cash provided by operating activities: Depreciation 441 715 Changes in assets and liabilities (Increase) decrease in: Accounts receivable (21,258) (762) Inventories 645 (872) Prepaid expenses (140) (4) Increase (decrease) in: Allowance for uncollectible accounts 779 (535) Accounts payable and accrued liabilities 2,103 (1,607) Prizes payable 24,436 (201) Compensated absences payable 90 97 Net pension liability and related deferred outflows and inflows (575) - Postemployment healthcare benefits payable 1,076 1,047 Net Cash Provided by Operating Activities 1,500,066$ 1,491,265$
Noncash Investing, Capital and Financing Activities: Increase/(decrease) in fair value of investments (42,047)$ (57,946)$
The notes to the financial statements are an integral part of these statements.

Report No. 2016-080 Page 18 January 2016
NOTES TO FINANCIAL STATEMENTS
SUMMARY OF SIGNIFICANT ACCOUNTING POLICIES
A. Reporting Entity
The State of Florida, Department of the Lottery (the Lottery) was established as a State agency with
the enactment of the Florida Public Education Lottery Act (the Act) in 1987. The purpose of the Act
is “to implement Section 15, Article X of the State Constitution in a manner that enables the people
of the State to benefit from significant additional moneys for education and also enables the people
of the State to play the best lottery games available.”
In evaluating the Lottery as a reporting entity, management has addressed all potential component
units for which the Lottery may be financially accountable and, as such, be includable in the Lottery’s
financial statements. The Lottery is financially accountable if it appoints a voting majority of the
organization’s governing board and (1) it is able to impose its will on the organization or (2) there is a
potential for the organization to provide specific financial benefit to or impose specific financial burden
on the Lottery. Additionally, the primary government is required to consider other organizations for
which the nature and significance of their relationship with the primary government is such that
exclusion would cause the reporting entity’s financial statements to be misleading or incomplete.
Management’s analysis has disclosed no component units that should be included in the Lottery’s
financial statements.
B. Basis of Presentation
The Lottery is accounted for as a proprietary type enterprise fund. Enterprise funds are used to
account for activities that are financed and operated in a manner similar to private business
enterprises: (1) where the costs of providing goods and services to the general public on a continuing
basis are to be financed through user charges; or (2) where the periodic determination of net income
is considered appropriate. The Lottery is reported as an enterprise fund within the State of Florida’s
Comprehensive Annual Financial Report.
C. Basis of Accounting
Basis of accounting refers to when the revenues, expenses, and related assets and liabilities are
recognized in the accounts and reported in the financial statements. The financial statements are
prepared on the accrual basis of accounting in accordance with generally accepted accounting
principles. Under this method, revenues are recognized when they are earned and expenses are
recognized when they are incurred.
The measurement focus of proprietary fund types is on a flow of economic resources method, which
emphasizes the determination of net income, financial position, and cash flows. All fund assets and
liabilities, current and noncurrent, are accounted for on the Statements of Net Position.
The Lottery’s operating revenues and expenses generally result from the sale and marketing of lottery
tickets and the payment of related prizes. All revenues and expenses not meeting this definition are
reported as nonoperating revenues and expenses.

Report No. 2016-080 January 2016 Page 19
D. Cash and Cash Equivalents
The Lottery considers all highly liquid investments with an original maturity of three months or less
when purchased to be cash equivalents. This includes cash in banks, repurchase agreements with
financial institutions, petty cash, balances held by the State Board of Administration (SBA), and
pooled investments in the State Treasury.
E. Investments
Florida Statutes authorize the Lottery to invest in certain instruments. The Lottery reports investments
at fair value. Investments that are not publicly quoted are priced by a third party through a discounted
cash flow method. Details of investments are included in Note II.
F. Allowance for Doubtful Accounts
The allowance for doubtful accounts is based on an analysis of collectability of accounts receivable,
which considers the age of the accounts.
G. Inventories
Supply inventory and promotional items are valued at cost, using the first-in, first-out method. Supply
inventory comprised game merchandise, prepaid postage, and prepaid tolls.
H. Prepaid Expenses
Prepaid expenses represent warranty agreements paid for during the current year but will not be
consumed or used up until a future period.
I. Capital Assets
Capital assets are stated at cost less accumulated depreciation. As required by Chapter 273, Florida
Statutes, a capitalization threshold of $1,000 and useful life extending beyond one year are employed
for tangible personal property. The Lottery’s capitalization threshold for intangible assets is $100,000.
Depreciation on all capital assets is computed using the straight-line method over the following
estimated useful lives:
Data processing equipment 3 to 5 years Office furniture and fixtures 3 to 15 years Vehicles and other equipment 3 to 20 years Software 3 to 15 years
When capital assets are retired or otherwise disposed of, the costs and related accumulated
depreciation are removed from the accounts and any resulting gain or loss is reflected in the
Statements of Revenues, Expenses, and Changes in Net Position in the period of disposal. See
Note V for more detailed information on capital assets.
J. Deferred Outflows of Resources
A consumption of net assets by the government that is applicable to a future reporting period is
presented as a deferred outflow of resources.

Report No. 2016-080 Page 20 January 2016
K. Long-term Liabilities
Refer to Note VII. for information on grand prizes payable, compensated absences payable,
postemployment healthcare benefits payable, and net pension liability, along with changes in
long-term liabilities. Also, refer to Note IX. for additional information on net pension liability and
postemployment healthcare benefits payable.
L. Compensated Absences
Employees earn the right to be compensated during absences for vacation, illness, and unused
special compensatory leave earned for hours worked on legal holidays. Compensated absences for
annual leave are recorded as a liability when the benefits are earned. Compensated absences for
sick leave are calculated based on the vesting method. Within the limits established by law or rule,
unused leave benefits are paid to employees upon separation from State service. The cost of
vacation and calculated sick leave benefits is accrued in the period in which the benefits are earned.
The compensated absences are based on current fiscal year-end salary rates and include employer
social security and pension contributions at current rates.
M. Deferred Inflows of Resources
A deferred inflow of resources is an acquisition of net assets by the government that is applicable to
a future reporting period.
N. Net Position
Net position includes categories for invested in capital assets, restricted for undistributed appreciation
on restricted investments, restricted for future prizes or special prize promotions, restricted for the
Multi-State Lottery Association (MUSL), and unrestricted net position resulting from liabilities for
which no cash payments will be made. See Note I.V. for more information on unrestricted net position.
The invested in capital assets category represents the investment in capital assets, recorded at cost
less accumulated depreciation.
The restricted for undistributed appreciation on restricted investments category represents the
undistributed appreciation for all restricted asset accounts.
The restricted for future prizes or special prize promotions category represents the portion of
unclaimed prize obligations legally reverted back to the Lottery and restricted for use in the payment
of future prize pools or special prize promotions in accordance with Section 24.115(2), Florida
Statutes.
The restricted for MUSL category represents the amount placed into reserve for the Florida Lottery
by the MUSL in accordance with Rule 53ER12-6, Florida Administrative Code. See Note VI. for more
information on MUSL.
O. Revenue Recognition
Lottery games are sold to the public by contracted retailers. Revenue is recognized when Terminal
game tickets are sold to players and when books of Scratch-Off tickets are settled. Certain games

Report No. 2016-080 January 2016 Page 21
include tickets that entitle the holder to exchange one ticket for another (free tickets). Such tickets
are deemed to be replacements and, therefore, are not included in ticket sales.
P. Commissions
Retailers receive a commission of 5 percent on ticket sales. The commission on ticket sales for
games is based upon total tickets distributed to the players (including free tickets) which, when
compared to revenue, causes the percentage to be slightly higher or lower than 5 percent at any
given time. Additionally, retailers are paid commissions through a 1 percent cashing bonus on
redemption of tickets (including free tickets).
Q. Prizes
In accordance with the Act, variable percentages of the gross revenue from the sale of Terminal and
Scratch-Off lottery tickets shall be returned to the public in the form of prizes paid by the Lottery or
retailers as authorized.
Prize expense for Terminal games is recorded based on prizes won by the players, as revenue is
recognized. Any prize that remains unclaimed at the end of a 180-day period following a draw is
considered unclaimed.
Prize expense for Scratch-Off games is recorded based on the predetermined prize structure for each
game, as revenue is recognized. Any prize that remains unclaimed 60 days after a Scratch-Off game
is closed is considered unclaimed.
Effective July 1, 2005, 80 percent of all unclaimed prize money is deposited in the Educational
Enhancement Trust Fund (EETF). The remaining 20 percent of unclaimed prize money is added to
the pool from which future prizes are to be awarded or used for special prize promotions and is
reported as restricted for future prizes or special prize promotions.
All prizes are recorded at the actual amount except for the annuity-funded prizes, which are paid out
on a deferred basis. The actual prize expense for these types of prizes is based on the present value
of an annuity using the interest yield on the investments acquired to fund the annuity.
R. Self-Insurance
The Lottery participates in the various self-insurance programs established by the State of Florida for
property and casualty losses and employee health insurance. Coverage includes property, general
liability, automobile liability, workers’ compensation, court-awarded attorney fees, and Federal civil
rights actions. The property insurance program self-insures the first $2 million per occurrence for all
perils except named windstorm and flood. For named windstorm and flood, the property insurance
program self-insures the first $2 million per occurrence but with an annual aggregate retention of
$40 million. Commercial excess insurance is purchased for losses over the self-insured retention up
to $54 million per occurrence for named windstorm and flood losses and $200 million per occurrence
for all other perils. Workers’ compensation is provided to comply with the applicable law. The
employee health and dental insurance program provides for payment of medical claims of employees
and covered dependents.

Report No. 2016-080 Page 22 January 2016
S. Use of Estimates
The preparation of financial statements in conformity with generally accepted accounting principles
requires management to make estimates and assumptions that affect the reported amounts of assets,
liabilities, restricted net position, revenues, and expenses, and disclosures of contingent assets and
liabilities. Actual results could differ from those estimates.
T. Bad Debt Expense
Bad debt expense is reported as a reduction in gross revenue. Bad debt expense is recognized when
a Lottery retailer’s uncollected revenue is past due. The amount of expense is based on an accounts
receivable age analysis. The bad debt expense for the fiscal years ended June 30, 2015, and
June 30, 2014, was $1,263,000 and $1,337,000, respectively.
U. Accounting Changes
The Lottery implemented GASB Statement No. 68, Accounting and Financial Reporting for Pensions,
an amendment of GASB Statement No. 27, and GASB Statement No. 71, Pension Transition for
Contributions Made Subsequent to the Measurement Date, an amendment of GASB Statement
No. 68. These standards require participants of cost-sharing multiple-employer defined benefit
pension plans to recognize their proportionate share of plans’ net pension liability and related deferred
outflows of resources and deferred inflows of resources. As a participant of the Florida Retirement
System and Retiree Health Insurance Subsidy Program defined benefit plans, implementation of
these standards required the Lottery to recognize its portion of the plans’ net pension liabilities and
related deferred outflows of resources and deferred inflows of resources on the Statements of Net
Position. Also, refer to Note IX. to the Notes to Financial Statements for further detail on the impact
of the implementation.
V. Unrestricted Net Position Deficit
The unrestricted net position deficit of $19,371,000 includes the cumulative effect of the Lottery’s
postemployment healthcare benefits, compensated absences, and net pension liabilities, along with
the deferred outflows of resources and deferred inflows of resources for pension related items. As a
result of these items being recorded for reporting purposes only and being excluded from the
calculation of transfers to the EETF, the effect is a deficit balance in unrestricted net position.
W. Net Position Restatement
Net position, June 30, 2014, as previously reported (in thousands) $97,661
Implementation effect of GASB Statement No. 68 (Refer to Note IX.) (10,998)
Net Position, June 30, 2014, as restated $86,663
CASH AND INVESTMENTS
A. Cash and Cash Equivalents
Cash is held in demand deposits at various financial institutions. These deposits, with a book value
of approximately $514,000 at June 30, 2015, and $370,000 at June 30, 2014, were insured by either

Report No. 2016-080 January 2016 Page 23
the State’s collateral for public deposits in accordance with Section 280.04, Florida Statutes, or
Federal depository insurance. Cash held in time deposits for the security lending program with a
book value of $13,600,000 were exposed to custodial credit risk as these balances were
uncollateralized and uninsured.
Chapter 280, Florida Statutes, generally requires public funds to be deposited in a Qualified Public
Depository, which is a bank or savings association that is designated by the State of Florida Chief
Financial Officer (State CFO) as authorized to receive deposits in the State and that meets the
collateral requirements. The State CFO determines the collateral requirements and collateral
pledging level for each Qualified Public Depository following guidelines outlined in Section 280.04,
Florida Statutes, and Chapter 69C-2, Florida Administrative Code. Collateral pledging levels include
25, 50, 110, and 150 percent of a Qualified Public Depository’s average daily deposit balance or, if
needed, an amount as prescribed by the State CFO. Collateral may be held by another custodian
with approval of the State CFO if conditions are met that protect the State’s interest. Eligible collateral
includes federal, federally-guaranteed, state and local government obligations, corporate bonds, and
other securities designated allowable under conditions set by the State CFO.
Florida Statutes provides that if a loss to public depositors is not covered by deposit insurance and
the proceeds from the sale of securities pledged by the defaulting depository, the difference will be
provided by an assessment levied against other Qualified Public Depositories of the same type as
the depository in default.
Due to the investing policy of the Lottery, book overdrafts were approximately $1,019,000 at
June 30, 2015, and $3,178,000 at June 30, 2014, representing outstanding prize payment checks
and retailer payment checks. These outstanding checks are included as a component of prizes
payable and accounts payable. The Lottery has an agreement with a financial institution to honor
prize payments and retailer payments, as they are presented to the bank, up to $75 million.
Surplus cash is maintained in the State Treasury’s general pool of investments. The State CFO pools
funds from all State agencies. Included in the pool are primarily time deposits, U.S. Government
securities, federal agency securities, commercial paper, corporate bonds and notes, and repurchase
agreements. The Lottery’s share of this investment pool was approximately $157,742,000 and
$139,868,000 at June 30, 2015, and 2014, respectively. No allocation will be made as to the Lottery’s
share of the types of investments or their risk categories. The Lottery’s share of the assets and
liabilities arising from the securities lending agreements administered by the State Treasury will
likewise not be carried on the Statements of Net Position since the State Treasury operates on a
pooled basis and to do so may give the misleading impression that the Lottery itself has entered into
such agreements. For further information, refer to the State of Florida’s Comprehensive Annual
Financial Report or publications of the State of Florida Department of Financial Services, Office of
the Chief Financial Officer.
B. Investments, Grand Prize
The grand prize investments primarily consist of U.S. Government obligations held on the Lottery’s
behalf by the SBA. Grand prize investments and related grand prizes payable are not presented in
current assets or liabilities. They are not part of current operations but instead are restricted assets
Report No. 2016-080 Page 24 January 2016
and liabilities that are held by the Lottery for grand prize winnings to be paid on a deferred basis if the
cash payment option is not selected.
Grand prize investments are shown at fair value, and the related grand prizes payable are adjusted
to the net present value using the yield on the investments. The difference between the fair value of
the investments and the net present value of the grand prizes payable is reflected as restricted for
undistributed appreciation on restricted investments in net position. This represents the unrealized
gains on the investments. Because these investments are held restrictively for grand prizewinners,
this balance is not available for transfer to the EETF.
Interest accreted on grand prize investments during the year is reflected as an increase in the carrying
value of grand prizes payable on the Statements of Net Position, and as a nonoperating revenue
(expense) on the Statements of Revenues, Expenses, and Changes in Net Position. Net appreciation
(depreciation) in fair value of investments is reflected as a nonoperating revenue (expense) on the
Statements of Revenues, Expenses, and Changes in Net Position, and takes into account all changes
in fair value that occurred during the year, including purchases, maturities, and sales.
C. Investments, Security Lending Collateral
These investments consist of the fair value of investments made with cash collateral held by the SBA
on the Lottery’s behalf as part of a securities lending program.
The SBA, authorized by Section 215.47, Florida Statutes, participates in a security lending program
involving grand prize investments. The Lottery, through the SBA, loans various securities to
borrowers for collateral with a simultaneous agreement to return collateral for the same securities in
the future. Collateral received from borrowers may be cash or U.S. Government securities. The SBA
is contractually limited from pledging or selling collateral except in the event of borrower default. The
contract with the lending agent requires it to indemnify the SBA if the borrowers fail to return the
underlying securities or fail to pay income distributions on them. No significant violations of legal or
contractual provisions occurred, and no losses resulted from borrower or lending agent defaults
during fiscal years 2014 and 2015.
The Bank of New York Mellon (Mellon) is the agent for lending U.S. Treasury securities to various
authorized brokers for cash or U.S. Government securities. Initially, collateral received shall be in the
form of cash at 100 percent, or other securities valued at 102 percent, of the fair value of the securities
loaned as required by the lending agreement. Borrowers must be approved for lending by Mellon’s
credit department. Mellon monitors the fair value of collateral provided and the securities on loan on
a daily basis. Additional collateral is required if the fair value of the collateral for any loan is less than
100 percent of the fair value of the securities provided for such loan. The SBA had no credit risk
exposure to borrowers at year-end.
The SBA had received $317,044,000 of cash collateral for the lending program as of June 30, 2015,
and $363,953,000 as of June 30, 2014. At June 30, 2015, and June 30, 2014, the collateral that was
held for the securities lending transactions exceeded the fair value of the securities underlying the
agreements (including accrued interest). The cash was invested in securities authorized by the
lending agreement. Authorized securities include primarily certificates of deposit, corporate and

Report No. 2016-080 January 2016 Page 25
medium term notes, asset-backed securities, and repurchase agreements. The invested cash
collateral generally has a shorter maturity than the securities on loan.
A risk factor associated with this lending agreement is the potential for declines in the value of the
invested holdings purchased with the cash collateral. If these investments must be liquidated, any
shortfall between the value of the investments and the securities lending obligation becomes the
responsibility of the Lottery. As of June 30, 2015, the unrealized shortfall was $13,100 and as of
June 30, 2014, the Lottery did not experience a shortfall.
Other risk factors associated with security lending include counterparty default and failure of the
custodial bank to indemnify the Lottery.
Securities lending income and expenses for the year ended June 30, 2015, and 2014, consisted of
(in thousands):
D. Investment Credit Risk
Lottery grand prizewinner investments have been limited to U.S. Government guaranteed securities.
Listed below are Standard and Poor’s (S&P) credit ratings for the lending program’s invested cash
collateral (in thousands):
As of June 30, 2015
Credit Ratings(1) Total
Certificates of Deposit
Commercial Paper
Domestic Corporate Bonds &
Notes
Domestic Non-
Government Asset-backed
Securities
International Corporate Bonds &
NotesRepurchase
Agreements(2)
AAA 45,070$ -$ -$ 4,400$ 40,670$ -$ -$
AA 54,457 8,099 - 25,130 - 18,306 2,922
A 14,308 - - 14,308 - - -
A-1 3,099 - 3,099 - - - -
Not Rated 75,232 24,000 - - 26,479 - 24,753
192,166 32,099$ 3,099$ 43,838$ 67,149$ 18,306$ 27,675$
Not Rated (2) 111,294 Repurchase agreements
303,460$ Total
Notes:
(1)
(2) Collateral for repurchase agreements that are explicitly guaranteed by the U.S. Government do not require disclosure of credit quality.
Ratings for investments are presented using S&P credit ratings. If S&P did not rate a security, including the collateral underlying repurchase agreements, the investments w ere presented as "Not Rated."
2015 2014Securities lending income 997$ 1,534$ Less broker rebates (447) (313) Less bank fees (58) (14) Net securities lending revenue 492$ 1,207$

Report No. 2016-080 Page 26 January 2016
As of June 30, 2014
Credit
Ratings (1) TotalCertificates of Deposit
Commercial Paper
Domestic Corporate Bonds &
Notes
Domestic Non-Government Asset-backed
Securities
International Corporate Bonds &
Notes
International Non-Government
Asset-backed Securities
Repurchase
Agreements(2)
AAA 25,390$ -$ -$ 9,044$ 16,346$ -$ -$ -$
AA 89,593 11,212 - 52,241 - 24,112 - 2,028
A 40,537 5,406 - 26,219 - 8,912 - -
A-1 25,803 - 25,803 - - - - -
Not Rated 121,351 97,734 8,802 8,101 5,129 - 1,222 363
302,674 114,352$ 34,605$ 95,605$ 21,475$ 33,024$ 1,222$ 2,391$
Not Rated (2) 46,307 Repurchase agreements
348,981$ Total
Notes: (1)
(2)
Ratings for investments are presented using S&P credit ratings. If S&P did not rate a security, including the collateral underlying repurchase agreements, the investments were presented as "Not Rated."
Collateral for repurchase agreements which are explicitly guaranteed by the U.S. Government do not require disclosure of credit quality.
The State Treasury Investment Pool’s current rating by S&P is A+f as of June 30, 2015.
E. Investment Interest Rate Risk
The investment policy objective is to match maturities of investments with the maturities of the Lottery
prizewinner annuities. Therefore, investments are held to maturity after they are purchased thereby
eliminating interest rate risk. Listed below are the Lottery’s investments in U.S. Treasury Strips (in
thousands):
As of June 30, 2015 As of June 30, 2014
Time to Maturity Fair Value
< 1 year 66,412$ > 1 year to 3 years 69,793 > 3 years to 5 years 37,425 > 5 years to 10 years 85,887 > 10 years to 15 years 83,095 > 15 years to 20 years 16,003 > 20 years to 25 years 9,134 > 25 years 4,517
Total 372,266$
Time to Maturity Fair Value
< 1 year 86,115$ > 1 year to 3 years 109,955 > 3 years to 5 years 42,903 > 5 years to 10 years 85,612 > 10 years to 15 years 70,014 > 15 years to 20 years 32,927 > 20 years to 25 years 8,618 > 25 years 5,359
Total 441,503$
The Lottery contracts with the SBA to execute the securities lending program. The securities lending
authorization agreement between Mellon and the SBA requires that the maximum weighted average
portfolio maturity not exceed 90 days. The lending program invests a significant amount of its assets
in floating rate securities and limits the maximum reset period for interest rate changes to six months.

Report No. 2016-080 January 2016 Page 27
Next reset dates are used in the calculation of weighted average maturity. Listed below are the
weighted average maturities for the lending program’s invested cash collateral:
Investment TypeFair Value
(Thousands)
Weighted Average Maturity (Days)
Fair Value(Thousands)
Weighted Average Maturity (Days)
Certificates of Deposit 32,099$ 55 114,352$ 55Commercial Paper 3,099 59 34,605 73Domestic Corporate Bonds & Notes 43,838 46 95,605 48Domestic Non-government Asset-backed Securities 67,149 19 21,475 23International Corporate Bonds & Notes 18,306 60 33,024 57International Non-government Asset-backed Securities - - 1,222 14Repurchase Agreements 138,969 1 48,698 1Total Fair Value 303,460$ 348,981$
Portfolio weighted average maturity 21 45
June 30, 2015 June 30, 2014
The effective duration of the State Treasury Investment Pool at June 30, 2015, and June 30, 2014,
was approximately 2.67 years and 2.57 years, respectively.
F. Investment Concentration of Credit Risk
Since all long-term investments (other than in the securities lending program) are in U.S. Government
guaranteed securities, the Lottery has not adopted a policy regarding concentration of credit risk. The
securities lending program has established investment concentration of credit risk policies that limit
the aggregate exposure to any one issuer or guarantor that is not the U.S. Government or guaranteed
by the U.S. Government to 10 percent of the book value of the lending program’s invested cash
collateral. No invested cash collateral exceeded the 10 percent limitation.
G. Investment Custodial Credit Risk
Custodial credit risk is defined as the risk that an entity may not recover securities held by another
party. The Lottery does not have a formal policy regarding custodial credit risk. The custodian for
the SBA-administered lending program is also the counterparty to the investment transactions.
Therefore, the amount of investments subject to investment custodial credit risk at June 30, 2015,
and June 30, 2014, was $303,460,000 and $348,981,000, respectively.
At June 30, 2015, and June 30, 2014, all non-lending investments held were either insured or
registered and held by the Lottery or its agents in the Lottery’s name and thus were not subject to
custodial credit risk.
H. Foreign Currency Risk
The Lottery had no exposure to foreign currency risk as of June 30, 2015, and June 30, 2014.

Report No. 2016-080 Page 28 January 2016
I. Investment Summary
The following schedule summarizes all investments and investments loaned under securities lending
agreements at June 30 (in thousands):
Investment TypeJune 30, 2015 Carrying Value
June 30, 2014 Carrying Value
Commercial Paper 3,099$ 34,605$
Certificates of Deposit 32,099 114,352
Repurchase Agreements 138,969 48,698
U.S. Government Obligations & Federally Guaranteed Obligations
61,881 84,598
Domestic Corporate Bonds & Notes 43,838 95,605
Domestic Non-government Asset-backed Securities 67,149 21,475
International Corporate Bonds & Notes 18,306 33,024
International Non-government Asset-backed Securities - 1,222
Investments Held by Others Under Securities Lending Agreements - U.S. Obligations
310,385 356,905
Pooled Investments with State Treasury 157,742 139,868
Total Investments 833,468$ 930,352$
The following schedules reconcile cash and investments to the Statements of Net Position at June 30
(in thousands):
Investments
Cash at Financial
Institutions
Cash at State
Treasury Totals
Cash and cash equivalents 136,213$ 376$ 108$ 136,697$ Restricted cash and cash equivalents 21,529 13,630 - 35,159 Investments, grand prize 372,266 - - 372,266 Investments, security lending collateral 303,460 - - 303,460 Totals 833,468$ 14,006$ 108$ 847,582$
June 30, 2015
Investments
Cash at Financial
Institutions
Cash at State
Treasury Totals
Cash and cash equivalents 124,276$ 326$ 27$ 124,629$ Restricted cash and cash equivalents 15,592 15,017 - 30,609 Investments, grand prize 441,503 - - 441,503 Investments, security lending collateral 348,981 - - 348,981 Totals 930,352$ 15,343$ 27$ 945,722$
June 30, 2014

Report No. 2016-080 January 2016 Page 29
ACCOUNTS RECEIVABLE
Accounts receivable as of June 30, consisted of (in thousands):
2015 2014Ticket sales receivable 68,422$ 48,972$ Other receivables 97 125 Total receivables 68,519 49,097 Less allowance for doubtful accounts (2,874) (2,094) Accounts receivable, net 65,645$ 47,003$
SECURITY DEPOSITS AND DEPOSITS PAYABLE
The Lottery receives certificates of deposit and cashier’s checks from certain vendors and retailers in
order to secure contract performance. Certificates of deposit are held in trust by the State with any
interest earnings being credited to the vendor or retailer. Cashier’s checks are held as cash by the
Lottery. These deposits are established to reduce the potential financial risk to the Lottery in the event
of a breach of contract. The certificates appear on the Statements of Net Position, in assets as security
deposits, and in liabilities, as deposits payable. The checks appear on the Statements of Net Position,
in assets as cash, and in liabilities, as deposits payable.
CAPITAL ASSETS
Changes in capital assets are summarized as follows (in thousands):
Balance Balance Balance30-Jun-13 Increase Decrease 30-Jun-14 Increase Decrease 30-Jun-15
Data processing equipment $ 3,407 $ 494 $ (95) $ 3,806 $ 325 $ (280) $ 3,851
Office equipment and fixtures 5,839 36 (1,570) 4,305 216 (190) 4,331
Vehicles and other equipment 3,541 325 (245) 3,621 1,249 (298) 4,572
Software and other intangibles 2,123 1,652 (920) 2,855 1,917 (1,772) 3,000
14,910 2,507 (2,830) 14,587 3,707 (2,540) 15,754
Less accumulated depreciation 11,695 747 (2,098) 10,344 441 (851) 9,934 Total capital assets, net $ 3,215 $ 1,760 $ (732) $ 4,243 $ 3,266 $ (1,689) $ 5,820
2013-14 2014-15
MULTI-STATE LOTTERY ASSOCIATION
MUSL is an unincorporated government-benefit voluntary association created for the purpose of
administering joint lottery games. MUSL included 34 state lottery entities, the District of Columbia, Puerto
Rico, and the Virgin Islands during fiscal year 2015. This association offers the Powerball with Powerplay,
Mega Millions with Megaplier, and several other Terminal games in participating states. The chief
executive officer of each member lottery serves on the MUSL board of directors.
As a member of MUSL, the Lottery is required to contribute to various prize reserve funds maintained by
MUSL. The prize reserve funds serve as a contingency reserve to protect MUSL from unforeseen prize
payments. MUSL periodically reallocates the prize reserve funds among the states based on relative
Powerball with Powerplay and Mega Millions with Megaplier sales levels. All remaining funds remitted,
and the related interest earnings (net of administrative costs), will be returned to the Lottery upon leaving
MUSL, less any portion of unanticipated prize claims that may have been paid from the fund.

Report No. 2016-080 Page 30 January 2016
As of June 30, 2015, and June 30, 2014, the Lottery had deposits with MUSL of $21,765,512, and
$19,817,102, respectively, representing the Lottery’s deposits of reserve funds.
A copy of the MUSL financial statements may be obtained by submitting a written request to MUSL, 4400
N.W. Urbandale Drive, Urbandale, Iowa 50322.
LONG-TERM LIABILITIES
A. Grand Prizes Payable
Grand prizes payable at June 30 consisted of (in thousands):
2015 2014FLORIDA LOTTO grand prizes (face value) 343,596$ 424,857$ MEGA MONEY grand prizes (face value) 8,303 8,058 Win for Life grand prizes (face value) 7,752 11,202 Flamingo Fortune Game Show grand prizes (face value) 300 400 Win a Million grand prizes (face value) 150 200 Lucky for Life grand prizes (face value) 20,550 20,050 Set for Life grand prizes (face value) 1,560 1,740 Cash Spectacular grand prizes (face value) 400 450 Cash for Life grand prizes (face value) 180 190 Loaded for Life grand prizes (face value) 2,550 2,650 Billion Dollar Blockbuster grand prizes (face value) 7,350 7,900 Gas for Life grand prizes (face value) 168 174 2 Million Dollar Casino Action grand prizes (face value) 1,500 1,600 Million Dollar Holiday grand prizes (face value) 800 850 Week for Life grand prizes (face value) 37,674 38,818 Monopoly grand prizes (face value) 3,320 3,510 Million Wishes grand prizes (face value) 850 900 X's The Cash grand prizes (face value) 3,590 3,770 $3 Million Flamingo grand prizes (face value) 2,700 2,850 Gold Rush grand prizes (face value) 8,460 2,850 Less imputed interest (131,187) (148,399) Net present value of grand prizes payable 320,566$ 384,620$
Current prizes payable from restricted assets 66,412$ 86,154$ Noncurrent prizes payable from restricted assets 254,154 298,466 Total grand prizes payable 320,566$ 384,620$

Report No. 2016-080 January 2016 Page 31
The following depicts by fiscal year the value (in thousands) of the grand prize annuities to pay
prizewinners:
Year Ending June 30 Amount2016 66,471$ 2017 44,909 2018 25,738 2019 19,833 2020 19,833 2021-2025 101,707 2026-2030 117,139 2031-2035 26,804 2036-2040 18,467 2041-2045 10,852 Grand prizes (face value) 451,753 Less imputed interest (131,187) Net present value of grand prizes payable 320,566$
B. Compensated Absences Payable
Compensated absences payable at June 30 consisted of (in thousands):
2015 2014
Current compensated absences 409$ 585$ Noncurrent compensated absences 3,455 3,189Total 3,864$ 3,774$
C. Changes in Long-Term Liabilities
Changes in long-term liabilities are summarized as follows (in thousands):
BalanceJune 30, 2014 Additions Reductions
BalanceJune 30, 2015
Amount Due Within One
Year
Grand prizes payable 384,620$ 23,897$ (87,951)$ 320,566$ 66,412$
Compensated absences payable 3,774 1,124 (1,034) 3,864 409
Postemployment healthcare benefits payable 4,009 1,076 - 5,085 -
Net pension liability - 12,758 (4,074) 8,684 192 Total long-term liabilities 392,403$ 38,855$ (93,059)$ 338,199$ 67,013$
2014-15
Balance June 30, 2013 Additions Reductions
BalanceJune 30, 2014
Amount Due Within One
Year
Grand prizes payable 456,193$ 41,030$ (112,603)$ 384,620$ 86,154$
Compensated absences payable 3,677 1,010 (913) 3,774 585
Postemployment healthcare benefits payable 2,962 1,047 - 4,009 - Total long-term liabilities 462,832$ 43,087$ (113,516)$ 392,403$ 86,739$
2013-14

Report No. 2016-080 Page 32 January 2016
See Note IX. for additional information regarding the net pension liability and the postemployment
healthcare benefits payable.
DUE TO EDUCATIONAL ENHANCEMENT TRUST FUND
In accordance with the Act, effective July 1, 2005, variable percentages of the gross revenue from the
sale of Terminal games and Scratch-Off lottery tickets as determined by the Lottery, and other earned
revenue, excluding application processing fees, shall be deposited in the EETF as provided in
Section 24.121, Florida Statutes, as amended. The amount transferred to the EETF was $1,496,371,000
for the fiscal year ended June 30, 2015, (26.8 percent of revenues), and $1,495,409,000 (27.8 percent
of revenues) for the fiscal year ended June 30, 2014.
Because the net appreciation in fair value of investments and amortization of grand prizes payable,
included in nonoperating revenue and expenses, relate to valuations of the restricted grand prize
investments and grand prizes payable, they are excluded from the determination of transfers to the EETF.
Effective July 1, 2005, provisions of the Act relating to the allocation of revenues for public education
were revised. The changes in the provisions were designed to maximize the transfers of moneys to the
EETF. These revisions resulted in changes in the methodology used to calculate the transfer based on
a business model of revenue minus expenses rather than a percent of revenue.

Report No. 2016-080 January 2016 Page 33
The amount due to the EETF at June 30, 2015, and June 30, 2014, was as follows (in thousands):
June 30, 2015 June 30, 2014
Terminal ticket sales 1,859,336$ 1,951,087$ Average percent transferred 37% 38%Transfer of Terminal ticket sales 1 688,241 744,066
Unclaimed Terminal ticket prizes 32,933 28,848 Percent transferred 80% 80%Transfer of unclaimed Terminal ticket prizes 26,346 23,078
Scratch-Off ticket sales 3,723,995 3,417,143 Average percent transferred 20% 20%Transfer of Scratch-Off ticket sales 1 750,341 692,063
Unclaimed Scratch-Off ticket prizes 14,737 31,012 Percent transferred 80% 80%Transfer of unclaimed Scratch-Off ticket prizes 11,790 24,810
Nonoperating revenues (expenses), net (1,218) (5,618) Add: Net (appreciation) depreciation in fair value of investments (12,604) (13,718) Amortization of grand prizes payable 18,040 22,911 Total Nonoperating revenues, net 4,218 3,575
Change in methodology for addressing postemployment healthcare expenses and compensated absences expenses 7,783 - Terminal fees and miscellaneous revenue 7,652 7,817
Due for the year 1,496,371 1,495,409
Balance due, beginning of year 55,409 76,111 Paid during the year (1,484,409) (1,516,111)
Due to Educational Enhancement Trust Fund, June 30 67,371$ 55,409$
1 Amounts do not foot due to rounding of average percent transferred.
PENSIONS AND OTHER POSTEMPLOYMENT BENEFITS
A. Retirement Programs
The Florida Department of Management Services (DMS) administers the State’s pension plans
referenced below. Financial statements and other required supplementary information for the plans
are included in the Florida Department of Management Services’ Florida Retirement System Pension
Plan and Other State-Administered Systems Comprehensive Annual Financial Report (Pension
CAFR). Copies of the Pension CAFR can be obtained from the DMS, Division of Retirement
(Division), Bureau of Research and Member Communications, P.O. Box 9000, Tallahassee, Florida
32315-9000; by telephone at 877-377-1888 or 850-907-6500; by e-mail at [email protected];
or at the Division’s Web site (www.frs.myflorida.com).
Florida Retirement System. The Florida Retirement System (FRS) is a State-administered
cost-sharing multiple-employer retirement plan administered by the DMS that offers members

Report No. 2016-080 Page 34 January 2016
(Regular Class, Special Risk Class, and Senior Management Service Class)1 an initial choice
between participating in a defined benefit plan (FRS Pension Plan) or a defined contribution plan
(FRS Investment Plan) and one additional choice to change plans before retirement. FRS provisions
are established by Chapters 121, 122, and 238, Florida Statutes; Chapter 112, Part IV, Florida
Statutes; and Florida Retirement System Rules, Chapter 60S, Florida Administrative Code; wherein
eligibility, required employer and employee contributions, and benefits are defined and described in
detail. Essentially, all employees of participating employers in regularly established positions must
be enrolled as members of the FRS or other non-integrated defined contribution plans in lieu of FRS
membership.
Benefits in the FRS Pension Plan vest at six years of service for members initially enrolled before
July 1, 2011, and at eight years for members initially enrolled on or after July 1, 2011. For members
initially enrolled before July 1, 2011, Special Risk Class members are eligible for normal retirement
benefits at age 55 and vested or after 25 years of service at any age. All other members initially
enrolled before July 1, 2011, are eligible for normal retirement benefits at age 62 and vested or at
any age after 30 years of service. For members initially enrolled on or after July 1, 2011, Special
Risk Class members are eligible for normal retirement benefits at age 60 and vested or after 30 years
of service at any age. All other members initially enrolled on or after July 1, 2011, are eligible for
normal retirement benefits at age 65 and vested or at any age after 33 years of service.
Early retirement is available but imposes a penalty for each year a member retires before his or her
normal retirement age. Retirement, disability, and death benefits are provided. Retirees with service
prior to July 1, 2011, receive annual cost-of-living adjustments. Retirees only with service accrued
on or after July 1, 2011, do not receive annual cost-of-living adjustments. Benefits are calculated at
retirement based on the age, years of service, accrual value by membership class, and average final
compensation (average of highest five fiscal years’ salaries if initially enrolled before July 1, 2011, or
the average of highest eight fiscal years’ salaries if initially enrolled on or after July 1, 2011).
Members of the FRS Pension Plan who reach normal retirement may participate in the Deferred
Retirement Option Program (DROP), subject to provisions of Section 121.091(13), Florida Statutes.
DROP participants are technically retired, deferring termination and receipt of monthly retirement
benefits for up to 60 months. During the period of DROP participation, deferred monthly benefits are
held in the FRS Trust Fund and accrue interest.
FRS Investment Plan benefits are established in Part II, Chapter 121, Florida Statutes, and
participation is available to all FRS members in lieu of the FRS Pension Plan. Members vest after
one year of creditable service for Investment Plan contributions. If an accumulated benefit obligation
for service credit originally earned under the FRS Pension Plan is transferred to the FRS Investment
Plan, six years of service (including the service credit represented by the transferred funds) is required
to be vested for these funds and the earnings on the funds. Benefits under the FRS Investment Plan
are based on the account balance at retirement composed of contributions plus investment gains less
investment losses and fees. Employer and employee contributions are a percentage of salary based
1 Regular Class includes members of the FRS who do not qualify for membership in the other classes. Special Risk Class includes members who are employed as law enforcement officers and the Senior Management Service Class includes members in senior management level positions.

Report No. 2016-080 January 2016 Page 35
on membership class. Contributions are directed to individual member accounts and the individual
members allocate contributions and account balances among various approved investment choices
offered under the plan.
The Florida Legislature established uniform contribution rates for participating FRS employees. FRS
employers pay the same contribution rate by membership class regardless of whether the members
participate in the FRS Pension Plan or FRS Investment Plan. Contribution rates as a percentage of
gross salary are as follows:
Employee Rate Fiscal Year
EndedJune 30, 2015
Employer Rate Fiscal Year
Ended
June 30, 2015(1)
Employee Rate Fiscal Year
EndedJune 30, 2014
Employer Rate Fiscal Year
Ended
June 30, 2014(1)
3.00 percent 21.14 percent 3.00 percent 18.31 percent3.00 percent 7.37 percent 3.00 percent 6.95 percent3.00 percent 19.82 percent 3.00 percent 19.06 percent
0.00 percent 12.28 percent 0.00 percent 12.84 percent
Note: (1)
Senior Management ServiceRegular Special Risk
DROP - Applicable to members from all of the above classes
Total employer contribution rates above include 1.26 percent and 1.20 percent for the fiscal yearsended June 30, 2015, and June 30, 2014, respectively, for the Retiree Health Insurance SubsidyProgram. Also, employer rates, other than for DROP participants, include 0.04 percent and 0.03percent for fiscal year ended June 30, 2015, and June 30, 2014, respectively, for administration costs ofthe financial education program and the FRS Investment Plan. Required employee contributions arededucted on a pre-tax basis.
Class
FRS Contributions and Contributions as a Percentage of Covered Payroll. The Lottery’s
employer contributions and contribution as a percentage of covered payroll for the FRS Pension Plan
and FRS Investment Plan for the fiscal years ended June 30, 2015, June 30, 2014, and
June 30, 2013, are as follows:
Fiscal Year Ended
June 30, 2015
Fiscal Year Ended
June 30, 2014
Fiscal Year Ended
June 30, 2013
1,354,333$ 1,184,595$ 673,580$ 328,836$ 297,945$ 178,175$
8.47% 7.28% 4.26%9.75% 8.67% 5.51%
FRS Pension PlanFRS Investment Plan
FRS Pension PlanFRS Investment Plan
Plan
Employer Contributions:
Contributions as a Percentage of Covered Payroll:
Senior Management Service Optional Annuity Program. Some Lottery employees also
participate in the Senior Management Service Optional Annuity Program (SMSOAP). Offered in lieu
of FRS participation, the SMSOAP is a defined contribution plan that provides retirement and death
benefits to the participant pursuant to Section 121.055, Florida Statutes. Participants have full and
immediate vesting of all contributions paid on their behalf to the participating provider companies to
invest as directed by the participants. Employees in eligible State positions may make an irrevocable

Report No. 2016-080 Page 36 January 2016
election to participate in the SMSOAP in lieu of the Senior Management Service Class. Employers
contributed 6.27 percent of covered payroll for July 2012 through June 2015. This contribution rate
includes a contribution that would otherwise be paid to the Retiree Health Insurance Subsidy Program
(HIS) described below so the SMSOAP retiree is not eligible to receive monthly HIS benefits. A
participant may contribute by salary reduction an amount not to exceed the percentage contributed
by the employer. The Lottery’s contributions for the fiscal years ended June 30, 2015, June 30, 2014,
and June 30, 2013, totaled $40,134, $33,575, and $13,103 respectively.
Retiree Health Insurance Subsidy Program. The HIS was created by the Florida Legislature in
1987 to assist FRS retirees in paying health insurance costs. HIS is a non-qualified, cost-sharing
multiple-employer defined benefit pension plan established under Section 112.363, Florida Statutes.
For the fiscal years ended June 30, 2015, 2014, and 2013, eligible retirees or beneficiaries received
a monthly HIS payment equal to the number of years of creditable service completed at the time of
retirement multiplied by $5. The payments to individual retirees or beneficiaries were at least $30 but
not more than $150 per month. To be eligible to receive HIS, an FRS retiree must apply for the
benefit, certify health insurance coverage, which can include Medicare or TRICARE, and be
approved.
HIS is funded by required contributions from FRS participating employers. For the fiscal years ended
June 30, 2015, 2014, and 2013, required contributions were 1.26 percent, 1.20 percent, and
1.11 percent, respectively, of payroll for all active employees covered by the FRS, pursuant to Section
112.363, Florida Statutes. For the fiscal years ended June 30, 2015, 2014, and 2013, the Lottery
contributed $215,070, $197,280, and $173,089, respectively, in employer contributions to the HIS.
HIS contributions are deposited in a DMS trust fund from which HIS payments are authorized.
HIS benefits are not guaranteed and are subject to legislative appropriation. If these contributions or
appropriation fail to provide full subsidy benefits to all participants, the Legislature may reduce or
cancel the subsidy payments.
Deferred Compensation Plan. The Lottery, through the State of Florida, offers its employees a
deferred compensation plan created in accordance with Section 457 of the Internal Revenue Code.
The plan (refer to Section 112.215, Florida Statutes), available to all regular payroll State employees,
permits them to defer a portion of their salaries until future years. The deferred compensation is not
available to employees until termination, retirement, death, or an unforeseen emergency.
All amounts of compensation deferred under the plan, all property and rights purchased with those
amounts, and all income attributable to those amounts, property, or rights are held in trust for the
exclusive benefit of participants and their beneficiaries as mandated by 26 USC 457(g)(1).
The Lottery does not contribute to the plan. Participation under the plan is solely at the discretion of
the employee.
The State has no liability for losses under the plan but does have the duty of due care that would be
required of an ordinary and prudent investor. Pursuant to Section 112.215, Florida Statutes, the
Deferred Compensation Trust Fund is created in the State Treasury.
Pension Liabilities, Pension Expense, and Deferred Outflows of Resources and Deferred
Inflows of Resources Related to Pensions. Effective July 1, 2014, the Lottery implemented the
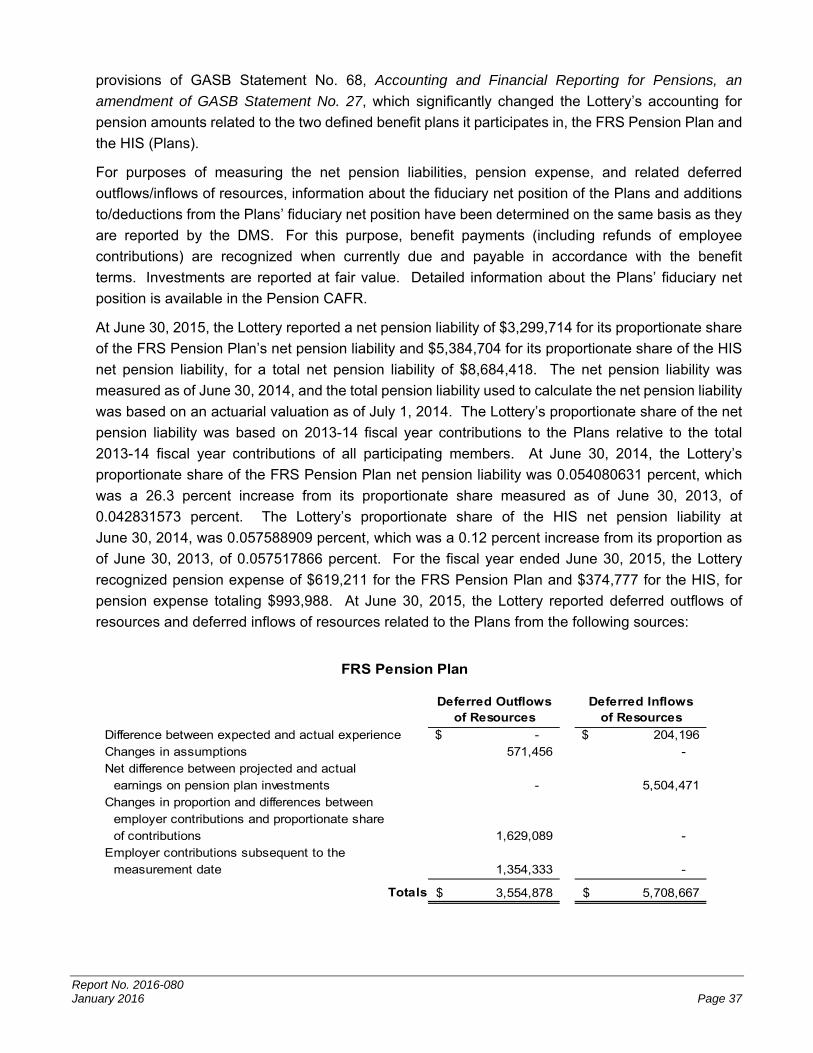
Report No. 2016-080 January 2016 Page 37
provisions of GASB Statement No. 68, Accounting and Financial Reporting for Pensions, an
amendment of GASB Statement No. 27, which significantly changed the Lottery’s accounting for
pension amounts related to the two defined benefit plans it participates in, the FRS Pension Plan and
the HIS (Plans).
For purposes of measuring the net pension liabilities, pension expense, and related deferred
outflows/inflows of resources, information about the fiduciary net position of the Plans and additions
to/deductions from the Plans’ fiduciary net position have been determined on the same basis as they
are reported by the DMS. For this purpose, benefit payments (including refunds of employee
contributions) are recognized when currently due and payable in accordance with the benefit
terms. Investments are reported at fair value. Detailed information about the Plans’ fiduciary net
position is available in the Pension CAFR.
At June 30, 2015, the Lottery reported a net pension liability of $3,299,714 for its proportionate share
of the FRS Pension Plan’s net pension liability and $5,384,704 for its proportionate share of the HIS
net pension liability, for a total net pension liability of $8,684,418. The net pension liability was
measured as of June 30, 2014, and the total pension liability used to calculate the net pension liability
was based on an actuarial valuation as of July 1, 2014. The Lottery’s proportionate share of the net
pension liability was based on 2013-14 fiscal year contributions to the Plans relative to the total
2013-14 fiscal year contributions of all participating members. At June 30, 2014, the Lottery’s
proportionate share of the FRS Pension Plan net pension liability was 0.054080631 percent, which
was a 26.3 percent increase from its proportionate share measured as of June 30, 2013, of
0.042831573 percent. The Lottery’s proportionate share of the HIS net pension liability at
June 30, 2014, was 0.057588909 percent, which was a 0.12 percent increase from its proportion as
of June 30, 2013, of 0.057517866 percent. For the fiscal year ended June 30, 2015, the Lottery
recognized pension expense of $619,211 for the FRS Pension Plan and $374,777 for the HIS, for
pension expense totaling $993,988. At June 30, 2015, the Lottery reported deferred outflows of
resources and deferred inflows of resources related to the Plans from the following sources:
Deferred Outflowsof Resources
Deferred Inflowsof Resources
Difference between expected and actual experience -$ 204,196$ Changes in assumptions 571,456 - Net difference between projected and actual
earnings on pension plan investments - 5,504,471 Changes in proportion and differences between
employer contributions and proportionate shareof contributions 1,629,089 -
Employer contributions subsequent to the measurement date 1,354,333 -
Totals 3,554,878$ 5,708,667$
FRS Pension Plan

Report No. 2016-080 Page 38 January 2016
Deferred Outflowsof Resources
Difference between expected and actual experience -$
Changes in assumptions 191,609
Net difference between projected and actual
earnings on pension plan investments 2,585
Changes in proportion and differences between
employer contributions and proportionate share
of contributions 5,327
Employer contributions subsequent to the
measurement date 215,070
Total 414,591$
HIS
The Lottery’s contributions subsequent to the measurement date of $1,354,333 for the FRS Pension
Plan and $215,070 for the HIS are reported as deferred outflows of resources and will be recognized
as a reduction of the total net pension liability in the fiscal year ended June 30, 2016. Other amounts
reported as deferred outflows of resources and deferred inflows of resources related to pensions will
be recognized in pension expense as follows:
Year Ending June 30FRS
Pension Plan HIS Totals2016 (735,224)$ 27,989$ (707,235)$ 2017 (735,224) 27,989 (707,235) 2018 (735,224) 27,989 (707,235) 2019 (735,224) 27,989 (707,235) 2020 (735,224) 27,989 (707,235)
2021 - 2023 167,996 59,579 227,575
(3,508,124)$ 199,524$ (3,308,600)$
Actuarial Methods and Assumptions. Actuarial assumptions for both defined benefit cost-sharing
plans, the FRS Pension Plan and the HIS, are reviewed annually by the Florida Retirement System
Actuarial Assumptions Conference. The most recent experience study for the FRS Pension Plan was
completed in 2014 for the period July 1, 2008, through June 30, 2013. Because the HIS is funded on
a pay as you go basis, no experience study has been completed for this program.
The total pension liability for each of the defined benefit plans was determined by an actuarial
valuation as of July 1, 2014, using the entry age normal actuarial cost method. Inflation increases for
both plans is assumed at 2.60 percent. Payroll growth for both Plans is assumed at 3.25 percent.
Both the discount rate and the long-term expected rate of return used for FRS Pension Plan
investments are 7.65 percent. The projection of cash flows used to determine the discount rate
assumed that employee contributions will be made at the current contribution rate and that
contributions from participating employers will be made at the statutorily required rates. Based on
these assumptions, the FRS Pension Plan’s fiduciary net position was projected to be available to
make all projected future benefit payments to current active and inactive employees. Therefore, the

Report No. 2016-080 January 2016 Page 39
discount rate for calculating the total pension liability is equal to the long-term expected rate of return
and was applied to all periods of projected benefit payments to determine the total pension liability.
Because the HIS uses a pay-as-you-go funding structure, a municipal bond rate of 4.29 percent was
used to determine the total pension liability for the plan. Mortality assumptions for both plans were
based on the Generational RP-2000 with Projection Scale BB tables (refer to the valuation reports at
www.frs.myflorida.com for more information).
There were no changes in benefit terms for either the FRS Pension Plan or the HIS that affected the
total pension liability since the prior measurement date. There were no changes between the
measurement date and the reporting date which significantly impact the Lottery’s proportionate share
of the net pension liability, deferred outflows of resources, deferred inflows of resources, and pension
expense for either the FRS Pension Plan or the HIS.
The following changes in actuarial assumptions occurred in 2014:
FRS Pension Plan: As of June 30, 2014, the inflation rate assumption was decreased from 3.00 percent to 2.60 percent, the real payroll growth assumption was decreased from 1.00 percent to 0.65 percent, and the overall payroll growth rate assumption was decreased from 4.00 percent to 3.25 percent. The long-term expected rate of return decreased from 7.75 percent to 7.65 percent.
HIS: The municipal rate used to determine total pension liability decreased from 4.63 percent to 4.29 percent.
The long-term expected rate of return on FRS Pension Plan investments was determined using a
forward-looking capital market economic model, which includes an adjustment for the inflation
assumption. The target allocation and best estimates of arithmetic real rates of return for each major
asset class are summarized in the following table:
Long-Term Expected Real Rate of Return
Cash 1.00% 3.11%Intermediate-term bonds 18.00% 4.18%High yield bonds 3.00% 6.79%Broad U.S. equities 26.50% 8.51%Developed foreign equities 21.20% 8.66%Emerging market equities 5.30% 11.58%Private equity 6.00% 11.80%Hedge funds / absolute return 7.00% 5.81%Real estate (property) 12.00% 7.11%
100.00%
Asset ClassTarget
Allocation
Sensitivity Analysis. The following tables demonstrate the sensitivity of the net pension liability to
changes in the discount rate. The sensitivity analysis shows the impact to the Lottery’s proportionate
share of each plan’s net pension liability if the discount rate was 1.00 percent higher or 1.00 percent
lower than the current discount rate at June 30, 2014.

Report No. 2016-080 Page 40 January 2016
1% Decrease6.65%
Current Discount Rate
7.65%1% Increase
8.65%1% Decrease
3.29%
Current Discount Rate
4.29%1% Increase
5.29%
14,113,315$ 3,299,714$ (5,695,138)$ 6,124,664$ 5,384,704$ 4,767,048$
FRS Pension Plan HIS
B. Postemployment Healthcare Benefits
The Lottery participates in the State Employees’ Health Insurance Program, a cost-sharing
multiple-employer defined benefit postemployment healthcare plan administered by the DMS,
Division of State Group Insurance, to provide group health benefits. Section 110.123, Florida
Statutes, provides that retirees may participate in the State’s group health insurance programs and
assigns the authority to establish and amend benefit provisions to the DMS. Although premiums are
paid by the retiree, the premium cost to the retiree is implicitly subsidized by the commingling of
claims experience in a single risk pool with a single premium determination. An actuarial valuation
has been performed for the plan and the Lottery’s employees were included in the actuarial analysis.
For more information on the plan regarding the funding policy and actuarial methods and
assumptions, see the State of Florida’s Comprehensive Annual Financial Report, which is available
from the Department of Financial Services.
In accordance with GASB Codification Section Po50, Postemployment Benefit Plans Other Than
Pension Plans - Defined Benefit, the Lottery is required to record its portion of the implicit
postemployment health benefit liability. Postemployment health benefits payable at June 30, 2015,
June 30, 2014, and June 30, 2013, was $5,085,000, $4,009,000, and $2,962,000, respectively.
OPERATING LEASES
The Lottery has entered into operating leases for the rental of office and warehouse space for the
headquarters and district offices. Certain leases are renewable at the option of the Lottery.
Future minimum rental payments as of June 30, 2015, are scheduled as follows (in thousands):
Year Ending June 30 Headquarters Districts Total2016 2,744$ 1,077$ 3,821$ 2017 2,772 1,115 3,887 2018 2,801 1,149 3,950 2019 234 1,187 1,421 2020 - 1,032 1,032
2021-2025 - 4,085 4,085 2026-2030 - 4,183 4,183 2031-2034 - 2,308 2,308
Total 8,551$ 16,136$ 24,687$
Rental expense under all operating leases totaled approximately $4,017,000 and $4,075,000 for the fiscal
years ended June 30, 2015, and 2014, respectively.

Report No. 2016-080 January 2016 Page 41
VENDOR SUPPORT FUNDS
Each of the gaming vendor contracts requires the vendors to provide a fund for marketing support
activities as directed by the Lottery. The vendors are required to make deposits into the designated
accounts either weekly or monthly and distribute the funds as directed by the Lottery. The funds are
used for market research and other expenses directly linked to product sales. Vendor balances
committed for marketing research vary with timing of marketing initiatives, industry developments, and
changes in technology. Actual cash balances for these funds at June 30, 2006, through June 30, 2015,
ranged from $1,058,000 to $3,874,000. Each contract requires that any funds remaining in the accounts
at the end of each contract’s term will be returned to the Lottery for transfer to the EETF. Historically, no
balances have reverted to the Lottery. The contract with IGT, formerly GTech, was extended in
June 2015. The contract with Scientific Games was renewed in September 2013.
Vendor support fund activities are summarized as follows (in thousands):
BalanceJune 30, 2014 Additions Deletions
BalanceJune 30, 2015
GTech/IGT 155$ 360$ (286)$ 229$ Scientific Games 903 5,201 (4,264) 1,840
Total Vendor Support 1,058$ 5,561$ (4,550)$ 2,069$
BalanceJune 30, 2013 Additions Deletions
BalanceJune 30, 2014
GTech 340$ 360$ (545)$ 155$ Scientific Games 2,155 4,290 (5,542) 903
Total Vendor Support 2,495$ 4,650$ (6,087)$ 1,058$
2014-15 Vendor Support Funds
2013-14 Vendor Support Funds
OTHER COMMITMENTS
The Lottery has contractual agreements under which Terminal and Scratch-Off lottery game vendors
provide gaming systems, tickets, and related services. The Lottery’s Terminal gaming vendor is
compensated at a rate of 1.0699 percent of net Terminal game ticket sales. The vendor’s compensation
for Terminal games and for the provision of full service vending machines for the fiscal years ended
June 30, 2015, and 2014, was $29,970,000 and $28,895,000, respectively.
The Lottery’s Scratch-Off ticket vendor is currently compensated at rates that range from .09776 percent
to 2.1997 percent based on ticket price points and total annual sales. Compensation under this
agreement and the agreement for the provision of instant ticket vending machines amounted to
$51,665,000 for the fiscal year ended June 30, 2015, and $48,157,000 for the fiscal year ended
June 30, 2014.

Report No. 2016-080 Page 42 January 2016
LITIGATION
The Lottery is involved in litigation and other claims incidental to the ordinary course of its operations. In
the opinion of Lottery management, based on the advice of legal counsel, the ultimate disposition of these
lawsuits and claims will not have a material adverse effect on the financial position of the Lottery.

Report No. 2016-080 January 2016 Page 43
OTHER REQUIRED SUPPLEMENTARY INFORMATION
2014(2)
Lottery's proportion of the net pension liability 0.054080631%Lottery's proportionate share of the net pension liability 3,299,714$ Lottery's covered-employee payroll 16,266,000$ Lottery's proportionate share of the net pension liability as a percentage of its covered-employee payroll
20.29%
Plan fiduciary net position as a percentage of the total pension liability 96.09%
(2) The amounts presented for the fiscal year were determined as of 6/30.
2015(2) 2014(2)
Contractually required contribution 1,354,333$ 1,184,595$ Contributions in relation to the contractually required contribution (1,354,333)$ (1,184,595)$ Contribution deficiency (excess) -$ -$
Lottery's covered-employee payroll 15,985,814$ 16,266,000$ Contributions as a percentage of covered-employee payroll 8.47% 7.28%
(2) The amounts presented for the fiscal year were determined as of 6/30.
(1) This schedule is intended to report information for ten years. Additional information will be displayed as it becomes available.
(1) This schedule is intended to report information for ten years. Additional information will be displayed as it becomes available.
FLORIDA RETIREMENT SYSTEMSchedule of the Lottery's Proportionate Share of the Net Pension Liability
and Related Ratios
Last Ten Fiscal Years (1)
Schedule of the Lottery's Contributions
Last Ten Fiscal Years(1)

Report No. 2016-080 Page 44 January 2016
2014(2)
Lottery's proportion of the net pension liability 0.057588909%Lottery's proportionate share of the net pension liability 5,384,704$ Lottery's covered-employee payroll 16,175,000$ Lottery's proportionate share of the net pension liability as a percentage of its covered-employee payroll 33.29%Plan fiduciary net position as a percentage of the total pension liability 0.99%
(2) The amounts presented for the fiscal year were determined as of 6/30.
2015(2) 2014(2)
Contractually required contribution 215,070$ 197,280$ Contributions in relation to the contractually required contribution (215,070)$ (197,280)$ Contribution deficiency (excess) -$ -$
Lottery's covered-employee payroll 15,969,897$ 16,175,000$ Contributions as a percentage of covered-employee payroll 1.35% 1.22%
(2) The amounts presented for the fiscal year were determined as of 6/30.
(1) This schedule is intended to report information for ten years. Additional information will be displayed as it becomes available.
RETIREE HEALTH INSURANCE SUBSIDY PROGRAMSchedule of the Lottery's Proportionate Share of Net Pension Liability
and Related Ratios
Last Ten Fiscal Years (1)
(1) This schedule is intended to report information for ten years. Additional information will be displayed as it becomes available.
Schedule of the Lottery's ContributionsLast Ten Fiscal Years(1)

Report No. 2016-080 January 2016 Page 45
Phone: (850) 412-2722 Fax: (850) 488-6975
Sherrill F. Norman, CPA Auditor General
AUDITOR GENERAL STATE OF FLORIDA Claude Denson Pepper Building, Suite G74
111 West Madison Street Tallahassee, Florida 32399-1450
The President of the Senate, the Speaker of the House of Representatives, and the Legislative Auditing Committee
INDEPENDENT AUDITOR’S REPORT ON INTERNAL CONTROL OVER
FINANCIAL REPORTING AND ON COMPLIANCE AND OTHER MATTERS
BASED ON AN AUDIT OF FINANCIAL STATEMENTS PERFORMED
IN ACCORDANCE WITH GOVERNMENT AUDITING STANDARDS
Report on the Financial Statements
We have audited, in accordance with auditing standards generally accepted in the United States of
America and the standards applicable to financial audits contained in Government Auditing Standards
issued by the Comptroller General of the United States, the financial statements of the Department of the
Lottery (Lottery), as of and for the fiscal year ended June 30, 2015, and the related notes to the financial
statements, which collectively comprise the Lottery’s basic financial statements, and have issued our
report thereon dated January 29, 2016, included under the heading INDEPENDENT AUDITOR'S
REPORT.
Internal Control over Financial Reporting
We have examined the effectiveness of the Lottery’s internal control over financial reporting as of
June 30, 2015, based on criteria established in Internal Control – Integrated Framework issued by the
Committee of Sponsoring Organizations of the Treadway Commission (COSO). The Lottery’s
management is responsible for maintaining effective internal control over financial reporting and for its
assertion of the effectiveness of internal control, included in the accompanying MANAGEMENT’S
REPORT ON INTERNAL CONTROL OVER FINANCIAL REPORTING. Our responsibility is to express
an opinion on the effectiveness of internal control over financial reporting based on our examination.
We conducted our examination in accordance with attestation standards established by the American
Institute of Certified Public Accountants, and the standards applicable to attestation engagements
contained in Government Auditing Standards issued by the Comptroller General of the United States.
Those standards require that we plan and perform the examination to obtain reasonable assurance about
whether effective internal control over financial reporting was maintained in all material respects. Our
examination included obtaining an understanding of the internal control over financial reporting,
assessing the risk that a material weakness exists, and testing and evaluating the design and operating

Report No. 2016-080 Page 46 January 2016
effectiveness of internal control based on the assessed risk. Our examination also included performing
such other procedures as we considered necessary in the circumstances. We believe that our
examination provides a reasonable basis for our opinion.
An entity’s internal control over financial reporting is a process effected by those charged with
governance, management, and other personnel, designed to provide reasonable assurance regarding
the preparation of reliable financial statements in accordance with accounting principles generally
accepted in the United States of America. An entity's internal control over financial reporting includes
those policies and procedures that (1) pertain to the maintenance of records that, in reasonable detail,
accurately and fairly reflect the transactions and dispositions of the assets of the entity; (2) provide
reasonable assurance that transactions are recorded as necessary to permit preparation of financial
statements in accordance with accounting principles generally accepted in the United States of America,
and that receipts and expenditures of the entity are being made only in accordance with authorizations
of management and those charged with governance; and (3) provide reasonable assurance regarding
prevention, or timely detection and correction of unauthorized acquisition, use, or disposition of the
entity's assets that could have a material effect on the financial statements.
Because of its inherent limitations, internal control may not prevent, or detect and correct misstatements.
Also, projections of any evaluation of effectiveness to future periods are subject to the risk that the internal
control may become inadequate because of changes in conditions, or that the degree of compliance with
the policies or procedures may deteriorate.
In our opinion, the Lottery maintained, in all material respects, effective internal control over financial
reporting as of June 30, 2015, based on the criteria established in Internal Control – Integrated
Framework issued by COSO. We did note an additional matter involving the internal control over financial
reporting, which is discussed in the SCHEDULE OF FINDINGS.
Compliance and Other Matters
As part of obtaining reasonable assurance about whether the Lottery’s financial statements are free from
material misstatement, we performed tests of its compliance with certain provisions of laws, rules,
regulations, and contracts, noncompliance with which could have a direct and material effect on the
determination of financial statement amounts. However, providing an opinion on compliance with those
provisions was not an objective of our audit, and accordingly, we do not express such an opinion. The
results of our tests disclosed no instances of noncompliance or other matters that are required to be
reported under Government Auditing Standards. However, we noted an additional matter, which is
discussed in the accompanying SCHEDULE OF FINDINGS.
The Lottery’s response to the findings described in the SCHEDULE OF FINDINGS section of this report
is included in this report under the heading MANAGEMENT’S RESPONSE. We did not audit the
Lottery’s response, and accordingly, we express no opinion on it.
Purpose of the Report
The purpose of the INDEPENDENT AUDITOR’S REPORT ON INTERNAL CONTROL OVER
FINANCIAL REPORTING AND ON COMPLIANCE AND OTHER MATTERS BASED ON AN AUDIT
OF FINANCIAL STATEMENTS PERFORMED IN ACCORDANCE WITH GOVERNMENT AUDITING

Report No. 2016-080 January 2016 Page 47
STANDARDS is solely to describe the scope of our testing of internal control and compliance and the
result of that testing, and to provide an opinion on the effectiveness of the Lottery’s internal control. This
report is an integral part of an audit performed in accordance with Government Auditing Standards in
considering the Lottery’s internal control and compliance. Accordingly, this report is not suitable for any
other purpose.
Respectfully submitted,
Sherrill F. Norman, CPA Tallahassee, Florida January 29, 2016

Report No. 2016-080 Page 48 January 2016
MANAGEMENT’S REPORT ON INTERNAL CONTROL OVER FINANCIAL REPORTING

Report No. 2016-080 January 2016 Page 49
SCHEDULE OF FINDINGS
ADDITIONAL MATTERS
Finding 1: Information Technology Controls
Information technology (IT) controls are intended to protect the confidentiality, integrity, and availability
of data and IT resources. During our audit, we identified the need for enhancements to the Lottery’s
IT control practices in one area which was also identified in the prior audit. To avoid the possibility of
compromising Lottery information, specific details of this issue are not disclosed in this report. However,
the appropriate Lottery personnel have been notified of this issue.
Recommendation: We recommend that Lottery management make the necessary IT control enhancements to address the issue identified.
Finding 2: Minority Retailer Participation
Section 24.113, Florida Statutes, requires that 15 percent of the Lottery’s retailers be minority business
enterprises, as defined in Section 288.703(3), Florida Statutes; however, no more than 35 percent of
such retailers shall be owned by the same type of minority person, as defined by Section 288.703(4),
Florida Statutes.
Our audit disclosed that as of July 1, 2015, retailers comprising one minority type totaled approximately
67 percent of the total number of minority retailers. A similar finding has been included in previous Auditor
General reports.
The Lottery has developed an outreach program to increase retailer participation in under-represented
minority groups; however, despite these efforts, the overall level of participation from these groups
decreased slightly over the prior fiscal year.
Recommendation: We recommend that the Lottery continue its efforts to increase retailer participation in under-represented minority groups.

Report No. 2016-080 Page 50 January 2016
MANAGEMENT’S RESPONSE