audited financial statements 2016 - wbho.co.za · wbho consolidated financial statements 2016 1...
TRANSCRIPT

A
NOTES TO THE FINANCIAL STATEMENTS (continued)for the year ended 30 June 2016
01
AUDITED FINANCIAL STATEMENTS 2016

WBHO CONSOLIDATED FINANCIAL STATEMENTS 2016
1
Statement of responsibility by the Board 2
Directors’ report 3
Independent auditor’s report 5
Consolidated statement of financial performance and other comprehensive income 6
Consolidated statement of financial position 7
Consolidated statement of changes in equity 8
Consolidated statement of cash flows 10
Principal accounting policies 11
Notes to the consolidated financial statements 20
Company annual financial statements 53
Annexures 56
CONTENTS

2
WBHO CONSOLIDATED FINANCIAL STATEMENTS 2016
3
STATEMENT OF RESPONSIBILITY BY THE BOARDfor the year ended 30 June 2016
DIRECTORS’ REPORTfor the year ended 30 June 2016
NATURE OF BUSINESSThe company is listed on the securities exchange operated by JSE Limited and is the holding company of a number of subsidiary companies principally engaged in civil engineering and building contracting activities in the Republic of South Africa and internationally.
GROUP RESULTSRevenue from continuing operations increased by 6,3% to R30,7 billion (2015: R28,8 billion) while operating profit before non-trading items increased by 30,7% to R1 billion (2015: R768 million). Total earnings attributable to the equity shareholders of the group amounted to R726 million (2015: R566 million) and headline earnings attributable to equity shareholders of the group amounted to R710 million (2015: R646 million). A full reconciliation between earning and headline earnings is disclosed under note 20. The financial statements set out on pages 6 to 57 provide full details of the financial position, results of operations and cash flows for the year ended 30 June 2016.
SUBSIDIARIESDetails of the group’s principal subsidiary companies are included within annexure 1. A full list of subsidiary companies is available on request from the company secretary.
The holding company is an investment company and consequently all profits recognised within the consolidated statement of financial performance were earned by subsidiary companies.
Transactions with minority shareholders during the year under review resulted in an increase in the group’s interest in Probuild from 80,57% to 83,02% at a cost of R37 million. Debit amounts of R14,5 million were recognised in equity. WBHO Construction increased its interest in Renniks Construction by 12,5% to 82,5% at a cost of R6 million. A debit of R1 million was recognised in equity.
LOSSES IN SUBSIDIARIESThere were no material losses from subsidiaries included in the group’s profit before tax.
SHARE CAPITALThe company has issued 63 190 064 ordinary shares. During the year the company bought back and cancelled 2 809 936 shares from Akani Investment Holdings (Pty) Ltd in terms of the Circular issued on 11 October 2006.
Subject to the regulations of the JSE, 10% of the unissued ordinary shares are under the control of the directors until the annual general meeting (AGM) to be held on 16 November 2016 at which time shareholders will be requested to grant the directors control over 5% of the unissued ordinary shares until the next annual general meeting in 2017.
DIVIDENDSThe group declares dividends dependent upon profits earned and the availability of cash. On 2 September 2016 the directors declared a final gross dividend of 313 cents (2015: 258 cents) per ordinary share from income reserves, which together with the interim dividend of 135 cents (2015: 110 cents) per ordinary share, results in a total payment to shareholders of 448 cents per share (2015: 368 cents).
SHARE SCHEMESDetails of transactions undertaken by the share trusts and empowerment vehicles are disclosed under note 27. There have been no changes to the trustees of the share schemes for the year under review. Participants in the management schemes are advanced interest-free loans by the trust to enable them to purchase the shares offered.
The vesting period in respect of the black partners participating in the Akani scheme matures in October 2016.
The trusts are consolidated for the purposes of the consolidated annual financial statements.
BORROWING POWERSIn terms of the memorandum of incorporation the company has unlimited borrowing powers.
DIRECTORATEDetails of the company’s directors are available online at www.wbho.co.za. The business physical address, postal address and company secretary details are set out in the Integrated Annual Report.
STATEMENT OF COMPLIANCE BY THE COMPANY SECRETARYfor the year ended 30 June 2016
The directors are responsible for the preparation, integrity and fair presentation of the financial statements of Wilson Bayly Holmes-Ovcon Limited and its subsidiaries. The consolidated annual financial statements have been prepared in compliance with the Listings Requirements of the JSE Limited, the framework concepts and the measurement and recognition requirements of International Financial Reporting Standards (“IFRS”), SAICA Financial Reporting Guidelines as issued by the Accounting Practices Committee and Financial Pronouncements as issued by the Financial Reporting Standards Council and the Companies Act of South Africa and include amounts based on judgements and estimates made by management. The directors have also prepared any other information included in the annual report and are responsible for both its accuracy and its consistency with the financial statements.
The directors acknowledge that, ultimately, they are responsible for the system of internal financial control established by the group and place considerable importance on maintaining a strong control environment. To enable the directors to meet these responsibilities, the board sets standards for internal control aimed at reducing the risk of error or loss in a cost-effective manner. These standards include the proper delegation of responsibilities within a clearly defined framework, effective accounting procedures and adequate segregation of duties to ensure an acceptable level of risk. These controls are monitored throughout the group and all employees are required to maintain the highest ethical standards in ensuring that the business of the group is conducted in a manner which, in all reasonable circumstances, is above reproach. The focus of risk management within the group is to identify, assess and monitor all known forms of risk across the group. While operating risk cannot be fully eliminated, the group endeavours to minimise it by ensuring that appropriate infrastructure, controls, systems and ethical behaviour are applied and managed within predetermined procedures and constraints.
Based on the information and explanations given by management and the internal auditors, the directors are of the opinion that the system of internal control provides reasonable assurance that the financial records may be relied on for the preparation of the financial statements, however, a system of internal control can provide only reasonable, and not absolute, assurance against material misstatement or loss.
The going concern basis has been adopted in preparing the financial statements. Based on forecasts and available cash resources, the directors have no reason to believe that the company or the group will not be a going concern in the foreseeable future. The viability of the company and the group is supported by the financial statements.
The financial statements have been audited by the independent auditors, BDO South Africa Inc., who were given unrestricted access to all financial records and the related data, including minutes of all meetings of shareholders, the board of directors and committees of the board. The directors believe that all representations made to the independent auditors during their audit were valid and appropriate. The unqualified audit report of BDO South Africa Inc. is presented on page 5.
The preparation of the financial statements was supervised by the Chief Financial Officer, Charles Henwood CA(SA) and approved by the board of directors on 2 September 2016 and are signed on its behalf.
Mike Wylie Louwtjie NelChairman Chief Executive Officer
2 September 2016
I confirm that the company has lodged with the Registrar of Companies all returns that are required to be lodged by a public company in terms of the Companies Act of South Africa in respect of the year ended 30 June 2016 and that all such returns are true, correct and up to date.
Shereen Vally-Kara Company Secretary
2 September 2016

4
WBHO CONSOLIDATED FINANCIAL STATEMENTS 2016
5
DIRECTORS’ REPORT (continued)for the year ended 30 June 2016
INDEPENDENT AUDITOR’S REPORTfor the year ended 30 June 2016
TO THE SHAREHOLDERS OF WILSON BAYLY HOLMES-OVCON LIMITEDWe have audited the consolidated and separate financial statements of Wilson Bayly Holmes-Ovcon Limited set out on pages 6 to 57, which comprise the statements of financial position as at 30 June 2016, and the statements of financial performance and other comprehensive income, statements of changes in equity and statements of cash flows for the year then ended, and the notes, comprising a summary of significant accounting policies and other explanatory information.
DIRECTORS’ RESPONSIBILITY FOR THE CONSOLIDATED FINANCIAL STATEMENTSThe company’s directors are responsible for the preparation and fair presentation of these consolidated and separate financial statements in accordance with International Financial Reporting Standards and the requirements of the Companies Act of South Africa, and for such internal control as the directors determine is necessary to enable the preparation of consolidated and separate financial statements that are free from material misstatement, whether due to fraud or error.
AUDITOR’S RESPONSIBILITYOur responsibility is to express an opinion on these consolidated and separate financial statements based on our audit. We conducted our audit in accordance with International Standards on Auditing. Those standards require that we comply with ethical requirements and plan and perform the audit to obtain reasonable assurance about whether the consolidated and separate financial statements are free from material misstatement.
An audit involves performing procedures to obtain audit evidence about the amounts and disclosures in the financial statements. The procedures selected depend on the auditor’s judgement, including the assessment of the risks of material misstatement of the financial statements, whether due to fraud or error. In making those risk assessments, the auditor considers internal control relevant to the entity’s preparation and fair presentation of the financial statements in order to design audit procedures that are appropriate in the circumstances, but not for the purpose of expressing an opinion on the effectiveness of the entity’s internal control. An audit also includes evaluating the appropriateness of accounting policies used and the reasonableness of accounting estimates made by management, as well as evaluating the overall presentation of the financial statements.
We believe that the audit evidence we have obtained is sufficient and appropriate to provide a basis for our audit opinion.
OPINIONIn our opinion, the consolidated and separate financial statements present fairly, in all material respects, the consolidated and separate financial position of Wilson Bayly Holmes-Ovcon Limited as at 30 June 2016, and its consolidated and separate financial performance and consolidated and separate cash flows for the year then ended in accordance with International Financial Reporting Standards, and the requirements of the Companies Act of South Africa.
OTHER REPORTS REQUIRED BY THE COMPANIES ACT As part of our audit of the consolidated and separate financial statements for the year ended 30 June 2016, we have read the Directors’ report, the Audit Committee’s report and the Company Secretary’s Certificate for the purpose of identifying whether there are material inconsistencies between these reports and the audited consolidated and separate financial statements. These reports are the responsibility of the respective preparers. Based on reading these reports we have not identified material inconsistencies between these reports and the audited consolidated and separate financial statements. However, we have not audited these reports and accordingly do not express an opinion on these reports.
REPORT ON OTHER LEGAL AND REGULATORY REQUIREMENTSIn terms of the IRBA Rule published in Government Gazette Number 39475 dated 4 December 2015, we report that BDO South Africa Inc. has been the auditor of Wilson Bayly Holmes-Ovcon Limited for 30 years.
Per: Jeanie RobertsDirector
Registered Auditor
2 September 2016
22 Wellington RoadParktown2193
In terms of the company’s memorandum of incorporation, Mme NS Mjoli-Mncube and Mme NS Maziya retire at the forthcoming annual general meeting. Mme NS Maziya is eligible for re-election while Mme NS Mjoli-Mncube has chosen not to stand for re-election. Ms N Damasane was appointed to the board on 2 September 2016, subject to shareholder ratification at the annual general meeting.
DIRECTOR’S SHAREHOLDINGThe direct and indirect interests of the directors are disclosed under note 24 of the financial statements.
There have been no material changes to directors’ shareholdings between the reporting date and the date of this report.
RELATED PARTY TRANSACTIONSRelated party transactions are disclosed under note 24.
PROPERTY, PLANT AND EQUIPMENTFull details of the property, plant and equipment are disclosed under note 2.
SUBSEQUENT EVENTSThere were no significant events subsequent to the reporting date.
GOING CONCERNThe directors have reviewed the group’s budget and forecast cash flows for the year to 30 June 2017. On the basis of this review, and in light of the current financial position, the directors are satisfied that the group and company have access to adequate resources to continue in operational existence for the foreseeable future. The going concern basis has been adopted in preparing the consolidated and separate annual financial statements.
SPECIAL RESOLUTIONSThe following special resolutions were passed at the 2015 AGM:
SPECIAL RESOLUTION NUMBER 1Approval of non-executive directors’ fees for the 2016 financial year
SPECIAL RESOLUTION NUMBER 2Financial assistance to directors, prescribed officers, employee share scheme beneficiaries and related or inter-related companies and corporations
SPECIAL RESOLUTION NUMBER 3Amendment of Memorandum of Incorporation
SPECIAL RESOLUTION NUMBER 4General authority to repurchase company shares
6
WBHO CONSOLIDATED FINANCIAL STATEMENTS 2016
7
Notes2016
R’000
Restated2015
R’000
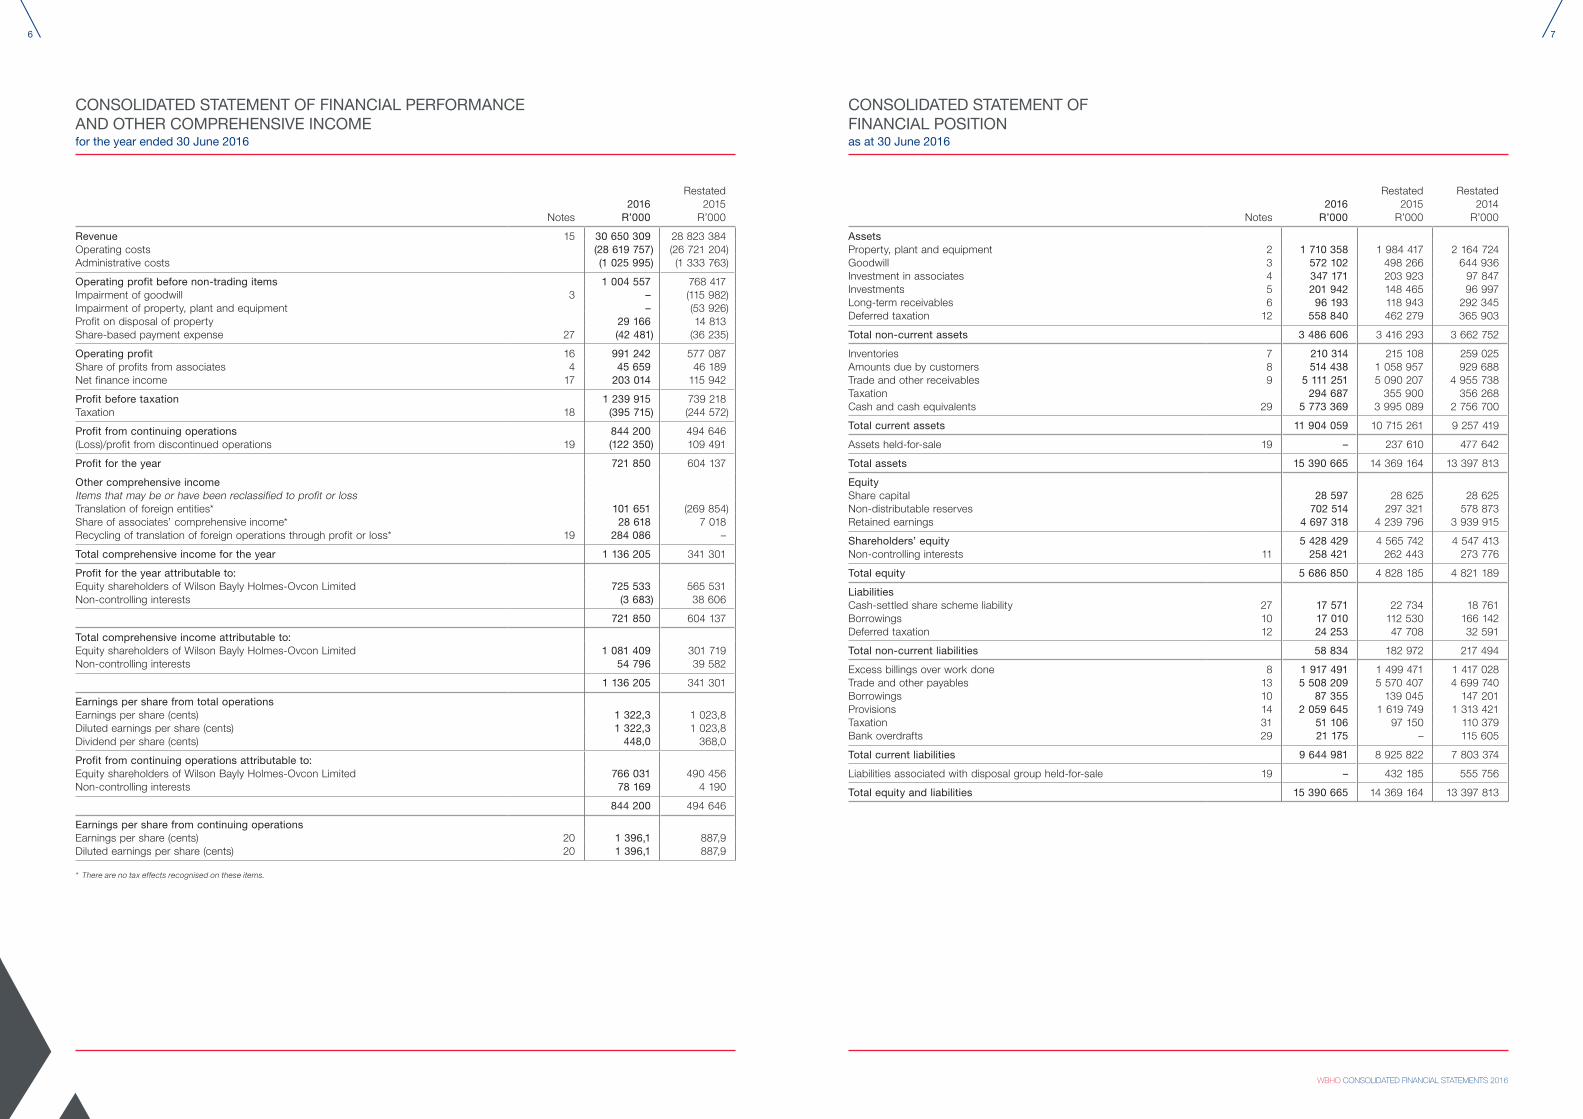
Revenue 15 30 650 309 28 823 384 Operating costs (28 619 757) (26 721 204)Administrative costs (1 025 995) (1 333 763)
Operating profit before non-trading items 1 004 557 768 417 Impairment of goodwill 3 – (115 982)Impairment of property, plant and equipment – (53 926)Profit on disposal of property 29 166 14 813 Share-based payment expense 27 (42 481) (36 235)
Operating profit 16 991 242 577 087 Share of profits from associates 4 45 659 46 189 Net finance income 17 203 014 115 942
Profit before taxation 1 239 915 739 218 Taxation 18 (395 715) (244 572)
Profit from continuing operations 844 200 494 646 (Loss)/profit from discontinued operations 19 (122 350) 109 491
Profit for the year 721 850 604 137
Other comprehensive incomeItems that may be or have been reclassified to profit or lossTranslation of foreign entities* 101 651 (269 854)Share of associates’ comprehensive income* 28 618 7 018 Recycling of translation of foreign operations through profit or loss* 19 284 086 –
Total comprehensive income for the year 1 136 205 341 301
Profit for the year attributable to:Equity shareholders of Wilson Bayly Holmes-Ovcon Limited 725 533 565 531 Non-controlling interests (3 683) 38 606
721 850 604 137
Total comprehensive income attributable to:Equity shareholders of Wilson Bayly Holmes-Ovcon Limited 1 081 409 301 719Non-controlling interests 54 796 39 582
1 136 205 341 301
Earnings per share from total operationsEarnings per share (cents) 1 322,3 1 023,8 Diluted earnings per share (cents) 1 322,3 1 023,8 Dividend per share (cents) 448,0 368,0
Profit from continuing operations attributable to:Equity shareholders of Wilson Bayly Holmes-Ovcon Limited 766 031 490 456 Non-controlling interests 78 169 4 190
844 200 494 646
Earnings per share from continuing operationsEarnings per share (cents) 20 1 396,1 887,9Diluted earnings per share (cents) 20 1 396,1 887,9
* There are no tax effects recognised on these items.
Notes2016
R’000
Restated2015
R’000
Restated2014
R’000
AssetsProperty, plant and equipment 2 1 710 358 1 984 417 2 164 724 Goodwill 3 572 102 498 266 644 936 Investment in associates 4 347 171 203 923 97 847 Investments 5 201 942 148 465 96 997 Long-term receivables 6 96 193 118 943 292 345 Deferred taxation 12 558 840 462 279 365 903
Total non-current assets 3 486 606 3 416 293 3 662 752
Inventories 7 210 314 215 108 259 025 Amounts due by customers 8 514 438 1 058 957 929 688 Trade and other receivables 9 5 111 251 5 090 207 4 955 738 Taxation 294 687 355 900 356 268 Cash and cash equivalents 29 5 773 369 3 995 089 2 756 700
Total current assets 11 904 059 10 715 261 9 257 419
Assets held-for-sale 19 – 237 610 477 642
Total assets 15 390 665 14 369 164 13 397 813
EquityShare capital 28 597 28 625 28 625 Non-distributable reserves 702 514 297 321 578 873 Retained earnings 4 697 318 4 239 796 3 939 915
Shareholders’ equity 5 428 429 4 565 742 4 547 413 Non-controlling interests 11 258 421 262 443 273 776
Total equity 5 686 850 4 828 185 4 821 189
LiabilitiesCash-settled share scheme liability 27 17 571 22 734 18 761 Borrowings 10 17 010 112 530 166 142 Deferred taxation 12 24 253 47 708 32 591
Total non-current liabilities 58 834 182 972 217 494
Excess billings over work done 8 1 917 491 1 499 471 1 417 028 Trade and other payables 13 5 508 209 5 570 407 4 699 740 Borrowings 10 87 355 139 045 147 201 Provisions 14 2 059 645 1 619 749 1 313 421 Taxation 31 51 106 97 150 110 379 Bank overdrafts 29 21 175 – 115 605
Total current liabilities 9 644 981 8 925 822 7 803 374
Liabilities associated with disposal group held-for-sale 19 – 432 185 555 756
Total equity and liabilities 15 390 665 14 369 164 13 397 813
CONSOLIDATED STATEMENT OF FINANCIAL PERFORMANCE AND OTHER COMPREHENSIVE INCOMEfor the year ended 30 June 2016
CONSOLIDATED STATEMENT OF FINANCIAL POSITIONas at 30 June 2016
8
WBHO CONSOLIDATED FINANCIAL STATEMENTS 2016
9
Non-distributable reserves
Note
Number ofordinary
shares issued
Number ofshares held by
share trusts
Net sharesissued to
the public
SharecapitalR’000
Foreigncurrency
translation reserve
R’000
Employeeshare-scheme
reserveR’000
Retained earnings
R’000
Shareholders’ equityR’000
Non-controlling interests
R’000
TotalequityR’000
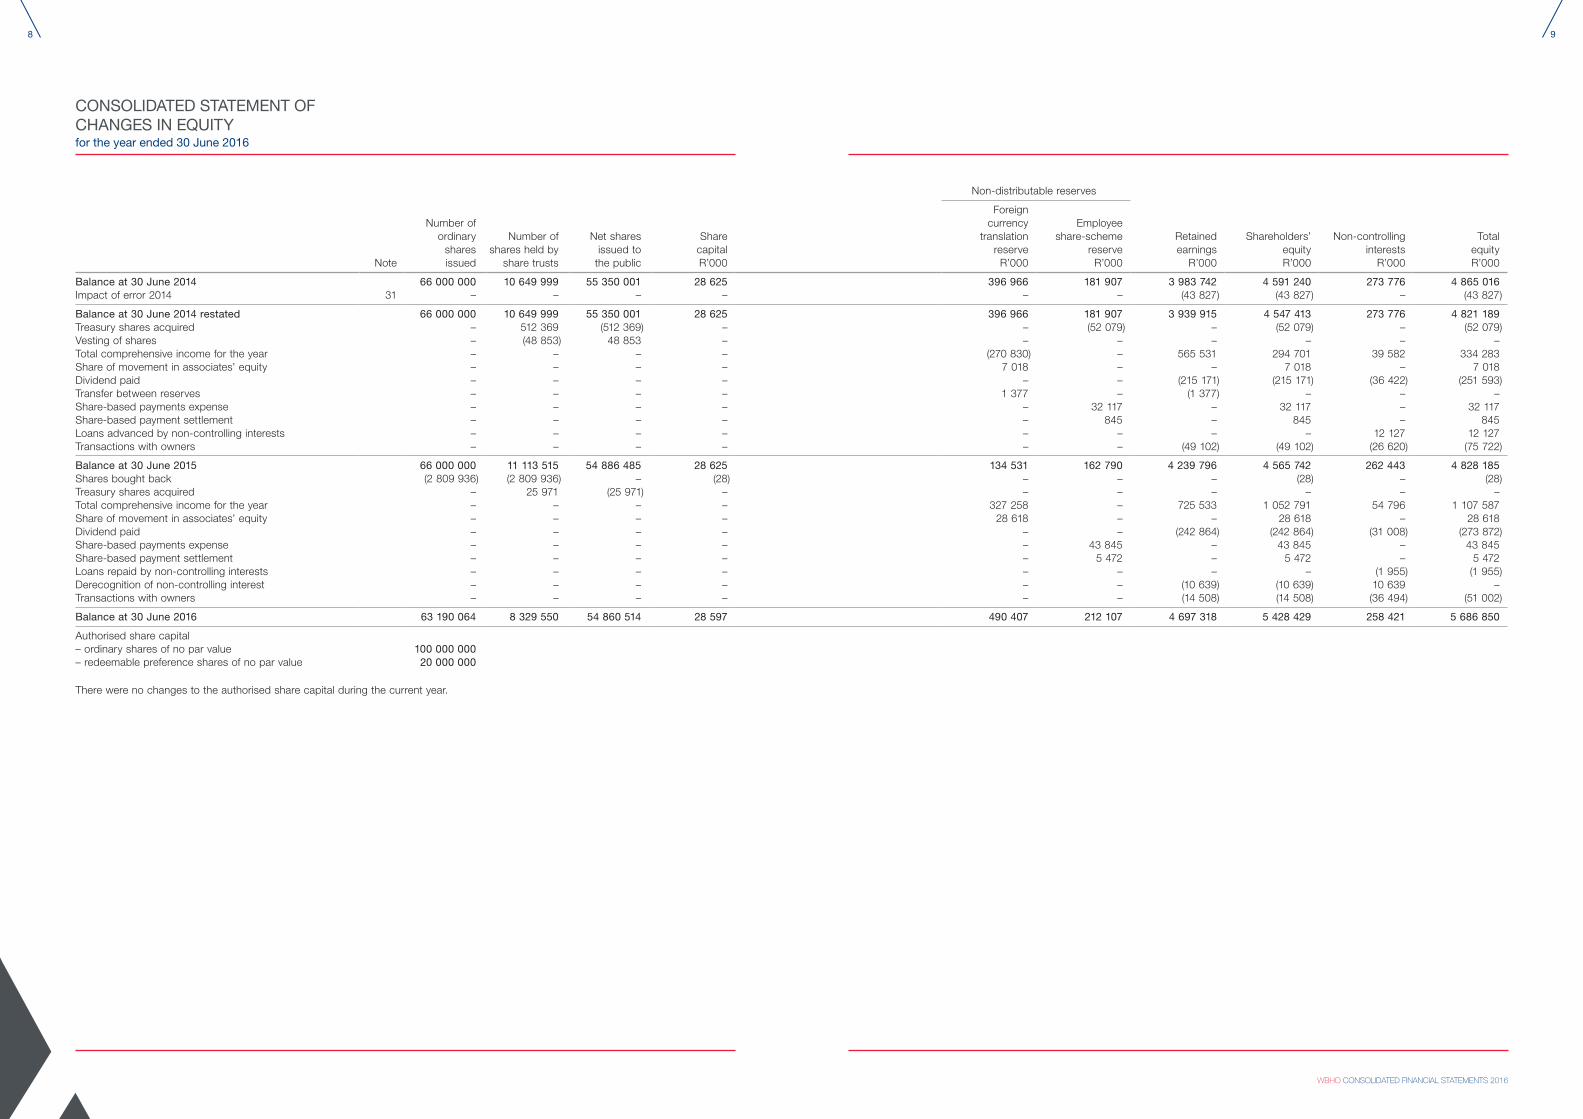
Balance at 30 June 2014 66 000 000 10 649 999 55 350 001 28 625 396 966 181 907 3 983 742 4 591 240 273 776 4 865 016 Impact of error 2014 31 – – – – – – (43 827) (43 827) – (43 827)
Balance at 30 June 2014 restated 66 000 000 10 649 999 55 350 001 28 625 396 966 181 907 3 939 915 4 547 413 273 776 4 821 189 Treasury shares acquired – 512 369 (512 369) – – (52 079) – (52 079) – (52 079)Vesting of shares – (48 853) 48 853 – – – – – – – Total comprehensive income for the year – – – – (270 830) – 565 531 294 701 39 582 334 283 Share of movement in associates’ equity – – – – 7 018 – – 7 018 – 7 018 Dividend paid – – – – – – (215 171) (215 171) (36 422) (251 593)Transfer between reserves – – – – 1 377 – (1 377) – – – Share-based payments expense – – – – – 32 117 – 32 117 – 32 117 Share-based payment settlement – – – – – 845 – 845 – 845 Loans advanced by non-controlling interests – – – – – – – – 12 127 12 127 Transactions with owners – – – – – – (49 102) (49 102) (26 620) (75 722)
Balance at 30 June 2015 66 000 000 11 113 515 54 886 485 28 625 134 531 162 790 4 239 796 4 565 742 262 443 4 828 185 Shares bought back (2 809 936) (2 809 936) – (28) – – – (28) – (28)Treasury shares acquired – 25 971 (25 971) – – – – – – – Total comprehensive income for the year – – – – 327 258 – 725 533 1 052 791 54 796 1 107 587 Share of movement in associates’ equity – – – – 28 618 – – 28 618 – 28 618 Dividend paid – – – – – – (242 864) (242 864) (31 008) (273 872)Share-based payments expense – – – – – 43 845 – 43 845 – 43 845 Share-based payment settlement – – – – – 5 472 – 5 472 – 5 472 Loans repaid by non-controlling interests – – – – – – – – (1 955) (1 955)Derecognition of non-controlling interest – – – – – – (10 639) (10 639) 10 639 – Transactions with owners – – – – – – (14 508) (14 508) (36 494) (51 002)
Balance at 30 June 2016 63 190 064 8 329 550 54 860 514 28 597 490 407 212 107 4 697 318 5 428 429 258 421 5 686 850
Authorised share capital– ordinary shares of no par value 100 000 000– redeemable preference shares of no par value 20 000 000
There were no changes to the authorised share capital during the current year.
CONSOLIDATED STATEMENT OF CHANGES IN EQUITYfor the year ended 30 June 2016

10
WBHO CONSOLIDATED FINANCIAL STATEMENTS 2016
11
Notes2016
R’0002015
R’000
Cash flow from operating activitiesCash generated from operations 29 1 994 855 2 552 930 Adjustments for:Net finance income 17 141 641 69 531 Taxation paid 29 (487 234) (363 767)Dividend paid (273 873) (251 593)
Cash flow from operating activities 1 375 389 2 007 101
Cash flow from investing activitiesAdvances of long-term receivables (14 000) (247 477)Repayment of long-term receivables 500 284 16 058Additions to investments (27 874) (58 127)Loans advanced to associates (68 353) (67 132)Proceeds on disposal of operations – 161 106 Restructuring of debt on disposal of operations (65 114) – Proceeds on disposal of property, plant and equipment 213 168 134 758 Purchase of property, plant and equipment – to maintain operations (77 546) (159 200)– to expand operations (38 660) (43 236)
Cash flow from investing activities 421 905 (263 250)
Cash flow from financing activitiesRepayment of borrowings (141 272) (24 109)Transactions with owners (41 720) (64 538)Treasury shares acquired (28) (52 079)Instalments in respect of capitalised finance leases (139 302) (153 824)
Cash flow from financing activities (322 322) (294 550)
Increase in cash and cash equivalents for the year 1 474 972 1 449 301 Foreign currency translation effect 259 212 (146 214)Overdraft in respect of disposal group at the beginning of the year (332 180) (268 450)Cash and cash equivalents at the beginning of the year 3 995 089 2 641 095 Overdraft/(cash and cash equivalents) disposed of 19 355 101 (12 823)Overdraft in respect of disposal group at the end of the year – 332 180
Cash and cash equivalents at the end of the year 29 5 752 194 3 995 089
CONSOLIDATED STATEMENT OF CASH FLOWSfor the year ended 30 June 2016
PRINCIPAL ACCOUNTING POLICIESfor the year ended 30 June 2016
STATEMENT OF COMPLIANCE The consolidated and company financial statements are prepared in accordance with International Financial Reporting Standards (IFRS) and the interpretations adopted by the International Accounting Standards Board (IASB) and the International Financial Reporting Interpretations Committee of the IASB. The consolidated and company financial statements comply with the SAICA Financial Reporting Guides as issued by the Accounting Practices Committee and Financial Reporting Pronouncements as issued the by Financial Reporting Standards Council, the JSE Listings Requirements and the requirements of the Companies Act of South Africa.
BASIS OF PREPARATION The consolidated and company financial statements have been prepared on the historical cost basis, except for specific financial assets and derivative financial instruments which are measured at fair value through profit and loss. The accounting policies adopted have been consistently applied throughout the group to all the periods presented. The consolidated and company financial statements have been prepared on the going concern basis.
SIGNIFICANT JUDGEMENTS AND CRITICAL ACCOUNTING ESTIMATES In preparing the annual financial statements, management is required to make estimates and assumptions that affect the amounts presented in the financial statements and related disclosures. Judgements and estimates are continually evaluated and are based on historical experience and other factors, including expectations of future events that are believed to be reasonable under the circumstances. Actual results in the future could differ from these estimates, which may be material to the financial statements. Significant judgements and estimates include:
a) Classification of investments Judgement has been applied in determining the classification of joint arrangements, other investments and associates depending on the
contractual rights and obligations of each investor. The judgements used have been disclosed in notes 4 and 5.
b) Impairment of trade receivables Estimates are based on management’s assessment of the likelihood of collecting outstanding receivables.
c) Inventories Where inventories are recognised at net realisable value, estimates are made of the expected selling price, cost of completion and
marketing, selling and distribution costs. Significant judgement has been applied in determining the net realisable value of limited service stock.
d) Impairment of goodwill Estimates are made in determining the recoverable amounts of cash-generating units, based on value-in-use and fair value less costs to
sell calculations. The estimates used have been disclosed in note 3.
e) Property, plant and equipment Estimates are made of the residual values and judgement applied in estimating the useful lives of items of property, plant and equipment
using relevant information available for similar assets.
f) Impairment of assets other than goodwill In determining the recoverable amount of an asset, estimates are made of suitable discount rates, growth rates and working capital
requirements in order to calculate present value as well as the future cash flows expected to arise from a specific asset.
g) Provisions Estimates are made of the expected cash outflow taking into account that the exact amount and timing of the outflow is uncertain.
h) Contracting profit or loss recognition Estimates are made of the total expected costs of individual contracts when applying the stage of completion method. In certain
instances management is required to exercise judgement to determine whether the outcome of a contract can be reliably estimated.
i) Taxation The group is subject to taxes in numerous jurisdictions. Judgement is required in determining the provision for taxes as the tax liability
and treatment thereof cannot be finally determined until a formal assessment has been made by the relevant tax authority. The group recognises the net future tax benefit related to deferred tax assets, where it is probable that there will be taxable income against which the tax losses and deductible temporary differences can be utilised.
j) Fair value The group is required to measure fair value for both financial and non-financial assets and liabilities and when recognising identifiable
assets and liabilities under business combinations. Judgement is required when determining the inputs to be used in discounted cash flow valuation techniques.
12
WBHO CONSOLIDATED FINANCIAL STATEMENTS 2016
13
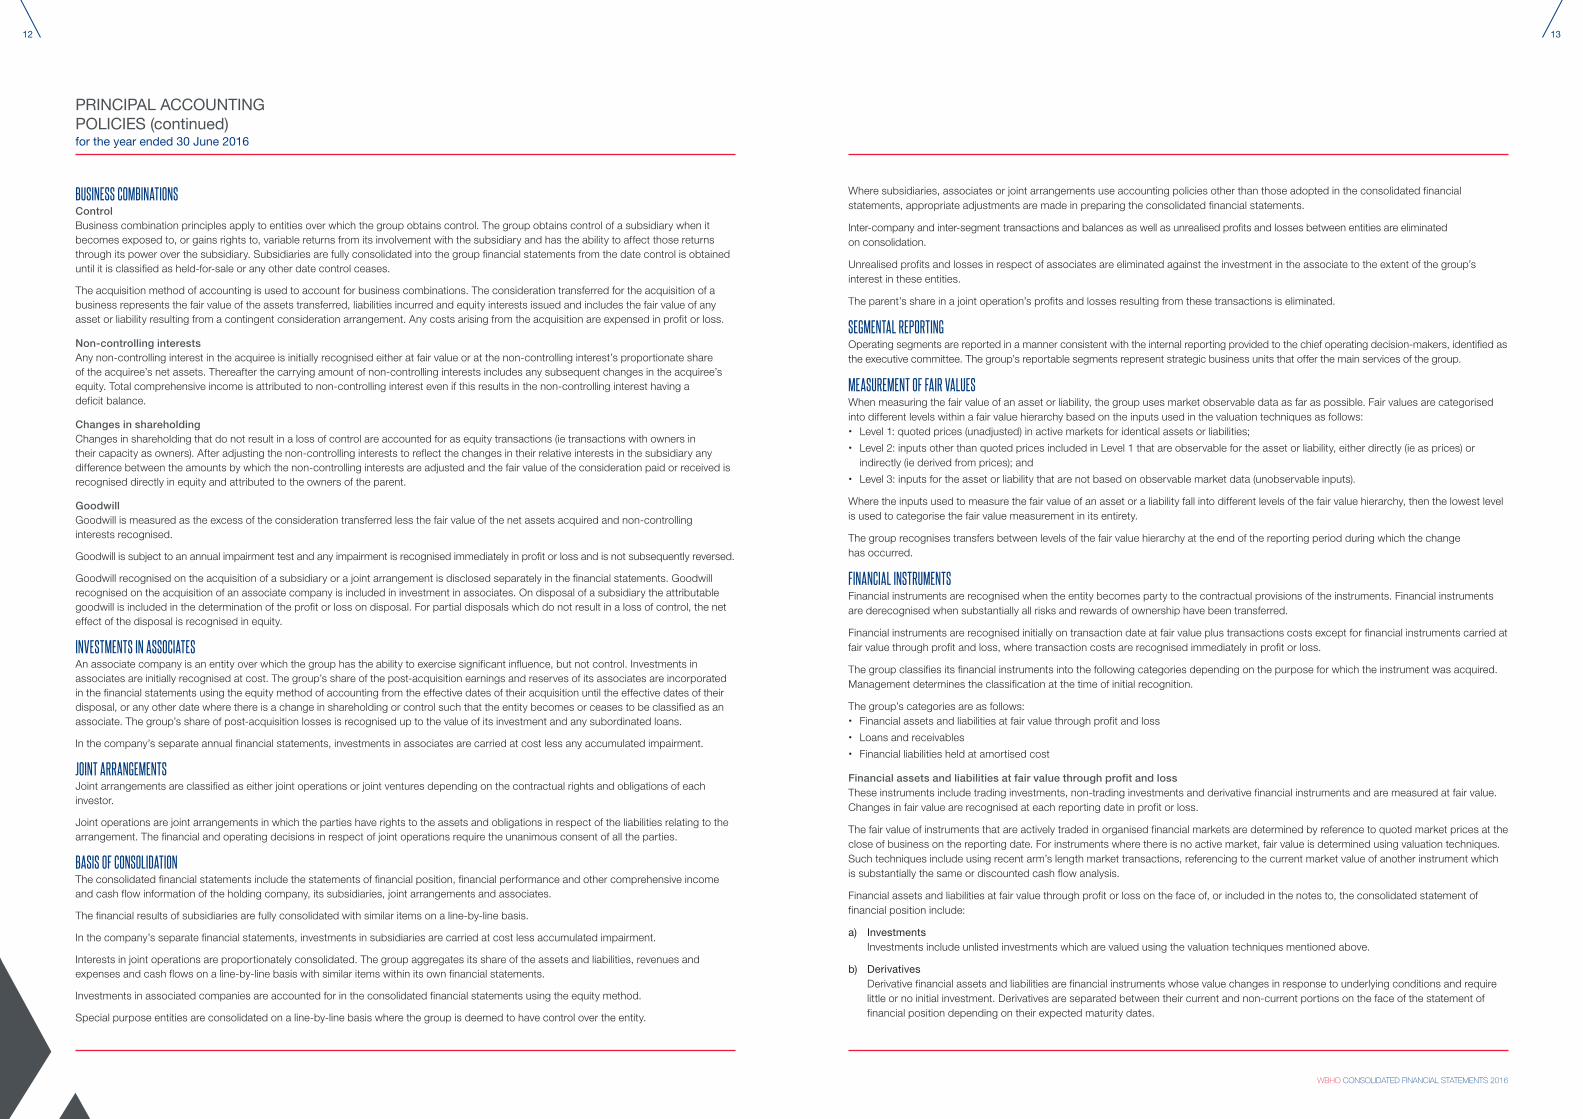
BUSINESS COMBINATIONS Control Business combination principles apply to entities over which the group obtains control. The group obtains control of a subsidiary when it becomes exposed to, or gains rights to, variable returns from its involvement with the subsidiary and has the ability to affect those returns through its power over the subsidiary. Subsidiaries are fully consolidated into the group financial statements from the date control is obtained until it is classified as held-for-sale or any other date control ceases.
The acquisition method of accounting is used to account for business combinations. The consideration transferred for the acquisition of a business represents the fair value of the assets transferred, liabilities incurred and equity interests issued and includes the fair value of any asset or liability resulting from a contingent consideration arrangement. Any costs arising from the acquisition are expensed in profit or loss.
Non-controlling interests Any non-controlling interest in the acquiree is initially recognised either at fair value or at the non-controlling interest’s proportionate share of the acquiree’s net assets. Thereafter the carrying amount of non-controlling interests includes any subsequent changes in the acquiree’s equity. Total comprehensive income is attributed to non-controlling interest even if this results in the non-controlling interest having a deficit balance.
Changes in shareholding Changes in shareholding that do not result in a loss of control are accounted for as equity transactions (ie transactions with owners in their capacity as owners). After adjusting the non-controlling interests to reflect the changes in their relative interests in the subsidiary any difference between the amounts by which the non-controlling interests are adjusted and the fair value of the consideration paid or received is recognised directly in equity and attributed to the owners of the parent.
Goodwill Goodwill is measured as the excess of the consideration transferred less the fair value of the net assets acquired and non-controlling interests recognised.
Goodwill is subject to an annual impairment test and any impairment is recognised immediately in profit or loss and is not subsequently reversed.
Goodwill recognised on the acquisition of a subsidiary or a joint arrangement is disclosed separately in the financial statements. Goodwill recognised on the acquisition of an associate company is included in investment in associates. On disposal of a subsidiary the attributable goodwill is included in the determination of the profit or loss on disposal. For partial disposals which do not result in a loss of control, the net effect of the disposal is recognised in equity.
INVESTMENTS IN ASSOCIATES An associate company is an entity over which the group has the ability to exercise significant influence, but not control. Investments in associates are initially recognised at cost. The group’s share of the post-acquisition earnings and reserves of its associates are incorporated in the financial statements using the equity method of accounting from the effective dates of their acquisition until the effective dates of their disposal, or any other date where there is a change in shareholding or control such that the entity becomes or ceases to be classified as an associate. The group’s share of post-acquisition losses is recognised up to the value of its investment and any subordinated loans.
In the company’s separate annual financial statements, investments in associates are carried at cost less any accumulated impairment.
JOINT ARRANGEMENTS Joint arrangements are classified as either joint operations or joint ventures depending on the contractual rights and obligations of each investor.
Joint operations are joint arrangements in which the parties have rights to the assets and obligations in respect of the liabilities relating to the arrangement. The financial and operating decisions in respect of joint operations require the unanimous consent of all the parties.
BASIS OF CONSOLIDATION The consolidated financial statements include the statements of financial position, financial performance and other comprehensive income and cash flow information of the holding company, its subsidiaries, joint arrangements and associates.
The financial results of subsidiaries are fully consolidated with similar items on a line-by-line basis.
In the company’s separate financial statements, investments in subsidiaries are carried at cost less accumulated impairment.
Interests in joint operations are proportionately consolidated. The group aggregates its share of the assets and liabilities, revenues and expenses and cash flows on a line-by-line basis with similar items within its own financial statements.
Investments in associated companies are accounted for in the consolidated financial statements using the equity method.
Special purpose entities are consolidated on a line-by-line basis where the group is deemed to have control over the entity.
Where subsidiaries, associates or joint arrangements use accounting policies other than those adopted in the consolidated financial statements, appropriate adjustments are made in preparing the consolidated financial statements.
Inter-company and inter-segment transactions and balances as well as unrealised profits and losses between entities are eliminated on consolidation.
Unrealised profits and losses in respect of associates are eliminated against the investment in the associate to the extent of the group’s interest in these entities.
The parent’s share in a joint operation’s profits and losses resulting from these transactions is eliminated.
SEGMENTAL REPORTING Operating segments are reported in a manner consistent with the internal reporting provided to the chief operating decision-makers, identified as the executive committee. The group’s reportable segments represent strategic business units that offer the main services of the group.
MEASUREMENT OF FAIR VALUES When measuring the fair value of an asset or liability, the group uses market observable data as far as possible. Fair values are categorised into different levels within a fair value hierarchy based on the inputs used in the valuation techniques as follows: • Level 1: quoted prices (unadjusted) in active markets for identical assets or liabilities;
• Level 2: inputs other than quoted prices included in Level 1 that are observable for the asset or liability, either directly (ie as prices) or indirectly (ie derived from prices); and
• Level 3: inputs for the asset or liability that are not based on observable market data (unobservable inputs).
Where the inputs used to measure the fair value of an asset or a liability fall into different levels of the fair value hierarchy, then the lowest level is used to categorise the fair value measurement in its entirety.
The group recognises transfers between levels of the fair value hierarchy at the end of the reporting period during which the change has occurred.
FINANCIAL INSTRUMENTS Financial instruments are recognised when the entity becomes party to the contractual provisions of the instruments. Financial instruments are derecognised when substantially all risks and rewards of ownership have been transferred.
Financial instruments are recognised initially on transaction date at fair value plus transactions costs except for financial instruments carried at fair value through profit and loss, where transaction costs are recognised immediately in profit or loss.
The group classifies its financial instruments into the following categories depending on the purpose for which the instrument was acquired. Management determines the classification at the time of initial recognition.
The group’s categories are as follows: • Financial assets and liabilities at fair value through profit and loss
• Loans and receivables
• Financial liabilities held at amortised cost
Financial assets and liabilities at fair value through profit and loss These instruments include trading investments, non-trading investments and derivative financial instruments and are measured at fair value. Changes in fair value are recognised at each reporting date in profit or loss.
The fair value of instruments that are actively traded in organised financial markets are determined by reference to quoted market prices at the close of business on the reporting date. For instruments where there is no active market, fair value is determined using valuation techniques. Such techniques include using recent arm’s length market transactions, referencing to the current market value of another instrument which is substantially the same or discounted cash flow analysis.
Financial assets and liabilities at fair value through profit or loss on the face of, or included in the notes to, the consolidated statement of financial position include:
a) Investments Investments include unlisted investments which are valued using the valuation techniques mentioned above.
b) Derivatives Derivative financial assets and liabilities are financial instruments whose value changes in response to underlying conditions and require
little or no initial investment. Derivatives are separated between their current and non-current portions on the face of the statement of financial position depending on their expected maturity dates.
PRINCIPAL ACCOUNTING POLICIES (continued)for the year ended 30 June 2016
14
WBHO CONSOLIDATED FINANCIAL STATEMENTS 2016
15
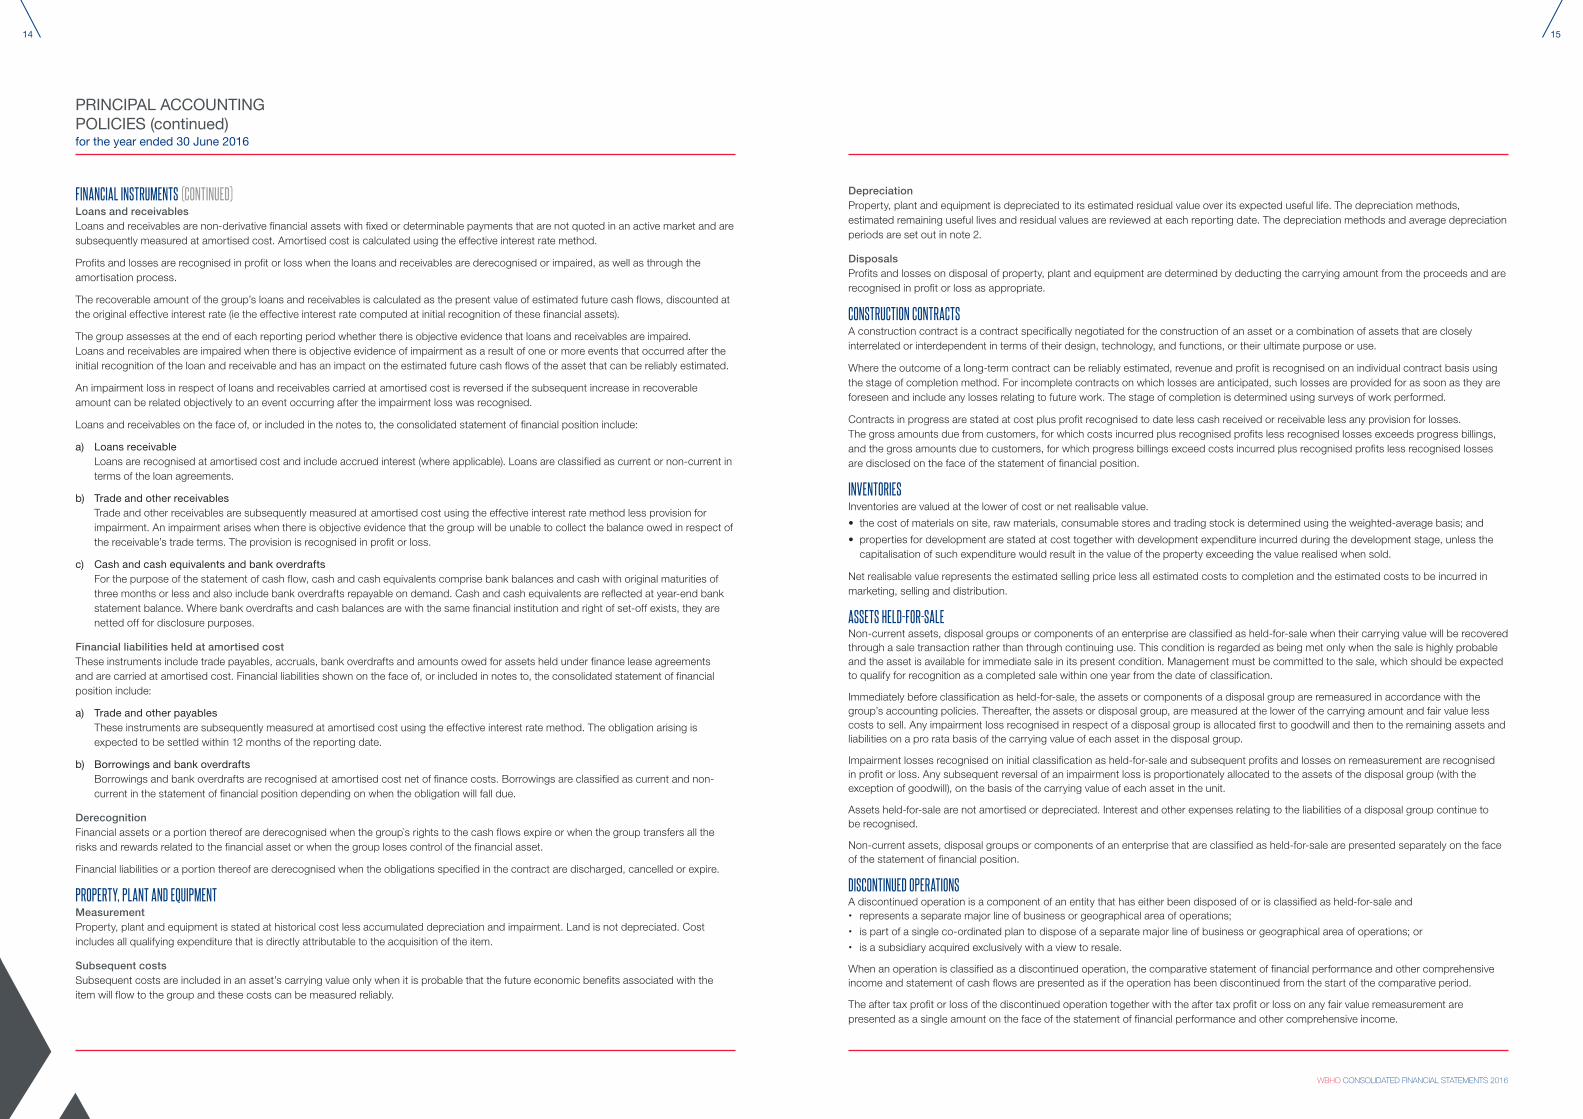
FINANCIAL INSTRUMENTS (CONTINUED)Loans and receivables Loans and receivables are non-derivative financial assets with fixed or determinable payments that are not quoted in an active market and are subsequently measured at amortised cost. Amortised cost is calculated using the effective interest rate method.
Profits and losses are recognised in profit or loss when the loans and receivables are derecognised or impaired, as well as through the amortisation process.
The recoverable amount of the group’s loans and receivables is calculated as the present value of estimated future cash flows, discounted at the original effective interest rate (ie the effective interest rate computed at initial recognition of these financial assets).
The group assesses at the end of each reporting period whether there is objective evidence that loans and receivables are impaired. Loans and receivables are impaired when there is objective evidence of impairment as a result of one or more events that occurred after the initial recognition of the loan and receivable and has an impact on the estimated future cash flows of the asset that can be reliably estimated.
An impairment loss in respect of loans and receivables carried at amortised cost is reversed if the subsequent increase in recoverable amount can be related objectively to an event occurring after the impairment loss was recognised.
Loans and receivables on the face of, or included in the notes to, the consolidated statement of financial position include:
a) Loans receivable Loans are recognised at amortised cost and include accrued interest (where applicable). Loans are classified as current or non-current in
terms of the loan agreements.
b) Trade and other receivables Trade and other receivables are subsequently measured at amortised cost using the effective interest rate method less provision for
impairment. An impairment arises when there is objective evidence that the group will be unable to collect the balance owed in respect of the receivable’s trade terms. The provision is recognised in profit or loss.
c) Cash and cash equivalents and bank overdrafts For the purpose of the statement of cash flow, cash and cash equivalents comprise bank balances and cash with original maturities of
three months or less and also include bank overdrafts repayable on demand. Cash and cash equivalents are reflected at year-end bank statement balance. Where bank overdrafts and cash balances are with the same financial institution and right of set-off exists, they are netted off for disclosure purposes.
Financial liabilities held at amortised cost These instruments include trade payables, accruals, bank overdrafts and amounts owed for assets held under finance lease agreements and are carried at amortised cost. Financial liabilities shown on the face of, or included in notes to, the consolidated statement of financial position include:
a) Trade and other payables These instruments are subsequently measured at amortised cost using the effective interest rate method. The obligation arising is
expected to be settled within 12 months of the reporting date.
b) Borrowings and bank overdrafts Borrowings and bank overdrafts are recognised at amortised cost net of finance costs. Borrowings are classified as current and non-
current in the statement of financial position depending on when the obligation will fall due.
Derecognition Financial assets or a portion thereof are derecognised when the group`s rights to the cash flows expire or when the group transfers all the risks and rewards related to the financial asset or when the group loses control of the financial asset.
Financial liabilities or a portion thereof are derecognised when the obligations specified in the contract are discharged, cancelled or expire.
PROPERTY, PLANT AND EQUIPMENT Measurement Property, plant and equipment is stated at historical cost less accumulated depreciation and impairment. Land is not depreciated. Cost includes all qualifying expenditure that is directly attributable to the acquisition of the item.
Subsequent costs Subsequent costs are included in an asset’s carrying value only when it is probable that the future economic benefits associated with the item will flow to the group and these costs can be measured reliably.
Depreciation Property, plant and equipment is depreciated to its estimated residual value over its expected useful life. The depreciation methods, estimated remaining useful lives and residual values are reviewed at each reporting date. The depreciation methods and average depreciation periods are set out in note 2.
Disposals Profits and losses on disposal of property, plant and equipment are determined by deducting the carrying amount from the proceeds and are recognised in profit or loss as appropriate.
CONSTRUCTION CONTRACTS A construction contract is a contract specifically negotiated for the construction of an asset or a combination of assets that are closely interrelated or interdependent in terms of their design, technology, and functions, or their ultimate purpose or use.
Where the outcome of a long-term contract can be reliably estimated, revenue and profit is recognised on an individual contract basis using the stage of completion method. For incomplete contracts on which losses are anticipated, such losses are provided for as soon as they are foreseen and include any losses relating to future work. The stage of completion is determined using surveys of work performed.
Contracts in progress are stated at cost plus profit recognised to date less cash received or receivable less any provision for losses. The gross amounts due from customers, for which costs incurred plus recognised profits less recognised losses exceeds progress billings, and the gross amounts due to customers, for which progress billings exceed costs incurred plus recognised profits less recognised losses are disclosed on the face of the statement of financial position.
INVENTORIES Inventories are valued at the lower of cost or net realisable value.
• the cost of materials on site, raw materials, consumable stores and trading stock is determined using the weighted-average basis; and
• properties for development are stated at cost together with development expenditure incurred during the development stage, unless the capitalisation of such expenditure would result in the value of the property exceeding the value realised when sold.
Net realisable value represents the estimated selling price less all estimated costs to completion and the estimated costs to be incurred in marketing, selling and distribution.
ASSETS HELD-FOR-SALE Non-current assets, disposal groups or components of an enterprise are classified as held-for-sale when their carrying value will be recovered through a sale transaction rather than through continuing use. This condition is regarded as being met only when the sale is highly probable and the asset is available for immediate sale in its present condition. Management must be committed to the sale, which should be expected to qualify for recognition as a completed sale within one year from the date of classification.
Immediately before classification as held-for-sale, the assets or components of a disposal group are remeasured in accordance with the group’s accounting policies. Thereafter, the assets or disposal group, are measured at the lower of the carrying amount and fair value less costs to sell. Any impairment loss recognised in respect of a disposal group is allocated first to goodwill and then to the remaining assets and liabilities on a pro rata basis of the carrying value of each asset in the disposal group.
Impairment losses recognised on initial classification as held-for-sale and subsequent profits and losses on remeasurement are recognised in profit or loss. Any subsequent reversal of an impairment loss is proportionately allocated to the assets of the disposal group (with the exception of goodwill), on the basis of the carrying value of each asset in the unit.
Assets held-for-sale are not amortised or depreciated. Interest and other expenses relating to the liabilities of a disposal group continue to be recognised.
Non-current assets, disposal groups or components of an enterprise that are classified as held-for-sale are presented separately on the face of the statement of financial position.
DISCONTINUED OPERATIONS A discontinued operation is a component of an entity that has either been disposed of or is classified as held-for-sale and • represents a separate major line of business or geographical area of operations;
• is part of a single co-ordinated plan to dispose of a separate major line of business or geographical area of operations; or
• is a subsidiary acquired exclusively with a view to resale.
When an operation is classified as a discontinued operation, the comparative statement of financial performance and other comprehensive income and statement of cash flows are presented as if the operation has been discontinued from the start of the comparative period.
The after tax profit or loss of the discontinued operation together with the after tax profit or loss on any fair value remeasurement are presented as a single amount on the face of the statement of financial performance and other comprehensive income.
PRINCIPAL ACCOUNTING POLICIES (continued)for the year ended 30 June 2016
16
WBHO CONSOLIDATED FINANCIAL STATEMENTS 2016
17
IMPAIRMENT OF ASSETS Impairment tests in respect of goodwill are undertaken at each reporting date or whenever events or changes in circumstances indicate that the carrying amount of an asset may not be recoverable. Where the carrying amount of an asset exceeds its recoverable amount, the asset is impaired to its recoverable amount.
The recoverable amount is the greater of an asset’s fair value less costs to sell and value in use. In assessing value in use, the estimated future cash flows are discounted to their present value using a pre-tax discount rate that reflects current market assessments of the time value of money and the risks specific to the asset. For an asset that does not generate cash inflows largely independent of those from other assets, including goodwill, the recoverable amount is determined for the cash-generating unit to which the asset relates. Impairment losses recognised in respect of cash-generating units are allocated first to reduce the carrying amount of any goodwill allocated to such cash generating units and thereafter, to reduce the carrying amounts of the other assets in the unit on a pro rata basis.
Impairment charges are included in profit or loss. An impairment loss recognised for goodwill is not reversed.
However, the amount of the impairment reversed cannot result in the final balance exceeding the carrying amount that would have been determined net of depreciation or amortisation, had no impairment loss been recognised in previous years.
LEASED ASSETS Finance leases Assets held under finance leases, where the risks and rewards of ownership have been transferred, are capitalised as property, plant and equipment. Finance lease assets are initially recognised at an amount equal to the lower of the fair value of the leased property and the present value of the minimum lease payments, and depreciated over their useful lives. The capital portion of the lease is included under other current or non-current liabilities as appropriate in the statement of financial position. The interest portion is expensed to profit or loss over the period.
Operating leases – lessee Leases of assets under which all the risks and rewards of ownership are effectively retained by the lessor are classified as operating leases. Operating lease rentals are charged to profit and loss on a straight-line basis over the period of the lease. The difference between the amount recognised as an expense and the contractual payment is recognised as an operating lease asset or liability. This asset or liability is not discounted.
PROVISIONS Provisions are recognised when there is a present legal or constructive obligation resulting from past events, where the settlement of such obligation will result in the probable outflow of resources from the group and a reliable estimate can be made of the amount of the obligation. If a present obligation does not exist or the amount cannot be reliably measured, the provision is not recognised but rather disclosed as a contingent liability.
Provisions are measured at the directors’ best estimate of the expenditure required to settle the obligation at year-end and are discounted to present value using a pre-tax rate if the effect is material.
Provisions for future expenses are not raised, unless supported by an onerous contract, where the unavoidable costs to be incurred in meeting the contract obligations exceed the economic benefits expected to be received from the contract.
REVENUE RECOGNITIONRevenue is recognised when it can be reliably measured and it is probable that the economic benefits associated with the transaction will flow to the group. All revenues are stated net of value added taxes and trade discounts, if applicable. Inter-company revenues are eliminated on consolidation.
Contract revenue Where the outcome of a construction contract can be reliably estimated, contract revenue is recognised based on the fair value of the consideration received or receivable, including variations and claims, taking into account the stage of completion of each contract. The stage of completion is determined using surveys of work performed relative to the estimated total costs of the contract. Changes to the original estimate of total revenue, cost or the stage of completion are reflected in profit and loss in the period in which the circumstances that gave rise to the revision becomes known. For contracts where the outcome cannot be reliably estimated, contract revenue is recognised to the extent that the recoverability of costs incurred is probable.
Sale of materialsRevenue arising from the sale of materials is recognised when the group transfers the item, through delivery to the customer or collection by the customer, and the significant risks and rewards of ownership have been transferred to the customer.
Other income Other income earned by the group which is not included in revenue, is recognised on the following basis in profit and loss: • Interest income is recognised using the effective interest rate method; and
• Dividend income is recognised when the shareholder’s right to receive payment has been established.
FOREIGN CURRENCY TRANSLATION Presentation currency The consolidated financial statements are presented in South African Rands which is the presentation currency and functional currency of the holding company in the group.
Foreign operations The results and financial position of all the group’s entities are measured using the currency of the primary economic environment in which the entity operates, namely the functional currency. Where the functional currency differs from that of the presentation currency, assets and liabilities are translated at the closing exchange rate and income and expenses are translated at average exchange rates.
The resulting translation difference is recognised as a separate component of equity, in other comprehensive income, until such time the foreign entity is disposed of, at which time the translation difference is recognised in profit or loss.
Transactions and balances Foreign currency transactions are recorded in the functional currency using the exchange rates prevailing at the transaction dates. Foreign exchange profits and losses resulting from the settlement of such transactions as well as the translation of monetary assets and liabilities denominated in foreign currencies are recognised in profit or loss.
TAXATION The tax expense for the period comprises current and deferred tax.
CURRENT TAXATION The current tax charge represents the calculated taxation payable on the taxable income for the year using substantively enacted tax rates and includes any adjustments to tax payable in respect of prior years.
Deferred taxation Deferred taxation is provided using the liability method for all temporary differences between the carrying amounts for financial reporting purposes and the tax base used for taxation purposes.
No deferred taxation is provided on temporary differences relating to: • goodwill;
• the initial recognition of an asset or liability to the extent that neither accounting nor taxable profit is affected on acquisition; and
• investments in subsidiaries to the extent they will probably not reverse in the foreseeable future.
A deferred tax asset is recognised to the extent that it is probable that future taxable income will be available against which any unused tax losses and deductible temporary differences can be utilised.
Enacted or substantively enacted tax rates that are expected to apply when the asset is realised or liability settled are used to determine the deferred tax provision at the reporting date.
Dividend taxation Dividend tax is withheld at a rate of 15% on all shareholders registered unless a shareholder qualifies for an exemption or at a lower rate in terms of double taxation agreements.
EMPLOYEE BENEFITS Defined contribution benefits Under defined contribution plans the group’s legal or constructive obligation is limited to the amount contributed to the fund. Consequently the risk that assets invested will be insufficient to meet the expected benefits is borne by the employees.
Contributions to a defined contribution plan in respect of the services rendered in a particular period are recognised as an expense in that period.
Leave pay Employee entitlements to annual leave are recognised when they accrue to employees. An accrual is made for the liability for annual leave, as a result of services provided by employees up to the reporting date.
PRINCIPAL ACCOUNTING POLICIES (continued)for the year ended 30 June 2016

18
WBHO CONSOLIDATED FINANCIAL STATEMENTS 2016
19
EMPLOYEE BENEFITS (continued) Bonus plans A liability for employee benefits in the form of bonus plans is recognised as a provision as past practice has created a valid expectation by employees that they will receive a bonus and amounts can be determined before the time of issuing the financial statements.
Share-based compensationThe group operates both equity-settled and cash-settled share-based schemes.
a) Equity-settled The fair value of shares and deferred delivery shares granted to employees is recognised as an employee expense with a corresponding
increase in equity. The fair value is measured at grant date taking into account the structure of the grant, and expensed over the period during which the employees are required to provide services in order to become unconditionally entitled to the equity instruments and allowing for an estimate of the number of shares that will eventually vest. The fair value of the instruments granted is measured using generally accepted valuation techniques, taking into account the terms and conditions upon which the instruments are granted. Where an employee resigns from the scheme, the estimated share based payment expense is adjusted such that on a cumulative basis, no expense is recognised in respect of that employee.
Where goods or services are received by the group in return for the equity compensation benefits, the fair value of the goods or services received is expensed on receipt of goods or, in the case of services, on a straight-line basis over their vesting periods. Where no goods or services can be determined to be received by the group the net cost of shares, as calculated above, is expensed in profit or loss immediately.
b) Cash-settled The fair value of the amount payable to employees in respect of share appreciation rights is recognised as an expense with a
corresponding increase in liabilities. The liability is re-measured at each reporting date or any settlement dates to fair value. The fair value of the instruments granted is measured by using valuation techniques.
TREASURY SHARES Shares held by the various trusts are treated as treasury shares. The shares are treated as a deduction from the issued and weighted average number of shares and the cost price of the shares is deducted from the share capital and share premium in the statement of financial position on consolidation. Dividends received on treasury shares are eliminated on consolidation. No profit or loss is recognised in profit or loss on the purchase, sale, issue or cancellation of the group’s own equity instruments.
EARNINGS PER SHARE AND HEADLINE EARNINGS PER SHAREEarnings per share is calculated by dividing attributable earnings by the weighted average number of ordinary shares in issue. Appropriate adjustments in terms of Circular 2/2015 issued by The South African Institute of Chartered Accountants are made in calculating headline earnings per share. Diluted earnings per share reflect the potential dilution that could occur if all the outstanding treasuring shares of the group are issued.
CONTINGENT LIABILITIES AND COMMITMENTS A contingent liability arises where:• there is a possible obligation that arises from past events where its existence will be confirmed by the occurrence or non-occurrence of one
or more uncertain future events not wholly within the control of the group; or
• a present obligation that arises from past events but has not been recognised as the outflow of economic benefits required to settle the obligation are not probable; or
• the amount of the obligation cannot be reliably measured.
RELATED PARTY TRANSACTIONS All subsidiaries, joint arrangements and associated companies of the group are related parties. A list of the major subsidiaries, joint ventures and associated companies are included in annexures 1 and 2 of these annual financial statements. All transactions with subsidiaries and associated companies were entered into under terms no more favourable than those with third parties and have been eliminated in the group accounts. Director and senior management emoluments as well as transactions with other related parties, are set out in note 24.
STANDARDS AND INTERPRETATIONS There were no significant new standards, amendments or interpretations effective in the current year.
At the date of authorisation of these annual financial statements there are a number of new standards, amendments and interpretations which will only be effective after the 2016 financial year. The significant ones are shown below:
Standard
Effective date – annual periods commencing on or after: Description
IFRS 15: Revenue from Contracts with Customers
1 January 2018 The new revenue standard incorporates all the revenue standards under one standard and applies a five step methodology to all contracts with customers which requires entities to recognise revenue to depict the transfer of goods and services to customers in an amount that reflects the consideration to which the entity expects to be entitled in exchange for those goods and services.
The standard will result in enhanced disclosures about revenue, provide guidance for transactions that were not previously addressed comprehensively and improve guidance for multiple-element arrangements.
The impact of the change will be evaluated.
IFRS 9: Financial instruments (2009 and 2010)
1 January 2018 This IFRS is part of the IASB’s project to replace IAS 39. IFRS 9 addresses classification and measurement, impairment hedge accounting and derecognition of financial assets.
A new approach to the classification of financial assets, which is driven by the business model has been introduced. A new business model was introduced which does not allow certain financial assets to be categorised as “fair value through other comprehensive income” in certain circumstances. A single impairment model is introduced and applied to all financial instruments as well as an “expected credit loss” model for the measurement of financial assets.
For hedge accounting a new model is introduced. The model aligns the accounting treatment with risk management activities of an entity, in addition to enhanced disclosures about risk management and the effect of hedge accounting on the financial statements.
Disclosure impact only.
IFRS 16: Leases 1 January 2019 The new leases standard incorporates all standards and interpretations relating to leases under one standard. It introduces a single lessee accounting model and requires a lessee to recognise assets and liabilities for all leases with a term of more than 12 months, unless the underlying asset is of low value. A lessee is required to recognise a right-of-use asset representing its right to use the underlying leased asset and a lease liability representing its obligation to make lease payments. A lessee measures right-of-use assets similarly to other non-financial assets (such as property, plant and equipment) and lease liabilities similarly to other financial liabilities. As a consequence, a lessee recognises depreciation of the right-of-use asset and interest on the lease liability, and also classifies cash repayments of the lease liability into a principal portion and an interest portion.
The impact of this change will be evaluated.
PRINCIPAL ACCOUNTING POLICIES (continued)for the year ended 30 June 2016
20
WBHO CONSOLIDATED FINANCIAL STATEMENTS 2016
21
NOTES TO THE FINANCIAL STATEMENTSfor the year ended 30 June 2016
Land andbuildings
R’000Aircraft
R’000
Plant, vehicles and
equipmentR’000
Office andcomputer
equipmentR’000
TotalR’000
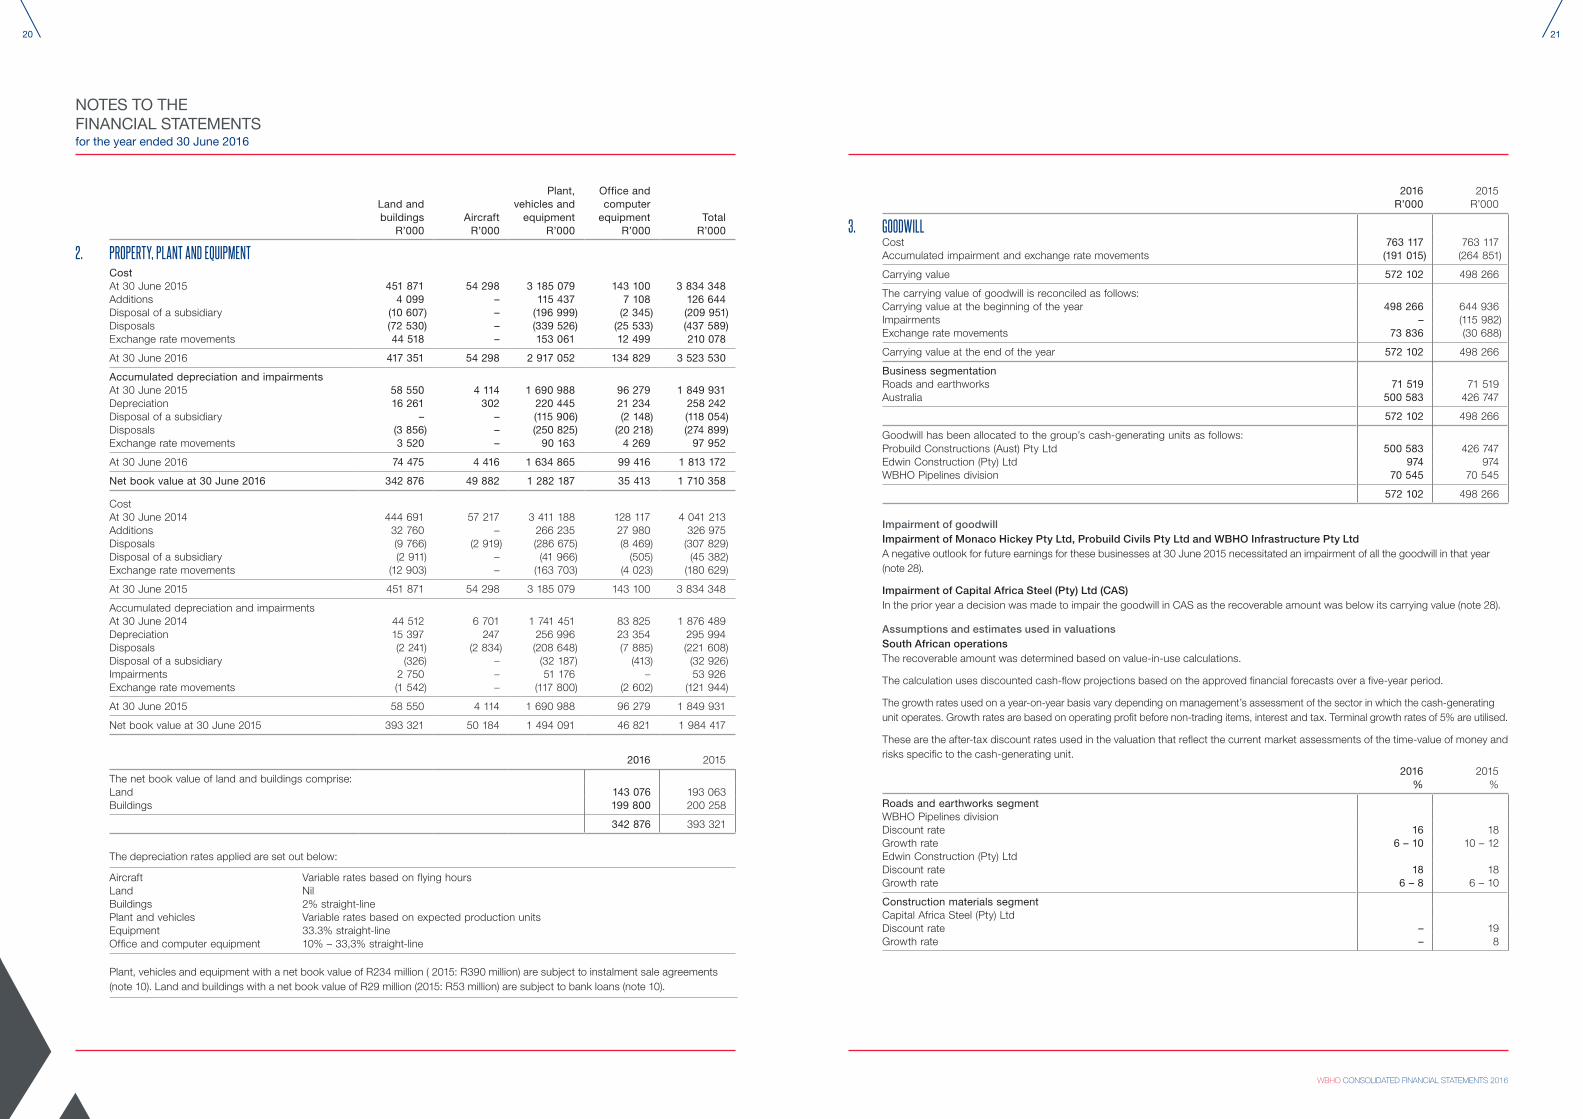
2. PROPERTY, PLANT AND EQUIPMENTCostAt 30 June 2015 451 871 54 298 3 185 079 143 100 3 834 348 Additions 4 099 – 115 437 7 108 126 644 Disposal of a subsidiary (10 607) – (196 999) (2 345) (209 951)Disposals (72 530) – (339 526) (25 533) (437 589)Exchange rate movements 44 518 – 153 061 12 499 210 078
At 30 June 2016 417 351 54 298 2 917 052 134 829 3 523 530
Accumulated depreciation and impairmentsAt 30 June 2015 58 550 4 114 1 690 988 96 279 1 849 931 Depreciation 16 261 302 220 445 21 234 258 242 Disposal of a subsidiary – – (115 906) (2 148) (118 054)Disposals (3 856) – (250 825) (20 218) (274 899)Exchange rate movements 3 520 – 90 163 4 269 97 952
At 30 June 2016 74 475 4 416 1 634 865 99 416 1 813 172
Net book value at 30 June 2016 342 876 49 882 1 282 187 35 413 1 710 358
CostAt 30 June 2014 444 691 57 217 3 411 188 128 117 4 041 213 Additions 32 760 – 266 235 27 980 326 975 Disposals (9 766) (2 919) (286 675) (8 469) (307 829)Disposal of a subsidiary (2 911) – (41 966) (505) (45 382)Exchange rate movements (12 903) – (163 703) (4 023) (180 629)
At 30 June 2015 451 871 54 298 3 185 079 143 100 3 834 348
Accumulated depreciation and impairmentsAt 30 June 2014 44 512 6 701 1 741 451 83 825 1 876 489 Depreciation 15 397 247 256 996 23 354 295 994 Disposals (2 241) (2 834) (208 648) (7 885) (221 608)Disposal of a subsidiary (326) – (32 187) (413) (32 926)Impairments 2 750 – 51 176 – 53 926 Exchange rate movements (1 542) – (117 800) (2 602) (121 944)
At 30 June 2015 58 550 4 114 1 690 988 96 279 1 849 931
Net book value at 30 June 2015 393 321 50 184 1 494 091 46 821 1 984 417
2016 2015
The net book value of land and buildings comprise:Land 143 076 193 063 Buildings 199 800 200 258
342 876 393 321
The depreciation rates applied are set out below:
Aircraft Variable rates based on flying hoursLand NilBuildings 2% straight-linePlant and vehicles Variable rates based on expected production unitsEquipment 33.3% straight-lineOffice and computer equipment 10% – 33,3% straight-line
Plant, vehicles and equipment with a net book value of R234 million ( 2015: R390 million) are subject to instalment sale agreements (note 10). Land and buildings with a net book value of R29 million (2015: R53 million) are subject to bank loans (note 10).
2016R’000
2015R’000
3. GOODWILLCost 763 117 763 117 Accumulated impairment and exchange rate movements (191 015) (264 851)
Carrying value 572 102 498 266
The carrying value of goodwill is reconciled as follows:Carrying value at the beginning of the year 498 266 644 936 Impairments – (115 982)Exchange rate movements 73 836 (30 688)
Carrying value at the end of the year 572 102 498 266
Business segmentationRoads and earthworks 71 519 71 519 Australia 500 583 426 747
572 102 498 266
Goodwill has been allocated to the group’s cash-generating units as follows:Probuild Constructions (Aust) Pty Ltd 500 583 426 747 Edwin Construction (Pty) Ltd 974 974 WBHO Pipelines division 70 545 70 545
572 102 498 266
Impairment of goodwillImpairment of Monaco Hickey Pty Ltd, Probuild Civils Pty Ltd and WBHO Infrastructure Pty LtdA negative outlook for future earnings for these businesses at 30 June 2015 necessitated an impairment of all the goodwill in that year (note 28).
Impairment of Capital Africa Steel (Pty) Ltd (CAS)In the prior year a decision was made to impair the goodwill in CAS as the recoverable amount was below its carrying value (note 28).
Assumptions and estimates used in valuationsSouth African operationsThe recoverable amount was determined based on value-in-use calculations.
The calculation uses discounted cash-flow projections based on the approved financial forecasts over a five-year period.
The growth rates used on a year-on-year basis vary depending on management’s assessment of the sector in which the cash-generating unit operates. Growth rates are based on operating profit before non-trading items, interest and tax. Terminal growth rates of 5% are utilised.
These are the after-tax discount rates used in the valuation that reflect the current market assessments of the time-value of money and risks specific to the cash-generating unit.
2016%
2015%
Roads and earthworks segmentWBHO Pipelines divisionDiscount rate 16 18Growth rate 6 – 10 10 – 12Edwin Construction (Pty) LtdDiscount rate 18 18Growth rate 6 – 8 6 – 10
Construction materials segmentCapital Africa Steel (Pty) LtdDiscount rate – 19Growth rate – 8

22
WBHO CONSOLIDATED FINANCIAL STATEMENTS 2016
23
NOTES TO THE FINANCIAL STATEMENTS (continued)for the year ended 30 June 2016
3. GOODWILL (CONTINUED)Assumptions and estimates used in valuations (continued)Australian operationsThe recoverable amount of the Australian cash-generating units was determined based on fair value less cost to sell. The estimation of the fair value has been determined using an earnings multiple method. The multiples used are benchmarked against similar companies in the construction sector in which the cash-generating unit operates and are as follows:
2016 2015%
Probuild Constructions (Aust) Pty Ltd 4,95 6,05
Sensitivity analysisShould one of the following changes be made to the above key assumptions, the carrying amount and recoverable amount would be equal:
WBHO Pipelines
division
Edwin Construction
(Pty) Ltd
ProbuildConstructions (Aust) Pty Ltd
Discount rate 20% 21% –Growth rate 3% <0% –Earnings multiple – – 3,05
2016 2015R’000 R’000
4. INVESTMENT IN ASSOCIATESInvestment at cost 67 716 64 080 Attributable post-acquisition profits, losses and equity movements 141 069 70 957 Loans advanced 138 386 68 886
347 171 203 923
The carrying value of investments in associates is reconciled as follows:Carrying value at the beginning of the year 203 923 97 847 Additions 3 636 18 085 Share of profits 45 659 46 189 Share of other comprehensive income 28 618 7 018 Dividends received (6 379) (13 181)Loans repaid – (13 785)Loans advanced 69 500 63 377 Exchange rate movements 2 214 (1 627)
Carrying value at the end of the year 347 171 203 923
Investment in associates include:
Effective interest Investments at cost Loans advanced
UnlistedCountry of
incorporation2016
%2015
%2016
R’0002015
R’0002016
R’0002015
R’000
Gigajoule International (Pty) Ltd South Africa 26,6 26,6 31 835 31 835 – – Ilembe Airport Construction Services (Pty) Ltd South Africa 28,3 28,3 3 3 – – Dipalopalo Concession (Pty) Ltd South Africa 27,7 27,7 – – 47 691 21 027 Saddleback Pty Ltd Australia 50,0 50,0 12 213 12 213 – – Gigajoule Power (Pty) Ltd South Africa 10,0 10,0 23 665 20 029 90 695 47 859
67 716 64 080 138 386 68 886
The loans are unsecured and will not be repaid within the next 12 months in terms of the loan agreements.The loan with Gigajoule Power (Pty) Ltd bears interest at 16,5% per annum.The loan with Dipalopalo Concession (Pty) Ltd bears interest at 13% per annum.
The aggregate assets and liabilities and the aggregate results from operations of associates are summarised as follows:
2016R’000
2015R’000
Non-current assets 4 340 635 2 458 159 Current assets 1 439 159 508 936
Total assets 5 779 794 2 967 095
Shareholders’ equity 1 697 341 916 467 Non-current liabilities 3 417 247 1 673 123 Current liabilities 665 206 377 505
Total equity and liabilities 5 779 794 2 967 095
Revenue 3 148 474 1 892 413 Net profit after tax 449 903 440 875 Other comprehensive income 124 982 45 914
Total comprehensive income for the year 574 885 486 789
The group’s share of profits in associates 45 659 46 189
The group has classified all entities over which it has significant influence but not control as associates.
5. INVESTMENTSClassified as fair value through profit and loss:Investments in concessionsAt fair value 280 280
Other investmentsAt cost 176 059 149 173 Accumulated fair value adjustments and exchange rate effects 25 603 (988)
Fair value 201 662 148 185
Total investments 201 942 148 465
Carrying value at the beginning of the year 148 185 96 717 Additions 27 874 58 127 Exchange rate movements 25 603 (6 659)
Carrying value at the end of the year 201 662 148 185
Entity Country of incorporation2016
% interest 2015
% interest
Rainprop (Pty) Ltd South Africa 2,5 2,5BPG Caulfield Village Pty Ltd Australia 30 30
The group’s interest in entities over which it has neither significant influence nor control are classified as investments.

24
WBHO CONSOLIDATED FINANCIAL STATEMENTS 2016
25
NOTES TO THE FINANCIAL STATEMENTS (continued)for the year ended 30 June 2016
2016R’000
2015R’000
6. LONG-TERM RECEIVABLESAt amortised cost:Secured loansMezzanine financing arrangements1 197 831 530 906 Loans to concession company2 2 200 2 305 Loans to employees for shares3 91 616 110 341 Property loans4 38 024 34 754 Consideration receivable5 140 000 –
469 671 678 306 Less: Current portion (note 9) (376 478) (565 660)
93 193 112 646
1 Mezzanine financing arrangements are secured by one or more of the following: third-party guarantees or listed company shares and bear interest at prime linked rates. Repayments are at terms agreed with each entity.
2 The concession company loan is secured through an option to exercise rights in terms of the preference share terms, bears interest at 16% and is repayable at the end of the concession.
3 Loans to employees for shares are secured by the shares issued, are interest-free and are repayable five years from the date of sale of the shares (note 27).
4 The loan is underwritten by a take-out agreement with a reputable, listed company and will be settled at the discretion of the directors. The loan bears interest at 9%.
5 Consideration receivable in respect of the disposal of 3Q Mahuma Concrete Holdings (Pty) Ltd. Upon settlement R40 million will be placed in escrow for a period of two years.
Unsecured loansProperty development loan1 3 000 4 639 Shareholders’ loans2 – 1 658
3 000 6 297
1. The loan is unsecured interest-free and has no fixed terms of repayment. The loan is interest-free.
2. The loans were unsecured and interest-free.
96 193 118 943
The fair value of long-term receivables is disclosed in note 25.
7. INVENTORIESConsumable stores 57 292 60 653 Raw materials 123 869 116 998 Finished goods 303 3 483 Manufacturing work in progress – 1 178 Properties for development 28 850 32 796
210 314 215 108
8. CONTRACTS IN PROGRESSCosts incurred to date 77 975 450 65 391 242 Plus: Profit recognised to date 5 742 990 4 673 559
83 718 440 70 064 801 Less: Work certified to date (85 437 030) (70 921 649)
Net amounts due to customers (1 718 590) (856 848)Payments received in advance (note 13) 315 537 416 334 Excess billings over work done 1 917 491 1 499 471
Amounts due by customers 514 438 1 058 957
2016R’000
2015R’000
9. TRADE AND OTHER RECEIVABLESContract receivables 3 806 273 3 701 898 Provisions for irrecoverable debts (171 029) (252 146)Contract retentions 241 849 218 538 Trade receivables 405 477 354 389Other receivables 86 486 246 953Current portion of long-term receivables (note 6) 376 478 565 660 Forward exchange contracts 3 725 –Prepayments 302 732 202 933 Value-added taxation 59 260 51 982
5 111 251 5 090 207
10. BORROWINGSAt amortised cost:Secured Capitalised finance leases (market-related interest rates linked to prime) 83 875 214 019 Bank loans (effective interest rate between 5,25% and 7,76%) 20 490 37 556
104 365 251 575 Less: Current portion of bank loans (20 490) –Less: Current portion of capitalised finance leases (66 865) (139 045)
17 010 112 530
Instalment salesCapitalised finance leases are for periods up to 48 months and are secured by certain plant, vehicles and equipment disclosed in note 2.The present value of future minimum payments on capitalised finance lease agreements is as follows:Due:Within one year 68 763 145 989 Within two to five years 18 877 81 235
Total capitalised finance lease obligation 87 640 227 224 Less: Future finance costs (3 765) (13 205)
Present value of finance lease obligations 83 875 214 019
Bank loansThe terms and conditions on the outstanding bank loans are as follows:
Interest rate Year of maturity
2016R’000
2015R’000
Westpac 4,59% 2017 20 490 36 511Secured by properties in Geraldton and Kwinana, Western Australia and is repayable monthly from July 2014 (note 2).
Nedbank 9,39% – – 1 045 Secured by a first covering mortgage bond over portion 1 of Erf1771 Ext 16, Limpopo Province (note 2). The property has been disposed of.
Bank loans 20 490 37 556
26
WBHO CONSOLIDATED FINANCIAL STATEMENTS 2016
27
NOTES TO THE FINANCIAL STATEMENTS (continued)for the year ended 30 June 2016
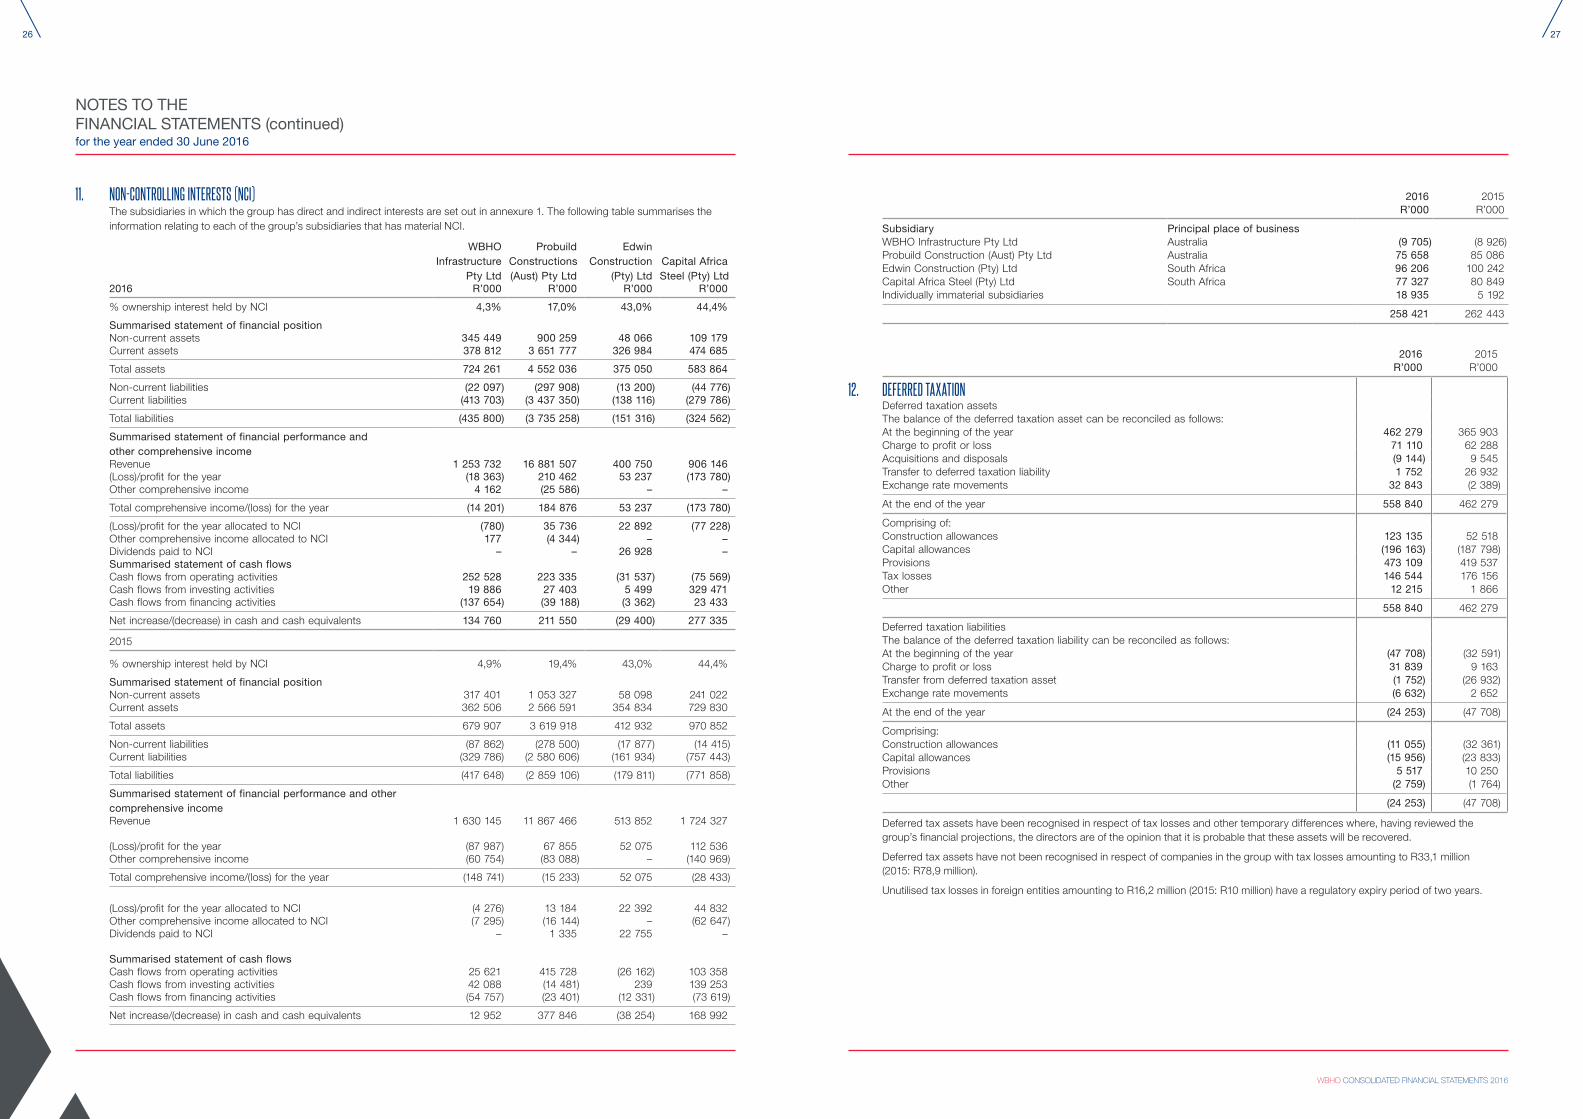
11. NON-CONTROLLING INTERESTS (NCI)The subsidiaries in which the group has direct and indirect interests are set out in annexure 1. The following table summarises the information relating to each of the group’s subsidiaries that has material NCI.
WBHO Infrastructure
Pty Ltd
Probuild Constructions (Aust) Pty Ltd
Edwin Construction
(Pty) LtdCapital Africa Steel (Pty) Ltd
2016 R’000 R’000 R’000 R’000
% ownership interest held by NCI 4,3% 17,0% 43,0% 44,4%
Summarised statement of financial positionNon-current assets 345 449 900 259 48 066 109 179Current assets 378 812 3 651 777 326 984 474 685
Total assets 724 261 4 552 036 375 050 583 864
Non-current liabilities (22 097) (297 908) (13 200) (44 776)Current liabilities (413 703) (3 437 350) (138 116) (279 786)
Total liabilities (435 800) (3 735 258) (151 316) (324 562)
Summarised statement of financial performance and other comprehensive incomeRevenue 1 253 732 16 881 507 400 750 906 146(Loss)/profit for the year (18 363) 210 462 53 237 (173 780)Other comprehensive income 4 162 (25 586) – –
Total comprehensive income/(loss) for the year (14 201) 184 876 53 237 (173 780)
(Loss)/profit for the year allocated to NCI (780) 35 736 22 892 (77 228)Other comprehensive income allocated to NCI 177 (4 344) – –Dividends paid to NCI – – 26 928 –Summarised statement of cash flowsCash flows from operating activities 252 528 223 335 (31 537) (75 569)Cash flows from investing activities 19 886 27 403 5 499 329 471Cash flows from financing activities (137 654) (39 188) (3 362) 23 433
Net increase/(decrease) in cash and cash equivalents 134 760 211 550 (29 400) 277 335
2015
% ownership interest held by NCI 4,9% 19,4% 43,0% 44,4%
Summarised statement of financial positionNon-current assets 317 401 1 053 327 58 098 241 022Current assets 362 506 2 566 591 354 834 729 830
Total assets 679 907 3 619 918 412 932 970 852
Non-current liabilities (87 862) (278 500) (17 877) (14 415)Current liabilities (329 786) (2 580 606) (161 934) (757 443)
Total liabilities (417 648) (2 859 106) (179 811) (771 858)
Summarised statement of financial performance and other comprehensive incomeRevenue 1 630 145 11 867 466 513 852 1 724 327
(Loss)/profit for the year (87 987) 67 855 52 075 112 536Other comprehensive income (60 754) (83 088) – (140 969)
Total comprehensive income/(loss) for the year (148 741) (15 233) 52 075 (28 433)
(Loss)/profit for the year allocated to NCI (4 276) 13 184 22 392 44 832Other comprehensive income allocated to NCI (7 295) (16 144) – (62 647)Dividends paid to NCI – 1 335 22 755 –
Summarised statement of cash flowsCash flows from operating activities 25 621 415 728 (26 162) 103 358Cash flows from investing activities 42 088 (14 481) 239 139 253Cash flows from financing activities (54 757) (23 401) (12 331) (73 619)
Net increase/(decrease) in cash and cash equivalents 12 952 377 846 (38 254) 168 992
2016 2015R’000 R’000
Subsidiary Principal place of businessWBHO Infrastructure Pty Ltd Australia (9 705) (8 926)Probuild Construction (Aust) Pty Ltd Australia 75 658 85 086Edwin Construction (Pty) Ltd South Africa 96 206 100 242Capital Africa Steel (Pty) Ltd South Africa 77 327 80 849Individually immaterial subsidiaries 18 935 5 192
258 421 262 443
2016R’000
2015R’000
12. DEFERRED TAXATIONDeferred taxation assetsThe balance of the deferred taxation asset can be reconciled as follows:At the beginning of the year 462 279 365 903 Charge to profit or loss 71 110 62 288 Acquisitions and disposals (9 144) 9 545 Transfer to deferred taxation liability 1 752 26 932 Exchange rate movements 32 843 (2 389)
At the end of the year 558 840 462 279
Comprising of:Construction allowances 123 135 52 518 Capital allowances (196 163) (187 798)Provisions 473 109 419 537 Tax losses 146 544 176 156 Other 12 215 1 866
558 840 462 279
Deferred taxation liabilitiesThe balance of the deferred taxation liability can be reconciled as follows:At the beginning of the year (47 708) (32 591)Charge to profit or loss 31 839 9 163 Transfer from deferred taxation asset (1 752) (26 932)Exchange rate movements (6 632) 2 652
At the end of the year (24 253) (47 708)
Comprising:Construction allowances (11 055) (32 361)Capital allowances (15 956) (23 833)Provisions 5 517 10 250 Other (2 759) (1 764)
(24 253) (47 708)
Deferred tax assets have been recognised in respect of tax losses and other temporary differences where, having reviewed the group’s financial projections, the directors are of the opinion that it is probable that these assets will be recovered.
Deferred tax assets have not been recognised in respect of companies in the group with tax losses amounting to R33,1 million (2015: R78,9 million).
Unutilised tax losses in foreign entities amounting to R16,2 million (2015: R10 million) have a regulatory expiry period of two years.
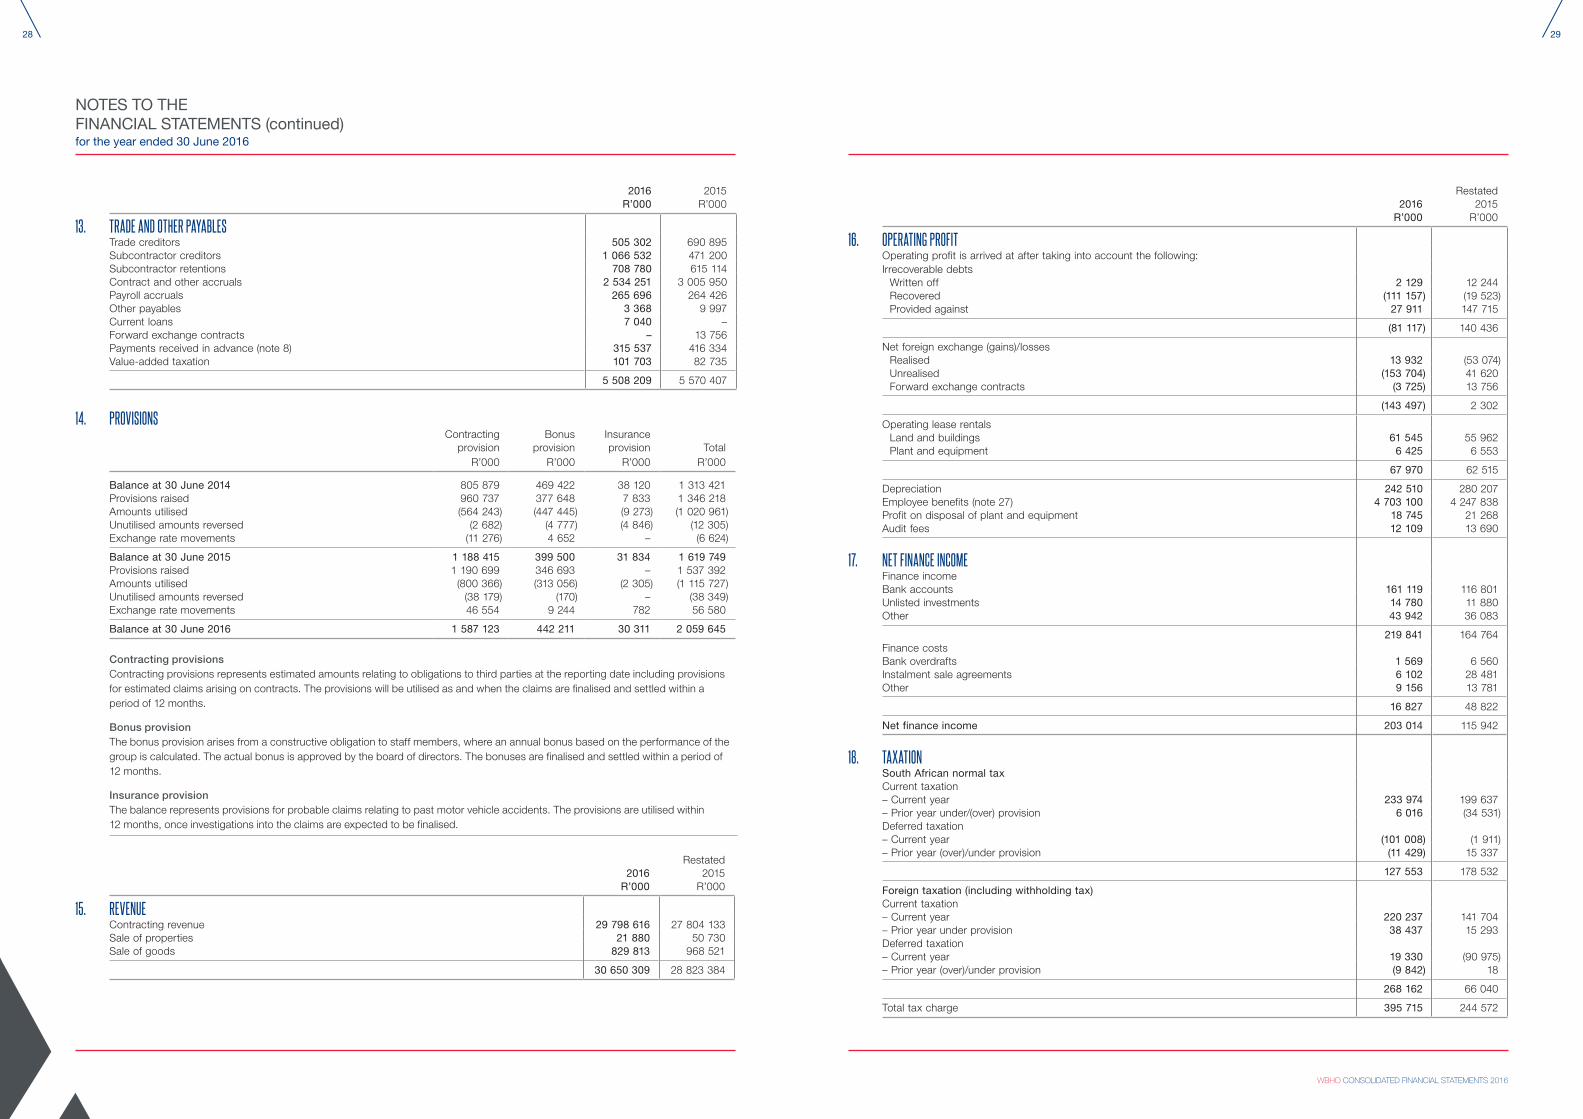
28
WBHO CONSOLIDATED FINANCIAL STATEMENTS 2016
29
NOTES TO THE FINANCIAL STATEMENTS (continued)for the year ended 30 June 2016
2016R’000
2015R’000
13. TRADE AND OTHER PAYABLESTrade creditors 505 302 690 895 Subcontractor creditors 1 066 532 471 200 Subcontractor retentions 708 780 615 114 Contract and other accruals 2 534 251 3 005 950 Payroll accruals 265 696 264 426 Other payables 3 368 9 997 Current loans 7 040 – Forward exchange contracts – 13 756 Payments received in advance (note 8) 315 537 416 334 Value-added taxation 101 703 82 735
5 508 209 5 570 407
14. PROVISIONS Contracting
provision R’000
Bonus provision
R’000
Insurance provision
R’000Total
R’000
Balance at 30 June 2014 805 879 469 422 38 120 1 313 421 Provisions raised 960 737 377 648 7 833 1 346 218 Amounts utilised (564 243) (447 445) (9 273) (1 020 961)Unutilised amounts reversed (2 682) (4 777) (4 846) (12 305)Exchange rate movements (11 276) 4 652 – (6 624)
Balance at 30 June 2015 1 188 415 399 500 31 834 1 619 749 Provisions raised 1 190 699 346 693 – 1 537 392Amounts utilised (800 366) (313 056) (2 305) (1 115 727)Unutilised amounts reversed (38 179) (170) – (38 349)Exchange rate movements 46 554 9 244 782 56 580
Balance at 30 June 2016 1 587 123 442 211 30 311 2 059 645
Contracting provisionsContracting provisions represents estimated amounts relating to obligations to third parties at the reporting date including provisions for estimated claims arising on contracts. The provisions will be utilised as and when the claims are finalised and settled within a period of 12 months.
Bonus provisionThe bonus provision arises from a constructive obligation to staff members, where an annual bonus based on the performance of the group is calculated. The actual bonus is approved by the board of directors. The bonuses are finalised and settled within a period of 12 months.
Insurance provisionThe balance represents provisions for probable claims relating to past motor vehicle accidents. The provisions are utilised within 12 months, once investigations into the claims are expected to be finalised.
2016R’000
Restated2015
R’000
15. REVENUEContracting revenue 29 798 616 27 804 133 Sale of properties 21 880 50 730 Sale of goods 829 813 968 521
30 650 309 28 823 384
2016R’000
Restated2015
R’000
16. OPERATING PROFITOperating profit is arrived at after taking into account the following:Irrecoverable debts
Written off 2 129 12 244 Recovered (111 157) (19 523)Provided against 27 911 147 715
(81 117) 140 436
Net foreign exchange (gains)/lossesRealised 13 932 (53 074)Unrealised (153 704) 41 620 Forward exchange contracts (3 725) 13 756
(143 497) 2 302
Operating lease rentals Land and buildings 61 545 55 962 Plant and equipment 6 425 6 553
67 970 62 515
Depreciation 242 510 280 207 Employee benefits (note 27) 4 703 100 4 247 838 Profit on disposal of plant and equipment 18 745 21 268 Audit fees 12 109 13 690
17. NET FINANCE INCOMEFinance incomeBank accounts 161 119 116 801 Unlisted investments 14 780 11 880 Other 43 942 36 083
219 841 164 764 Finance costsBank overdrafts 1 569 6 560 Instalment sale agreements 6 102 28 481 Other 9 156 13 781
16 827 48 822
Net finance income 203 014 115 942
18. TAXATION South African normal taxCurrent taxation– Current year 233 974 199 637 – Prior year under/(over) provision 6 016 (34 531)Deferred taxation– Current year (101 008) (1 911)– Prior year (over)/under provision (11 429) 15 337
127 553 178 532
Foreign taxation (including withholding tax)Current taxation– Current year 220 237 141 704 – Prior year under provision 38 437 15 293 Deferred taxation– Current year 19 330 (90 975)– Prior year (over)/under provision (9 842) 18
268 162 66 040
Total tax charge 395 715 244 572
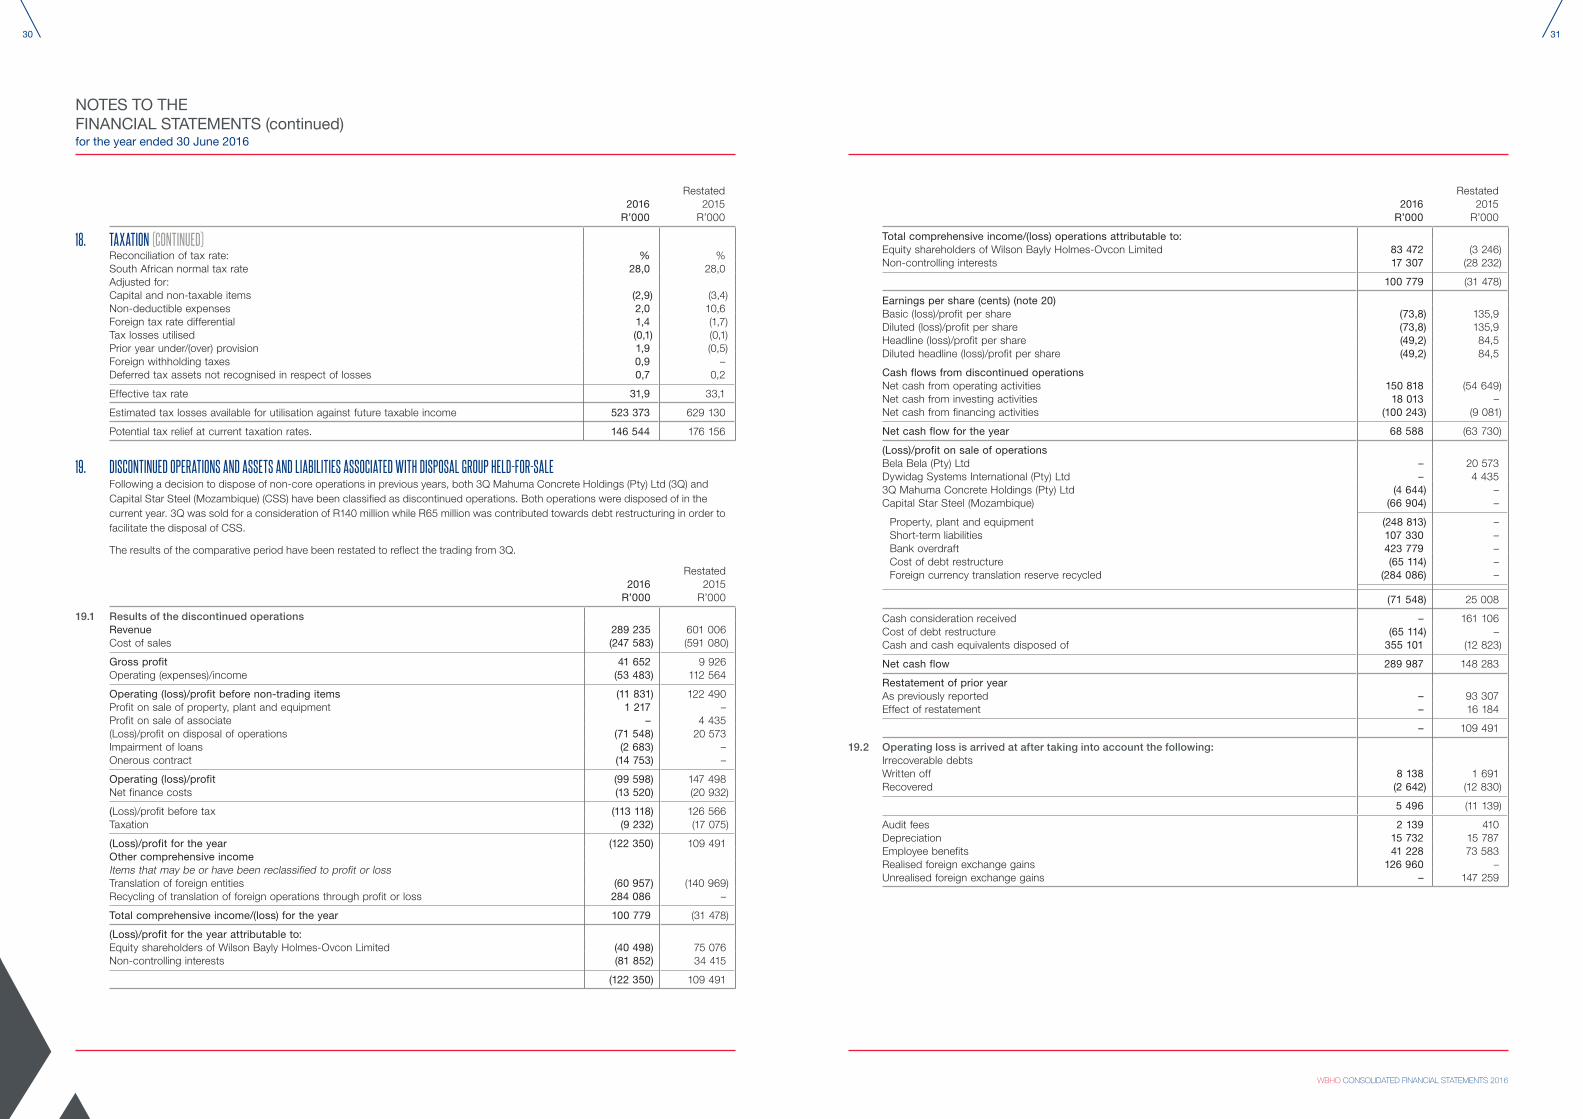
30
WBHO CONSOLIDATED FINANCIAL STATEMENTS 2016
31
NOTES TO THE FINANCIAL STATEMENTS (continued)for the year ended 30 June 2016
2016R’000
Restated2015
R’000
18. TAXATION (CONTINUED)Reconciliation of tax rate: % %South African normal tax rate 28,0 28,0Adjusted for:Capital and non-taxable items (2,9) (3,4)Non-deductible expenses 2,0 10,6Foreign tax rate differential 1,4 (1,7)Tax losses utilised (0,1) (0,1)Prior year under/(over) provision 1,9 (0,5)Foreign withholding taxes 0,9 –Deferred tax assets not recognised in respect of losses 0,7 0,2
Effective tax rate 31,9 33,1
Estimated tax losses available for utilisation against future taxable income 523 373 629 130
Potential tax relief at current taxation rates. 146 544 176 156
19. DISCONTINUED OPERATIONS AND ASSETS AND LIABILITIES ASSOCIATED WITH DISPOSAL GROUP HELD-FOR-SALEFollowing a decision to dispose of non-core operations in previous years, both 3Q Mahuma Concrete Holdings (Pty) Ltd (3Q) and Capital Star Steel (Mozambique) (CSS) have been classified as discontinued operations. Both operations were disposed of in the current year. 3Q was sold for a consideration of R140 million while R65 million was contributed towards debt restructuring in order to facilitate the disposal of CSS.
The results of the comparative period have been restated to reflect the trading from 3Q.
2016R’000
Restated 2015
R’000
19.1 Results of the discontinued operationsRevenue 289 235 601 006 Cost of sales (247 583) (591 080)
Gross profit 41 652 9 926 Operating (expenses)/income (53 483) 112 564
Operating (loss)/profit before non-trading items (11 831) 122 490 Profit on sale of property, plant and equipment 1 217 – Profit on sale of associate – 4 435 (Loss)/profit on disposal of operations (71 548) 20 573 Impairment of loans (2 683) – Onerous contract (14 753) –
Operating (loss)/profit (99 598) 147 498 Net finance costs (13 520) (20 932)
(Loss)/profit before tax (113 118) 126 566 Taxation (9 232) (17 075)
(Loss)/profit for the year (122 350) 109 491 Other comprehensive incomeItems that may be or have been reclassified to profit or lossTranslation of foreign entities (60 957) (140 969)Recycling of translation of foreign operations through profit or loss 284 086 –
Total comprehensive income/(loss) for the year 100 779 (31 478)
(Loss)/profit for the year attributable to:Equity shareholders of Wilson Bayly Holmes-Ovcon Limited (40 498) 75 076 Non-controlling interests (81 852) 34 415
(122 350) 109 491
2016R’000
Restated 2015
R’000
Total comprehensive income/(loss) operations attributable to:Equity shareholders of Wilson Bayly Holmes-Ovcon Limited 83 472 (3 246)Non-controlling interests 17 307 (28 232)
100 779 (31 478)
Earnings per share (cents) (note 20)Basic (loss)/profit per share (73,8) 135,9 Diluted (loss)/profit per share (73,8) 135,9 Headline (loss)/profit per share (49,2) 84,5 Diluted headline (loss)/profit per share (49,2) 84,5
Cash flows from discontinued operationsNet cash from operating activities 150 818 (54 649)Net cash from investing activities 18 013 – Net cash from financing activities (100 243) (9 081)
Net cash flow for the year 68 588 (63 730)
(Loss)/profit on sale of operationsBela Bela (Pty) Ltd – 20 573 Dywidag Systems International (Pty) Ltd – 4 435 3Q Mahuma Concrete Holdings (Pty) Ltd (4 644) –Capital Star Steel (Mozambique) (66 904) –
Property, plant and equipment (248 813) – Short-term liabilities 107 330 – Bank overdraft 423 779 – Cost of debt restructure (65 114) – Foreign currency translation reserve recycled (284 086) –
(71 548) 25 008
Cash consideration received – 161 106 Cost of debt restructure (65 114) – Cash and cash equivalents disposed of 355 101 (12 823)
Net cash flow 289 987 148 283
Restatement of prior yearAs previously reported – 93 307 Effect of restatement – 16 184
– 109 491
19.2 Operating loss is arrived at after taking into account the following:Irrecoverable debtsWritten off 8 138 1 691 Recovered (2 642) (12 830)
5 496 (11 139)
Audit fees 2 139 410 Depreciation 15 732 15 787 Employee benefits 41 228 73 583 Realised foreign exchange gains 126 960 – Unrealised foreign exchange gains – 147 259
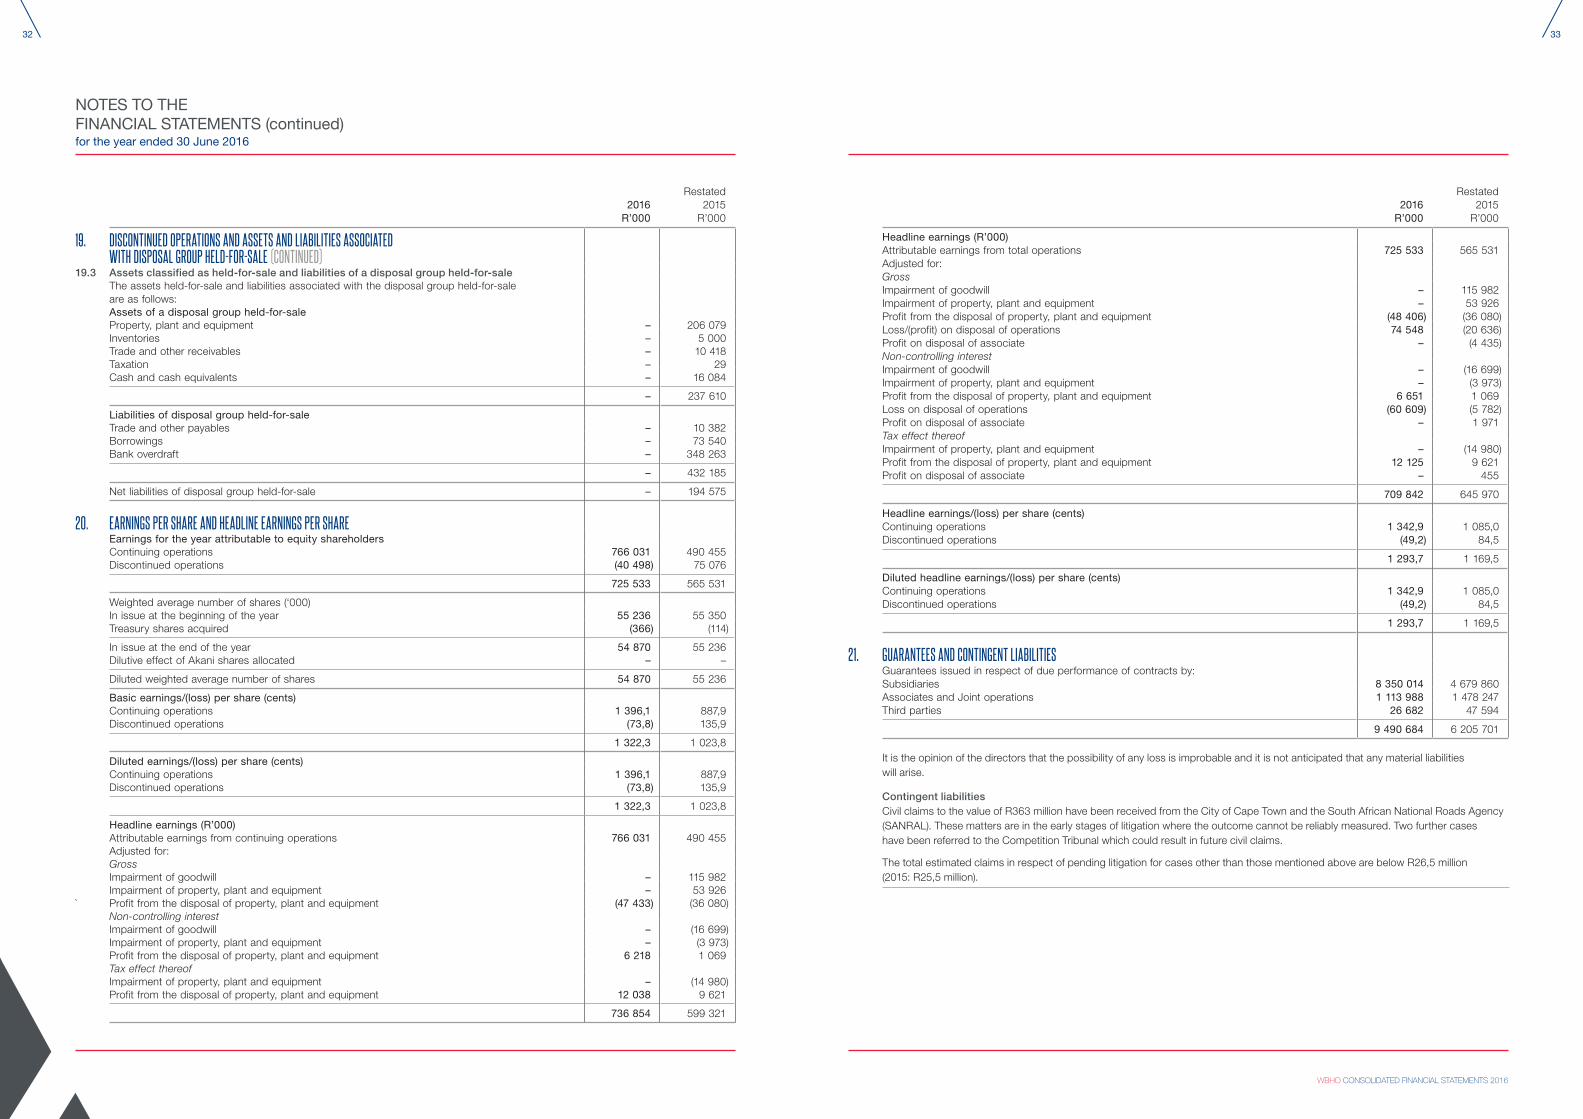
32
WBHO CONSOLIDATED FINANCIAL STATEMENTS 2016
33
NOTES TO THE FINANCIAL STATEMENTS (continued)for the year ended 30 June 2016
2016R’000
Restated 2015
R’000
19. DISCONTINUED OPERATIONS AND ASSETS AND LIABILITIES ASSOCIATED WITH DISPOSAL GROUP HELD-FOR-SALE (CONTINUED)
19.3 Assets classified as held-for-sale and liabilities of a disposal group held-for-saleThe assets held-for-sale and liabilities associated with the disposal group held-for-sale are as follows:Assets of a disposal group held-for-saleProperty, plant and equipment – 206 079 Inventories – 5 000 Trade and other receivables – 10 418 Taxation – 29 Cash and cash equivalents – 16 084
– 237 610
Liabilities of disposal group held-for-saleTrade and other payables – 10 382 Borrowings – 73 540 Bank overdraft – 348 263
– 432 185
Net liabilities of disposal group held-for-sale – 194 575
20. EARNINGS PER SHARE AND HEADLINE EARNINGS PER SHAREEarnings for the year attributable to equity shareholdersContinuing operations 766 031 490 455 Discontinued operations (40 498) 75 076
725 533 565 531
Weighted average number of shares (‘000)In issue at the beginning of the year 55 236 55 350 Treasury shares acquired (366) (114)
In issue at the end of the year 54 870 55 236 Dilutive effect of Akani shares allocated – –
Diluted weighted average number of shares 54 870 55 236
Basic earnings/(loss) per share (cents) Continuing operations 1 396,1 887,9 Discontinued operations (73,8) 135,9
1 322,3 1 023,8
Diluted earnings/(loss) per share (cents) Continuing operations 1 396,1 887,9 Discontinued operations (73,8) 135,9
1 322,3 1 023,8
Headline earnings (R’000)Attributable earnings from continuing operations 766 031 490 455 Adjusted for:GrossImpairment of goodwill – 115 982 Impairment of property, plant and equipment – 53 926
` Profit from the disposal of property, plant and equipment (47 433) (36 080)Non-controlling interestImpairment of goodwill – (16 699)Impairment of property, plant and equipment – (3 973)Profit from the disposal of property, plant and equipment 6 218 1 069 Tax effect thereofImpairment of property, plant and equipment – (14 980)Profit from the disposal of property, plant and equipment 12 038 9 621
736 854 599 321
2016R’000
Restated 2015
R’000
Headline earnings (R’000)Attributable earnings from total operations 725 533 565 531 Adjusted for:GrossImpairment of goodwill – 115 982 Impairment of property, plant and equipment – 53 926 Profit from the disposal of property, plant and equipment (48 406) (36 080)Loss/(profit) on disposal of operations 74 548 (20 636)Profit on disposal of associate – (4 435)Non-controlling interestImpairment of goodwill – (16 699)Impairment of property, plant and equipment – (3 973)Profit from the disposal of property, plant and equipment 6 651 1 069 Loss on disposal of operations (60 609) (5 782)Profit on disposal of associate – 1 971 Tax effect thereofImpairment of property, plant and equipment – (14 980)Profit from the disposal of property, plant and equipment 12 125 9 621 Profit on disposal of associate – 455
709 842 645 970
Headline earnings/(loss) per share (cents)Continuing operations 1 342,9 1 085,0 Discontinued operations (49,2) 84,5
1 293,7 1 169,5
Diluted headline earnings/(loss) per share (cents) Continuing operations 1 342,9 1 085,0 Discontinued operations (49,2) 84,5
1 293,7 1 169,5
21. GUARANTEES AND CONTINGENT LIABILITIESGuarantees issued in respect of due performance of contracts by:Subsidiaries 8 350 014 4 679 860 Associates and Joint operations 1 113 988 1 478 247 Third parties 26 682 47 594
9 490 684 6 205 701
It is the opinion of the directors that the possibility of any loss is improbable and it is not anticipated that any material liabilities will arise.
Contingent liabilitiesCivil claims to the value of R363 million have been received from the City of Cape Town and the South African National Roads Agency (SANRAL). These matters are in the early stages of litigation where the outcome cannot be reliably measured. Two further cases have been referred to the Competition Tribunal which could result in future civil claims.
The total estimated claims in respect of pending litigation for cases other than those mentioned above are below R26,5 million (2015: R25,5 million).

34
WBHO CONSOLIDATED FINANCIAL STATEMENTS 2016
35
NOTES TO THE FINANCIAL STATEMENTS (continued)for the year ended 30 June 2016
2016R’000
2015R’000
22. CAPITAL COMMITMENTSCapital commitments include expenditure relating to property, plant and equipment for which specific board approval has been obtained.Authorised and contracted for 14 960 3 593 Authorised but not yet contracted for 289 691 256 111
304 651 259 704
Expenditure on estimated commitments will occur within one year. Capital commitments will be funded from internal cash resources and existing facilities.
23. COMMITMENTS UNDER OPERATING LEASESThe minimum lease rentals to be paid under non-cancellable leases at 30 June are as follows:Buildings:Due within one year 38 534 28 452 Due later than one year but less than five years 114 112 71 031 Greater than five years 4 180 652
156 826 100 135
Plant and equipment:Due within one year 1 786 266 Due later than one year but less than five years 2 963 369
4 749 635
24 RELATED PARTY TRANSACTIONS24.1 Identification of related parties
The group has a related party relationship with its subsidiaries (annexure 1), associates (note 4), joint operations (annexure 2) and directors and prescribed officers.
24.2 Related party transactions and balancesDuring the year, group companies, in the ordinary course of business, entered into various inter-group sales and purchase transactions. These transactions are no less favourable than those arranged with third parties. Transactions and balances between the group companies have, where appropriate, been eliminated on consolidation and are not disclosed.
Details of transactions and balances with other related parties are set out below:Amounts owing by related partiesAmounts owing by associate companies 138 386 68 886Amounts owing by joint operations 24 018 30 064 The amounts are unsecured, interest-free and have no fixed terms of repayment.Amounts owing to related partiesAmounts owing to joint operations 3 368 9 997 The amounts are unsecured, interest-free and have no fixed terms of repayment.Transactions with related partiesContracts with associate companies 1 622 955 1 126 978 Interest and dividends received from related parties 6 379 13 181
Directors’fees
R’000Salaries
R’000
Incentive bonuses
R’000
Retirement and medical
R’000
Other benefits
R’000
Totalemoluments
R’000
24.3 Directors’ emoluments2016ExecutiveMS Wylie – 1 228 7 179 477 273 9 157 EL Nel – 1 724 8 461 511 261 10 957 CV Henwood – 1 608 8 065 481 316 10 470
– 4 560 23 705 1 469 850 30 584Non-executiveNS Maziya 414 – – – – 414 NS Mjoli-Mncube 366 – – – – 366 NNA Matyumza 629 – – – – 629 JM Ngobeni 357 – – – – 357 RW Gardiner 411 – – – – 411
2 177 – – – – 2 177
Total 2 177 4 560 23 705 1 469 850 32 761
2015ExecutiveMS Wylie – 1 200 4 272 470 262 6 204 EL Nel – 1 680 5 246 497 251 7 673 CV Henwood – 1 560 4 936 465 280 7 241
– 4 440 14 454 1 432 793 21 119 Non-executiveNS Maziya 350 – – – – 350 NS Mjoli-Mncube 437 – – – – 437 NNA Matyumza 656 – – – – 656 JM Ngobeni 351 – – – – 351 RW Gardiner 366 – – – – 366
2 160 – – – – 2 160
Total 2 160 4 440 14 454 1 432 793 23 279
24.4 Directors’ shareholdingThe interests of directors and those of their families in the share capital of the company are as follows:
2016 2015
Number of ordinary shares (‘000) Direct Indirect Total Direct Indirect Total
MS Wylie# – 758 758 – 900 900 EL Nel 261 – 261 261 – 261 CV Henwood~ 36 – 36 – 100 100 NS Maziya^ – 724 724 – 712 712 NS Mjoli-Mncube^ – 724 724 – 712 712 JM Ngobeni^ – 724 724 – 712 712
297 2 930 3 227 261 3 136 3 397
# The indirect shares are held by family trusts in which the director has no beneficial interest.~ During the year 100 000 shares held in the share schemes vested after settlement of all liabilities related to the shares. The participant held 36 286 shares in total.^ Shares disclosed in the above table are allocated shares in respect of the empowerment initiative of the group and do not represent the number of shares likely to vest
upon fulfilment of the vesting conditions. The number of WBHO shares that will ultimately vest is dependent on the market value on vesting date based on a predetermined threshold. Using the share price at 30 June 2016, the partners would receive no shares in terms of the formula, but would receive 90 873 shares acquired with dividends over duration of the scheme. This would result in a total vesting of 90 873 shares on the assumption that all taxes due would be paid by the partner. The indirect shares reflected at 30 June 2016 consist of 633 333 allocated shares and 90 873 dividend shares purchased on the open market.

36
WBHO CONSOLIDATED FINANCIAL STATEMENTS 2016
37
NOTES TO THE FINANCIAL STATEMENTS (continued)for the year ended 30 June 2016
24. RELATED PARTY TRANSACTIONS (CONTINUED)24.4 Directors’ shareholding (continued)
2016 2015
Long-term incentive scheme (LTIs) (‘000)
Share appreciation
rights Performance
shares Total
Share appreciation
rights Performance
shares Total
EL Nel 20 48 68 20 19 39 CV Henwood 19 44 63 19 18 37
39 92 131 39 37 76
The long-term incentives are part of the WBHO share plan, details of which are disclosed in note 27.
SalariesR’000
Incentive bonuses
R’000
Retirement and medical
R’000
Other benefits
R’000
Totalemoluments
R’000
24.5 Prescribed officers2016PJ Foley 1 608 7 200 479 219 9 506TR Armstrong 1 300 4 750 394 227 6 671S Vally-Kara 974 800 227 142 2 143RM Smith 1 212 6 000 353 305 7 870EA Mashishi 1 272 5 500 400 245 7 417
6 366 24 250 1 853 1 138 33 607
2015PJ Foley 1 560 5 000 463 215 7 238 TR Armstrong 1 260 3 800 380 227 5 667 S Vally-Kara 913 500 212 141 1 766 MJ Sprott* 792 2 375 264 203 3 634 RM Smith 1 440 5 000 425 270 7 135 EA Mashishi^ 1 188 4 500 373 267 6 328 L Cohen` 760 1 550 238 192 2 740
7 913 22 725 2 355 1 515 34 508
* Retired 30 June 2015^ Appointed 1 July 2014` Resigned 31 March 2015
24.6 Prescribed officers’ shareholdingThe interests of prescribed officers and those of their families in the share capital of the company are as follows:
2016 2015
Number of ordinary shares (‘000) Direct Indirect Total Direct Indirect Total
PJ Foley 78 – 78 78 – 78 TR Armstrong 14 504 518 14 514 528 MJ Sprott – – – 91 – 91 RM Smith 18 – 18 18 – 18 EA Mashishi 2 114 116 2 114 116 L Cohen – – – 49 – 49
112 618 730 252 628 880
RM Smith and EA Mashishi have 1,5% and 28% interest in Edwin Construction (Pty) Ltd respectively.
2016 2015
Long-term incentive scheme (LTIs) (‘000)
Share appreciation
rights Performance
shares Total
Share appreciation
rights Performance
shares Total
PJ Foley 19 44 63 19 18 37 S Vally-Kara 5 12 17 5 5 10 RM Smith 19 44 63 19 18 37 EA Mashishi 11 26 37 11 10 21
54 126 180 54 51 105
The long-term incentives are part of the WBHO share plan, details of which are disclosed in note 27.
Other material transactions with directorsThere were no other transactions with directors or entities in which directors have a material interest.
25. FINANCIAL INSTRUMENTS AND FINANCIAL RISK MANAGEMENT
OverviewThe group’s activities expose it to a variety of financial risks, including the effects of foreign currency exchange rates and interest rates. The group’s overall risk management programme focuses on the unpredictability of financial markets and seeks to minimise potential adverse effects on the financial performance of the group. Where appropriate, the group uses derivative financial instruments such as foreign exchange contracts to hedge expected exposures.
The group has exposure to the following risks through its use of financial instruments:• credit risk
• market risk
• liquidity risk
This note presents information about the group’s exposure to each of the above risks, the group’s objectives, policies and processes for measuring and managing risk and the group’s management of capital. Further quantitative disclosures are included throughout these financial statements.
The board of directors have overall responsibility for the establishment and oversight of the group’s risk management framework and set group policies and guidelines.
The group’s risk management policies are established to identify and analyse the risks faced by the group, to set appropriate risk limits and controls, and to monitor risks and adherence to limits. Risk management policies and systems are reviewed regularly to reflect changes in market conditions and the group’s activities. The group, through its training and management standards and procedures, aims to develop a disciplined and constructive control environment in which all employees understand their roles and obligations.
The treasury function monitors and controls these risks on a day-to-day basis. The risk committee meets on a regular basis to review the group’s management and implementation of risk strategies. The group’s internal audit department undertakes both regular and ad hoc reviews of risk management controls and procedures, the results of which are reported to the group audit committee.
The group’s strategy with regards to the management of these risks remains the same as in prior periods and there have been no changes to the risk profile of the group.

38
WBHO CONSOLIDATED FINANCIAL STATEMENTS 2016
39
NOTES TO THE FINANCIAL STATEMENTS (continued)for the year ended 30 June 2016
R’000
Total carrying
value
At fair value
through profit
or loss
Financial liabilities
held at amortised
cost
Loans and receivables
at amortised cost
25. FINANCIAL INSTRUMENTS AND FINANCIAL RISK MANAGEMENT (CONTINUED)Financial instruments by category2016Loans advanced to associated companies 138 386 – – 138 386 Investments 201 942 201 942 – – Long-term receivables 96 193 – – 96 193Amounts due by customers 514 438 – – 514 438 Trade and other receivables 4 749 260 3 725 – 4 745 535 Borrowings (104 364) – (104 364) – Excess billings over work done (1 917 491) – (1 917 491) – Trade and other payables (4 998 722) – (4 998 722) – Cash and cash equivalents 5 773 369 – – 5 773 369 Bank overdraft (21 175) – (21 175) –
4 431 836 205 667 (7 041 752) 11 267 921
2015Loans advanced to associated companies 68 886 – – 68 886 Investments 148 465 148 465 – – Long-term receivables1 118 943 – – 118 943 Amounts due by customers 1 058 957 – – 1 058 957 Trade and other receivables 4 835 292 – – 4 835 292 Borrowings (251 575) – (251 575) – Excess billings over work done (1 499 471) – (1 499 471) – Trade and other payables (5 071 338) (13 756) (5 057 582) – Cash and cash equivalents 3 995 089 – – 3 995 089
3 403 248 134 709 (6 808 628) 10 077 167
1. The fair value of long-term receivables, subject to market related interest rates, approximates fair value. The fair value of loans to employees for shares is calculated at R87 million (2015: R88 million) discounted using a rate of 10,50% (2015: 9,50%).
Fair valueAt 30 June 2016 the carrying amounts of all financial instruments approximated their fair values unless otherwise disclosed. The group does not trade in financial instruments and only enters into contracts as a means of hedging open exposures.
The level in the fair value hierarchy within which the financial asset or financial liability is categorised is determined on the basis of the lowest level input that is significant to the fair value measurement. Financial assets and liabilities are classified in their entirety into one of the three levels.
R’000 Level 2 Level 3 Total
2016Financial assets at fair value through profit and loss:Investments – 201 942 201 942 Derivative financial assets 3 725 – 3 725
3 725 201 942 205 667
2015Financial assets at fair value through profit and loss:Investments – 148 465 148 465
– 148 465 148 465
Financial liabilities at fair value through profit and loss:Derivative financial liabilities (13 756) – (13 756)
(13 756) – (13 756)
Level 2 investments relate to foreign exchange contracts (FECs). The valuation of these instruments is performed by reputable financial institutions.
Level 3 investments relate only to unlisted investments. After giving due consideration to market conditions, fair value is deemed to approximate cost.
The directors are of the opinion that changes to the inputs would not have a material effect on the future value as determined.
25.1 Credit riskCredit risk is the risk of financial loss to the group if a customer or counterparty to a financial instrument fails to meet its contractual obligations and arises principally from the group’s long-term receivables, trade and other receivables and cash and cash equivalents maintained with financial institutions.
Long-term receivablesThe group is exposed to credit risk through loans advanced to certain entities and employees. The group mitigates these risks firstly through the careful selection of entities to whom advances are made by the credit committee and secondly by obtaining sufficient security in order to be able to extinguish the debt in the event of default. Where loans are unsecured the group owns an equity interest in the entity and is able to influence the decision making of such entities. Loans to employees are predominantly for shares sold in terms of the share schemes and the shares themselves are held as security for the loans advanced.
Trade and other receivablesThe group’s exposure to credit risk is influenced mainly by the individual characteristics of each customer. The demographics of the group’s customer base, including the default risk of the industry and country in which customers operate, has less of an influence on credit risk
Construction contractsWhere the group is exposed to credit risk through construction contracts, in most instances, the group either negotiates or tenders for the contracts to which it became a party. As a result, the group is able to evaluate prospective clients prior to the commencement of any project. Additionally, for all contracts other than those concluded with government departments, the group insists on receipt of a payment guarantee equal to the value of the contract sum. Any relaxation of this policy must be approved by the credit committee. Where no guarantee has been obtained the group holds a lien over the work-in-progress.
Sale of propertiesWhere the group is exposed to credit risk through the sale of properties, the risk is fully mitigated by retaining title over such properties until the purchase price has been settled in full.
Sale of goodsNew customers are analysed individually for credit worthiness using external ratings and in some cases bank references. Where a credit facility is granted the group requests a guarantee for the value of the facility. Where no facilities are granted customers are required to deposit cash in advance.
Irrecoverable receivablesThe group establishes an allowance for impairment that represents its estimate of anticipated losses in respect of trade and other receivables. The main component of this allowance relates to individually significant exposures where the nature of customers, overdue accounts and collateral held are taken into account.
Cash and cash equivalentsThe group limits its exposure to credit risk by only investing in liquid securities and only with reputable financial institutions. Cash and cash equivalents are held with financial institutions which are rated between AAA and BBB based on Fitch ratings.

40
WBHO CONSOLIDATED FINANCIAL STATEMENTS 2016
41
NOTES TO THE FINANCIAL STATEMENTS (continued)for the year ended 30 June 2016
25. FINANCIAL INSTRUMENTS AND FINANCIAL RISK MANAGEMENT (CONTINUED)25.1 Credit risk (continued)
The group’s exposure to credit risk together with an analysis of amounts past due is disclosed below.
Payment past due analysis and allowance for impairment:
R‘000Carrying amount
Not past due
Payment past due
1–30 days
Payment past due 31–120
days
Payment past due
> 120 days
All payments past due
>120 days: Provision for
impairment
2016Trade and other receivables 4 745 533 4 423 940 144 268 122 480 225 874 (171 029)Cash and cash equivalents 5 773 369 5 773 369 – – – – Long-term receivables 96 193 96 193 – – – – Loans advanced to associated companies 138 386 138 386 – – – –
10 753 481 10 431 888 144 268 122 480 225 874 (171 029)
2015Trade and other receivables 4 835 292 4 417 876 229 169 135 685 304 708 (252 146)Cash and cash equivalents 3 995 089 3 995 089 – – – – Long-term receivables 118 943 118 943 – – – – Loans advanced to associated companies 68 886 68 886 – – – –
9 018 210 8 600 794 229 169 135 685 304 708 (252 146)
Reconciliation of the provision for impairment losses:
R‘000
Trade and other
receivables
2016Balance at the beginning of the year 252 146 Impairment losses reversed (83 246)Amounts written off 2 129
Balance at the end of the year 171 029
2015Balance at the beginning of the year 111 710 Impairment losses recognised 128 192 Amounts written off 12 244
Balance at the end of the year 252 146
Amounts outstanding for greater than 30 days, which have not been impaired, are considered fully collectable based on historic payment behaviour and extensive analysis of the individual circumstances in respect of each amount.
The impairment account is used to record the anticipated impairment losses within the group. When management is satisfied that no recovery of the amount is possible, the amount considered irrecoverable is written off directly to profit and loss.
25.2 Market risk (Currency risk)
Transactions in a foreign currency settled in that foreign currencyTransactions with certain of the group’s operations occur in various foreign currencies and consequently are exposed to exchange rate fluctuations that have an impact on cash flows and financing activities. These transactions are entered into in the respective functional currencies of the individual operations and the group mitigates this risk by settling the transactions with cash balances maintained in the various currencies utilised.
Transactions in a foreign currency settled in South African RandsSome operations are exposed to foreign currency risk in connection with contracted payments in currencies not in their individual functional currencies. The group manages this risk through the selective use of forward exchange contracts and cross currency swaps. Forward exchange contracts are used primarily to reduce foreign currency exposure relating to imports into South Africa. Where funds are repatriated back to South Africa, forward exchange contracts are used to mitigate the risk of foreign currency fluctuations.
The group’s exposure to significant foreign denominated monetary assets and liabilities is as follows:
R’000 US DollarMozambique
MeticalsAustralian
DollarBotswana
PulaZambia
KwachaGhanaian
Cedi
2016Trade and other receivables 278 599 55 512 1 992 288 74 554 7 577 13 179 Cash and cash equivalents 790 888 20 351 1 856 573 388 076 248 462 33 857 Trade and other payables (98 641) (38 247) (3 164 136) (38 601) (15 195) (29 438)Borrowings – – (12 764) – – –
970 846 37 616 671 961 424 029 240 844 17 598
Closing rate 14,78 0,23 11,04 1,33 1,43 3,74 Average rate 14,46 0,31 10,53 1,32 1,41 3,73
2015Trade and other receivables 599 612 121 236 2 070 149 183 031 20 753 2 101 Cash and cash equivalents 662 727 39 278 1 252 467 218 214 4 436 17 917 Trade and other payables (356 463) (71 175) (3 418 919) (20 717) (19 260) (65 813)Borrowings – – (63 019) – – –
905 876 89 339 (159 322) 380 528 5 929 (45 795)
Closing rate 12,26 0,32 9,40 1,20 1,64 2,80 Average rate 11,45 0,35 9,56 1,20 1,72 3,27
Forward exchange contracts The group has entered into forward exchange contracts during the year in order to mitigate foreign exchange risks associated with the supply of foreign goods and services within particular contracts.
The following forward exchange contracts and cross currency swaps were held during the year and at 30 June:
Contract foreign
currencyamountFC 000
Contract Rand
equivalent amount
R’000
Averagerate of
exchange(calculated)
Actual/ estimated fair value
gain/(loss) R’000
2016Relating to transactions which have already occurredUS Dollar 378 6 113 16,2 (352)Related to commitments surrendered at year endUS Dollar 700 10 143 14,5 (1 446)Related to future commitmentsUS Dollar 13 657 202 042 14,8 337 Chinese Yuan 33 525 74 401 2,2 (25)
2015Relating to transactions which have already occurredUS Dollar 950 11 516 12,1 (34)Euro 3 858 53 967 14,0 (3 831)Related to commitments surrendered at year endEuro 11 124 168 177 15,1 (20 139)Related to future commitmentsUS Dollar 8 149 97 520 12,0 1
Expected cash flows to settle derivative financial instruments occurring within one year amounts to R114,9 million (2015: R97,5 million).

42
WBHO CONSOLIDATED FINANCIAL STATEMENTS 2016
43
NOTES TO THE FINANCIAL STATEMENTS (continued)for the year ended 30 June 2016
25. FINANCIAL INSTRUMENTS AND FINANCIAL RISK MANAGEMENT (CONTINUED)25.2 Market risk (Currency risk)
Sensitivity analysisA 10% weakening of the Rand against the following currencies at 30 June would affect, profit or loss in respect of the translation of the balances of the following monetary items by the amounts shown below. The analysis assumes that all other variables, in particular interest rates, remain constant and is applied against the gross statement of financial position exposure and forward exchange contracts at reporting date.
R‘000 US Dollar Mozambique
Meticals Australian
Dollar Botswana
Pula Zambia Kwacha
Ghanaian Cedi
2016Trade and other receivables 27 860 5 551 199 229 7 455 758 1 318 Cash and cash equivalents 79 089 2 035 185 657 38 808 24 846 3 386 Trade and other payables (9 864) (3 825) (316 414) (3 860) (1 520) (2 944)Borrowings – – (1 276) – – –
Total 97 085 3 761 67 196 42 403 24 084 1 760
2015Trade and other receivables 59 961 12 124 207 015 18 303 2 075 210 Cash and cash equivalents 66 273 3 928 125 247 21 821 444 1 792 Trade and other payables (35 646) (7 118) (341 892) (2 072) (1 926) (6 581)Borrowings – – (6 302) – – –
Total 90 588 8 934 (15 932) 38 052 593 (4 579)
A 10% strengthening of the Rand against the above currencies at 30 June would have had the equal but opposite effect to the amount shown above, on the basis that all other variables remain constant.
25.3 Market risk (Interest rate risk)The group has adopted a policy where exposure to interest rate risk is on a floating rate basis linked to market rates on interest-bearing bank deposits, borrowings and loans advanced.
At the reporting date the interest rate profile of the group’s financial instruments was:
Interest bearing
R’000Carrying amount
Linked to prime rate Fixed rate Interest free
2016Loans to associate companies 138 386 – 138 386 – Long-term receivables 96 193 17 852 – 78 341Trade and other receivables 4 749 260 342 411 42 424 4 364 425 Borrowings (104 364) (104 364) – – Trade and other payables (4 998 722) – – (4 998 722)Cash and cash equivalents 5 773 369 5 773 369 – – Bank overdraft (21 175) (21 175) – –
5 632 947 6 008 093 180 810 (555 956)
2015Loans to associate companies 68 886 – 68 886 – Long-term receivables 118 943 4 639 – 114 304 Trade and other receivables 4 835 292 565 660 – 4 269 632 Borrowings (251 575) (251 575) – – Trade and other payables (5 071 338) – – (5 071 338)Cash and cash equivalents 3 995 089 3 995 089 – –
3 695 297 4 313 813 68 886 (687 402)
Sensitivity analysisA change of 75 basis points in interest rates at the reporting date would have increased or decreased profit for the following year by the amounts shown below. This analysis assumes that all other variables remain constant and is based on closing balances compounded monthly.
R‘000
Profit/(loss)75 basis point
increase
Profit/(loss)75 basis point
decrease
2016Long-term receivables 134 (134)Trade and other receivables 2 568 (2 568)Cash and cash equivalents 43 300 (43 300)Bank overdraft (159) 159 Borrowings (783) 783
45 060 (45 060)
Profit/(loss)150 basis point
increase
Profit/(loss)150 basis point
decrease
2015Long-term receivables 1 033 (1 033)Trade and other receivables 8 485 (8 485)Cash and cash equivalents 59 926 (59 926)Borrowings (3 774) 3 774
65 670 (65 670)
25.4 Liquidity riskLiquidity risk is the risk that the group will not be able to meet its financial obligations as they fall due.
The group’s approach to managing liquidity is to ensure, as far as possible, that it will have sufficient liquidity to meet its liabilities under both normal and stressed conditions, without incurring unacceptable losses or risking damage to the group’s reputation.
Cash flow forecasting within the group typically ensures that it has sufficient cash available, as well as lines of credit, to meet expected operational expenses including the servicing of financial obligations. The potential impacts of extreme circumstances that cannot reasonably be predicted such as major catastrophes like property damage, business interruption, public liability and political riot are covered by local and group short-term insurance.
The following are the contractual maturities of the group’s financial liabilities:
R’000 Total < 1 years 2 – 5 years > 5 years
2016Non-derivative liabilities measured at amortised cost Borrowings 104 365 87 355 17 010 – Other financial liabilities 3 223 410 3 223 410 – – Sub-contractor liabilities 1 775 312 1 775 312 – – Bank overdraft 21 175 21 175 – –
5 124 262 5 107 252 17 010 –
2015Non-derivative liabilities measured at amortised cost Borrowings 251 575 139 045 112 158 372 Other financial liabilities 3 971 268 3 948 534 22 734 – Sub-contractor liabilities 1 086 314 1 086 314 – – Derivative financial liabilities at fair valueForward exchange contracts 13 756 13 756 – –
5 322 913 5 187 649 134 892 372
The group expects to meet its other obligations from operating cash flows and proceeds of maturing financial assets,as well as from current cash reserves (note 29.3) currently held at the various financial institutions.
The group does not at this point require or have any other structured financing facilities in place, apart from asset specific finance agreements (note 10) and a daily notional overdraft facility of R40 million.

44
WBHO CONSOLIDATED FINANCIAL STATEMENTS 2016
45
NOTES TO THE FINANCIAL STATEMENTS (continued)for the year ended 30 June 2016
26. CAPITAL MANAGEMENTTo provide returns for shareholders and benefits for other stakeholders and to maintain optimal structure to reduce the cost of capital, the group policy maintains an adequate capital base.
Capital comprises shareholders’ equity, including capital and reserves. In order to maintain or adjust the capital structure, the group may adjust the amount of dividends paid to shareholders, return capital to shareholders, issue new shares or sell assets to reduce debt.
The level of dividends paid by the group is determined with reference to the liquidity and solvency of the group as well as consideration of budgets and forecasts.
The group follows a conservative approach to its statement of financial position assuming low levels of debt and maintaining substantial cash balances. Given the cyclical and often unpredictable nature of the construction environment, we believe this approach to be appropriate in providing flexibility to the group during difficult times and in protecting shareholder value.
2016 2015
Debt/equity ratio (%) 2,2 5,9
This measure has been revised and recalculated to be total capitalised interest-bearing liabilities as a percentage of average shareholders’ interest.
2016R’000
2015R’000
27. EMPLOYEE BENEFITS27.1 Staff costs
Wages and salaries 4 158 066 3 702 224 Provident cost – defined contribution funds 132 867 140 073 Superannuation and provident expense 13 673 74 507 Medical aid 2 519 2 120 Other contributions 395 975 328 914
4 703 100 4 247 838
27.2 Defined contribution funds WBHO Staff Provident Fund
The fund is open to all full-time monthly paid employees of the company.
27.3 Equity compensation benefits The WBHO Share Plan
This scheme was introduced to provide long-term incentives to executives and prescribed officers.
Share Appreciation Rights (SARS)Annual allocations, determined by the Remuneration Committee are made to participants based on the fair market value of the shares on the allocation date. Rights will be available for settlement, subject to the achievement of the performance criteria, in equal thirds on the 3rd, 4th and 5th anniversaries, but need not be exercised until the 7th anniversary. On settlement, the value accruing to the participants will be the full appreciation of the share price over the vesting period.
The performance target threshold is the average growth in adjusted headline earnings per share (HEPS) compared against the average CPI plus 3%. The average calculation will be determined annually in three-year cycles.
Performance Shares (PS)Performance shares will be made annually to participants for which there will be no consideration payable. Vesting will commence on the 3rd anniversary of the award to the extent that the company has met the specified performance criteria over the vesting period. Being a full value share element, essentially without a strike price, the number of shares that vest will depend on the extent of the company performance over the three year vesting period.
Weight Threshold Target vesting Stretch
Return on capital employed 50% 14% 16% 20%Relative total shareholder return (TSR) 50% 7th position 5th position 2nd position
In calculating the share-based payment expense, valuations were performed using the Binomial model. The probability of achieving the TSR performance condition for the performance shares has been measured by a Monte Carlo simulation.
The following assumptions were made in arriving at the share-based payment expense estimate:
PS SARS
Volatility (%) N/A 22,1 – 22,6 – Volatility has been calculated using the historical WBHO share prices over the vesting periodsRisk-free rate (%) N/A 6,9 – 7,4 Dividend yield (%) 2,3 2,3 – 2,5 Attrition rate (%) 5,0 5,0
Number of conditional
awards‘000 Issue date
Issue price (cents)
Exercise price
(cents) Vesting period
Share-based payment
expense for the year
Future expense
to be recognised
Performance shares2014 128 16/03/2015 10 795 N/A 3 years 7 141 14 515 2015 194 7/12/2015 11 175 N/A 3 years 6 916 28 651 SARS 137 16/03/2015 10 795 11 540 3 – 5 years – –
Total 14 057 43 166
At 30 june 2016, the share appreciation rights criteria had not been met as the share price had not appreciated at CPI+3%.
For performance shares the actual results for the 2016 financial year are as follows:
Offer 2014 Performance
shares
Offer 2015 Performance
shares
Return on capital employed 20,5% 23,0%Relative total shareholder return (TSR) 2nd 1st
The WBHO Share Trust The trust is a special purpose vehicle through which the group sells shares to employees with the aim of retaining existing talent within the group. The shares are sold to employees at market value at the date of issue. At the time of the sale, a loan equal to the value of the shares sold, is raised for each identified employee. The employee is required to pledge the shares to the trust as security against the loan.
The loan must be repaid after, but not before, a period of five years. Any dividends earned from the shares during that period are set off against the balance of the loan. The trustees are entitled to buy back from the employee sufficient shares to settle any amount outstanding on the loan once the five-year period has elapsed. Should a scheme member leave the employ of the company before the five-year period has elapsed, the member is obliged to sell the shares back to the trust at the same price at which they were purchased. Details relating to the number of shares issued to the trust, the selling prices to employees and the accompanying share based expense are set out in the following table:
50 000 shares vested in the current year as the vesting condition had been met. The relevant number of shares were sold on the open market to settle the balance of the loan.
Number ofshares
‘000
Averageselling
price persharecents
Share-basedpayments
expensefor the year
R’000
Future expense to be
recognisedR’000
Unsold treasury shares 42 n/a n/a n/a
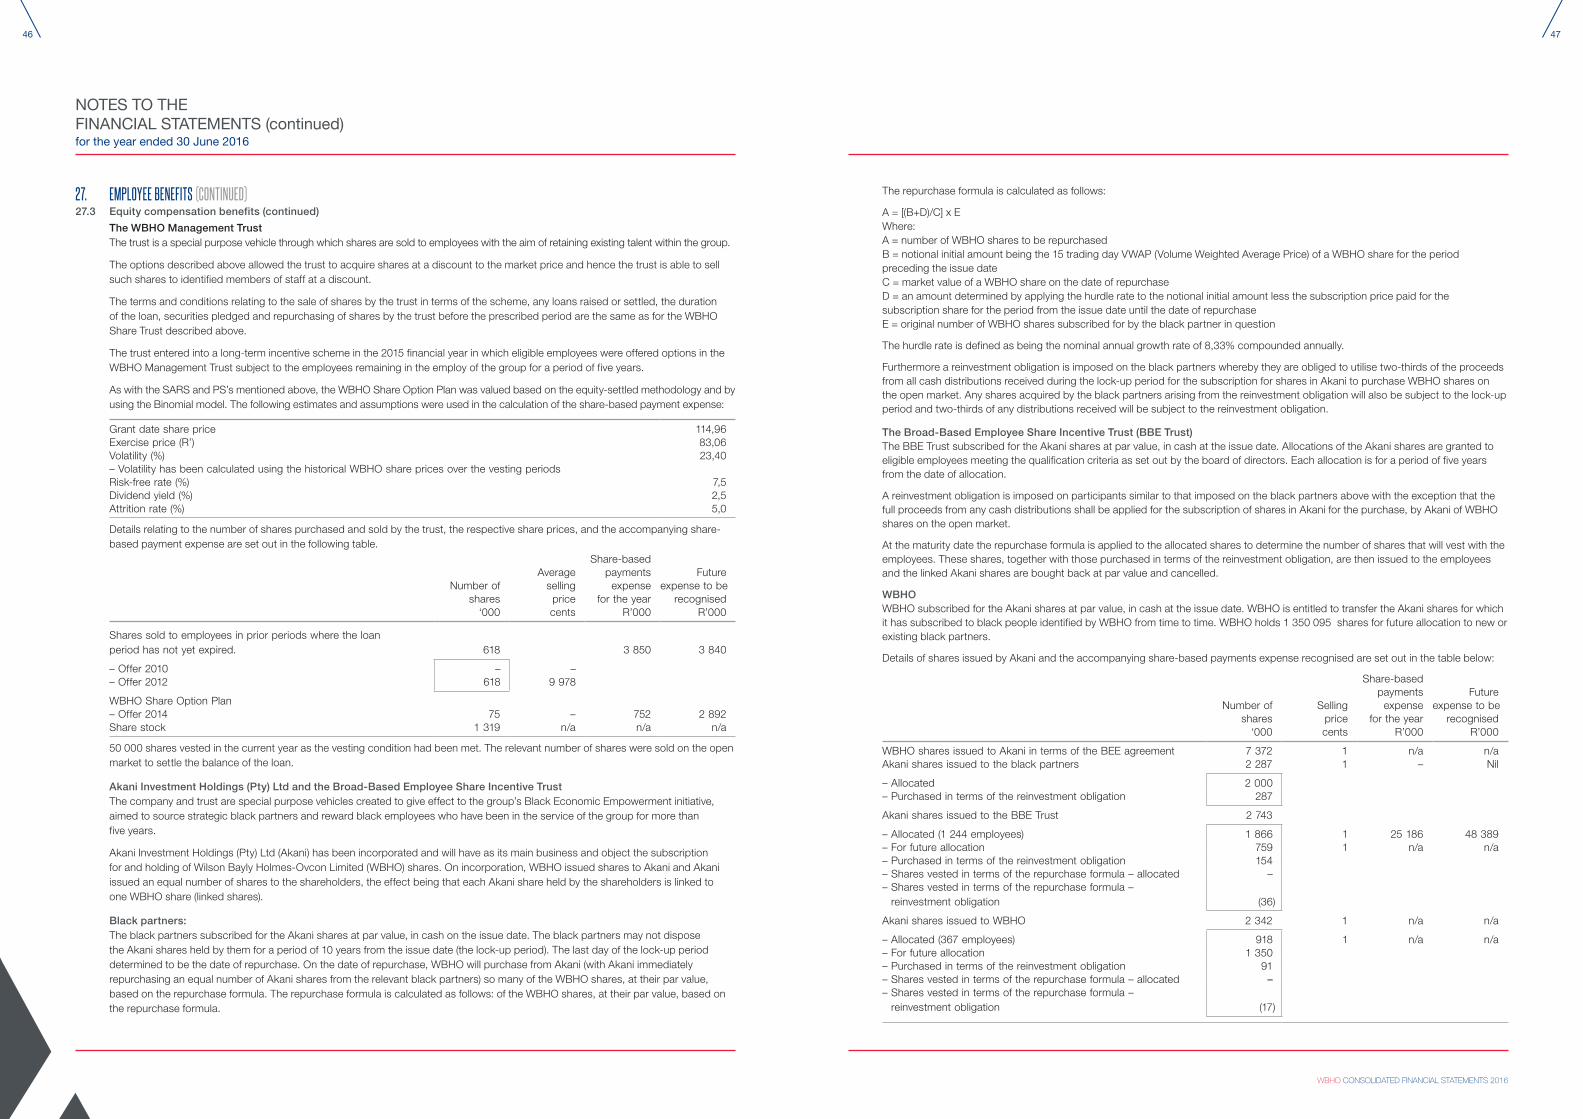
46
WBHO CONSOLIDATED FINANCIAL STATEMENTS 2016
47
NOTES TO THE FINANCIAL STATEMENTS (continued)for the year ended 30 June 2016
27. EMPLOYEE BENEFITS (CONTINUED)27.3 Equity compensation benefits (continued)
The WBHO Management TrustThe trust is a special purpose vehicle through which shares are sold to employees with the aim of retaining existing talent within the group.
The options described above allowed the trust to acquire shares at a discount to the market price and hence the trust is able to sell such shares to identified members of staff at a discount.
The terms and conditions relating to the sale of shares by the trust in terms of the scheme, any loans raised or settled, the duration of the loan, securities pledged and repurchasing of shares by the trust before the prescribed period are the same as for the WBHO Share Trust described above.
The trust entered into a long-term incentive scheme in the 2015 financial year in which eligible employees were offered options in the WBHO Management Trust subject to the employees remaining in the employ of the group for a period of five years.
As with the SARS and PS’s mentioned above, the WBHO Share Option Plan was valued based on the equity-settled methodology and by using the Binomial model. The following estimates and assumptions were used in the calculation of the share-based payment expense:
Grant date share price 114,96 Exercise price (R’) 83,06 Volatility (%) 23,40 – Volatility has been calculated using the historical WBHO share prices over the vesting periodsRisk-free rate (%) 7,5 Dividend yield (%) 2,5 Attrition rate (%) 5,0
Details relating to the number of shares purchased and sold by the trust, the respective share prices, and the accompanying share-based payment expense are set out in the following table.
Number ofshares
‘000
Averagesellingprice cents
Share-basedpayments
expensefor the year
R’000
Future expense to be
recognisedR’000
Shares sold to employees in prior periods where the loan period has not yet expired. 618 3 850 3 840
– Offer 2010 – –– Offer 2012 618 9 978
WBHO Share Option Plan– Offer 2014 75 – 752 2 892 Share stock 1 319 n/a n/a n/a
50 000 shares vested in the current year as the vesting condition had been met. The relevant number of shares were sold on the open market to settle the balance of the loan.
Akani Investment Holdings (Pty) Ltd and the Broad-Based Employee Share Incentive TrustThe company and trust are special purpose vehicles created to give effect to the group’s Black Economic Empowerment initiative, aimed to source strategic black partners and reward black employees who have been in the service of the group for more than five years.
Akani Investment Holdings (Pty) Ltd (Akani) has been incorporated and will have as its main business and object the subscription for and holding of Wilson Bayly Holmes-Ovcon Limited (WBHO) shares. On incorporation, WBHO issued shares to Akani and Akani issued an equal number of shares to the shareholders, the effect being that each Akani share held by the shareholders is linked to one WBHO share (linked shares).
Black partners:The black partners subscribed for the Akani shares at par value, in cash on the issue date. The black partners may not dispose the Akani shares held by them for a period of 10 years from the issue date (the lock-up period). The last day of the lock-up period determined to be the date of repurchase. On the date of repurchase, WBHO will purchase from Akani (with Akani immediately repurchasing an equal number of Akani shares from the relevant black partners) so many of the WBHO shares, at their par value, based on the repurchase formula. The repurchase formula is calculated as follows: of the WBHO shares, at their par value, based on the repurchase formula.
The repurchase formula is calculated as follows:
A = [(B+D)/C] x E Where:A = number of WBHO shares to be repurchasedB = notional initial amount being the 15 trading day VWAP (Volume Weighted Average Price) of a WBHO share for the period preceding the issue dateC = market value of a WBHO share on the date of repurchaseD = an amount determined by applying the hurdle rate to the notional initial amount less the subscription price paid for the subscription share for the period from the issue date until the date of repurchaseE = original number of WBHO shares subscribed for by the black partner in question
The hurdle rate is defined as being the nominal annual growth rate of 8,33% compounded annually.
Furthermore a reinvestment obligation is imposed on the black partners whereby they are obliged to utilise two-thirds of the proceeds from all cash distributions received during the lock-up period for the subscription for shares in Akani to purchase WBHO shares on the open market. Any shares acquired by the black partners arising from the reinvestment obligation will also be subject to the lock-up period and two-thirds of any distributions received will be subject to the reinvestment obligation.
The Broad-Based Employee Share Incentive Trust (BBE Trust)The BBE Trust subscribed for the Akani shares at par value, in cash at the issue date. Allocations of the Akani shares are granted to eligible employees meeting the qualification criteria as set out by the board of directors. Each allocation is for a period of five years from the date of allocation.
A reinvestment obligation is imposed on participants similar to that imposed on the black partners above with the exception that the full proceeds from any cash distributions shall be applied for the subscription of shares in Akani for the purchase, by Akani of WBHO shares on the open market.
At the maturity date the repurchase formula is applied to the allocated shares to determine the number of shares that will vest with the employees. These shares, together with those purchased in terms of the reinvestment obligation, are then issued to the employees and the linked Akani shares are bought back at par value and cancelled.
WBHOWBHO subscribed for the Akani shares at par value, in cash at the issue date. WBHO is entitled to transfer the Akani shares for which it has subscribed to black people identified by WBHO from time to time. WBHO holds 1 350 095 shares for future allocation to new or existing black partners.
Details of shares issued by Akani and the accompanying share-based payments expense recognised are set out in the table below:
Number ofshares
‘000
Sellingprice cents
Share-basedpayments
expensefor the year
R’000
Future expense to be
recognisedR’000
WBHO shares issued to Akani in terms of the BEE agreement 7 372 1 n/a n/a Akani shares issued to the black partners 2 287 1 – Nil
– Allocated 2 000 – Purchased in terms of the reinvestment obligation 287
Akani shares issued to the BBE Trust 2 743
– Allocated (1 244 employees) 1 866 1 25 186 48 389 – For future allocation 759 1 n/a n/a – Purchased in terms of the reinvestment obligation 154 – Shares vested in terms of the repurchase formula – allocated –– Shares vested in terms of the repurchase formula –
reinvestment obligation (36)
Akani shares issued to WBHO 2 342 1 n/a n/a
– Allocated (367 employees) 918 1 n/a n/a – For future allocation 1 350 – Purchased in terms of the reinvestment obligation 91 – Shares vested in terms of the repurchase formula – allocated –– Shares vested in terms of the repurchase formula –
reinvestment obligation (17)

48
WBHO CONSOLIDATED FINANCIAL STATEMENTS 2016
49
NOTES TO THE FINANCIAL STATEMENTS (continued)for the year ended 30 June 2016
27. EMPLOYEE BENEFITS (CONTINUED)27.3 Equity compensation benefits (continued)
In calculating the share-based payments expense applicable to the black partners and the BBE trust it was necessary to estimate the number of shares that could vest at the end of the lock-up period and allocation period respectively. The following assumptions and judgements were used in arriving at the estimate:
BBE Trust Black partners
Hurdle rate (%) 8,3 8,3 Weighted average expected volatility (%) 24,0 24,0 Weighted average dividend yield (%) 2,7 2,7 Weighted average risk-free interest rate (%) 8,8 8,8 Vesting period (years) 5,0 10,0
27.4 Cash-settled compensation benefits Edwin Construction Employee Share Incentive Trust (Edwin Share Trust)
The trust is a special purpose vehicle through which Edwin Construction (Pty) Ltd aims to retain existing talent within the company. The company issues Edwin Construction shares to the trust at the discretion of the directors. The shares are allocated to employees in the form of units at market value at the date of issue. A loan equal to the value of the units acquired, is raised for each identified employee and the units may not be disposed of prior to the five-year vesting period without the explicit approval of the trustees. The employee is required to pledge the units to the trust as security for the loan. Any dividends earned by the units during that period are set off against the balance of the loan. The loan must be repaid no later than the date on which the employee disposes of all his units. Should a scheme member leave the employ of the company during the five-year vesting period, the member has an obligation to offer the units back to the trust at either the deemed value, or the higher of R1 and the outstanding balance of the loan. Should the employee leave the company after the five-year vesting period, the member has an obligation to offer the units back to the trust at either the deemed value or the higher of the original cost and 50% of the deemed value. The deemed value is calculated as the higher of five times the profit before tax or the tangible net asset value as disclosed in the company’s most recent annual financial statements.
Details relating to the number of shares issued to the trust, the selling price to employees and the liability recognised are set out in the following table:
Number ofunits ‘000
Sellingprice
(cents)
Share-basedpayments
expensefor the year
R’000
Liabilityrecognised
to dateR’000
Edwin shares issued to the trust 600 n/a n/a n/aUnits issued (11 employees) 251 1 512 (1 364) 17 571 Units remaining to be issued 349 n/a n/a n/a
28. SEGMENTAL ANALYSISOperating segments reflect the management structure of the group and are identified both geographically and by the key markets which they serve.
The operating segments are regularly reviewed by the group’s chief operating decision makers, defined as the executive committee, in order to allocate resources and assess the performance of the segments.
The group has five reportable operating segments from which it derives revenue. The activities associated with each segment are noted below:
Building and civil engineering• Construction of retail shopping centres, commercial buildings, hotels, hospitals and residential apartments mostly for the private
sectors.• Construction civil engineering related infrastructure for the mining, industrial, energy and oil and gas sectors.
Roads and earthworks• Activities include infrastructure and water and gas pipelines and other large infrastructure projects.
Australia• Construction of retail, residential and commercial buildings for the private building sector.• Various engineering disciplines, servicing the road and mining sectors and telecommunications.
Property developments• property development sales.
Construction materials• Sales and manufacture of long-steel products.
None of the operating segments are aggregated and there are no additional segments to report separately.Building and civil
engineeringR’000
Roads andearthworks
R’000 Australia
R’000
Propertydevelopments
R’000
Constructionmaterials
R’000Total
R’000
Operating segments2016Revenue 7 536 471 4 333 788 18 112 931 18 880 906 146 30 908 216 Inter-segment sales – – – – (257 907) (257 907)
Revenue – external customers 7 536 471 4 333 788 18 112 931 18 880 648 239 30 650 309
Operating profit before non-trading items 369 585 283 422 300 392 14 656 36 502 1 004 557
Profit on disposal of property – – 29 166 – – 29 166Depreciation 65 751 104 993 62 245 – 9 521 242 510Capital expenditure 48 511 52 685 8 234 – 17 214 126 644
2015Revenue 7 385 199 5 282 022 15 351 787 50 730 984 454 29 054 192 Inter-segment sales – – – – (230 808) (230 808)
Revenue – external customers 7 385 199 5 282 022 15 351 787 50 730 753 646 28 823 384
Operating profit before non-trading items 351 685 380 260 10 612 13 318 12 542 768 417
Impairment of goodwill – – 106 857 – 9 125 115 982 Depreciation 57 662 133 037 76 438 – 13 070 280 207 Impairment of property, plant and equipment – – 53 926 – – 53 926 Capital expenditure 74 804 188 218 44 936 – 19 017 326 975
2016R’000
Restated2015
R’000
Geographical segmentsRevenueSouth Africa 9 739 222 9 796 003Rest of Africa 2 798 156 3 675 594 Australia 18 112 931 15 351 787
30 650 309 28 823 384
Operating profit before non-trading itemsSouth Africa 346 354 427 697Rest of Africa 357 811 330 108 Australia 300 392 10 612
1 004 557 768 417
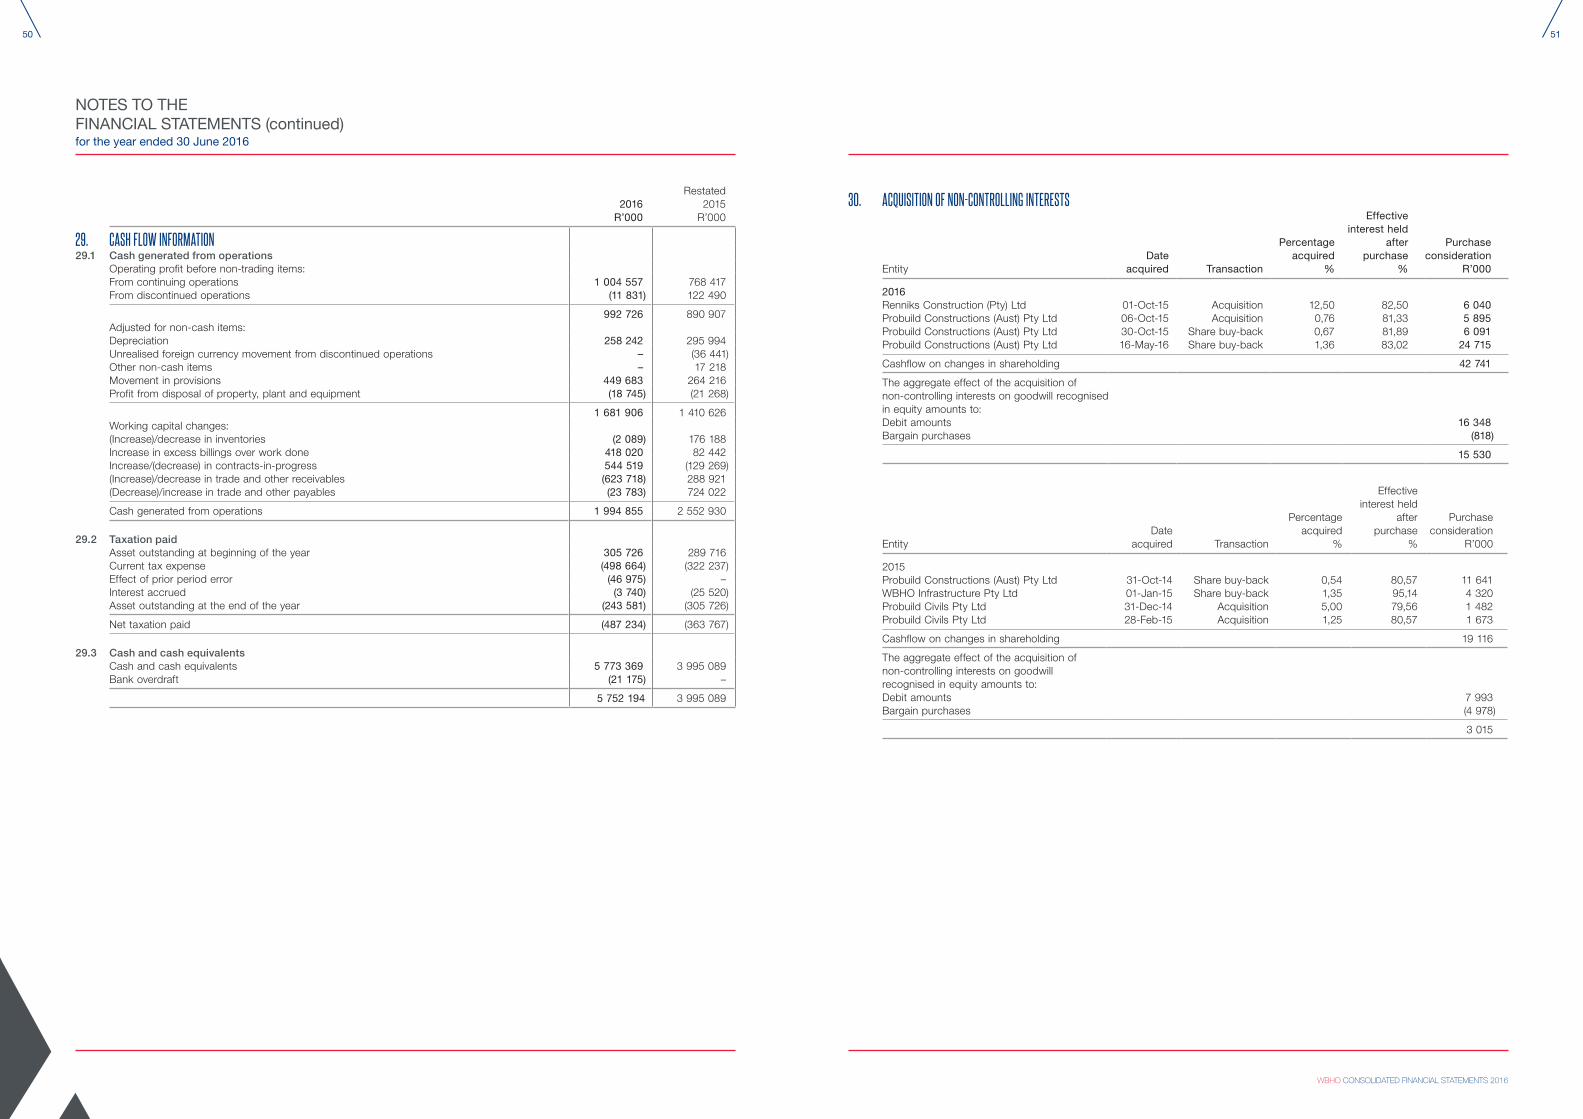
50
WBHO CONSOLIDATED FINANCIAL STATEMENTS 2016
51
NOTES TO THE FINANCIAL STATEMENTS (continued)for the year ended 30 June 2016
2016R’000
Restated2015
R’000
29. CASH FLOW INFORMATION29.1 Cash generated from operations
Operating profit before non-trading items:From continuing operations 1 004 557 768 417From discontinued operations (11 831) 122 490
992 726 890 907 Adjusted for non-cash items:Depreciation 258 242 295 994 Unrealised foreign currency movement from discontinued operations – (36 441)Other non-cash items – 17 218 Movement in provisions 449 683 264 216 Profit from disposal of property, plant and equipment (18 745) (21 268)
1 681 906 1 410 626 Working capital changes:(Increase)/decrease in inventories (2 089) 176 188 Increase in excess billings over work done 418 020 82 442 Increase/(decrease) in contracts-in-progress 544 519 (129 269)(Increase)/decrease in trade and other receivables (623 718) 288 921 (Decrease)/increase in trade and other payables (23 783) 724 022
Cash generated from operations 1 994 855 2 552 930
29.2 Taxation paidAsset outstanding at beginning of the year 305 726 289 716 Current tax expense (498 664) (322 237)Effect of prior period error (46 975) – Interest accrued (3 740) (25 520)Asset outstanding at the end of the year (243 581) (305 726)
Net taxation paid (487 234) (363 767)
29.3 Cash and cash equivalentsCash and cash equivalents 5 773 369 3 995 089 Bank overdraft (21 175) –
5 752 194 3 995 089
30. ACQUISITION OF NON-CONTROLLING INTERESTS
EntityDate
acquired Transaction
Percentage acquired
%
Effective interest held
after purchase
%
Purchase consideration
R’000
2016Renniks Construction (Pty) Ltd 01-Oct-15 Acquisition 12,50 82,50 6 040 Probuild Constructions (Aust) Pty Ltd 06-Oct-15 Acquisition 0,76 81,33 5 895 Probuild Constructions (Aust) Pty Ltd 30-Oct-15 Share buy-back 0,67 81,89 6 091 Probuild Constructions (Aust) Pty Ltd 16-May-16 Share buy-back 1,36 83,02 24 715
Cashflow on changes in shareholding 42 741
The aggregate effect of the acquisition of non-controlling interests on goodwill recognised in equity amounts to:Debit amounts 16 348 Bargain purchases (818)
15 530
EntityDate
acquired Transaction
Percentage acquired
%
Effective interest held
after purchase
%
Purchase consideration
R’000
2015Probuild Constructions (Aust) Pty Ltd 31-Oct-14 Share buy-back 0,54 80,57 11 641 WBHO Infrastructure Pty Ltd 01-Jan-15 Share buy-back 1,35 95,14 4 320 Probuild Civils Pty Ltd 31-Dec-14 Acquisition 5,00 79,56 1 482 Probuild Civils Pty Ltd 28-Feb-15 Acquisition 1,25 80,57 1 673
Cashflow on changes in shareholding 19 116
The aggregate effect of the acquisition of non-controlling interests on goodwill recognised in equity amounts to:Debit amounts 7 993 Bargain purchases (4 978)
3 015

52
WBHO CONSOLIDATED FINANCIAL STATEMENTS 2016
53
NOTES TO THE FINANCIAL STATEMENTS (continued)for the year ended 30 June 2016
31. RESTATEMENT OF PRIOR YEAR FIGURESDuring the year, the group became aware of errors made in calculating the secondary tax on companies (STC) for the 2009 and 2011 financial years. At year end it was also discovered that in the prior year inter-company revenue in Capital Africa Steel (Pty) Ltd had not been eliminated. During the year 3Q Mahuma Concrete Holdings (Pty) Ltd was classified as a discontinued operation. The impact of the restatements are disclosed below:
Statement of financial positionR’000
Retained earnings
R’000Taxation
liability
Balance at 30 June 2014 as previously reported 3 983 742 66 552 Taxation and accrued interest (40 886) 40 886 Accrued interest 2014 (2 941) 2 941
Restated balance at 30 June 2014 3 939 915 110 379
Balance at 30 June 2015 as previously reported 4 286 772 50 174 Taxation and accrued interest (40 886) 40 886 Accrued interest 2014 (2 941) 2 941 Accrued interest 2015 (3 149) 3 149
Restated balance at 30 June 2015 4 239 796 97 150
Statement of financial performance and other comprehensive income
Revenue
As previously reported at 30 June 2015 29 522 972 Adjusted for:
Reclassification of discontinued operations (468 780)Inter-company revenue not eliminated (230 808)
28 823 384
Contract costs
As previously reported at 30 June 2015 (27 376 407)Adjusted for:
Reclassification of discontinued operations 424 395 Inter-company revenue not eliminated 230 808
(26 721 204)
Profit for the year
As previously reported at 30 June 2015 607 286 Accrued interest 2015 (3 149)
604 137
Earnings per share and headline earnings per share (cents)
Earnings per share
Headline earnings
per share
As previously reported at 30 June 2015 1 029,5 1 175,2 Impact of restatement (5,7) (5,7)
1 023,8 1 169,5
There was no impact on the statement of cash flows.
32. EVENTS AFTER THE REPORTING DATEThere were no significant events after the reporting date to date of this report.
COMPANY STATEMENT OF FINANCIAL POSITIONas at 30 June 2016
Notes2016
R’0002015
R’000
AssetsInvestments in subsidiaries and special purpose entities 1 42 761 42 769 Loans to group companies 2 186 170 186 162
Total non-current assets 228 931 228 931
Cash and cash equivalents 569 561 Value-added taxation 1 1
Total current assets 570 562
Total assets 229 501 229 493
EquityShare capital 31 147 31 175 Retained earnings 141 474 1 916
172 621 33 091
LiabilitiesLoans from group companies 3 55 992 195 610 Unclaimed dividends 888 792
Total liabilities 56 880 196 402
Total equity and liabilities 229 501 229 493
Notes2016
R’0002015
R’000
Finance income and dividends received 4 395 232 198 377 Other direct costs (1) (1)
Profit for the year 395 231 198 376
COMPANY STATEMENT OF FINANCIAL PERFORMANCEfor the year ended 30 June 2016

54
WBHO CONSOLIDATED FINANCIAL STATEMENTS 2016
55
COMPANY STATEMENT OF CHANGES IN EQUITYfor the year ended 30 June 2016
SharecapitalR’000
Retainedearnings
R’000
TotalequityR’000
Balance at 30 June 2014 31 175 29 833 61 008 Profit for the year – 198 376 198 376 Dividend paid – (226 293) (226 293)
Balance at 30 June 2015 31 175 1 916 33 091 Share buy-back (28) – (28)Profit for the year – 395 231 395 231 Dividend paid – (255 673) (255 673)
Balance at 30 June 2016 31 147 141 474 172 621
Notes2016R000
2015R000
Cash flow from operating activitiesOther direct costs (1) (1)Increase in unclaimed dividends 95 41Finance income and dividends received 395 232 198 377 Dividend paid (255 673) (226 293)
Net cash flow from operating activities 139 653 (27 876)(Decrease)/increase in loans from group companies (139 618) 27 915 Shares bought back (28) –
Increase in cash and cash equivalents for the year 7 39 Cash and cash equivalents at the beginning of the year 561 522
Cash and cash equivalents at the end of the year 568 561
COMPANY STATEMENT OF CASH FLOWSfor the year ended 30 June 2016
NOTES TO THE COMPANY FINANCIAL STATEMENTS (continued)for the year ended 30 June 2016
2016 2015
1. INVESTMENTS IN SUBSIDIARIES (‘000)Shares at cost less impairment losses 42 761 42 769
A complete list of investments in subsidiaries is set out in Annexure 1.
2. LOANS TO GROUP COMPANIESLoans to subsidiaries (Annexure 1) 184 696 184 688 Loans to share trusts (Annexure 1) 1 474 1 474
186 170 186 162
The loans are unsecured, bear no interest and will not be repaid within the next 12 months.
3. LOANS FROM GROUP COMPANIESLoans from subsidiaries (Annexure 1) 50 911 190 529 Loans from share trusts 5 081 5 081
55 992 195 610
The loans are unsecured, bear no interest and will not be repaid within the next 12 months.
4. RELATED PARTY TRANSACTIONSDividends received WBHO Construction (Pty) Ltd 387 200 190 100 Akani Investment Holdings (Pty) Ltd 8 032 8 277
395 232 198 377
Dividends paidAkani Investment Holdings (Pty) Ltd 35 825 34 600WBHO Management Trust 4 635 2 763WBHO Share Trust 142 124
40 602 37 487
Related party balances have been disclosed in notes 2 and 3.
Related party transactions with directors are disclosed in note 24 of the group financial statements.
5. FINANCIAL INSTRUMENTS AND FINANCIAL RISK MANAGEMENTOverviewThe company’s activities expose it to credit risk. Further information about the management of financial risks within the group is disclosed in note 25 of the group financial statements. The group’s strategy is applied by the company and remains the same as in prior period. There have been no changes to the risk profile of the company.Financial instruments by categoryLoans and receivables at amortised costsLoans to group companies 186 170 186 162 Cash and cash equivalents 569 561
186 739 186 723
Financial liabilities held at amortised costLoans from group companies (55 992) (195 610)
Total carrying value 130 747 (8 887)
Fair valueAt 30 June 2016 the carrying amount of the all the financial instruments approximated their fair value unless otherwise disclosed. The company does not trade in financial instruments.
Credit riskThe company is exposed to credit risk through loans advanced to its subsidiaries and special purpose entities. These loans are unsecured so the company mitigates the risk of default by being able to exercise influence over the decision-making of these entities through equity interests in the subsidiaries or by appointing all or the majority of the trustees.

56
WBHO CONSOLIDATED FINANCIAL STATEMENTS 2016
57
ANNEXURE 1 INVESTMENTS IN SUBSIDIARIESfor the year ended 30 June 2016
Country ofIncorporation
Issuedcapital Effective holding Shares at cost
Amounts owingby/(to) subsidiaries
2016%
2015%
2016R000
2015R000
2016R000
2015R000
Held directlyWBHO Construction (Pty) Ltd South Africa R900 000 100 100 42 738 42 738 (50 911) (190 529)WBHO Industrial Holdings (Pty) Ltd South Africa R1 100 100 – – 184 308 184 308 Special purpose entitiesWBHO Management Trust South Africa – – – – (5 081) (5 081)WBHO Share Trust South Africa – – – – 1 474 1 474 WBHO Broad-based Employee Share Incentive Trust South Africa – – – – – –Edwin Construction Employee Share Incentive Trust South Africa – – – – – –Akani Investment Holdings (Pty) Ltd South Africa R73 716 32 39 23 31 388 380 Held indirectlyEdwin Construction (Pty) Ltd South Africa R100 57 57Renniks Construction (Pty) Ltd South Africa R405 600 82,5 70Roadspan Surfaces (Pty) Ltd South Africa R10 000 100 100St Francis Links (Pty) Ltd South Africa R100 80 80WBHO Construction Sierra Leone Limited Sierra Leone US$23 000 100 100WBHO Guinea (SA) Limited Guinea Fr100 000 000 100 100WBHO Mozambique Projectos Limitada Mozambique MZN10 000 000 100 100WBHO Namibia (Pty) Ltd Namibia N$1 100 100WBHO Construction Zambia Limited Zambia ZMW5 000 100 100Kalcon (Pty) Ltd Botswana P2 100 100WBHO Ghana (Pty) Ltd Ghana $500 000 100 100WBHO Australia Pty Ltd Australia AUS$26 400 000 100 100WBHO Infrastructure Pty Ltd* Australia AUS$16 560 228 95,8 95,1Monaco Hickey Pty Ltd Australia AUS$6 000 000 69,7 67,7Probuild Constructions (Aust) Pty Ltd Australia AUS$37 915 795 83,0 80,6Capital Africa Steel (Pty) Ltd South Africa R235 861 55,6 55,6Tekfalt Binders (Pty) Ltd South Africa R100 60 60Balmoral Crushers (Pty) Ltd South Africa R120 100 100
42 761 42 769 130 178 (9 448)
* Previously WBHO Civils Pty Ltd
Investments in dormant subsidiaries are not disclosed.
ANNEXURE 2 INTERESTS IN JOINT OPERATIONSfor the year ended 30 June 2016
Investments in significant joint operations Country of operation Principle activity2016
%2015
%
Sandton Joint Venture South Africa Retail shopping centre 50,0 50,0Kusile Civils Joint Venture South Africa Power station 25,0 25,0WBHO/Group 5 Mall of Africa Joint Venture South Africa Retail shopping centre 50,0 50,0WBHO/Phayindani Joint Venture South Africa Public transport network 59,0 59,0WBHO/Inanda Joint Venture South Africa Public transport network 59,0 59,0WBHO/Stats SA Joint Venture South Africa Serviced accommodation 63,0 63,0WBHO/Tiber Discovery JV South Africa Office building 50,0 50,0WBHO/Tiber 140 West JV South Africa Office building 50,0 –WBHO/WET Joint Venture South Africa Public transport network 70,0 –WBHO/CCC Joint Venture Botswana Water infrastructure 50,0 50,0WBHO/Parsons Brinckenhoff JV Mozambique Power station 70,0 70,0
The group’s proportionate share of the assets, liabilities, results of operations and cash flows as incorporated in the financial statements are summarised below:
2016R‘000
2015R‘000
Non-current assets 25 958 24 510 Current assets 1 263 701 1 802 701
Total assets 1 289 659 1 827 211
Shareholders’ equity 121 869 10 101 Non-current liabilities – 131 672 Current liabilities 1 167 790 1 685 438
Total equity and liabilities 1 289 659 1 827 211
Revenue 2 552 916 3 522 402 Contract costs (2 222 362) (3 288 026)Overheads (4 020) (26 880)Profit before taxation 395 805 238 423

www.wbho.co.za