auditing the auditors: an international analysis of the ...3 auditing the auditors: an international...
TRANSCRIPT

Auditing the Auditors: An International Analysis of the Effectiveness of National Inspection
Regimes on Audit Quality
Elizabeth Carson
Professor of Accounting
University of New South Wales
Roger Simnett
Scientia Professor of Accounting
University of New South Wales
Ann Vanstraelen
Professor of Accounting and Assurance Services
Maastricht University
3 September 2013
Preliminary draft: Please do not quote without permission of the authors.
We thank Anna Huggins, Ashna Prasad, Shirley Tsau and Lei Zou for research assistance, and
appreciate the comments of participants at workshops at the University of Auckland, the University of
New South Wales, the International Symposium on Audit Research and the Accounting and Finance
Association of Australia and New Zealand Conference. We also acknowledge the financial support of
the Australian Research Council.

2
3
Auditing the Auditors: An International Analysis of the Effectiveness of National Inspection
Regimes on Audit Quality
ABSTRACT: We undertake an examination of the effectiveness of the different forms of
public oversight and independent inspection regimes that have been put in place by the
various national public oversight bodies of the auditing profession. Using a large sample of
companies from 33 countries over the period 2006-2010, we find that audit quality is higher
in countries where independent inspections are in place and are member of IFIAR. In order to
control for potential endogeneity concerns, we then limit our examination to countries that
introduced independent inspection programs during our sample period, and we find that audit
quality is higher in the period after inspections are introduced compared to the pre-inspection
period. Our results, however, do not support an association between the different ways of
organizing public oversight and audit quality. This provides evidence that the existence of
public oversight and independent inspections has an impact on audit quality, but not the
characteristics of the inspection programs. Overall, our study contributes to the emerging
literature on public oversight of the auditing profession.
Keywords: public oversight; audit quality; IFIAR; inspections
Data Availability: The data are available from sources identified in this study.
4
I. INTRODUCTION
In the last decade one of the key reform initiatives directed at improving the
quality of auditing has been the introduction of public oversight over the audit profession.
This is observed at both the national and international levels, and impacts on both the
setting of standards for the auditing profession as well as its continuing regulation. For
example, over the past decade the setting of auditing standards has been more likely to be
undertaken by bodies independent of the audit process (such as the Public Company
Accounting Oversight Board (PCAOB) in the U.S., and the Australian Auditing and
Assurance Standards Board (AUASB), or independent of the profession (for example, the
International Auditing and Assurance Standards Board (IAASB)). The continuing
regulation of the auditing profession has also been increasingly removed from the auditing
profession to independent national public oversight boards (POBs) (for example, the
PCAOB in the U.S. and the Australian Securities and Investments Commission (ASIC) in
Australia).
The U.S. was one of the front-runners in introducing public oversight of the
auditing profession, and the PCAOB model of independent public oversight has formed
the basis of many other national POBs (Franzel 2012). The PCAOB has four main
responsibilities under the Sarbanes-Oxley (2002) Act: (1) to register public accounting
firms; (2) to establish auditing and other professional standards; (3) to conduct and report
on regular inspections of registered public accounting firms; and (4) to conduct
investigations and disciplinary proceedings of the auditing profession where rules or
standards may have been violated. While other countries have followed suit, they have
made different choices with regard to the organization of public oversight. For example,
most countries outside the U.S. have a policy of adopting or converging with standards

5
developed by the IAASB (Simnett and Smith 2005), and the setting of auditing standards
is separated from the body undertaking the inspection program.
Also, while inspection programs have become the key plank of the strategy and
work effort of all national POBs, divergent approaches to these inspection programs have
developed. For example, some countries have elected to have direct inspections by the
independent POB while other countries have chosen for inspections to be undertaken by
professional bodies in the country under the supervision of the POB. Further, the
frequency of inspections of audit firms varies across countries and some countries have a
longer history of public oversight of the auditing profession compared to others.
Internationally, a growing number of independent national audit regulators have
decided to join the international organization, the International Forum of Independent
Audit Regulators (IFIAR). This organization was founded in September 2006 and aims to
promote audit quality, and effective independent audit regulatory activity. IFIAR has a
specific focus on inspections of audit firms, and co-operation regarding the inspection of
international audit networks (IFIAR 2012).
The rationale behind the auditing profession’s moves to POBs is that regulators
and other market participants expect that independent public oversight is a more effective
way to ensure audit quality than self-regulation by the audit profession. Critics are not
convinced, however, and question the adequacy of the expertise, knowledge and skills of
inspectors of independent POBs (e.g,. Glover et al. 2009). This reflects the often raised
concern in relation to public oversight of the auditing profession of the trade-off between
expertise and independence (e.g., DeFond 2010) and the effectiveness of such oversight.
Given the significant amount of resources that is spent on public oversight, its
effectiveness is an important empirical question. There is an emerging literature in the
U.S. addressing this question (e.g. Lennox and Pittman 2010; DeFond and Lennox 2011;
6
Carcello et al. 2011); however to date there has been no international comparison of the
differing national approaches to public oversight, and in particular the inspection
programs, and their association, if any, with resulting audit quality.
In this paper we examine the effectiveness of the inspection programs, and their
different forms, as undertaken by the national POBs. Specifically, we examine whether
inspections (between countries with and without inspection programs) affect audit quality,
and whether there is a difference in audit quality between the pre- and post-inspection
periods (within member country analysis for countries introducing inspections during the
study period). We further examine whether IFIAR membership, first-time inspections,
inspection experience, type of inspection system (direct inspections versus oversight of
the inspection process) and frequency of inspections affect audit quality. We measure
audit quality by the level of abnormal accruals of audit firms’ client companies.
Using a large sample of listed companies from 33 countries during the period
2006-2010, we find that companies domiciled in countries where inspection programs are
in place have significantly lower abnormal total accruals and this holds for both income-
increasing and income-decreasing abnormal accruals. Further, we find that the level of
abnormal accruals (both income-increasing and income-decreasing) of audit firms’ clients
in countries that introduced inspection programs during our sample period is significantly
lower in the post-inspection period compared to the pre-inspection period. This compares
with no change in abnormal accruals over 2006-2010 for clients in those countries that did
not introduce an inspection program. We further find that companies domiciled in IFIAR
member countries have significantly lower abnormal accruals, which is to be attributed to
lower income-decreasing accruals. We do not find much support for differences in audit
quality that could be explained by differences in design of the oversight system within the
group of countries with independent inspections of audit firms in place. Overall, our

7
findings contribute to the emerging literature on public oversight of the auditing
profession. This study is one of the first that compares the benefits, if any, of the
differences in the national regulatory systems at an international level. A better
understanding of the effectiveness of the different types of oversight systems can facilitate
the design of an optimal and potentially harmonized oversight system which would be
congruent with the objectives of IFIAR. Further, our insights may also prove useful for
regulators across the world in their ongoing discussions and decisions regarding mutual
recognition of public oversight across countries.
The remainder of this paper is organized as follows. In Section II, we provide the
relevant background for the study and formulate the hypotheses that we test. In Section
III, we describe the data, descriptive statistics and research design. In Section IV, we
present the results of the study and we conclude in Section V.
II. BACKGROUND AND HYPOTHESES DEVELOPMENT
The Organization of Public Oversight
A number of high-profile corporate financial reporting scandals in which auditors
were implicated, including the collapse of Enron and the role of its auditor Arthur Andersen,
prompted regulators in the U.S. to end self-regulation of the auditing profession. It was
replaced by a system of public oversight of the auditing profession, created by the Sarbanes-
Oxley Act in 2002. Since 2004, all audit firms that issue an audit report for a SEC-reporting
company or substantially participate in the audit are required to be registered with the
PCAOB. One of the primary duties of the PCAOB is to perform periodic independent
inspections of these firms. In reflecting upon the effectiveness of the PCAOB seven years
after inception, Acting Chairman Goelzer (2009) noted, “in evaluating the Board’s work, the
question is not how many inspections have been conducted or how many pages of standards

8
have been written. It is whether investors are better off as a result. While that is not a question
that is likely to be resolved based on anything I might say today, I believe that evidence is
accumulating that they are.”
Goelzer went on to outline the process by which this benefit was achieved: “… we
know from the visibility that we have through the inspections and remediation process, that
the large firms have made important changes to their systems of quality control in response to
PCAOB inspections findings. These have included such things as changes related to partner
evaluation and compensation to place greater emphasis on audit quality and technical skills;
changes to management structures to provide greater separation between the audit quality
function and audit business operations; creation of national- or regional-level positions or
committees to promote and monitor audit quality; and modifications to internal inspection
programs.”
After the creation of the PCAOB in the U.S., other countries around the world have
followed the U.S. example of creating independent POBs by either introducing or expanding
their use of inspection programs of audit firms. The European Commission (EC) introduced
independent oversight over financial reporting and auditing in its revised Eighth Directive of
2006. This was further reinforced in the EC Green Paper Audit Policy (2010) addressing the
need to strengthen the current role of audit supervision to ensure the full independence of the
public oversight systems from the audit profession in all Member States. In the Green Paper,
the EC suggests transforming the current European Group of Auditors’ Oversight Board
(EGAOB)1 into a so-called ‘Lamfalussy Level 3 Committee’ to strengthen cooperation
between national public oversight bodies, ensure an improved and common approach to
1 The European Group of Auditors’ Oversight Board (EGAOB) was founded in December 2005 and is composed
of high-level representatives from the respective public oversight authorities of EU Member States or alternate
representatives from national ministries in the event that such a national oversight system is not yet established.
The role of the EGAOB is to provide technical input into the preparation of possible measures of the EC in
implementing the 8th
EU Directive on statutory audit, and it facilitates the EC’s implementation of the
requirements of external quality assurance for statutory auditors and audit firms auditing public interest entities.
9
inspections of audit firms, and foster convergence in the application of the rules. This
accentuates the EC’s belief that the establishment of an independent oversight board with the
vested power to enforce cooperation among member states will ultimately improve audit
quality and the level of confidence investors place on financial statement reporting, thereby
contributing to financial stability.
In a similar vein, at an international level, the International Forum of Independent
Audit Regulators (IFIAR) was established in September 2006 by 18 independent audit
regulatory organizations (these being the POBs in these countries) around the world. The
mission of IFIAR is to create a platform to share knowledge of the audit market environment
and practical experience regarding independent audit regulatory activity; to promote
collaboration in regulatory activities; and to provide a focal point for contacts with other
international organizations that have an interest in audit quality (IFIAR 2013). While
membership of IFIAR is not mandated by law, the requirements for becoming a member of
IFIAR clearly reinforce the expectation of an improved audit environment and outline how
this can be achieved. IFIAR memberships are strictly confined to regulatory agencies that are:
(1) independent of the audit profession, which means that the majority of the relevant
governing body should be non-practitioners and that the funding of the board should be free
of influence by the profession; and (2) engaged in audit regulatory functions in the public
interest. The latter requirement refers to the responsibility of the POB in each IFIAR member
country to conduct periodic inspections of audit firms undertaking audits of public interest
entities (IFIAR 2012). Since its inception, IFIAR has increased its membership base from the
initial 18 countries in 2006 to 44 countries at the beginning of 2013.
Inspection programs of audit firms are the main technique for improving deficiencies
in audit quality and driving improvements in the audit process. For example, the Financial
Reporting Council (2012 18) in the United Kingdom describes the objectives and process of
10
their inspection program as “to monitor and promote improvements in the quality of auditing.
As part of our work, we monitor firms’ compliance with the regulatory framework for
auditing, including the Auditing Standards, Ethical Standards and Quality Control Standards
for auditors and other requirements under the Audit Regulations…”. ASIC (2012), the
regulator of the auditing profession in Australia, describes the aim of their audit inspection
program as being to “promote high-quality external audits of financial reports of listed and
other public interest entities in Australia. High-quality audits are an important contributor to
financial report quality and market confidence”.
Although considerable resources go into these inspection regimes, very little is known
about how effective they have been. In 2012, IFIAR released their first global survey of
inspection findings (IFIAR 2012). The survey was designed to identify the level of inspection
activity and common inspection findings related to the audits of public companies. The survey
identified that more needs to be done to improve the consistency of performance by auditors,
and confirmed that IFIAR members are noting audit findings in numerous common areas
(inspection themes) including professional skepticism and tone at the top, group audits,
revenue recognition, internal control testing, and engagement quality control review across
the different jurisdictions.
Prior Literature
The increasing prominence of the various national audit regulators undertaking public
oversight responsibilities for this profession was explored by Simnett and Smith (2005). They
compared and contrasted the various structures that have been instigated or proposed by the
leading national and international bodies in relation to public oversight of the auditing
standard-setting process. These POBs had taken on various dimensions of both the auditing
standard-setting responsibility, and the continuing monitoring function, mainly through

11
inspections of the auditors and audit firms. At this time a unique combination was that in the
U.S., the PCAOB had taken on both the law-maker (developing standards) and the law-
enforcer (inspections) aspects of this public oversight.
Despite its potential merits, public oversight of the auditing profession has been
subject to criticism and skepticism. For example, Glover et al. (2009) criticize the PCAOB for
insufficient staff, staff with limited expertise, inadequate transparency of procedures and
inspection outcomes, and slow feedback. Small U.S. audit firms also do not appear to see an
improvement in audit quality or increased public confidence (Daugherty and Tervo 2010).
Thus, as public oversight is contested in some quarters, its effectiveness has become the
subject of academic research.
Prior research on public oversight has mainly focused on the U.S., as the PCAOB is
one of the few public oversight bodies that publicly disclose inspection findings. Early studies
provide descriptive evidence on inspection reports that are issued by the PCAOB and the type
of quality control defects and audit deficiencies that are found (Hermanson et al. 2007;
Hermanson and Houston 2008; Roybark 2009). Subsequently, academic research has looked
into the informational value of PCAOB inspection reports. For example, Dee et al. (2011)
find a negative stock market reaction to PCAOB sanctions imposed upon one of the Big 4
audit firms. The informational value of PCAOB inspection reports has also been addressed by
examining client hiring and firing of audit firms. For example, Lennox and Pittman (2010)
find no changes in audit firm market shares following deficient inspection findings. However,
Daugherty et al. (2011) find that for triennially inspected audit firms, clients are more likely
to dismiss an audit firm with a deficient inspection report and switch to an audit firm with a
clean inspection report. Similarly, Abbott et al. (2013) find that clients with effective audit
committees or high potential agency conflicts are more likely to switch to a successor auditor
without such deficiencies.

12
A number of studies suggest that public oversight bodies are able to discriminate
between various levels of audit quality. For example, Gunny and Zhang (2013) find that
clients of triennially inspected audit firms with deficiencies identified by the PCAOB have
higher levels of abnormal accruals. A similar result is reported by Van Opijnen et al. (2011) in
a Dutch setting. Furthermore, there is some support within individual countries as to the
effectiveness of national public oversight. For example, Carcello et al. (2011) find that
absolute abnormal accruals decrease following PCAOB inspections. Similarly, Fuentes et al.
(2010) find that earnings quality has improved in Spain since the Spanish public oversight
body started its inspections. Knechel et al. (2012) find that audit fees increase in response to
deficient inspection results.
Apart from the exceptions noted above, research on public oversight bodies outside
the U.S. is very limited. The purpose of our study is to compare the effectiveness
internationally of public oversight of the auditing profession and to provide a comparison of
the relative effectiveness of the differing aspects of the organization of the various public
oversight systems.
Development of Hypotheses
This study examines the effectiveness of public oversight of the auditing profession
from an international perspective. In addition, we examine a number of specific choices that
countries have made with regard to the organization of public oversight. First, we look into
countries that have an inspection program in place and compare these with countries without
inspections of audit firms. Secondly, in order to address potential endogeneity concerns, we
consider whether the introduction of inspection processes in countries that introduced
inspection programs during our sample period is followed by an increase in audit quality. In
additional analyses, we look into the choice of a public oversight body of a country to become
13
a member of IFIAR. As discussed above, IFIAR membership is restricted to those public
oversight bodies that meet certain criteria. Further, we examine whether there is any
association between the characteristics of the various inspection regimes and audit quality.
We infer audit quality by examining the accruals properties of audit firms’ client companies.
In line with prior research, we consider that a high quality audit will be more effective at
constraining opportunistic reporting by managers, which is reflected in lower levels of
abnormal accruals (e.g. Carey and Simnett 2006; Francis and Wang 2008). We formulate the
following hypotheses:
Inspections
For the reasons outlined earlier, we expect that companies domiciled in countries that
have independent inspections in place have higher audit quality compared to companies
domiciled in countries that do not perform independent inspections of audit firms. We
therefore hypothesize that:
H1: Companies domiciled in countries where audit firms are subject to independent
inspections are associated with higher audit quality compared to companies domiciled in
countries where audit firms are not subject to independent inspections.
Pre-/post-inspection
We understand that the above analysis could potentially suffer from endogeneity
issues. Thus we examine whether, for the smaller group of countries in which public oversight
was initiated during the sample period, there is a difference in audit quality for pre- versus
post-inspection audits. We expect that the benefits of introducing an inspection process will
result in audit quality being higher in the post-inspection period. This is tested by the
following hypothesis:
H2: Audit quality after the introduction of the inspection process will be higher than
audit quality before the inspection process began.

14
III. DATA, DESCRIPTIVE STATISTICS, AND RESEARCH DESIGN
Sample Selection and Description
To collect data for this study, we use the Worldscope database which provides
financial data covering 91 countries. The initial scope of the sample is to include all 40
member countries of IFIAR as at the end of 20102, and another 51 non-IFIAR member
countries that are covered in Worldscope. However, data for some countries are lacking or
insufficient for this type of international research and are therefore excluded from the sample.
Furthermore, the data is then filtered to only contain samples that do not have any missing
variables that are required to calculate the dependent and independent variables. Through the
process of filtering, several countries whose number of complete observations fell below 50
per year are eliminated. Finally, consistent with prior studies, financial institutions with
Standard Industrial Codes 6000-6999 are excluded from the sample because this industry is
subject to specific accounting requirements that significantly affect the calculation of
discretionary accruals. The final dataset contains a total of 33 countries, seven of which do
not perform independent inspections and eight of which are non-IFIAR members at the end of
2010. Our sample period is 2006-2010, but we also collect data for 2005 for the calculation of
the discretionary accruals of 2006. In total, we have 39,278 firm-year observations over the
period 2006-2010. The year 2006 is an appropriate year to start to undertake this analysis,
because as well as IFIAR coming into existence in this year, it is also after the introduction of
International Financial Reporting Standards (IFRS) for most countries, and it is the year that
the European Commission published its revised EU 8th Directive, requiring member countries
to install public oversight (with an implementation deadline of two years maximum). For the
testing of Hypothesis 2, we restrict the sample to the 11 countries where public oversight and
2 Data collection occurred in 2012; at that time, data was only available up until the end of 2010.
15
inspections started during the period 2007-2010, and use the year 2006 as the baseline where,
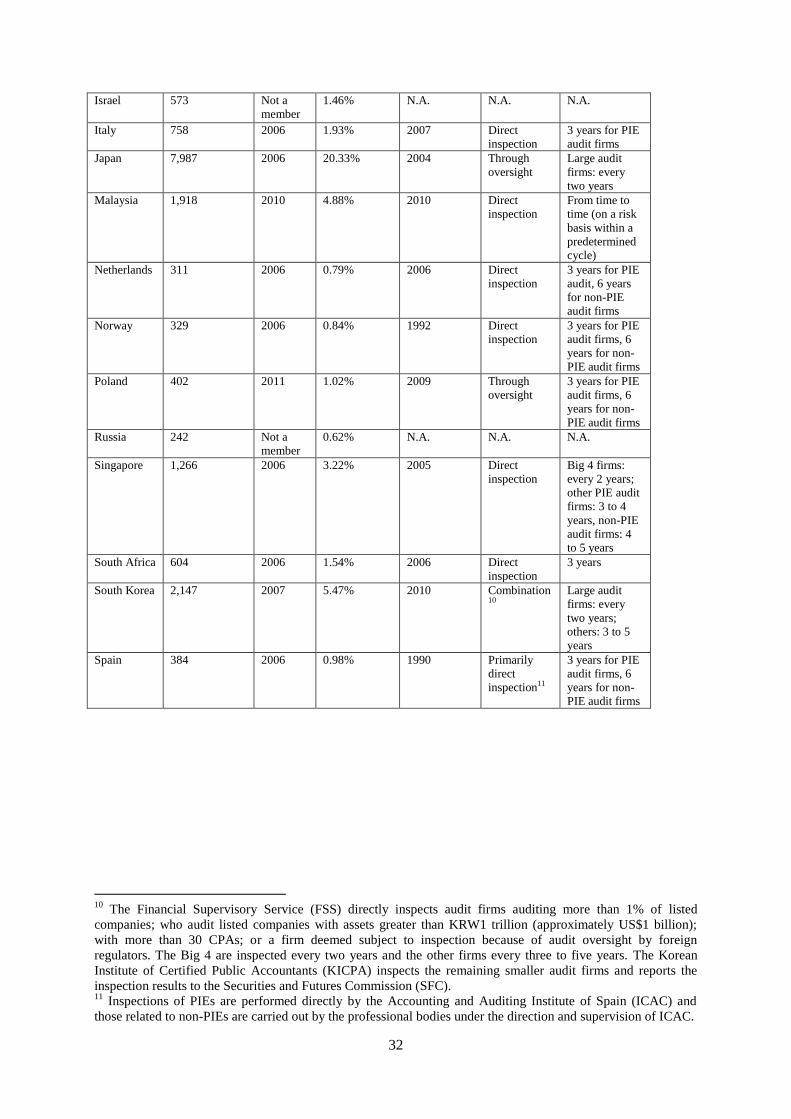
by design, no country has an inspection regime in place. Table 1 provides an overview of the
number of firm-year observations per country included in the sample in the period 2006 –
2010 and its inspection regime, IFIAR membership status, and the year inspections by
independent POBs commenced. We gather information on the frequency, experience, and
type of inspection system using the country profile documentation available on the IFIAR
website, the official websites of the POBs and/or through follow up direct contact with these
boards. This information, for listed entities in each country, is summarized in Table 1.
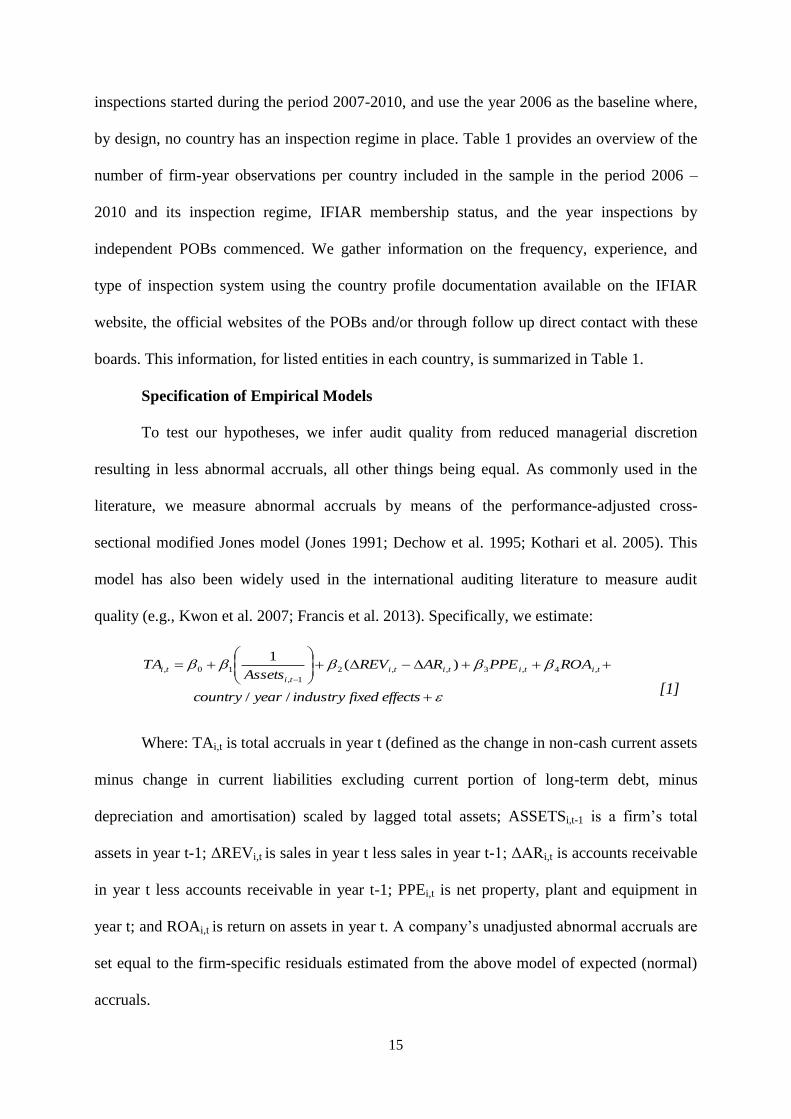
Specification of Empirical Models
To test our hypotheses, we infer audit quality from reduced managerial discretion
resulting in less abnormal accruals, all other things being equal. As commonly used in the
literature, we measure abnormal accruals by means of the performance-adjusted cross-
sectional modified Jones model (Jones 1991; Dechow et al. 1995; Kothari et al. 2005). This
model has also been widely used in the international auditing literature to measure audit
quality (e.g., Kwon et al. 2007; Francis et al. 2013). Specifically, we estimate:
effectsfixedindustryyearcountry
ROAPPEARREVAssets
TA titititi
ti
ti
//
)(1
,4,3,,2
1,
10,
[1]
Where: TAi,t is total accruals in year t (defined as the change in non-cash current assets
minus change in current liabilities excluding current portion of long-term debt, minus
depreciation and amortisation) scaled by lagged total assets; ASSETSi,t-1 is a firm’s total
assets in year t-1; ΔREVi,t is sales in year t less sales in year t-1; ΔARi,t is accounts receivable
in year t less accounts receivable in year t-1; PPEi,t is net property, plant and equipment in
year t; and ROAi,t is return on assets in year t. A company’s unadjusted abnormal accruals are
set equal to the firm-specific residuals estimated from the above model of expected (normal)
accruals.

16
As an alternative measure for abnormal accruals, we use abnormal working capital
accruals based on the expectation model in DeFond and Park (2001). A common argument in
the literature is that non-working capital accruals are less susceptible to manipulation than
working capital accruals (e.g., DeFond and Jiambalvo 1994; Teoh et al. 1998). Specifically,
we calculate abnormal working capital accruals as realized working capital minus expected
working capital, where expected working capital is assumed to be a fixed proportion of sales
(Dechow et al. 1998; DeFond and Park 2001). Or formally:
tititititi SSWCWCAWCA ,1,1,,, *)/( [2]
Where: AWCAt is abnormal working capital accruals in year t; WCt and WCt-1 are non-
cash working capital in year t and year t-1, respectively, where non-cash working capital is
computed as the difference between (current assets minus cash and short-term investments)
and (current liabilities minus short-term debt); and St and St-1 are sales in year t and year t-1.
To test our hypotheses, we use the following model:
EffectsFixedYearEffectsFixedIndustryInterestofVariables
LawofRuleAuditorGrowthPPEMB
LossGrowthePerformancLeverageSizeAWCAorATA
titititi
tititititititi
__
_
10
,9,8,7,6
,5,4,3,2,10,,
[3]
Where:
|ATAi,t| is the absolute value of performance-adjusted abnormal total accruals
measured by modified Jones model in Equation 1; |AWCAi,t| is the absolute value of abnormal
working capital accruals in Equation 2; Sizei,t is the natural logarithm of total assets (in
millions); Leveraget is the ratio of long-term debt to total assets; Performancei,t is the
operating cash flow scaled by total assets; Growthi,t is the percentage of year-to-year growth
in sales; Lossi,t is an indicator variable for loss in the current year; MBi,t is a company’s
market value of equity scaled by book value of equity; PPE_Growthi,t is a company’s one
year growth in gross property, plant and equipment from year t-1 to year t. Auditori,t is an

17
indicator variable for Big N auditors; Rule of Lawi,t is a World Bank Governance Indicator
developed by Kaufmann et al. (2010 4) and represents “capturing perceptions of the extent to
which agents have confidence in and abide by the rules of society, and in particular the
quality of contract enforcement, property rights, the police, and the courts, as well as the
likelihood of crime and violence”; and Industry is a vector of industry indicator variables and
Year is a vector of year indicator variables. The variables of interest are: Inspection, which is
an indicator variable taking the value of 1 when the observation relates to a country where
independent inspections are in place; Post_Inspect, which is an indicator variable taking the
value of 1 when the observation relates to the post-inspection period; IFIAR, which is an
indicator variable taking the value of 1 if the observation relates to a country whose regulator
is a current member of IFIAR; First_time, which is an indicator variable taking the value of 1
when it is the first year that inspections are performed; Ln_exp, which is the natural logarithm
of the number of years of inspection experience; Type_oversight, which represents the type of
oversight system taking the value of 2 in case of direct oversight, 0 in case of oversight
through the profession under supervision of the oversight board, and 1 in case of a
combination; and Freq_Inspect, which is an indicator variable taking the value of 1 in cases
where large audit firms are inspected on an annual basis.
IV. RESULTS
Descriptives
Table 1 presents the 33 countries included in the sample, the number of observations
per country, IFIAR membership and other public oversight features. The most highly
represented countries in the sample in terms of number of observations are Japan (20.33%)
and the U.S. (16.02%). All other countries individually represent less than 7% of the total
sample. To control for the discrepancy in the number of observations and as our focus is at the
18
country-level, we use weighted regressions where we equally weight countries rather than
equal weight client observations, consistent with the approach used by Choi and Wong
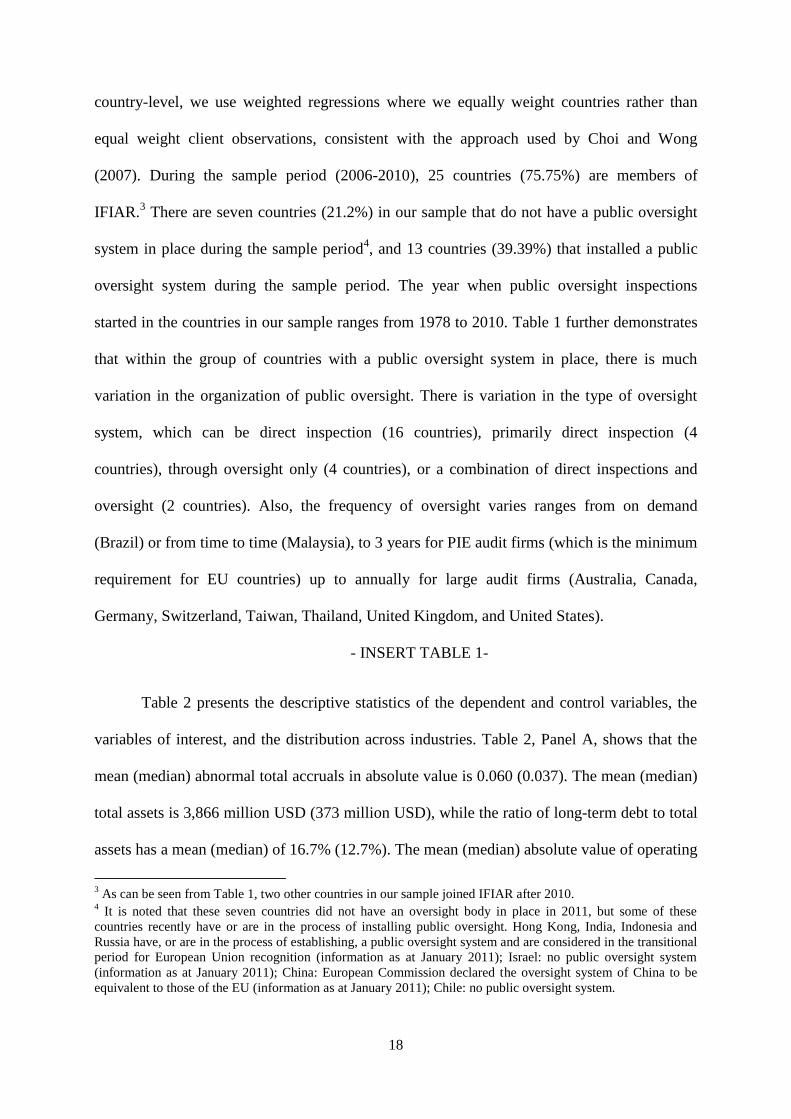
(2007). During the sample period (2006-2010), 25 countries (75.75%) are members of
IFIAR.3 There are seven countries (21.2%) in our sample that do not have a public oversight
system in place during the sample period4, and 13 countries (39.39%) that installed a public
oversight system during the sample period. The year when public oversight inspections
started in the countries in our sample ranges from 1978 to 2010. Table 1 further demonstrates
that within the group of countries with a public oversight system in place, there is much
variation in the organization of public oversight. There is variation in the type of oversight
system, which can be direct inspection (16 countries), primarily direct inspection (4
countries), through oversight only (4 countries), or a combination of direct inspections and
oversight (2 countries). Also, the frequency of oversight varies ranges from on demand
(Brazil) or from time to time (Malaysia), to 3 years for PIE audit firms (which is the minimum
requirement for EU countries) up to annually for large audit firms (Australia, Canada,
Germany, Switzerland, Taiwan, Thailand, United Kingdom, and United States).
- INSERT TABLE 1-
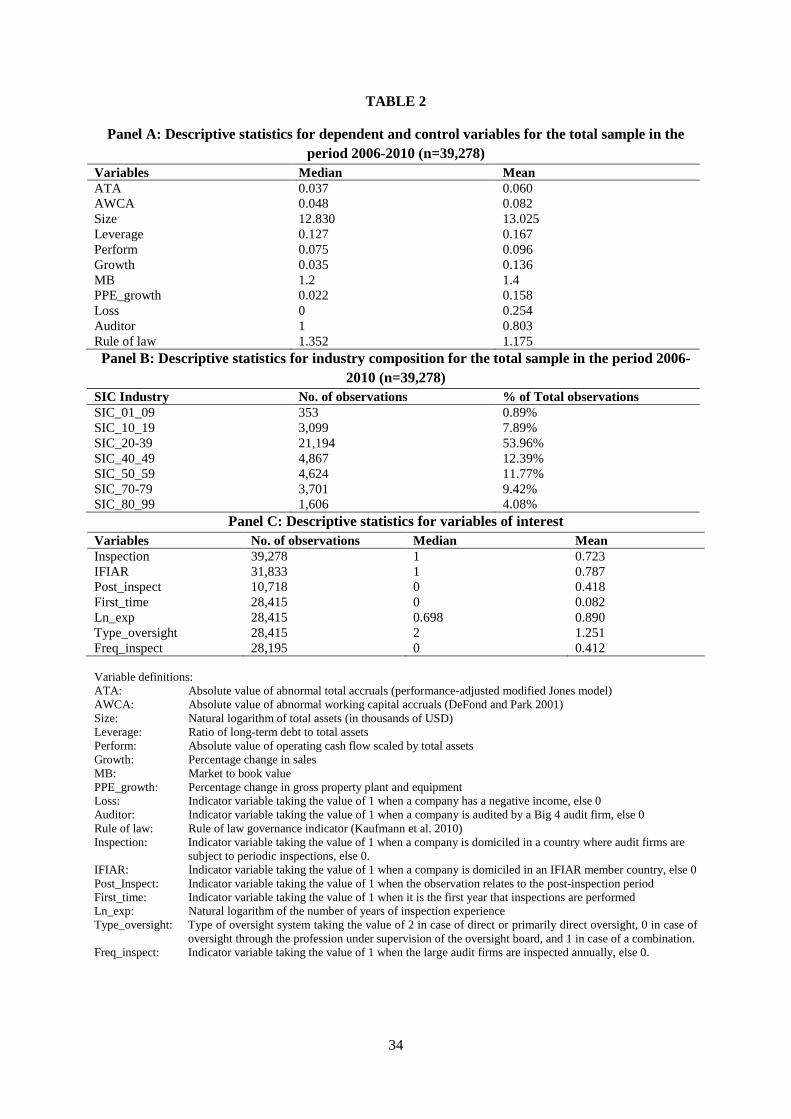
Table 2 presents the descriptive statistics of the dependent and control variables, the
variables of interest, and the distribution across industries. Table 2, Panel A, shows that the
mean (median) abnormal total accruals in absolute value is 0.060 (0.037). The mean (median)
total assets is 3,866 million USD (373 million USD), while the ratio of long-term debt to total
assets has a mean (median) of 16.7% (12.7%). The mean (median) absolute value of operating
3 As can be seen from Table 1, two other countries in our sample joined IFIAR after 2010.
4 It is noted that these seven countries did not have an oversight body in place in 2011, but some of these
countries recently have or are in the process of installing public oversight. Hong Kong, India, Indonesia and
Russia have, or are in the process of establishing, a public oversight system and are considered in the transitional
period for European Union recognition (information as at January 2011); Israel: no public oversight system
(information as at January 2011); China: European Commission declared the oversight system of China to be
equivalent to those of the EU (information as at January 2011); Chile: no public oversight system.
19
cash flow scaled by total assets is 0.096 (0.075). The mean (median) growth rate measured as
the percentage change in sales is 13.6% (3.5%), and the mean (median) growth rate of gross
property plant and equipment is 15.8% (2.2%). The mean (median) market to book value is
1.4 (1.2). In the sample, 25.4% of the observations have a negative income, and 80.3% are
audited by a Big 4 auditor5. The rule of law has a mean (median) value of 1.175 (1.352).
Table 2, Panel B, shows that the majority of the observations (53.96%) relate to the
manufacturing industry (SIC 20-30), followed by 12.39% in the utilities industry (SIC 40-49),
and 11.77% in the wholesale trade industry (SIC 50-59).
Table 2, Panel C, presents the mean (median) values of the variables of interest in the
analyses and the corresponding number of observations. For the testing of Hypothesis 2, we
concentrate on those countries where public oversight was introduced in the period 2007-
2010, and use the year 2006 as the benchmark as, at that stage, no country had public
oversight in place. In total, 11 countries started their inspections in the period 2007-2010,
which corresponds with 10,718 observations of which 58.2% (41.8%) relate to the pre- (post)
inspection period. In the additional analysis, for the testing of IFIAR membership, we focus
on the period 2007-2010, and exclude the year 2006 since IFIAR was founded in September
2006. For this analysis, we have 31,833 observations, 78.7% of which belong to an IFIAR
member country. Our additional analysis of characteristics of inspections uses a sample of
those countries where inspections were in place before or during the sample period, which
represents 28,415 observations. Of these observations, 8.2% relate to a country where
inspections are performed for the first time. The mean (median) years of experience with
inspections is 4.5 (4) years. With regard to the type of oversight system, the median
observation relates to a country where direct or primarily direct inspection is in place. Note
5 We note that the data for the type of auditor are retrieved from Worldscope which only offers static data for this
data item. As we do not have access to earlier versions of Worldscope, we cannot control for changes during the
sample period.
20
that in the analyses we classify primarily direct inspection under direct inspection since our
sample is comprised of listed companies and all listed companies are subject to direct
inspection in those countries where primarily direct inspection applies.
-INSERT TABLE 2-
Multivariate Analysis
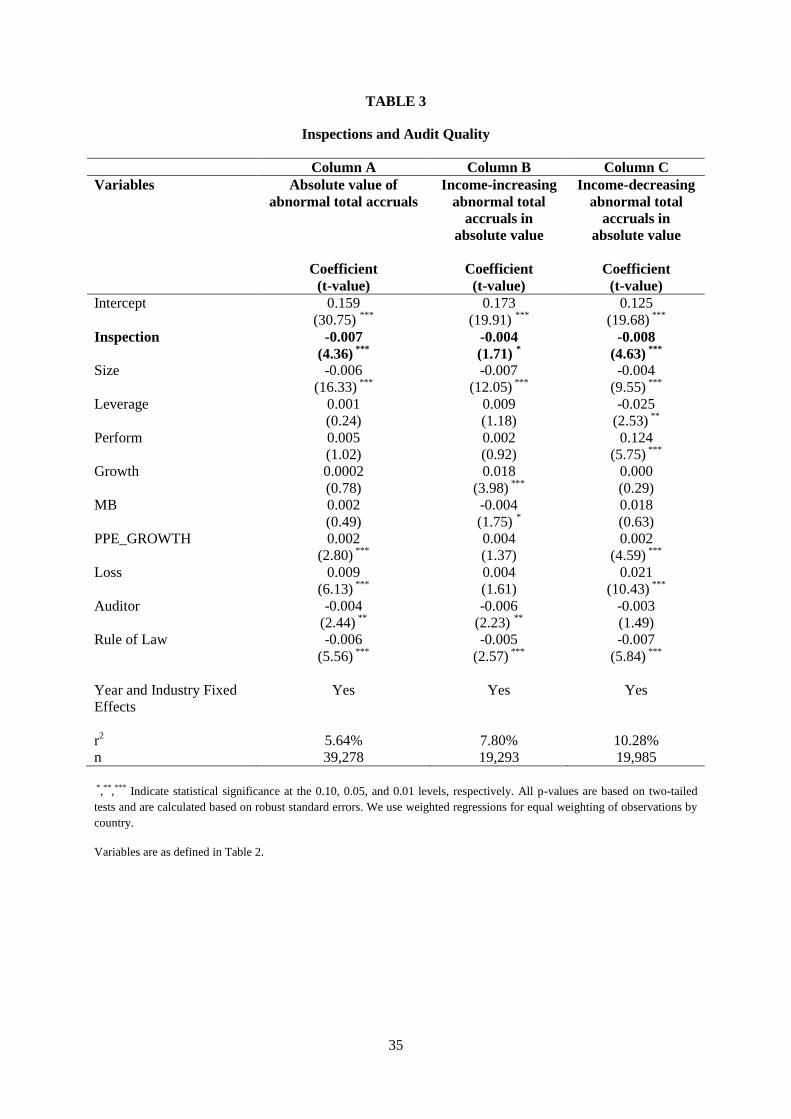
Table 3 presents the results of the testing of Hypothesis 1 on the association between
inspections and audit quality (measured by abnormal total accruals). The results (Column A)
show a significant negative coefficient for the Inspection variable (p<0.01), implying that
companies domiciled in countries with independent inspections have significantly lower
levels of abnormal accruals. This would suggest that audit quality is higher in those countries
as auditors appear to act as a stronger constraint on earnings management. Significant control
variables are size, PPE growth, loss, auditor, and rule of law, all of which are in the expected
direction. We repeat the analysis for income-increasing (Column B) and income-decreasing
(Column C) accruals, and find that inspections are associated with significantly less income-
increasing (p<0.10) and income-decreasing accruals (p<0.01). We repeat these analyses with
abnormal working capital accruals as the dependent variable. The results (not tabulated for
parsimony) are qualitatively similar: inspections are associated with significantly less
abnormal working capital accruals (p<0.01). Similarly, inspections are associated with
significantly less income-increasing abnormal working capital accruals (p<0.05), and
significantly less income-decreasing abnormal working capital accruals (p<0.01).
-INSERT TABLE 3-
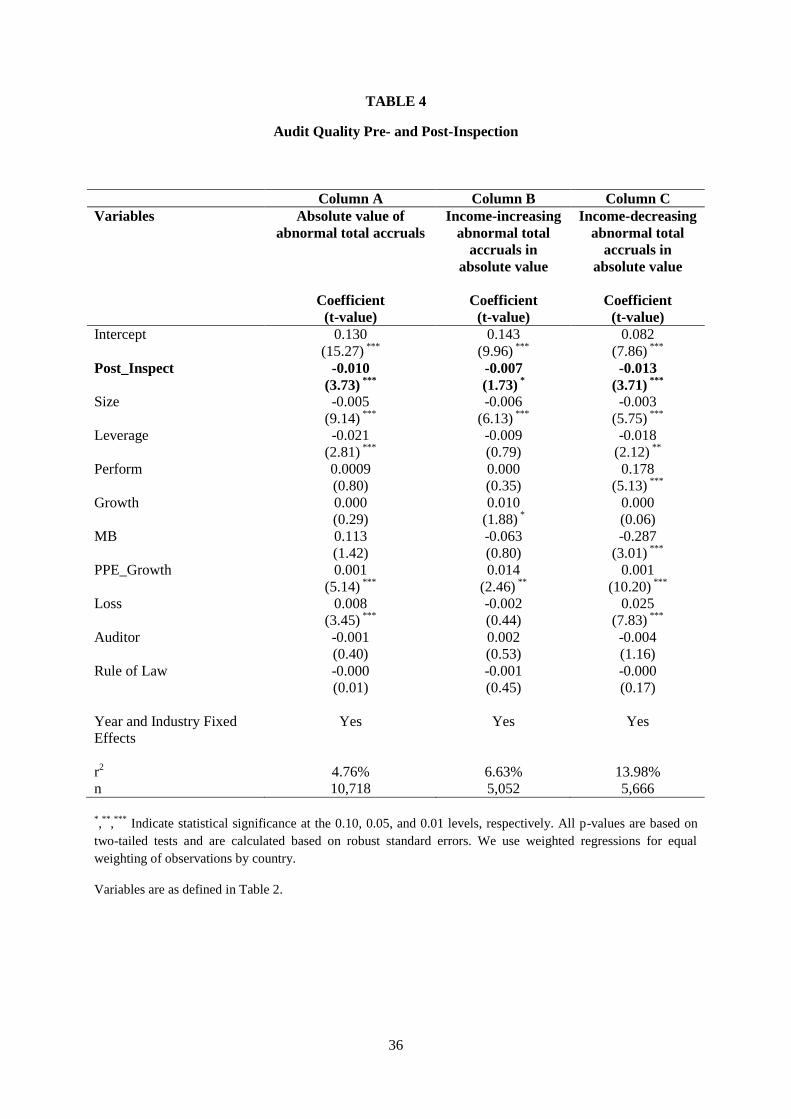
In Table 4, the results of the analysis of Hypothesis 2 relating to audit quality pre- and
post-inspections are presented. The coefficient of the post inspection variable (Column A) is
significantly negative (p<0.01). This implies that the level of abnormal accruals of companies
21
domiciled in countries that installed public oversight during the period 2007-2010 is
significantly lower in the post-inspection regime compared to the pre-inspection regime.
Significant control variables are size, leverage, PPE growth, and loss, all in the expected
directions. This result holds for income-increasing (Column B, p<0.10) and for income-
decreasing accruals (Column C, p<0.01). A univariate t-test shows that the mean value of
absolute abnormal accruals is 0.072 in the pre-inspection regime (n=6,236) and drops to 0.061
in the post-inspection regime (n=4,482) (p<0.01). There is a potential concern that all
environments have experienced an increase in audit quality over this period, and so we
compare these results with companies in our sample from countries in which public oversight
was not installed either before or during the period 2007-2010. For this sample we find a
mean absolute value of abnormal accruals of 0.071 in the benchmark year 2006 (n=1,117),
and 0.073 in the years 2007-2010 (n=5,276), which suggests a slight increase in abnormal
accruals. In a multivariate analysis (not reported), the coefficient of the benchmark year 2006
is not significant. Collectively, this supports the view that the implementation of an inspection
regime has resulted in an increase in audit quality, as over the same period there is no similar
improvement in audit quality where there are no inspection processes in place. We repeat the
analyses of Table 4 with abnormal working capital accruals as the dependent variable.
Untabulated results show that post-inspection these accruals are significantly lower in
absolute value (p<0.01), which is attributed to income-decreasing (p<0.01) abnormal working
capital accruals being significantly lower, while income-increasing abnormal working capital
accruals are negative but not significant. We note that if we run unweighted regressions, we
obtain significant lower abnormal working capital accruals in absolute value (p<0.01), both
for income-increasing (p<0.05) and income-decreasing (p<0.01) abnormal working capital
accruals.
-INSERT TABLE 4-
22
Additional Analyses
IFIAR Membership
As outlined earlier, IFIAR membership is confined to regulatory agencies that are
independent of the audit profession and conduct periodic independent inspections of audit
firms undertaking audits of public interest entities. Both of these characteristics of a POB
should result in a higher audit quality in that country, and thus we expect that IFIAR
membership has a positive association with audit quality. Since IFIAR was founded in
September 2006, the period of study for this analysis starts in 2007.
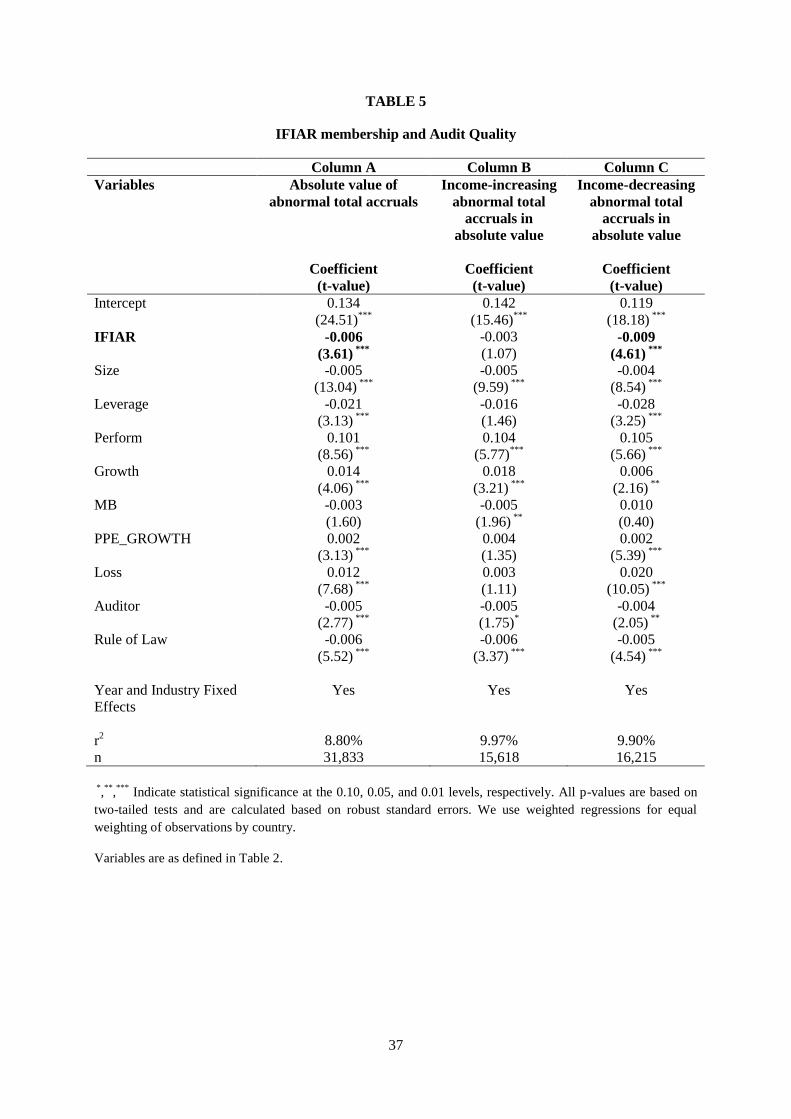
Table 5 presents the results of the analysis on the association between IFIAR
membership and audit quality. The results (Column A) show a significant negative coefficient
for IFIAR (p<0.01), implying that companies domiciled in IFIAR member countries have
significantly lower levels of abnormal accruals. This would suggest that audit quality is higher
in those countries as auditors appear to act as a stronger constraint on earnings management.
We repeat the analysis for income-increasing (Column B) and income-decreasing (Column C)
accruals, and find that IFIAR membership is associated both with significantly less income-
decreasing accruals (p<0.01), and negative but insignificant income-increasing abnormal
accruals. We repeat these analyses with abnormal working capital accruals as the dependent
variable. The results (not tabulated for parsimony) are qualitatively similar: IFIAR
membership is associated with significantly less abnormal working capital accruals (p<0.05).
For IFIAR membership, we find a significant negative association with income-decreasing
abnormal working capital accruals (p<0.05), and a negative but insignificant association with
income-increasing abnormal working capital accruals.
-INSERT TABLE 5-

23
Unweighted Regression Analyses
We re-ran the models (untabulated for parsimony) presented in Tables 3 and 5 using
unweighted regressions and subsequently excluding alternatively Japan and the U.S., which
are the dominant countries in the sample. In all cases (full sample, with and without Japan,
with and without the U.S.), we observe a significant negative coefficient for Inspection (as in
Table 3) for the absolute value of abnormal total accruals, income-increasing absolute
abnormal total accruals, and income-decreasing absolute abnormal total accruals.
For IFIAR, we observe a significant negative coefficient for the full sample and
without the U.S. for the absolute value of abnormal total accruals, income-increasing absolute
abnormal total accruals, and income-decreasing absolute abnormal total accruals. Without
Japan, the coefficient for IFIAR is only significantly positive for income-decreasing abnormal
accruals.
Unweighted regressions (untabulated for parsimony) for the models presented in
Table 4 also give a significant negative coefficient for the variable Post_Inspect for the
absolute value of abnormal total accruals, income-increasing absolute total accruals, and
income-decreasing absolute total accruals. Note that Japan and the U.S. are not included in
the sample used for testing of hypothesis 2 as shown in Table 4 and therefore their inclusion
or exclusion will not influence the results reported.
Characteristics of inspection process
In examining the impact of the major characteristics of the inspection process on audit
quality we focus on those countries where independent inspections of audit firms are in place,
and consider a number of choices made by regulators in the design of inspection processes.
Specifically, we consider three major characteristics of the inspection regime, being the
period of time since inspections commenced (outlining the number of years of inspection
24
experience), the type of inspection system, being inspections directly undertaken by the
independent POB or undertaken by professional bodies under the POB’s supervision, and the
frequency of inspections. This allows an examination as to whether variation in the
characteristics of inspection regimes is associated with audit quality.
We examine whether a learning effect arises from the cumulative experience of being
inspected. We also consider the differential impact of the two main types of inspection
systems on audit quality. We consider whether inspections of audit firms directly performed
by inspectors of independent POBs have a stronger association with audit quality compared to
inspections undertaken by a professional body under the supervision of the POB. We argue
that inspection directly undertaken by the POBs will result in a stricter and more rigorous type
of inspection system. The rationale for this analysis is consistent with the reasons why there
has been a move in the last decade from self-regulation by the audit profession to oversight by
independent POBs. In our third additional analysis we consider the frequency of inspections
conducted. We expect that more frequent inspections are associated with higher audit quality.
The reasoning behind this is that the incentives of audit firms to be lenient towards their client
companies may decrease as a function of the likelihood of being caught for malpractice,
which may increase with the frequency of inspections.
The results of these analyses relating to features of inspection regimes and audit
quality are as follows. None of the features that we consider (number of years of inspection
experience, type of oversight system, and frequency of inspections) are significantly
associated with the absolute value of abnormal total accruals. Similarly, none of these features
significantly affects income-increasing abnormal total accruals. We also do not find any
support for a significant association between features of inspection regimes and audit quality
using abnormal working capital accruals, except that direct inspections significantly increase
income-decreasing abnormal working capital accruals (p<0.10).
25
V. CONCLUSION
One of the most profound changes in audit regulation of the past decade has been the
move to independent public oversight of the auditing profession, putting an end to the
traditional model of self-regulation. As the potential merits of public oversight are contested
by some, research on its effectiveness is warranted. Currently, the emerging literature on
public oversight has mainly focused on the U.S., since it is one of the few countries where the
public oversight body publicly discloses inspection findings. The issue is much broader than
the U.S., and the move to independent public oversight bodies has been a world-wide trend,
emphasized by the formation of IFIAR in September 2006, growing to a membership of 44
countries in early 2013. However, apart from a couple of studies relating to individual
countries other than the U.S., to the best of our knowledge, there is no international study on
the effectiveness of independent public oversight which we examine here. In our examination
of the effectiveness of public oversight in its different forms at an international level, we
make use of a large sample of non-financial companies located in 33 countries over the period
2006-2010. We observe that the level of abnormal accruals is significantly lower for
companies domiciled in countries where independent inspections of audit firms are conducted
and in IFIAR member countries. This suggests that audit quality is stronger in countries
where a national independent inspection regime is in place as well as in IFIAR member
countries, where the POB is bound by a number of requirements that are expected to lead to
an improved audit environment.
We further concentrate our analysis on the key plank of the strategy and work effort of
the independent oversight bodies, which is the inspection of audit firms. We find that the level
of abnormal accruals is significantly lower in the period after the introduction of inspections
compared to the pre-inspection regime. This provides evidence that audit quality improves
26
after installing public oversight and conducting inspections. We also consider the various
characteristics of the inspection regimes to identify whether variation in the performance
characteristics of these inspections is associated with audit quality. We do not find much
difference in audit quality that could be explained by different features of the public oversight
system.
Collectively, our results contribute to the emerging literature and debate on public
oversight by providing insights from an international setting. Our findings may prove useful
for regulators in the further development, design and mutual recognition of public oversight
systems. They do suggest that one of the major impacts on audit quality is having an
inspection program, and that the specific characteristics of the inspection programs are less
important.
One of the potential limitations of our study is endogeneity concerns, especially with
regards to the analysis of impact of countries with inspections and IFIAR membership. Our
pre-/post-analysis, where we find that the level of abnormal accruals is significantly lower in
the post-inspection regime compared to the pre-inspection regime, and that this finding does
not hold for audits not subject to inspection regimes over a similar period, helps to alleviate
this concern. However, we cannot categorically attribute the observed improvement in audit
quality directly to the performance of inspections. Although this is the major initiative of the
independent oversight boards aimed at audit quality, it may be that other common factors
associated with the countries that have created independent oversight boards that have
instigated active inspection regimes have also contributed. Alternatively, it may be not that
inspections themselves are improving audit quality but that the expectation of having audit
work subjected to external scrutiny and public disclosure may improve audit practices and
impact audit quality6. A further limitation is that we are restricted to one measure of audit
6 The Consultative Committee of Accountancy Bodies in the United Kingdom conducted a series of interviews
with stakeholders regarding perceptions of the impact of inspections and transparency reports in 2011: “Some
27
quality, discretionary accruals. Other commonly used measures of audit quality are limited to
certain companies (such as the appropriate use of going concern opinions, which are specific
to loss-making companies) or are not available, or comparable, for an international study
(such as financial statement restatements which are a common feature in the U.S. but for
which information is not applicable or available for other countries).
Our study is a first attempt at addressing public oversight of the auditing profession in
an international setting. Future research could attempt to disentangle the impact of inspections
themselves improving audit quality versus the perception that a firm will be inspected that
will impact audit processes and hence audit quality. Further insights could also be gained by
separately analysing the impact of inspection programs on global audit firm networks and
other audit firms. Future research may also look into the effectiveness of public oversight in
an international setting by using other indicators of audit quality, by further exploiting the
different features on the organization and characteristics of public oversight as data become
available, and by further extending the period of study.
investor representatives and regulators saw the potential for the reports to improve audit quality. Most
interviewees, however, did not believe that the governance and transparency reports would improve audit quality
to any significant extent. ... There was a view that the fact that the firm was going to be reviewed was as much a
driver of improvement as the review itself” (emphasis added).

28
REFERENCES
Abbott, L. J., K. Gunny, and T. C. Zhang. 2013. When the PCAOB talks, who listens?
Evidence from client firm reactions to adverse, GAAP-deficient PCAOB inspection
reports. Auditing: A Journal of Practice & Theory 32 (2): 1-31.
Australian Securities and Investments Commission (ASIC). 2012. 12-301MR ASIC's audit
inspection findings for 2011-12. Available at:
http://www.asic.gov.au/asic/asic.nsf/byheadline/12-
301MR+ASICs+audit+inspection+findings+for+2011-12?openDocument.
Carcello, J. V., C. Hollingsworth, and S. Mastrolia. 2011. The effect of PCAOB inspections
on Big 4 audit quality. Research in Accounting Regulation 23 (2): 85-96.
Carey, P., and R. Simnett. 2006. Audit partner tenure and audit quality. The Accounting
Review 81: 653-676.
Choi, J.-H., and T. J. Wong. 2007. Auditors' governance functions and legal environments:
An international investigation. Contemporary Accounting Research 24: 13–46.
Consultative Committee of Accountancy Bodies. 2011. Audit Quality and Transparency, a
Study of the Usage and Impact of Public Reports on Audit Governance: Are they
Providing Appropriate Reassurance on Audit Quality? CCAB Limited: London.
Daugherty, B. and W. Tervo. 2010. PCAOB inspections of smaller CPA firms: The
perspective of inspected firms. Accounting Horizons 24 (2): 189-219.
Daugherty, B., D. Dickins, and W. A. Tervo. 2011. Negative PCAOB inspections of
triennially inspected auditors and involuntary and voluntary client losses. International
Journal of Auditing 15 (3): 231-246.
Dechow, P., R. Sloan, and A. Sweeney. 1995. Detecting earnings management. The
Accounting Review 70: 193-225.
Dechow, P., S. P. Kothari, and R. Watts. 1998. The relation between earnings and cash flows.
Journal of Accounting and Economics 25 (2): 133-168.
Dee, C. C., A. Lulseged, and T. Zhang. 2011. Client stock market reaction to PCAOB
sanctions against a Big Four auditor. Contemporary Accounting Research 28 (1): 263-
291.
DeFond, M. L. 2010. How should the auditors be audited? Comparing the PCAOB
Inspections with the AICPA Peer Reviews. Journal of Accounting and Economics 49
(1-2): 104-108.
DeFond, M. L. and J. Jiambalvo. 1994. Debt covenant violation and manipulation of accruals.
Journal of Accounting and Economics 17(1-2): 145-176.
DeFond, M. L., and C. S. Lennox. 2011. The effect of SOX on small auditor exits and audit
quality. Journal of Accounting and Economics 52: 21-40.
DeFond, M. L. and C. Park. 2001. The reversal of abnormal accruals and the market valuation
of earnings surprises. The Accounting Review 76 (3): 375-404.
European Commission (EC). 2010. Green Paper. Audit Quality: Lessons from the Crisis.
Available at: http://eur-
lex.europa.eu/LexUriServ/LexUriServ.do?uri=COM:2010:0561:FIN:EN:PDF.
29
Financial Reporting Council (FRC). 2012. Audit Quality Inspections: Annual Report 2011-
2012. Available at:
https://www.ifiar.org/IFIAR/media/Documents/General/Members%20Inspection%20Re
ports/Audit-Quality-Inspections-Annual-Report-2011-12.pdf.
Francis, J. R., and D. Wang. 2008. The joint effect of investor protection and Big 4 audits on
earnings quality around the world. Contemporary Accounting Research 25 (1): 157-191.
Francis, J. R., P. Michas, and S. Seavey. 2013. Does audit market concentration harm the
quality of audited earnings? Evidence from audit markets in 42 countries.
Contemporary Accounting Research 30 (1): 325-355.
Franzel, J. M. 2012. Keynote address: Driving change to achieve independent and high
quality audits. Speech delivered at Baruch College Financial Reporting Conference,
May 3. Available at: http://pcaobus.org/News/Speech/Pages/05032012_Baruch.aspx.
Fuentes, C. D., M. Illueca, and M. C. Pucheta-Martinez. 2010. Disciplinary sanctions and
audit quality: Empirical evidence from an external oversight system. Working paper,
available at SSRN.
Glover, S. M., D. F. Prawitt, and M. H. Taylor. 2009. Audit standard setting and inspection
for US public companies: A critical assessment and recommendations for fundamental
change. Accounting Horizons 23: 221-237.
Goelzer D. L. 2009. Seven years of The Public Company Accounting Oversight Board –
What has been accomplished and what remains to be done? Speech delivered at AICPA
Conference, Washington, December 7. Available at:
http://pcaobus.org/News/Speech/Pages/12072009_Goelzer_AICPA_Speech.aspx.
Gunny, K. and T. C. Zhang. 2013. PCAOB inspection reports and audit quality. Journal of
Accounting and Public Policy (forthcoming).
Hermanson, D. R., R. W. Houston, and J. C. Rice. 2007. PCAOB inspections of smaller CPA
firms: Initial evidence from inspection reports. Accounting Horizons 21: 137-152.
Hermanson, D. R., and R. W. Houston. 2008. Quality control defects revealed in smaller
firms’ PCAOB inspection reports. The CPA Journal 78 (12): 36-39.
International Forum of Independent Audit Regulators (IFIAR). 2012. Summary Report of
Inspection Findings 18 December 2012. Available at
https://www.ifiar.org/IFIAR/media/Documents/General/IFIAR-2012-Summary-Report-
of-Members-Inspection-Findings-18-Dec-12-(2).pdf.
International Forum of Independent Audit Regulators (IFIAR). 2013. International Forum of
Independent Audit Regulators (IFIAR) – About Us. Available at:
https://www.ifiar.org/About-Us.aspx.
Jones, J. J. 1991. Earnings management during import relief investigations. Journal of
Accounting Research 29: 193-228.
Kaufmann, D., A. Kraay, and M. Mastruzzi. 2010. The Worldwide Governance Indicators:
Methodology and Analytical Issues. World Bank Policy Research Working Paper No.
5430.
30
Knechel, W. R., M. Offermanns, and A. Vanstraelen. 2012. PCAOB inspections and audit
firm behavior: An analysis of audit fees, audit effort and industry specialization.
Working paper, Maastricht University.
Kothari, S. P., A. J. Leone, and C. E. Wesley. 2005. Performance matched discretionary
accrual measures. Journal of Accounting and Economics 39: 163-197.
Kwon, S. Y., C. Y. Lim, and P. M.-S. Tan. 2007. Legal systems and earnings quality: The
role of auditor industry specialization. Auditing: A Journal of Practice and Theory 26
(2): 25-55.
Lennox, C., and J. Pittman. 2010. Auditing the auditors: Evidence on the recent reforms to the
external monitoring of audit firms. Journal of Accounting and Economics 49 (1-2): 84-
103.
Roybark, H. M. 2009. An analysis of audit deficiencies based on Section 104 inspection
reports issued by the PCAOB during 2004-2007. Journal of Accounting, Ethics and
Public Policy 10(1): 1-81.
Simnett, R., and A. Smith. 2005. Public oversight: An international approach to auditing. In
Ethics and Auditing, edited by T. Campbell and K. Houghton, 45-62. Canberra: ANU
E-Press.
Teoh, S., T. Wong and G. Rao. 1998. Are accruals during initial public offerings
opportunistic? Review of Accounting Studies 3 (1-2): 175-208.
Van Opijnen, M., K. Van de Poel, and A. Vanstraelen. 2011. Public oversight and audit
quality: Evidence from public oversight of audit firms in the Netherlands. Working
paper, available at SSRN.

31
TABLE 1
Observations per Country and Details of Inspection Regimes
Country Number of
Observations
Year of
joining
IFIAR
% of Total
Observations
Year
inspections
commence
Oversight
system
Frequency of
inspections
Australia 912 2006 2.32% 2005 Direct
inspection
Large audit
firms and
significant
smaller firms:
regular
inspections
(approximately
annually)
Belgium 272 2012 0.69% 2007 Through
oversight
3 years for PIE
audit firms, 6
years for non-
PIE audit firms
Brazil 425 2006 1.08% 1978 Combination7
Prior to 2011
on demand
Canada 942 2006 2.40% 2004 Primarily
direct
inspection8
Large audit
firms: annually,
others – 2-3
years
Chile 343 Not a
member
0.87% N.A. N.A. N.A.
China 926 Not a
member
2.36% N.A. N.A. N.A.
Denmark 339 2006 0.86% 2008 Direct
inspection
3 years for PIE
audit firms, 6
years for non-
PIE audit firms
Finland 402 2007 1.02% 2007 Direct
inspection
3 years for PIE
audit firms
France 1,560 2006 3.97% 2003 Primarily
direct
inspection9
3 years for PIE
audit firms, 6
years for non-
PIE audit firms
Germany 1,101 2006 2.80% 2007 Through
oversight
Large audit
firms: annually,
others every 3
years
Greece 369 2010 0.94% 2009 Direct
inspection
3 years for PIE
audit firms
Hong Kong 1,181 Not a
member
3.01% N.A. N.A. N.A.
India 482 Not a
member
1.23% N.A. N.A. N.A.
Indonesia 490 Not a
member
1.25% N.A. N.A. N.A.
7 In 1999, a peer review system with recurring inspections undertaken by the Brazilian professional organization
was implemented. The Brazilian Securities Commission (CVM) retains the ultimate responsibility for this
system and exercises full oversight, remaining empowered to carry out its own direct inspections at any time. 8 The Canadian Public Accountability Board (CPAB) performs most of its own inspections however has entered
into memoranda of understanding with the provincial regulators of public accountants who perform inspections
of some of the smaller audit firms. CPAB’s Director of Interprovincial Affairs reviews the provincial inspection
reports and will supplement a provincial inspection if necessary. 9 A part of the PIE inspections can be delegated to the Compagnie nationale des commissaires aux comptes
(CNCC) under the supervision of the Haut Conseil du Commissariat aux Comptes (H3C). Inspections of
statutory auditors and audit firms of non-PIEs are carried out by the CNCC and Compagnie Régionale des
Commissaires aux Comptes de Paris (CRCC) under the supervision of the H3C.
32
Israel 573 Not a
member
1.46% N.A. N.A. N.A.
Italy 758 2006 1.93% 2007 Direct
inspection
3 years for PIE
audit firms
Japan 7,987 2006 20.33% 2004 Through
oversight
Large audit
firms: every
two years
Malaysia 1,918 2010 4.88% 2010 Direct
inspection
From time to
time (on a risk
basis within a
predetermined
cycle)
Netherlands 311 2006 0.79% 2006 Direct
inspection
3 years for PIE
audit, 6 years
for non-PIE
audit firms
Norway 329 2006 0.84% 1992 Direct
inspection
3 years for PIE
audit firms, 6
years for non-
PIE audit firms
Poland 402 2011 1.02% 2009 Through
oversight
3 years for PIE
audit firms, 6
years for non-
PIE audit firms
Russia 242 Not a
member
0.62% N.A. N.A. N.A.
Singapore 1,266 2006 3.22% 2005 Direct
inspection
Big 4 firms:
every 2 years;
other PIE audit
firms: 3 to 4
years, non-PIE
audit firms: 4
to 5 years
South Africa 604 2006 1.54% 2006 Direct
inspection
3 years
South Korea 2,147 2007 5.47% 2010 Combination10
Large audit
firms: every
two years;
others: 3 to 5
years
Spain 384 2006 0.98% 1990 Primarily
direct
inspection11
3 years for PIE
audit firms, 6
years for non-
PIE audit firms
10
The Financial Supervisory Service (FSS) directly inspects audit firms auditing more than 1% of listed
companies; who audit listed companies with assets greater than KRW1 trillion (approximately US$1 billion);
with more than 30 CPAs; or a firm deemed subject to inspection because of audit oversight by foreign
regulators. The Big 4 are inspected every two years and the other firms every three to five years. The Korean
Institute of Certified Public Accountants (KICPA) inspects the remaining smaller audit firms and reports the
inspection results to the Securities and Futures Commission (SFC). 11
Inspections of PIEs are performed directly by the Accounting and Auditing Institute of Spain (ICAC) and
those related to non-PIEs are carried out by the professional bodies under the direction and supervision of ICAC.

33
Sri Lanka 220 2007 0.56% 2000 Direct
inspection
Annual sample
of all audits
Sweden 601 2006 1.53% 1995 Direct
inspection12
3 years for PIE
audit firms, 6
years for non-
PIE audit firms
Switzerland 509 2007 1.30% 2005 Direct
inspection
PWC, KPMG,
EY: annual
basis; others: 3
years
Taiwan 2,413 2009 6.14% 2009 Direct
inspection
Large audit
firms: every 3
years; others: 6
years
Thailand 597 2010 1.52% 2010 Direct
inspection
Big 4: every
year; others:
every 3 years
United
Kingdom
1,982 2006 5.05% 2004 Primarily
direct
inspection13
Big 4: annual;
other major
firms: 2 years
United
States
6,291 2007 16.02% 2003 Direct
inspection
Large audit
firms: annual;
others: 3 years
Total 39,278 100%
12
For non-PIE audit firms, an oversight role is played by members as inspections are carried out by the
professional institute. 13
The oversight is mostly direct and the U.K. does state “Direct Inspection” in their member form to IFIAR.
Consider the following statement: “There are an estimated further 40 firms with less than 10 public interest
audits, where the Audit Inspection Unit (AIU) of the Financial Reporting Council (FRC) reviews the audit work
of their public interest audits and delegates the independent inspection of the firm to the Monitoring Bodies of
either the Institute of Chartered Accountants in England and Wales (ICAEW) or Institute of Chartered
Accountants in Scotland (ICAS) to undertake the primary review of the firm.”
34
TABLE 2
Panel A: Descriptive statistics for dependent and control variables for the total sample in the
period 2006-2010 (n=39,278)
Variables Median Mean
ATA 0.037 0.060
AWCA 0.048 0.082
Size 12.830 13.025
Leverage 0.127 0.167
Perform 0.075 0.096
Growth 0.035 0.136
MB 1.2 1.4
PPE_growth 0.022 0.158
Loss 0 0.254
Auditor 1 0.803
Rule of law 1.352 1.175
Panel B: Descriptive statistics for industry composition for the total sample in the period 2006-
2010 (n=39,278)
SIC Industry No. of observations % of Total observations
SIC_01_09 353 0.89%
SIC_10_19 3,099 7.89%
SIC_20-39 21,194 53.96%
SIC_40_49 4,867 12.39%
SIC_50_59 4,624 11.77%
SIC_70-79 3,701 9.42%
SIC_80_99 1,606 4.08%
Panel C: Descriptive statistics for variables of interest
Variables No. of observations Median Mean
Inspection 39,278 1 0.723
IFIAR 31,833 1 0.787
Post_inspect 10,718 0 0.418
First_time 28,415 0 0.082
Ln_exp 28,415 0.698 0.890
Type_oversight 28,415 2 1.251
Freq_inspect 28,195 0 0.412
Variable definitions:
ATA: Absolute value of abnormal total accruals (performance-adjusted modified Jones model)
AWCA: Absolute value of abnormal working capital accruals (DeFond and Park 2001)
Size: Natural logarithm of total assets (in thousands of USD)
Leverage: Ratio of long-term debt to total assets
Perform: Absolute value of operating cash flow scaled by total assets
Growth: Percentage change in sales
MB: Market to book value
PPE_growth: Percentage change in gross property plant and equipment
Loss: Indicator variable taking the value of 1 when a company has a negative income, else 0
Auditor: Indicator variable taking the value of 1 when a company is audited by a Big 4 audit firm, else 0
Rule of law: Rule of law governance indicator (Kaufmann et al. 2010)
Inspection: Indicator variable taking the value of 1 when a company is domiciled in a country where audit firms are
subject to periodic inspections, else 0.
IFIAR: Indicator variable taking the value of 1 when a company is domiciled in an IFIAR member country, else 0
Post_Inspect: Indicator variable taking the value of 1 when the observation relates to the post-inspection period
First_time: Indicator variable taking the value of 1 when it is the first year that inspections are performed
Ln_exp: Natural logarithm of the number of years of inspection experience
Type_oversight: Type of oversight system taking the value of 2 in case of direct or primarily direct oversight, 0 in case of
oversight through the profession under supervision of the oversight board, and 1 in case of a combination.
Freq_inspect: Indicator variable taking the value of 1 when the large audit firms are inspected annually, else 0.
35
TABLE 3
Inspections and Audit Quality
Column A Column B Column C
Variables Absolute value of
abnormal total accruals
Income-increasing
abnormal total
accruals in
absolute value
Income-decreasing
abnormal total
accruals in
absolute value
Coefficient
(t-value)
Coefficient
(t-value)
Coefficient
(t-value)
Intercept 0.159
(30.75) ***
0.173
(19.91) ***
0.125
(19.68) ***
Inspection -0.007
(4.36) ***
-0.004
(1.71) *
-0.008
(4.63) ***
Size -0.006
(16.33) ***
-0.007
(12.05) ***
-0.004
(9.55) ***
Leverage 0.001
(0.24)
0.009
(1.18)
-0.025
(2.53) **
Perform 0.005
(1.02)
0.002
(0.92)
0.124
(5.75) ***
Growth 0.0002
(0.78)
0.018
(3.98) ***
0.000
(0.29)
MB 0.002
(0.49)
-0.004
(1.75) *
0.018
(0.63)
PPE_GROWTH 0.002
(2.80) ***
0.004
(1.37)
0.002
(4.59) ***
Loss 0.009
(6.13) ***
0.004
(1.61)
0.021
(10.43) ***
Auditor -0.004
(2.44) **
-0.006
(2.23) **
-0.003
(1.49)
Rule of Law -0.006
(5.56) ***
-0.005
(2.57) ***
-0.007
(5.84) ***
Year and Industry Fixed
Effects
Yes Yes Yes
r2 5.64% 7.80% 10.28%
n 39,278 19,293 19,985
*,**,*** Indicate statistical significance at the 0.10, 0.05, and 0.01 levels, respectively. All p-values are based on two-tailed
tests and are calculated based on robust standard errors. We use weighted regressions for equal weighting of observations by
country.
Variables are as defined in Table 2.
36
TABLE 4
Audit Quality Pre- and Post-Inspection
Column A Column B Column C
Variables Absolute value of
abnormal total accruals
Income-increasing
abnormal total
accruals in
absolute value
Income-decreasing
abnormal total
accruals in
absolute value
Coefficient
(t-value)
Coefficient
(t-value)
Coefficient
(t-value)
Intercept 0.130
(15.27) ***
0.143
(9.96) ***
0.082
(7.86) ***
Post_Inspect -0.010
(3.73) ***
-0.007
(1.73) *
-0.013
(3.71) ***
Size -0.005
(9.14) ***
-0.006
(6.13) ***
-0.003
(5.75) ***
Leverage -0.021
(2.81) ***
-0.009
(0.79)
-0.018
(2.12) **
Perform 0.0009
(0.80)
0.000
(0.35)
0.178
(5.13) ***
Growth 0.000
(0.29)
0.010
(1.88) *
0.000
(0.06)
MB 0.113
(1.42)
-0.063
(0.80)
-0.287
(3.01) ***
PPE_Growth 0.001
(5.14) ***
0.014
(2.46) **
0.001
(10.20) ***
Loss 0.008
(3.45) ***
-0.002
(0.44)
0.025
(7.83) ***
Auditor -0.001
(0.40)
0.002
(0.53)
-0.004
(1.16)
Rule of Law -0.000
(0.01)
-0.001
(0.45)
-0.000
(0.17)
Year and Industry Fixed
Effects
Yes Yes Yes
r2 4.76% 6.63% 13.98%
n 10,718 5,052 5,666
*,**
,***
Indicate statistical significance at the 0.10, 0.05, and 0.01 levels, respectively. All p-values are based on
two-tailed tests and are calculated based on robust standard errors. We use weighted regressions for equal
weighting of observations by country.
Variables are as defined in Table 2.
37
TABLE 5
IFIAR membership and Audit Quality
Column A Column B Column C
Variables Absolute value of
abnormal total accruals
Income-increasing
abnormal total
accruals in
absolute value
Income-decreasing
abnormal total
accruals in
absolute value
Coefficient
(t-value)
Coefficient
(t-value)
Coefficient
(t-value)
Intercept 0.134
(24.51)***
0.142
(15.46)***
0.119
(18.18) ***
IFIAR -0.006
(3.61) ***
-0.003
(1.07)
-0.009
(4.61) ***
Size -0.005
(13.04) ***
-0.005
(9.59) ***
-0.004
(8.54) ***
Leverage -0.021
(3.13) ***
-0.016
(1.46)
-0.028
(3.25) ***
Perform 0.101
(8.56) ***
0.104
(5.77)***
0.105
(5.66) ***
Growth 0.014
(4.06) ***
0.018
(3.21) ***
0.006
(2.16) **
MB -0.003
(1.60)
-0.005
(1.96) **
0.010
(0.40)
PPE_GROWTH 0.002
(3.13) ***
0.004
(1.35)
0.002
(5.39) ***
Loss 0.012
(7.68) ***
0.003
(1.11)
0.020
(10.05) ***
Auditor -0.005
(2.77) ***
-0.005
(1.75)*
-0.004
(2.05) **
Rule of Law -0.006
(5.52) ***
-0.006
(3.37) ***
-0.005
(4.54) ***
Year and Industry Fixed
Effects
Yes Yes Yes
r2 8.80% 9.97% 9.90%
n 31,833 15,618 16,215
*,**
,***
Indicate statistical significance at the 0.10, 0.05, and 0.01 levels, respectively. All p-values are based on
two-tailed tests and are calculated based on robust standard errors. We use weighted regressions for equal
weighting of observations by country.
Variables are as defined in Table 2.