august 2012 reuben ternes, oira. presentation in 6 parts introduction to oira part i: ftiac growth...
TRANSCRIPT

ESSENTIAL DATA FOR ADMISSIONS
ADVISERS
August 2012
Reuben Ternes, OIRA
Presentation in 6 Parts
Introduction to OIRA
Part I: FTIAC Growth
Part II: Recruitment Data
Part III: The Importance of Transfer Students
Part IV: Comparing OU to National Data
Part V: Academic Success Indicators
OVERVIEW

• Tracks and projects enrollment• Reports to federal agencies (IPEDS)• Official record keeper for large amounts of university data• Analyzes policy decisions• (i.e. Is it a good policy to encourage students to take 16
credits their first semester, regardless of their ACT score? What will happen to our retention rates if we change our admission requirements?)
• Reports graduation rates, retention rates, etc.• Gathers and reports on various student surveys.• …and much much more…
WHAT DOES OIRA DO?

www.oakland.edu/OIRA
Lots of potentially useful info on the website:
• New student profiles
• Enrollment data, current and historical
• Ad hoc reports
• Retention and Graduation Rate Data
• NSSE Data
• Assessment data and links
• PowerPoint Presentations (including this one)
OIRA WEBSITE

Part I
FTIAC GROWTH

1998
1999
2000
2001
2002
2003
2004
2005
2006
2007
2008
2009
2010
2011
2012
0
500
1000
1500
2000
2500
3000
1530
1813188819051868
210120532213228723402350
2466231123612430
FTIACs
HISTORICAL FTIACS NUMBERS 1998 - 2012
?

CHALLENGES TO FTIAC GROWTH
2006
2008
2010
2012
2014
2016
2018
2020
1500
1700
1900
2100
2300
2500
2700
Projected New Undergraduate (FTIACs) by Year
Goal Pace (25,000 by 2020)
Current OIRA Projections
We are here.

There are two major obstacles responsible for the gap between the 2020 goal and the steady state projections
1). High School Demographics
2). Current Market Share
UNDERSTANDING THE PROJECTIONS

20092010201120122013201420152016201720182019202020210
20000
40000
60000
80000
100000
120000
140000
NCES Projections of Michigan High School Graduates

• NCES has revised their projection downward from last year’s projection.
• (This means they expect even fewer students to graduate from MI high schools in the next few years)
NCES NOTES

County of Origin % of 2011 FTIAC Cohort
Oakland 42.5%
Macomb 30.4%
Wayne 10.4%
Genesee 2.9%
Lapeer 2.1%
St. Clair 2.0%
Every Where Else 9.7%
2011 OU-FTIACS BY COUNTY

MARKET SHARE, 2011 VS. 2006
Market Share of FTIACs
County 2011 2006
Oakland 15.5% 15.4%
Macomb 23.5% 25.1%
Wayne 4.0% 3.7%

Bad News for FTIAC Enrollment
• High school graduates are down
• We will need to do more with less
• Over 80% of our FTIACs come from only 3 counties
• Our market share in other counties is low and/or non-existent.
The Good News for FTIAC Enrollment
• The decline in projected high school students is slightly less severe in Oakland and Macomb counties (at least for the next few
years).
• These are the counties where we have the highest market share.
FTIAC GROWTH: GOOD AND BAD NEWS

Part II
RECRUITMENT DATA

HIGH SCHOOLS WITH MOST ENROLLED
FTIACS
Top 22 Feeder High Schools for Fall 2011
Rank Name Enrolled
Rank Name Enrolled
1 Eisenhower 79 12 Utica 41
2 Adlai E Stevenson 75 13 Waterford Mott 39
3 Lake Orion Community 67 14 Rochester Adams 37
4 Romeo 58 15 Warren Mott 33
5 Stony Creek 57 16 Holly 31
6 Rochester 55 17 Anchor Bay 28
7 Athens 54 18 Avondale Senior 27
8Clarkston
Senior 51 19 Brandon 27
9 Troy 50 20Walled Lake
Central 25
10 Henry Ford II 47 21 Paul K Cousino 24
11Chippewa
Valley 41 22 Pontiac 23

Yield: the probability that an applicant will enroll.
Many variables are correlated with yield
HS GPA
ACT scores
Plus many others.
The relationship between HS GPA and yield follows a non-obvious (and non-linear) pattern.
YIELD BY HS GPA

YIELD BY HS GPA FOR FALL 2010

• ACT scores follow a similar pattern• Predicting who will attend is not straightforward• Because of this, OIRA used a technique known as Random Forest to predict who might attend and who
might not.• It works a lot like Netflix.
• It does not work like Pandora! (Pandora has a terrible algorithm).
• Takes into account over 50 different variables!• Like Application date, event registration, time between
application and decision, scholarship offers, family income, HS rank and size, ACT scores, etc. etc.
YIELD, CONTINUED

• Accuracy = 75%• So, it’s pretty good.
• But it still gets a lot of predictions wrong. It’s not perfect!
• RF is another tool in the toolbox. • It’s useful, but it won’t do our jobs for us.
RANDOM FOREST: WHAT YOU NEED TO KNOW

Part III
SWITCHING FOCUS: THE ROLE OF THE TRANSFER
STUDENT

New students = FTIACs + New Transfers
2361 new FTIACs in 2011
1891 new transfer students in 2011
This Year:
FTIACs up 3%
Transfers up 3%
Official count is not until the end of September, so these numbers may fluctuate.
About half of our seniors are transfers.
(Which suggests that about half of our degree recipients are too)
PART III: TRANSFER DATA

WHERE DO OUR TRANSFER STUDENTS COME FROM?
Campus Name FA11 New X-fers
Macomb Cmty Coll Center Campus
326
OCC – Auburn Hills 193OCC 123
OCC – Highland Lakes 76MCC – South Campus 70
Wayne State University 52OCC – Royal Oak 49
OCC – Orchard Ridge 46Central Michigan University 40Western Michigan University 31
Schoolcraft College 32Michigan State University 31
GVSU 30

Approximately 75% come from 2-year colleges while 25% come from 4-year institutions.
Almost 50% were 21 or younger.
About 25% are 25 or older.
72% were full-time.
70% had a GPA of a 2.5 or higher from their former institution.
Half had a GPA of 2.9 or higher.
NEW TRANSFER STUDENT PROFILE (FALL 2011)

Part IV
SIMILARITIES AND DIFFERENCES: COMPARING
OU TO NATIONAL DATA
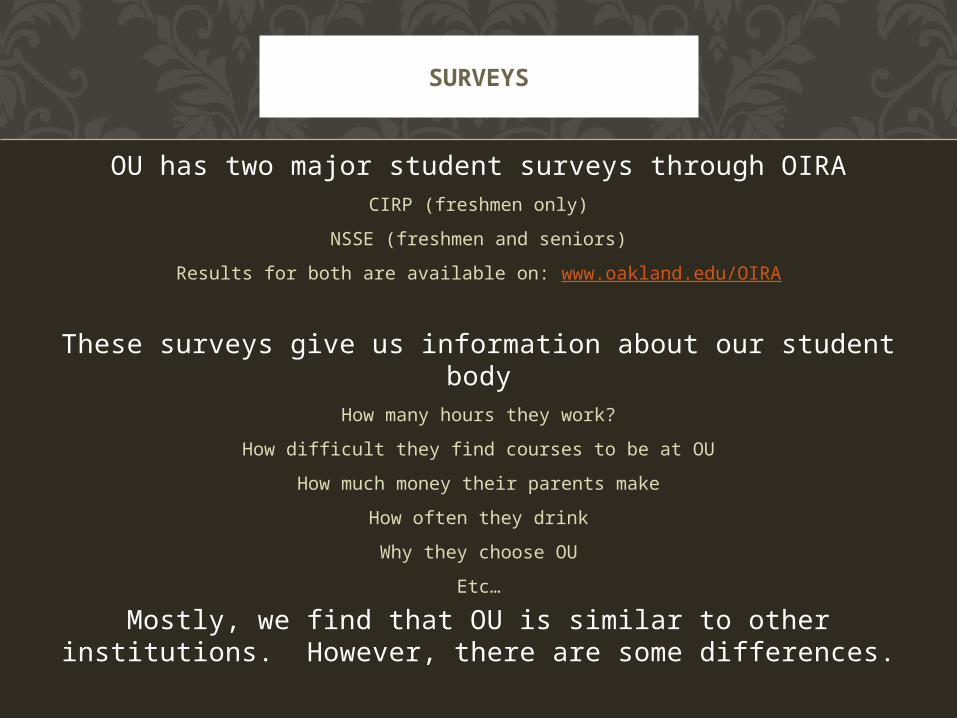
OU has two major student surveys through OIRACIRP (freshmen only)
NSSE (freshmen and seniors)
Results for both are available on: www.oakland.edu/OIRA
These surveys give us information about our student body
How many hours they work?
How difficult they find courses to be at OU
How much money their parents make
How often they drink
Why they choose OU
Etc…
Mostly, we find that OU is similar to other institutions. However, there are some differences.
SURVEYS

1996
1998
2000
2002
2004
2006
2009
2011
0
10
20
30
40
50
60
70
Good academic rep-utationWanted to live near homeCostOffered financial assistanceGraduates get good jobs
VERY IMPORTANT REASONS TO SELECT
OU

1995
1996
1997
1998
1999
2000
2001
2002
2003
2004
2005
2006
2007
2009
2010
2011
0.0%
5.0%
10.0%
15.0%
20.0%
25.0%
30.0%
35.0%
OUComparison
THE IMPORTANCE OF KEEPING UP TO DATE WITH POLITICS

1993
1996
1998
2000
2002
2004
2006
2009
0.0
10.0
20.0
30.0
40.0
50.0
60.0
OUComparison
Perc
en
tag
e P
oin
tsMARIJUANA SHOULD BE
LEGALIZED

1995
1997
1999
2001
2003
2005
2009
2011
0.0
10.0
20.0
30.0
40.0
50.0
60.0
OUComparison
DRANK BEER DURING HIGH SCHOOL YEAR

Class OaklandSelected
Peers
First-Year
25% 16%
Seniors 58% 45%
MORE THAN 15 HOURS PER WEEK WORKING OFF CAMPUS

2003 2005 2007 2009 20112.9
2.95
3
3.05
3.1
3.15
3.2
3.25
OUPeer
“THE ENVIRONMENT EMPHASIZES SPENDING SIGNIFICANT AMOUNTS
OF TIME ON ACADEMIC WORK”
Average NSSE Response (Freshmen)
“Quite a Bit”
“Very Much” (4.0)
“Some” (2.0)

TIME SPENT ON ACADEMIC WORK
11-15 HoursPer Week
6-10 Hours Per Week (3.0)
2007 2009 20113.3
3.4
3.5
3.6
3.7
3.8
3.9
4
4.1
OUPeer

Part V
ACADEMIC SUCCESS INDICATORS
2003 2004 2005 2006 2007 2008 2009 2010 20115
8
11
14
17
20
23
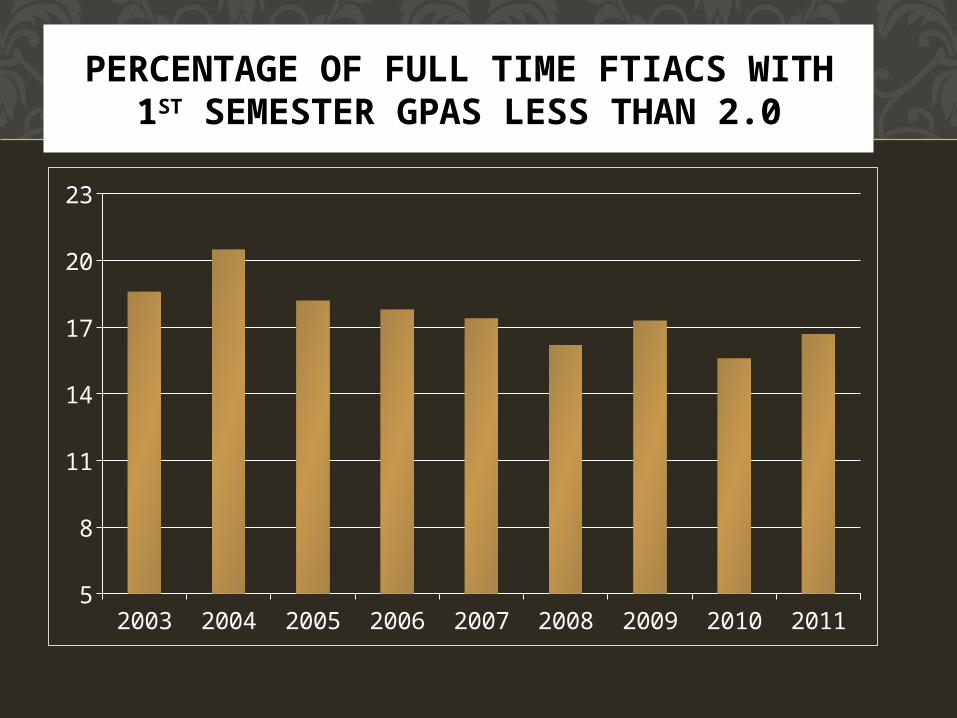
PERCENTAGE OF FULL TIME FTIACS WITH 1ST SEMESTER GPAS LESS THAN 2.0

1992
1994
1996
1998
2000
2002
2004
2006
2008
2010
50%
55%
60%
65%
70%
75%
80%
85%
90%
FT-FTIAC RETENTION TO SECOND YEAR

6-YEAR GRADUATION RATE BY ACT SCORE

6 YEAR GRADUATION RATE BY HS GPA

FIRST YEAR RETENTION RATE BY ACT SCORE

FIRST YEAR RETENTION BY HS GPA

What questions do you have for me?
What questions do you have for OIRA?
What data do you use on a regular basis?
What information do you need?
What tools do you need to turn your data into information?
QUESTIONS