august 2017 immigration trends and the immigration … total foreign-born population living in the...
TRANSCRIPT

August 2017
Immigration Trends and By: Theresa Cardinal Brown and Jeff Mason
Over the past 20 years, the flow and demographic profile of immigrants entering the United States has changed dramatically. Despite new trends and characteristics, much of the debate on immigration—both in the public and among many policymakers—remains outdated and often stuck on the issues and conditions of the 1990s, not 2017. Much of the public believes that illegal immigration continues at high rates and mostly through the southwest border, that most new immigrants come from Mexico, and that immigrants are mostly uneducated. Each of these may have been closer to the truth in the 1990s, but recent trends are decidedly different. Proposals like the construction of a physical border wall are reflective of an outdated understanding of immigration flows, in which most unauthorized immigration flows across the border from Mexico. Yet border crossings are at their lowest levels in decades, and current research estimates more unauthorized immigration is caused by visa overstays than illegal entry. This issue brief will explore the changes over the last 25 years in key demographic categories of immigration, along with trends in unauthorized immigration and border activity, and how they compare with the current immigration debate.
the Immigration Debate

1 bipartisanpolicy.org
Total Immigrant Population
One reason the immigration debate is so heated today is the large size of the immigrant population residing in the United States. The total foreign-born population living in the United States has increased by over 70 percent since 1997, rising from 25.3 million to 43.4 million in 2017 (Figure 1). In 1997, the 25.3 million foreign-born residents made up 9.5 percent of the total U.S. population. Today, the foreign-born population is 1.5 times higher by percentage, at 13.6 percent of the total U.S. population.1
Naturalized Noncitizen Total Share of Labor Force
0
10,000,000
20,000,000
30,000,000
40,000,000
50,000,000
2017
2016
2015
2014
2013
2012
2011
2010
2009
2008
2007
2006
2005
2004
2003
2002
2001
2000
1999
1998
1997
5,000,000
15,000,000
25,000,000
35,000,000
45,000,000
10%
11%
12%
13%
14%
15%
16%
17%
18%
Figure 1. Foreign-born population by citizenship status and share of labor force FY1997 – FY20172
Source: Current Population Survey
The foreign-born have also come to account for a much larger share of the American labor force. In 1997, 11.3 percent of the labor force comprised foreign-born individuals. Now, 17.3 percent of the U.S. labor force is made up of the foreign-born (Figure 1).
While the larger number of foreign residents in the country continues to be a central focus of the immigration debate, it obfuscates many other facts about this population that are important, some of which are explored below.
Regions of Origin
One of the most significant changes in the last 20 years is where the foreign-born population has come from (Figure 2). The European share of the foreign-born population has declined substantially since 1997, falling from 17 percent in 1997 to just 10.3 percent in 2017. Asians and Central Americans have become larger shares of the foreign-born population. In 1997, Asians accounted for 26.1 percent of the foreign-born population and Central Americans accounted for 6.3 percent.

2bipartisanpolicy.org
Today, those figures are 30 and 8.1 percent, respectively. South America’s share has increased as well, rising from 5.9 percent to 7.3 percent. And, although the immigration debate is often seen as synonymous with Mexico, the Mexican share of the foreign-born population has not seen much growth, holding at 27 to 29 percent over the past 20 years. In addition, because of declining rates of new immigration from Mexico and increases in Asian migration (more about that below), today there are more Asians than Mexicans living in the United States.
“
In addition, because of declining rates of new immigration from Mexico and increases in Asian
migration, today there are more Asians than Mexicans living in the United States.
”
1997 2017
0%
5%
10%
15%
20%
25%
30%
35%
Mexico Africa South AmericaCentral AmericaAsiaCaribeanEurope
Figure 2. Percentage of Foreign-Born Population by Region of Origin, 1997 and 20173
Source: Current Population Survey
Educational Attainment
The foreign-born population is now better educated than ever before (Figure 3). The share of foreign-born individuals over age 15 with less than a ninth-grade education has declined by nearly 40 percent since 1997 to 14.4 percent. By comparison, the share of native-born individuals with less than a ninth-grade education has fallen from 5.9 percent in 1997 to 2.3 percent today. The number of foreign-born high school dropouts has also fallen, from 14.7 percent to 11.9 percent. At the same time, the share of immigrants with a high school diploma has ticked up from 23.7 percent to 25.4 percent. Meanwhile, the foreign-born population has made significant gains with respect to higher education. While the share of those with some college experience has fallen slightly from 12.9 percent to 11.2 percent, every other category of higher-educational degrees has gone up. The

3 bipartisanpolicy.org
percent of the foreign-born population with a bachelor’s degree has risen from 13 percent to 18.1 percent. The share of the foreign-born population holding a postgraduate degree has risen by nearly 70 percent, from 7.6 percent in 1997 to 12.8 percent. Currently, almost half of all immigrants in the United States have more than a high school education. A recent Migration Policy Institute study found that between 2011 and 2015, nearly half of all new immigrants were college graduates.4 According to the study, only 27 percent of new immigrants were college graduates between 1986 and 1990. This trend of new immigrant arrivals continuing to be better educated plays a large role in explaining the better educational attainment of the entire foreign-born population. Well-educated immigrants have been vital in filling needed skills in the economy, and they make significant contributions to innovation.5 However, these trends contradict the persistent and inaccurate public rhetoric about “unskilled” immigration to the United States.
Postgraduate degree Bachelor’s degree Associates degree Some college
High school diploma No high school diploma Less than 9th grade
Figure 3. Foreign-Born Population by Educational Attainment, 1997 and 20176
Source: Current Population Survey
20171997
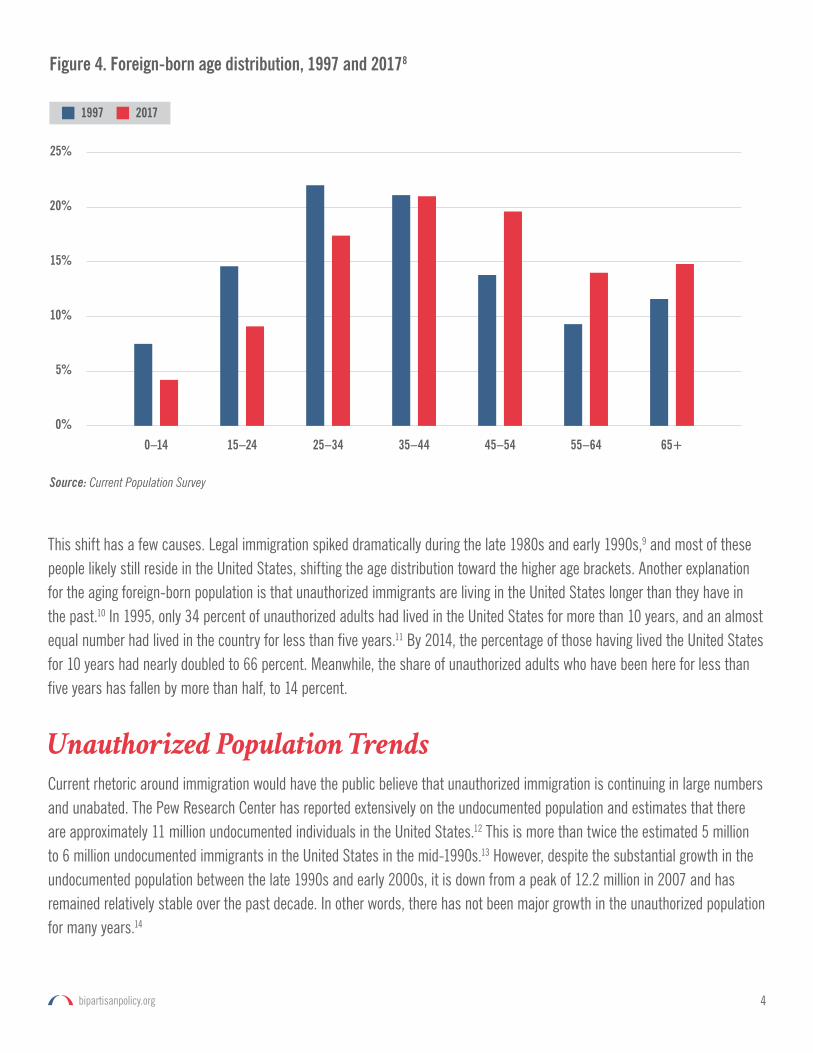
Age and Length of Residence
The average age of foreign-born immigrants in the United States is much older than it was in the past, and most of these immigrants have resided in the country a lot longer than in the past. The share of the foreign-born population under age 34 has declined by over 30 percent since 1997. The share of those between 35 and 44 years old has held basically constant, but those who are over 45 now represent nearly 40 percent more of the foreign-born population than they did in 1997. Those aged 55 to 64 increased even more—over 50 percent from 1997 levels.7
4bipartisanpolicy.org
This shift has a few causes. Legal immigration spiked dramatically during the late 1980s and early 1990s,9 and most of these people likely still reside in the United States, shifting the age distribution toward the higher age brackets. Another explanation for the aging foreign-born population is that unauthorized immigrants are living in the United States longer than they have in the past.10 In 1995, only 34 percent of unauthorized adults had lived in the United States for more than 10 years, and an almost equal number had lived in the country for less than five years.11 By 2014, the percentage of those having lived the United States for 10 years had nearly doubled to 66 percent. Meanwhile, the share of unauthorized adults who have been here for less than five years has fallen by more than half, to 14 percent.
Unauthorized Population Trends
Current rhetoric around immigration would have the public believe that unauthorized immigration is continuing in large numbers and unabated. The Pew Research Center has reported extensively on the undocumented population and estimates that there are approximately 11 million undocumented individuals in the United States.12 This is more than twice the estimated 5 million to 6 million undocumented immigrants in the United States in the mid-1990s.13 However, despite the substantial growth in the undocumented population between the late 1990s and early 2000s, it is down from a peak of 12.2 million in 2007 and has remained relatively stable over the past decade. In other words, there has not been major growth in the unauthorized population for many years.14
1997 2017
0%
5%
10%
15%
20%
25%
65+55–6445–5435–4425–3415–240–14
Figure 4. Foreign-born age distribution, 1997 and 20178
Source: Current Population Survey
5 bipartisanpolicy.org
“
Despite substantial growth between the late 1990s and early 2000s, the undocumented population has
remained relatively stable over the past decade.
”In addition, Mexicans are a smaller percentage of the overall U.S. population than they have been for many years. Central Americans and Asians have increasingly been a larger share of the undocumented population, while the Mexican share has steadily declined since 2009. The “Northern Triangle” countries—Honduras, Guatemala, and El Salvador—have all consistently increased as shares of the undocumented U.S. population. El Salvador’s growth began to take off rapidly in the mid-1990s and now is rising at more gradual rate. Guatemala saw a rapid increase in the early 2000s and now resembles El Salvador’s growth. Honduras has grown more gradually over this time. Meanwhile, India has driven the growth in the Asian undocumented U.S. population, as the levels from countries like China and Korea have largely remained constant for the past 15 to 20 years.15
Border Trends
Demographics are not the only facet of immigration that has changed since the late 1990s. The ways immigrants arrive has also evolved. In fiscal year (FY) 1997, for example, over 1.4 million migrants were apprehended while attempting illegal entry at U.S. borders (Figure 5). FY1997 was the sixth-busiest year ever for border apprehensions. Border apprehensions of more than 1 million per fiscal year were standard from the mid-1980s through the mid-2000s. Since then, however, apprehensions have precipitously declined to between 300,000 and 500,000 per year. During FY2016, 415,816 apprehensions were made. The drop in border apprehensions can be attributed to several factors, including increased border security, more Mexicans using legal visas (evidenced in the growth of H-2A and H-2B visas during the same period), and the growth in visa overstays as a source of unauthorized immigration (Figure 5). According to some analysts, the government’s emphasis on a “deterrence through enforcement” strategy, which applies more serious consequences for unlawful border crossing, has been a key factor in the declining level of apprehensions over the past decade.16 The growth in Mexicans’ usage of legal visas, coupled with a major decline in Mexican illegal immigration, has changed things dramatically at the border compared with the mid 1990s.17 Today, more Central American migrants are apprehended at the border than Mexican migrants. In addition, the Center for Migration Studies estimates that since 2007, annual visa overstays have outnumbered unlawful border crossings for those joining the ranks of the unauthorized.18 The growth of visa overstays as a source of unauthorized migration, combined with the decline in unauthorized border crossings, calls into question continued emphasis on stronger enforcement at the U.S.-Mexico border in response to the current immigration trends.

6bipartisanpolicy.org
Conclusion
“
Immigration in the 1990s and immigration today are wildly different. Understanding the differences is
essential to improving the public debate on immigration policy.
”As this issue brief has highlighted, immigration in the 1990s and immigration today are wildly different. Illegal-immigration levels have fallen substantially and now are predominantly visa overstays, not southwest border crossings. Mexico was once the dominant source of immigration to the United States but has since been overtaken by Asia. Mexico as source of illegal immigration has declined as the Northern Triangle countries grow in importance. Today, the immigrant population is far better educated than it was during the 1990s, as more people arrive with high school diplomas and college degrees, enabling them to fill vital jobs in the U.S. economy. These trends run contrary to what much of the public and many policymakers believe about immigration. This divergence has a harmful effect on discourse about immigration and manifests itself in outdated policy proposals like the southwest border wall. Understanding that immigration in 2017 does not mirror immigration in 1997 is essential to improving the public debates on immigration policy.
Apprehensions (left axis) H Visas Issued (right axis)
0
200,000
400,000
600,000
80,0000
1,000,000
1,200,000
1,400,000
1,600,000
1,800,000
2016
2015
2014
2013
2012
2011
2010
2009
2008
2007
2006
2005
2004
2003
2002
2001
2000
1999
1998
1997
1996
1995
1994
1993
1992
1991
1990
Figure 5. Total border apprehensions, FY1990 – FY2016, H Visas Issued to Mexican Nationals, FY1998 – FY201619
Source: U.S. Customs and Border Protection, U.S. Department of State
0
20,000
40,000
60,000
80,000
100,000
120,000
140,000
160,000
180,000
200,000

7 bipartisanpolicy.org
Endnotes
1 Data compiled from 1997-2017 January Community Population Survey. U.S. Census Bureau. Available at DataFerrett: https://dataferrett.census.gov/.
2 Ibid.
3 Ibid.
4 Jeanne Batalova and Michael Fix. “New Brain Gain: Rising Human Capital among Recent Immigrants to the United States.” Migration Policy Institute. 2017. Available at: http://www.migrationpolicy.org/research/new-brain-gain-rising-human-capital-among-recent-immigrants-united-states.
5 Neil G. Ruiz, Jill H. Wilson, and Shayamali Choudhury. “The Search for Skills: Demand for H-1B Immigrant Workers in U.S. Metropolitan Areas.” Brookings Institution. 2012. Available at: https://www.brookings.edu/wp-content/uploads/2016/06/18-h1b-visas-labor-immigration.pdf.
6 Data compiled from 1997-2017 January Community Population Survey. U.S. Census Bureau. Available at DataFerrett: https://dataferrett.census.gov/.
7 Migration Policy Institute tabulation of data from U.S. Census Bureau: 2015 American Community Survey and 1970, 1980, 1990, and 2000 Decennial Census. Available at: http://www.migrationpolicy.org/programs/data-hub/charts/age-sex-pyramids-immigrant-and-native-born-population-over-time?width=900&height=850&iframe=true.
8 Data compiled from 1997-2017 January Community Population Survey. U.S. Census Bureau. Available at DataFerrett: https://dataferrett.census.gov/.
9 Migration Policy Institute tabulations of the U.S. Department of Homeland Security’s Office of Immigration Statistics: Yearbook of Immigration Statistics. Available at: http://www.migrationpolicy.org/programs/data-hub/charts/Annual-Number-of-US-Legal-Permanent-Residents.
10 Jeffrey S. Passel and D’Vera Cohn. “Overall Number of U.S. Unauthorized Immigrants Holds Steady Since 2009.” Pew Research Center. 2016. Available at: http://www.pewhispanic.org/2016/09/20/overall-number-of-u-s-unauthorized-immigrants-holds-steady-since-2009/.
11 Jens Manuel Krogstad, Jeffrey S. Passel, and D’Vera Cohn. “5 facts about illegal immigration in the U.S.” Pew Research Center. 2017. Available at: http://www.pewresearch.org/fact-tank/2017/04/27/5-facts-about-illegal-immigration-in-the-u-s/.
12 Ibid.
13 Office of Policy and Planning. “Estimates of the Unauthorized Immigrant Population Residing in the United States: 1990 to 2000.” U.S. Immigration and Naturalization Service. Available at: https://www.dhs.gov/xlibrary/assets/statistics/publications/Ill _ Report _ 1211.pdf.
14 Jeffrey S. Passel and D’Vera Cohn. “As Mexican share declined, U.S. unauthorized immigrant population fell in 2015 below recession level.” Pew Research Center. 2017. Available at: http://www.pewresearch.org/fact-tank/2017/04/25/as-mexican-share-declined-u-s-unauthorized-immigrant-population-fell-in-2015-below-recession-level/.
15 Pew Research Center estimates for 2005-2014 based on augmented American Community Survey data from Integrated Public Use Microdata Series; for 1995 and 2000 based on March supplements to Current Population Survey. Available at: http://www.pewhispanic.org/interactives/unauthorized-trends/.
16 Edward Alden. “Is Border Enforcement Effective? What We Know and What It Means.” Journal on Migration and Human Security. 2017. Available at: http://cmsny.org/publications/jmhs-is-border-enforcement-effective/.
17 Alex Nowrasteh. “The Choice: Legal Immigrants or Illegal Immigrants.” Cato Institute. 2016. Available at: https://www.cato.org/blog/choice-legal-immigrants-or-illegal-immigrants.
18 Robert Warren and Donald Kerwin. “The 2,000 Mile Wall in Search of a Purpose: Since 2007 Visa Overstays have Outnumbered Undocumented Border Crossers by a Half Million.” Center for Migration Studies of New York. 2017. Available at: http://cmsny.org/publications/jmhs-visa-overstays-border-wall/.
19 U.S. Border Patrol. “Nationwide Illegal Alien Apprehensions Fiscal Years 1925-2016.” Available at: https://www.cbp.gov/sites/default/files/assets/documents/2016-Oct/BP%20Total%20Apps%20FY1925-FY2016.pdf. U.S. Department of State. “Report of the Visa Office.” Data compiled from 2000-2016 reports. Available at: https://travel.state.gov/content/visas/en/law-and-policy/statistics.html. U.S. Department of Homeland Security. “Yearbook of Immigration Statistics, FY1997-FY1999.” Available at: https://www.dhs.gov/immigration-statistics/yearbook/1996 _ 1999.

8bipartisanpolicy.org
Notes

9 bipartisanpolicy.org
Notes
BPC Policy Areas
Economy
Energy
Finance
Governance
Health
Housing
Immigration
Infrastructure
National Security
@BPC_Bipartisan facebook.com/BipartisanPolicyCenter instagram.com/BPC_Bipartisan flickr.com/BPC_Bipartisan
2017 marks the Bipartisan Policy Center’s 10th anniversary. For a decade, BPC hasworkedtofindactionablesolutionstoAmerica’smajorpolicychallenges.
Celebrating ten years of productive partisanship.
TheBipartisanPolicyCenterisanon-profitorganizationthatcombinesthebestideas
from both parties to promote health, security, and opportunity for all Americans. BPC
drives principled and politically viable policy solutions through the power of rigorous
analysis, painstaking negotiation, and aggressive advocacy.
bipartisanpolicy.org | 202-204-2400 1225 Eye Street NW, Suite 1000 | Washington, D.C. 20005

1225 Eye Street NW, Suite 1000 | Washington, D.C. 20005
202-204-2400 | bipartisanpolicy.org