august 28, 1992 dtic
TRANSCRIPT

Naval Research LaboratoryNashington, DC 20375-5320
NRL/MR/4790-92-6996
AD-A255 545
Numerical Modelling of Intense Electron Beam Transportin the Spiral Line Induction Accelerator
J. KRALL, S. SLINKER, M. LAMPE AND G. JOYCE
Beam Physics BranchPlasma Physics Division
August 28, 1992
_pw DTIC
U)lz E. i G1tI
92 9 U49
Approved for public release, distribution unlimited

/-ormn Approved,
REPORT DOCUMENTATION PAGE OMB No 0o704-0a8P u b lih c e po l n g b iu rd e n fo r t h is C o lleci lo n o f in f om a tio n is e st i ma t e d to a ve ra ge I h o u r p e rN r e s po n s0. i n cl u dn g t h e tim e f o r r e v ie w in g htn f u c'l lo n m s e a rch in g e mis t n d a t a so u r c es
gatherinq and maintaining the data neehed, and ComPeting rnd revieming the colliection of intormation Send comminents regarding this burden estimate or any other aspect of thiscolletionn of informatiOn. including sugqestorn fOr reducIn this burden to Washington Headnuarlers Services. Directorate for information Operations and Reports. 1215 JeffersonDavis Highway. Suite 1204. Arlington. VA 22202-4302. and to the Office of Management and Budget. Paperwork Reduction Project (0704-0188). Washington. DC 20503
1. AGENCY USE ONLY (Leave blank) 2. REPORT DATE 3. REPORT TYPE AND DATES COVERED
I August 28, 1992 Interim4. TITLE AND SUBTITLE S. FUNDING NUMBERS
Numerical Modelling of Intense Electron Beam Transport inthe Spiral Line Induction Accelerator
6. AUTHOR(S) ARPA Order #7781
J. Krall, S. Slinker, M. Lampe and G. Joyce
7. PERFORMING ORGANIZATION NAME(S) AND ADDRESSEES) 8. PERFORMING ORGANIZATIONREPORT NUMBER
Naval Research Laboratory NRL/MR/4790-92-6996Washington, DC 20375-5320
9. SPONSORING/MONITORING AGENCY NAME(S) AND ADDRESS(ES) 10. SPONSORING/MONITORINGAGENCY REPORT NUMBER
DARPA NSWCArlington, VA 22203 Silver Spring, MD 20903-5000
11. SUPPLEMENTARY NOTES
12a. DISTRIBUTION / AVAILABILITY STATEMENT 12b. DISTRIBUTION CODE
Approved for public release: distribution unlimited.
13. ABSTRACT (Maximum 200 words)
Computer simulation is used to study issues of intense electron beam transport arising in the context of thespiral line induction accelerator (SLIA), a device in which the beam is transported along an open-ended beampipe. making multiple passes through each accelerating cavity and traversing a 1800 achromatic bend betweenpasses. In the straight sections. the beam is transported on a solenoidal field: in the bends, the beam is subjectto a vertical bending field and strong focusing stellarator fields, in addition to the solenoidal field. We showthat the self-fields of the beam change the optimum vertical field in the bend but do not significantly affect theachromaticitv of the bend. We find that magnetic matching elements are required, at the entrance and exit ofeach stellarator section. to minimize oscillations of the beam envelope and concomitant emittance growth. Weshoss that matching can be accomplished satisfactorily with a single thick quadrupole lens. We determine thetrequenc\ and damping rate of envelope oscillations that result from mismatches, and resulting emittanceOrowth. These arc found to be sensitive functions of the beam radial profile. Simulation results are found to bein excellent agreement with experiments conducted recently at Pulse Sciences. Inc.
14 SUBJECT TERMS 15. NUMBER OF PAGES
Intense beam Induction accelerator 63
Emittance growth 16. PRICE CODE
17, SECURITY CLASSIFICATION 18. SECURITY CLASSIFICATION 19. SECURITY CLASSIFICATION 20. LIMITATION OF ABSTRACTOF REPORT OF THIS PAGE OF ABSTRACT
UNCLASSIFIED UNCLASSIFIED UNCLASSIFIED ULNSN 7540-01-280-5500 Standard Form 298 (Rev 2 89)
r,.5 ,,b,•d tib AN%, ito 13`1

CONTENTS
I. INTRODUCTION .......................................... 1.....
II. EQUILIBRIA FOR SOLENOIDAL TRANSPORT ......................... 5
II1. TRANSPORT THROUGH THE 1800 BEND ........................... 8
IV. MATCHING VIA MAGNETIC FOCUSING ELEMENTS ................ 13
V. SIMULATION OF THE 850 KeV EXPERIMENT ........................ 21
VI. CONCLUSIONS ..... ......................................... 25
ACKNOWLEDGMENTS ....................................... 28
APPENDIX: FIRST ORDER FIELD CORRECTIONS IN ACURVED GEOMETRY ..................................... 29
REFERENCES .............................................. 33
AOoession For
NI RA&IDTC TAB
Un~mz alcu rced 0]
~ 1SL.T' ~NSE(T~ 5By-_Diatribution/Availability Cods
Avail d/zDlet speolaol
III

NUMERICAL MODELLING OF INTENSE ELECTRON BEAM TRANSPORT
IN THE SPIRAL LINE INDUCTION ACCELERATOR
I. INTRODUCTION
Advanced high-current accelerator concepts, such as the heavy ion
accelerators that are being considered as inertial fusion drivers [1], or
the compact high-current electron accelerators [2] that are under
development for military and commercial applications, present unique and
challenging beam transport problems. In both cases, the beam currents are
in the multi-kiloamp regime, where space charge and self-magnetic forces
play a major role. In the heavy ion fusion accelerator, both the
longitudinal and transverse emittance are strongly constrained by the
requirement that the ion beam subsequently be focused, over a focal length
of several meters (the radius of the reaction chamber), onto a target with
a radius of order 0.2 cm. In the case of high-current electron
accelerators, there is considerable interest in generating beams of
energetic electrons in very compact devices. To minimize size, multiple-
pass designs such as the ion-focused regime recirculator[3], the modified
betatron accelerator (MBA)14] and the spiral line induction accelerator
(SLIA)[5] have been investigated. Each of these includes tightly curved
transport sections with radii of curvature of order 1 meter. This paper is
concerned specifically with the magnetic transport issues that arise in the
context of SLIA.
In the proposed design for SLIA (see Fig. 1), the beam is transported
along an open-ended beam pipe which makes multiple passes through each
accelerating cavity. The accelerating cavities are aligned along the
straight sections of the beam pipe, where the beam is transported on a
solenoidal focusing field. To bring the beam back around after each
straight section, it is taken through a 1800 achromatic bend, where a
strong focusing stellarator (helical quadrupole) field is provided, in
Manuscript approved June 25, 192.

addition to the solenoidal field and the vertical bending field. Because
the field coils are wound directly onto the spiral beam pipe, and because
each bend is magnetically shielded from its neighbors, each bend can be
individually designed to be achromatic near the expected beam energy at
that point. (A perfectly achromatic bend would be defined as one in which
each beam particle exits the bend along the trajectory, relative to the
axis, with which it entered the bend.) A schematic diagram of the proposed
SLIA proof-of-concept experiment (POCE)[5], which uses three bends and
makes two passes though each set of accelerating cores, is shown in Fig. 1.
Two key problems must be addressed in this transport scheme. The
first concerns the effect of the hoop forces which act on the beam in the
bends. These are the net electrostatic and magnetostatic forces acting on
a given beam segment, due to the remainder of the curved beam. Hoop forces
have been analyzed only for a coasting beam in a circular torus, such as
the MBA.[6] The second difficulty arises from the fact that a matched beam
in a solenoid has a circular cross-section, while a matched beam in the
combined solenoid/stellarator fields has an elliptical cross-section.[71
Thus it is necessary to use matching elements at the entrance and at the
exit of each bend, in order to avoid mismatch oscillations of the beam
cross-section which can result in emittance growth. In an higher en^rgy
SLIA design, there can be on the order of 10 passes through the
accelerating cores[2], implying 19 bends and 38 such transitions.
In this study, we focus our attention on two specific parameter
regimes of immediate interest: (1) the POCE, in which a 10 kA, 35 ns beam
is to be injected at 3.5 MeV and then accelerated tr 9.5 MeV in steps of
1.5 MeV, and (2) recent experiments[8-10] in wAich an 850 keV, 200 A
2

injector was used to study the capture of the beam onto a solenoid, and the
matching at the entrance of the stellarator field.
These studies are based on numerical simulation. Initially, the
simulations were performed using the ELBA three-dimensional particle
simulation code[ll], which solves Maxwell's equations self-consistently
with the complete relativistic beam dynamics. In the ELBA code, the beam
pipe is represented as a straight metallic cylinder, but bends are included
via a mapping scheme which was adapted from the work of Friedman[12], with
corrections to the electromagnetic fields which are valid to first order in
the small parameter rv/R. Here, rw is the beam pipe radius (3 cm in the
POCE) and R is the major radius of the bend (80 cm in the POCE). The
electromagnetic field corrections are discussed in the Appendix. The bulk
of the studies reported in this paper were done with a faster running
version of the code called SST (Single Slice Transport).[13J Here, self-
field effects due to variations in the beam density or current along the
length of the beam are neglected, so that only a single transverse slice of
the beam need be simulated. For transport in a bend, results from the two
codes for beam displacement and optimum vertical field showed agreement to
within less than 1 for POCE parameters.
The organization of the paper is as follows. In Section II, we
discuss the initial equilibrium of the intense beam in the solenoid field.
In section III, we present transport simulations for each of the three POCE
bends. The optimum vertical field is determined for each bend and compared
to the theoretical estimate of Chernin and Sprangle.16] The effect of this
correction to the vertical field on the achromatic properties of the first
bend is also assessed. In section IV, we present simulations of transport
into and out of the stellarator fields with various beam profiles for POCE
3

parameters. We show that emittance growth results from phase-mix damping
of mismatch oscillations of the beam[14-16], but can be reduced or
eliminated though the use of magnetic focusing elements. We present a
novel method of accomplishing this match via a single thick quadrupole
lens. We present end-to-end simulations of the POCE with and without
matching elements. In section V, we discuss the recent experimental
results of Refs. 8-10. Simulations with these parameters illustrate the
sensitivity of the mismatch oscillation characteristics to the radial
distribution of the beam. Our conclusions are given in section VI.
4

II. EQUILIBRIA FOR SOLENOIDAL TRANSPORT
In accelerator transport studies, it is frequently assumed that the
beam has a Kapchinskij-Vladimirskij (K-V) distribution[17] in the rotating
frame in the directions (x,y) transverse to the propagation direction (z).
The K-V distribution, which has a flat radial density profile, is an exact
equilibrium in the limit Yb 4 - and V/yb 4 0, where Yb is the relativistic
factor corresponding to the beam kinetic energy, v = Ib[kAJ/1 70b is
Budker's parameter, Ib is the beam current and Ob = (1 - 1/b/2)
However, particle simulations of the POCE beam in the 5.492 kG solenoidal
guide field show at instability if the beam is injected with a transverse
K-V distribution. The beam radius exhibits growing oscillations at the
envelope frequency which typically reach amplitudes of the order of 7 to
10% of the equilibrium radius. These are shown in Fig. 2 (solid line),
where the RMS radius rb is plotted versus transport distance z for the POCE
beam (10 kA, 4 MeV, normalized RMS emittance %n,rms = 0.158 cm-rad)
initialized with a K-V distribution. Note that in this simulation and
throughout the paper we assume that the diode is nonimmersed, so the
canonical angular momentum of the beam is zero. Eventually (over a scale
length of several meters), the oscillation amplitude saturates. The
instability is a kinetic effect which does not occur in envelope code
calculations and is not suppressed by simply initiating the beam with
carefully matched envelope parameters. It indicates that the initial
distribution is not a true equilibrium, and that the beam dynamics are
acting to rearrange the distribution to approach equilibrium. Similar
phenomena are seen if the beam is initialized in other distributions that
are not exact equilibria for finite V/Yb, e.g., a parabolic density profile
with a Gaussian velocity distribution. Although the instability is rather
5

weak, it tends to mask the features of interest. Oscillations of this type
are probably inevitable in a real beam, where one does not have perfect
control over the beam distribution.
The K-V distribution can be derived from the Vlasov equilibrium given
by f(r,p) - n0 /2ny0m 6(H-wL-yo0mc2 ) 6(P- 0 0 omc) in the limit yo 4 -. [18]
Here the energy H, the canonical angular momentum L, and the canonical
axial momentum P are constants of motion and w, Y0 , O0 and no are
parameters. We have derived an improved distribution by retaining the
first order terms in 1/y 0 , which result in corrections to the K-V including
the self-generated diamagnetic axial magnetic field and the kinetic energy
variations due to the space charge depression.f19] Although the charge
distribution is not radially flat in this approximation, it has a sharp
cutoff as does the K-V. When the POCE beam is initialized with this
higher-order K-V distribution, as in Fig. 2 (dashed line), growing
oscillations of the beam radius are not observed.
Simulations of the POCE injector[20J, as well as experimental
measurements[8-10], indicate that the beam injected into the SLIA transport
system has a rounded radial profile, and thus does not have a K-V type
distribution. In simulation studies, we have found it convenient to use a
numerical technique to initiate the beam equilibrium, rather than the
analytic expansion described in the previous paragraph. We begin the
simulation with a beam distribution that reflects the macroscopic
properties of interest (radial density profile and emittance), and with
carefully matched envelope parameters, including an ad hoc correction to
the initial particle energy as a function of radius due to the space charge
potential of the beam:
2 2 2yr Yb + •(r rb)/rb (1)
6

where y is the relativistic factor assigned to a particle at radius r and
rb is the IMS radius of the beam. We have followed this procedure for a
variety of equilibria and find that the space-charge correction reduces but
does not eliminate the unstable oscillations. The beam is then transported
numerically for several meters in the solenoid field, thus allowing the
oscillations to saturate and damp. Such equilibria were used to initiate
the simulations presented below.
7

III. TRANSPORT THROUGH THE 1800 BEND
Hoop forces occur in the bends because a given point in the curved
beam experiences a net transverse electro- and magnetostatic force due to
the remainder of the curved beam. These self-fields have been analyzed in
some detail for a beam of circular cross-section in a toroidal
configuration.[6] Assuming the beam is on axis, the optimum vertical field
is given by
My b~c2 1 inc2 .v 2 r 2
Bv eR 13b e b)ln(r) + (2)
where m is the electron mass, R is the major radius of the bend, rw is the
radius of the beam pipe, e (taken to be positive) is the elementary charge
and c is the speed of light. The parameter 6 depends on the details of the
beam equilibrium in the bend: & = 1 if -ne assumes consta.t current
density across the beam cross-section and 6 - 2 if one assumes constant
circulation frequency. The first term in Eq. (2) is the ideal value for a
low-current beam; the second is required to correct for the hoop forces.
For the POCE, in which Ib = 10 kA, R = 80 cm and rw = 3 cm, these
forces can be substantial. In the first bend, for example, the design
energy is 4 MeV and the ideal vertical field is 186.9 G. Equation (2)
gives Bv between 236.2 G (for 6=1) and 248.6 G (for 6=2). There are
additional uncertainties in these values because a) the beam cross-section
in the bend is not circular but is instead a slowly rotating ellipse and b)
the SLIA bend extends for 1800 with entrance and exit points, whereas the
published calculation applies to a full toroidal configuration.
Field parameters for the three POCE achromatic bends are given in
Table I.[21] In Table I, Bs i: the axial magnetic field at the geometric
8

axis, b is the quadrupole field gradient near the quadrupole field axis,q
and Xp is the pitch length of the quadrupole windings. The FST and ELBA
codes use the following somevwat idealized approximations for the external
fields in the bend. The axial field is given by
Bz - B sR/(R + x) . (3)
The quadrupol: fields are
B = b [y cos(k Z) - (x - X )sin(kqz)] (4a)x q q q q
B = bq[(X - xq)cos(kqz) + y sin(kqZ)] , (4b)
where k - 4n/X and x is the x-coordinate of the quadrupole field axis,q p q
which is displaced relative to the geometric axis in the bend[221:
2
Xq ,-r 1 + ) (5)
The vertical field enters as
By - -B v(1 - Ilx/R) (6a)
Bx - Bvr',/R , (6b)
where n is the vertical field index anO is responsible for weak focusing in
betatrons. In this coordinate system, the beam moves in the z direction,
and x and y are the horizontal and vertical coordinates, respectively. The
curve lies in the x-z plane with the inside wall of the curved beam pipe at
x = -rw. In Eqs. (3-6), we assume rw/R -. 1.
9

Each bend is designed to be achromatic near the expected beam energy
for that bend. In other words, if the beam is within 10-20% of the design
energy for a given bend, the beam should exit with the same position and
angle, relative to the axis, that it had when it entered. A perfectly
achromatic bend will have no effect on the beam trajectory relative to the
axis no matter what the beam energy. In practice, parameters have been
determined that are correct to first order in the small parameter AE/E
where E is the design energy for the bend and AE is the deviation of the
beam energy from the design energy.[21,23]
Simulation results for the first bend show that if B is set to thev
vaJ.ue Bv = 186.9 G which includes no hoop force corrections, the beam
centroid displacement within the bend will exceed 1 cm. This is shown in
Fig. 3 where the x and y positions of the beam centroid are plotted versus
transport distance for the first POCE bend. Here the bend entrance is
located at z - 50 cm with the exit at z - 301.3 cm. Even with this
unacceptably large displacement, the achromatic design brings the centroid
back to within 2 mm of the axis on exit. A series of runs were performed
to determine the maximum beam centroid displacement rcmax as a function of
the imposed B v. The results are shown in Fig. 4. The optimal value of
the vertical field is seen to be 233 G, for which the beam centroid remains
within 0.06 cm of the geometric axis at all times. This value of Bv is a
25% increase over the ideal value but is somewhat smaller than expected
from Eq. (2). Numerically determined optimum vertical field values for all
three bends are given in Table II. For comparison, the ideal values (no
hoop force correction) and the predicted values from Eq. (2) are also
given.
I0

With a 25% increase in the design value of the vertical field, it
might be expected that other corrections to the design parameters of the
stellarator and solenoidal fields would be necessary to preserve the
achromatic property of the bend. For instance, an achromatic design
requires that the frequencies associated with the various fields produce
integer numbers of oscillations as the beam traverses the bend. However,
Hondelli et al.[24] have shown that the vertical field correction, with an
appropriate correction to the vertical field index, simply preserves the
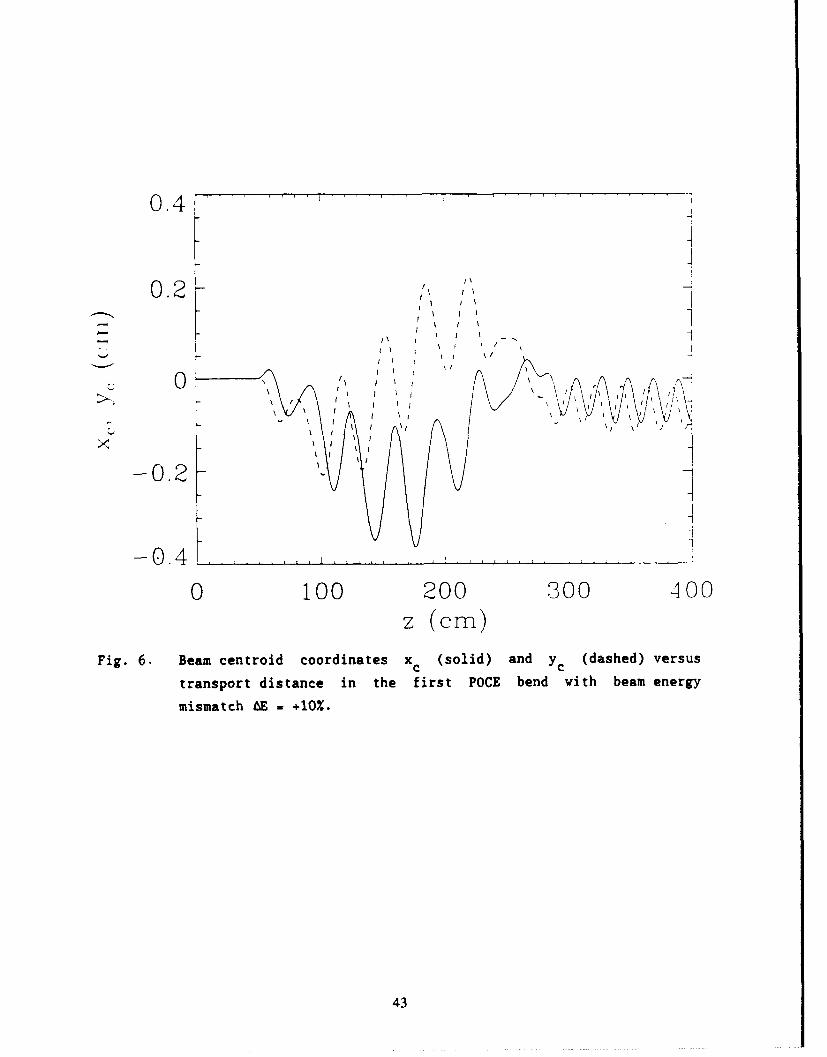
frequency that would be expected in the ideal, low-current case. Figures 5
and 6 confirm this conclusion. These figures show the centroid position
x c(z), yc (z) as the beam passes around the first POCE bend with the optimum
vertical field value given in Table I. In Fig. 5, the beam energy was
offset from the design energy by AE = -10%. In Fig. 6, 6E = +10%. In both
cases, the beam centroid returns to within 0.2 cm of the axis.
In principle, it is also necessary to correct the vertical field index
fl to account for diamagnetic effects in the intense beam, which tend to
reduce rl to less than the design value over most of the beam cross-section.
We have performed several simulations with 11 set between 0 and 1.0 (at low
current, the design value is n - 0.5). These simulations showed that the
value of the vertical field index had less than a 1% effect on the beam
centroid position, and had no effect whatsoever on transport at the design
energy or the achromatic properties of the first bend. This result might
well have been anticipated inasmuch as the strong focusing due to the
stellarator fields dominates the weak focusing arising from the betatron
field. In subsequent simulations, we simply set n = 0.5.
We also measured the sensitivity of the achromatic design to errors in
the settings of the axial and stellarator magnetic fields. In Figs. 7 and
I!

8, we show the results of setting AE - -10%, and varying Bs and b . It is
apparent that the achromatic design is tolerant to errors in the 2-3% range
and that the design values are not optimized for AE i -10%. Further runs
at AE - +10% showed similar sensitivity to field errors. The optimum
values at AE - +10% differ from those at AE = 0 or 6E i -10% but not in an
easily predictable way (i.e., corrections to the optimum fields at AE =
+10% are not simply the negatives of those at 6E = -10%). These
observations are not surprising in that the achromatic parameters are
correct only to first order in AE/E.
12

IV. MATCHING VIA MAGNETIC FOCUSING ELEMENTS
A major concern in the SLIA design is the transition at the entrance
and exit of each bend. In the straight sections, the beam is transported
on a solenoidal field in an equilibrium state with a circular cross-
section. In the bends, a strong focusing stellarator (rotating quadrupole)
field is also imposed, to improve momentum compaction. Chernin[25] has
derived an envelope equation for transport in stellarator/solenoidal fields
and has shown that matched solutions exist in which the beam cross-section
is elliptic, with constant major and minor radii and with the orientation
of the beam ellipse rotating in phase with the stellarator windings. Since
the transitions onto and off of the bends will be made more than fifty
times in a 50 to 100 MeV accelerator, it is crucial that each transition be
made smoothly and with a minimum of emittance growth.
For beams with coupled x-y motion, Chernin[25] has provided a suitable
definition of emittance which is a straight-forward generalization of the
usual emittance definition (e.g., Ref. 26). This definition is
£rms E Illl/4 (7)
where Z is a 4 by 4 matrix with elements
Eij - <uiuj> - <u i><ui> , (8)
u 1 x, u2 a dx/dz, u3 a y, u4 w dy/dz and "< >" signifies an average over
the beam particles. The emittance crms is conserved by Chernin's envelope
equation[251, which makes the usual assumption that all forces acting on
the beam are linear in the radial coordinate r. It is therefore assumed
that the beam density profile is flat-topped, which is necessary if the
13

space-charge forces are to be linear. The normalized, RMS emittance is
Cn,rms - Oyerms. In terms of the matrix elements Eij, the major radius r+
and the minor radius r of the beam cross-section are given by
1r21 2 .E + E(9)T± 11 + 1 33 ± 0(
=~ 2 )23]/2.where 0 [(' 33) + 4E 31 For a beam with circular cross-
section, r+ = r - ¶42"•rb.
Simulations show that large-amplitude envelope oscillations are
excited at the entrance and exit of the first POCE bend if no matching lens
elements are used to facilitate the transition. The characteristics of the
oscillations (wavelength, damping and emittance growth) are not determined
entirely by beam envelope parameters but are sensitive to the distribution
function of the beam.
In Fig. 9, we show r (z) for the POCE beam as it transits the first±
bend of the POCE. Four different beam profiles are simulated. In Fig.
9(a), the beam is initiated with a K-V distribution. At the entrance to
the bend (z - 50 cm), the beam transitions to an elliptic cross-section,
but overshoots the elliptic equilibrium and enters into a series of
undamped large-amplitude oscillations, which are particularly evident in
r+(z). At the exit from the bend (z = 301.3 cm), the beam transitions to
an elliptic cross-section of lower eccentricity. After a series of damped
oscillations of r ±(z), the beam approaches an elliptic equilibrium in the
solenoidal transport system, but shows no sign of damping back toward the
conventional equilibrium with circular cross-section. Little or no
emittance increase occurs, as seen in Fig. 10.
This type of behavior is characteristic of the K-V distribution.
Because the radial profiles of charge and current density are nearly flat,
14

the self-forces are nearly linear, there is very little phase-mix damping,
and Chernin's envelope equations[25] provide a nearly complete description
of the beam dynamics. The damping of the weak oscillations about an
elliptic equilibrium in the solenoid is probably associated with self-force
nonlinearities that result from the inexactness of the K-V equilibrium, as
discussed in Sec. II.
The results are markedly different if the beam profile is rounded, as
can be seen in Figs. 9(b)-9(d). In case 9(b), the beam is initiated with a
spatially parabolic profile,
nb(r.0)[1 - (r/ 2rb)2J , r < 2rb
nb(r) = (10)
0 , r > 2 rb,
where rb is the RMS beam radius. In Fig. 9(c), the beam is initiated with
a Gaussian spatial profile and, in Fig 9(d), with a truncated Bennett[271
spatial profile,
n (r=0)[1 + (r/r 2-2 , r < 3rb/ 4 Tnb(r) b (II)
0 , r > 3rb/T'
Each of our non-K-V beams have Gaussian distribution functions in velocity
space. In each of these cases, the beam becomes mismatched at the
stellarator entrance, damps toward an elliptical state in the bend, becomes
mismatched again at the exit, and finally damps toward a circular cross-
section. Each stage of damping is accompanied by emittance growth as seen
in Fig. 10. The damping would appear to be associated with phase mixing,
15

due to the nonlinear self-field forces arising from the rounded beam radial
profiles. Since rounded beam profiles are typical in the SLIA, the
pictures presented in Figs. 9(b-d) are representative of SLIA physics,
rather than the K-V case, Fig 9(a), where the oscillations are highly
coherent and undamped. We can expect considerable emittance growth in the
accelerator unless lens elements are introduced to carefully match the beam
at the entrance and exit of each bend.
Tiefenback[9] has shown that the beam envelope parameters Zij can be
matched exactly by using a compound magnetic lens consisting of three ideal
thin focusing elements (one solenoid lens and two quadrupole lenses).
Petillo et al.[21] have used an envelope code to show that this scheme can
be implemented with realistic, finite thickness lenses to obtain a useful
inexact match. We have found a novel solution to the matching problem
which employs a single thick quadrupole lens.
The key to this matching scheme is the effect of a thick quadrupole
lens on beam transport in a solenoidal field. This is illustrated in Fig.
11, where we plot the major and minor radii r ±(z) obtained from solutions
of the envelope equations with beam and solenoidal field parameters
corresponding to those of the first POCE bend. A thin quadrupole lens,
Fig. 11(a), simply induces a series of quasiperiodic quadrupole envelope
oscillations, i.e., the beam cross-section oscillates between states of
maximum elliptic eccentricity, passing through a circular cross-section in
between maxima. However, when the quadrupole lens has finite thickness L0
[defined as the full-width-at-half-maximum length of the field envelope
b0 (z)], as in Fig. 11(b), the traces of r+(z) and r_(z) separate, so that
the cross-section is non-circular at all times, but oscillates between
states of maximum and minimum elliptic eccentricity. As the thickness of
16

the lens increases further, to LQ - 5 cm in Fig. 11(c), r +(z) and r_(z)
become well separated, and oscillate separately around central values
corresponding to an elliptic equilibrium state. For a still thicker lens,
L = 10 cm in Fig. 11(d), r+(z) performs small-amplitude sinusoidal
oscillations about a well-defined equilibrium value and phase locking is
observed such that r (z) is approximately stationary at the extrema of
r+(z). The beam has been transformed from its initial circular equilibrium
to a new approximate equilibrium in which the cross-section is elliptic and
slowly rotating. The eccentricity of the ellipse is nearly constant and is
determined by the integrated strength of the lens fdz b0 (z). Recall,
however, that in the context of a more exact kinetic treatment, rather than
an envelope model, the elliptic equilibrium will eventually damp back to
circular if there is phase mixing due to a rounded beam radial profile (see
Fig. 9). The transition to an elliptic equilibrium via a single quadrupole
lens and subsequent damping toward a circular beam cross-section has been
observed both experimentally[22] and in particle simulations.
Envelope modelling and particle simulations indicate that the beam
response to a quadrupole lens is not very sensitive to the details of the
quadrupole lens axial dependence b0 (z), but rather depends primarily on the
integrated lens strength fdz bQ(z) and on the thickness L An approximate
criterion for the "thick lens" limit, as exemplified by Fig. 11(c) and to
an even greater degree by Fig. 11(d), is
L > z a 2eB (12)Q 2eB5
where Xc is the cyclotron wavelength in the solenoidal field. (For SLIA
parameters, the oscillation wavelength is not significantly increased by
17

space-charge fields.) In the first POCE bend, X = 17.2 cm, and the lens
is "thick" in Figs. 11(c) and 11(d), where L0 . 5 cm and 10 cm,
respectively.
The matching onto the stellarator equilibrium is accomplished by using
a quadrupole lens that is in the "thick lens" limit (given the beam energy
at that point in the beam line), adjusting the integrated strength of the
lens to match the eccentricity needed in the bend, adjusting the distance
between the lens and the bend such that the beam enters the stellarator
field at a stationary point of the oscillation, and adjusting the
orientation of the lens so that the angle of the ellipse is in the correct
phase as the beam enters the bend. A single quadrupole lens can also be
used at the exit of the bend to bring the beam back to a nearly circular
cross-section. In the ideal case (no envelope oscillations), the exit
quadrupole is identical to the entrance quadrupole.
It should be noted that the required minimum lens thickness LQ, such
that the lens is "thick," increases proportionally to the beam energy,
according to Eq. (12). For example, the lens of Fig. 11(c) is sufficiently
thick for the first bend of the POCE (electron energy 4 MeV), but not for
the third bend (7 MeV), as shown in Fig. 12. For practical reasons, it may
be necessary to use another matching scheme at high energy.
Although the features of the matching scheme are easily accessed and
surveyed by numerically solving the envelope equations, we have used
particle simulation to study the transport processes in full detail.
Figures 13 and 14 show the results of a simulation of transport around the
POCE first bend for a case in which the beam is initiated with a parabolic
radial profile identical to that of Fig. 9 (b). Here, a single quadrupole
lens is used to match the beam at the entrance to the bend. The lens is
18

located 25 cm from the stellarator entrance, with peak quadrupole gradient
b0 - 292 G/cm, z-dependence as plotted in Fig. 15 and lens thickness L0 =
5.5 cm. At the bend exit, we fine-tuned the match using an exit quadrupole
with b0 - 255 G/cm (this fine tuning accounts for the phase of the small
mismatch oscillation as the beam exits the stellarator). The lens profile
of Fig. 15 is taken from measurements of an actual quadrupole lens used in
SLIA experiments.[22] With this matching scheme, the radial mismatch
oscillations of Fig. 9(b) have been minimized and the 13% emittance growth
of the unmatched case has been eliminated. For comparison, Fig. 14 shows
emittance plotted versus transport distance for this case and for the
simulation of Fig. 9(b). We have obtained similar results via the three-
element match of Ref. 21.
These simulations have been extended to provide complete end-to-end
particle simulations of transport in the POCE with each of the three bends
modeled as described above. The acceleration sections are modeled by
simply imposing an axial electric field over a short section of the beam
pipe. The location of each curve and each idealized acceleration section
for the end-to-end simulations is given in Table III. Results from a
simulation without matching elements are shown in Fig. 16. The beam is
initiated with a parabolic spatial profile as in Figs. 9(b) and 13 above.
Overall, the emittance cn,rms increases by 52%. Plots of r (z) show that
the beam becomes mismatched in each bend and damps back to an approximately
circular cross-section after each bend. It is interesting to note that, by
chance, the beam exits the third bend with an approximately circular cross-
section and little subsequent emittance growth occurs. For comparison, we
repeated this simulation with the third bend terminated at z = 1250 cm, at
19

the point of maximum eccentricity of the beam cross-section. In this case
we observed an overall emittance increase of 110%.
The results of an end-to-end POCE simulation in which single-element
matching is employed on all three bends are shown in Fig. 17. Here, the
initial beam parameters are identical to those of Fig. 16. With the use of
single-element matching, however, the normalized emittance is largely
preserved, increasing by only 10%. In this simulation, quadrupole lenses
with peak quadrupole gradient b M 149 G/cm were placed 4 cm from the
entrance and 4 cm after the exit of the second bend. For the third bend,
lenses were located 6 cm from the stellarator end points with b0 - 266
G/cm. The quadrupole lens profile of Fig. 15 was used for the first bend,
as in Fig. 13, and a similarly shaped quadrupole with L = 11 cm was used
on the second and third bends.
20

V. SIMULATION OF THE 850 KeV EXPERIMENT
In preparation for the POCE, a series of preliminary transport and
matching experiments has recently been performed at PSI.[8-10] The
parameters for these experiments were chosen to replicate as closely as
possible the physics of the POCE beam at much lower current and energy.
Thus, the dimensionless ratio a = vr2/y 2 , which determines the relative
influences of the emittance and space charge forces, was chosen to be the
same for both beams. The significance of a can be noted from the envelope
equation for a beam in the presence of an axial magnetic field[28,151,
a2r 2 C2b z 2v n 0 (13)
2z-2 + 4d222 rb 2d3rb 2 2 3 =z c Tb 0 rb Oyb brb
where 9z = eB z/mc is the nonrelativistic cyclotron frequency and vn =
4c n,rms. The nominal POCE parameters are Ib a 10 kA, Yb = 8.83 (4 MeV),
Cn,rms - 0.159 cm-rad and rb - 0.5 cm, which gives a = 0.041. The low
energy experiments were done at Ib = 200 A, yb - 2.66 (850 keV), and rb =
0.25 cm. Preservation of the ratio a requires en,rms - 0.022 cm-rad (the
actual experimental value was somewhat lower, as will be discussed below).
In these experiments, the beam was transported along a 1.5 kG solenoid
field into a stellarator section with length 251.3 cm and pitch X = 68.33p
cm, identical to that of the first POCE bend. This stellarator section,
however, was straight (rather than curved) so as to facilitate diagnostics,
and the stellarator strength was reduced to b q 68.5 from the POCE valueq
of 251.6 G/cm.
In the initial experiment, the beam was transported into the
stellarator fields without matching at the stellarator entrance. The data
from this experiment, giving the beam major and minor radii r (z), are±
21

shown in Fig. 18. Each data point represents a time-integrated average
over one shot of the device, obtained by inserting a piece of film into the
beam pipe at a location that was varied from shot to shot. It should be
noted that the experimental "major and minor radii" r± (z) are determined by
fitting a constant current-density contour at approximately l0% of the peak
current density in each shot, whereas the simulation r ±(z) values are
computed via Eq. (9) and are RMS values multiplied by 1.T. The
experimental measurements extend only to z = 350 cm, 50 cm beyond the end
of the stellarator section. As a result, the damping of mismatch
oscillations at the stellarator exit, as well as thp emittance growth
associated with this damping, was not measured. The simulations extend to
z- 500 cm, enabling us to study matching phenomena at the exit as well as
the entrance of the stellarator section.
In Fig. 18, it is evident that envelope oscillations are excited at
the stellarator entrance which subsequently damp toward an elliptic
equilibrium. Emittance measurements, which tend to be problematical for a
space-charge dominated beam, were made both at the injector and at the exit
of the stellarator section. The inherent difficulties associated with this
measurement were further exacerbated at the end of the stellarator section
by the need to aperture the beam and to transport the resulting "beamlet"
into a field-free region. Because the measurement was performed within the
3 cm radius beam pipe, the drift region over which the emittance could be
measured was limited to 10 cm. In fact, a definitive measurement of the
emittance at the stellarator exit has not yet been obtained.[221
Preliminary measurements of the beam initial radial profile showed an
approximately parabolic profile with emittance En,rms = 0.008 rad-cm and
beam radius 0.25 cm.[22] In our first simulation studies, we initiated the
22

beam with a parabolic profile. One such simulation is shown in Fig. 19,
with beam parameters rb 0.2.5 cm, "n,rms = 0.011 rad-cm. The damping rate
was found to be comparable to that of the experiment, but the mismatch
oscillation frequency differs markedly (by 25%) from that seen in the
experiment. It was found to be impossible to match the experimental data
in simulations initiated with any of the usual distributions (KV,
parabolic, Gaussian, Bennett).
Since it is known[29J that core-halo radial profiles are associated
with increased phase-mix damping of radial mismatch oscillations expected
to be present in the injector[10,20], we then tried initiating the beam
with a core-helo profile in the simulations. It was found that the
simulations could provide a good match to the data. Subsequently, careful
measurements were performed which indicated that the beam had approximately
10% of its current in a diffuse halo extending to about twice the radius of
the main core, as shown in Fig. 20.
Creating a core-halo distribution for simulation purposes was
accomplished by adding a constant density spatial distribution with edge
radius 2 rb to the core parabolic distribution. The result was then
transported for 30 meters and allowed to come to equilibrium. The spatial
profile of our numerical core-halo distribution is shown in Fig. 21. Here,
we put 25% of the current into the initial flat-top halo. In the resulting
beam, particles with r > r + i 3.46 mm represented 8% of the total current.
In Fig. 21, the beam emittance is cn rms W 0.01 cm-rad. If we consider
only the particles within the r < r+ we have enrms = 0.0065 cm-rad.
Figure 22 shows the major and minor radii r (z) and the emittance
Cn,rms (z) of the core-halo simulation beam. The simulation reproduces the
23

radial oscillation frequency and the damping rate observed in the
experiments. Total emittance growth in the simulation was 29%.
Experiments were also done using the three-element match of Ref. 21.
Experimental major and minor radii, again defined in terms of the time-
averaged current-density contour at 10% of the peak current density, are
plotted versus transport distance in Fig. 23. In this case, the mismatch
oscillations are greatly reduced.
Simulation results using the core-halo distribution as in Fig. 22 are
shown in Fig. 24. Here we have used a single-element match with peak
quadrupole gradient b0 = 75 G/cm located 5 cm from the stellarator
entrance. As before, the axial lens profile is that shown in Fig. 15. We
find smaller radial oscillations, as in the experiment, and emittance
growth of only 11%.
24

VI. CONCLUSIONS
Simulation studies of recent SLIA experiments and of the SLIA POCE
have been performed. Simulation results shoved that as the intense beam is
transported through each bend, the beam experiences self electro- and
magnetostatic forces. To account for these forces, the design value of the
vertical bending field had to be increased by as much as 25%. Optimum
vertical field values, which were in reasonable agreement with the
theoretical analysis of Ref. 6, were determined for each bend.
Furthermore, we found that this correction to the vertical field did not
adversely effect the chromatic properties of the bend.
Simulations of transport into the stellarator fields showed that
radial mismatch oscillations are likely to be excited both at the
stellarator entrance and at the exit. Simulation results were quite
sensitive to the spatial distribution of the beam particles. We found
that, if the radial profile of the beam is rounded, the mismatch
oscillations damp and that this damping is accompanied by emittance growth.
These phenomena did not occur when the beam was initialized with a
Kapchinskij-Vladimirskij distribution, however. We believe that the
observed damping of radial mismatch oscillations is due to phase mixing
caused by nonlinear space-charge forces associated with a non-uniform beam
profilej14-16] By contrast, the K-V distribution has a uniform spatial
profile.
We have presented a novel method of matching the beam onto and off of
the stellarator fields. Here we use a single thick quadrupole lens on each
end of the stellarator to transform the circular cross-section of the beam
in the solenoid field into an elliptical shape that closely approximates
the equilibrium configuration in the stellarator fields. The lens strength
25

and orientation are adjusted to obtain the correct eccentricity and phase
at the stellarator entrance. An identical lens, with only its orientation
adjusted, is used at the exit to bring the beam back to a circular cross-
section. Simulations show that matching can be accomplished in this way
and that the degree of emittance growth can be greatly reduced by the use
of such single-element matching lenses.
We also performed end-to-end simulations of the SLIA POCE, where the
beam was taken through all three bends. These showed that matching
elements can reduce total emittance growth from 52Z to 10%. While the
level of emittance growth found in the end-to-end simulations was modest
even when no matching elements were used, such elements will certainly be
necessary in a 50-100 MeV SLIA design, where many more bends would be
required.
We have also explored other approaches to the SLIA matching and
transport problems, which are not reported here. For instance, discrete,
alternating-gradient quadrupole lenses were considered as an alternative to
stellarator windings. The motivation for this study was the possibility of
improved stability with regard to the electromagnetic instability of Refs.
30-32. It was found, however, that alternating-gradient transport is
comparably unstable.[33,34] It was further found that the instability
could be avoided in the stellarator configuration by carefully choosing
system parameters.[31,32,35] We also considered a design in which
stellarator windings were used on the straight sections as well as on the
bends. This design does not avoid the complication of changing the
parameters of the stellarator and solenoid fields between each bend, in
order to keep the bends achromatic as the beam energy increases. We found
that the stellarator-stellarator transitions (i.e., between the parameters
26

of bends one and two) were no less problematical than the solenoid-
stellarator transitions of the POCE. This difficulty persisted even for
designs in which each bend had the same stellarator pitch length.
Finally, simulations were performed to model and understand the recent
SLIA transport experiments.J8-10] A core-halo distribution, similar to
that of the 850 keV, 200 A experimental beam, was used in simulations of
transport through the stellarator fields, with and without matching lenses.
These simulations reproduced each of the key features of the experiments,
including the motion of the beam cross-section, which followed the pitch of
the stellarator windings in all cases, the amplitude, frequency and damping
rate of the radial mismatch oscillations, and the reduction in the
amplitude of these oscillations through the use of matching elements at the
stellarator entrance and exit.
In the 850 keV simulations, the sensitivity of the results to the
spatial distribution of the beam was of key importance in our efforts to
reproduce the experimental results. Specifically, the initial measurements
of the spatial profile of the beam showed only the central core.
Simulation results with the same profile (Fig. 19) showed a 25% disparity
in the frequency of the mismatch oscillations between simulation and
experiment (see Fig. 18). By adding a halo, we found that this disparity
could be eliminated. The addition of a halo was motivated by the fact that
such core-halo distributions are associated with the damping of radial
mismatch oscillations[291 as might be present in the injector.[lO,201 The
existence of the halo was later confirmed experimentally. [10]
27

ACKNOWLEDGMENTS
We wish to acknowledge our collaboration with V. Bailey, M.
Tiefenback, J. Lidestri, D. Wake and S. Putnam of Pulse Sciences, Inc., who
assisted us in interpreting their experimental data. We also wish to
acknowledge many helpful discussions with J. Petillo, D. Chernin and A.
Mondelli of Science Applications International Corp., T. Hughes of Mission
Research Corp., I. Haber, C. M. Tang and R. Hubbard of N.R.L. and M. Reiser
of the University of Maryland.
This work was supported by Defense Advanced Research Projects Agency
under ARPA Order 7781 and monitored by the Naval Surface Warfare Center.
28

APPENDIX: FIRST ORDER FIELD CORRECTIONS IN A CURVED GEOMETRY
In the ELBA[1lJ and SST[13] particle simulation codes, the
electromagnetic fields are computed in terms of the scalar and vector
potentials using cylindrical coordinates. In all cases, the beam is
assumed to be propagating within a conducting pipe of radius rw. Following
the approach originated by Lee[36], the equations are solved using the
gauge
1i.A - 0 , (Al)
where Ai is the component of the vector potential perpendicular to the
direction of propagation. This gauge works well for problems in which the
beam is nearly axisymmetric and dominates the field production. In the
ELBA code, a change of variables is made from (r,e,z,t) to (r,e,C.ct-
z,c=t). The (C,x) variables are numerically advantageous in that a) a
relativistic beam is nearly stationary in these coordinates and b)
information flow is always towards larger values of C. The SST code makes
the additional simplifying assumption that a/IC - 0. This approximation is
useful when self-forces arising from C-derivatives of the beam density and
current can be neglected.
In terms of the potentials, A1, f and a a Az - f, Maxwell's equations
in the gauge of Eq. (Al) can be written as[11,37]
BE + -z- -4np (A2)
•i + -4Ezi aE
2 + 1E = -4n(J /C - p) (A3)
29

and
V2 -fL+2rý)Aý -L" .(I J ~ -h 'a'r (A4)-0 -RcO -1 7 a -F ,
where
E a + -)c of• (A5)
For propagation around a bend, we neglect corrections to A and A andre
retain terms in the equations for a and f to first order in rw /R, where R
is the radius of curvature of the bend. The corrections are treated as
explicit terms in the solution algorithms. Maxwell's equations for the
potentials in the bend are derived by transforming to a local orthogonal
coordinate system (r,e,s) which is centered on the axis of the beam pipe
with s measuring arc length along the bend. The (r,e,s) coordinates can be
written in terms of global Cartesian coordinates (x,y,z) with the origin at
the center of the bend:
x - (R + r cose)cos(s/R) , (A6a)
y - r sine (A6b)
and
z . (R + r cose)sin(s/R) , (A6c)
for r < r-- W
Maxwell's equations for a and 0 are written in the (r,e,s) coordinate
system and expanded to first order in r/R. We then make a change of
variables from (r,e,s,t) to (r,8,C=ct-s,x.t). The result is
30

72 aE s -4p-1[cos L' sine 8# r coe82#
ra 8 r e 82o r73.
+ cose 3 + rcose-+cose&a 3 r )+
- sine 8A•e+ e e) (A7)
and
V2 3Ea = -4n(J /C - p)
+ cose + 1 a - coseRI fMac+ c- ý-rC+ 2 a r
sine ac(2 2Ar 1A rr + cose 8-7 +
Me8A 1 aAe'"
-sine12-, + e- T ,- (A8)
vhere
s _ a' 8 r atE5 + at it - S cas (A9)
and Js is the current density in the s direction. Because we neglect
corrections to Ar and Ae, the gauge condition, Eq. (Al), and Eq. (A4)
remain unchanged. The remaining electric and magnetic field components are
8A 8A
E -1 3 r r t (AlOa)r c -c - TC - 'IO
31

Eei 83 A 8Ae lat (AlOb)c- T&t r- ae'
I: 1La 8# Ae 1 MAe
JF[r coseq +T ie~ ) (Alla)
Be r r - r +~ 3 [r cose 7a cose(m + t)(Alib)
and
13 r
32

References
1. C. G. Fong, T. J. Fessenden, R. L. Fulton and D. Keefe, in Proceedings
of the 1989 IEEE Particle Accelerator Conference, IEEE Catalog No.
89CH2669-0 (Chicago, IL, 1989), p. 962.
2. S. 0. Putnam, in Proceedings of the 1987 IEEE Particle Accelerator
Conference (New York, IEEE Press, 1987) p. 887.
3. W. K. Tucker, S. L. Shope and D. E. Hasti, in Proceedings of the 1987
IEEE Particle Accelerator Conference (New York, IEEE Press, 1987) p.
957.
4. C. A. Kapetanakos, L. K. Len, T. Smith, J. Golden, K. Smith, S. J.
Marsh, D. Dialetis, J. Mathew, P. Loschialpo and J. H. Chang, Phys.
Rev. Lett. 64, 2374 (1990); C. W. Roberson, A. Mondelli and D.
Chernin, Phys. Rev. Lett. 50, 507 (1983).
5. V. Bailey, L. Schlitt, M. Tiefenback, S. Putnam, A. Mondelli, D.
Chernin, and J. Petillo, in Proceedings of the 1987 IEEE Particle
Accelerator Conference (New York, IEEE Press, 1987), p. 920; A.
Mondelli, D. Chernin, S. D. Putnam, L. Schlitt and V. Bailey, in
Proceedings of the Sixth Inernational Conference on High Power
Particle Beams (Osaka, Japan, 1986).
6. D. Chernin and P. Sprangle, Part. Accel. 12, 85 (1982).
7. R. L. Gluckstern, in Proceedings of the 1979 Linear Accelerator
Conference, BNL Report BNL-51134 (Brookhaven, New York, 1979), p. 245.
8. J. P. Lidestri, V. L. Bailey, Jr., J. A. Edighoffer, S. D. Putnam,
M.G. Tiefenback and D. Wake, in Conference Record of the 1991 IEEE
Particle Accelerator Conference, IEEE Catalog No. 91CH3038-7 (San
Francisco, CA, 1991), p. 3120.
33

9. M. G. Tiefenback, J.P. Lidestri, V.L. Bailey, Jr. and S.D. Putnam, in
Conference Record of the 1991 IEEE Particle Accelerator Conference,
IEEE Catalog No. 91CH3038-7 (San Francisco, CA, 1991), p. 3195.
10. M. G. Tiefenback, S. D. Putnam, V. L. Bailey, Jr., J. P. Lidestri and
J. A. Edighoffer, PSI Report PSIFR-2543-01 (1991).
11. G. Joyce, J. Krall, and S. Slinker, in Proceedings of the Conference
on Computer Codes in the Linear Accelerator Community, LANL Report LA-
11857-C (Los Alamos, NM, 1990), p. 99; S. Slinker, G. Joyce, J. Krall
and R. F. Hubbard in Proceedings of the 14th International Conference
on the Numerical Simulation of Plasmas (Annapolis, MD, 1991).
12. A. Friedman, in Proceedings of the 13th International Conference on
the Numerical Simulation of Plasmas (Santa Fe, NM, 1989); A. Friedman,
D. A. Callahan, D. P. Grote, A. B. Langdon and I. Haber, in
Proceedings of the Conference on Computer Codes in the Linear
Accelerator Community, LANL Report LA-11857-C (Los Alamos, NM, 1990),
p. 119.
13. J. Krall, G. Joyce and S. Slinker, in Proceedings of the 14th
International Conference on the Numerical Simulation of Plasmas
(Annapolis, MD, 1991).
14. S. Humphries, Charged Particle Beams (J. Wiley, New York, 1990).
15. J. D. Lawson, The Physics of Charged Particle Beams, Second Edition
(Oxford U. P., London, 1988).
16. T. P. Wangler, K. R. Crandall, R. S. Mills and M. Reiser, IEEE Trans.
Nucl. Sci NS-32, 2196 (1985).
17. I. M. Kapchinskij and V. V. Vladimirskij, in Proceedings of the
International Conference on High-Energy Accelerators and
Instrumentation (CERN, 1959), p. 274.
34

18. R. C. Davidson, Physics of Nonneutral Plasmas (Reading, MA, Addison-
Wesley, 1990), pp. 588-594.
19. S. Slinker, G. Joyce, J. Krall and M. Lampe, submitted to Phys. Fluids
B.
20. T. P. Hughes, T. C. Genoni, K. T. Nguyen and D. R. Welch, MRC Report
MRC/ABQ-R-1442 (1991).
21. J. J. Petillo, C. Kostas, D. P. Chernin and A. Mondelli, in Conference
Record of the 1991 IEEE Particle Accelerator Conference, IEEE Catalog
No. 91CH3038-7 (San Francisco, CA, 1991), p. 613; The parameters
listed in Table I of this reference are for the case of zero space-
charge and are useful for the envelope code simulations included
therein. The parameters for our case were generated in the same way,
but with some space-charge effects included.
22. V. Bailey and J. Lidestri, private communication.
23. V. Bailey, D. Wake, R. Curry, J. Lidestri and M. Tiefenback, in
Conference Record of the 1991 IEEE Particle Accelerator Conference,
IEEE Catalog No. 91CH3038-7 (San Francisco, CA, 1991), p. 3123.
24. A. Mondelli, D. Chernin and J. Petillo, private communication.
25. D. Chernin, Part. Accel. 24, 29 (1988).
26. F. J. Sacherer, IEEE Trans. Nucl. Sci 18, 1105 (1971).
27. W. H. Bennett, Phys. Rev. 45, 890 (1934).
28. E. P. Lee and R. K. Cooper. Part. Accel. 7, 83 (1976).
29. See, e.g., Y.-J. Chen, G. J. Caporaso, A. G. Cole, A. C. Paul and W.
C. Turner, in Conference Record of the 1991 IEEE Particle Accelerator
Conference, IEEE Catalog No. 91CH3038-7 (San Francisco, CA, 1991), p.
3100 and D. Kehne, M. Reiser and H. Rudd, ibid., p. 248.
30. T. P. Hughes and B. B. Godfrey, Phys. Fluids 29, 1698 (1986).
35

31. C. M. Tang, P. Sprangle, J. Krall, P. Serafim and F. Mako, Part.
Accel. 35, 101 (1991).
32. J. Krall, C. M. Tang, G. Joyce and P. Sprangle, Phys. Fluids B 3, 204
(1991).
33. C. M. Tang, J. Krall and T. Swyden, Phys. Rev. A 45, 7492 (1992).
34. T. P. Hughes and D. Chernin, submitted to Particle Accelerators.
35. D. Chernin and T. P. Hughes, private communication.
36. W. S. Sharp, S. S. Yu and E. P. Lee, private communication.
37. J. Krall, K. Nguyen and G. Joyce, Phys. Fluids B 1, 2099 (198q).
36

Table I. Parameters for the SLIA POCE: bend design energy E, axial fieldBs, quadrupole gradient bq and quadrupole pitch length Xp.
Bend E (MeV) B (G) b (G/cm) X (cm)
1 4.0 5492. 251.6 68-332 5.5 5335. 207.0 83.783 7.0 5483. 182.3 125.67
Table II. Numerically determined optimum vertical field values for eachPOCE bend. Values are in units of Gauss. For comparison, theideal values (no hoop forces) and the predicted values from Eq.(2) are also given.
Bend B Bv (ideal] Bv [6=11 Bv [6=21
1 233.0 186.9 236.2 248.62 296.0 249.5 '98.6 311.03 354.5 312.5 .;0.1 372.5
Table III. Location for each bend, each ideal acceleration and eachsolenoid transition for the end-to-end POCE simulations.Lengths are in centimeters. Note that the acceleration afterthe third bend is not included and that the POCE design featureslonger straight sections than those used here.
Bend Bend location Acceleration Solenoid transition
1 50 - 301.3 400 - 450 422.5 - 427.52 550 - 801.3 900 - 950 922.5 - 927.53 1050 - 1301.3 ......
37

T 9
kAccelerating
R =80 cm
Y"12<
Y 15
Fig. 1. SLIA proof-of-concept experiment schematic.
38

0.40
o 0.30 7
0.20
010
0 20 40 60 80 100Z (C n/
Fig. 2. RMS radius rb versus transport distance z for the POCE beam
initialized with a K-V distribution (solid line) and with a
higher-order K-V distribution (dashed line).
39

1 . 0 . . . . . . . . . I. . . . I. . . . . . .1.0 I
05 "cx " (d
SI I e f z
40I, ' I I \
0 I I III\I\II I I "
I I I \I \
-0.5 1• '
-1.0 A-1.5 ,,
0 100 200 300 400
Fig. 3. Beam centroid coordinates xc (solid) and yc (dashed) versus
transport distance in the first POCE bend with no hoop-force
correction. The bend extends from z = 50 cm to z -301.3 cm.
40

1.2 1
1.0 E
"2 0.8
0.6E
S0.4 -
0.2 -
0
180 200 220 240 260Bv (G)
Fig. 4. Maximum displacement of the beam centroid radius, r c,max, in the
bend versus vertical bending field B v. Optimum value is Bv = 233
G.
41

0.4
0.2-SA. . . . .. ) . . . ' , I
I fi l
0 II
-0.2 -
-0.4 1 ... . .. .0 100 200 300 400
Fig. 5. Beam centroid coordinates xc (solid) and yc (dashed) versus
transport distance in the first POCE bend with beam energy
mismatch AE - -10%.
42
0.4'
0.2 - I I
- I -
0 -• \I I I
I \. \ j
02 ' -•
-0.
-0-2-
-0.4 ... ...
0 100 200 300 400z (CrM)
Fig. 6. Beam centroid coordinates xc (solid) and yc (dashed) versus
transport distance in the first POCE bend with beam energy
mismatch 6E - +10%.
43

0.25
0.20 - -
0.15I. -
= 0.10,
0.05
-10 -5 0 5 10ABS (70
Fig. 7. Beam centroid displacement at the bend exit Sr versus percentage
error in the axial magnetic field bBs for runs with beam energy
mismatch AE - -10%.
44

0.20
0.15
S0.107
0.05 E -0
-10 -5 0 5 10Abq (M)
Fig. 8. Beam centroid displacement at the bend exit Sr versus percentage
error in the stellarator gradient Ab for runs with beam energyqmismatch AE - -10.
45

121 2
0 6--
~0
I- (W 20 W . I W
06- i .- C,
0U- 6 0"
S2 - 0 4 -
() 1 00 200 30 ( 40) --0() 1 00 200 2300 (I -0z (cm) z (cm)
Fig. ~ ~ _______ 9 ---. Majo an mio-air+(oi)an dse) fteba
s - s . . ..... .. di' n r ,! 1I 0- '
-6 0 6-. .
(16- - .0~
0 4 0 4
(0 00) 200 200 .400) 3w)-• 0) 100 200 300S(cm) z (crm)
Figl. 9. Major and minor radii, r (solid) and r (dashed), of the beam+
cross-section versus transport distance for beams with various
profiles: (a) K-V, (b) parabolic, (c) Gaussian and (d) Bennett.
46

m- -
010
I
10
0 100 200 300 400 500
Fig. 10. Emittance Cn,rms versus transport distance for each of the four
cases of Fig. 9: K-V (solid line), parabolic (dashed), Gaussian
(dotted) and Bennett (long dashes).
47

1 0 (a) 1 .01
0 .0.4
7 0.2 1 ," ' • : 0.2: 1 "z (a) M) b)-
S0- 1.0 \0 6 - 0i, ,6- -.- , -,
04 - 0.4-
0.2- - 0,2-
1 r
0 10 20 30 40 50 0 10 20 30 40 50z (cre) z (crm)
-0 1.0c (d)
0 "" '08-
/ -
0.(6 , , ", . , ., . -i 0 6--
04 -. 04-
02- -• 02-
L0 10 20 30 40 50 0 10 20 30 40qarplz (cm) z (cre)
Fig. 11. Envelope code results showing major and minor beam radii versus
transport distance for several quadrupole lens lengths LO: a) L0
= 1 cm, b) L0 = 2.5 cm, c) LQ = 5 cm and d) L0 1 0 cm. Here,
L bQ - 2000 G in all cases, where bQ is the peak quadrupole
gradient of the lens. Beam parameters correspond to those of the
first POCE bend.
48

1.0r
S/
/
/ -0.6
-0.4-
tKI
L
0.21 !5
0 10 20 30 40 50z\cm)
Fig. 12. Envelope code results shoving major and minor beam radii versus
transport distance for a quadrupole lens with length L 0 - 5 cm
and quadrupole gradient b = 400 G/cm as in Fig 11 (c). Beam
parameters correspond to those of the third POCE bend.
49

1 .O0 ....... ., . . . . . . . . . .
0.8
0 .6 -- 7
I I \I 1 \ J
S0./4-
0.2
0
0 100 200 300 400 500
Fig. 13. Simulation result showing major and minor beam radii, r+ and r_,
as a function of transport distance. Here, single-element
matching has been used.
50

o0 . .. . . . . . ... . . . .1i0•
F
0 too 200 30C 400 500
Fig. 14. Simulation result showing normalized RMS emittance as a function
of transport distance for the single-element matching case as
shown in Fig. 13 (solid line) and for the case with no matching
as shown in Fig. 9(b) (dashed line).
51

1.5L'
i.0~
0.5
-0.5
"-15 -1 50 0 1
522

3.0 (a)
2.5
- 2.0H
1.0-
0.0 "P0 500 1000 1500
z (cm)
2• 5t
2~10~
V p1
0 -00 1000 1o00z (ore)
Fig. 16. End-to-end POCE simulation results showing (a) major and minor
radii and (b) emittance versus transport distance. No matching
lenses are used. The overall emittance growth is 52%.
53

3.0 (-,2.D5
1.01
- 0.5
0 500 1000 1500z (Cra)
S2 ~(b)
20 -
• -J
5 -J
"0 500 1000 1 -o0
Fig. 17. End-to-end POCE simulation results shoving (a) major and minor
radii and (b) emittance versus transport distance. Single-
element matching lenses are used at the entrance and exit of each
bend. The overall emittance growth is 10%.
54

0.8
0.4-
0.26
0 100 200 300 400z, (o m)
Fig. 18. Experimental data from Lidestri et ai.[81 showing the major and
minor radii of the beam cross-section as a function of transport
distance. In this plot, the stellarator entrance is at z = 50 cm
and the exit is at z -f 301.3 cm.
55

0.8 (a...
0.6-
0.4-
0.2
0 100 200 300 400 500Z (crn/
1.5((bm
1.0-
' Q51
0 ý . . . .. . . . . . .. . • . . . . . , . . . . . . .
0 100 200 300 400 500
Fig. 19. Simulation result showing (a) major and minor beam radii and (b)
normalized RMS emittance as a function of transport distance for
a beam with a parabolic spatial profile.
56

''1.0k
-08
0.4-
~0.2- .- 04
: 0
-1.0 -0.5 0 0.5 1.0x (arb. units)
Fig. 20. Experimental data from Tiefenback et al.[10] showing charge
density versus transverse coordinate x.
57

S1.0L
-.• F
-• 0. 4
" 06-2-
-. -4
-1.0 -0.5 0 0.5 1.0x (C M)
Fig. 21. Current density versus transverse coordinate x for the core-halo
simulation beam.
58

0.8! (a)
S0.6 70 8 i .. 8) , - S - - -' .... T
0 .14.
06
0 100 200 300 400 5_00
15 (b)
-10
0.45,,
0':
0 100 200 300 400 500
Fig. 22. Simulation result shoving (a) major and minor beam radii and (b)
normalized RMS emittance as a function of transport distance for
a beam with a core-halo distribution.
59

0.8K "
0.4 --0
0.4
0.2
0. J
0 100 200 300 400S(cm)
60

0 .8 1 ......... '.. ....... . . . .'. . . .
7 1
0 . 6 ,4 -
0.2•
0 100 200 300 400 500z (Cm)
1.5 (b) . . ., . . . . ,. . . .
1 .0 ,r--
S0.5-
- r
0 100 200 300 400 500' (o M)
Fig. 24. Simulation result shoving (a) major and minor beam radii and (b)
normalized RMS emittance as a function of transport distance. In
this case, a single-element matching lens was used.
61