australian energy technology assessment 2013 model · pdf filethe inaugural australian energy...
TRANSCRIPT

1
Australian Energy Technology
Assessment 2013 Model Update
December 2013
2
Arif Syed (BREE) 2013 The Australian Energy Assessment (AETA) 2013 Model update Canberra
December 2013
copy Commonwealth of Australia 2013
This work is copyright the copyright being owned by the Commonwealth of Australia The Commonwealth
of Australia has however decided that consistent with the need for free and open re-use and adaptation
public sector information should be licensed by agencies under the Creative Commons BY standard as the
default position The material in this publication is available for use according to the Creative Commons BY
licensing protocol whereby when a work is copied or redistributed the Commonwealth of Australia (and any
other nominated parties) must be credited and the source linked to by the user It is recommended that users
wishing to make copies from BREE publications contact the Chief Economist Bureau of Resources and
Energy Economics (BREE) This is especially important where a publication contains material in respect of
which the copyright is held by a party other than the Commonwealth of Australia as the Creative Commons
licence may not be acceptable to those copyright owners
The Australian Government acting through BREE has exercised due care and skill in the preparation and
compilation of the information and data set out in this publication Notwithstanding BREE its employees
and advisers disclaim all liability including liability for negligence for any loss damage injury expense or
cost incurred by any person as a result of accessing using or relying upon any of the information or data set
out in this publication to the maximum extent permitted by law
ISBN 978-1-925092-14-1 (online)
This report was produced by Arif Syed Modelling and Policy Integration Program BREE It is based on
analysis undertaken by WorleyParsons commissioned by the Department of Industry
Acknowledgements
The Project Steering Committee comprised Professor Quentin Grafton Bruce Wilson Wayne Calder and Dr
Arif Syed of BREE Rick Belt and Mark Stevens of the Department of Industry Damir Ivkovic of ARENA
Professor Ken Baldwin of the Australian National University Dr Alex Wonhas of the Commonwealth
Scientific and Industrial Research Organisation and Nathan White of the Australian Energy Market Operator
The guidance and assistance of the AETA Steering Committee members and AETA Stakeholders Group are
gratefully acknowledged Davin Nowakowski and Shamim Ahmad of BREE provided valuable support to the
preparation of this report
Postal address
Bureau of Resources and Energy Economics
GPO Box 1564
Canberra ACT 2601 Australia
Phone +61 2 6243 7000
Email infobreegovau or ArifSyedbreegovau
Web wwwbreegovau
3
FOREWORD
The inaugural Australian Energy Technology Assessment (AETA) 2012 report released in
mid-2012 was an important step forward in improving the quality and transparency of
information available for market-ready and prospective electricity generation technologies in
Australia The AETA 2012 provided many important insights particularly the relatively
rapid cost reductions expected for a range of renewable energy technologies over the course
of the next decade
To ensure that technology costs remain up to date this AETA 2013 Model Update report
provides electricity generation technology cost parameters as an update to the values
presented in AETA 2012 All of the 40 technologies considered in AETA 2012 are included
in this update and encompass a diverse range of energy generation sources including
renewable energy (such as wind solar geothermal biomass and wave power) fossil fuels
(such as coal and gas) and nuclear power
The AETA 2013 Model Update takes into account new information on technology generation
costs and has been the subject of wide consultation with relevant industry stakeholders and a
stakeholder reference group drawn from industry and researchacademic organisations with
interests and expertise in a diverse range of electricity generation technologies
As is the case for all such assessments the cost estimates in this report reflect assumptions
made on a mix of critical technical and economic parameters Importantly the LCOE
estimates do not include site specific or systems costs The AETA 2013 Model Update
results also do not include carbon or other environmental costs that may be associated with
various technologies Clearly the extent to which these might apply in the market or
through regulation may impact on generation or delivered costs of electricity
Importantly the transparency and detail provided in the AETA model enables users to apply
their particular assumptions to construct their own LCOE based on Australian conditions
and a copy of the model is available upon request It is essential to energy planners energy
modellers and indeed anyone interested in exploring different scenarios and energy
futures
Bruce Wilson
Executive Director
Bureau of Resources and Energy Economics
4
CONTENTS
About the Bureau of resources and energy economics 2
Acknowledgements 2
FOREWORD 3
ACRONYMSABBREVIATIONS 8
GLOSSARY 9
EXECUTIVE SUMMARY 10
1 INTRODUCTION 12
11 Background to the AETA 2012 report 12
12 Methods and Assumptions of the AETA 2012 Report and Model 12
121 Macro assumptions 12
122 Technical assumptions 13
123 Levelised cost of energy (LCOE) 13
13 Methodology of the AETA 2013 Model Update 13
131 Caveats on the use of LCOE 14
132 Organisation of the report 14
2 AETA MODEL PARAMETER CHANGES 16
21 Stakeholder Initiated Changes 16
211 Nuclear Capital Costs 16
212 Carbon Capture and Storage (CCS) Retrofit Thermal Efficiency 17
213 Amortisation period 19
22 No Carbon Pricing 19
3 CONSIDERATION OF OTHER ISSUES 20
31 Representation of Uncertainty 20
32 Application of Learning Curves 20
33 General Costs Considerations 21
331 Fuel Costs 21
332 CCS Costs 21
333 Opportunity Costs 22
34 Capital and Construction Costs 22
5
35 Costs Associated with Solar Technologies 23
36 Costs Associated with Nuclear Technologies 24
37 Further Technologies 24
38 Auxiliary Loads 24
4 WIND PV AND CSP OPERATIONS AND MAINTENANCE (OampM) COST UPDATE 25
41 Operation and Maintenance Costs 25
42 Operating and Maintenance (OampM) Changes in summary 26
43 Wind 28
431 Introduction 28
432 Review of Evidence 29
433 Updated OampM Figures for Australia 33
44 Solar Photovoltaics (PV) 36
441 Introduction 36
442 Review of the Evidence 37
443 AETA 2012 OampM PV costs report comparison 37
45 AETA 2013 PV OampM Costs Update 40
451 OampM Learning Rates 41
452 Conclusions - PV 42
46 Concentrating Solar Power (CSP) 43
461 Introduction 43
462 Review of the evidence 43
463 AETA 2012 OampM CSP costs report comparison 44
47 AETA 2013 OampM Learning Rate recommendation 53
5 CHANGES TO THE LCOE 55
51 Conclusions 63
REFERENCES 64
Appendix A Electricity Generation Technologies in AETA 2012 Report and Model 67
Appendix B Consultations with Stakeholders 69
BREE CONTACTS 71
6
INDEX OF TABLES
Table 1 Model Changes Nuclear Technologies 17
Table 2 Model Changes CCS Retrofit Thermal Technologies 18
Table 3 Model Changes amortisation period 19
Table 4 Model Changes OampM costs 27
Table 5 Wind OampM costs used in the AETA 2012 report 29
Table 6 Comparison of AETA 2012 wind OampM estimates with new references for 2013 35
Table 7 Recommended AETA 2013 values 36
Table 8 AETA 2012 reference plants technical characteristics and OPEX costs 39
Table 9 Comparison of historical estimated PV and OampM costs in the public domain 39
Table 10 2013 PV OampM costs compared to 2012 PV OampM costs 40
Table 11 2013 updated OampM costs compared to new referenced OampM costs (7-2) 41
Table 12 AETA 2012 Reference Plant Technical Characteristics 45
Table 13 AETA 2012 OampM Opex costs on a per kWh basis 46
Table 14 PT and ST Reference Plant Characteristics 47
Table 15 2013 CSP OampM Costs Compared to 2012 OampM Costs 48
Table 16 Estimated LCOE form Existing and Hypothetical Trough and Solar Tower CSP
Technologies 51
Table 17 AETA Learning Rate Comparison 54
7
TABLE OF FIGURES
Figure 1 - Effect of country variables on LCOE of wind plant 31
Figure 2 - Typical cost increasing trends in wind farm OampM costs with commercial
operations date 32
Figure 3 - Trends in offshore wind farms and estimated impact on LCOE 33
Figure 4 - OampM Costs (per MW) and Technician Numbers (per 100MW) for total wind
turbine OampM (Opex) 34
Figure 5 - AETA 2012 FOM and VOM Percentages of Total OPEX Costs 46
Figure 6 - Comparison of OPEX Costs per Total Annual Plant Production per Year
AETA 2012 Report and 2013 Update 49
Figure 7 - Expected LCOE Reductions for CSP Technology from 2012 to 2025 52
Figure 8 Updated LCOEs for AETA 2013 Model technologies values for 2012 (NSW) with
carbon price set to zero 56
Figure 9 Updated LCOEs for AETA 2013 Model technologies values for 2020 (NSW) with
carbon price set to zero 57
Figure 10 Updated LCOEs for AETA 2013 Model technologies values for 2025 (NSW) with
carbon price set to zero 58
Figure 11 Updated LCOEs for AETA 2013 Model technologies values for 2030 (NSW) with
carbon price set to zero 59
Figure 12 Updated LCOEs for AETA 2013 Model technologies values for 2040 (NSW) with
carbon price set to zero 60
Figure 13 Updated LCOEs for AETA 2013 Model technologies values for 2050 (NSW) with
carbon price set to zero 61
Figure 14 Comparison of AETA 2013 Model Update and AETA 2012 LCOE estimates
selected technologies 62
8
ACRONYMSABBREVIATIONS
AETA Australian Energy Technology Assessment
BREE Bureau of Resources and Energy Economics
CAPEX Total capital expenditures
CSP Concentrating Solar Power Technologies
DAT Dual axis tracking
EPIA European Photovoltaic Industry Association
EPRI Electric Power Research Institute
ESTELA European Solar Thermal Electricity Association
FOM Fixed operation and maintenance costs
FT Fixed Tilt
h Hours
IDEA Institute for Energy Diversification and Saving
IEA International Energy Agency
IRENA International Renewable Energy Agency
kW Kilowatts
kWh Kilowatt hours
LCOE Levelised Cost of Energy
LF Lineal Fresnel Reflector CSP Technology
m2 Square Meters
MENA Middle East and North Africa region
MW Megawatts
MWh Megawatt hours
MWe Megawatt hours electric
NREL National Renewable Energy Laboratory
OampM Operation and maintenance
OEM Original Equipment Manufacturer
OPEX Total operating expenditures
PT Parabolic Trough CSP Technology
PV Photovoltaic
RampD Research and Development
SAT Single axis tracking
SEGS Solar Electricity Generating System
SEIA Solar Energy Industries Association
SEPA Solar Electric Power Association
ST Solar Tower CSP Technology
TES Thermal Energy Storage System
USD United States Dollar
VOM Variable operation and maintenance costs
WB The World Bank organization
9
GLOSSARY
Amortisation Period the period over which a plant must achieve its economic return
Auxiliary Load the internal or parasitic load from the electricity required to sustain the
operation of a plant
Capacity Factor the ratio of the actual output of a power plant over a period of time and its
potential output if it had operated at full nameplate capacity the entire time
Capital Cost the cost of delivery of a plant not including the cost of finance
Discount Rate the rate at which future values are discounted or converted to a present
value
First-of-a-Kind Plant cost costs necessary to put a first commercial plant in place and that
will not be incurred for subsequent plants Design and certification costs are examples of
such costs
First Year Available for Construction the year in which the technology will be available
for commercial deployment globally
Gross Capacity maximum or rated generation from a power plant without losses and
auxiliary loads taken into account
International Equipment Cost the cost for internationally sourced equipment associated
with the project
Labour Cost the component of the delivery cost for a plant associated with local
(Australian) labour
Lead time for Development the time taken from inception to financial close This includes
permitting approvals and engineering design
Levelised Cost of Energy the minimum cost of energy at which a generator must sell the
produced electricity in order to achieve its desired economic return
Local Equipment Cost the cost of locally sourced (Australia) plant and equipment for the
project
Net Capacity the export capacity of a generation plant ndash ie the Gross Capacity less the
losses and auxiliary loads of the plant
Nth-of-a-kind plant cost all engineering equipment construction testing tooling project
management and other costs that are repetitive in nature and would be incurred if a plant
identical to a FOAK plant were built The NOAK plant is the nth-of-a-kind or equilibrium
commercial plant of identical design to the FOAK plant
Sequestration the process of transport and storage of Carbon Dioxide (CO2)
Thermal Efficiency the ratio between the useful energy output of a generator and inputs
10
EXECUTIVE SUMMARY
This Report provides electricity generation technology cost parameters as an update to those
presented in the Australian Energy Technology Assessment (AETA) Report and Model
published in July 2012 This update takes into account a range of new material reported in the
public and private domain further discussions with asset owners and technology developers
and input from key experts in relation to these costs
The AETA 2012 Model estimated levelised costs of energy (LCOE) for a set of 40 market
ready and prospective electricity generation technologies LCOE can be interpreted as the
long-run marginal cost of electricity generation These were estimated by breaking down
the cost drivers for a technology into its key constituent parts such as capital cost fixed and
variable lsquooperations and maintenancersquo (OampM) costs and where applicable fuel costs and
CO2 storage costs While the LCOEs included carbon costs project specific regulatory or
system based costs were not included although clearly these may have a significant impact
on the delivered price of electricity
The AETA 2013 Model update generally follows the same approach although comparable
LCOE results are presented without carbon costs reflecting the Governmentrsquos intention to
repeal carbon pricing To the extent that alternative emissions reduction measures impact on
the electricity generation sector this may have different implications for fossil fuel andor
renewable based technologies
For these reasons some caution should be applied when interpreting LCOE estimates These
estimates best illustrate potential and relative ldquooff-the-shelfrdquo cost competitiveness rather than
a firm predictor of market outcomes or the commercial viability of individual projects
The key features of the LCOE cost parameters in the AETA 2013 Model update with respect
to the AETA 2012 Model can be summarised as follows
renewable technologies have generally higher LCOEs than the lowest cost non-
renewable technologies and the relative LCOE rankings significantly change post
2030 The LCOE of solar PV becomes lower than the non-renewables from mid-
2030 onwards
however wind based generation is estimated to already have a lower LCOE than
many new build comparable fossil-fuel generation technologies
LCOE costs vary substantially across the technologies from $89MWh (combined
cycle gas turbine) to $351MWh (solar thermal Linear Fresnel) in 2012 and
$73MWh (PV non-tracking) to $247MWh (IGCC black coal CCS) in 2050
changes are made to nuclear capital costs and nuclear technology plantrsquos lsquofirst year of
constructionrsquo carbon capture and storage (CCS) retrofit thermal efficiency and
amortisation period for various technologies to include construction period
a reduction in onshore wind OampM costs of 18 per cent
11
a reduction in offshore wind fixed OampM costs and a three-fold increase in offshore
wind variable OampM costs resulting in an overall increase of 50 per cent total OampM
costs
fixed tilt PV configurations have not seen significant changes in OampM costs
single axis tracking and dual axis tracking PV configurations are approximately 20-30
per cent reduced based on a better understanding of the associated OampM costs
concentrating solar power (solar thermal) OampM cost reduced between 8 per cent and 27
per cent and
the OampM learning rate for offshore wind and all solar technologies are increased from
02 to 25 per cent
The overall impact of parameter changes by technology is given in the AETA 2013 Model
and in this report As in the AETA 2012 the 2013 Model update provides technology
LCOEs for the years 2012 2020 2025 2030 2040 and 2050
12
1 INTRODUCTION
The Australian Energy Technology Assessment (AETA) 2012 report published in July 2012
by the Bureau of Resources and Energy Economics (BREE 2012) undertook costing of 40
electricity generation technologies This report made a provision that due to the fast changing
technology cost environment cost and performance parameters assessed in the AETA 2012
model may be updated every year In addition a full report and lsquobottom uprsquo study will be
undertaken biennially with the next report to be released in 2014
The next fully updated AETA report is scheduled for completion in 2014 To ensure that cost
estimates for electricity generation technologies are current and take into consideration the latest
developments parameter estimates for the 40 technologies will be updated where appropriate
every six months in a manner consistent with the methods outlined in this report and in consultation
with the stakeholder reference group (BREE 2012 p 24)
The purpose of this AETA 2013 Model Update report is to present findings arising from a
review of specific technologies by BREE This review was assisted by comments made by
the AETA Project Steering Committee (PSC) members and AETA Stakeholders Reference
Group (SRG) WorleyParsons was commissioned to review cost parameters for the
technologies considered in the AETA 2012 model Given the fast changing nature of solar
and wind technology operating costs especial emphasis was placed on reviewing OampM costs
for wind and solar technologies Changes to the model for the 2013 update are discussed in
the following sections
11 Background to the AETA 2012 report
BREE engaged WorleyParsons in 2011-12 to develop cost estimates for 40 electricity
generation technologies under Australian conditions for AETA 2012 The AETA cost
estimates were developed with the active collaboration of the Australian Energy Market
Operator (AEMO) which utilised the AETA cost estimates for its National Transmission
Network Development Plan (NTNDP) In addition the Commonwealth Scientific and
Industrial Research Organisation (CSIRO) provided technical advice as part of the AETA
project steering committee The AETA 2012 provided technology costs for the years 2012
2020 2025 2030 2040 and 2050 These technologies encompass a diverse range of
energy sources including renewable energy (such as wind solar geothermal biomass and
wave power) fossil fuels (such as coal and gas) and nuclear power (Appendix A) Since its
publication in July 2012 more than 1000 requests have been made from BREE for the
AETA 2012 cost estimates (model) by domestic and international sources
12 Methods and Assumptions of the AETA 2012 Report and Model
121 Macro assumptions
Key macroeconomic assumptions are consistent with those detailed by the Australian
Energy Market Operator in its National Transmission Network Development Plan and by
the Australian Treasury (see BREE 2012 for a full set of assumptions)
13
122 Technical assumptions
all technologies were costed on a consistent and transparent basis with itemisation of
component costs
capital costs included direct (eg engineering procurement and construction) and
indirect (eg owners) costs but exclude transmission and decommissioning costs
future cost estimates included assumptions about the exchange rate productivity
variation commodity variation and technology improvements
fuel cost estimates were based on ACIL Tasman projections and
projected growth rates for future operating and maintenance costs were provided
123 Levelised cost of energy (LCOE)
LCOE can be interpreted as the long-run marginal cost of electricity generation Key
factors used to calculate LCOE by technology include amortisation period discount rate
capacity factor CO2 emissions factor CO2 capture rate emissions price CO2 storage cost
fuel cost variable and fixed OampM cost and the capital cost
LCOE is a key comparative cost indicator across technologies that is expressed in real
Australian dollars per Megawatt hour of electricity generation ($MWh) The LCOE is the
price at which electricity must be generated from a specific plant to break even taking into
account the costs incurred over the life of the plant (capital cost cost of capitalfinancing
operations and maintenance costs cost of fuel emissions price if applicable and CO2
sequestration) While LCOE is an invaluable tool for comparing technology costs power
generation companies andor investors who wish to choose a technology to deploy would
also need to consider other criteria such as site-specific costs technology performance
characteristics and experience with the technology prior to any final investment decision
AETA cost estimates are developed to provide design basis and plant characteristics
performance parameters capital cost estimates fuel cost estimates OampM cost estimates
and LCOE estimates
Regional impacts on capital and operating costs have been incorporated in the analysis
These regions include Victoria New South Wales (including ACT) South Queensland
(incorporating the South East Queensland and Central Queensland AEMO regions) North
Queensland (incorporating the North Queensland AEMO region) Northern Territory
North WA (Pilbara region) South WA (the South West Interconnected System region)
South Australia and Tasmania
13 Methodology of the AETA 2013 Model Update
As part of the AETA 2013 Model Update BREE invited submissions from the AETA
Steering Committee and the Stakeholder Reference Group to provide commentary and
recommendations on the AETA 2012 Report and Model Eight written submissions were
received in this regard Changes were only recommended where specific substantiated
changes were received The AETA 2013 model has been updated in accordance with the
above consultations and under the same macro economic and technical assumptions as in
AETA 2012 The AETA 2013 model is freely available on request from BREE
(infobreegovau)
Within this context this report provides updated costs based on
14
relevant Australian and international reports on generation technologies that have been
published since AETA 2012 or have been newly discovered
new public domain information
new information from private sources that could be obtained
in-house experience of WorleyParsons and
input on OampM costs and learning rates from a number of industry stakeholders
This AETA 2013 Model Update report provides supporting explanations and references and
justifies amendments to the cost parameters of technologies especially the OampM costs for
wind and solar technologies that were covered in AETA 2012 model
131 Caveats on the use of LCOE
LCOE provides a generalised cost estimate and does not account for site specific factors
that would be encountered when constructing an actual power plant As a result the costs
associated with integrating a particular technology in a specific location to a specific
electricity network are not considered
Projected LCOE does not necessarily provide a reliable indicator of the relative market
value of generation technologies because of differences in the role of technologies in a
wholesale electricity market For example projected LCOE does not provide a direct
indicator of electricity demand or generation in isolation with other emissions abatement
policies Similarly many technologies involve integration costs in addition to the LCOE to
be able to reliably supply to the system The value of variable (or intermittent) power plants
(such as wind and solar) will depend upon the extent to which such plants generate
electricity during peak periods and the impact these plants have on the reliability of the
electricity system Unlike dispatchable power plants (such as coal natural gas biomass
and hydroelectric) ndash which are reliant on some form of stored energy (eg fuels water
storage or battery storage) ndash wind and photovoltaic power plants do not typically include
energy storage Dispatchable plants such as coal or gas fired plants may involve negative
externalities (environment fuel disposal or insurance costs etc) which are not always
reflected in their LCOEs
The AETA LCOEs are restricted to only utility-scale or large scale technologies
Consequently small-scale technologies (eg small roof-top photovoltaics fuel cells co-
generation and trigeneration) that may be relevant to distributed generation were not
included in the AETA 2012 analysis LCOE cost estimates associated with distributed
photovoltaics are likely to differ substantially from utility-scale photovoltaic systems as a
result of differences in component costs (eg capital costs operating and maintenance
costs) and performance characteristics (eg capacity factor)
132 Organisation of the report
This report is organised in five sections After a brief introduction and purpose of the report
in this section section 2 discusses the changes made to the AETA 2013 Model parameters as
a result of the discussions with Stakeholders and Steering Committee members on the
individual issues and technologies Section 3 presents the issues that were considered but did
not result in the AETA Model parameter changes Section 4 presents in detail the OampM cost
15
changes for wind and solar technologies covered in AETA 2012 Updated LCOE graphs as
well as a comparison of the resultant AETA 2013 Model and AETA 2012 Model LCOEs are
presented in section 5 which also presents concluding comments
16
2 AETA MODEL PARAMETER CHANGES
21 Stakeholder Initiated Changes
Consultations for the AETA 2013 Model update identified the following issues for
consideration
nuclear technology capital costs and lsquofirst year available for constructionrsquo
CCS retrofit thermal efficiency
amortisation period for all technologies and
OampM costs
The OampM issue is discussed in section 4 whereas rest of the issues are discussed below
211 Nuclear Capital Costs
The AETA 2012 report and model presents costs for first of a kind (FOAK) and Nth of a kind
(NOAK) nuclear technologies There could have been some confusion from the original
wording of Section 310 of AETA 2012 report It starts by discussing Gen III plants currently
sold (presumably NOAK) however further in the document Gen III plants are referred to as
FOAK The AETA 2012 report states that the capital costs are based on nuclear power plants
in the US The NOAK value is what is represented in Table 3101 in the AETA 2012 report
and model
Although there are cost adjusting factors used for other technologies studied in the AETA
2012 report there is no adjustment of the US cost base for Australian labour costs and for
adjustment of Australian equipment costs Submissions indicated that an adjustment to costs
should also be used for nuclear to ensure there is commonality in the comparison
This suggestion was considered appropriate and adjustment to the costs for nuclear
technologies was made Based on the factors to convert US rates to Australian rates used in
the fossil fuel technologies ie the factors from the Thermoflow software the new nuclear
capital costs were calculated The multiplier from Thermoflow for labour costs is 205 and
the factor for equipment costs is 13 both US to Australia
Additionally it was submitted that the first year available for construction of nuclear
technologies be extended In support of this the submission argued that nuclear technologies
are examples of generation technology where legislation regulation and public policy
planning is highly region-dependent and must therefore precede deployment by several years
This was considered an appropriate submission and therefore the first year available for
construction in the model has been changed from 2012 to 2020 These changes are shown in
Table 1
17
Table 1 Model Changes Nuclear Technologies
AETA 2012 report reference AETA 2012 model value AETA 2013 update
Technology 37 Nuclear (GW Scale LWR)
Change first year available for Construction
2012
2020
Technology 37 Nuclear (GW Scale LWR)
Convert FOAK Capital Cost to Australian productivity
and commodity costs
4210
6392
Technology 37 Nuclear (GW Scale LWR)
Convert NOAK Capital Cost to Australian productivity
and commodity costs
3470
5268
Technology 38 Nuclear (SMR)
Convert FOAK Capital Cost to Australian productivity
and commodity costs
7908
11778
Technology 38 Nuclear (SMR)
Convert NOAK Capital Cost to Australian productivity
and commodity costs
4778
7116
The overall impact of these parameters on individual technology LCOE changes is given in
the AETA 2013 Model and in Section 5
212 Carbon Capture and Storage (CCS) Retrofit Thermal Efficiency
Subcritical coal technologies with CCS retrofit were reported to have only slightly lower
thermal efficiency values compared with new build supercritical technologies with CCS in
the AETA 2012 Model This was an oversight in the AETA 2012 Model
The AETA 2012 report identified the thermal efficiency to retrofit subcritical brown and
black coal plants as 216 per cent and 301 per cent respectively (Table 312) In the same
table the efficiency for new build supercritical brown and black coal plants is reported to be
208 per cent and 314 per cent respectively
The thermal efficiencies were revised down based on actual operating efficiencies of existing
coal facilities in Victoria and NSW and factored based on the thermal efficiency ratio of new
coal facilities with and without CCS
A reduction in thermal efficiency is to be expected when applying a retrofit CCS to the plant
The CCS factor in the following representation refers the efficiency reduction factors for
adding CCS to a coal fired power station The useful output will reduce from the new
parasitic loads to run the CCS equipment
Thermal efficiency of existing brown coal plant in Victoria is 265 per cent and the CCS
factor is 064 Similarly the thermal efficiency of existing bituminous coal plant in NSW is
355 per cent and the CCS factor is 075
Table 311 and 312 of the AETA 2012 report show a reduction is present when comparing
the supercritical with no CCS compared to supercritical with CCS However the retrofit case
was only provided for the subcritical technology only and no case was included in the AETA
2012 for a subcritical plant with any CCS
A review of the values in Table 312 through comparison to the existing efficiency of
installed black and brown coal fleet in Australia was undertaken For brown coal the current
18
sent out thermal efficiency is 265 per cent for a 500 MW subcritical unit For supercritical
brown coal without CCS the sent out efficiency is 323 per cent Applying the same reduction
factor the thermal efficiency with CCS retrofitted should be 17 per cent in lieu of 216 per
cent as published in AETA 2012 report
For black coal the current sent out thermal efficiency is 355 per cent for a 660 MW
subcritical unit For supercritical black coal without CCS the sent out efficiency is 419 per
cent Applying the same reduction factor the thermal efficiency with CCS retrofitted should
be 266 per cent in lieu of 301 per cent as published AETA 2012 report (Table 2)
Table 2 Model Changes CCS Retrofit Thermal Technologies
AETA 2012 report reference AETA 2012 model value AETA 2013 update
Technology 8 Pulverised coal subcritical plant
with post combustion CCS based on brown coal
(retrofit)
Thermal Efficiency
216
170
Technology 12 Pulverised coal subcritical plant
with post combustion CCS based on bituminous
coal (retrofit)
Thermal Efficiency
301
266
19
213 Amortisation period
There was stakeholder consensus that the operating period for all technologies needs to be set
to thirty years and that the construction time is in addition to the operating time The financial
amortisation period is common for all technologies and is set at 30 years In the AETA 2012
model section 24 (a) nominates that the amortisation period of 30 years is from the
commencement of construction The amortisation period has now been changed (Table 3)
Examples of the change are
Nuclear LWR ndash GW scale In AETA 2012 report amortisation period was 30 years inclusive
of construction and operation The amortisation period has now changed to 36 years (30
operating and 6 years construction)
Solar parabolic trough In AETA 2012 report amortisation period was 30 years inclusive of
construction and operation The amortisation period has now changed to 33 years (30
operating and 3 years construction)
Table 3 Model Changes amortisation period
AETA 2012 report reference AETA 2012 model value AETA 2013 update
Common Amortisation period
for construction and operation
Amortisation period for
operation includes
construction for all
technologies
Amortisation period for
operation to exclude
construction for all
technologies
22 No Carbon Pricing
For the 2013 AETA update the carbon price modifier has been set to zero per cent as the
base value for the results presented in this report with the effect of applying a zero carbon
price to all technologies throughout the study period to 2050 The AETA 2013 Model
however has the option of changing this parameter by the user
20
3 CONSIDERATION OF OTHER ISSUES
This section summarises the issues that were discussed during the AETA 2013 Model Update
with AETA stakeholders but have not led to a change in the model However these issues do
not cover the OampM costs considerations that are detailed in section 4
31 Representation of Uncertainty
The recognition of uncertainty within the model was discussed including both the level of
representation and potential uncertainties with respect to First-of-a-Kind and lsquoEarly Moverrsquo
Technologies
A number of factors were identified that lead to uncertainty in estimates ndash particularly for
emerging technologies For conventional coal and gas technologies even though the
technology is mature the addition of carbon capture introduces cost and performance
uncertainty Cost estimates have inherent uncertainty due to the market uncertainties and
unforeseeable technological developments and due to
- Volatility in equipment pricing
- Volatility in economic conditions (during post Global Financial Crisis) and
- Volatility in labour pricing due to ldquootherrdquo heavy construction projects in specific areas
For technologies where the costs are well understood it was considered that the error bars
should be reduced compared to immediate and emerging technologies and that the error bars
should be lower for technology costs in 2012 compared to later years
There is strong agreement from two key stakeholder submissions with all the factors causing
uncertainty that have been identified in AETA 2012 In particular the labour cost has varied
(increased) significantly due to large construction projects which have increased costs due to
a shortage of labour and a lower productivity due to less experienced personnel The
uncertainties provided in the AETA model are available on a per technology and a per
selected years basis BREE will consider whether or not to include more detail on
uncertainty by technology in the 2014 review of the model
32 Application of Learning Curves
It was raised during the consultation process that the AETA model revision could allow for
learning curve cost reduction assumptions to be altered by the end user This has not been
incorporated in the 2013 update as it is a structural change to the AETA Model
Stakeholders also raised the question as to whether it is possible within the application of
learning curves to distinguish between the potential for cost reductions on manufactured
components like PV panels versus the Balance of Project (BoP) costs which may involve
routine assembly and erection activities which are not subject to significant learning by
doing
However there are opportunities for cost reductions particularly where many repetitive tasks
are involved such as solar field construction modular construction techniques
rationalization of components in the BoP design or reduction in assembly or placement time
21
This is supported in the US Solar Market Insight Report 2012 (Kann 2012) which identified
continued savings in inverter and racking costs as follows
ldquohellip falling equipment costs and fine-tuning of installation practices have made large-
scale solar less expensive QQrdquo
ldquohellip with the continuing maturation of the industry we expect continued focus on
reducing PV balance-of-systems costs (BOS) and that the increased worry over high
penetration PV will drive adoption of 1000Vdc and advanced inverters
respectivelyrdquo and
ldquoMounting structure manufacturers noted that the past year has seen tremendous
pricing pressure accounting for price declines of anywhere between 10 per cent and
30 per cent over the past yearrdquo
Given that the balance of plant costs can also be subject to cost reductions it is not
considered necessary to distinguish learning curves for discrete project costs in the model
33 General Costs Considerations
331 Fuel Costs
The outlook for fuel costs for gas coal and carbon was claimed to have materially shifted
since the AETA 2012 model While there was no evidence provided to support this
consideration will be given to this issue in the 2014 model update
332 CCS Costs
A submission cited the ZeroGen Case Study and sought to clarify the differences in CCS
cost between ZeroGen and lower values estimated for AETA 2012 This is a valid
comparison however BREE notes the following issues which contribute to explaining the
differences The international cost component is as follows AETA 52 per cent ZeroGen 34
per cent With the USD exchange rate AETA 1 ZeroGen at 08 adjusting the AETA value
for exchange rate variation would add A$952kWnet to the AETA value There is a
difference in plant size with AETA at 557 MW net and Zerogen 400 MW net A bigger plant
size would typically provide a lower cost kW installed
Additionally section 112 of Chapter One of the ZeroGen report advises escalation based on
project delivery from 2011 to 2017 AETA costs are for 2012 basis and do not include
escalation beyond this time A portion of the Zerogen costs will be inflated over the
comparable AETA cost Also section 113 of Chapter One of the ZeroGen report identifies
significant enabling works This is likely to be more inclusive than considered in the AETA
2012 report as identified in section 23 (a)
Overall it is considered likely that a number of estimate basis items in the ZeroGen study are
different and once equalised will show a smaller difference between the AETA and
ZeroGen values Therefore there is no immediate action but the basis and assumptions of the
model may be reviewed during 2014 AETA update
With regard to CCS efficiency one submission proposed that the AETA estimates were
overly optimistic However no references were cited to support this view and no change has
been made to the model
22
333 Opportunity Costs
A submission was made that footnotes be included regarding retrofit costs to indicate that
make-up power costs are not included This was not adopted because AETA parameters for
each technology are calculated for that technology alone and do not consider the impact of
reduced output of a retrofit project where additional output needs to be generated from
alternate higher cost generation Opportunity costs are specifically related to business cases
for specific projects and are not considered for any cases presented in the AETA report
Moreover retrofitting does not make electricity generation uncertain or intermittent It only
lowers the flow of generation at a constant rate (due to lower thermal efficiency) relative to
the non-retrofit case
34 Capital and Construction Costs
A submission was made to update the AETA values for the mid-point capital cost for several
technologies based on a study provided in support of the submission The technologies
asserted were
IGCC (Integrated Gasification and Combined Cycle) with 90 per cent capture fuelled
with Victorian brown coal
IGCC with no capture fuelled with black coal
IGCC with 90 per cent capture fuelled with black coal
Pulverised Fuel power plant with 90 per cent capture fuelled with Victorian brown
coal
Pulverised Fuel power plant with 90 per cent capture fuelled with black coal and
OCGT with no capture fuelled with natural gas
There is a key difference in the magnitude of the labour component in Australia compared
with the labour costs associated with the supporting material (from the USA) While no
changes have been made to the model in this update the ldquoshort termrdquo impact of labour
pricing on technology costs may be considered in further updates
Similarly it was submitted that the capital cost values for combined Cycle Gas Turbine
(CCGT) (with and without capture) could be revised As no documentary evidence was
provided to support this no change was made
For Direct Injection Coal Emulsion (DICE) power plant with no capture fuelled with
Victorian brown coal it is also suggested that the values be reviewed with a number of
papers provided for reference However these papers do not address capital cost in any depth
and it is unclear if the balance of project costs included are comparable with AETA DICE
technology is not mature and is probably best described as in the demonstration to
deployment phase of development which brings uncertainty into the cost analysis Therefore
data is needed to substantiate this submission As this was not available at the time of
preparing this report consideration of this issue is deferred to a later time when the necessary
data is available
An increase in the capital costs for Solar thermal trough (6 hrs storage) and Solar thermal
central receiver (6 hours storage) were proposed based on a supporting study by the Electric
Power Research institute (EPRI) The proposed values are substantially larger than the AETA
23
2012 but it is not clear what basis is used to generate these revised values A separate
submission received from another AETA stakeholder has supported the AETA values
Additionally the cited reference for solar thermal trough the Energy Power Research
Institute (EPRI) plant configuration is based on air cooling ndash while for AETA the plant
configuration assumes water cooling The difference in plant configuration will account for a
small part of the difference The AETA value is based on a reference report as issued in 2012
by the US National Renewable Energy Laboratory (NREL 2012)
The AETA value for the central receiver technology is based on a small (20MW) plant
(Gemasolar) with factors for adjustment to field size for thermal storage capacity and post
FOAK learning These factors will align with increased uncertainty in the AETA value It is
likely that additional cost information may now be available for the Brightsource Ivanpah
plant (no storage) and other tower plants being considered under construction
Further investigation of these issues has been sought with stakeholders but is as yet
unavailable
Another suggestion was made to consider capital costs on a component basis The capital
costs used in AETA 2012 for existing technologies were based on actual costs that could be
sourced on published documents (locally andor internationally) or from WorleyParsons
internal data For developing technologies costs were not considered on a component level
For this reason in technologies that are not commercialised a number of assumptions would
need to be made which may limit lsquorealrsquo costs being available No change to the model arose
from this submission
A reassessment of the construction expenditure profile for concentrating solar power (CSP)
technology options was sought in another stakeholder submission and supported by a
referenced report (IT Power 2012) However the plant sizes considered in the AETA report
are larger capacity (100 MW+) than those discussed in the cited report and consequently
have a longer duration construction period As three years is considered to be an appropriate
time period to spread the construction expenditure profile no change to the model was made
35 Costs Associated with Solar Technologies
A change to the model was sought with regard to the significant downward trends in the cost
of solar PV The stakeholder submission cited pricing data from the Australian Photovoltaic
Institute (APVI) Consultation with the APVI identified that evidence based information for
utility scale PV costs in Australia is limited because Australia has no PV systems 100 MW or
larger It is acknowledged however that there is significant and continued volatility in the
solar PV market including volatility due to competition oversupply in the PV module
market as well as continued price reductions for balance of system and installation costs
A$338 Wnet was a reasonable valuation for 2012 AETA The AETA 2012 value will be
maintained but may be reviewed in the 2014 model update
It was also suggested that solar thermal costs could be better represented in the model by
allowing for different periods of storage rather than a standard 6 hours The AETA 2012
scope was based on fixed plant designs which included fixed thermal storage sizing where
thermal storage was included With thermal storage there are a number of variables that can
be considered including differing field sizes (solar multiple) as well as actual thermal storage
capacities This is likely to add significant complexity to the report and to the model the
benefit of which at this stage does not warrant the changes
24
36 Costs Associated with Nuclear Technologies
It was submitted that consideration be given to including the impact on LCOE for nuclear
technology of the relatively high insurance costs for nuclear technologies This issue will be
considered in the 2014 review of the AETA model However insurance costs or plant
decommissioning costs are not considered for any of the 40 AETA technologies
Also the OampM improvement rate for Nuclear was not reconsidered as there is no OampM
improvement rate for Nuclear in the model
37 Further Technologies
A proposal was received which recommended that further technologies (DICE power plant
based on black coal with and without capture and DICE brown coal with capture and
medium speed DICE technologies) be incorporated into the AETA Model However as
mentioned earlier this update of the AETA 2012 Model only considered the technologies
included in that model This update of the model is not intended to broaden the technologies
38 Auxiliary Loads
Another example used for the purposes of drawing comparisons with the AETA model was
the SaskPower Post Combustion Retrofit It is difficult to distil the SaskPower project data
into a direct comparison with the AETA study and consequently there is insufficient data
certainty to warrant changes to the AETA 2012 values The SaskPower Post Combustion
Retrofit was also cited as to its conservative auxiliary loads for brown and black coal
However upon further investigation this was not substantiated within the SaskPower
example
25
4 WIND PV AND CSP OPERATIONS AND MAINTENANCE (OampM) COST UPDATE
41 Operation and Maintenance Costs
OPERATING AND MAINTENANCE COST DEFINITIONS
In considering the costing of OampM there is no absolutely clear definition of which costs
should be considered as fixed and which variable with the breakdown varying based on a
range of issues including technology location and resource type For this reason in the future
AETA reports OampM costs may be compared in terms of annual total operating expenditure
(OPEX) per MW of generation This method is widely used by most international institutions
to analyse OampM costs and to avoid subjective considerations
For this report fixed and variable costs are reported to provide direct comparison with AETA
2012 In this regard in general fixed costs are independent of the electrical generation of the
plant and are expressed as annual cost per MW capacity Fixed costs include items such as
fixed labour
equipment and
vehicles
Variable costs are proportional to the electrical generation of the Plant and are expressed as
cost rate per kWh energy output Variable costs include items such as
variable labour
consumables and
spare parts
As both public and private domain material vary in the way they approach and report on
fixed and variable maintenance within the following text where an interpretation has been
used for comparison purposes this is described
A submission was made to remove the operations and maintenance (OampM) cost escalation
factors This was not taken up as there is an increase in the OampM costs over CPI which is
borne out historically A review of the basis for this escalation determined that the
underlying assumptions were appropriate The review also considered adopting a generic
learning curve approach for OampM improvement rates as was suggested in one submission
This was not adopted as the model has an OampM improvement rate (set at 02 per cent per
annum) which can be varied by the user for wind and solar technologies This value accounts
for more efficient practices balancing the increase in labour and material costs over and
above CPI However changes to OampM improvement rates for selected technologies were
made as mentioned earlier OampM improvement rate values may be further considered for
emerging technologies in 2014 AETA study
A number of submissions referred to the improvement rate of OampM costs with evidence for
existing technologies to support these rising at 150 per cent CPI It was suggested that for
26
developing technologies it could reasonably be assumed that there would be reductions in
OampM between the first commercial installation and subsequent installations
While it is generally acknowledged that the LCOE of delivered energy from wind is falling
within the literature there is conflicting evidence around trends in OampM costs with recent
reports indicating both significant decreases and increases in OampM (see section 432)
Solar thermal plants consist of technology components that can be considered mature (eg
steam turbine) and components that are undergoing further development such as the solar
field and thermal storage Solar thermal plants require manning for operation as opposed to
wind turbines that do not require the same level of manning
A recent article (Muirhead 2013) advised for the Solar Energy Generating Systems (SEGS)
plants in California that have been operating since the early 1990rsquos ldquoMy understanding is
that the performance of the SEGS plants has significantly improved over time This is due
primarily to replacement of first generation receivers with newer receivers that are much
more efficient OampM practices at the plants have also improved over time based on the now
long history of operating these plants resulting in increased output in addition to reduced
OampM costs
In the AEMO report 100 Per Cent Renewables Study - Draft Modelling Outcomes Scenario 1
assumes that rapid technology transformation will drive real reductions in OampM costs
outweighing any increases projected in the AETA 2012 so OampM costs reduce by 125 per
cent by 2030 and 25 per cent by 2050 Scenario 2 uses the AETA 2012 assumption that
OampM costs escalate at around 150 per cent of Consumer Price Index (CPI) which leads to
cost increases of 27 per cent by 2030 and 46 per cent by 2050 It should be noted that the
Scenario 1 reductions are assumptions without further analysis of what will bring the
assumptions to fruition
In AETA 2012 the common OampM improvement rate for most technologies is set at 02 per
cent and can be varied as a user input The OampM improvement rate for emerging
technologies solar thermal and photovoltaic technology options and offshore wind is set to
25 per cent and can also be varied as a user input The improvement rate is now compounds
on the previous yearrsquos value
The OampM improvement rate values may be further considered for emerging technologies in
2014 AETA study
42 Operating and Maintenance (OampM) Changes in summary
As part of the Model Update special emphasis was placed in this report on the Operational
and Maintenance (OampM) costs and OampM improvement rates for all wind solar thermal and
solar PV renewable technologies covered in AETA 2012 As mentioned earlier this took into
account relevant Australian and international reports public domain information private
sources as well BREE and WorleyParsonsrsquo in-house experience The updated OampM values
are shown in Table 4 Reductions in CSP OampM costs of between 8 per cent and 27 per cent
were obtained in comparison to values provide in AETA 2012 report
The review included a detailed review of a report by IT Power cited as part of one of the
stakeholder submissions In that report reference is made to a case where $18MWh of OampM
costs comes from 64MW trough plant however it does not specify the relevant location hour
27
of thermal energy storage (TES) capacity factor type of cooling and back-up fuel and
therefore cannot be fully analysed nor used towards this AETA update
OampM costs for solar thermal plants are significantly affected by the costs of manpower To
demonstrate this with an example $18MWh for a 100MW plant with a 23 per cent capacity
factor (the IT Power report consideration) would result in an annual OampM cost of
approximately $36 million A 100MW plant will need at least 28 full time employees to be
properly manned 7 daysweek as there needs to be multiple shifts With this amount of
labour there are insufficient funds for site services utilities and materialsmaintenance If the
value is based on another location such as the Far or the Middle East region where labour
costs are significantly lower then a lower OampM cost may be feasible however for Australia
this does not appear to be feasible
The changes to OampM values for the 2013 AETA model refresh are summarised below
Table 4 Model Changes OampM costs
AETA 2012 report reference AETA 2012 model value AETA 2013 update
Section 23 Technical Assumptions
Operating and Maintenance Cost
Estimates
OampM improvement rate 02per
cent all technologies
OampM improvement rate maintained at
02per cent for
Coal based technology options
Gas based technology options
Solar thermal hybrid options
Onshore wind
Biomass technology options
Wave technology options
Geothermal technology options
Nuclear technology options
OampM improvement rate changed to 25per
cent for
Solar thermal technology options
Photovoltaic technology options
Offshore wind
The OampM improvement rate is compounded
from the previous yearsrsquo value
Section 33 Solar thermal
technologies
Solar thermal - Parabolic Trough wo
storage
Fixed OampM (AUS$MWyear)
Variable OampM (AUS$MWh)
60000
15
59176
1519
Solar thermal - Parabolic Trough with
storage
Fixed OampM (AUS$MWyear)
Variable OampM (AUS$MWh)
65000
20
72381
1139
Solar thermal - central receiver
technology wo storage
28
AETA 2012 report reference AETA 2012 model value AETA 2013 update
Fixed OampM (AUS$MWyear)
Variable OampM (AUS$MWh)
70000
15
58285
707
Solar thermal - central receiver
technology with storage
Fixed OampM (AUS$MWyear)
Variable OampM (AUS$MWh)
60000
15
71312
565
Solar thermal - Linear Fresnel wo
storage
Fixed OampM (AUS$MWyear)
Variable OampM (AUS$MWh)
60000
1500
64105
1519
Solar thermal - Linear Fresnel with
storage
Fixed OampM (AUS$MWyear)
Variable OampM (AUS$MWh)
65000
20
72381
1139
Section 35 Photovoltaic
technologies
PV ndash non tracking
Fixed OampM (AUS$MWyear)
25000
25000 (no change)
PV - Single Axis Tracking
Fixed OampM (AUS$MWyear)
38000
30000
PV - Dual Axis Tracking
Fixed OampM (AUS$MWyear)
47000
39000
Section 36 Wind Technologies
Wind Onshore
Fixed OampM (AUS$MWyear)
Variable OampM (AUS$MWh)
40000
12
32500
10
Wind Offshore
Fixed OampM (AUS$MWyear)
Variable OampM (AUS$MWh)
80000
12
77600
30
43 Wind
431 Introduction
This Section reviews onshore and offshore wind operations and maintenance (OampM) costs
used in AETA 2012 The values scrutinised are the fixed and variable OampM given in Table
361 of that report summarised in Table 5 below
29
Table 5 Wind OampM costs used in the AETA 2012 report
Option Fixed OampM (AUS$MW) Variable OampM (AUS$MWh)
Onshore 40000 12
Offshore 80000 12
OampM covers all of the services required to keep the wind farm operating as contracted to
supply energy and renewable energy certificates for its lifetime inclusive of
turbines and all balance of plant (roads buildings electrical equipment SCADA
control equipment) up to the high voltage connection point on the wind farm
substation
labour (both trades and professional)
facilities (workshops stores offices)
equipment (tools jigs vehicles rigging safety equipment craneage)
spare parts and
consumables (such as oil grease and office consumables)
Windfarm size was not specified in AETA 2012 however it was noted that wind farms
greater than 100MW are becoming more common Since then within Australia wind farms
of larger and smaller sizes have been constructed for example the 420 MW Macarthur Wind
Farm in Victoria and the 55 MW Mumbida Wind Farm in Western Australia with both larger
and smaller wind farms under proposal For this review a nominal size of 100-150 MW is
used as representative of current and future facilities
432 Review of Evidence
As mentioned earlier the review of public literature by BREE and WorleyParsons the
procurement of private studies consultations with owneroperators in the wind farm OampM
sector in Australia AETA Stakeholders and project Steering Committee members were used
to assist the current Model Update process Where possible these sources are noted in the
text however some of these sources have asked to remain anonymous and where so the
term ldquoprivate sourcerdquo has been used
As noted by one reviewer in NREL 2011 OampM cost information in the public domain in
both quantum and quality is poor and the situation appears no better in 2013 particularly in
the discrimination of fixed and variable costs One reason for this is the commercial and
increasingly competitive nature of the sector with wind farm OampM now a significant
business worldwide with subsequent confidentiality around actual costs
What constitutes wind farm OampM is also changing This is driven in part by technological
change as the wind fleet ages as new turbines become larger and more sophisticated
particularly offshore Competition in the provision of OampM services is also changing with
maturing of the wind energy product As an example the following industry trends are now
evident
30
a growing role of independents in the wind OampM market ndash around 25 per cent of the
wind fleet in the US is expected to be operated and maintained by independents by
2025 (Ebert and Ware 2013) as opposed to original equipment manufacturers (OEMs) -
wind is largely a commodity market and easier for new participants to enter something
not necessarily seen with other generation technologies
tighter supply markets ndash general economic volatility is tightening the supply and
project development chain for wind moving interest into the OampM sector bringing
price volatility and more competition
a more sophisticated asset management model ndash where OampM providers are linking
operational data with long term condition monitoring output forecasting and work
order scheduling to deliver what is termed ldquolifecycle optimisationrdquo squeezing more
energy out of the asset
older turbines exceeding planned maintenance budgets ndash with the chief issue being
keeping the variable OampM from unforeseen breakdowns
a push for larger turbines particularly offshore (5-10 MW) and in deeper waters and
linking OampM to turbine contracts ndash there is evidence (including in Australia private
source) that wind farm OampM is becoming an even more significant bargaining
component of turbine supply contracts where lower supply costs are balanced by
longer OampM contracts
Costs of wind OampM are difficult to summarise as they are dependent on many issues As just
one example in the NREL 2011 study cited earlier a wide variability in wind farm OampM
costs was found across a range of countries (Figure 1) This reference demonstrates this
variability from the average reference case in terms of Levelised Cost of Energy (LCOE)
31
Figure 1 Effect of country variables on LCOE of wind plant
Source NREL (2011)
Other issues which affect the contracted cost of OampM for wind include
regional variations in labour and transport costs
wind farm environment particularly wind regime and proximity to the ocean
(corrosion)
the maturity and availability of wind turbine technicians
the spread of facilities geographically and the wind farm asset sizes in a portfolio
the turbine type and brand particularly the support establishment within a Region
the age of the asset OampM history and existence of Type (or systematic) failures of
major components
the ability of the OampM provider under the contract to source third party spares andor
try varied maintenance practices and
the nature of the OampM contract ndash for example does it include risk reward elements or
have a link to the wind turbine supply contract or is it a ldquoproduction availabilityrdquo
contract type
While it is generally acknowledged that the LCOE of delivered energy is falling for wind
technology (Hand 2013) within the literature there is conflicting evidence around trends in
OampM costs with recent reports indicating both significant decreases (BNEF 2013) and
increases (Ebert and Ware 2013) It is generally acknowledged that increased competition in
the OampM market is delivering lower cost service provision but this may in part be offset by
an ageing fleet requiring more variable maintenance and a more sophisticated and costly
32
response Several studies have demonstrated that the costs of maintaining wind turbines
generally increase with time following a trend similar in shape to that in Figure 2 (Hand
2013) with estimates in Albers (2009) indicating a doubling in turbine OampM costs by mid
plant life The term COD in Figure 2 refers to commercial operations date
Figure 2 Typical cost increasing trends in wind farm OampM costs with commercial operations
date
Source Adapted by WorleyParsons from Houston (2013)
In Australia this trend is also evident in post 10-year aged machines (private source)
particularly in relation to variable maintenance The nature of any similar increase with more
modern turbines is unpredictable although turbine availability is improving and there is
evidence that OampM costs with each generation of turbine are lowering see Wiser et al
(2012)
The OampM costs for offshore wind farms are particularly difficult to estimate as the industry
is still at the early stages of development including the progression of much larger turbines
into deeper water and the more complex nature of the task Such progression is indicated in
Figure 3 taken from RolandBerger (2013) which indicates an expected decrease in OampM
costs These costs are of the same order of that published in other recent publications UK
Crown Estate (2012) and US DoE (2013)
33
Figure 3 Trends in offshore wind farms and estimated impact on LCOE
Source RolandBerger (2013)
433 Updated OampM Figures for Australia
It is not a simple matter to transfer international costs to Australia as despite trends there are
significant differences between regions including
size of market ndash despite growth the Australian wind market is small with respect to
other world regions For example the total wind fleet is 4 GW (CEC 2013) for
Australia versus 60 GW for the US (AWEA 2013)
labour and material rates in certain parts of Australia are high by world standards
the logistics of getting to and within Australia generally involve longer distances than
other areas of the world particularly due to the remoteness from major equipment
suppliers
volatility of the Australian dollar particularly against the US and
the size of Australian wind farms tends to be larger
These differences can be seen in Figure 4 supplied by a turbine equipment supplier (private
source) and showing the relative OampM costs (per MW) and technician numbers (per 100
MW) across various world regions in 2012 for wind turbine maintenance only and excluding
balance of plant Numbers and scales between the two indices have been removed to protect
the confidentiality of this supplier with data believed to cover the entire global portfolio
under management This shows a significant difference between regions for onshore in both
indices for example almost a 45 per cent difference in costs between Europe and America
Australia would sit within ldquoAsiaPacificrdquo and while the Figure indicates generally lower
OampM costs and higher technician numbers for this region this presumably covers a very
diverse area (including South East Asia New Zealand and Oceania) which may skew results
34
Unlike many larger global markets the wind OampM sector in Australia is dominated by
turbine equipment suppliers with original equipment manufacturer (OEM) contracts
estimated to cover more than 95 per cent of the fleet The evidence for this is mostly
anecdotal although a number of smaller independent suppliers are now known to be
undertaking full service OampM for older plant (gt10+ years) with many of the drivers for this
covered in Ebert et al (2013) There is also evidence (private source) that wind turbine
suppliers in Australia are seeking OampM contracts with much longer terms and tying these to
reductions in turbine supply prices This may indicate a lack of competitive pressure on
OampM pricing in the near to mid-term and as the size of the overall market is small it is
unknown whether independents will grow market share as has been the case in many larger
global markets see for example Deloitte amp Touche (2012)
The most recent contemporary literature comments on onshore wind farm OampM pricing in
Australia and surrounds that could be found in the public domain and not used for the AETA
2012 work are from Hassan (2011) and Deloitte (2011) These are summarised with other
new international references cited in Table 6 with assumptions on any conversions noted
below the table As no offshore wind farm projects have been progressed in Australia the
table includes values from new sources for offshore projects from the international public
domain literature - the significant difference to onshore costs is evident in the values
Figure 4 OampM Costs (per MW) and Technician Numbers (per 100MW) for total wind turbine
OampM (Opex)
Source Private - values and scales removed to protect confidentiality
From Table 6 and considering the differences in markets it appears that for onshore wind the
AETA 2012 estimates may be slightly high with an updated AETA 2013 recommendation
given in Table 7 This value has been arrived at by considering
the size of the Australian wind market and lack of competitive pressure from
independent OampM service providers
35
supply side pressures on OEMs driving them to protect their OampM businesses and
lowering costs
the likely increase in fleet installations to comply with RET legislation skewing the
fleet age to more a modern generation of turbines although it is noted that there is some
uncertainty around long term OampM cost trends particularly variable maintenance ndash an
asset age of around 5 years is assumed here
uncertainties in what is included in referenced values and differences in markets and
advice from actual asset owners and OampM providers (private sources) on current actual
costs
Table 6 Comparison of AETA 2012 wind OampM estimates with new references for 2013
Source Region
Fixed OampM
(AUS$MW)
Variable OampM
(AUS$MWh)
Total OPEX
(AUS$MW)
On
sh
ore
AETA 2012 Australia 40000 12 799451
Houston 2013 US - - 35-380002
BNEF 2013 Global - - 25000
3
Private Source (2013) (gt 10 yr old
plant) Australia - - 70000
Private Source (2013)
(lt 2 yr old out of warranty plant) Australia - - 55000
Hassan 2011 Australia - - 83-99000
4
Deloitte 2011 New Zealand - - 450005
Off
sh
ore
AETA 2012 Australia 80000 12 1262526
Crown Estate 2012 UK - - 275000
7
Hassan (2013) UK - - 2391567
RolandBerger 2013 Europe - - 198000
8
US DoE 2013 US - - 144970
9
1 Assumes a 38 capacity factor
2 USAUD = 109 extrapolated from Figure approximately to 2013
3 EUROAUD = 142 uncertain if this includes all balance of plant or VOM and only includes OEM providers
4 Assumes a 38 capacity factor
5 Assumes NZAUD = 084 a 38 capacity factor and the mid-range estimate for OampM
6 Assumes a 44 capacity factor
7 Assumes GBPAUD = 167 and taking midpoint of estimates stated
8 Assumes GBPAUD = 167 and taking value for 3MW turbines
9 Assumes USAUD = 109
36
The figures shown for onshore projects in Table 7 represent a 15 per cent decrease in the
expected OampM costs of wind farms in Australia compared to AETA 2012 This change
reflects the volatility in this market noted in previous sections and in referenced material
internationally plus the appearance of significant downward pressure on wind OampM prices
primarily through increased global competition The values allow for the rising price of
turbine OampM as the turbine ages during its life
For offshore wind it appears that the OampM costs in AETA 2012 are too low and although it
is tempting to align costs with the most recent US figures due to their lower costs and similar
coastal conditions to Australia the European offshore fleet is significantly larger and more
mature Average figures across the 2013 referenced material including Europe is
recommended This is also shown in Table 7 and represents a significant increase in estimate
costs (around 33per cent) which reflects this evolving sector
There is very little contemporary information available on the breakdown of fixed and
variable maintenance on wind plant making judgment around this for the AETA requirements
is difficult However there is some published but copyrighted material eg GlobalData 2012
which combined with others (private sources) indicates that for onshore and offshore wind
plant respectively a 5050 and 4060 FOM VOM split is appropriate This has been used to
adjust the total OPEX figure in Table 7 to the AETA scheduled and variable indices
requirements using a 38 per cent and a 44 per cent capacity factor for onshore and offshore
projects respectively
Table 7 Recommended AETA (2013) values
AETA (2013) update Fixed OampM
(AUS$MW)
Variable OampM
(AUS$MWh)
Total OPEX
(AUS$MW)
Onshore $32500 $10 $65790
Offshore $77600 $30 $194000
44 Solar Photovoltaics (PV)
441 Introduction
This Section of the report focuses on the OampM costs for ground-mount photovoltaic (PV)
technologies broken down by the following mounting system configurations
Fixed Tilt (FT)
Single Axis Tracking (SAT)
Dual Axis Tracking (DAT)
Although different PV panel technology types (eg poly-crystalline mono-crystalline or thin
film CdTe) affect the capacity factor and land use the OampM costs are comparable The
estimates for this Report are based on polycrystalline PV technology which provides an
average cost on a per Watt basis with mono-crystalline OampM costs being slightly lower and
thin film OampM costs being slightly higher
With the aim to provide comparable results between technologies WorleyParsons has
analysed and updated the PV OampM costs in terms of both fixed operation and maintenance
37
costs (FOM) and total operating expenditures (OPEX) based on reference plants of similar
characteristics
Assumptions interpretations and considerations based on their in-house data and global
market trends are described in the following Sections
442 Review of the Evidence
Since the AETA 2012 report release few new public domain reports related to OampM costs
for PV systems have been published To confirm this the following organisations have been
consulted by WorleyParsons to provide the 2013 OampM costs update for the selected PV
configurations
International Renewable Energy Agency (IRENA) (wwwirenaorg)
International Energy Agency (IEA) (wwwieaorg)
The World Bank (WB) (wwwworldbankorg)
The US National Renewable Energy Laboratory (NREL) (wwwnrelgov)
Solar Energy Industries Association (SEIA) (wwwseiaorgau)
European Photovoltaic Industry Association (EPIA) (wwwepiaorg) and
Solar Electric Power Association (SEPA) (wwwsolarelectricpowerorg)
Upon review of the available information when compared to AETA 2012 the listed
organisations do not have any new public information related to large-scale PV OampM costs
If OampM costs are mentioned they are normally referenced as a per cent of the total Capital
Expenditure (CAPEX) for the plant (around 1 per cent) and provide little useful information
about OampM Cost changes
Due to insufficient detailed and recent information in the public domain WorleyParsons
obtained the following market reports from Photon a private organisation focused on market
news political discussions and technology analysis for the PV industry
Photon 2013 ldquoThe True Cost of Solar Power - Temple of Doomrdquo and
Photon 2013 ldquoSolar Annual 2013 - Build your Empirerdquo
These private reports had minimal focus on OampM costs To provide further input in this
area private OampM service providers were contacted for pricing estimates and market trends
443 AETA 2012 OampM PV costs report comparison
Typical power plant OampM costs are expressed as a combination of a variable component
(proportional to generation) and a fixed component (occurs irrespective of generated output)
Since the generation of a PV plant is dependent on solar radiation (not requiring fossil fuel or
water which make up the major components of variable costs for conventional generation) it
is typical to express the OampM costs only as Fixed OampM (FOM) costs proportional to the
plant size due to the simplicity of PV systems The AETA 2012 report follows this practice
and estimates the PV OampM costs as FOM only relative to plant size (kW) expressed on a per
year basis
38
In order to facilitate comparisons of these costs with other electricity technologies the FOM
costs in the AETA 2012 report are also presented as OPEX costs per MW of generating
capacity per year
ASSUMPTIONS AND CONSIDERATIONS
The following costs are included in the FOM estimates as an annual cost per kW capacity
labor and administrative expenses
panel washing (twice per year at $300 kl for water)
weed abatement (seasonal herbicide applications)
inverter replacement reserve (replaced at operational year 10) and
materials and maintenance spare parts civil works preventative and corrective
equipment maintenance
Although the cost of water is variable depending on location and usage it is such a small
portion of the total OampM costs that it is adequate to assume it as a fixed cost using the
assumptions listed above
AETA 2012 PV OampM COSTS COMPARISON REPORT
The technical characteristics of the reference PV plants used in the AETA 2012 report have
been extracted from the AETA 2012 Model (Version 1_0 Rev B BREE 2012) and are
summarised in Table 8
Based on this information the following parameters for the PV technologies are estimated
Total net energy production in terms of MWh sent out per year
Total plant acreage
FOM in terms of USD per year and
Total OPEX costs in terms of USD per year and USD per total net energy production
per year
39
Table 8 AETA 2012 reference plants technical characteristics and OPEX costs
Plant Characteristics Units Fixed Tilt (FT) Single Axis Tracking (SAT)
Dual Axis Tracking (DAT)
Plant Characteristics
Plant Net Capacity MW 100 100 100
Capacity Factor per cent 21 24 26
FOM $kWyear 25 38 47
Net Energy MWhyear 183960 210240 227760
Plant Acreage acres 500 800 900
Total FOM $year 2500000 3800000 4700000
Total OPEX $year 2500000 3800000 4700000
Total OPEX $kWh 00136 00181 00206
Total OPEX costs are between 00136 and 00206 USDkWh as shown in Table 8 above
These values are conservative cost estimates but reasonable for a large-scale PV plant with
comprehensive OampM service As is expected the FOM or OPEX costs increase as the plant
footprint increases and the complexity of the mounting system increases However the
increases to single and double axis tracking technologies are larger than would be expected
The increased complexity of the trackers does add costs to OampM in terms of labor parts and
even physical plant size but these additions are minor in comparison to the larger OampM
budget items such as the inverter replacement reserve and general electrical maintenance
which are irrespective of mounting system
These values although conservative still show the cost reductions from the industry learning
curve and expanded competition over the past few years when compared to past estimates of
OampM costs This can be seen in the following Table 9 of Fixed Tilt (FT) costs which
provides some estimates found in previous publications by IEA (2008) and EPRI (2010) The
tracking estimates are not shown since minimal data is available This corresponds to the
historical market trend of the industry being more willing to install fixed tilt systems rather
than tracking systems due to lower costs and technology risk
Table 9 Comparison of historical estimated PV and OampM costs in the public domain
PV Configuration OampM Costs Units IEA 200810
EPRI 2010 AETA 2012
Fixed Tilt (FT) FOM $kWyear 40 32 to 37 25
values in Italics are derived from reported data
10
Report assumed 1 of capital costs and 23 capacity factor
40
45 AETA 2013 PV OampM Costs Update
Using the same plant characteristic assumptions as the 2012 AETA Model the 2013 OampM
costs were estimated by WorleyParsons based on the references described in review of the
evidence in Section 442 The comparison of the AETA 2013 and 2012 OampM costs are
presented in Table 10 below
Table 10 2013 PV OampM costs compared to 2012 PV OampM costs PV Configuration OampM Costs Units AETA 2012 WorleyParsons
2013 Update
Fixed Tilt (FT) FOM $kWyear 25 25
OPEX $kWh 00136 00134
Single Axis Tracking (SAT) FOM $kWyear 38 30
OPEX $kWh 00181 00141
Dual Axis Tracking (DAT) FOM $kWyear 47 39
OPEX $kWh 00206 00173
Although the OampM costs for FT systems are approximately the same SAT and DAT OampM
costs reduced by around 20-30 per cent in this 2013 update compared to the AETA 2012
report The consistency of the FT costs is reasonable and expected to continue for the next
few years as discussed further in Section 451
Regarding the SAT and DAT costs although there have been improvements in the design of
trackers for PV applications this OampM cost reduction is due to a better understanding of the
costs associated with electrical and tracking system maintenance The cost differences
between tracking systems was corroborated by quotes from private OampM service companies
who indicated that there was only a slight increase in costs from FT to SAT but a larger
increase in costs from SAT to DAT
As compared to the references mentioned in Section 442 the updated cost estimates are
conservative Table 11 compares the estimated 2013 OampM costs with those references
However since these publications focused primarily on the CAPEX with very general OampM
cost assumptions the OampM costs presented therein are not considered representative
baselines for large-scale solar projects Furthermore they attest to the industryrsquos tendency to
focus strictly on installation costs and not lifecycle costs which is discussed further in Section
451
41
Table 11 2013 updated OampM costs compared to new referenced OampM costs (7-2) PV Configuration
OampM Costs
Units WorleyParsons 2013 Update
11
NREL 2013
12
IRENA 2013a
13
Photon 2013
14
Private OampM Service Providers
201315
Fixed Tilt (FT) FOM $kWyear 25 235 17 to 21 18 17 to 23
OPEX $kWh 00134 00216 to
00383
00121 to 00266
00098 00094 to 00127
Single Axis Tracking (SAT)
FOM $kWyear 30 Not provided
Not provided
Not provided
25 to 27
OPEX $kWh 00141 Not provided
Not provided
Not provided
00136 to 00147
Dual Axis Tracking (DAT)
FOM $kWyear 39 Not provided
Not provided
Not provided
32 to 34
OPEX $kWh 00173 Not provided
Not provided
Not provided
00174 to 00185
values in Italics are derived from reported data
451 OampM Learning Rates
In the rapid PV industry growth of the last three years WorleyParsons and anecdotal
experience is that PV was considered generally to require little to no maintenance causing a
general disregard for OampM planning This appears to have resulted in complications as
owners struggle to resolve reliability performance and budget issues as the projects mature
(multiple private sources) Although the maintenance costs are smaller compared to standard
power plants OampM awareness has been increasing in the industry and therefore the OampM
cost estimates have subsequently increased
This is supported through the recent focus of OampM at PV conferences (such as Sandia
National Laboratory and Solar Energy International events) on increasing the investment in
OampM practices in addition to improving the current practices products and services so that
PV plants can be better maintained to achieve higher reliability throughout the plant life
cycle Currently the majority of OampM expenses for PV systems consist of maintaining and
replacing the inverters followed by the Balance of System maintenance In general once the
appropriate level of investment in OampM for PV is reached then OampM costs will begin to
decrease as the following issues develop to maturity
technology improvement
inverter design for reliability and longevity
data monitoring for preventative and corrective maintenance support
system efficiency to increase system output for the same OampM expense
decreased capital costs for major equipment
decreased spare parts costs
11
See assumptions in Section 433 and 443 12
Report assumed 250kW rooftop at 7 to 10 capacity factor 13
Report assumed 1 of CAPEX and 9 to16 capacity factor 14
Values derived from the global weighted average calculations assuming 21 capacity factor and 20 year lifecycle Report assumed a
simple percentage of average selling price 15
Quote excluded weed abatement panel washing and inverter replacement reserve which were supplemented from the WP estimate
Calculations assumed 21 capacity factor
42
industry maturity and stability
reliable OEM support from product consistency and commercial stability
improved codes and standards for PV equipment system design installation
commissioning and OampM and
experience
trained and experienced personnel in the installation and maintenance of PV plants
In line with this trend owners system designers installers and OEMs are now including
OampM considerations in their finances designs services and products Even though there
have been and will continue to be cost reductions in OampM due to the industry maturation
stabilization and competition those cost reductions are balanced with the necessary
increases in OampM investment to meet the maintenance needs of existing and planned PV
plants resulting in a level OampM cost estimate for the next five years
Photon (2013) follows this assumption of consistent OampM costs for the next ten years as well
as WorleyParsons discussions with OampM service providers Therefore the assumption that
PV OampM costs will remain somewhat constant over the next five years before reducing again
appears to follow the projections in the industry
452 Conclusions - PV
The key findings from the AETA 2012 review and update of the PV OampM costs are as
follows
The 2013 WorleyParsons PV OampM costs update resulted in values of
$25kWyear for FT systems
$30kWyear for SAT
$39kWyear for SAT in 2012 USD
Fixed tilt configurations have not seen significant changes in OampM costs compared to
the 2012 AETA estimates while SAT and DAT configurations cost estimates have
reduced approximately 20-30 per cent based on a better understanding of the associated
OampM costs
Values obtained in the 2013 WorleyParsons update are more conservative but are
aligned with values provided by recognised international institutions even though few
detailed OampM breakdowns are available and
OampM costs for PV are expected to remain constant over the next five years before
reducing as the industry matures in both experience and long-term planning
capabilities
43
46 Concentrating Solar Power (CSP)
461 Introduction
This Section of the report focuses on the OampM costs for the following Concentrating Solar
Power (CSP) technologies
Parabolic Trough (PT)
Solar Tower (ST) and
Linear Fresnel (LF)
CSP OampM costs were analysed in terms of
Fixed Operating and Maintenance Costs (FOM)
Variable Operating and Maintenance Costs (VOM) and
Total Operating Expenditures (OPEX)
In order to arrive at comparable results between technologies BREE and WorleyParsons
estimated the OampM costs based on
Reference Plants with similar Solar Plant characteristics localisation net capacity
capacity factor hours of Thermal Energy Storage (TES) and type of cooling system(s)
and
Cost estimate amounts that were updated to 2012 USD
When information was not available necessary estimates were made using WorleyParsonsrsquo
in-house data and based on global market trends observed in various publications
462 Review of the evidence
The following international organisations were consulted to provide the AETA 2013 OampM
costs update for the selected CSP technologies
International Renewable Energy Agency (IRENA) (wwwirenaorg)
International Energy Agency (IEA) (wwwieaorg)
European Solar Thermal Electricity Association (ESTELA) (wwwestelarde)
The World Bank (WB) (wwwworldbankorg)
National Renewable Energy Laboratory (NREL) (wwwnrelgov)
Protermosolar (wwwprotermosolares)
Institute for Energy Diversification and Saving (IDEA) (wwwideaes)
Renovetec (wwwrenoveteces) and
CSP Today (wwwcsptodaycom)
The approach in reviewing OampM costs for the 2013 update for CSP technology was only to
use new sources of information published since the AETA 2012 report was written This was
44
maintained for all but the learning rates estimation which is due to the lack of any new
updated information published since 2012 in relation to this
Upon review of the available public domain information it was found that IEA ESTELA
WB Protermosolar Renovetec and IDEA do not have any new relevant public information
related to CSP OampM costs However IRENA 2013b IRENA 2013c and NREL 2012 are
new references from IRENA and NREL that are considered relevant and which were used in
this report
The information contained in these references did not provide updated costs for all of the
CSP technologies being considered in this Report and the values offered were not provided
in terms of FOM and VOM costs as preferred
Due to the lack of new relevant information in the public domain the AETA 2013 Model
Update process obtained reports from CSP Today a private international organisation
focused on news events reports updates and information for the CSP industry in markets
such as India South Africa Spain USA Chile and MENA regions The Update acquired the
last edition of PT and ST reports CSP Today 2012a and CSP Today 2012b for which OPEX
costs were analysed
463 AETA 2012 OampM CSP costs report comparison
Operating and Maintenance expenses were provided in terms of fixed and variable costs in
the AETA 2012 report and this Model Update has modified these for 2013 for PT ST and LF
technologies based on the references cited above and further consideration of learning rates
for the CSP industry
Most CSP projects with commercial operational experience are parabolic trough technology
as it is the most mature technology and currently more is reported and known about actual
costs than other CSP technologies Nevada Solar One as an example is a 64MWe parabolic
trough plant based in California which was commissioned in 2007 and it is the first plant
built after the SEGS development during the 1980-90s also in California
Andasol 1 the 50 MWe parabolic trough plant based in Spain is also the first CSP plant
worldwide to implement a commercial thermal energy storage system with a capacity of 75
hours of full load storage It commenced operation at the end of 2008 and other similar and
larger trough projects are now operating or being constructed
As the most mature CSP technology trough plant should be further down the operational and
design operability maturity path and hence have a lower opportunity for OampM cost
reductions through learning By contrast Solar Tower and Linear Fresnel systems are only
beginning to be deployed at larger scale and hence there is expected to be more potential to
reduce their capital and operating costs and improve performance
Learning rates have been argued by stakeholders as being very significant for CSP plant with
comments of the AETA 2012 report centring on this issue Disappointingly there is no new
published evidence or actual plant report data that could be found by the AETA stakeholders
and WorleyParsons to add to that used for the 2012 report There is however new evidence
on the reduction in LCOE for CSP technologies and WorleyParsons linked OPEX
contribution to these LCOE predictions so that a sense of future reductions could be made
This is outlined further in the following Sections
45
4631 ASSUMPTIONS AND CONSIDERATIONS
FOM and VOM Breakdown
The following costs are included in proceeding FOM cost estimates for CSP technologies as
an annual cost per MW capacity
Insurance
Labour costs and
Fixed service maintenance contracts
Similarly the following costs are included in the VOM cost estimates as a cost rate per MWh
of sent out energy
Material and maintenance costs spare parts equipment maintenance and unscheduled
inspections and
Utilities costs water auxiliary fuel and auxiliary power when applicable
Some items such as spare parts for scheduled maintenance could be considered FOM costs
However to simplify the comparison and to homogenise all of the analyses across
technologies all concepts related to plant material and maintenance were included in the
VOM costs
4632 AETA 2012 OampM CSP COSTS COMPARISON REPORT
The technical characteristics of the reference CSP Plants used in the AETA 2012 report have
been extracted from the AETA Model Version 1_0 (BREE 2012) and are summarised in
Table 12
Table 12 AETA 2012 Reference Plant Technical Characteristics
Plant
Characteristics
Units Parabolic
Trough
without
Storage
Parabolic
Trough
with
Storage
Solar
Tower
without
Storage
Solar
Tower
with
Storage
Linear
Fresnel
without
Storage
Linear
Fresnel
with
Storage
Plant Net Capacity MW 138 135 122 18 230 225
Location NA Unknown Unknown Unknown Unknown Unknown Unknown
Isolation kWhm2year Unknown Unknown Unknown Unknown Unknown Unknown
Hours of TES h - 7 - 6 - 6
Capacity Factor per cent 23 42 31 42 23 42
Type of Cooling NA Unknown Unknown Unknown Unknown Unknown Unknown
FOM $MWyear 60000 65000 70000 60000 65000 65000
VOM $MWh sent out 15 20 15 15 15 20
Based on the information above this Model Update estimated the following parameters for
the CSP technologies evaluated in this study
46
Total net energy production in terms of MWh delivered per year
FOM and VOM in terms of USD per year and
Total OPEX costs in terms of USD per year and USD per total net energy production
per year
The results are listed in Table 13 below Table 13 AETA 2012 OampM Opex costs on a per kWh basis
Plant
Characteristics
Units Parabolic
Trough
without
Storage
Parabolic
Trough
with
Storage
Solar
Tower
without
Storage
Solar
Tower
with
Storage
Linear
Fresnel
without
Storage
Linear
Fresnel
with
Storage
Plant Net Capacity MW 138 135 122 18 230 225
Net Energy sent out MWhyear 2780424 496692 3313032 662256 463404 827820
FOM $year 8280000 8775000 8540000 1080000 14950000 14625000
VOM $year 4170636 9933840 4969548 993384 6951060 16556400
OPEX $year 12450636 18708840 13509548 2073384 21901060 31181400
OPEX $kWh 00448 00377 00408 00313 00473 00377
FOM per cent 6650 4690 6321 5209 6826 4690
VOM per cent 3350 5310 3679 4791 3174 5310
The percentages of FOM and VOM costs as part of the total OPEX costs are presented in
Figure 5
Figure 5 AETA 2012 FOM and VOM Percentages of Total OPEX Costs
47
In Figure 5 FOM costs are in general terms significantly higher than VOM costs because
they include the higher cost items such as insurance labour costs and fixed service contracts
However as shown in the Figure VOM costs are higher or approximately equal to FOM
costs for technologies with energy storage given the criteria selected for the breakdown
between FOM costs and VOM costs FOM costs will remain relatively consistent from year-
to-year while VOM costs should be broken down even further since the costs of water
natural gas (if required) and electricity vary between locations and from one year to another
Total OPEX costs are expressed in terms of USD per total net energy production per year and
are between 00313 and 00473 USDkWh as listed in Table 13 These values are aligned
with the values provided by international institutions cited although they appear to be
somewhat inflated in comparison with those values that are closer to 0025 and 0035
USDkWh as published by others (eg IRENA)
4633 AETA 2013 OampM COSTS UPDATE
Similar Plant characteristics to AETA 2012 were considered for the appropriate comparison
of OampM costs for this update Plant characteristics include location net capacity capacity
factor hours of TES and type of cooling For this Report the characteristics of the reference
plants used are described in Table 14
Table 14 PT and ST Reference Plant Characteristics
Plant
characteristics
Units Parabolic
Trough without
Storage
Parabolic
Trough with
Storage
Solar Tower
without
Storage
Solar Tower
with Storage
Plant Net Capacity MW 100 100 100 100
Location NA MENA region MENA region MENA region MENA region
Isolation kWhm2year 2400 2400 2400 2400
Hours of TES h 0 6 0 6
Capacity Factor per cent 26 46 275 476
Type of Cooling NA Dry Dry Dry Dry
Source NA WorleyParsons CSP Today 2012a WorleyParsons CSP Today 2012b
The 2013 OampM costs were estimated using as a basis the information provided in the CSP
2012 reports (CSP 2012a and 2012 b) The following considerations were taken into account
the CSP Today reports only consider PT and ST plants with thermal storage
WorleyParsons made the following estimates based on experience with solar and
conventional power plants based on PT and ST technologies without TES
estimated the capacity factor based on plant capacity location and type of cooling
adjusted the insurance material and maintenance and labour costs based on the
solar field reduction factor when applicable
adjusted the steam turbine maintenance based on the potential hours of operation
48
adjusted the plant electricity and water consumption based on the total net
production
assumed similar auxiliary fuel consumption for the plant with and without TES This
assumption is due to the reference plants being based in the same location thus
requiring similar auxiliary fuel consumption for start-up Minimal differences in
auxiliary fuel consumption for freeze protection due to increased time offline for a
plant without TES system compared to a plant with TES are expected but not
considered in this Report as the impact would be minor
the capacity factor provided by CSP Today for PT with thermal storage is considered
high Based on the plant location and capacity WorleyParsons would anticipate the
capacity factor to be closer to 42 per cent instead of 46 per cent as indicated in Table
14 above This difference in capacity factor directly impacts the estimated VOM cost
which is correlated with plant production For comparison purposes the value provided
by CSP Today has maintained and
with respect to Linear Fresnel technology updated information has not been published
since the AETA 2012 report release by the references listed in Section 462 which
WorleyParsons consulted For the purpose of updating the estimates to 2013 it was
assumed that the evolution of the OampM costs would be similar to that of parabolic
trough plants and the same escalation factors were applied
The resulting 2013 and 2012 OampM costs are listed in Table 15 below for comparison
Table 15 2013 CSP OampM Costs Compared to 2012 OampM Costs
CSP Technology OampM Costs AETA 2012 WorleyParsons 2013 update
Parabolic Trough
without Storage
FOM $MWyear 60000 59176
VOM $MWh sent out 1500 1519
OPEX $kWh 00448 00412
Parabolic Trough with
Storage
FOM $MWyear 65000 72381
VOM $MWh sent out 2000 1139
OPEX $kWh 00377 00293
Solar Tower without
Storage
FOM $MWyear 70000 58285
VOM $MWh sent out 1500 707
OPEX $kWh 00408 00313
Solar Tower with
Storage
FOM $MWyear 60000 71372
VOM $MWh sent out 1500 565
OPEX $kWh 00313 00228
Linear Fresnel without
Storage
FOM $MWyear 65000 64107
VOM $MWh sent out 1500 1519
OPEX $kWh 00473 00434
49
CSP Technology OampM Costs AETA 2012 WorleyParsons 2013 update
Linear Fresnel with
Storage
FOM $MWyear 65000 72381
VOM $MWh sent out 2000 1139
OPEX $kWh 00377 00293
The total OPEX costs per year from the AETA 2012 report and the WorleyParsonsrsquo estimates
that were updated for 2013 are compared in Figure 6 below
Figure 6 Comparison of OPEX Costs per Total Annual Plant Production per Year AETA 2012
Report and 2013 Update
Reductions of approximately 20 - 27 per cent in OampM costs would be realised by CSP with
TES according to the updated 2013 WorleyParsons estimates compared to the same costs
reported in the AETA 2012 report However reductions for PT and LF without TES were
found to be lower at approximately 8 per cent
The IRENA reports (IRENA 2013b IRENA 2013c) provide values for OPEX between 0025
and 0035 USDkWh for PT and ST technologies with and without TES Values updated to
2013 by WorleyParsons are between 0023 and 00412 USDkWh for PT and ST
technologies which align with the IRENA values However IRENA does not differentiate
between the utilisation of TES Solar technologies without TES have fewer hours of
production and although OPEX costs are lower in terms of USDMW compared with solar
technologies with TES OPEX costs in terms of costs per total annual plant production per
year will typically be higher for technologies that do not use TES
4634 OampM CSP LEARNING RATES
Cost reductions on CSP technologies are expected to come from the following main actions
economies of scale in the plant size and manufacturing industry
learning impacts on design construction and operation phases
50
advances in RampD of the following factors
Components Solar receivers mirrors HTF storage media supporting structures
trackers and auxiliary systems
Systems Direct steam generation storage systems or hybrid cooling systems
Configurations Hybridisation or duel electricity water plants
a more competitive supply chain
improvements in the performance of the solar field solar-to-electric efficiency and
thermal energy storage systems
increases in the life of plants and
reduced financial costs
Based on the parameters listed above the LCOE from Solar Thermal technologies is likely to
be continuously decreasing and this is born out in the literature that has been reviewed Based
on the IRENA 2013b report the evolution of the LCOE from trough and power tower CSP
technologies shows how the LCOE is decreasing as technology development increases in
Table 16 below Estimates for LCOE for the hypothetical trough and tower CSP plants in
2014 are also included
51
Table 16 Estimated LCOE form Existing and Hypothetical Trough and Solar Tower CSP Technologies
CSP
Technology
Year Capacity
(MW)
Plant Name Location DNI
(kWhm2year)
LCOE 2012
$kWh Installed
Trough
1981 05 PSA Spain 2000 064
1983 138 SEGS I California 2700 039
1989 30 SEGS II ndash VIII California 2700 026
1992 80 SEGS VIII amp IX California 2700 020
2008 - 2009 50 Andasol 1 2 Spain 2000 035
2010 50 Solnova 1 amp 3 Spain 2000 034
2010 - 2011 50 Extresol 1 amp 2 Spain 2000 035
2014 250 Unspecified (wet
cooling no storage)
Not provided Not provided 020
Tower
1987 10 Solar One California 2700 058
2007 11 PS10 Spain 2000 034
2009 20 PS20 Spain 2000 036
2011 199 Gemasolar (wet
cooling 15hr
storage)
Spain 2000 033
2014 120 Unspecified
(dry cooling
storage)
Not Provided Not provided 015
International Institutions such as IRENA ESTELA or the World Bank agree that the LCOE
and capital cost reductions of 28 per cent to 60 per cent are envisioned by 2020 ndash 2025 for
such plant Estimates of possible LCOE reductions for CSP technology from 2012 to 2025
are provided in Figure 7 taken from Kearny (2010)
52
Figure 7 Expected LCOE Reductions for CSP Technology from 2012 to 2025
Source (Kearny 2010)
The OampM maintenance costs of modern CSP Plants are lower than those for Californian
SEGS Plants built in the 1980s and 1990s which has a total combined capacity of 354 MW
and estimated OampM costs of USD 004kWh (IRENA 2013b) However CSP experienced no
growth from early 1990s until the mid-2000s as can be seen in Table 16 above
As stated at the beginning of Section 462 Andasol 1 was the first 50 MWe parabolic trough
plant built after SEGS which included a thermal energy storage system It commenced
operation at the end of 2008 Podewils (2008) estimated Andasol 1 OampM costs of EUR
0072kWh or USD 0095kWh (considering 2012 medium rate exchange EURUSD of
07553) This value is high compared to OPEX estimations for PT with TES provided by
both this 2013 update and the AETA 2012 report (00293 and 00377 USDkWh
respectively) Therefore according to the information detailed above considerable learning
improvements to OampM costs have been already achieved from the commencement of
operation of Andasol 1 to the time of this Report
`WorleyParsonsrsquo estimations on the LCOE of parabolic trough plants is in the range of
USD 020kWh to USD 035kWh and that of solar towers between USD 017kWh and
USD 029kWh However in areas with excellent solar resources the range could be as low
as USD 014kWh to USD 018kWh
The following considerations have been taken into account for OampM cost learning rates
forecast
WorleyParsons LCOE estimations as set out above
Potential average envisaged LCOE reductions of 475 per cent by 2025 based on Figure
7 above
OPEX contribution on LCOE of 20 per cent and
53
assuming that all components involved in the LCOE (CAPEX OPEX and financial
expenses) reduce at the same rate so percentage contributions remain constant
According to these considerations WorleyParsons estimates that OPEX values by 2025 could
reach from 0021 to 0037 USDkWh for PT technology and from 0018 to 0031 USDkWh
for ST technology
Technological improvements have reduced the requirement of replacing mirrors and
receivers Automation has reduced the cost of other OampM procedures by as much 30 per
cent As a result of OampM procedure improvements (both cost and plant performance) the
total OampM costs of CSP plants in the long-term are likely to be below USD 0025kWh
(IRENA 2013b)
Parabolic trough system in the United States would have OampM costs of around USD 002 to
USD 003kWh meanwhile the OampM costs of parabolic trough and solar tower power plants
currently under construction in South Africa have estimated OampM costs of between USD
0029 and USD 0036kWh (also IRENA 2013b)
WorleyParsons estimations are in alignment with IRENA estimations in terms of current and
envisaged CSP OPEX costs
4635 CONCLUSIONS ndash CSP
The following main conclusions were made based on this study in relation to CSP
technologies
the 2013 WorleyParsons CSP OampM costs update resulted in values between 0023 and
0043 USDkWh based on 2012 USD
reductions in CSP OampM costs between 8 per cent and 27 per cent were obtained in
comparison to values provide in AETA 2012 report
the total OampM costs of CSP Plants in the long-term are likely to be below USD
0025kWh
the updated values for 2013 by WorleyParsons are in alignment with the values
provided by recognised international institutions and
at the time of this report the only CSP technology with substantial operation capacity
was PT Only three utility-scale ST plants were in operation at the time of this report
(PS-10 PS-20 and Gemasolar) of which only one (Gemasolar) uses TES Though
several process steam and small-scale LFR Plants are currently in operation only one
utility-scale LFR (Puerto Erradio 2) was in operation at the time of this report
47 AETA 2013 OampM Learning Rate recommendation
The learning rate used in AETA 2012 for OampM is applied to all technologies assessed and
includes fossil fuel technologies and emerging technologies The learning rate is set at an
improvement of 02 per cent per annum
In addition to the improvement rate OampM is escalated at a rate of 150 per cent of CPI per
year based on experience with increases in parts and labour costs
The CPI rate set in the model is 25 per cent per annum
54
OampM cost information in the public domain in both quantum and quality is poor for
contemporary data Information supporting OampM learning rates is equally poor There are
indications that emerging technologies do have the potential for increased OampM learning
rates relative to mature technologies
For the renewable energy technologies studied in this report onshore wind is considered
mature and it is recommended that the AETA 2012 report value of 02 per cent is maintained
For all other renewable energy technologies studied in this report a more aggressive learning
rate of 25 per cent is recommended This will effectively cancel out the CPI escalation
adjustment and provide a ldquoflat linerdquo OampM rate for future years This will provide a value in
line with the learning rate conclusions for PV
The learning rate for CSP is considered to have greater potential for reduction but due to the
high level of analysis in this report (and therefore uncertainty) it is proposed that a maximum
of two learning rates is appropriate for the AETA model
Table 17 AETA Learning Rate Comparison
AETA 2012 Learning Rate AETA 2013 update Learning Rate
Onshore Wind 02 per cent 02 per cent
Offshore Wind
PV ndash all technologies
CSP ndash all technologies
02 per cent 25 per cent
55
5 CHANGES TO THE LCOE
Changes to the model parameters described in the earlier sections have resulted in changes to
the LCOE estimates for a number of technologies The LCOE estimate values for all
technologies and associated range of uncertainty are shown in the Figures 8 to 13 below
Note that the values listed are for a base value carbon price modifier of zero per cent which
places no value on carbon emissions
For selected technologies where there are significant cost differences Figure 14 provides a
comparison of mid-range LCOE values for the AETA 2013 and AETA 2012 Models Key
features of the Figures 8 to 14 are as follows
both in AETA 2012 and 2013 Model update LCOE costs are provided for the years
2012 2020 2025 2030 2040 and 2050
cost ranges are provided for each technology that accounts for differences in fuel prices
and state-based variations
LCOE costs vary substantially across the technologies from $89MWh (combined cycle
gas turbine) to $351MWh (solar thermal linear fresnel) in 2012 and $73MWh (PV
non-tracking) to $247MWh (IGCC black coal CCS) in 2050
the inter-technology LCOE comparisons figures (Figures 8 to 13) reveal changes in
relative costs of technologies over time Key results include renewable technologies
have higher LCOEs than the lowest cost non-renewable technologies and the relative
LCOE rankings significantly change post 2030 The LCOE of solar PV become lower
than the non-renewables from mid 2030 onwards and
large changes in LCOE results between AETA 2013 Update and AETA 2012 are
depicted in Figures14 below Figure 14 compares LCOEs at 2050 between the AETA
2013 Update and AETA 2012 for a selected number of technologies that have changed
significantly for NSW (AETA developed LCOEs by each Australian state) Differences
in technology LCOEs are explained by a multiplicity of factors including the technical
developments OampM costs and learning rate changes
56
Figure 8 Updated LCOEs for AETA 2013 Model technologies values for 2012 (NSW) with carbon price set to zero
0
50
100
150
200
250
300
350
400
450
500
LCO
E ($
MW
h)
LCOE FOR 2012 TECHNOLOGIES (NSW) Note Default region is NSW except bown coal
technologies (VIC) and SWIS scale (as specified)
LCOE includes where relevant allowance for- Carbon Price- CO2 transport and sequestration cost- Plant capital cost (EPC basis) within battery limits- Owners costs excluding interest during construction- Fixed and variable operating costs- Fuel costs- Economic escalation factors
57
Figure 9 Updated LCOEs for AETA 2013 Model technologies values for 2020 (NSW) with carbon price set to zero
0
50
100
150
200
250
300
350
400
450
LCO
E ($
MW
h)
LCOE FOR 2020 TECHNOLOGIES (NSW) Note Default region is NSW except bown coal
technologies (VIC) and SWIS scale (as specified)
LCOE includes where relevant allowance for- Carbon Price- CO2 transport and sequestration cost- Plant capital cost (EPC basis) within battery limits- Owners costs excluding interest during construction- Fixed and variable operating costs- Fuel costs- Economic escalation factors
58
Figure 10 Updated LCOEs for AETA 2013 Model technologies values for 2025 (NSW) with carbon price set to zero
0
50
100
150
200
250
300
350
400
LCO
E ($
MW
h)
LCOE FOR 2025 TECHNOLOGIES (NSW) Note Default region is NSW except bown coal
technologies (VIC) and SWIS scale (as specified)
LCOE includes where relevant allowance for- Carbon Price- CO2 transport and sequestration cost- Plant capital cost (EPC basis) within battery limits- Owners costs excluding interest during construction- Fixed and variable operating costs- Fuel costs- Economic escalation factors
59
Figure 11 Updated LCOEs for AETA 2013 Model technologies values for 2030 (NSW) with carbon price set to zero
0
50
100
150
200
250
300
350
400
LCO
E ($
MW
h)
LCOE FOR 2030 TECHNOLOGIES (NSW) Note Default region is NSW except bown coal
technologies (VIC) and SWIS scale (as specified)
LCOE includes where relevant allowance for- Carbon Price- CO2 transport and sequestration cost- Plant capital cost (EPC basis) within battery limits- Owners costs excluding interest during construction- Fixed and variable operating costs- Fuel costs- Economic escalation factors
60
Figure 12 Updated LCOEs for AETA 2013 Model technologies values for 2040 (NSW) with carbon price set to zero
0
50
100
150
200
250
300
350
400
LCO
E ($
MW
h)
LCOE FOR 2040 TECHNOLOGIES (NSW) Note Default region is NSW except bown coal
technologies (VIC) and SWIS scale (as specified)
LCOE includes where relevant allowance for- Carbon Price- CO2 transport and sequestration cost- Plant capital cost (EPC basis) within battery limits- Owners costs excluding interest during construction- Fixed and variable operating costs- Fuel costs- Economic escalation factors
61
Figure 13 Updated LCOEs for AETA 2013 Model technologies values for 2050 (NSW) with carbon price set to zero
0
50
100
150
200
250
300
350
400
LCO
E ($
MW
h)
LCOE FOR 2050 TECHNOLOGIES (NSW)
LCOE includes where relevant allowance for- Carbon Price- CO2 transport and sequestration cost- Plant capital cost (EPC basis) within battery limits- Owners costs excluding interest during construction- Fixed and variable operating costs- Fuel costs- Economic escalation factors
Note Default region is NSW except bown coal
technologies (VIC) and SWIS scale (as specified)
62
Figure 14 Comparison of AETA 2013 Model and AETA 2012 Model LCOE estimates selected technologies 2050
0
50
100
150
200
250
AETA 2012
AETA 2013
63
51 Conclusions
The Australian Energy Technology Assessment (AETA 2012) provided the best available and most up-to-
date cost estimates for 40 electricity generation technologies under Australian conditions To ensure that
the cost estimates for the various technologies are consistent all common input costs (eg labour
materials components carbon price) were itemised To ensure that the AETA costings remain up to date
AETA costs are reviewed in this AETA 2013 Model Update report
The AETA 2013 refresh was developed in close consultation with a stakeholder reference group drawn
from industry and researchacademic organisations with interests and expertise in a diverse range of
electricity generation technologies
The AETA 2013 Model results reflect the change to exclude the value of a carbon price in the Levelised
Cost of Energy (LCOE) All technologies have experienced a minor reduction in LCOE relative to 2012
(offset in some cases by other factors) due to the change to an amortisation period of 30 years plus the
construction period
Comparing the 2012 AETA results without a carbon price to the 2013 results without a carbon price there
are significant reductions in the LCOE of solar technologies and onshore wind This is as a consequence of
changes to the fixed and variable Operations and Maintenance (OampM) costs for these technologies For the
solar technologies the adjustment of the capital learning rate to 25 per cent has also contributed to the
LCOE reduction Offshore wind also has an increased learning rate but this has been offset to a large extent
by increased variable OampM costs
Nuclear LCOE has increased significantly due to higher estimates for capital costs
Efficiency for coal fired plants with CCS retrofits has been revised downwards to better reflect the expected
efficiency of these plants and has the effect of increasing the LCOE
64
REFERENCES
Albers A 2009 OampM Cost Modeling Technical Losses and Associated Uncertainties Proceedings of the
2009 European Wind Energy Conference Marseilles France March
AWEA (American Wind Energy Association) 2013 AWEA US Wind Industry Annual Report ndash Year
Ending 2012 USA
BNEF (Bloomberg New Energy Finance) 2013 Operations and Maintenance (OampM) Price Index Issue II
Wind Research Note April
BREE (Bureau of Resources and Energy Economics) 2012 AETA Report and Model Version 1_0 2012
Australian httpwwwbreegovau
CEC (Clean Energy Council) 2013 Australian Energy Technology Assessment 2013 Review Letter to
BREE of 20 May 2013 from the Clean Energy Council (Mr Russel Marsh signatory for the CEC)
CEC (Clean Energy Council) 2013 Clean Energy Council Renewable Energy Map Australia June (data
noted as current as of 21 August 2012)
httpwwwcleanenergycouncilorgauresourcecentreplantregistermaphtml
Crown Estate 2012 Offshore Wind Cost Reduction Pathways Study United Kingdom May
CSP 2012a CSP Parabolic Trough Report Cost Performance and Key Trends CSP Today
CSP 2012b CSP Solar Tower Report Cost Performance and Key Trends CSP Today
Deloitte amp Touche 2012 European Wind Services Study Find Out Which Way the Wind Blows Deloitte amp
Touche GmbH Wirtschaftspruumlfungsgesellschaft August
Deloitte 2011 Economics of wind development in New Zealand Deloitte for the for the New Zealand Wind
Energy Association
Ebert P amp Ware J 2013 The Role of Independents in the Wind Farm Operations amp Maintenance
Proceedings of the 2013 New Zealand Wind Energy Conference and Exhibition March
EPRI (Electric Power Research Institute) 2010 Engineering and Economic Evaluation of Central-Station
Solar Photovoltaic Power Plants USA March
GlobalData 2012 Wind Operations amp Maintenance (OampM) Market ndash Global Market Size Share by
Component Competitive Landscape and Key Country Analysis to 2020 GlobalData reference code
GDAE1054MAR January
Hand M 2013 Wind Plant Cost of Energy Proceedings of the 2nd NREL Wind Energy System
Engineering Workshop January
Hassan G 2011 Review of the Australian Wind Energy Industry Clean Energy Council Australia 2011
Houston C 2013 The Real Truth About Wind Farm OampM Costs North American WindPower March
IEA (International Energy Agency) 2008 Technology Roadmap Solar photovoltaic energy France
httpwwwieaorgpublicationsfreepublicationspublicationpv_roadmappdf
IRENA (International Renewable Energy Agency) 2013a Solar Photovoltaics Technology Brief Germany
January httpwwwirenaorgDocumentDownloadsPublicationsIRENA-ETSAPper
cent20Techper cent 20Briefper cent20E11per cent20Solarper cent20PVpdf
65
IRENA (International Renewable Energy Agency) 2013b Concentrating Solar Power Technology Brief
Germany January
IRENA (International Renewable Energy Agency) 2013c Renewable Power Generation Costs in 2012 An
Overview Germany
IT Power 2013 Analysis of the AETA 2012 cost estimates of CSP technologies Clean Energy Council
submission to the Bureau of Resources and Energy Economics May
Kann S 2012 US Solar Market Insight Report Q3 California USA
Kearny A 2010 Solar Thermal Electricity 2025 ndash clean electricity on demand attractive STE costs
stabilize energy production ATKearny consultants Dusseldorf Germany
Muirhead J 2013 SEGS experience suggests that CSP will age gracefully CSP Today South Africa
httpsocialcsptodaycommarketssegs-experience-suggests-csp-will-age-
gracefullysthash6VkxFaD0dpuf
NREL (National Renewable Energy Laboratories) 2011 IEA Wind Task 26 ndash Multi-national Case Study of
the Financial Cost of Wind Energy Technical Report NRELTP-6A2-48-48155 March
NREL (National Renewable Energy Laboratories) 2012 Cost and Performance Data for Power Generation
Technologies USA February
NREL (National Renewable Energy Laboratories) 2013 Breakeven Prices for Photovoltaics on
Supermarkets in the United States March httpwwwnrelgovdocsfy13osti57276pdf
NREL (National Renewable Energy Laboratories) 2013 Breakeven Prices for Photovoltaics on
Supermarkets in the United States USA March httpwwwnrelgovdocsfy13osti57276pdf
Photon 2012 The True Cost of Solar Power 2012 Temple of Doom Solar Power in Focus Series Photon
Consulting
Photon 2013 Solar Annual 2013 Build Your Empire Photon Consulting
Podewils C 2008 Photovoltaic vs Solar Thermal where PV has the upper hand and where solar thermal
strikes back Photon International Germany November
Poore R and Walford C 2008 Development of an Operations and Maintenance Cost Model to Identify
Cost of Energy Savings for Low Wind Speed Turbines Report NRELSR-500-40581 National
Renewable Energy Laboratory January
RolandBerger 2013 Offshore Wind Towards 2020 On the Pathway to Cost Competitiveness RolandBerger
Consultants Germany April
See wwwcsptodaycom
See wwwepiaorg
See wwwestelasolarde
See wwwidaees
See wwwieaorg
See wwwirenaorg
See wwwnrelgov
See wwwprotermosolares
66
See wwwrenoveteces
See wwwseiaorgau
See wwwsolarelectricpowerorg
See wwwworldbankorg
UK Crown Estate 2012 Offshore Wind Cost reduction Study May
US DoE (Department of Energy) 2013 Award Number DE-EE0005360 USA February
Wiser R Lantz E Bolinger M amp Hand M 2012 Recent Developments in the Levelized Cost of Energy
from US Wind Power Projects Contract No DE-AC02-05CH11231 National Renewable Energy
Laboratories February
67
Appendix A
Electricity Generation Technologies in AETA 2012 Report and Model
The 40 AETA electricity generation technologies are
1 Integrated Gasification and Combined Cycle (IGCC) plant based on brown coal
2 IGCC plant with Carbon Capture and Sequestration (CCS) based on brown coal
3 IGCC plant based on bituminous coal
4 IGCC plant with CCS based on bituminous coal
5 Direct injection coal engine (clean lignite eg brown coal technology)
6 Pulverised coal supercritical plant based on brown coal
7 Pulverised coal supercritical plant with post combustion CCS based on brown coal
8 Pulverised coal subcritical plant with post combustion CCS based on brown coal (retrofit)
9 Pulverised coal supercritical plant based on bituminous coal
10 Pulverised coal supercritical plant based on bituminous coal - SWIS relevant scale
11 Pulverised coal supercritical plant with CCS based on bituminous coal
12 Pulverised coal subcritical plant with post combustion CCS based on bituminous coal (retrofit)
13 Adding CCS to existing Combined Cycle Gas Turbine (CCGT) power plants (retrofitting)
14 Oxy combustion pulverised coal supercritical plant based on bituminous coal
15 Oxy combustion pulverised coal supercritical plant with CCS based on bituminous coal
16 Combined cycle plant burning natural gas
17 Combined cycle plant burning natural gas - SWIS relevant scale
18 Combined cycle plant with post combustion CCS
19 Open cycle plant burning natural gas
20 Solar thermal plant using compact linear fresnal reflector technology wo storage
21 Solar thermal plant using parabolic trough technology wo storage
22 Solar thermal plant using parabolic trough technology with storage
23 Solar thermal plant using compact linear fresnal reflector technology with storage
24 Solar thermal plant using central receiver technology wo storage
25 Solar thermal plant using central receiver technology with storage
26 Solar photovoltaic (PV) - non-tracking
27 Solar photovoltaic (PV) - single axis tracking
28 Solar photovoltaic (PV) - dual axis tracking
29 Wind (on-shore)
30 Wind (off-shore)
31 WaveOcean
68
32 Geothermal - hot sedimentary aquifer (HSA)
33 Geothermal - enhances geothermal system (EGS)
34 Landfill gas power plant
35 Sugar cane waste power plant
36 Other biomass waste power plant (eg wood)
37 Nuclear Gen 3+
38 Nuclear Small Modular Reactors (SMR)
39 Solarcoal hybrid
40 Integrated solar combined cycle (ISCS) ndash parabolic trough with combined cycle gas
69
Appendix B
Consultations with Stakeholders
This study has been undertaken in close consultation with a Stakeholder Reference Group drawn from
Australian industry and domestic as well as overseas researchacademic organisations with interests and
expertise in a diverse range of electricity generation technologies These stakeholders were invited to
provide evidence of the latest estimates for the costs and performance of various technologies
In addition the AETA project also had a Project Steering Committee comprising staff from BREE
AEMO CSIRO and other independent experts to provide technical advice and support The following
agencies participated in the stakeholder reference group meetings or were forwarded the documents
presented at the meetings
AETA Stakeholder Reference Group
Australian Coal Association
Australian Energy Market Operator
Australian Geothermal Energy Association
Australian National Low Emissions Coal RampD
Australian National University
Australian Renewable Energy Agency
Australian Solar Thermal Energy Association
Australian Sugar Milling Council
Australian Treasury
Bureau of Resources and Energy Economics
Clean Energy Council
CSIRO
Department of Industry
Economic Research Institute for ASEAN and East Asia
Energy Retailers Association of Australia
Energy Users Association of Australia
Evans and Peck
Ferrostaal
Global CCS Institute
Grid Australia
Intergen
International Energy Agency France
International Power Suez
IRENA Innovation and Technology Centre Germany
70
National Generators Forum
Oceanlinx Limited
Origin Energy
Private Generators Group
The Institute of Energy Economics Japan
The Energy Research Institute New Delhi
University of Melbourne Energy Institute
University of Queensland Energy Initiative
UQ Energy Economics amp Management Group
Wyldgroup
WorleyParsons
Two AETA Stakeholders Reference Group meetings took place on 30 April 2013 and 17 July 2013 In
addition the AETA Project Steering Committee met on 24 June 2013
71
BREE contacts Executive Director BREE Bruce Wilson brucewilsonretgovau
(02) 6243 7901
Deputy Executive Director Wayne Calder waynecalderbreegovau
(02) 6243 7718
Modelling amp Policy Integration Arif Syed arifsyedbreegovau
Program Leader (02) 6243 7504
Data Statistics Geoff Armitage geoffarmitagebreegovau
Program Leader (02) 6243 7510
Energy and Quantitative Analysis Allison Ball allisonballbreegovau
Program Leader (02) 6243 7539
Resources ndash Program Leader John Barber johnbarberbreegovau
(02) 6243 7988
72

3
FOREWORD
The inaugural Australian Energy Technology Assessment (AETA) 2012 report released in
mid-2012 was an important step forward in improving the quality and transparency of
information available for market-ready and prospective electricity generation technologies in
Australia The AETA 2012 provided many important insights particularly the relatively
rapid cost reductions expected for a range of renewable energy technologies over the course
of the next decade
To ensure that technology costs remain up to date this AETA 2013 Model Update report
provides electricity generation technology cost parameters as an update to the values
presented in AETA 2012 All of the 40 technologies considered in AETA 2012 are included
in this update and encompass a diverse range of energy generation sources including
renewable energy (such as wind solar geothermal biomass and wave power) fossil fuels
(such as coal and gas) and nuclear power
The AETA 2013 Model Update takes into account new information on technology generation
costs and has been the subject of wide consultation with relevant industry stakeholders and a
stakeholder reference group drawn from industry and researchacademic organisations with
interests and expertise in a diverse range of electricity generation technologies
As is the case for all such assessments the cost estimates in this report reflect assumptions
made on a mix of critical technical and economic parameters Importantly the LCOE
estimates do not include site specific or systems costs The AETA 2013 Model Update
results also do not include carbon or other environmental costs that may be associated with
various technologies Clearly the extent to which these might apply in the market or
through regulation may impact on generation or delivered costs of electricity
Importantly the transparency and detail provided in the AETA model enables users to apply
their particular assumptions to construct their own LCOE based on Australian conditions
and a copy of the model is available upon request It is essential to energy planners energy
modellers and indeed anyone interested in exploring different scenarios and energy
futures
Bruce Wilson
Executive Director
Bureau of Resources and Energy Economics
4
CONTENTS
About the Bureau of resources and energy economics 2
Acknowledgements 2
FOREWORD 3
ACRONYMSABBREVIATIONS 8
GLOSSARY 9
EXECUTIVE SUMMARY 10
1 INTRODUCTION 12
11 Background to the AETA 2012 report 12
12 Methods and Assumptions of the AETA 2012 Report and Model 12
121 Macro assumptions 12
122 Technical assumptions 13
123 Levelised cost of energy (LCOE) 13
13 Methodology of the AETA 2013 Model Update 13
131 Caveats on the use of LCOE 14
132 Organisation of the report 14
2 AETA MODEL PARAMETER CHANGES 16
21 Stakeholder Initiated Changes 16
211 Nuclear Capital Costs 16
212 Carbon Capture and Storage (CCS) Retrofit Thermal Efficiency 17
213 Amortisation period 19
22 No Carbon Pricing 19
3 CONSIDERATION OF OTHER ISSUES 20
31 Representation of Uncertainty 20
32 Application of Learning Curves 20
33 General Costs Considerations 21
331 Fuel Costs 21
332 CCS Costs 21
333 Opportunity Costs 22
34 Capital and Construction Costs 22
5
35 Costs Associated with Solar Technologies 23
36 Costs Associated with Nuclear Technologies 24
37 Further Technologies 24
38 Auxiliary Loads 24
4 WIND PV AND CSP OPERATIONS AND MAINTENANCE (OampM) COST UPDATE 25
41 Operation and Maintenance Costs 25
42 Operating and Maintenance (OampM) Changes in summary 26
43 Wind 28
431 Introduction 28
432 Review of Evidence 29
433 Updated OampM Figures for Australia 33
44 Solar Photovoltaics (PV) 36
441 Introduction 36
442 Review of the Evidence 37
443 AETA 2012 OampM PV costs report comparison 37
45 AETA 2013 PV OampM Costs Update 40
451 OampM Learning Rates 41
452 Conclusions - PV 42
46 Concentrating Solar Power (CSP) 43
461 Introduction 43
462 Review of the evidence 43
463 AETA 2012 OampM CSP costs report comparison 44
47 AETA 2013 OampM Learning Rate recommendation 53
5 CHANGES TO THE LCOE 55
51 Conclusions 63
REFERENCES 64
Appendix A Electricity Generation Technologies in AETA 2012 Report and Model 67
Appendix B Consultations with Stakeholders 69
BREE CONTACTS 71
6
INDEX OF TABLES
Table 1 Model Changes Nuclear Technologies 17
Table 2 Model Changes CCS Retrofit Thermal Technologies 18
Table 3 Model Changes amortisation period 19
Table 4 Model Changes OampM costs 27
Table 5 Wind OampM costs used in the AETA 2012 report 29
Table 6 Comparison of AETA 2012 wind OampM estimates with new references for 2013 35
Table 7 Recommended AETA 2013 values 36
Table 8 AETA 2012 reference plants technical characteristics and OPEX costs 39
Table 9 Comparison of historical estimated PV and OampM costs in the public domain 39
Table 10 2013 PV OampM costs compared to 2012 PV OampM costs 40
Table 11 2013 updated OampM costs compared to new referenced OampM costs (7-2) 41
Table 12 AETA 2012 Reference Plant Technical Characteristics 45
Table 13 AETA 2012 OampM Opex costs on a per kWh basis 46
Table 14 PT and ST Reference Plant Characteristics 47
Table 15 2013 CSP OampM Costs Compared to 2012 OampM Costs 48
Table 16 Estimated LCOE form Existing and Hypothetical Trough and Solar Tower CSP
Technologies 51
Table 17 AETA Learning Rate Comparison 54
7
TABLE OF FIGURES
Figure 1 - Effect of country variables on LCOE of wind plant 31
Figure 2 - Typical cost increasing trends in wind farm OampM costs with commercial
operations date 32
Figure 3 - Trends in offshore wind farms and estimated impact on LCOE 33
Figure 4 - OampM Costs (per MW) and Technician Numbers (per 100MW) for total wind
turbine OampM (Opex) 34
Figure 5 - AETA 2012 FOM and VOM Percentages of Total OPEX Costs 46
Figure 6 - Comparison of OPEX Costs per Total Annual Plant Production per Year
AETA 2012 Report and 2013 Update 49
Figure 7 - Expected LCOE Reductions for CSP Technology from 2012 to 2025 52
Figure 8 Updated LCOEs for AETA 2013 Model technologies values for 2012 (NSW) with
carbon price set to zero 56
Figure 9 Updated LCOEs for AETA 2013 Model technologies values for 2020 (NSW) with
carbon price set to zero 57
Figure 10 Updated LCOEs for AETA 2013 Model technologies values for 2025 (NSW) with
carbon price set to zero 58
Figure 11 Updated LCOEs for AETA 2013 Model technologies values for 2030 (NSW) with
carbon price set to zero 59
Figure 12 Updated LCOEs for AETA 2013 Model technologies values for 2040 (NSW) with
carbon price set to zero 60
Figure 13 Updated LCOEs for AETA 2013 Model technologies values for 2050 (NSW) with
carbon price set to zero 61
Figure 14 Comparison of AETA 2013 Model Update and AETA 2012 LCOE estimates
selected technologies 62
8
ACRONYMSABBREVIATIONS
AETA Australian Energy Technology Assessment
BREE Bureau of Resources and Energy Economics
CAPEX Total capital expenditures
CSP Concentrating Solar Power Technologies
DAT Dual axis tracking
EPIA European Photovoltaic Industry Association
EPRI Electric Power Research Institute
ESTELA European Solar Thermal Electricity Association
FOM Fixed operation and maintenance costs
FT Fixed Tilt
h Hours
IDEA Institute for Energy Diversification and Saving
IEA International Energy Agency
IRENA International Renewable Energy Agency
kW Kilowatts
kWh Kilowatt hours
LCOE Levelised Cost of Energy
LF Lineal Fresnel Reflector CSP Technology
m2 Square Meters
MENA Middle East and North Africa region
MW Megawatts
MWh Megawatt hours
MWe Megawatt hours electric
NREL National Renewable Energy Laboratory
OampM Operation and maintenance
OEM Original Equipment Manufacturer
OPEX Total operating expenditures
PT Parabolic Trough CSP Technology
PV Photovoltaic
RampD Research and Development
SAT Single axis tracking
SEGS Solar Electricity Generating System
SEIA Solar Energy Industries Association
SEPA Solar Electric Power Association
ST Solar Tower CSP Technology
TES Thermal Energy Storage System
USD United States Dollar
VOM Variable operation and maintenance costs
WB The World Bank organization
9
GLOSSARY
Amortisation Period the period over which a plant must achieve its economic return
Auxiliary Load the internal or parasitic load from the electricity required to sustain the
operation of a plant
Capacity Factor the ratio of the actual output of a power plant over a period of time and its
potential output if it had operated at full nameplate capacity the entire time
Capital Cost the cost of delivery of a plant not including the cost of finance
Discount Rate the rate at which future values are discounted or converted to a present
value
First-of-a-Kind Plant cost costs necessary to put a first commercial plant in place and that
will not be incurred for subsequent plants Design and certification costs are examples of
such costs
First Year Available for Construction the year in which the technology will be available
for commercial deployment globally
Gross Capacity maximum or rated generation from a power plant without losses and
auxiliary loads taken into account
International Equipment Cost the cost for internationally sourced equipment associated
with the project
Labour Cost the component of the delivery cost for a plant associated with local
(Australian) labour
Lead time for Development the time taken from inception to financial close This includes
permitting approvals and engineering design
Levelised Cost of Energy the minimum cost of energy at which a generator must sell the
produced electricity in order to achieve its desired economic return
Local Equipment Cost the cost of locally sourced (Australia) plant and equipment for the
project
Net Capacity the export capacity of a generation plant ndash ie the Gross Capacity less the
losses and auxiliary loads of the plant
Nth-of-a-kind plant cost all engineering equipment construction testing tooling project
management and other costs that are repetitive in nature and would be incurred if a plant
identical to a FOAK plant were built The NOAK plant is the nth-of-a-kind or equilibrium
commercial plant of identical design to the FOAK plant
Sequestration the process of transport and storage of Carbon Dioxide (CO2)
Thermal Efficiency the ratio between the useful energy output of a generator and inputs
10
EXECUTIVE SUMMARY
This Report provides electricity generation technology cost parameters as an update to those
presented in the Australian Energy Technology Assessment (AETA) Report and Model
published in July 2012 This update takes into account a range of new material reported in the
public and private domain further discussions with asset owners and technology developers
and input from key experts in relation to these costs
The AETA 2012 Model estimated levelised costs of energy (LCOE) for a set of 40 market
ready and prospective electricity generation technologies LCOE can be interpreted as the
long-run marginal cost of electricity generation These were estimated by breaking down
the cost drivers for a technology into its key constituent parts such as capital cost fixed and
variable lsquooperations and maintenancersquo (OampM) costs and where applicable fuel costs and
CO2 storage costs While the LCOEs included carbon costs project specific regulatory or
system based costs were not included although clearly these may have a significant impact
on the delivered price of electricity
The AETA 2013 Model update generally follows the same approach although comparable
LCOE results are presented without carbon costs reflecting the Governmentrsquos intention to
repeal carbon pricing To the extent that alternative emissions reduction measures impact on
the electricity generation sector this may have different implications for fossil fuel andor
renewable based technologies
For these reasons some caution should be applied when interpreting LCOE estimates These
estimates best illustrate potential and relative ldquooff-the-shelfrdquo cost competitiveness rather than
a firm predictor of market outcomes or the commercial viability of individual projects
The key features of the LCOE cost parameters in the AETA 2013 Model update with respect
to the AETA 2012 Model can be summarised as follows
renewable technologies have generally higher LCOEs than the lowest cost non-
renewable technologies and the relative LCOE rankings significantly change post
2030 The LCOE of solar PV becomes lower than the non-renewables from mid-
2030 onwards
however wind based generation is estimated to already have a lower LCOE than
many new build comparable fossil-fuel generation technologies
LCOE costs vary substantially across the technologies from $89MWh (combined
cycle gas turbine) to $351MWh (solar thermal Linear Fresnel) in 2012 and
$73MWh (PV non-tracking) to $247MWh (IGCC black coal CCS) in 2050
changes are made to nuclear capital costs and nuclear technology plantrsquos lsquofirst year of
constructionrsquo carbon capture and storage (CCS) retrofit thermal efficiency and
amortisation period for various technologies to include construction period
a reduction in onshore wind OampM costs of 18 per cent
11
a reduction in offshore wind fixed OampM costs and a three-fold increase in offshore
wind variable OampM costs resulting in an overall increase of 50 per cent total OampM
costs
fixed tilt PV configurations have not seen significant changes in OampM costs
single axis tracking and dual axis tracking PV configurations are approximately 20-30
per cent reduced based on a better understanding of the associated OampM costs
concentrating solar power (solar thermal) OampM cost reduced between 8 per cent and 27
per cent and
the OampM learning rate for offshore wind and all solar technologies are increased from
02 to 25 per cent
The overall impact of parameter changes by technology is given in the AETA 2013 Model
and in this report As in the AETA 2012 the 2013 Model update provides technology
LCOEs for the years 2012 2020 2025 2030 2040 and 2050
12
1 INTRODUCTION
The Australian Energy Technology Assessment (AETA) 2012 report published in July 2012
by the Bureau of Resources and Energy Economics (BREE 2012) undertook costing of 40
electricity generation technologies This report made a provision that due to the fast changing
technology cost environment cost and performance parameters assessed in the AETA 2012
model may be updated every year In addition a full report and lsquobottom uprsquo study will be
undertaken biennially with the next report to be released in 2014
The next fully updated AETA report is scheduled for completion in 2014 To ensure that cost
estimates for electricity generation technologies are current and take into consideration the latest
developments parameter estimates for the 40 technologies will be updated where appropriate
every six months in a manner consistent with the methods outlined in this report and in consultation
with the stakeholder reference group (BREE 2012 p 24)
The purpose of this AETA 2013 Model Update report is to present findings arising from a
review of specific technologies by BREE This review was assisted by comments made by
the AETA Project Steering Committee (PSC) members and AETA Stakeholders Reference
Group (SRG) WorleyParsons was commissioned to review cost parameters for the
technologies considered in the AETA 2012 model Given the fast changing nature of solar
and wind technology operating costs especial emphasis was placed on reviewing OampM costs
for wind and solar technologies Changes to the model for the 2013 update are discussed in
the following sections
11 Background to the AETA 2012 report
BREE engaged WorleyParsons in 2011-12 to develop cost estimates for 40 electricity
generation technologies under Australian conditions for AETA 2012 The AETA cost
estimates were developed with the active collaboration of the Australian Energy Market
Operator (AEMO) which utilised the AETA cost estimates for its National Transmission
Network Development Plan (NTNDP) In addition the Commonwealth Scientific and
Industrial Research Organisation (CSIRO) provided technical advice as part of the AETA
project steering committee The AETA 2012 provided technology costs for the years 2012
2020 2025 2030 2040 and 2050 These technologies encompass a diverse range of
energy sources including renewable energy (such as wind solar geothermal biomass and
wave power) fossil fuels (such as coal and gas) and nuclear power (Appendix A) Since its
publication in July 2012 more than 1000 requests have been made from BREE for the
AETA 2012 cost estimates (model) by domestic and international sources
12 Methods and Assumptions of the AETA 2012 Report and Model
121 Macro assumptions
Key macroeconomic assumptions are consistent with those detailed by the Australian
Energy Market Operator in its National Transmission Network Development Plan and by
the Australian Treasury (see BREE 2012 for a full set of assumptions)
13
122 Technical assumptions
all technologies were costed on a consistent and transparent basis with itemisation of
component costs
capital costs included direct (eg engineering procurement and construction) and
indirect (eg owners) costs but exclude transmission and decommissioning costs
future cost estimates included assumptions about the exchange rate productivity
variation commodity variation and technology improvements
fuel cost estimates were based on ACIL Tasman projections and
projected growth rates for future operating and maintenance costs were provided
123 Levelised cost of energy (LCOE)
LCOE can be interpreted as the long-run marginal cost of electricity generation Key
factors used to calculate LCOE by technology include amortisation period discount rate
capacity factor CO2 emissions factor CO2 capture rate emissions price CO2 storage cost
fuel cost variable and fixed OampM cost and the capital cost
LCOE is a key comparative cost indicator across technologies that is expressed in real
Australian dollars per Megawatt hour of electricity generation ($MWh) The LCOE is the
price at which electricity must be generated from a specific plant to break even taking into
account the costs incurred over the life of the plant (capital cost cost of capitalfinancing
operations and maintenance costs cost of fuel emissions price if applicable and CO2
sequestration) While LCOE is an invaluable tool for comparing technology costs power
generation companies andor investors who wish to choose a technology to deploy would
also need to consider other criteria such as site-specific costs technology performance
characteristics and experience with the technology prior to any final investment decision
AETA cost estimates are developed to provide design basis and plant characteristics
performance parameters capital cost estimates fuel cost estimates OampM cost estimates
and LCOE estimates
Regional impacts on capital and operating costs have been incorporated in the analysis
These regions include Victoria New South Wales (including ACT) South Queensland
(incorporating the South East Queensland and Central Queensland AEMO regions) North
Queensland (incorporating the North Queensland AEMO region) Northern Territory
North WA (Pilbara region) South WA (the South West Interconnected System region)
South Australia and Tasmania
13 Methodology of the AETA 2013 Model Update
As part of the AETA 2013 Model Update BREE invited submissions from the AETA
Steering Committee and the Stakeholder Reference Group to provide commentary and
recommendations on the AETA 2012 Report and Model Eight written submissions were
received in this regard Changes were only recommended where specific substantiated
changes were received The AETA 2013 model has been updated in accordance with the
above consultations and under the same macro economic and technical assumptions as in
AETA 2012 The AETA 2013 model is freely available on request from BREE
(infobreegovau)
Within this context this report provides updated costs based on
14
relevant Australian and international reports on generation technologies that have been
published since AETA 2012 or have been newly discovered
new public domain information
new information from private sources that could be obtained
in-house experience of WorleyParsons and
input on OampM costs and learning rates from a number of industry stakeholders
This AETA 2013 Model Update report provides supporting explanations and references and
justifies amendments to the cost parameters of technologies especially the OampM costs for
wind and solar technologies that were covered in AETA 2012 model
131 Caveats on the use of LCOE
LCOE provides a generalised cost estimate and does not account for site specific factors
that would be encountered when constructing an actual power plant As a result the costs
associated with integrating a particular technology in a specific location to a specific
electricity network are not considered
Projected LCOE does not necessarily provide a reliable indicator of the relative market
value of generation technologies because of differences in the role of technologies in a
wholesale electricity market For example projected LCOE does not provide a direct
indicator of electricity demand or generation in isolation with other emissions abatement
policies Similarly many technologies involve integration costs in addition to the LCOE to
be able to reliably supply to the system The value of variable (or intermittent) power plants
(such as wind and solar) will depend upon the extent to which such plants generate
electricity during peak periods and the impact these plants have on the reliability of the
electricity system Unlike dispatchable power plants (such as coal natural gas biomass
and hydroelectric) ndash which are reliant on some form of stored energy (eg fuels water
storage or battery storage) ndash wind and photovoltaic power plants do not typically include
energy storage Dispatchable plants such as coal or gas fired plants may involve negative
externalities (environment fuel disposal or insurance costs etc) which are not always
reflected in their LCOEs
The AETA LCOEs are restricted to only utility-scale or large scale technologies
Consequently small-scale technologies (eg small roof-top photovoltaics fuel cells co-
generation and trigeneration) that may be relevant to distributed generation were not
included in the AETA 2012 analysis LCOE cost estimates associated with distributed
photovoltaics are likely to differ substantially from utility-scale photovoltaic systems as a
result of differences in component costs (eg capital costs operating and maintenance
costs) and performance characteristics (eg capacity factor)
132 Organisation of the report
This report is organised in five sections After a brief introduction and purpose of the report
in this section section 2 discusses the changes made to the AETA 2013 Model parameters as
a result of the discussions with Stakeholders and Steering Committee members on the
individual issues and technologies Section 3 presents the issues that were considered but did
not result in the AETA Model parameter changes Section 4 presents in detail the OampM cost
15
changes for wind and solar technologies covered in AETA 2012 Updated LCOE graphs as
well as a comparison of the resultant AETA 2013 Model and AETA 2012 Model LCOEs are
presented in section 5 which also presents concluding comments
16
2 AETA MODEL PARAMETER CHANGES
21 Stakeholder Initiated Changes
Consultations for the AETA 2013 Model update identified the following issues for
consideration
nuclear technology capital costs and lsquofirst year available for constructionrsquo
CCS retrofit thermal efficiency
amortisation period for all technologies and
OampM costs
The OampM issue is discussed in section 4 whereas rest of the issues are discussed below
211 Nuclear Capital Costs
The AETA 2012 report and model presents costs for first of a kind (FOAK) and Nth of a kind
(NOAK) nuclear technologies There could have been some confusion from the original
wording of Section 310 of AETA 2012 report It starts by discussing Gen III plants currently
sold (presumably NOAK) however further in the document Gen III plants are referred to as
FOAK The AETA 2012 report states that the capital costs are based on nuclear power plants
in the US The NOAK value is what is represented in Table 3101 in the AETA 2012 report
and model
Although there are cost adjusting factors used for other technologies studied in the AETA
2012 report there is no adjustment of the US cost base for Australian labour costs and for
adjustment of Australian equipment costs Submissions indicated that an adjustment to costs
should also be used for nuclear to ensure there is commonality in the comparison
This suggestion was considered appropriate and adjustment to the costs for nuclear
technologies was made Based on the factors to convert US rates to Australian rates used in
the fossil fuel technologies ie the factors from the Thermoflow software the new nuclear
capital costs were calculated The multiplier from Thermoflow for labour costs is 205 and
the factor for equipment costs is 13 both US to Australia
Additionally it was submitted that the first year available for construction of nuclear
technologies be extended In support of this the submission argued that nuclear technologies
are examples of generation technology where legislation regulation and public policy
planning is highly region-dependent and must therefore precede deployment by several years
This was considered an appropriate submission and therefore the first year available for
construction in the model has been changed from 2012 to 2020 These changes are shown in
Table 1
17
Table 1 Model Changes Nuclear Technologies
AETA 2012 report reference AETA 2012 model value AETA 2013 update
Technology 37 Nuclear (GW Scale LWR)
Change first year available for Construction
2012
2020
Technology 37 Nuclear (GW Scale LWR)
Convert FOAK Capital Cost to Australian productivity
and commodity costs
4210
6392
Technology 37 Nuclear (GW Scale LWR)
Convert NOAK Capital Cost to Australian productivity
and commodity costs
3470
5268
Technology 38 Nuclear (SMR)
Convert FOAK Capital Cost to Australian productivity
and commodity costs
7908
11778
Technology 38 Nuclear (SMR)
Convert NOAK Capital Cost to Australian productivity
and commodity costs
4778
7116
The overall impact of these parameters on individual technology LCOE changes is given in
the AETA 2013 Model and in Section 5
212 Carbon Capture and Storage (CCS) Retrofit Thermal Efficiency
Subcritical coal technologies with CCS retrofit were reported to have only slightly lower
thermal efficiency values compared with new build supercritical technologies with CCS in
the AETA 2012 Model This was an oversight in the AETA 2012 Model
The AETA 2012 report identified the thermal efficiency to retrofit subcritical brown and
black coal plants as 216 per cent and 301 per cent respectively (Table 312) In the same
table the efficiency for new build supercritical brown and black coal plants is reported to be
208 per cent and 314 per cent respectively
The thermal efficiencies were revised down based on actual operating efficiencies of existing
coal facilities in Victoria and NSW and factored based on the thermal efficiency ratio of new
coal facilities with and without CCS
A reduction in thermal efficiency is to be expected when applying a retrofit CCS to the plant
The CCS factor in the following representation refers the efficiency reduction factors for
adding CCS to a coal fired power station The useful output will reduce from the new
parasitic loads to run the CCS equipment
Thermal efficiency of existing brown coal plant in Victoria is 265 per cent and the CCS
factor is 064 Similarly the thermal efficiency of existing bituminous coal plant in NSW is
355 per cent and the CCS factor is 075
Table 311 and 312 of the AETA 2012 report show a reduction is present when comparing
the supercritical with no CCS compared to supercritical with CCS However the retrofit case
was only provided for the subcritical technology only and no case was included in the AETA
2012 for a subcritical plant with any CCS
A review of the values in Table 312 through comparison to the existing efficiency of
installed black and brown coal fleet in Australia was undertaken For brown coal the current
18
sent out thermal efficiency is 265 per cent for a 500 MW subcritical unit For supercritical
brown coal without CCS the sent out efficiency is 323 per cent Applying the same reduction
factor the thermal efficiency with CCS retrofitted should be 17 per cent in lieu of 216 per
cent as published in AETA 2012 report
For black coal the current sent out thermal efficiency is 355 per cent for a 660 MW
subcritical unit For supercritical black coal without CCS the sent out efficiency is 419 per
cent Applying the same reduction factor the thermal efficiency with CCS retrofitted should
be 266 per cent in lieu of 301 per cent as published AETA 2012 report (Table 2)
Table 2 Model Changes CCS Retrofit Thermal Technologies
AETA 2012 report reference AETA 2012 model value AETA 2013 update
Technology 8 Pulverised coal subcritical plant
with post combustion CCS based on brown coal
(retrofit)
Thermal Efficiency
216
170
Technology 12 Pulverised coal subcritical plant
with post combustion CCS based on bituminous
coal (retrofit)
Thermal Efficiency
301
266
19
213 Amortisation period
There was stakeholder consensus that the operating period for all technologies needs to be set
to thirty years and that the construction time is in addition to the operating time The financial
amortisation period is common for all technologies and is set at 30 years In the AETA 2012
model section 24 (a) nominates that the amortisation period of 30 years is from the
commencement of construction The amortisation period has now been changed (Table 3)
Examples of the change are
Nuclear LWR ndash GW scale In AETA 2012 report amortisation period was 30 years inclusive
of construction and operation The amortisation period has now changed to 36 years (30
operating and 6 years construction)
Solar parabolic trough In AETA 2012 report amortisation period was 30 years inclusive of
construction and operation The amortisation period has now changed to 33 years (30
operating and 3 years construction)
Table 3 Model Changes amortisation period
AETA 2012 report reference AETA 2012 model value AETA 2013 update
Common Amortisation period
for construction and operation
Amortisation period for
operation includes
construction for all
technologies
Amortisation period for
operation to exclude
construction for all
technologies
22 No Carbon Pricing
For the 2013 AETA update the carbon price modifier has been set to zero per cent as the
base value for the results presented in this report with the effect of applying a zero carbon
price to all technologies throughout the study period to 2050 The AETA 2013 Model
however has the option of changing this parameter by the user
20
3 CONSIDERATION OF OTHER ISSUES
This section summarises the issues that were discussed during the AETA 2013 Model Update
with AETA stakeholders but have not led to a change in the model However these issues do
not cover the OampM costs considerations that are detailed in section 4
31 Representation of Uncertainty
The recognition of uncertainty within the model was discussed including both the level of
representation and potential uncertainties with respect to First-of-a-Kind and lsquoEarly Moverrsquo
Technologies
A number of factors were identified that lead to uncertainty in estimates ndash particularly for
emerging technologies For conventional coal and gas technologies even though the
technology is mature the addition of carbon capture introduces cost and performance
uncertainty Cost estimates have inherent uncertainty due to the market uncertainties and
unforeseeable technological developments and due to
- Volatility in equipment pricing
- Volatility in economic conditions (during post Global Financial Crisis) and
- Volatility in labour pricing due to ldquootherrdquo heavy construction projects in specific areas
For technologies where the costs are well understood it was considered that the error bars
should be reduced compared to immediate and emerging technologies and that the error bars
should be lower for technology costs in 2012 compared to later years
There is strong agreement from two key stakeholder submissions with all the factors causing
uncertainty that have been identified in AETA 2012 In particular the labour cost has varied
(increased) significantly due to large construction projects which have increased costs due to
a shortage of labour and a lower productivity due to less experienced personnel The
uncertainties provided in the AETA model are available on a per technology and a per
selected years basis BREE will consider whether or not to include more detail on
uncertainty by technology in the 2014 review of the model
32 Application of Learning Curves
It was raised during the consultation process that the AETA model revision could allow for
learning curve cost reduction assumptions to be altered by the end user This has not been
incorporated in the 2013 update as it is a structural change to the AETA Model
Stakeholders also raised the question as to whether it is possible within the application of
learning curves to distinguish between the potential for cost reductions on manufactured
components like PV panels versus the Balance of Project (BoP) costs which may involve
routine assembly and erection activities which are not subject to significant learning by
doing
However there are opportunities for cost reductions particularly where many repetitive tasks
are involved such as solar field construction modular construction techniques
rationalization of components in the BoP design or reduction in assembly or placement time
21
This is supported in the US Solar Market Insight Report 2012 (Kann 2012) which identified
continued savings in inverter and racking costs as follows
ldquohellip falling equipment costs and fine-tuning of installation practices have made large-
scale solar less expensive QQrdquo
ldquohellip with the continuing maturation of the industry we expect continued focus on
reducing PV balance-of-systems costs (BOS) and that the increased worry over high
penetration PV will drive adoption of 1000Vdc and advanced inverters
respectivelyrdquo and
ldquoMounting structure manufacturers noted that the past year has seen tremendous
pricing pressure accounting for price declines of anywhere between 10 per cent and
30 per cent over the past yearrdquo
Given that the balance of plant costs can also be subject to cost reductions it is not
considered necessary to distinguish learning curves for discrete project costs in the model
33 General Costs Considerations
331 Fuel Costs
The outlook for fuel costs for gas coal and carbon was claimed to have materially shifted
since the AETA 2012 model While there was no evidence provided to support this
consideration will be given to this issue in the 2014 model update
332 CCS Costs
A submission cited the ZeroGen Case Study and sought to clarify the differences in CCS
cost between ZeroGen and lower values estimated for AETA 2012 This is a valid
comparison however BREE notes the following issues which contribute to explaining the
differences The international cost component is as follows AETA 52 per cent ZeroGen 34
per cent With the USD exchange rate AETA 1 ZeroGen at 08 adjusting the AETA value
for exchange rate variation would add A$952kWnet to the AETA value There is a
difference in plant size with AETA at 557 MW net and Zerogen 400 MW net A bigger plant
size would typically provide a lower cost kW installed
Additionally section 112 of Chapter One of the ZeroGen report advises escalation based on
project delivery from 2011 to 2017 AETA costs are for 2012 basis and do not include
escalation beyond this time A portion of the Zerogen costs will be inflated over the
comparable AETA cost Also section 113 of Chapter One of the ZeroGen report identifies
significant enabling works This is likely to be more inclusive than considered in the AETA
2012 report as identified in section 23 (a)
Overall it is considered likely that a number of estimate basis items in the ZeroGen study are
different and once equalised will show a smaller difference between the AETA and
ZeroGen values Therefore there is no immediate action but the basis and assumptions of the
model may be reviewed during 2014 AETA update
With regard to CCS efficiency one submission proposed that the AETA estimates were
overly optimistic However no references were cited to support this view and no change has
been made to the model
22
333 Opportunity Costs
A submission was made that footnotes be included regarding retrofit costs to indicate that
make-up power costs are not included This was not adopted because AETA parameters for
each technology are calculated for that technology alone and do not consider the impact of
reduced output of a retrofit project where additional output needs to be generated from
alternate higher cost generation Opportunity costs are specifically related to business cases
for specific projects and are not considered for any cases presented in the AETA report
Moreover retrofitting does not make electricity generation uncertain or intermittent It only
lowers the flow of generation at a constant rate (due to lower thermal efficiency) relative to
the non-retrofit case
34 Capital and Construction Costs
A submission was made to update the AETA values for the mid-point capital cost for several
technologies based on a study provided in support of the submission The technologies
asserted were
IGCC (Integrated Gasification and Combined Cycle) with 90 per cent capture fuelled
with Victorian brown coal
IGCC with no capture fuelled with black coal
IGCC with 90 per cent capture fuelled with black coal
Pulverised Fuel power plant with 90 per cent capture fuelled with Victorian brown
coal
Pulverised Fuel power plant with 90 per cent capture fuelled with black coal and
OCGT with no capture fuelled with natural gas
There is a key difference in the magnitude of the labour component in Australia compared
with the labour costs associated with the supporting material (from the USA) While no
changes have been made to the model in this update the ldquoshort termrdquo impact of labour
pricing on technology costs may be considered in further updates
Similarly it was submitted that the capital cost values for combined Cycle Gas Turbine
(CCGT) (with and without capture) could be revised As no documentary evidence was
provided to support this no change was made
For Direct Injection Coal Emulsion (DICE) power plant with no capture fuelled with
Victorian brown coal it is also suggested that the values be reviewed with a number of
papers provided for reference However these papers do not address capital cost in any depth
and it is unclear if the balance of project costs included are comparable with AETA DICE
technology is not mature and is probably best described as in the demonstration to
deployment phase of development which brings uncertainty into the cost analysis Therefore
data is needed to substantiate this submission As this was not available at the time of
preparing this report consideration of this issue is deferred to a later time when the necessary
data is available
An increase in the capital costs for Solar thermal trough (6 hrs storage) and Solar thermal
central receiver (6 hours storage) were proposed based on a supporting study by the Electric
Power Research institute (EPRI) The proposed values are substantially larger than the AETA
23
2012 but it is not clear what basis is used to generate these revised values A separate
submission received from another AETA stakeholder has supported the AETA values
Additionally the cited reference for solar thermal trough the Energy Power Research
Institute (EPRI) plant configuration is based on air cooling ndash while for AETA the plant
configuration assumes water cooling The difference in plant configuration will account for a
small part of the difference The AETA value is based on a reference report as issued in 2012
by the US National Renewable Energy Laboratory (NREL 2012)
The AETA value for the central receiver technology is based on a small (20MW) plant
(Gemasolar) with factors for adjustment to field size for thermal storage capacity and post
FOAK learning These factors will align with increased uncertainty in the AETA value It is
likely that additional cost information may now be available for the Brightsource Ivanpah
plant (no storage) and other tower plants being considered under construction
Further investigation of these issues has been sought with stakeholders but is as yet
unavailable
Another suggestion was made to consider capital costs on a component basis The capital
costs used in AETA 2012 for existing technologies were based on actual costs that could be
sourced on published documents (locally andor internationally) or from WorleyParsons
internal data For developing technologies costs were not considered on a component level
For this reason in technologies that are not commercialised a number of assumptions would
need to be made which may limit lsquorealrsquo costs being available No change to the model arose
from this submission
A reassessment of the construction expenditure profile for concentrating solar power (CSP)
technology options was sought in another stakeholder submission and supported by a
referenced report (IT Power 2012) However the plant sizes considered in the AETA report
are larger capacity (100 MW+) than those discussed in the cited report and consequently
have a longer duration construction period As three years is considered to be an appropriate
time period to spread the construction expenditure profile no change to the model was made
35 Costs Associated with Solar Technologies
A change to the model was sought with regard to the significant downward trends in the cost
of solar PV The stakeholder submission cited pricing data from the Australian Photovoltaic
Institute (APVI) Consultation with the APVI identified that evidence based information for
utility scale PV costs in Australia is limited because Australia has no PV systems 100 MW or
larger It is acknowledged however that there is significant and continued volatility in the
solar PV market including volatility due to competition oversupply in the PV module
market as well as continued price reductions for balance of system and installation costs
A$338 Wnet was a reasonable valuation for 2012 AETA The AETA 2012 value will be
maintained but may be reviewed in the 2014 model update
It was also suggested that solar thermal costs could be better represented in the model by
allowing for different periods of storage rather than a standard 6 hours The AETA 2012
scope was based on fixed plant designs which included fixed thermal storage sizing where
thermal storage was included With thermal storage there are a number of variables that can
be considered including differing field sizes (solar multiple) as well as actual thermal storage
capacities This is likely to add significant complexity to the report and to the model the
benefit of which at this stage does not warrant the changes
24
36 Costs Associated with Nuclear Technologies
It was submitted that consideration be given to including the impact on LCOE for nuclear
technology of the relatively high insurance costs for nuclear technologies This issue will be
considered in the 2014 review of the AETA model However insurance costs or plant
decommissioning costs are not considered for any of the 40 AETA technologies
Also the OampM improvement rate for Nuclear was not reconsidered as there is no OampM
improvement rate for Nuclear in the model
37 Further Technologies
A proposal was received which recommended that further technologies (DICE power plant
based on black coal with and without capture and DICE brown coal with capture and
medium speed DICE technologies) be incorporated into the AETA Model However as
mentioned earlier this update of the AETA 2012 Model only considered the technologies
included in that model This update of the model is not intended to broaden the technologies
38 Auxiliary Loads
Another example used for the purposes of drawing comparisons with the AETA model was
the SaskPower Post Combustion Retrofit It is difficult to distil the SaskPower project data
into a direct comparison with the AETA study and consequently there is insufficient data
certainty to warrant changes to the AETA 2012 values The SaskPower Post Combustion
Retrofit was also cited as to its conservative auxiliary loads for brown and black coal
However upon further investigation this was not substantiated within the SaskPower
example
25
4 WIND PV AND CSP OPERATIONS AND MAINTENANCE (OampM) COST UPDATE
41 Operation and Maintenance Costs
OPERATING AND MAINTENANCE COST DEFINITIONS
In considering the costing of OampM there is no absolutely clear definition of which costs
should be considered as fixed and which variable with the breakdown varying based on a
range of issues including technology location and resource type For this reason in the future
AETA reports OampM costs may be compared in terms of annual total operating expenditure
(OPEX) per MW of generation This method is widely used by most international institutions
to analyse OampM costs and to avoid subjective considerations
For this report fixed and variable costs are reported to provide direct comparison with AETA
2012 In this regard in general fixed costs are independent of the electrical generation of the
plant and are expressed as annual cost per MW capacity Fixed costs include items such as
fixed labour
equipment and
vehicles
Variable costs are proportional to the electrical generation of the Plant and are expressed as
cost rate per kWh energy output Variable costs include items such as
variable labour
consumables and
spare parts
As both public and private domain material vary in the way they approach and report on
fixed and variable maintenance within the following text where an interpretation has been
used for comparison purposes this is described
A submission was made to remove the operations and maintenance (OampM) cost escalation
factors This was not taken up as there is an increase in the OampM costs over CPI which is
borne out historically A review of the basis for this escalation determined that the
underlying assumptions were appropriate The review also considered adopting a generic
learning curve approach for OampM improvement rates as was suggested in one submission
This was not adopted as the model has an OampM improvement rate (set at 02 per cent per
annum) which can be varied by the user for wind and solar technologies This value accounts
for more efficient practices balancing the increase in labour and material costs over and
above CPI However changes to OampM improvement rates for selected technologies were
made as mentioned earlier OampM improvement rate values may be further considered for
emerging technologies in 2014 AETA study
A number of submissions referred to the improvement rate of OampM costs with evidence for
existing technologies to support these rising at 150 per cent CPI It was suggested that for
26
developing technologies it could reasonably be assumed that there would be reductions in
OampM between the first commercial installation and subsequent installations
While it is generally acknowledged that the LCOE of delivered energy from wind is falling
within the literature there is conflicting evidence around trends in OampM costs with recent
reports indicating both significant decreases and increases in OampM (see section 432)
Solar thermal plants consist of technology components that can be considered mature (eg
steam turbine) and components that are undergoing further development such as the solar
field and thermal storage Solar thermal plants require manning for operation as opposed to
wind turbines that do not require the same level of manning
A recent article (Muirhead 2013) advised for the Solar Energy Generating Systems (SEGS)
plants in California that have been operating since the early 1990rsquos ldquoMy understanding is
that the performance of the SEGS plants has significantly improved over time This is due
primarily to replacement of first generation receivers with newer receivers that are much
more efficient OampM practices at the plants have also improved over time based on the now
long history of operating these plants resulting in increased output in addition to reduced
OampM costs
In the AEMO report 100 Per Cent Renewables Study - Draft Modelling Outcomes Scenario 1
assumes that rapid technology transformation will drive real reductions in OampM costs
outweighing any increases projected in the AETA 2012 so OampM costs reduce by 125 per
cent by 2030 and 25 per cent by 2050 Scenario 2 uses the AETA 2012 assumption that
OampM costs escalate at around 150 per cent of Consumer Price Index (CPI) which leads to
cost increases of 27 per cent by 2030 and 46 per cent by 2050 It should be noted that the
Scenario 1 reductions are assumptions without further analysis of what will bring the
assumptions to fruition
In AETA 2012 the common OampM improvement rate for most technologies is set at 02 per
cent and can be varied as a user input The OampM improvement rate for emerging
technologies solar thermal and photovoltaic technology options and offshore wind is set to
25 per cent and can also be varied as a user input The improvement rate is now compounds
on the previous yearrsquos value
The OampM improvement rate values may be further considered for emerging technologies in
2014 AETA study
42 Operating and Maintenance (OampM) Changes in summary
As part of the Model Update special emphasis was placed in this report on the Operational
and Maintenance (OampM) costs and OampM improvement rates for all wind solar thermal and
solar PV renewable technologies covered in AETA 2012 As mentioned earlier this took into
account relevant Australian and international reports public domain information private
sources as well BREE and WorleyParsonsrsquo in-house experience The updated OampM values
are shown in Table 4 Reductions in CSP OampM costs of between 8 per cent and 27 per cent
were obtained in comparison to values provide in AETA 2012 report
The review included a detailed review of a report by IT Power cited as part of one of the
stakeholder submissions In that report reference is made to a case where $18MWh of OampM
costs comes from 64MW trough plant however it does not specify the relevant location hour
27
of thermal energy storage (TES) capacity factor type of cooling and back-up fuel and
therefore cannot be fully analysed nor used towards this AETA update
OampM costs for solar thermal plants are significantly affected by the costs of manpower To
demonstrate this with an example $18MWh for a 100MW plant with a 23 per cent capacity
factor (the IT Power report consideration) would result in an annual OampM cost of
approximately $36 million A 100MW plant will need at least 28 full time employees to be
properly manned 7 daysweek as there needs to be multiple shifts With this amount of
labour there are insufficient funds for site services utilities and materialsmaintenance If the
value is based on another location such as the Far or the Middle East region where labour
costs are significantly lower then a lower OampM cost may be feasible however for Australia
this does not appear to be feasible
The changes to OampM values for the 2013 AETA model refresh are summarised below
Table 4 Model Changes OampM costs
AETA 2012 report reference AETA 2012 model value AETA 2013 update
Section 23 Technical Assumptions
Operating and Maintenance Cost
Estimates
OampM improvement rate 02per
cent all technologies
OampM improvement rate maintained at
02per cent for
Coal based technology options
Gas based technology options
Solar thermal hybrid options
Onshore wind
Biomass technology options
Wave technology options
Geothermal technology options
Nuclear technology options
OampM improvement rate changed to 25per
cent for
Solar thermal technology options
Photovoltaic technology options
Offshore wind
The OampM improvement rate is compounded
from the previous yearsrsquo value
Section 33 Solar thermal
technologies
Solar thermal - Parabolic Trough wo
storage
Fixed OampM (AUS$MWyear)
Variable OampM (AUS$MWh)
60000
15
59176
1519
Solar thermal - Parabolic Trough with
storage
Fixed OampM (AUS$MWyear)
Variable OampM (AUS$MWh)
65000
20
72381
1139
Solar thermal - central receiver
technology wo storage
28
AETA 2012 report reference AETA 2012 model value AETA 2013 update
Fixed OampM (AUS$MWyear)
Variable OampM (AUS$MWh)
70000
15
58285
707
Solar thermal - central receiver
technology with storage
Fixed OampM (AUS$MWyear)
Variable OampM (AUS$MWh)
60000
15
71312
565
Solar thermal - Linear Fresnel wo
storage
Fixed OampM (AUS$MWyear)
Variable OampM (AUS$MWh)
60000
1500
64105
1519
Solar thermal - Linear Fresnel with
storage
Fixed OampM (AUS$MWyear)
Variable OampM (AUS$MWh)
65000
20
72381
1139
Section 35 Photovoltaic
technologies
PV ndash non tracking
Fixed OampM (AUS$MWyear)
25000
25000 (no change)
PV - Single Axis Tracking
Fixed OampM (AUS$MWyear)
38000
30000
PV - Dual Axis Tracking
Fixed OampM (AUS$MWyear)
47000
39000
Section 36 Wind Technologies
Wind Onshore
Fixed OampM (AUS$MWyear)
Variable OampM (AUS$MWh)
40000
12
32500
10
Wind Offshore
Fixed OampM (AUS$MWyear)
Variable OampM (AUS$MWh)
80000
12
77600
30
43 Wind
431 Introduction
This Section reviews onshore and offshore wind operations and maintenance (OampM) costs
used in AETA 2012 The values scrutinised are the fixed and variable OampM given in Table
361 of that report summarised in Table 5 below
29
Table 5 Wind OampM costs used in the AETA 2012 report
Option Fixed OampM (AUS$MW) Variable OampM (AUS$MWh)
Onshore 40000 12
Offshore 80000 12
OampM covers all of the services required to keep the wind farm operating as contracted to
supply energy and renewable energy certificates for its lifetime inclusive of
turbines and all balance of plant (roads buildings electrical equipment SCADA
control equipment) up to the high voltage connection point on the wind farm
substation
labour (both trades and professional)
facilities (workshops stores offices)
equipment (tools jigs vehicles rigging safety equipment craneage)
spare parts and
consumables (such as oil grease and office consumables)
Windfarm size was not specified in AETA 2012 however it was noted that wind farms
greater than 100MW are becoming more common Since then within Australia wind farms
of larger and smaller sizes have been constructed for example the 420 MW Macarthur Wind
Farm in Victoria and the 55 MW Mumbida Wind Farm in Western Australia with both larger
and smaller wind farms under proposal For this review a nominal size of 100-150 MW is
used as representative of current and future facilities
432 Review of Evidence
As mentioned earlier the review of public literature by BREE and WorleyParsons the
procurement of private studies consultations with owneroperators in the wind farm OampM
sector in Australia AETA Stakeholders and project Steering Committee members were used
to assist the current Model Update process Where possible these sources are noted in the
text however some of these sources have asked to remain anonymous and where so the
term ldquoprivate sourcerdquo has been used
As noted by one reviewer in NREL 2011 OampM cost information in the public domain in
both quantum and quality is poor and the situation appears no better in 2013 particularly in
the discrimination of fixed and variable costs One reason for this is the commercial and
increasingly competitive nature of the sector with wind farm OampM now a significant
business worldwide with subsequent confidentiality around actual costs
What constitutes wind farm OampM is also changing This is driven in part by technological
change as the wind fleet ages as new turbines become larger and more sophisticated
particularly offshore Competition in the provision of OampM services is also changing with
maturing of the wind energy product As an example the following industry trends are now
evident
30
a growing role of independents in the wind OampM market ndash around 25 per cent of the
wind fleet in the US is expected to be operated and maintained by independents by
2025 (Ebert and Ware 2013) as opposed to original equipment manufacturers (OEMs) -
wind is largely a commodity market and easier for new participants to enter something
not necessarily seen with other generation technologies
tighter supply markets ndash general economic volatility is tightening the supply and
project development chain for wind moving interest into the OampM sector bringing
price volatility and more competition
a more sophisticated asset management model ndash where OampM providers are linking
operational data with long term condition monitoring output forecasting and work
order scheduling to deliver what is termed ldquolifecycle optimisationrdquo squeezing more
energy out of the asset
older turbines exceeding planned maintenance budgets ndash with the chief issue being
keeping the variable OampM from unforeseen breakdowns
a push for larger turbines particularly offshore (5-10 MW) and in deeper waters and
linking OampM to turbine contracts ndash there is evidence (including in Australia private
source) that wind farm OampM is becoming an even more significant bargaining
component of turbine supply contracts where lower supply costs are balanced by
longer OampM contracts
Costs of wind OampM are difficult to summarise as they are dependent on many issues As just
one example in the NREL 2011 study cited earlier a wide variability in wind farm OampM
costs was found across a range of countries (Figure 1) This reference demonstrates this
variability from the average reference case in terms of Levelised Cost of Energy (LCOE)
31
Figure 1 Effect of country variables on LCOE of wind plant
Source NREL (2011)
Other issues which affect the contracted cost of OampM for wind include
regional variations in labour and transport costs
wind farm environment particularly wind regime and proximity to the ocean
(corrosion)
the maturity and availability of wind turbine technicians
the spread of facilities geographically and the wind farm asset sizes in a portfolio
the turbine type and brand particularly the support establishment within a Region
the age of the asset OampM history and existence of Type (or systematic) failures of
major components
the ability of the OampM provider under the contract to source third party spares andor
try varied maintenance practices and
the nature of the OampM contract ndash for example does it include risk reward elements or
have a link to the wind turbine supply contract or is it a ldquoproduction availabilityrdquo
contract type
While it is generally acknowledged that the LCOE of delivered energy is falling for wind
technology (Hand 2013) within the literature there is conflicting evidence around trends in
OampM costs with recent reports indicating both significant decreases (BNEF 2013) and
increases (Ebert and Ware 2013) It is generally acknowledged that increased competition in
the OampM market is delivering lower cost service provision but this may in part be offset by
an ageing fleet requiring more variable maintenance and a more sophisticated and costly
32
response Several studies have demonstrated that the costs of maintaining wind turbines
generally increase with time following a trend similar in shape to that in Figure 2 (Hand
2013) with estimates in Albers (2009) indicating a doubling in turbine OampM costs by mid
plant life The term COD in Figure 2 refers to commercial operations date
Figure 2 Typical cost increasing trends in wind farm OampM costs with commercial operations
date
Source Adapted by WorleyParsons from Houston (2013)
In Australia this trend is also evident in post 10-year aged machines (private source)
particularly in relation to variable maintenance The nature of any similar increase with more
modern turbines is unpredictable although turbine availability is improving and there is
evidence that OampM costs with each generation of turbine are lowering see Wiser et al
(2012)
The OampM costs for offshore wind farms are particularly difficult to estimate as the industry
is still at the early stages of development including the progression of much larger turbines
into deeper water and the more complex nature of the task Such progression is indicated in
Figure 3 taken from RolandBerger (2013) which indicates an expected decrease in OampM
costs These costs are of the same order of that published in other recent publications UK
Crown Estate (2012) and US DoE (2013)
33
Figure 3 Trends in offshore wind farms and estimated impact on LCOE
Source RolandBerger (2013)
433 Updated OampM Figures for Australia
It is not a simple matter to transfer international costs to Australia as despite trends there are
significant differences between regions including
size of market ndash despite growth the Australian wind market is small with respect to
other world regions For example the total wind fleet is 4 GW (CEC 2013) for
Australia versus 60 GW for the US (AWEA 2013)
labour and material rates in certain parts of Australia are high by world standards
the logistics of getting to and within Australia generally involve longer distances than
other areas of the world particularly due to the remoteness from major equipment
suppliers
volatility of the Australian dollar particularly against the US and
the size of Australian wind farms tends to be larger
These differences can be seen in Figure 4 supplied by a turbine equipment supplier (private
source) and showing the relative OampM costs (per MW) and technician numbers (per 100
MW) across various world regions in 2012 for wind turbine maintenance only and excluding
balance of plant Numbers and scales between the two indices have been removed to protect
the confidentiality of this supplier with data believed to cover the entire global portfolio
under management This shows a significant difference between regions for onshore in both
indices for example almost a 45 per cent difference in costs between Europe and America
Australia would sit within ldquoAsiaPacificrdquo and while the Figure indicates generally lower
OampM costs and higher technician numbers for this region this presumably covers a very
diverse area (including South East Asia New Zealand and Oceania) which may skew results
34
Unlike many larger global markets the wind OampM sector in Australia is dominated by
turbine equipment suppliers with original equipment manufacturer (OEM) contracts
estimated to cover more than 95 per cent of the fleet The evidence for this is mostly
anecdotal although a number of smaller independent suppliers are now known to be
undertaking full service OampM for older plant (gt10+ years) with many of the drivers for this
covered in Ebert et al (2013) There is also evidence (private source) that wind turbine
suppliers in Australia are seeking OampM contracts with much longer terms and tying these to
reductions in turbine supply prices This may indicate a lack of competitive pressure on
OampM pricing in the near to mid-term and as the size of the overall market is small it is
unknown whether independents will grow market share as has been the case in many larger
global markets see for example Deloitte amp Touche (2012)
The most recent contemporary literature comments on onshore wind farm OampM pricing in
Australia and surrounds that could be found in the public domain and not used for the AETA
2012 work are from Hassan (2011) and Deloitte (2011) These are summarised with other
new international references cited in Table 6 with assumptions on any conversions noted
below the table As no offshore wind farm projects have been progressed in Australia the
table includes values from new sources for offshore projects from the international public
domain literature - the significant difference to onshore costs is evident in the values
Figure 4 OampM Costs (per MW) and Technician Numbers (per 100MW) for total wind turbine
OampM (Opex)
Source Private - values and scales removed to protect confidentiality
From Table 6 and considering the differences in markets it appears that for onshore wind the
AETA 2012 estimates may be slightly high with an updated AETA 2013 recommendation
given in Table 7 This value has been arrived at by considering
the size of the Australian wind market and lack of competitive pressure from
independent OampM service providers
35
supply side pressures on OEMs driving them to protect their OampM businesses and
lowering costs
the likely increase in fleet installations to comply with RET legislation skewing the
fleet age to more a modern generation of turbines although it is noted that there is some
uncertainty around long term OampM cost trends particularly variable maintenance ndash an
asset age of around 5 years is assumed here
uncertainties in what is included in referenced values and differences in markets and
advice from actual asset owners and OampM providers (private sources) on current actual
costs
Table 6 Comparison of AETA 2012 wind OampM estimates with new references for 2013
Source Region
Fixed OampM
(AUS$MW)
Variable OampM
(AUS$MWh)
Total OPEX
(AUS$MW)
On
sh
ore
AETA 2012 Australia 40000 12 799451
Houston 2013 US - - 35-380002
BNEF 2013 Global - - 25000
3
Private Source (2013) (gt 10 yr old
plant) Australia - - 70000
Private Source (2013)
(lt 2 yr old out of warranty plant) Australia - - 55000
Hassan 2011 Australia - - 83-99000
4
Deloitte 2011 New Zealand - - 450005
Off
sh
ore
AETA 2012 Australia 80000 12 1262526
Crown Estate 2012 UK - - 275000
7
Hassan (2013) UK - - 2391567
RolandBerger 2013 Europe - - 198000
8
US DoE 2013 US - - 144970
9
1 Assumes a 38 capacity factor
2 USAUD = 109 extrapolated from Figure approximately to 2013
3 EUROAUD = 142 uncertain if this includes all balance of plant or VOM and only includes OEM providers
4 Assumes a 38 capacity factor
5 Assumes NZAUD = 084 a 38 capacity factor and the mid-range estimate for OampM
6 Assumes a 44 capacity factor
7 Assumes GBPAUD = 167 and taking midpoint of estimates stated
8 Assumes GBPAUD = 167 and taking value for 3MW turbines
9 Assumes USAUD = 109
36
The figures shown for onshore projects in Table 7 represent a 15 per cent decrease in the
expected OampM costs of wind farms in Australia compared to AETA 2012 This change
reflects the volatility in this market noted in previous sections and in referenced material
internationally plus the appearance of significant downward pressure on wind OampM prices
primarily through increased global competition The values allow for the rising price of
turbine OampM as the turbine ages during its life
For offshore wind it appears that the OampM costs in AETA 2012 are too low and although it
is tempting to align costs with the most recent US figures due to their lower costs and similar
coastal conditions to Australia the European offshore fleet is significantly larger and more
mature Average figures across the 2013 referenced material including Europe is
recommended This is also shown in Table 7 and represents a significant increase in estimate
costs (around 33per cent) which reflects this evolving sector
There is very little contemporary information available on the breakdown of fixed and
variable maintenance on wind plant making judgment around this for the AETA requirements
is difficult However there is some published but copyrighted material eg GlobalData 2012
which combined with others (private sources) indicates that for onshore and offshore wind
plant respectively a 5050 and 4060 FOM VOM split is appropriate This has been used to
adjust the total OPEX figure in Table 7 to the AETA scheduled and variable indices
requirements using a 38 per cent and a 44 per cent capacity factor for onshore and offshore
projects respectively
Table 7 Recommended AETA (2013) values
AETA (2013) update Fixed OampM
(AUS$MW)
Variable OampM
(AUS$MWh)
Total OPEX
(AUS$MW)
Onshore $32500 $10 $65790
Offshore $77600 $30 $194000
44 Solar Photovoltaics (PV)
441 Introduction
This Section of the report focuses on the OampM costs for ground-mount photovoltaic (PV)
technologies broken down by the following mounting system configurations
Fixed Tilt (FT)
Single Axis Tracking (SAT)
Dual Axis Tracking (DAT)
Although different PV panel technology types (eg poly-crystalline mono-crystalline or thin
film CdTe) affect the capacity factor and land use the OampM costs are comparable The
estimates for this Report are based on polycrystalline PV technology which provides an
average cost on a per Watt basis with mono-crystalline OampM costs being slightly lower and
thin film OampM costs being slightly higher
With the aim to provide comparable results between technologies WorleyParsons has
analysed and updated the PV OampM costs in terms of both fixed operation and maintenance
37
costs (FOM) and total operating expenditures (OPEX) based on reference plants of similar
characteristics
Assumptions interpretations and considerations based on their in-house data and global
market trends are described in the following Sections
442 Review of the Evidence
Since the AETA 2012 report release few new public domain reports related to OampM costs
for PV systems have been published To confirm this the following organisations have been
consulted by WorleyParsons to provide the 2013 OampM costs update for the selected PV
configurations
International Renewable Energy Agency (IRENA) (wwwirenaorg)
International Energy Agency (IEA) (wwwieaorg)
The World Bank (WB) (wwwworldbankorg)
The US National Renewable Energy Laboratory (NREL) (wwwnrelgov)
Solar Energy Industries Association (SEIA) (wwwseiaorgau)
European Photovoltaic Industry Association (EPIA) (wwwepiaorg) and
Solar Electric Power Association (SEPA) (wwwsolarelectricpowerorg)
Upon review of the available information when compared to AETA 2012 the listed
organisations do not have any new public information related to large-scale PV OampM costs
If OampM costs are mentioned they are normally referenced as a per cent of the total Capital
Expenditure (CAPEX) for the plant (around 1 per cent) and provide little useful information
about OampM Cost changes
Due to insufficient detailed and recent information in the public domain WorleyParsons
obtained the following market reports from Photon a private organisation focused on market
news political discussions and technology analysis for the PV industry
Photon 2013 ldquoThe True Cost of Solar Power - Temple of Doomrdquo and
Photon 2013 ldquoSolar Annual 2013 - Build your Empirerdquo
These private reports had minimal focus on OampM costs To provide further input in this
area private OampM service providers were contacted for pricing estimates and market trends
443 AETA 2012 OampM PV costs report comparison
Typical power plant OampM costs are expressed as a combination of a variable component
(proportional to generation) and a fixed component (occurs irrespective of generated output)
Since the generation of a PV plant is dependent on solar radiation (not requiring fossil fuel or
water which make up the major components of variable costs for conventional generation) it
is typical to express the OampM costs only as Fixed OampM (FOM) costs proportional to the
plant size due to the simplicity of PV systems The AETA 2012 report follows this practice
and estimates the PV OampM costs as FOM only relative to plant size (kW) expressed on a per
year basis
38
In order to facilitate comparisons of these costs with other electricity technologies the FOM
costs in the AETA 2012 report are also presented as OPEX costs per MW of generating
capacity per year
ASSUMPTIONS AND CONSIDERATIONS
The following costs are included in the FOM estimates as an annual cost per kW capacity
labor and administrative expenses
panel washing (twice per year at $300 kl for water)
weed abatement (seasonal herbicide applications)
inverter replacement reserve (replaced at operational year 10) and
materials and maintenance spare parts civil works preventative and corrective
equipment maintenance
Although the cost of water is variable depending on location and usage it is such a small
portion of the total OampM costs that it is adequate to assume it as a fixed cost using the
assumptions listed above
AETA 2012 PV OampM COSTS COMPARISON REPORT
The technical characteristics of the reference PV plants used in the AETA 2012 report have
been extracted from the AETA 2012 Model (Version 1_0 Rev B BREE 2012) and are
summarised in Table 8
Based on this information the following parameters for the PV technologies are estimated
Total net energy production in terms of MWh sent out per year
Total plant acreage
FOM in terms of USD per year and
Total OPEX costs in terms of USD per year and USD per total net energy production
per year
39
Table 8 AETA 2012 reference plants technical characteristics and OPEX costs
Plant Characteristics Units Fixed Tilt (FT) Single Axis Tracking (SAT)
Dual Axis Tracking (DAT)
Plant Characteristics
Plant Net Capacity MW 100 100 100
Capacity Factor per cent 21 24 26
FOM $kWyear 25 38 47
Net Energy MWhyear 183960 210240 227760
Plant Acreage acres 500 800 900
Total FOM $year 2500000 3800000 4700000
Total OPEX $year 2500000 3800000 4700000
Total OPEX $kWh 00136 00181 00206
Total OPEX costs are between 00136 and 00206 USDkWh as shown in Table 8 above
These values are conservative cost estimates but reasonable for a large-scale PV plant with
comprehensive OampM service As is expected the FOM or OPEX costs increase as the plant
footprint increases and the complexity of the mounting system increases However the
increases to single and double axis tracking technologies are larger than would be expected
The increased complexity of the trackers does add costs to OampM in terms of labor parts and
even physical plant size but these additions are minor in comparison to the larger OampM
budget items such as the inverter replacement reserve and general electrical maintenance
which are irrespective of mounting system
These values although conservative still show the cost reductions from the industry learning
curve and expanded competition over the past few years when compared to past estimates of
OampM costs This can be seen in the following Table 9 of Fixed Tilt (FT) costs which
provides some estimates found in previous publications by IEA (2008) and EPRI (2010) The
tracking estimates are not shown since minimal data is available This corresponds to the
historical market trend of the industry being more willing to install fixed tilt systems rather
than tracking systems due to lower costs and technology risk
Table 9 Comparison of historical estimated PV and OampM costs in the public domain
PV Configuration OampM Costs Units IEA 200810
EPRI 2010 AETA 2012
Fixed Tilt (FT) FOM $kWyear 40 32 to 37 25
values in Italics are derived from reported data
10
Report assumed 1 of capital costs and 23 capacity factor
40
45 AETA 2013 PV OampM Costs Update
Using the same plant characteristic assumptions as the 2012 AETA Model the 2013 OampM
costs were estimated by WorleyParsons based on the references described in review of the
evidence in Section 442 The comparison of the AETA 2013 and 2012 OampM costs are
presented in Table 10 below
Table 10 2013 PV OampM costs compared to 2012 PV OampM costs PV Configuration OampM Costs Units AETA 2012 WorleyParsons
2013 Update
Fixed Tilt (FT) FOM $kWyear 25 25
OPEX $kWh 00136 00134
Single Axis Tracking (SAT) FOM $kWyear 38 30
OPEX $kWh 00181 00141
Dual Axis Tracking (DAT) FOM $kWyear 47 39
OPEX $kWh 00206 00173
Although the OampM costs for FT systems are approximately the same SAT and DAT OampM
costs reduced by around 20-30 per cent in this 2013 update compared to the AETA 2012
report The consistency of the FT costs is reasonable and expected to continue for the next
few years as discussed further in Section 451
Regarding the SAT and DAT costs although there have been improvements in the design of
trackers for PV applications this OampM cost reduction is due to a better understanding of the
costs associated with electrical and tracking system maintenance The cost differences
between tracking systems was corroborated by quotes from private OampM service companies
who indicated that there was only a slight increase in costs from FT to SAT but a larger
increase in costs from SAT to DAT
As compared to the references mentioned in Section 442 the updated cost estimates are
conservative Table 11 compares the estimated 2013 OampM costs with those references
However since these publications focused primarily on the CAPEX with very general OampM
cost assumptions the OampM costs presented therein are not considered representative
baselines for large-scale solar projects Furthermore they attest to the industryrsquos tendency to
focus strictly on installation costs and not lifecycle costs which is discussed further in Section
451
41
Table 11 2013 updated OampM costs compared to new referenced OampM costs (7-2) PV Configuration
OampM Costs
Units WorleyParsons 2013 Update
11
NREL 2013
12
IRENA 2013a
13
Photon 2013
14
Private OampM Service Providers
201315
Fixed Tilt (FT) FOM $kWyear 25 235 17 to 21 18 17 to 23
OPEX $kWh 00134 00216 to
00383
00121 to 00266
00098 00094 to 00127
Single Axis Tracking (SAT)
FOM $kWyear 30 Not provided
Not provided
Not provided
25 to 27
OPEX $kWh 00141 Not provided
Not provided
Not provided
00136 to 00147
Dual Axis Tracking (DAT)
FOM $kWyear 39 Not provided
Not provided
Not provided
32 to 34
OPEX $kWh 00173 Not provided
Not provided
Not provided
00174 to 00185
values in Italics are derived from reported data
451 OampM Learning Rates
In the rapid PV industry growth of the last three years WorleyParsons and anecdotal
experience is that PV was considered generally to require little to no maintenance causing a
general disregard for OampM planning This appears to have resulted in complications as
owners struggle to resolve reliability performance and budget issues as the projects mature
(multiple private sources) Although the maintenance costs are smaller compared to standard
power plants OampM awareness has been increasing in the industry and therefore the OampM
cost estimates have subsequently increased
This is supported through the recent focus of OampM at PV conferences (such as Sandia
National Laboratory and Solar Energy International events) on increasing the investment in
OampM practices in addition to improving the current practices products and services so that
PV plants can be better maintained to achieve higher reliability throughout the plant life
cycle Currently the majority of OampM expenses for PV systems consist of maintaining and
replacing the inverters followed by the Balance of System maintenance In general once the
appropriate level of investment in OampM for PV is reached then OampM costs will begin to
decrease as the following issues develop to maturity
technology improvement
inverter design for reliability and longevity
data monitoring for preventative and corrective maintenance support
system efficiency to increase system output for the same OampM expense
decreased capital costs for major equipment
decreased spare parts costs
11
See assumptions in Section 433 and 443 12
Report assumed 250kW rooftop at 7 to 10 capacity factor 13
Report assumed 1 of CAPEX and 9 to16 capacity factor 14
Values derived from the global weighted average calculations assuming 21 capacity factor and 20 year lifecycle Report assumed a
simple percentage of average selling price 15
Quote excluded weed abatement panel washing and inverter replacement reserve which were supplemented from the WP estimate
Calculations assumed 21 capacity factor
42
industry maturity and stability
reliable OEM support from product consistency and commercial stability
improved codes and standards for PV equipment system design installation
commissioning and OampM and
experience
trained and experienced personnel in the installation and maintenance of PV plants
In line with this trend owners system designers installers and OEMs are now including
OampM considerations in their finances designs services and products Even though there
have been and will continue to be cost reductions in OampM due to the industry maturation
stabilization and competition those cost reductions are balanced with the necessary
increases in OampM investment to meet the maintenance needs of existing and planned PV
plants resulting in a level OampM cost estimate for the next five years
Photon (2013) follows this assumption of consistent OampM costs for the next ten years as well
as WorleyParsons discussions with OampM service providers Therefore the assumption that
PV OampM costs will remain somewhat constant over the next five years before reducing again
appears to follow the projections in the industry
452 Conclusions - PV
The key findings from the AETA 2012 review and update of the PV OampM costs are as
follows
The 2013 WorleyParsons PV OampM costs update resulted in values of
$25kWyear for FT systems
$30kWyear for SAT
$39kWyear for SAT in 2012 USD
Fixed tilt configurations have not seen significant changes in OampM costs compared to
the 2012 AETA estimates while SAT and DAT configurations cost estimates have
reduced approximately 20-30 per cent based on a better understanding of the associated
OampM costs
Values obtained in the 2013 WorleyParsons update are more conservative but are
aligned with values provided by recognised international institutions even though few
detailed OampM breakdowns are available and
OampM costs for PV are expected to remain constant over the next five years before
reducing as the industry matures in both experience and long-term planning
capabilities
43
46 Concentrating Solar Power (CSP)
461 Introduction
This Section of the report focuses on the OampM costs for the following Concentrating Solar
Power (CSP) technologies
Parabolic Trough (PT)
Solar Tower (ST) and
Linear Fresnel (LF)
CSP OampM costs were analysed in terms of
Fixed Operating and Maintenance Costs (FOM)
Variable Operating and Maintenance Costs (VOM) and
Total Operating Expenditures (OPEX)
In order to arrive at comparable results between technologies BREE and WorleyParsons
estimated the OampM costs based on
Reference Plants with similar Solar Plant characteristics localisation net capacity
capacity factor hours of Thermal Energy Storage (TES) and type of cooling system(s)
and
Cost estimate amounts that were updated to 2012 USD
When information was not available necessary estimates were made using WorleyParsonsrsquo
in-house data and based on global market trends observed in various publications
462 Review of the evidence
The following international organisations were consulted to provide the AETA 2013 OampM
costs update for the selected CSP technologies
International Renewable Energy Agency (IRENA) (wwwirenaorg)
International Energy Agency (IEA) (wwwieaorg)
European Solar Thermal Electricity Association (ESTELA) (wwwestelarde)
The World Bank (WB) (wwwworldbankorg)
National Renewable Energy Laboratory (NREL) (wwwnrelgov)
Protermosolar (wwwprotermosolares)
Institute for Energy Diversification and Saving (IDEA) (wwwideaes)
Renovetec (wwwrenoveteces) and
CSP Today (wwwcsptodaycom)
The approach in reviewing OampM costs for the 2013 update for CSP technology was only to
use new sources of information published since the AETA 2012 report was written This was
44
maintained for all but the learning rates estimation which is due to the lack of any new
updated information published since 2012 in relation to this
Upon review of the available public domain information it was found that IEA ESTELA
WB Protermosolar Renovetec and IDEA do not have any new relevant public information
related to CSP OampM costs However IRENA 2013b IRENA 2013c and NREL 2012 are
new references from IRENA and NREL that are considered relevant and which were used in
this report
The information contained in these references did not provide updated costs for all of the
CSP technologies being considered in this Report and the values offered were not provided
in terms of FOM and VOM costs as preferred
Due to the lack of new relevant information in the public domain the AETA 2013 Model
Update process obtained reports from CSP Today a private international organisation
focused on news events reports updates and information for the CSP industry in markets
such as India South Africa Spain USA Chile and MENA regions The Update acquired the
last edition of PT and ST reports CSP Today 2012a and CSP Today 2012b for which OPEX
costs were analysed
463 AETA 2012 OampM CSP costs report comparison
Operating and Maintenance expenses were provided in terms of fixed and variable costs in
the AETA 2012 report and this Model Update has modified these for 2013 for PT ST and LF
technologies based on the references cited above and further consideration of learning rates
for the CSP industry
Most CSP projects with commercial operational experience are parabolic trough technology
as it is the most mature technology and currently more is reported and known about actual
costs than other CSP technologies Nevada Solar One as an example is a 64MWe parabolic
trough plant based in California which was commissioned in 2007 and it is the first plant
built after the SEGS development during the 1980-90s also in California
Andasol 1 the 50 MWe parabolic trough plant based in Spain is also the first CSP plant
worldwide to implement a commercial thermal energy storage system with a capacity of 75
hours of full load storage It commenced operation at the end of 2008 and other similar and
larger trough projects are now operating or being constructed
As the most mature CSP technology trough plant should be further down the operational and
design operability maturity path and hence have a lower opportunity for OampM cost
reductions through learning By contrast Solar Tower and Linear Fresnel systems are only
beginning to be deployed at larger scale and hence there is expected to be more potential to
reduce their capital and operating costs and improve performance
Learning rates have been argued by stakeholders as being very significant for CSP plant with
comments of the AETA 2012 report centring on this issue Disappointingly there is no new
published evidence or actual plant report data that could be found by the AETA stakeholders
and WorleyParsons to add to that used for the 2012 report There is however new evidence
on the reduction in LCOE for CSP technologies and WorleyParsons linked OPEX
contribution to these LCOE predictions so that a sense of future reductions could be made
This is outlined further in the following Sections
45
4631 ASSUMPTIONS AND CONSIDERATIONS
FOM and VOM Breakdown
The following costs are included in proceeding FOM cost estimates for CSP technologies as
an annual cost per MW capacity
Insurance
Labour costs and
Fixed service maintenance contracts
Similarly the following costs are included in the VOM cost estimates as a cost rate per MWh
of sent out energy
Material and maintenance costs spare parts equipment maintenance and unscheduled
inspections and
Utilities costs water auxiliary fuel and auxiliary power when applicable
Some items such as spare parts for scheduled maintenance could be considered FOM costs
However to simplify the comparison and to homogenise all of the analyses across
technologies all concepts related to plant material and maintenance were included in the
VOM costs
4632 AETA 2012 OampM CSP COSTS COMPARISON REPORT
The technical characteristics of the reference CSP Plants used in the AETA 2012 report have
been extracted from the AETA Model Version 1_0 (BREE 2012) and are summarised in
Table 12
Table 12 AETA 2012 Reference Plant Technical Characteristics
Plant
Characteristics
Units Parabolic
Trough
without
Storage
Parabolic
Trough
with
Storage
Solar
Tower
without
Storage
Solar
Tower
with
Storage
Linear
Fresnel
without
Storage
Linear
Fresnel
with
Storage
Plant Net Capacity MW 138 135 122 18 230 225
Location NA Unknown Unknown Unknown Unknown Unknown Unknown
Isolation kWhm2year Unknown Unknown Unknown Unknown Unknown Unknown
Hours of TES h - 7 - 6 - 6
Capacity Factor per cent 23 42 31 42 23 42
Type of Cooling NA Unknown Unknown Unknown Unknown Unknown Unknown
FOM $MWyear 60000 65000 70000 60000 65000 65000
VOM $MWh sent out 15 20 15 15 15 20
Based on the information above this Model Update estimated the following parameters for
the CSP technologies evaluated in this study
46
Total net energy production in terms of MWh delivered per year
FOM and VOM in terms of USD per year and
Total OPEX costs in terms of USD per year and USD per total net energy production
per year
The results are listed in Table 13 below Table 13 AETA 2012 OampM Opex costs on a per kWh basis
Plant
Characteristics
Units Parabolic
Trough
without
Storage
Parabolic
Trough
with
Storage
Solar
Tower
without
Storage
Solar
Tower
with
Storage
Linear
Fresnel
without
Storage
Linear
Fresnel
with
Storage
Plant Net Capacity MW 138 135 122 18 230 225
Net Energy sent out MWhyear 2780424 496692 3313032 662256 463404 827820
FOM $year 8280000 8775000 8540000 1080000 14950000 14625000
VOM $year 4170636 9933840 4969548 993384 6951060 16556400
OPEX $year 12450636 18708840 13509548 2073384 21901060 31181400
OPEX $kWh 00448 00377 00408 00313 00473 00377
FOM per cent 6650 4690 6321 5209 6826 4690
VOM per cent 3350 5310 3679 4791 3174 5310
The percentages of FOM and VOM costs as part of the total OPEX costs are presented in
Figure 5
Figure 5 AETA 2012 FOM and VOM Percentages of Total OPEX Costs
47
In Figure 5 FOM costs are in general terms significantly higher than VOM costs because
they include the higher cost items such as insurance labour costs and fixed service contracts
However as shown in the Figure VOM costs are higher or approximately equal to FOM
costs for technologies with energy storage given the criteria selected for the breakdown
between FOM costs and VOM costs FOM costs will remain relatively consistent from year-
to-year while VOM costs should be broken down even further since the costs of water
natural gas (if required) and electricity vary between locations and from one year to another
Total OPEX costs are expressed in terms of USD per total net energy production per year and
are between 00313 and 00473 USDkWh as listed in Table 13 These values are aligned
with the values provided by international institutions cited although they appear to be
somewhat inflated in comparison with those values that are closer to 0025 and 0035
USDkWh as published by others (eg IRENA)
4633 AETA 2013 OampM COSTS UPDATE
Similar Plant characteristics to AETA 2012 were considered for the appropriate comparison
of OampM costs for this update Plant characteristics include location net capacity capacity
factor hours of TES and type of cooling For this Report the characteristics of the reference
plants used are described in Table 14
Table 14 PT and ST Reference Plant Characteristics
Plant
characteristics
Units Parabolic
Trough without
Storage
Parabolic
Trough with
Storage
Solar Tower
without
Storage
Solar Tower
with Storage
Plant Net Capacity MW 100 100 100 100
Location NA MENA region MENA region MENA region MENA region
Isolation kWhm2year 2400 2400 2400 2400
Hours of TES h 0 6 0 6
Capacity Factor per cent 26 46 275 476
Type of Cooling NA Dry Dry Dry Dry
Source NA WorleyParsons CSP Today 2012a WorleyParsons CSP Today 2012b
The 2013 OampM costs were estimated using as a basis the information provided in the CSP
2012 reports (CSP 2012a and 2012 b) The following considerations were taken into account
the CSP Today reports only consider PT and ST plants with thermal storage
WorleyParsons made the following estimates based on experience with solar and
conventional power plants based on PT and ST technologies without TES
estimated the capacity factor based on plant capacity location and type of cooling
adjusted the insurance material and maintenance and labour costs based on the
solar field reduction factor when applicable
adjusted the steam turbine maintenance based on the potential hours of operation
48
adjusted the plant electricity and water consumption based on the total net
production
assumed similar auxiliary fuel consumption for the plant with and without TES This
assumption is due to the reference plants being based in the same location thus
requiring similar auxiliary fuel consumption for start-up Minimal differences in
auxiliary fuel consumption for freeze protection due to increased time offline for a
plant without TES system compared to a plant with TES are expected but not
considered in this Report as the impact would be minor
the capacity factor provided by CSP Today for PT with thermal storage is considered
high Based on the plant location and capacity WorleyParsons would anticipate the
capacity factor to be closer to 42 per cent instead of 46 per cent as indicated in Table
14 above This difference in capacity factor directly impacts the estimated VOM cost
which is correlated with plant production For comparison purposes the value provided
by CSP Today has maintained and
with respect to Linear Fresnel technology updated information has not been published
since the AETA 2012 report release by the references listed in Section 462 which
WorleyParsons consulted For the purpose of updating the estimates to 2013 it was
assumed that the evolution of the OampM costs would be similar to that of parabolic
trough plants and the same escalation factors were applied
The resulting 2013 and 2012 OampM costs are listed in Table 15 below for comparison
Table 15 2013 CSP OampM Costs Compared to 2012 OampM Costs
CSP Technology OampM Costs AETA 2012 WorleyParsons 2013 update
Parabolic Trough
without Storage
FOM $MWyear 60000 59176
VOM $MWh sent out 1500 1519
OPEX $kWh 00448 00412
Parabolic Trough with
Storage
FOM $MWyear 65000 72381
VOM $MWh sent out 2000 1139
OPEX $kWh 00377 00293
Solar Tower without
Storage
FOM $MWyear 70000 58285
VOM $MWh sent out 1500 707
OPEX $kWh 00408 00313
Solar Tower with
Storage
FOM $MWyear 60000 71372
VOM $MWh sent out 1500 565
OPEX $kWh 00313 00228
Linear Fresnel without
Storage
FOM $MWyear 65000 64107
VOM $MWh sent out 1500 1519
OPEX $kWh 00473 00434
49
CSP Technology OampM Costs AETA 2012 WorleyParsons 2013 update
Linear Fresnel with
Storage
FOM $MWyear 65000 72381
VOM $MWh sent out 2000 1139
OPEX $kWh 00377 00293
The total OPEX costs per year from the AETA 2012 report and the WorleyParsonsrsquo estimates
that were updated for 2013 are compared in Figure 6 below
Figure 6 Comparison of OPEX Costs per Total Annual Plant Production per Year AETA 2012
Report and 2013 Update
Reductions of approximately 20 - 27 per cent in OampM costs would be realised by CSP with
TES according to the updated 2013 WorleyParsons estimates compared to the same costs
reported in the AETA 2012 report However reductions for PT and LF without TES were
found to be lower at approximately 8 per cent
The IRENA reports (IRENA 2013b IRENA 2013c) provide values for OPEX between 0025
and 0035 USDkWh for PT and ST technologies with and without TES Values updated to
2013 by WorleyParsons are between 0023 and 00412 USDkWh for PT and ST
technologies which align with the IRENA values However IRENA does not differentiate
between the utilisation of TES Solar technologies without TES have fewer hours of
production and although OPEX costs are lower in terms of USDMW compared with solar
technologies with TES OPEX costs in terms of costs per total annual plant production per
year will typically be higher for technologies that do not use TES
4634 OampM CSP LEARNING RATES
Cost reductions on CSP technologies are expected to come from the following main actions
economies of scale in the plant size and manufacturing industry
learning impacts on design construction and operation phases
50
advances in RampD of the following factors
Components Solar receivers mirrors HTF storage media supporting structures
trackers and auxiliary systems
Systems Direct steam generation storage systems or hybrid cooling systems
Configurations Hybridisation or duel electricity water plants
a more competitive supply chain
improvements in the performance of the solar field solar-to-electric efficiency and
thermal energy storage systems
increases in the life of plants and
reduced financial costs
Based on the parameters listed above the LCOE from Solar Thermal technologies is likely to
be continuously decreasing and this is born out in the literature that has been reviewed Based
on the IRENA 2013b report the evolution of the LCOE from trough and power tower CSP
technologies shows how the LCOE is decreasing as technology development increases in
Table 16 below Estimates for LCOE for the hypothetical trough and tower CSP plants in
2014 are also included
51
Table 16 Estimated LCOE form Existing and Hypothetical Trough and Solar Tower CSP Technologies
CSP
Technology
Year Capacity
(MW)
Plant Name Location DNI
(kWhm2year)
LCOE 2012
$kWh Installed
Trough
1981 05 PSA Spain 2000 064
1983 138 SEGS I California 2700 039
1989 30 SEGS II ndash VIII California 2700 026
1992 80 SEGS VIII amp IX California 2700 020
2008 - 2009 50 Andasol 1 2 Spain 2000 035
2010 50 Solnova 1 amp 3 Spain 2000 034
2010 - 2011 50 Extresol 1 amp 2 Spain 2000 035
2014 250 Unspecified (wet
cooling no storage)
Not provided Not provided 020
Tower
1987 10 Solar One California 2700 058
2007 11 PS10 Spain 2000 034
2009 20 PS20 Spain 2000 036
2011 199 Gemasolar (wet
cooling 15hr
storage)
Spain 2000 033
2014 120 Unspecified
(dry cooling
storage)
Not Provided Not provided 015
International Institutions such as IRENA ESTELA or the World Bank agree that the LCOE
and capital cost reductions of 28 per cent to 60 per cent are envisioned by 2020 ndash 2025 for
such plant Estimates of possible LCOE reductions for CSP technology from 2012 to 2025
are provided in Figure 7 taken from Kearny (2010)
52
Figure 7 Expected LCOE Reductions for CSP Technology from 2012 to 2025
Source (Kearny 2010)
The OampM maintenance costs of modern CSP Plants are lower than those for Californian
SEGS Plants built in the 1980s and 1990s which has a total combined capacity of 354 MW
and estimated OampM costs of USD 004kWh (IRENA 2013b) However CSP experienced no
growth from early 1990s until the mid-2000s as can be seen in Table 16 above
As stated at the beginning of Section 462 Andasol 1 was the first 50 MWe parabolic trough
plant built after SEGS which included a thermal energy storage system It commenced
operation at the end of 2008 Podewils (2008) estimated Andasol 1 OampM costs of EUR
0072kWh or USD 0095kWh (considering 2012 medium rate exchange EURUSD of
07553) This value is high compared to OPEX estimations for PT with TES provided by
both this 2013 update and the AETA 2012 report (00293 and 00377 USDkWh
respectively) Therefore according to the information detailed above considerable learning
improvements to OampM costs have been already achieved from the commencement of
operation of Andasol 1 to the time of this Report
`WorleyParsonsrsquo estimations on the LCOE of parabolic trough plants is in the range of
USD 020kWh to USD 035kWh and that of solar towers between USD 017kWh and
USD 029kWh However in areas with excellent solar resources the range could be as low
as USD 014kWh to USD 018kWh
The following considerations have been taken into account for OampM cost learning rates
forecast
WorleyParsons LCOE estimations as set out above
Potential average envisaged LCOE reductions of 475 per cent by 2025 based on Figure
7 above
OPEX contribution on LCOE of 20 per cent and
53
assuming that all components involved in the LCOE (CAPEX OPEX and financial
expenses) reduce at the same rate so percentage contributions remain constant
According to these considerations WorleyParsons estimates that OPEX values by 2025 could
reach from 0021 to 0037 USDkWh for PT technology and from 0018 to 0031 USDkWh
for ST technology
Technological improvements have reduced the requirement of replacing mirrors and
receivers Automation has reduced the cost of other OampM procedures by as much 30 per
cent As a result of OampM procedure improvements (both cost and plant performance) the
total OampM costs of CSP plants in the long-term are likely to be below USD 0025kWh
(IRENA 2013b)
Parabolic trough system in the United States would have OampM costs of around USD 002 to
USD 003kWh meanwhile the OampM costs of parabolic trough and solar tower power plants
currently under construction in South Africa have estimated OampM costs of between USD
0029 and USD 0036kWh (also IRENA 2013b)
WorleyParsons estimations are in alignment with IRENA estimations in terms of current and
envisaged CSP OPEX costs
4635 CONCLUSIONS ndash CSP
The following main conclusions were made based on this study in relation to CSP
technologies
the 2013 WorleyParsons CSP OampM costs update resulted in values between 0023 and
0043 USDkWh based on 2012 USD
reductions in CSP OampM costs between 8 per cent and 27 per cent were obtained in
comparison to values provide in AETA 2012 report
the total OampM costs of CSP Plants in the long-term are likely to be below USD
0025kWh
the updated values for 2013 by WorleyParsons are in alignment with the values
provided by recognised international institutions and
at the time of this report the only CSP technology with substantial operation capacity
was PT Only three utility-scale ST plants were in operation at the time of this report
(PS-10 PS-20 and Gemasolar) of which only one (Gemasolar) uses TES Though
several process steam and small-scale LFR Plants are currently in operation only one
utility-scale LFR (Puerto Erradio 2) was in operation at the time of this report
47 AETA 2013 OampM Learning Rate recommendation
The learning rate used in AETA 2012 for OampM is applied to all technologies assessed and
includes fossil fuel technologies and emerging technologies The learning rate is set at an
improvement of 02 per cent per annum
In addition to the improvement rate OampM is escalated at a rate of 150 per cent of CPI per
year based on experience with increases in parts and labour costs
The CPI rate set in the model is 25 per cent per annum
54
OampM cost information in the public domain in both quantum and quality is poor for
contemporary data Information supporting OampM learning rates is equally poor There are
indications that emerging technologies do have the potential for increased OampM learning
rates relative to mature technologies
For the renewable energy technologies studied in this report onshore wind is considered
mature and it is recommended that the AETA 2012 report value of 02 per cent is maintained
For all other renewable energy technologies studied in this report a more aggressive learning
rate of 25 per cent is recommended This will effectively cancel out the CPI escalation
adjustment and provide a ldquoflat linerdquo OampM rate for future years This will provide a value in
line with the learning rate conclusions for PV
The learning rate for CSP is considered to have greater potential for reduction but due to the
high level of analysis in this report (and therefore uncertainty) it is proposed that a maximum
of two learning rates is appropriate for the AETA model
Table 17 AETA Learning Rate Comparison
AETA 2012 Learning Rate AETA 2013 update Learning Rate
Onshore Wind 02 per cent 02 per cent
Offshore Wind
PV ndash all technologies
CSP ndash all technologies
02 per cent 25 per cent
55
5 CHANGES TO THE LCOE
Changes to the model parameters described in the earlier sections have resulted in changes to
the LCOE estimates for a number of technologies The LCOE estimate values for all
technologies and associated range of uncertainty are shown in the Figures 8 to 13 below
Note that the values listed are for a base value carbon price modifier of zero per cent which
places no value on carbon emissions
For selected technologies where there are significant cost differences Figure 14 provides a
comparison of mid-range LCOE values for the AETA 2013 and AETA 2012 Models Key
features of the Figures 8 to 14 are as follows
both in AETA 2012 and 2013 Model update LCOE costs are provided for the years
2012 2020 2025 2030 2040 and 2050
cost ranges are provided for each technology that accounts for differences in fuel prices
and state-based variations
LCOE costs vary substantially across the technologies from $89MWh (combined cycle
gas turbine) to $351MWh (solar thermal linear fresnel) in 2012 and $73MWh (PV
non-tracking) to $247MWh (IGCC black coal CCS) in 2050
the inter-technology LCOE comparisons figures (Figures 8 to 13) reveal changes in
relative costs of technologies over time Key results include renewable technologies
have higher LCOEs than the lowest cost non-renewable technologies and the relative
LCOE rankings significantly change post 2030 The LCOE of solar PV become lower
than the non-renewables from mid 2030 onwards and
large changes in LCOE results between AETA 2013 Update and AETA 2012 are
depicted in Figures14 below Figure 14 compares LCOEs at 2050 between the AETA
2013 Update and AETA 2012 for a selected number of technologies that have changed
significantly for NSW (AETA developed LCOEs by each Australian state) Differences
in technology LCOEs are explained by a multiplicity of factors including the technical
developments OampM costs and learning rate changes
56
Figure 8 Updated LCOEs for AETA 2013 Model technologies values for 2012 (NSW) with carbon price set to zero
0
50
100
150
200
250
300
350
400
450
500
LCO
E ($
MW
h)
LCOE FOR 2012 TECHNOLOGIES (NSW) Note Default region is NSW except bown coal
technologies (VIC) and SWIS scale (as specified)
LCOE includes where relevant allowance for- Carbon Price- CO2 transport and sequestration cost- Plant capital cost (EPC basis) within battery limits- Owners costs excluding interest during construction- Fixed and variable operating costs- Fuel costs- Economic escalation factors
57
Figure 9 Updated LCOEs for AETA 2013 Model technologies values for 2020 (NSW) with carbon price set to zero
0
50
100
150
200
250
300
350
400
450
LCO
E ($
MW
h)
LCOE FOR 2020 TECHNOLOGIES (NSW) Note Default region is NSW except bown coal
technologies (VIC) and SWIS scale (as specified)
LCOE includes where relevant allowance for- Carbon Price- CO2 transport and sequestration cost- Plant capital cost (EPC basis) within battery limits- Owners costs excluding interest during construction- Fixed and variable operating costs- Fuel costs- Economic escalation factors
58
Figure 10 Updated LCOEs for AETA 2013 Model technologies values for 2025 (NSW) with carbon price set to zero
0
50
100
150
200
250
300
350
400
LCO
E ($
MW
h)
LCOE FOR 2025 TECHNOLOGIES (NSW) Note Default region is NSW except bown coal
technologies (VIC) and SWIS scale (as specified)
LCOE includes where relevant allowance for- Carbon Price- CO2 transport and sequestration cost- Plant capital cost (EPC basis) within battery limits- Owners costs excluding interest during construction- Fixed and variable operating costs- Fuel costs- Economic escalation factors
59
Figure 11 Updated LCOEs for AETA 2013 Model technologies values for 2030 (NSW) with carbon price set to zero
0
50
100
150
200
250
300
350
400
LCO
E ($
MW
h)
LCOE FOR 2030 TECHNOLOGIES (NSW) Note Default region is NSW except bown coal
technologies (VIC) and SWIS scale (as specified)
LCOE includes where relevant allowance for- Carbon Price- CO2 transport and sequestration cost- Plant capital cost (EPC basis) within battery limits- Owners costs excluding interest during construction- Fixed and variable operating costs- Fuel costs- Economic escalation factors
60
Figure 12 Updated LCOEs for AETA 2013 Model technologies values for 2040 (NSW) with carbon price set to zero
0
50
100
150
200
250
300
350
400
LCO
E ($
MW
h)
LCOE FOR 2040 TECHNOLOGIES (NSW) Note Default region is NSW except bown coal
technologies (VIC) and SWIS scale (as specified)
LCOE includes where relevant allowance for- Carbon Price- CO2 transport and sequestration cost- Plant capital cost (EPC basis) within battery limits- Owners costs excluding interest during construction- Fixed and variable operating costs- Fuel costs- Economic escalation factors
61
Figure 13 Updated LCOEs for AETA 2013 Model technologies values for 2050 (NSW) with carbon price set to zero
0
50
100
150
200
250
300
350
400
LCO
E ($
MW
h)
LCOE FOR 2050 TECHNOLOGIES (NSW)
LCOE includes where relevant allowance for- Carbon Price- CO2 transport and sequestration cost- Plant capital cost (EPC basis) within battery limits- Owners costs excluding interest during construction- Fixed and variable operating costs- Fuel costs- Economic escalation factors
Note Default region is NSW except bown coal
technologies (VIC) and SWIS scale (as specified)
62
Figure 14 Comparison of AETA 2013 Model and AETA 2012 Model LCOE estimates selected technologies 2050
0
50
100
150
200
250
AETA 2012
AETA 2013
63
51 Conclusions
The Australian Energy Technology Assessment (AETA 2012) provided the best available and most up-to-
date cost estimates for 40 electricity generation technologies under Australian conditions To ensure that
the cost estimates for the various technologies are consistent all common input costs (eg labour
materials components carbon price) were itemised To ensure that the AETA costings remain up to date
AETA costs are reviewed in this AETA 2013 Model Update report
The AETA 2013 refresh was developed in close consultation with a stakeholder reference group drawn
from industry and researchacademic organisations with interests and expertise in a diverse range of
electricity generation technologies
The AETA 2013 Model results reflect the change to exclude the value of a carbon price in the Levelised
Cost of Energy (LCOE) All technologies have experienced a minor reduction in LCOE relative to 2012
(offset in some cases by other factors) due to the change to an amortisation period of 30 years plus the
construction period
Comparing the 2012 AETA results without a carbon price to the 2013 results without a carbon price there
are significant reductions in the LCOE of solar technologies and onshore wind This is as a consequence of
changes to the fixed and variable Operations and Maintenance (OampM) costs for these technologies For the
solar technologies the adjustment of the capital learning rate to 25 per cent has also contributed to the
LCOE reduction Offshore wind also has an increased learning rate but this has been offset to a large extent
by increased variable OampM costs
Nuclear LCOE has increased significantly due to higher estimates for capital costs
Efficiency for coal fired plants with CCS retrofits has been revised downwards to better reflect the expected
efficiency of these plants and has the effect of increasing the LCOE
64
REFERENCES
Albers A 2009 OampM Cost Modeling Technical Losses and Associated Uncertainties Proceedings of the
2009 European Wind Energy Conference Marseilles France March
AWEA (American Wind Energy Association) 2013 AWEA US Wind Industry Annual Report ndash Year
Ending 2012 USA
BNEF (Bloomberg New Energy Finance) 2013 Operations and Maintenance (OampM) Price Index Issue II
Wind Research Note April
BREE (Bureau of Resources and Energy Economics) 2012 AETA Report and Model Version 1_0 2012
Australian httpwwwbreegovau
CEC (Clean Energy Council) 2013 Australian Energy Technology Assessment 2013 Review Letter to
BREE of 20 May 2013 from the Clean Energy Council (Mr Russel Marsh signatory for the CEC)
CEC (Clean Energy Council) 2013 Clean Energy Council Renewable Energy Map Australia June (data
noted as current as of 21 August 2012)
httpwwwcleanenergycouncilorgauresourcecentreplantregistermaphtml
Crown Estate 2012 Offshore Wind Cost Reduction Pathways Study United Kingdom May
CSP 2012a CSP Parabolic Trough Report Cost Performance and Key Trends CSP Today
CSP 2012b CSP Solar Tower Report Cost Performance and Key Trends CSP Today
Deloitte amp Touche 2012 European Wind Services Study Find Out Which Way the Wind Blows Deloitte amp
Touche GmbH Wirtschaftspruumlfungsgesellschaft August
Deloitte 2011 Economics of wind development in New Zealand Deloitte for the for the New Zealand Wind
Energy Association
Ebert P amp Ware J 2013 The Role of Independents in the Wind Farm Operations amp Maintenance
Proceedings of the 2013 New Zealand Wind Energy Conference and Exhibition March
EPRI (Electric Power Research Institute) 2010 Engineering and Economic Evaluation of Central-Station
Solar Photovoltaic Power Plants USA March
GlobalData 2012 Wind Operations amp Maintenance (OampM) Market ndash Global Market Size Share by
Component Competitive Landscape and Key Country Analysis to 2020 GlobalData reference code
GDAE1054MAR January
Hand M 2013 Wind Plant Cost of Energy Proceedings of the 2nd NREL Wind Energy System
Engineering Workshop January
Hassan G 2011 Review of the Australian Wind Energy Industry Clean Energy Council Australia 2011
Houston C 2013 The Real Truth About Wind Farm OampM Costs North American WindPower March
IEA (International Energy Agency) 2008 Technology Roadmap Solar photovoltaic energy France
httpwwwieaorgpublicationsfreepublicationspublicationpv_roadmappdf
IRENA (International Renewable Energy Agency) 2013a Solar Photovoltaics Technology Brief Germany
January httpwwwirenaorgDocumentDownloadsPublicationsIRENA-ETSAPper
cent20Techper cent 20Briefper cent20E11per cent20Solarper cent20PVpdf
65
IRENA (International Renewable Energy Agency) 2013b Concentrating Solar Power Technology Brief
Germany January
IRENA (International Renewable Energy Agency) 2013c Renewable Power Generation Costs in 2012 An
Overview Germany
IT Power 2013 Analysis of the AETA 2012 cost estimates of CSP technologies Clean Energy Council
submission to the Bureau of Resources and Energy Economics May
Kann S 2012 US Solar Market Insight Report Q3 California USA
Kearny A 2010 Solar Thermal Electricity 2025 ndash clean electricity on demand attractive STE costs
stabilize energy production ATKearny consultants Dusseldorf Germany
Muirhead J 2013 SEGS experience suggests that CSP will age gracefully CSP Today South Africa
httpsocialcsptodaycommarketssegs-experience-suggests-csp-will-age-
gracefullysthash6VkxFaD0dpuf
NREL (National Renewable Energy Laboratories) 2011 IEA Wind Task 26 ndash Multi-national Case Study of
the Financial Cost of Wind Energy Technical Report NRELTP-6A2-48-48155 March
NREL (National Renewable Energy Laboratories) 2012 Cost and Performance Data for Power Generation
Technologies USA February
NREL (National Renewable Energy Laboratories) 2013 Breakeven Prices for Photovoltaics on
Supermarkets in the United States March httpwwwnrelgovdocsfy13osti57276pdf
NREL (National Renewable Energy Laboratories) 2013 Breakeven Prices for Photovoltaics on
Supermarkets in the United States USA March httpwwwnrelgovdocsfy13osti57276pdf
Photon 2012 The True Cost of Solar Power 2012 Temple of Doom Solar Power in Focus Series Photon
Consulting
Photon 2013 Solar Annual 2013 Build Your Empire Photon Consulting
Podewils C 2008 Photovoltaic vs Solar Thermal where PV has the upper hand and where solar thermal
strikes back Photon International Germany November
Poore R and Walford C 2008 Development of an Operations and Maintenance Cost Model to Identify
Cost of Energy Savings for Low Wind Speed Turbines Report NRELSR-500-40581 National
Renewable Energy Laboratory January
RolandBerger 2013 Offshore Wind Towards 2020 On the Pathway to Cost Competitiveness RolandBerger
Consultants Germany April
See wwwcsptodaycom
See wwwepiaorg
See wwwestelasolarde
See wwwidaees
See wwwieaorg
See wwwirenaorg
See wwwnrelgov
See wwwprotermosolares
66
See wwwrenoveteces
See wwwseiaorgau
See wwwsolarelectricpowerorg
See wwwworldbankorg
UK Crown Estate 2012 Offshore Wind Cost reduction Study May
US DoE (Department of Energy) 2013 Award Number DE-EE0005360 USA February
Wiser R Lantz E Bolinger M amp Hand M 2012 Recent Developments in the Levelized Cost of Energy
from US Wind Power Projects Contract No DE-AC02-05CH11231 National Renewable Energy
Laboratories February
67
Appendix A
Electricity Generation Technologies in AETA 2012 Report and Model
The 40 AETA electricity generation technologies are
1 Integrated Gasification and Combined Cycle (IGCC) plant based on brown coal
2 IGCC plant with Carbon Capture and Sequestration (CCS) based on brown coal
3 IGCC plant based on bituminous coal
4 IGCC plant with CCS based on bituminous coal
5 Direct injection coal engine (clean lignite eg brown coal technology)
6 Pulverised coal supercritical plant based on brown coal
7 Pulverised coal supercritical plant with post combustion CCS based on brown coal
8 Pulverised coal subcritical plant with post combustion CCS based on brown coal (retrofit)
9 Pulverised coal supercritical plant based on bituminous coal
10 Pulverised coal supercritical plant based on bituminous coal - SWIS relevant scale
11 Pulverised coal supercritical plant with CCS based on bituminous coal
12 Pulverised coal subcritical plant with post combustion CCS based on bituminous coal (retrofit)
13 Adding CCS to existing Combined Cycle Gas Turbine (CCGT) power plants (retrofitting)
14 Oxy combustion pulverised coal supercritical plant based on bituminous coal
15 Oxy combustion pulverised coal supercritical plant with CCS based on bituminous coal
16 Combined cycle plant burning natural gas
17 Combined cycle plant burning natural gas - SWIS relevant scale
18 Combined cycle plant with post combustion CCS
19 Open cycle plant burning natural gas
20 Solar thermal plant using compact linear fresnal reflector technology wo storage
21 Solar thermal plant using parabolic trough technology wo storage
22 Solar thermal plant using parabolic trough technology with storage
23 Solar thermal plant using compact linear fresnal reflector technology with storage
24 Solar thermal plant using central receiver technology wo storage
25 Solar thermal plant using central receiver technology with storage
26 Solar photovoltaic (PV) - non-tracking
27 Solar photovoltaic (PV) - single axis tracking
28 Solar photovoltaic (PV) - dual axis tracking
29 Wind (on-shore)
30 Wind (off-shore)
31 WaveOcean
68
32 Geothermal - hot sedimentary aquifer (HSA)
33 Geothermal - enhances geothermal system (EGS)
34 Landfill gas power plant
35 Sugar cane waste power plant
36 Other biomass waste power plant (eg wood)
37 Nuclear Gen 3+
38 Nuclear Small Modular Reactors (SMR)
39 Solarcoal hybrid
40 Integrated solar combined cycle (ISCS) ndash parabolic trough with combined cycle gas
69
Appendix B
Consultations with Stakeholders
This study has been undertaken in close consultation with a Stakeholder Reference Group drawn from
Australian industry and domestic as well as overseas researchacademic organisations with interests and
expertise in a diverse range of electricity generation technologies These stakeholders were invited to
provide evidence of the latest estimates for the costs and performance of various technologies
In addition the AETA project also had a Project Steering Committee comprising staff from BREE
AEMO CSIRO and other independent experts to provide technical advice and support The following
agencies participated in the stakeholder reference group meetings or were forwarded the documents
presented at the meetings
AETA Stakeholder Reference Group
Australian Coal Association
Australian Energy Market Operator
Australian Geothermal Energy Association
Australian National Low Emissions Coal RampD
Australian National University
Australian Renewable Energy Agency
Australian Solar Thermal Energy Association
Australian Sugar Milling Council
Australian Treasury
Bureau of Resources and Energy Economics
Clean Energy Council
CSIRO
Department of Industry
Economic Research Institute for ASEAN and East Asia
Energy Retailers Association of Australia
Energy Users Association of Australia
Evans and Peck
Ferrostaal
Global CCS Institute
Grid Australia
Intergen
International Energy Agency France
International Power Suez
IRENA Innovation and Technology Centre Germany
70
National Generators Forum
Oceanlinx Limited
Origin Energy
Private Generators Group
The Institute of Energy Economics Japan
The Energy Research Institute New Delhi
University of Melbourne Energy Institute
University of Queensland Energy Initiative
UQ Energy Economics amp Management Group
Wyldgroup
WorleyParsons
Two AETA Stakeholders Reference Group meetings took place on 30 April 2013 and 17 July 2013 In
addition the AETA Project Steering Committee met on 24 June 2013
71
BREE contacts Executive Director BREE Bruce Wilson brucewilsonretgovau
(02) 6243 7901
Deputy Executive Director Wayne Calder waynecalderbreegovau
(02) 6243 7718
Modelling amp Policy Integration Arif Syed arifsyedbreegovau
Program Leader (02) 6243 7504
Data Statistics Geoff Armitage geoffarmitagebreegovau
Program Leader (02) 6243 7510
Energy and Quantitative Analysis Allison Ball allisonballbreegovau
Program Leader (02) 6243 7539
Resources ndash Program Leader John Barber johnbarberbreegovau
(02) 6243 7988
72

4
CONTENTS
About the Bureau of resources and energy economics 2
Acknowledgements 2
FOREWORD 3
ACRONYMSABBREVIATIONS 8
GLOSSARY 9
EXECUTIVE SUMMARY 10
1 INTRODUCTION 12
11 Background to the AETA 2012 report 12
12 Methods and Assumptions of the AETA 2012 Report and Model 12
121 Macro assumptions 12
122 Technical assumptions 13
123 Levelised cost of energy (LCOE) 13
13 Methodology of the AETA 2013 Model Update 13
131 Caveats on the use of LCOE 14
132 Organisation of the report 14
2 AETA MODEL PARAMETER CHANGES 16
21 Stakeholder Initiated Changes 16
211 Nuclear Capital Costs 16
212 Carbon Capture and Storage (CCS) Retrofit Thermal Efficiency 17
213 Amortisation period 19
22 No Carbon Pricing 19
3 CONSIDERATION OF OTHER ISSUES 20
31 Representation of Uncertainty 20
32 Application of Learning Curves 20
33 General Costs Considerations 21
331 Fuel Costs 21
332 CCS Costs 21
333 Opportunity Costs 22
34 Capital and Construction Costs 22
5
35 Costs Associated with Solar Technologies 23
36 Costs Associated with Nuclear Technologies 24
37 Further Technologies 24
38 Auxiliary Loads 24
4 WIND PV AND CSP OPERATIONS AND MAINTENANCE (OampM) COST UPDATE 25
41 Operation and Maintenance Costs 25
42 Operating and Maintenance (OampM) Changes in summary 26
43 Wind 28
431 Introduction 28
432 Review of Evidence 29
433 Updated OampM Figures for Australia 33
44 Solar Photovoltaics (PV) 36
441 Introduction 36
442 Review of the Evidence 37
443 AETA 2012 OampM PV costs report comparison 37
45 AETA 2013 PV OampM Costs Update 40
451 OampM Learning Rates 41
452 Conclusions - PV 42
46 Concentrating Solar Power (CSP) 43
461 Introduction 43
462 Review of the evidence 43
463 AETA 2012 OampM CSP costs report comparison 44
47 AETA 2013 OampM Learning Rate recommendation 53
5 CHANGES TO THE LCOE 55
51 Conclusions 63
REFERENCES 64
Appendix A Electricity Generation Technologies in AETA 2012 Report and Model 67
Appendix B Consultations with Stakeholders 69
BREE CONTACTS 71
6
INDEX OF TABLES
Table 1 Model Changes Nuclear Technologies 17
Table 2 Model Changes CCS Retrofit Thermal Technologies 18
Table 3 Model Changes amortisation period 19
Table 4 Model Changes OampM costs 27
Table 5 Wind OampM costs used in the AETA 2012 report 29
Table 6 Comparison of AETA 2012 wind OampM estimates with new references for 2013 35
Table 7 Recommended AETA 2013 values 36
Table 8 AETA 2012 reference plants technical characteristics and OPEX costs 39
Table 9 Comparison of historical estimated PV and OampM costs in the public domain 39
Table 10 2013 PV OampM costs compared to 2012 PV OampM costs 40
Table 11 2013 updated OampM costs compared to new referenced OampM costs (7-2) 41
Table 12 AETA 2012 Reference Plant Technical Characteristics 45
Table 13 AETA 2012 OampM Opex costs on a per kWh basis 46
Table 14 PT and ST Reference Plant Characteristics 47
Table 15 2013 CSP OampM Costs Compared to 2012 OampM Costs 48
Table 16 Estimated LCOE form Existing and Hypothetical Trough and Solar Tower CSP
Technologies 51
Table 17 AETA Learning Rate Comparison 54
7
TABLE OF FIGURES
Figure 1 - Effect of country variables on LCOE of wind plant 31
Figure 2 - Typical cost increasing trends in wind farm OampM costs with commercial
operations date 32
Figure 3 - Trends in offshore wind farms and estimated impact on LCOE 33
Figure 4 - OampM Costs (per MW) and Technician Numbers (per 100MW) for total wind
turbine OampM (Opex) 34
Figure 5 - AETA 2012 FOM and VOM Percentages of Total OPEX Costs 46
Figure 6 - Comparison of OPEX Costs per Total Annual Plant Production per Year
AETA 2012 Report and 2013 Update 49
Figure 7 - Expected LCOE Reductions for CSP Technology from 2012 to 2025 52
Figure 8 Updated LCOEs for AETA 2013 Model technologies values for 2012 (NSW) with
carbon price set to zero 56
Figure 9 Updated LCOEs for AETA 2013 Model technologies values for 2020 (NSW) with
carbon price set to zero 57
Figure 10 Updated LCOEs for AETA 2013 Model technologies values for 2025 (NSW) with
carbon price set to zero 58
Figure 11 Updated LCOEs for AETA 2013 Model technologies values for 2030 (NSW) with
carbon price set to zero 59
Figure 12 Updated LCOEs for AETA 2013 Model technologies values for 2040 (NSW) with
carbon price set to zero 60
Figure 13 Updated LCOEs for AETA 2013 Model technologies values for 2050 (NSW) with
carbon price set to zero 61
Figure 14 Comparison of AETA 2013 Model Update and AETA 2012 LCOE estimates
selected technologies 62
8
ACRONYMSABBREVIATIONS
AETA Australian Energy Technology Assessment
BREE Bureau of Resources and Energy Economics
CAPEX Total capital expenditures
CSP Concentrating Solar Power Technologies
DAT Dual axis tracking
EPIA European Photovoltaic Industry Association
EPRI Electric Power Research Institute
ESTELA European Solar Thermal Electricity Association
FOM Fixed operation and maintenance costs
FT Fixed Tilt
h Hours
IDEA Institute for Energy Diversification and Saving
IEA International Energy Agency
IRENA International Renewable Energy Agency
kW Kilowatts
kWh Kilowatt hours
LCOE Levelised Cost of Energy
LF Lineal Fresnel Reflector CSP Technology
m2 Square Meters
MENA Middle East and North Africa region
MW Megawatts
MWh Megawatt hours
MWe Megawatt hours electric
NREL National Renewable Energy Laboratory
OampM Operation and maintenance
OEM Original Equipment Manufacturer
OPEX Total operating expenditures
PT Parabolic Trough CSP Technology
PV Photovoltaic
RampD Research and Development
SAT Single axis tracking
SEGS Solar Electricity Generating System
SEIA Solar Energy Industries Association
SEPA Solar Electric Power Association
ST Solar Tower CSP Technology
TES Thermal Energy Storage System
USD United States Dollar
VOM Variable operation and maintenance costs
WB The World Bank organization
9
GLOSSARY
Amortisation Period the period over which a plant must achieve its economic return
Auxiliary Load the internal or parasitic load from the electricity required to sustain the
operation of a plant
Capacity Factor the ratio of the actual output of a power plant over a period of time and its
potential output if it had operated at full nameplate capacity the entire time
Capital Cost the cost of delivery of a plant not including the cost of finance
Discount Rate the rate at which future values are discounted or converted to a present
value
First-of-a-Kind Plant cost costs necessary to put a first commercial plant in place and that
will not be incurred for subsequent plants Design and certification costs are examples of
such costs
First Year Available for Construction the year in which the technology will be available
for commercial deployment globally
Gross Capacity maximum or rated generation from a power plant without losses and
auxiliary loads taken into account
International Equipment Cost the cost for internationally sourced equipment associated
with the project
Labour Cost the component of the delivery cost for a plant associated with local
(Australian) labour
Lead time for Development the time taken from inception to financial close This includes
permitting approvals and engineering design
Levelised Cost of Energy the minimum cost of energy at which a generator must sell the
produced electricity in order to achieve its desired economic return
Local Equipment Cost the cost of locally sourced (Australia) plant and equipment for the
project
Net Capacity the export capacity of a generation plant ndash ie the Gross Capacity less the
losses and auxiliary loads of the plant
Nth-of-a-kind plant cost all engineering equipment construction testing tooling project
management and other costs that are repetitive in nature and would be incurred if a plant
identical to a FOAK plant were built The NOAK plant is the nth-of-a-kind or equilibrium
commercial plant of identical design to the FOAK plant
Sequestration the process of transport and storage of Carbon Dioxide (CO2)
Thermal Efficiency the ratio between the useful energy output of a generator and inputs
10
EXECUTIVE SUMMARY
This Report provides electricity generation technology cost parameters as an update to those
presented in the Australian Energy Technology Assessment (AETA) Report and Model
published in July 2012 This update takes into account a range of new material reported in the
public and private domain further discussions with asset owners and technology developers
and input from key experts in relation to these costs
The AETA 2012 Model estimated levelised costs of energy (LCOE) for a set of 40 market
ready and prospective electricity generation technologies LCOE can be interpreted as the
long-run marginal cost of electricity generation These were estimated by breaking down
the cost drivers for a technology into its key constituent parts such as capital cost fixed and
variable lsquooperations and maintenancersquo (OampM) costs and where applicable fuel costs and
CO2 storage costs While the LCOEs included carbon costs project specific regulatory or
system based costs were not included although clearly these may have a significant impact
on the delivered price of electricity
The AETA 2013 Model update generally follows the same approach although comparable
LCOE results are presented without carbon costs reflecting the Governmentrsquos intention to
repeal carbon pricing To the extent that alternative emissions reduction measures impact on
the electricity generation sector this may have different implications for fossil fuel andor
renewable based technologies
For these reasons some caution should be applied when interpreting LCOE estimates These
estimates best illustrate potential and relative ldquooff-the-shelfrdquo cost competitiveness rather than
a firm predictor of market outcomes or the commercial viability of individual projects
The key features of the LCOE cost parameters in the AETA 2013 Model update with respect
to the AETA 2012 Model can be summarised as follows
renewable technologies have generally higher LCOEs than the lowest cost non-
renewable technologies and the relative LCOE rankings significantly change post
2030 The LCOE of solar PV becomes lower than the non-renewables from mid-
2030 onwards
however wind based generation is estimated to already have a lower LCOE than
many new build comparable fossil-fuel generation technologies
LCOE costs vary substantially across the technologies from $89MWh (combined
cycle gas turbine) to $351MWh (solar thermal Linear Fresnel) in 2012 and
$73MWh (PV non-tracking) to $247MWh (IGCC black coal CCS) in 2050
changes are made to nuclear capital costs and nuclear technology plantrsquos lsquofirst year of
constructionrsquo carbon capture and storage (CCS) retrofit thermal efficiency and
amortisation period for various technologies to include construction period
a reduction in onshore wind OampM costs of 18 per cent
11
a reduction in offshore wind fixed OampM costs and a three-fold increase in offshore
wind variable OampM costs resulting in an overall increase of 50 per cent total OampM
costs
fixed tilt PV configurations have not seen significant changes in OampM costs
single axis tracking and dual axis tracking PV configurations are approximately 20-30
per cent reduced based on a better understanding of the associated OampM costs
concentrating solar power (solar thermal) OampM cost reduced between 8 per cent and 27
per cent and
the OampM learning rate for offshore wind and all solar technologies are increased from
02 to 25 per cent
The overall impact of parameter changes by technology is given in the AETA 2013 Model
and in this report As in the AETA 2012 the 2013 Model update provides technology
LCOEs for the years 2012 2020 2025 2030 2040 and 2050
12
1 INTRODUCTION
The Australian Energy Technology Assessment (AETA) 2012 report published in July 2012
by the Bureau of Resources and Energy Economics (BREE 2012) undertook costing of 40
electricity generation technologies This report made a provision that due to the fast changing
technology cost environment cost and performance parameters assessed in the AETA 2012
model may be updated every year In addition a full report and lsquobottom uprsquo study will be
undertaken biennially with the next report to be released in 2014
The next fully updated AETA report is scheduled for completion in 2014 To ensure that cost
estimates for electricity generation technologies are current and take into consideration the latest
developments parameter estimates for the 40 technologies will be updated where appropriate
every six months in a manner consistent with the methods outlined in this report and in consultation
with the stakeholder reference group (BREE 2012 p 24)
The purpose of this AETA 2013 Model Update report is to present findings arising from a
review of specific technologies by BREE This review was assisted by comments made by
the AETA Project Steering Committee (PSC) members and AETA Stakeholders Reference
Group (SRG) WorleyParsons was commissioned to review cost parameters for the
technologies considered in the AETA 2012 model Given the fast changing nature of solar
and wind technology operating costs especial emphasis was placed on reviewing OampM costs
for wind and solar technologies Changes to the model for the 2013 update are discussed in
the following sections
11 Background to the AETA 2012 report
BREE engaged WorleyParsons in 2011-12 to develop cost estimates for 40 electricity
generation technologies under Australian conditions for AETA 2012 The AETA cost
estimates were developed with the active collaboration of the Australian Energy Market
Operator (AEMO) which utilised the AETA cost estimates for its National Transmission
Network Development Plan (NTNDP) In addition the Commonwealth Scientific and
Industrial Research Organisation (CSIRO) provided technical advice as part of the AETA
project steering committee The AETA 2012 provided technology costs for the years 2012
2020 2025 2030 2040 and 2050 These technologies encompass a diverse range of
energy sources including renewable energy (such as wind solar geothermal biomass and
wave power) fossil fuels (such as coal and gas) and nuclear power (Appendix A) Since its
publication in July 2012 more than 1000 requests have been made from BREE for the
AETA 2012 cost estimates (model) by domestic and international sources
12 Methods and Assumptions of the AETA 2012 Report and Model
121 Macro assumptions
Key macroeconomic assumptions are consistent with those detailed by the Australian
Energy Market Operator in its National Transmission Network Development Plan and by
the Australian Treasury (see BREE 2012 for a full set of assumptions)
13
122 Technical assumptions
all technologies were costed on a consistent and transparent basis with itemisation of
component costs
capital costs included direct (eg engineering procurement and construction) and
indirect (eg owners) costs but exclude transmission and decommissioning costs
future cost estimates included assumptions about the exchange rate productivity
variation commodity variation and technology improvements
fuel cost estimates were based on ACIL Tasman projections and
projected growth rates for future operating and maintenance costs were provided
123 Levelised cost of energy (LCOE)
LCOE can be interpreted as the long-run marginal cost of electricity generation Key
factors used to calculate LCOE by technology include amortisation period discount rate
capacity factor CO2 emissions factor CO2 capture rate emissions price CO2 storage cost
fuel cost variable and fixed OampM cost and the capital cost
LCOE is a key comparative cost indicator across technologies that is expressed in real
Australian dollars per Megawatt hour of electricity generation ($MWh) The LCOE is the
price at which electricity must be generated from a specific plant to break even taking into
account the costs incurred over the life of the plant (capital cost cost of capitalfinancing
operations and maintenance costs cost of fuel emissions price if applicable and CO2
sequestration) While LCOE is an invaluable tool for comparing technology costs power
generation companies andor investors who wish to choose a technology to deploy would
also need to consider other criteria such as site-specific costs technology performance
characteristics and experience with the technology prior to any final investment decision
AETA cost estimates are developed to provide design basis and plant characteristics
performance parameters capital cost estimates fuel cost estimates OampM cost estimates
and LCOE estimates
Regional impacts on capital and operating costs have been incorporated in the analysis
These regions include Victoria New South Wales (including ACT) South Queensland
(incorporating the South East Queensland and Central Queensland AEMO regions) North
Queensland (incorporating the North Queensland AEMO region) Northern Territory
North WA (Pilbara region) South WA (the South West Interconnected System region)
South Australia and Tasmania
13 Methodology of the AETA 2013 Model Update
As part of the AETA 2013 Model Update BREE invited submissions from the AETA
Steering Committee and the Stakeholder Reference Group to provide commentary and
recommendations on the AETA 2012 Report and Model Eight written submissions were
received in this regard Changes were only recommended where specific substantiated
changes were received The AETA 2013 model has been updated in accordance with the
above consultations and under the same macro economic and technical assumptions as in
AETA 2012 The AETA 2013 model is freely available on request from BREE
(infobreegovau)
Within this context this report provides updated costs based on
14
relevant Australian and international reports on generation technologies that have been
published since AETA 2012 or have been newly discovered
new public domain information
new information from private sources that could be obtained
in-house experience of WorleyParsons and
input on OampM costs and learning rates from a number of industry stakeholders
This AETA 2013 Model Update report provides supporting explanations and references and
justifies amendments to the cost parameters of technologies especially the OampM costs for
wind and solar technologies that were covered in AETA 2012 model
131 Caveats on the use of LCOE
LCOE provides a generalised cost estimate and does not account for site specific factors
that would be encountered when constructing an actual power plant As a result the costs
associated with integrating a particular technology in a specific location to a specific
electricity network are not considered
Projected LCOE does not necessarily provide a reliable indicator of the relative market
value of generation technologies because of differences in the role of technologies in a
wholesale electricity market For example projected LCOE does not provide a direct
indicator of electricity demand or generation in isolation with other emissions abatement
policies Similarly many technologies involve integration costs in addition to the LCOE to
be able to reliably supply to the system The value of variable (or intermittent) power plants
(such as wind and solar) will depend upon the extent to which such plants generate
electricity during peak periods and the impact these plants have on the reliability of the
electricity system Unlike dispatchable power plants (such as coal natural gas biomass
and hydroelectric) ndash which are reliant on some form of stored energy (eg fuels water
storage or battery storage) ndash wind and photovoltaic power plants do not typically include
energy storage Dispatchable plants such as coal or gas fired plants may involve negative
externalities (environment fuel disposal or insurance costs etc) which are not always
reflected in their LCOEs
The AETA LCOEs are restricted to only utility-scale or large scale technologies
Consequently small-scale technologies (eg small roof-top photovoltaics fuel cells co-
generation and trigeneration) that may be relevant to distributed generation were not
included in the AETA 2012 analysis LCOE cost estimates associated with distributed
photovoltaics are likely to differ substantially from utility-scale photovoltaic systems as a
result of differences in component costs (eg capital costs operating and maintenance
costs) and performance characteristics (eg capacity factor)
132 Organisation of the report
This report is organised in five sections After a brief introduction and purpose of the report
in this section section 2 discusses the changes made to the AETA 2013 Model parameters as
a result of the discussions with Stakeholders and Steering Committee members on the
individual issues and technologies Section 3 presents the issues that were considered but did
not result in the AETA Model parameter changes Section 4 presents in detail the OampM cost
15
changes for wind and solar technologies covered in AETA 2012 Updated LCOE graphs as
well as a comparison of the resultant AETA 2013 Model and AETA 2012 Model LCOEs are
presented in section 5 which also presents concluding comments
16
2 AETA MODEL PARAMETER CHANGES
21 Stakeholder Initiated Changes
Consultations for the AETA 2013 Model update identified the following issues for
consideration
nuclear technology capital costs and lsquofirst year available for constructionrsquo
CCS retrofit thermal efficiency
amortisation period for all technologies and
OampM costs
The OampM issue is discussed in section 4 whereas rest of the issues are discussed below
211 Nuclear Capital Costs
The AETA 2012 report and model presents costs for first of a kind (FOAK) and Nth of a kind
(NOAK) nuclear technologies There could have been some confusion from the original
wording of Section 310 of AETA 2012 report It starts by discussing Gen III plants currently
sold (presumably NOAK) however further in the document Gen III plants are referred to as
FOAK The AETA 2012 report states that the capital costs are based on nuclear power plants
in the US The NOAK value is what is represented in Table 3101 in the AETA 2012 report
and model
Although there are cost adjusting factors used for other technologies studied in the AETA
2012 report there is no adjustment of the US cost base for Australian labour costs and for
adjustment of Australian equipment costs Submissions indicated that an adjustment to costs
should also be used for nuclear to ensure there is commonality in the comparison
This suggestion was considered appropriate and adjustment to the costs for nuclear
technologies was made Based on the factors to convert US rates to Australian rates used in
the fossil fuel technologies ie the factors from the Thermoflow software the new nuclear
capital costs were calculated The multiplier from Thermoflow for labour costs is 205 and
the factor for equipment costs is 13 both US to Australia
Additionally it was submitted that the first year available for construction of nuclear
technologies be extended In support of this the submission argued that nuclear technologies
are examples of generation technology where legislation regulation and public policy
planning is highly region-dependent and must therefore precede deployment by several years
This was considered an appropriate submission and therefore the first year available for
construction in the model has been changed from 2012 to 2020 These changes are shown in
Table 1
17
Table 1 Model Changes Nuclear Technologies
AETA 2012 report reference AETA 2012 model value AETA 2013 update
Technology 37 Nuclear (GW Scale LWR)
Change first year available for Construction
2012
2020
Technology 37 Nuclear (GW Scale LWR)
Convert FOAK Capital Cost to Australian productivity
and commodity costs
4210
6392
Technology 37 Nuclear (GW Scale LWR)
Convert NOAK Capital Cost to Australian productivity
and commodity costs
3470
5268
Technology 38 Nuclear (SMR)
Convert FOAK Capital Cost to Australian productivity
and commodity costs
7908
11778
Technology 38 Nuclear (SMR)
Convert NOAK Capital Cost to Australian productivity
and commodity costs
4778
7116
The overall impact of these parameters on individual technology LCOE changes is given in
the AETA 2013 Model and in Section 5
212 Carbon Capture and Storage (CCS) Retrofit Thermal Efficiency
Subcritical coal technologies with CCS retrofit were reported to have only slightly lower
thermal efficiency values compared with new build supercritical technologies with CCS in
the AETA 2012 Model This was an oversight in the AETA 2012 Model
The AETA 2012 report identified the thermal efficiency to retrofit subcritical brown and
black coal plants as 216 per cent and 301 per cent respectively (Table 312) In the same
table the efficiency for new build supercritical brown and black coal plants is reported to be
208 per cent and 314 per cent respectively
The thermal efficiencies were revised down based on actual operating efficiencies of existing
coal facilities in Victoria and NSW and factored based on the thermal efficiency ratio of new
coal facilities with and without CCS
A reduction in thermal efficiency is to be expected when applying a retrofit CCS to the plant
The CCS factor in the following representation refers the efficiency reduction factors for
adding CCS to a coal fired power station The useful output will reduce from the new
parasitic loads to run the CCS equipment
Thermal efficiency of existing brown coal plant in Victoria is 265 per cent and the CCS
factor is 064 Similarly the thermal efficiency of existing bituminous coal plant in NSW is
355 per cent and the CCS factor is 075
Table 311 and 312 of the AETA 2012 report show a reduction is present when comparing
the supercritical with no CCS compared to supercritical with CCS However the retrofit case
was only provided for the subcritical technology only and no case was included in the AETA
2012 for a subcritical plant with any CCS
A review of the values in Table 312 through comparison to the existing efficiency of
installed black and brown coal fleet in Australia was undertaken For brown coal the current
18
sent out thermal efficiency is 265 per cent for a 500 MW subcritical unit For supercritical
brown coal without CCS the sent out efficiency is 323 per cent Applying the same reduction
factor the thermal efficiency with CCS retrofitted should be 17 per cent in lieu of 216 per
cent as published in AETA 2012 report
For black coal the current sent out thermal efficiency is 355 per cent for a 660 MW
subcritical unit For supercritical black coal without CCS the sent out efficiency is 419 per
cent Applying the same reduction factor the thermal efficiency with CCS retrofitted should
be 266 per cent in lieu of 301 per cent as published AETA 2012 report (Table 2)
Table 2 Model Changes CCS Retrofit Thermal Technologies
AETA 2012 report reference AETA 2012 model value AETA 2013 update
Technology 8 Pulverised coal subcritical plant
with post combustion CCS based on brown coal
(retrofit)
Thermal Efficiency
216
170
Technology 12 Pulverised coal subcritical plant
with post combustion CCS based on bituminous
coal (retrofit)
Thermal Efficiency
301
266
19
213 Amortisation period
There was stakeholder consensus that the operating period for all technologies needs to be set
to thirty years and that the construction time is in addition to the operating time The financial
amortisation period is common for all technologies and is set at 30 years In the AETA 2012
model section 24 (a) nominates that the amortisation period of 30 years is from the
commencement of construction The amortisation period has now been changed (Table 3)
Examples of the change are
Nuclear LWR ndash GW scale In AETA 2012 report amortisation period was 30 years inclusive
of construction and operation The amortisation period has now changed to 36 years (30
operating and 6 years construction)
Solar parabolic trough In AETA 2012 report amortisation period was 30 years inclusive of
construction and operation The amortisation period has now changed to 33 years (30
operating and 3 years construction)
Table 3 Model Changes amortisation period
AETA 2012 report reference AETA 2012 model value AETA 2013 update
Common Amortisation period
for construction and operation
Amortisation period for
operation includes
construction for all
technologies
Amortisation period for
operation to exclude
construction for all
technologies
22 No Carbon Pricing
For the 2013 AETA update the carbon price modifier has been set to zero per cent as the
base value for the results presented in this report with the effect of applying a zero carbon
price to all technologies throughout the study period to 2050 The AETA 2013 Model
however has the option of changing this parameter by the user
20
3 CONSIDERATION OF OTHER ISSUES
This section summarises the issues that were discussed during the AETA 2013 Model Update
with AETA stakeholders but have not led to a change in the model However these issues do
not cover the OampM costs considerations that are detailed in section 4
31 Representation of Uncertainty
The recognition of uncertainty within the model was discussed including both the level of
representation and potential uncertainties with respect to First-of-a-Kind and lsquoEarly Moverrsquo
Technologies
A number of factors were identified that lead to uncertainty in estimates ndash particularly for
emerging technologies For conventional coal and gas technologies even though the
technology is mature the addition of carbon capture introduces cost and performance
uncertainty Cost estimates have inherent uncertainty due to the market uncertainties and
unforeseeable technological developments and due to
- Volatility in equipment pricing
- Volatility in economic conditions (during post Global Financial Crisis) and
- Volatility in labour pricing due to ldquootherrdquo heavy construction projects in specific areas
For technologies where the costs are well understood it was considered that the error bars
should be reduced compared to immediate and emerging technologies and that the error bars
should be lower for technology costs in 2012 compared to later years
There is strong agreement from two key stakeholder submissions with all the factors causing
uncertainty that have been identified in AETA 2012 In particular the labour cost has varied
(increased) significantly due to large construction projects which have increased costs due to
a shortage of labour and a lower productivity due to less experienced personnel The
uncertainties provided in the AETA model are available on a per technology and a per
selected years basis BREE will consider whether or not to include more detail on
uncertainty by technology in the 2014 review of the model
32 Application of Learning Curves
It was raised during the consultation process that the AETA model revision could allow for
learning curve cost reduction assumptions to be altered by the end user This has not been
incorporated in the 2013 update as it is a structural change to the AETA Model
Stakeholders also raised the question as to whether it is possible within the application of
learning curves to distinguish between the potential for cost reductions on manufactured
components like PV panels versus the Balance of Project (BoP) costs which may involve
routine assembly and erection activities which are not subject to significant learning by
doing
However there are opportunities for cost reductions particularly where many repetitive tasks
are involved such as solar field construction modular construction techniques
rationalization of components in the BoP design or reduction in assembly or placement time
21
This is supported in the US Solar Market Insight Report 2012 (Kann 2012) which identified
continued savings in inverter and racking costs as follows
ldquohellip falling equipment costs and fine-tuning of installation practices have made large-
scale solar less expensive QQrdquo
ldquohellip with the continuing maturation of the industry we expect continued focus on
reducing PV balance-of-systems costs (BOS) and that the increased worry over high
penetration PV will drive adoption of 1000Vdc and advanced inverters
respectivelyrdquo and
ldquoMounting structure manufacturers noted that the past year has seen tremendous
pricing pressure accounting for price declines of anywhere between 10 per cent and
30 per cent over the past yearrdquo
Given that the balance of plant costs can also be subject to cost reductions it is not
considered necessary to distinguish learning curves for discrete project costs in the model
33 General Costs Considerations
331 Fuel Costs
The outlook for fuel costs for gas coal and carbon was claimed to have materially shifted
since the AETA 2012 model While there was no evidence provided to support this
consideration will be given to this issue in the 2014 model update
332 CCS Costs
A submission cited the ZeroGen Case Study and sought to clarify the differences in CCS
cost between ZeroGen and lower values estimated for AETA 2012 This is a valid
comparison however BREE notes the following issues which contribute to explaining the
differences The international cost component is as follows AETA 52 per cent ZeroGen 34
per cent With the USD exchange rate AETA 1 ZeroGen at 08 adjusting the AETA value
for exchange rate variation would add A$952kWnet to the AETA value There is a
difference in plant size with AETA at 557 MW net and Zerogen 400 MW net A bigger plant
size would typically provide a lower cost kW installed
Additionally section 112 of Chapter One of the ZeroGen report advises escalation based on
project delivery from 2011 to 2017 AETA costs are for 2012 basis and do not include
escalation beyond this time A portion of the Zerogen costs will be inflated over the
comparable AETA cost Also section 113 of Chapter One of the ZeroGen report identifies
significant enabling works This is likely to be more inclusive than considered in the AETA
2012 report as identified in section 23 (a)
Overall it is considered likely that a number of estimate basis items in the ZeroGen study are
different and once equalised will show a smaller difference between the AETA and
ZeroGen values Therefore there is no immediate action but the basis and assumptions of the
model may be reviewed during 2014 AETA update
With regard to CCS efficiency one submission proposed that the AETA estimates were
overly optimistic However no references were cited to support this view and no change has
been made to the model
22
333 Opportunity Costs
A submission was made that footnotes be included regarding retrofit costs to indicate that
make-up power costs are not included This was not adopted because AETA parameters for
each technology are calculated for that technology alone and do not consider the impact of
reduced output of a retrofit project where additional output needs to be generated from
alternate higher cost generation Opportunity costs are specifically related to business cases
for specific projects and are not considered for any cases presented in the AETA report
Moreover retrofitting does not make electricity generation uncertain or intermittent It only
lowers the flow of generation at a constant rate (due to lower thermal efficiency) relative to
the non-retrofit case
34 Capital and Construction Costs
A submission was made to update the AETA values for the mid-point capital cost for several
technologies based on a study provided in support of the submission The technologies
asserted were
IGCC (Integrated Gasification and Combined Cycle) with 90 per cent capture fuelled
with Victorian brown coal
IGCC with no capture fuelled with black coal
IGCC with 90 per cent capture fuelled with black coal
Pulverised Fuel power plant with 90 per cent capture fuelled with Victorian brown
coal
Pulverised Fuel power plant with 90 per cent capture fuelled with black coal and
OCGT with no capture fuelled with natural gas
There is a key difference in the magnitude of the labour component in Australia compared
with the labour costs associated with the supporting material (from the USA) While no
changes have been made to the model in this update the ldquoshort termrdquo impact of labour
pricing on technology costs may be considered in further updates
Similarly it was submitted that the capital cost values for combined Cycle Gas Turbine
(CCGT) (with and without capture) could be revised As no documentary evidence was
provided to support this no change was made
For Direct Injection Coal Emulsion (DICE) power plant with no capture fuelled with
Victorian brown coal it is also suggested that the values be reviewed with a number of
papers provided for reference However these papers do not address capital cost in any depth
and it is unclear if the balance of project costs included are comparable with AETA DICE
technology is not mature and is probably best described as in the demonstration to
deployment phase of development which brings uncertainty into the cost analysis Therefore
data is needed to substantiate this submission As this was not available at the time of
preparing this report consideration of this issue is deferred to a later time when the necessary
data is available
An increase in the capital costs for Solar thermal trough (6 hrs storage) and Solar thermal
central receiver (6 hours storage) were proposed based on a supporting study by the Electric
Power Research institute (EPRI) The proposed values are substantially larger than the AETA
23
2012 but it is not clear what basis is used to generate these revised values A separate
submission received from another AETA stakeholder has supported the AETA values
Additionally the cited reference for solar thermal trough the Energy Power Research
Institute (EPRI) plant configuration is based on air cooling ndash while for AETA the plant
configuration assumes water cooling The difference in plant configuration will account for a
small part of the difference The AETA value is based on a reference report as issued in 2012
by the US National Renewable Energy Laboratory (NREL 2012)
The AETA value for the central receiver technology is based on a small (20MW) plant
(Gemasolar) with factors for adjustment to field size for thermal storage capacity and post
FOAK learning These factors will align with increased uncertainty in the AETA value It is
likely that additional cost information may now be available for the Brightsource Ivanpah
plant (no storage) and other tower plants being considered under construction
Further investigation of these issues has been sought with stakeholders but is as yet
unavailable
Another suggestion was made to consider capital costs on a component basis The capital
costs used in AETA 2012 for existing technologies were based on actual costs that could be
sourced on published documents (locally andor internationally) or from WorleyParsons
internal data For developing technologies costs were not considered on a component level
For this reason in technologies that are not commercialised a number of assumptions would
need to be made which may limit lsquorealrsquo costs being available No change to the model arose
from this submission
A reassessment of the construction expenditure profile for concentrating solar power (CSP)
technology options was sought in another stakeholder submission and supported by a
referenced report (IT Power 2012) However the plant sizes considered in the AETA report
are larger capacity (100 MW+) than those discussed in the cited report and consequently
have a longer duration construction period As three years is considered to be an appropriate
time period to spread the construction expenditure profile no change to the model was made
35 Costs Associated with Solar Technologies
A change to the model was sought with regard to the significant downward trends in the cost
of solar PV The stakeholder submission cited pricing data from the Australian Photovoltaic
Institute (APVI) Consultation with the APVI identified that evidence based information for
utility scale PV costs in Australia is limited because Australia has no PV systems 100 MW or
larger It is acknowledged however that there is significant and continued volatility in the
solar PV market including volatility due to competition oversupply in the PV module
market as well as continued price reductions for balance of system and installation costs
A$338 Wnet was a reasonable valuation for 2012 AETA The AETA 2012 value will be
maintained but may be reviewed in the 2014 model update
It was also suggested that solar thermal costs could be better represented in the model by
allowing for different periods of storage rather than a standard 6 hours The AETA 2012
scope was based on fixed plant designs which included fixed thermal storage sizing where
thermal storage was included With thermal storage there are a number of variables that can
be considered including differing field sizes (solar multiple) as well as actual thermal storage
capacities This is likely to add significant complexity to the report and to the model the
benefit of which at this stage does not warrant the changes
24
36 Costs Associated with Nuclear Technologies
It was submitted that consideration be given to including the impact on LCOE for nuclear
technology of the relatively high insurance costs for nuclear technologies This issue will be
considered in the 2014 review of the AETA model However insurance costs or plant
decommissioning costs are not considered for any of the 40 AETA technologies
Also the OampM improvement rate for Nuclear was not reconsidered as there is no OampM
improvement rate for Nuclear in the model
37 Further Technologies
A proposal was received which recommended that further technologies (DICE power plant
based on black coal with and without capture and DICE brown coal with capture and
medium speed DICE technologies) be incorporated into the AETA Model However as
mentioned earlier this update of the AETA 2012 Model only considered the technologies
included in that model This update of the model is not intended to broaden the technologies
38 Auxiliary Loads
Another example used for the purposes of drawing comparisons with the AETA model was
the SaskPower Post Combustion Retrofit It is difficult to distil the SaskPower project data
into a direct comparison with the AETA study and consequently there is insufficient data
certainty to warrant changes to the AETA 2012 values The SaskPower Post Combustion
Retrofit was also cited as to its conservative auxiliary loads for brown and black coal
However upon further investigation this was not substantiated within the SaskPower
example
25
4 WIND PV AND CSP OPERATIONS AND MAINTENANCE (OampM) COST UPDATE
41 Operation and Maintenance Costs
OPERATING AND MAINTENANCE COST DEFINITIONS
In considering the costing of OampM there is no absolutely clear definition of which costs
should be considered as fixed and which variable with the breakdown varying based on a
range of issues including technology location and resource type For this reason in the future
AETA reports OampM costs may be compared in terms of annual total operating expenditure
(OPEX) per MW of generation This method is widely used by most international institutions
to analyse OampM costs and to avoid subjective considerations
For this report fixed and variable costs are reported to provide direct comparison with AETA
2012 In this regard in general fixed costs are independent of the electrical generation of the
plant and are expressed as annual cost per MW capacity Fixed costs include items such as
fixed labour
equipment and
vehicles
Variable costs are proportional to the electrical generation of the Plant and are expressed as
cost rate per kWh energy output Variable costs include items such as
variable labour
consumables and
spare parts
As both public and private domain material vary in the way they approach and report on
fixed and variable maintenance within the following text where an interpretation has been
used for comparison purposes this is described
A submission was made to remove the operations and maintenance (OampM) cost escalation
factors This was not taken up as there is an increase in the OampM costs over CPI which is
borne out historically A review of the basis for this escalation determined that the
underlying assumptions were appropriate The review also considered adopting a generic
learning curve approach for OampM improvement rates as was suggested in one submission
This was not adopted as the model has an OampM improvement rate (set at 02 per cent per
annum) which can be varied by the user for wind and solar technologies This value accounts
for more efficient practices balancing the increase in labour and material costs over and
above CPI However changes to OampM improvement rates for selected technologies were
made as mentioned earlier OampM improvement rate values may be further considered for
emerging technologies in 2014 AETA study
A number of submissions referred to the improvement rate of OampM costs with evidence for
existing technologies to support these rising at 150 per cent CPI It was suggested that for
26
developing technologies it could reasonably be assumed that there would be reductions in
OampM between the first commercial installation and subsequent installations
While it is generally acknowledged that the LCOE of delivered energy from wind is falling
within the literature there is conflicting evidence around trends in OampM costs with recent
reports indicating both significant decreases and increases in OampM (see section 432)
Solar thermal plants consist of technology components that can be considered mature (eg
steam turbine) and components that are undergoing further development such as the solar
field and thermal storage Solar thermal plants require manning for operation as opposed to
wind turbines that do not require the same level of manning
A recent article (Muirhead 2013) advised for the Solar Energy Generating Systems (SEGS)
plants in California that have been operating since the early 1990rsquos ldquoMy understanding is
that the performance of the SEGS plants has significantly improved over time This is due
primarily to replacement of first generation receivers with newer receivers that are much
more efficient OampM practices at the plants have also improved over time based on the now
long history of operating these plants resulting in increased output in addition to reduced
OampM costs
In the AEMO report 100 Per Cent Renewables Study - Draft Modelling Outcomes Scenario 1
assumes that rapid technology transformation will drive real reductions in OampM costs
outweighing any increases projected in the AETA 2012 so OampM costs reduce by 125 per
cent by 2030 and 25 per cent by 2050 Scenario 2 uses the AETA 2012 assumption that
OampM costs escalate at around 150 per cent of Consumer Price Index (CPI) which leads to
cost increases of 27 per cent by 2030 and 46 per cent by 2050 It should be noted that the
Scenario 1 reductions are assumptions without further analysis of what will bring the
assumptions to fruition
In AETA 2012 the common OampM improvement rate for most technologies is set at 02 per
cent and can be varied as a user input The OampM improvement rate for emerging
technologies solar thermal and photovoltaic technology options and offshore wind is set to
25 per cent and can also be varied as a user input The improvement rate is now compounds
on the previous yearrsquos value
The OampM improvement rate values may be further considered for emerging technologies in
2014 AETA study
42 Operating and Maintenance (OampM) Changes in summary
As part of the Model Update special emphasis was placed in this report on the Operational
and Maintenance (OampM) costs and OampM improvement rates for all wind solar thermal and
solar PV renewable technologies covered in AETA 2012 As mentioned earlier this took into
account relevant Australian and international reports public domain information private
sources as well BREE and WorleyParsonsrsquo in-house experience The updated OampM values
are shown in Table 4 Reductions in CSP OampM costs of between 8 per cent and 27 per cent
were obtained in comparison to values provide in AETA 2012 report
The review included a detailed review of a report by IT Power cited as part of one of the
stakeholder submissions In that report reference is made to a case where $18MWh of OampM
costs comes from 64MW trough plant however it does not specify the relevant location hour
27
of thermal energy storage (TES) capacity factor type of cooling and back-up fuel and
therefore cannot be fully analysed nor used towards this AETA update
OampM costs for solar thermal plants are significantly affected by the costs of manpower To
demonstrate this with an example $18MWh for a 100MW plant with a 23 per cent capacity
factor (the IT Power report consideration) would result in an annual OampM cost of
approximately $36 million A 100MW plant will need at least 28 full time employees to be
properly manned 7 daysweek as there needs to be multiple shifts With this amount of
labour there are insufficient funds for site services utilities and materialsmaintenance If the
value is based on another location such as the Far or the Middle East region where labour
costs are significantly lower then a lower OampM cost may be feasible however for Australia
this does not appear to be feasible
The changes to OampM values for the 2013 AETA model refresh are summarised below
Table 4 Model Changes OampM costs
AETA 2012 report reference AETA 2012 model value AETA 2013 update
Section 23 Technical Assumptions
Operating and Maintenance Cost
Estimates
OampM improvement rate 02per
cent all technologies
OampM improvement rate maintained at
02per cent for
Coal based technology options
Gas based technology options
Solar thermal hybrid options
Onshore wind
Biomass technology options
Wave technology options
Geothermal technology options
Nuclear technology options
OampM improvement rate changed to 25per
cent for
Solar thermal technology options
Photovoltaic technology options
Offshore wind
The OampM improvement rate is compounded
from the previous yearsrsquo value
Section 33 Solar thermal
technologies
Solar thermal - Parabolic Trough wo
storage
Fixed OampM (AUS$MWyear)
Variable OampM (AUS$MWh)
60000
15
59176
1519
Solar thermal - Parabolic Trough with
storage
Fixed OampM (AUS$MWyear)
Variable OampM (AUS$MWh)
65000
20
72381
1139
Solar thermal - central receiver
technology wo storage
28
AETA 2012 report reference AETA 2012 model value AETA 2013 update
Fixed OampM (AUS$MWyear)
Variable OampM (AUS$MWh)
70000
15
58285
707
Solar thermal - central receiver
technology with storage
Fixed OampM (AUS$MWyear)
Variable OampM (AUS$MWh)
60000
15
71312
565
Solar thermal - Linear Fresnel wo
storage
Fixed OampM (AUS$MWyear)
Variable OampM (AUS$MWh)
60000
1500
64105
1519
Solar thermal - Linear Fresnel with
storage
Fixed OampM (AUS$MWyear)
Variable OampM (AUS$MWh)
65000
20
72381
1139
Section 35 Photovoltaic
technologies
PV ndash non tracking
Fixed OampM (AUS$MWyear)
25000
25000 (no change)
PV - Single Axis Tracking
Fixed OampM (AUS$MWyear)
38000
30000
PV - Dual Axis Tracking
Fixed OampM (AUS$MWyear)
47000
39000
Section 36 Wind Technologies
Wind Onshore
Fixed OampM (AUS$MWyear)
Variable OampM (AUS$MWh)
40000
12
32500
10
Wind Offshore
Fixed OampM (AUS$MWyear)
Variable OampM (AUS$MWh)
80000
12
77600
30
43 Wind
431 Introduction
This Section reviews onshore and offshore wind operations and maintenance (OampM) costs
used in AETA 2012 The values scrutinised are the fixed and variable OampM given in Table
361 of that report summarised in Table 5 below
29
Table 5 Wind OampM costs used in the AETA 2012 report
Option Fixed OampM (AUS$MW) Variable OampM (AUS$MWh)
Onshore 40000 12
Offshore 80000 12
OampM covers all of the services required to keep the wind farm operating as contracted to
supply energy and renewable energy certificates for its lifetime inclusive of
turbines and all balance of plant (roads buildings electrical equipment SCADA
control equipment) up to the high voltage connection point on the wind farm
substation
labour (both trades and professional)
facilities (workshops stores offices)
equipment (tools jigs vehicles rigging safety equipment craneage)
spare parts and
consumables (such as oil grease and office consumables)
Windfarm size was not specified in AETA 2012 however it was noted that wind farms
greater than 100MW are becoming more common Since then within Australia wind farms
of larger and smaller sizes have been constructed for example the 420 MW Macarthur Wind
Farm in Victoria and the 55 MW Mumbida Wind Farm in Western Australia with both larger
and smaller wind farms under proposal For this review a nominal size of 100-150 MW is
used as representative of current and future facilities
432 Review of Evidence
As mentioned earlier the review of public literature by BREE and WorleyParsons the
procurement of private studies consultations with owneroperators in the wind farm OampM
sector in Australia AETA Stakeholders and project Steering Committee members were used
to assist the current Model Update process Where possible these sources are noted in the
text however some of these sources have asked to remain anonymous and where so the
term ldquoprivate sourcerdquo has been used
As noted by one reviewer in NREL 2011 OampM cost information in the public domain in
both quantum and quality is poor and the situation appears no better in 2013 particularly in
the discrimination of fixed and variable costs One reason for this is the commercial and
increasingly competitive nature of the sector with wind farm OampM now a significant
business worldwide with subsequent confidentiality around actual costs
What constitutes wind farm OampM is also changing This is driven in part by technological
change as the wind fleet ages as new turbines become larger and more sophisticated
particularly offshore Competition in the provision of OampM services is also changing with
maturing of the wind energy product As an example the following industry trends are now
evident
30
a growing role of independents in the wind OampM market ndash around 25 per cent of the
wind fleet in the US is expected to be operated and maintained by independents by
2025 (Ebert and Ware 2013) as opposed to original equipment manufacturers (OEMs) -
wind is largely a commodity market and easier for new participants to enter something
not necessarily seen with other generation technologies
tighter supply markets ndash general economic volatility is tightening the supply and
project development chain for wind moving interest into the OampM sector bringing
price volatility and more competition
a more sophisticated asset management model ndash where OampM providers are linking
operational data with long term condition monitoring output forecasting and work
order scheduling to deliver what is termed ldquolifecycle optimisationrdquo squeezing more
energy out of the asset
older turbines exceeding planned maintenance budgets ndash with the chief issue being
keeping the variable OampM from unforeseen breakdowns
a push for larger turbines particularly offshore (5-10 MW) and in deeper waters and
linking OampM to turbine contracts ndash there is evidence (including in Australia private
source) that wind farm OampM is becoming an even more significant bargaining
component of turbine supply contracts where lower supply costs are balanced by
longer OampM contracts
Costs of wind OampM are difficult to summarise as they are dependent on many issues As just
one example in the NREL 2011 study cited earlier a wide variability in wind farm OampM
costs was found across a range of countries (Figure 1) This reference demonstrates this
variability from the average reference case in terms of Levelised Cost of Energy (LCOE)
31
Figure 1 Effect of country variables on LCOE of wind plant
Source NREL (2011)
Other issues which affect the contracted cost of OampM for wind include
regional variations in labour and transport costs
wind farm environment particularly wind regime and proximity to the ocean
(corrosion)
the maturity and availability of wind turbine technicians
the spread of facilities geographically and the wind farm asset sizes in a portfolio
the turbine type and brand particularly the support establishment within a Region
the age of the asset OampM history and existence of Type (or systematic) failures of
major components
the ability of the OampM provider under the contract to source third party spares andor
try varied maintenance practices and
the nature of the OampM contract ndash for example does it include risk reward elements or
have a link to the wind turbine supply contract or is it a ldquoproduction availabilityrdquo
contract type
While it is generally acknowledged that the LCOE of delivered energy is falling for wind
technology (Hand 2013) within the literature there is conflicting evidence around trends in
OampM costs with recent reports indicating both significant decreases (BNEF 2013) and
increases (Ebert and Ware 2013) It is generally acknowledged that increased competition in
the OampM market is delivering lower cost service provision but this may in part be offset by
an ageing fleet requiring more variable maintenance and a more sophisticated and costly
32
response Several studies have demonstrated that the costs of maintaining wind turbines
generally increase with time following a trend similar in shape to that in Figure 2 (Hand
2013) with estimates in Albers (2009) indicating a doubling in turbine OampM costs by mid
plant life The term COD in Figure 2 refers to commercial operations date
Figure 2 Typical cost increasing trends in wind farm OampM costs with commercial operations
date
Source Adapted by WorleyParsons from Houston (2013)
In Australia this trend is also evident in post 10-year aged machines (private source)
particularly in relation to variable maintenance The nature of any similar increase with more
modern turbines is unpredictable although turbine availability is improving and there is
evidence that OampM costs with each generation of turbine are lowering see Wiser et al
(2012)
The OampM costs for offshore wind farms are particularly difficult to estimate as the industry
is still at the early stages of development including the progression of much larger turbines
into deeper water and the more complex nature of the task Such progression is indicated in
Figure 3 taken from RolandBerger (2013) which indicates an expected decrease in OampM
costs These costs are of the same order of that published in other recent publications UK
Crown Estate (2012) and US DoE (2013)
33
Figure 3 Trends in offshore wind farms and estimated impact on LCOE
Source RolandBerger (2013)
433 Updated OampM Figures for Australia
It is not a simple matter to transfer international costs to Australia as despite trends there are
significant differences between regions including
size of market ndash despite growth the Australian wind market is small with respect to
other world regions For example the total wind fleet is 4 GW (CEC 2013) for
Australia versus 60 GW for the US (AWEA 2013)
labour and material rates in certain parts of Australia are high by world standards
the logistics of getting to and within Australia generally involve longer distances than
other areas of the world particularly due to the remoteness from major equipment
suppliers
volatility of the Australian dollar particularly against the US and
the size of Australian wind farms tends to be larger
These differences can be seen in Figure 4 supplied by a turbine equipment supplier (private
source) and showing the relative OampM costs (per MW) and technician numbers (per 100
MW) across various world regions in 2012 for wind turbine maintenance only and excluding
balance of plant Numbers and scales between the two indices have been removed to protect
the confidentiality of this supplier with data believed to cover the entire global portfolio
under management This shows a significant difference between regions for onshore in both
indices for example almost a 45 per cent difference in costs between Europe and America
Australia would sit within ldquoAsiaPacificrdquo and while the Figure indicates generally lower
OampM costs and higher technician numbers for this region this presumably covers a very
diverse area (including South East Asia New Zealand and Oceania) which may skew results
34
Unlike many larger global markets the wind OampM sector in Australia is dominated by
turbine equipment suppliers with original equipment manufacturer (OEM) contracts
estimated to cover more than 95 per cent of the fleet The evidence for this is mostly
anecdotal although a number of smaller independent suppliers are now known to be
undertaking full service OampM for older plant (gt10+ years) with many of the drivers for this
covered in Ebert et al (2013) There is also evidence (private source) that wind turbine
suppliers in Australia are seeking OampM contracts with much longer terms and tying these to
reductions in turbine supply prices This may indicate a lack of competitive pressure on
OampM pricing in the near to mid-term and as the size of the overall market is small it is
unknown whether independents will grow market share as has been the case in many larger
global markets see for example Deloitte amp Touche (2012)
The most recent contemporary literature comments on onshore wind farm OampM pricing in
Australia and surrounds that could be found in the public domain and not used for the AETA
2012 work are from Hassan (2011) and Deloitte (2011) These are summarised with other
new international references cited in Table 6 with assumptions on any conversions noted
below the table As no offshore wind farm projects have been progressed in Australia the
table includes values from new sources for offshore projects from the international public
domain literature - the significant difference to onshore costs is evident in the values
Figure 4 OampM Costs (per MW) and Technician Numbers (per 100MW) for total wind turbine
OampM (Opex)
Source Private - values and scales removed to protect confidentiality
From Table 6 and considering the differences in markets it appears that for onshore wind the
AETA 2012 estimates may be slightly high with an updated AETA 2013 recommendation
given in Table 7 This value has been arrived at by considering
the size of the Australian wind market and lack of competitive pressure from
independent OampM service providers
35
supply side pressures on OEMs driving them to protect their OampM businesses and
lowering costs
the likely increase in fleet installations to comply with RET legislation skewing the
fleet age to more a modern generation of turbines although it is noted that there is some
uncertainty around long term OampM cost trends particularly variable maintenance ndash an
asset age of around 5 years is assumed here
uncertainties in what is included in referenced values and differences in markets and
advice from actual asset owners and OampM providers (private sources) on current actual
costs
Table 6 Comparison of AETA 2012 wind OampM estimates with new references for 2013
Source Region
Fixed OampM
(AUS$MW)
Variable OampM
(AUS$MWh)
Total OPEX
(AUS$MW)
On
sh
ore
AETA 2012 Australia 40000 12 799451
Houston 2013 US - - 35-380002
BNEF 2013 Global - - 25000
3
Private Source (2013) (gt 10 yr old
plant) Australia - - 70000
Private Source (2013)
(lt 2 yr old out of warranty plant) Australia - - 55000
Hassan 2011 Australia - - 83-99000
4
Deloitte 2011 New Zealand - - 450005
Off
sh
ore
AETA 2012 Australia 80000 12 1262526
Crown Estate 2012 UK - - 275000
7
Hassan (2013) UK - - 2391567
RolandBerger 2013 Europe - - 198000
8
US DoE 2013 US - - 144970
9
1 Assumes a 38 capacity factor
2 USAUD = 109 extrapolated from Figure approximately to 2013
3 EUROAUD = 142 uncertain if this includes all balance of plant or VOM and only includes OEM providers
4 Assumes a 38 capacity factor
5 Assumes NZAUD = 084 a 38 capacity factor and the mid-range estimate for OampM
6 Assumes a 44 capacity factor
7 Assumes GBPAUD = 167 and taking midpoint of estimates stated
8 Assumes GBPAUD = 167 and taking value for 3MW turbines
9 Assumes USAUD = 109
36
The figures shown for onshore projects in Table 7 represent a 15 per cent decrease in the
expected OampM costs of wind farms in Australia compared to AETA 2012 This change
reflects the volatility in this market noted in previous sections and in referenced material
internationally plus the appearance of significant downward pressure on wind OampM prices
primarily through increased global competition The values allow for the rising price of
turbine OampM as the turbine ages during its life
For offshore wind it appears that the OampM costs in AETA 2012 are too low and although it
is tempting to align costs with the most recent US figures due to their lower costs and similar
coastal conditions to Australia the European offshore fleet is significantly larger and more
mature Average figures across the 2013 referenced material including Europe is
recommended This is also shown in Table 7 and represents a significant increase in estimate
costs (around 33per cent) which reflects this evolving sector
There is very little contemporary information available on the breakdown of fixed and
variable maintenance on wind plant making judgment around this for the AETA requirements
is difficult However there is some published but copyrighted material eg GlobalData 2012
which combined with others (private sources) indicates that for onshore and offshore wind
plant respectively a 5050 and 4060 FOM VOM split is appropriate This has been used to
adjust the total OPEX figure in Table 7 to the AETA scheduled and variable indices
requirements using a 38 per cent and a 44 per cent capacity factor for onshore and offshore
projects respectively
Table 7 Recommended AETA (2013) values
AETA (2013) update Fixed OampM
(AUS$MW)
Variable OampM
(AUS$MWh)
Total OPEX
(AUS$MW)
Onshore $32500 $10 $65790
Offshore $77600 $30 $194000
44 Solar Photovoltaics (PV)
441 Introduction
This Section of the report focuses on the OampM costs for ground-mount photovoltaic (PV)
technologies broken down by the following mounting system configurations
Fixed Tilt (FT)
Single Axis Tracking (SAT)
Dual Axis Tracking (DAT)
Although different PV panel technology types (eg poly-crystalline mono-crystalline or thin
film CdTe) affect the capacity factor and land use the OampM costs are comparable The
estimates for this Report are based on polycrystalline PV technology which provides an
average cost on a per Watt basis with mono-crystalline OampM costs being slightly lower and
thin film OampM costs being slightly higher
With the aim to provide comparable results between technologies WorleyParsons has
analysed and updated the PV OampM costs in terms of both fixed operation and maintenance
37
costs (FOM) and total operating expenditures (OPEX) based on reference plants of similar
characteristics
Assumptions interpretations and considerations based on their in-house data and global
market trends are described in the following Sections
442 Review of the Evidence
Since the AETA 2012 report release few new public domain reports related to OampM costs
for PV systems have been published To confirm this the following organisations have been
consulted by WorleyParsons to provide the 2013 OampM costs update for the selected PV
configurations
International Renewable Energy Agency (IRENA) (wwwirenaorg)
International Energy Agency (IEA) (wwwieaorg)
The World Bank (WB) (wwwworldbankorg)
The US National Renewable Energy Laboratory (NREL) (wwwnrelgov)
Solar Energy Industries Association (SEIA) (wwwseiaorgau)
European Photovoltaic Industry Association (EPIA) (wwwepiaorg) and
Solar Electric Power Association (SEPA) (wwwsolarelectricpowerorg)
Upon review of the available information when compared to AETA 2012 the listed
organisations do not have any new public information related to large-scale PV OampM costs
If OampM costs are mentioned they are normally referenced as a per cent of the total Capital
Expenditure (CAPEX) for the plant (around 1 per cent) and provide little useful information
about OampM Cost changes
Due to insufficient detailed and recent information in the public domain WorleyParsons
obtained the following market reports from Photon a private organisation focused on market
news political discussions and technology analysis for the PV industry
Photon 2013 ldquoThe True Cost of Solar Power - Temple of Doomrdquo and
Photon 2013 ldquoSolar Annual 2013 - Build your Empirerdquo
These private reports had minimal focus on OampM costs To provide further input in this
area private OampM service providers were contacted for pricing estimates and market trends
443 AETA 2012 OampM PV costs report comparison
Typical power plant OampM costs are expressed as a combination of a variable component
(proportional to generation) and a fixed component (occurs irrespective of generated output)
Since the generation of a PV plant is dependent on solar radiation (not requiring fossil fuel or
water which make up the major components of variable costs for conventional generation) it
is typical to express the OampM costs only as Fixed OampM (FOM) costs proportional to the
plant size due to the simplicity of PV systems The AETA 2012 report follows this practice
and estimates the PV OampM costs as FOM only relative to plant size (kW) expressed on a per
year basis
38
In order to facilitate comparisons of these costs with other electricity technologies the FOM
costs in the AETA 2012 report are also presented as OPEX costs per MW of generating
capacity per year
ASSUMPTIONS AND CONSIDERATIONS
The following costs are included in the FOM estimates as an annual cost per kW capacity
labor and administrative expenses
panel washing (twice per year at $300 kl for water)
weed abatement (seasonal herbicide applications)
inverter replacement reserve (replaced at operational year 10) and
materials and maintenance spare parts civil works preventative and corrective
equipment maintenance
Although the cost of water is variable depending on location and usage it is such a small
portion of the total OampM costs that it is adequate to assume it as a fixed cost using the
assumptions listed above
AETA 2012 PV OampM COSTS COMPARISON REPORT
The technical characteristics of the reference PV plants used in the AETA 2012 report have
been extracted from the AETA 2012 Model (Version 1_0 Rev B BREE 2012) and are
summarised in Table 8
Based on this information the following parameters for the PV technologies are estimated
Total net energy production in terms of MWh sent out per year
Total plant acreage
FOM in terms of USD per year and
Total OPEX costs in terms of USD per year and USD per total net energy production
per year
39
Table 8 AETA 2012 reference plants technical characteristics and OPEX costs
Plant Characteristics Units Fixed Tilt (FT) Single Axis Tracking (SAT)
Dual Axis Tracking (DAT)
Plant Characteristics
Plant Net Capacity MW 100 100 100
Capacity Factor per cent 21 24 26
FOM $kWyear 25 38 47
Net Energy MWhyear 183960 210240 227760
Plant Acreage acres 500 800 900
Total FOM $year 2500000 3800000 4700000
Total OPEX $year 2500000 3800000 4700000
Total OPEX $kWh 00136 00181 00206
Total OPEX costs are between 00136 and 00206 USDkWh as shown in Table 8 above
These values are conservative cost estimates but reasonable for a large-scale PV plant with
comprehensive OampM service As is expected the FOM or OPEX costs increase as the plant
footprint increases and the complexity of the mounting system increases However the
increases to single and double axis tracking technologies are larger than would be expected
The increased complexity of the trackers does add costs to OampM in terms of labor parts and
even physical plant size but these additions are minor in comparison to the larger OampM
budget items such as the inverter replacement reserve and general electrical maintenance
which are irrespective of mounting system
These values although conservative still show the cost reductions from the industry learning
curve and expanded competition over the past few years when compared to past estimates of
OampM costs This can be seen in the following Table 9 of Fixed Tilt (FT) costs which
provides some estimates found in previous publications by IEA (2008) and EPRI (2010) The
tracking estimates are not shown since minimal data is available This corresponds to the
historical market trend of the industry being more willing to install fixed tilt systems rather
than tracking systems due to lower costs and technology risk
Table 9 Comparison of historical estimated PV and OampM costs in the public domain
PV Configuration OampM Costs Units IEA 200810
EPRI 2010 AETA 2012
Fixed Tilt (FT) FOM $kWyear 40 32 to 37 25
values in Italics are derived from reported data
10
Report assumed 1 of capital costs and 23 capacity factor
40
45 AETA 2013 PV OampM Costs Update
Using the same plant characteristic assumptions as the 2012 AETA Model the 2013 OampM
costs were estimated by WorleyParsons based on the references described in review of the
evidence in Section 442 The comparison of the AETA 2013 and 2012 OampM costs are
presented in Table 10 below
Table 10 2013 PV OampM costs compared to 2012 PV OampM costs PV Configuration OampM Costs Units AETA 2012 WorleyParsons
2013 Update
Fixed Tilt (FT) FOM $kWyear 25 25
OPEX $kWh 00136 00134
Single Axis Tracking (SAT) FOM $kWyear 38 30
OPEX $kWh 00181 00141
Dual Axis Tracking (DAT) FOM $kWyear 47 39
OPEX $kWh 00206 00173
Although the OampM costs for FT systems are approximately the same SAT and DAT OampM
costs reduced by around 20-30 per cent in this 2013 update compared to the AETA 2012
report The consistency of the FT costs is reasonable and expected to continue for the next
few years as discussed further in Section 451
Regarding the SAT and DAT costs although there have been improvements in the design of
trackers for PV applications this OampM cost reduction is due to a better understanding of the
costs associated with electrical and tracking system maintenance The cost differences
between tracking systems was corroborated by quotes from private OampM service companies
who indicated that there was only a slight increase in costs from FT to SAT but a larger
increase in costs from SAT to DAT
As compared to the references mentioned in Section 442 the updated cost estimates are
conservative Table 11 compares the estimated 2013 OampM costs with those references
However since these publications focused primarily on the CAPEX with very general OampM
cost assumptions the OampM costs presented therein are not considered representative
baselines for large-scale solar projects Furthermore they attest to the industryrsquos tendency to
focus strictly on installation costs and not lifecycle costs which is discussed further in Section
451
41
Table 11 2013 updated OampM costs compared to new referenced OampM costs (7-2) PV Configuration
OampM Costs
Units WorleyParsons 2013 Update
11
NREL 2013
12
IRENA 2013a
13
Photon 2013
14
Private OampM Service Providers
201315
Fixed Tilt (FT) FOM $kWyear 25 235 17 to 21 18 17 to 23
OPEX $kWh 00134 00216 to
00383
00121 to 00266
00098 00094 to 00127
Single Axis Tracking (SAT)
FOM $kWyear 30 Not provided
Not provided
Not provided
25 to 27
OPEX $kWh 00141 Not provided
Not provided
Not provided
00136 to 00147
Dual Axis Tracking (DAT)
FOM $kWyear 39 Not provided
Not provided
Not provided
32 to 34
OPEX $kWh 00173 Not provided
Not provided
Not provided
00174 to 00185
values in Italics are derived from reported data
451 OampM Learning Rates
In the rapid PV industry growth of the last three years WorleyParsons and anecdotal
experience is that PV was considered generally to require little to no maintenance causing a
general disregard for OampM planning This appears to have resulted in complications as
owners struggle to resolve reliability performance and budget issues as the projects mature
(multiple private sources) Although the maintenance costs are smaller compared to standard
power plants OampM awareness has been increasing in the industry and therefore the OampM
cost estimates have subsequently increased
This is supported through the recent focus of OampM at PV conferences (such as Sandia
National Laboratory and Solar Energy International events) on increasing the investment in
OampM practices in addition to improving the current practices products and services so that
PV plants can be better maintained to achieve higher reliability throughout the plant life
cycle Currently the majority of OampM expenses for PV systems consist of maintaining and
replacing the inverters followed by the Balance of System maintenance In general once the
appropriate level of investment in OampM for PV is reached then OampM costs will begin to
decrease as the following issues develop to maturity
technology improvement
inverter design for reliability and longevity
data monitoring for preventative and corrective maintenance support
system efficiency to increase system output for the same OampM expense
decreased capital costs for major equipment
decreased spare parts costs
11
See assumptions in Section 433 and 443 12
Report assumed 250kW rooftop at 7 to 10 capacity factor 13
Report assumed 1 of CAPEX and 9 to16 capacity factor 14
Values derived from the global weighted average calculations assuming 21 capacity factor and 20 year lifecycle Report assumed a
simple percentage of average selling price 15
Quote excluded weed abatement panel washing and inverter replacement reserve which were supplemented from the WP estimate
Calculations assumed 21 capacity factor
42
industry maturity and stability
reliable OEM support from product consistency and commercial stability
improved codes and standards for PV equipment system design installation
commissioning and OampM and
experience
trained and experienced personnel in the installation and maintenance of PV plants
In line with this trend owners system designers installers and OEMs are now including
OampM considerations in their finances designs services and products Even though there
have been and will continue to be cost reductions in OampM due to the industry maturation
stabilization and competition those cost reductions are balanced with the necessary
increases in OampM investment to meet the maintenance needs of existing and planned PV
plants resulting in a level OampM cost estimate for the next five years
Photon (2013) follows this assumption of consistent OampM costs for the next ten years as well
as WorleyParsons discussions with OampM service providers Therefore the assumption that
PV OampM costs will remain somewhat constant over the next five years before reducing again
appears to follow the projections in the industry
452 Conclusions - PV
The key findings from the AETA 2012 review and update of the PV OampM costs are as
follows
The 2013 WorleyParsons PV OampM costs update resulted in values of
$25kWyear for FT systems
$30kWyear for SAT
$39kWyear for SAT in 2012 USD
Fixed tilt configurations have not seen significant changes in OampM costs compared to
the 2012 AETA estimates while SAT and DAT configurations cost estimates have
reduced approximately 20-30 per cent based on a better understanding of the associated
OampM costs
Values obtained in the 2013 WorleyParsons update are more conservative but are
aligned with values provided by recognised international institutions even though few
detailed OampM breakdowns are available and
OampM costs for PV are expected to remain constant over the next five years before
reducing as the industry matures in both experience and long-term planning
capabilities
43
46 Concentrating Solar Power (CSP)
461 Introduction
This Section of the report focuses on the OampM costs for the following Concentrating Solar
Power (CSP) technologies
Parabolic Trough (PT)
Solar Tower (ST) and
Linear Fresnel (LF)
CSP OampM costs were analysed in terms of
Fixed Operating and Maintenance Costs (FOM)
Variable Operating and Maintenance Costs (VOM) and
Total Operating Expenditures (OPEX)
In order to arrive at comparable results between technologies BREE and WorleyParsons
estimated the OampM costs based on
Reference Plants with similar Solar Plant characteristics localisation net capacity
capacity factor hours of Thermal Energy Storage (TES) and type of cooling system(s)
and
Cost estimate amounts that were updated to 2012 USD
When information was not available necessary estimates were made using WorleyParsonsrsquo
in-house data and based on global market trends observed in various publications
462 Review of the evidence
The following international organisations were consulted to provide the AETA 2013 OampM
costs update for the selected CSP technologies
International Renewable Energy Agency (IRENA) (wwwirenaorg)
International Energy Agency (IEA) (wwwieaorg)
European Solar Thermal Electricity Association (ESTELA) (wwwestelarde)
The World Bank (WB) (wwwworldbankorg)
National Renewable Energy Laboratory (NREL) (wwwnrelgov)
Protermosolar (wwwprotermosolares)
Institute for Energy Diversification and Saving (IDEA) (wwwideaes)
Renovetec (wwwrenoveteces) and
CSP Today (wwwcsptodaycom)
The approach in reviewing OampM costs for the 2013 update for CSP technology was only to
use new sources of information published since the AETA 2012 report was written This was
44
maintained for all but the learning rates estimation which is due to the lack of any new
updated information published since 2012 in relation to this
Upon review of the available public domain information it was found that IEA ESTELA
WB Protermosolar Renovetec and IDEA do not have any new relevant public information
related to CSP OampM costs However IRENA 2013b IRENA 2013c and NREL 2012 are
new references from IRENA and NREL that are considered relevant and which were used in
this report
The information contained in these references did not provide updated costs for all of the
CSP technologies being considered in this Report and the values offered were not provided
in terms of FOM and VOM costs as preferred
Due to the lack of new relevant information in the public domain the AETA 2013 Model
Update process obtained reports from CSP Today a private international organisation
focused on news events reports updates and information for the CSP industry in markets
such as India South Africa Spain USA Chile and MENA regions The Update acquired the
last edition of PT and ST reports CSP Today 2012a and CSP Today 2012b for which OPEX
costs were analysed
463 AETA 2012 OampM CSP costs report comparison
Operating and Maintenance expenses were provided in terms of fixed and variable costs in
the AETA 2012 report and this Model Update has modified these for 2013 for PT ST and LF
technologies based on the references cited above and further consideration of learning rates
for the CSP industry
Most CSP projects with commercial operational experience are parabolic trough technology
as it is the most mature technology and currently more is reported and known about actual
costs than other CSP technologies Nevada Solar One as an example is a 64MWe parabolic
trough plant based in California which was commissioned in 2007 and it is the first plant
built after the SEGS development during the 1980-90s also in California
Andasol 1 the 50 MWe parabolic trough plant based in Spain is also the first CSP plant
worldwide to implement a commercial thermal energy storage system with a capacity of 75
hours of full load storage It commenced operation at the end of 2008 and other similar and
larger trough projects are now operating or being constructed
As the most mature CSP technology trough plant should be further down the operational and
design operability maturity path and hence have a lower opportunity for OampM cost
reductions through learning By contrast Solar Tower and Linear Fresnel systems are only
beginning to be deployed at larger scale and hence there is expected to be more potential to
reduce their capital and operating costs and improve performance
Learning rates have been argued by stakeholders as being very significant for CSP plant with
comments of the AETA 2012 report centring on this issue Disappointingly there is no new
published evidence or actual plant report data that could be found by the AETA stakeholders
and WorleyParsons to add to that used for the 2012 report There is however new evidence
on the reduction in LCOE for CSP technologies and WorleyParsons linked OPEX
contribution to these LCOE predictions so that a sense of future reductions could be made
This is outlined further in the following Sections
45
4631 ASSUMPTIONS AND CONSIDERATIONS
FOM and VOM Breakdown
The following costs are included in proceeding FOM cost estimates for CSP technologies as
an annual cost per MW capacity
Insurance
Labour costs and
Fixed service maintenance contracts
Similarly the following costs are included in the VOM cost estimates as a cost rate per MWh
of sent out energy
Material and maintenance costs spare parts equipment maintenance and unscheduled
inspections and
Utilities costs water auxiliary fuel and auxiliary power when applicable
Some items such as spare parts for scheduled maintenance could be considered FOM costs
However to simplify the comparison and to homogenise all of the analyses across
technologies all concepts related to plant material and maintenance were included in the
VOM costs
4632 AETA 2012 OampM CSP COSTS COMPARISON REPORT
The technical characteristics of the reference CSP Plants used in the AETA 2012 report have
been extracted from the AETA Model Version 1_0 (BREE 2012) and are summarised in
Table 12
Table 12 AETA 2012 Reference Plant Technical Characteristics
Plant
Characteristics
Units Parabolic
Trough
without
Storage
Parabolic
Trough
with
Storage
Solar
Tower
without
Storage
Solar
Tower
with
Storage
Linear
Fresnel
without
Storage
Linear
Fresnel
with
Storage
Plant Net Capacity MW 138 135 122 18 230 225
Location NA Unknown Unknown Unknown Unknown Unknown Unknown
Isolation kWhm2year Unknown Unknown Unknown Unknown Unknown Unknown
Hours of TES h - 7 - 6 - 6
Capacity Factor per cent 23 42 31 42 23 42
Type of Cooling NA Unknown Unknown Unknown Unknown Unknown Unknown
FOM $MWyear 60000 65000 70000 60000 65000 65000
VOM $MWh sent out 15 20 15 15 15 20
Based on the information above this Model Update estimated the following parameters for
the CSP technologies evaluated in this study
46
Total net energy production in terms of MWh delivered per year
FOM and VOM in terms of USD per year and
Total OPEX costs in terms of USD per year and USD per total net energy production
per year
The results are listed in Table 13 below Table 13 AETA 2012 OampM Opex costs on a per kWh basis
Plant
Characteristics
Units Parabolic
Trough
without
Storage
Parabolic
Trough
with
Storage
Solar
Tower
without
Storage
Solar
Tower
with
Storage
Linear
Fresnel
without
Storage
Linear
Fresnel
with
Storage
Plant Net Capacity MW 138 135 122 18 230 225
Net Energy sent out MWhyear 2780424 496692 3313032 662256 463404 827820
FOM $year 8280000 8775000 8540000 1080000 14950000 14625000
VOM $year 4170636 9933840 4969548 993384 6951060 16556400
OPEX $year 12450636 18708840 13509548 2073384 21901060 31181400
OPEX $kWh 00448 00377 00408 00313 00473 00377
FOM per cent 6650 4690 6321 5209 6826 4690
VOM per cent 3350 5310 3679 4791 3174 5310
The percentages of FOM and VOM costs as part of the total OPEX costs are presented in
Figure 5
Figure 5 AETA 2012 FOM and VOM Percentages of Total OPEX Costs
47
In Figure 5 FOM costs are in general terms significantly higher than VOM costs because
they include the higher cost items such as insurance labour costs and fixed service contracts
However as shown in the Figure VOM costs are higher or approximately equal to FOM
costs for technologies with energy storage given the criteria selected for the breakdown
between FOM costs and VOM costs FOM costs will remain relatively consistent from year-
to-year while VOM costs should be broken down even further since the costs of water
natural gas (if required) and electricity vary between locations and from one year to another
Total OPEX costs are expressed in terms of USD per total net energy production per year and
are between 00313 and 00473 USDkWh as listed in Table 13 These values are aligned
with the values provided by international institutions cited although they appear to be
somewhat inflated in comparison with those values that are closer to 0025 and 0035
USDkWh as published by others (eg IRENA)
4633 AETA 2013 OampM COSTS UPDATE
Similar Plant characteristics to AETA 2012 were considered for the appropriate comparison
of OampM costs for this update Plant characteristics include location net capacity capacity
factor hours of TES and type of cooling For this Report the characteristics of the reference
plants used are described in Table 14
Table 14 PT and ST Reference Plant Characteristics
Plant
characteristics
Units Parabolic
Trough without
Storage
Parabolic
Trough with
Storage
Solar Tower
without
Storage
Solar Tower
with Storage
Plant Net Capacity MW 100 100 100 100
Location NA MENA region MENA region MENA region MENA region
Isolation kWhm2year 2400 2400 2400 2400
Hours of TES h 0 6 0 6
Capacity Factor per cent 26 46 275 476
Type of Cooling NA Dry Dry Dry Dry
Source NA WorleyParsons CSP Today 2012a WorleyParsons CSP Today 2012b
The 2013 OampM costs were estimated using as a basis the information provided in the CSP
2012 reports (CSP 2012a and 2012 b) The following considerations were taken into account
the CSP Today reports only consider PT and ST plants with thermal storage
WorleyParsons made the following estimates based on experience with solar and
conventional power plants based on PT and ST technologies without TES
estimated the capacity factor based on plant capacity location and type of cooling
adjusted the insurance material and maintenance and labour costs based on the
solar field reduction factor when applicable
adjusted the steam turbine maintenance based on the potential hours of operation
48
adjusted the plant electricity and water consumption based on the total net
production
assumed similar auxiliary fuel consumption for the plant with and without TES This
assumption is due to the reference plants being based in the same location thus
requiring similar auxiliary fuel consumption for start-up Minimal differences in
auxiliary fuel consumption for freeze protection due to increased time offline for a
plant without TES system compared to a plant with TES are expected but not
considered in this Report as the impact would be minor
the capacity factor provided by CSP Today for PT with thermal storage is considered
high Based on the plant location and capacity WorleyParsons would anticipate the
capacity factor to be closer to 42 per cent instead of 46 per cent as indicated in Table
14 above This difference in capacity factor directly impacts the estimated VOM cost
which is correlated with plant production For comparison purposes the value provided
by CSP Today has maintained and
with respect to Linear Fresnel technology updated information has not been published
since the AETA 2012 report release by the references listed in Section 462 which
WorleyParsons consulted For the purpose of updating the estimates to 2013 it was
assumed that the evolution of the OampM costs would be similar to that of parabolic
trough plants and the same escalation factors were applied
The resulting 2013 and 2012 OampM costs are listed in Table 15 below for comparison
Table 15 2013 CSP OampM Costs Compared to 2012 OampM Costs
CSP Technology OampM Costs AETA 2012 WorleyParsons 2013 update
Parabolic Trough
without Storage
FOM $MWyear 60000 59176
VOM $MWh sent out 1500 1519
OPEX $kWh 00448 00412
Parabolic Trough with
Storage
FOM $MWyear 65000 72381
VOM $MWh sent out 2000 1139
OPEX $kWh 00377 00293
Solar Tower without
Storage
FOM $MWyear 70000 58285
VOM $MWh sent out 1500 707
OPEX $kWh 00408 00313
Solar Tower with
Storage
FOM $MWyear 60000 71372
VOM $MWh sent out 1500 565
OPEX $kWh 00313 00228
Linear Fresnel without
Storage
FOM $MWyear 65000 64107
VOM $MWh sent out 1500 1519
OPEX $kWh 00473 00434
49
CSP Technology OampM Costs AETA 2012 WorleyParsons 2013 update
Linear Fresnel with
Storage
FOM $MWyear 65000 72381
VOM $MWh sent out 2000 1139
OPEX $kWh 00377 00293
The total OPEX costs per year from the AETA 2012 report and the WorleyParsonsrsquo estimates
that were updated for 2013 are compared in Figure 6 below
Figure 6 Comparison of OPEX Costs per Total Annual Plant Production per Year AETA 2012
Report and 2013 Update
Reductions of approximately 20 - 27 per cent in OampM costs would be realised by CSP with
TES according to the updated 2013 WorleyParsons estimates compared to the same costs
reported in the AETA 2012 report However reductions for PT and LF without TES were
found to be lower at approximately 8 per cent
The IRENA reports (IRENA 2013b IRENA 2013c) provide values for OPEX between 0025
and 0035 USDkWh for PT and ST technologies with and without TES Values updated to
2013 by WorleyParsons are between 0023 and 00412 USDkWh for PT and ST
technologies which align with the IRENA values However IRENA does not differentiate
between the utilisation of TES Solar technologies without TES have fewer hours of
production and although OPEX costs are lower in terms of USDMW compared with solar
technologies with TES OPEX costs in terms of costs per total annual plant production per
year will typically be higher for technologies that do not use TES
4634 OampM CSP LEARNING RATES
Cost reductions on CSP technologies are expected to come from the following main actions
economies of scale in the plant size and manufacturing industry
learning impacts on design construction and operation phases
50
advances in RampD of the following factors
Components Solar receivers mirrors HTF storage media supporting structures
trackers and auxiliary systems
Systems Direct steam generation storage systems or hybrid cooling systems
Configurations Hybridisation or duel electricity water plants
a more competitive supply chain
improvements in the performance of the solar field solar-to-electric efficiency and
thermal energy storage systems
increases in the life of plants and
reduced financial costs
Based on the parameters listed above the LCOE from Solar Thermal technologies is likely to
be continuously decreasing and this is born out in the literature that has been reviewed Based
on the IRENA 2013b report the evolution of the LCOE from trough and power tower CSP
technologies shows how the LCOE is decreasing as technology development increases in
Table 16 below Estimates for LCOE for the hypothetical trough and tower CSP plants in
2014 are also included
51
Table 16 Estimated LCOE form Existing and Hypothetical Trough and Solar Tower CSP Technologies
CSP
Technology
Year Capacity
(MW)
Plant Name Location DNI
(kWhm2year)
LCOE 2012
$kWh Installed
Trough
1981 05 PSA Spain 2000 064
1983 138 SEGS I California 2700 039
1989 30 SEGS II ndash VIII California 2700 026
1992 80 SEGS VIII amp IX California 2700 020
2008 - 2009 50 Andasol 1 2 Spain 2000 035
2010 50 Solnova 1 amp 3 Spain 2000 034
2010 - 2011 50 Extresol 1 amp 2 Spain 2000 035
2014 250 Unspecified (wet
cooling no storage)
Not provided Not provided 020
Tower
1987 10 Solar One California 2700 058
2007 11 PS10 Spain 2000 034
2009 20 PS20 Spain 2000 036
2011 199 Gemasolar (wet
cooling 15hr
storage)
Spain 2000 033
2014 120 Unspecified
(dry cooling
storage)
Not Provided Not provided 015
International Institutions such as IRENA ESTELA or the World Bank agree that the LCOE
and capital cost reductions of 28 per cent to 60 per cent are envisioned by 2020 ndash 2025 for
such plant Estimates of possible LCOE reductions for CSP technology from 2012 to 2025
are provided in Figure 7 taken from Kearny (2010)
52
Figure 7 Expected LCOE Reductions for CSP Technology from 2012 to 2025
Source (Kearny 2010)
The OampM maintenance costs of modern CSP Plants are lower than those for Californian
SEGS Plants built in the 1980s and 1990s which has a total combined capacity of 354 MW
and estimated OampM costs of USD 004kWh (IRENA 2013b) However CSP experienced no
growth from early 1990s until the mid-2000s as can be seen in Table 16 above
As stated at the beginning of Section 462 Andasol 1 was the first 50 MWe parabolic trough
plant built after SEGS which included a thermal energy storage system It commenced
operation at the end of 2008 Podewils (2008) estimated Andasol 1 OampM costs of EUR
0072kWh or USD 0095kWh (considering 2012 medium rate exchange EURUSD of
07553) This value is high compared to OPEX estimations for PT with TES provided by
both this 2013 update and the AETA 2012 report (00293 and 00377 USDkWh
respectively) Therefore according to the information detailed above considerable learning
improvements to OampM costs have been already achieved from the commencement of
operation of Andasol 1 to the time of this Report
`WorleyParsonsrsquo estimations on the LCOE of parabolic trough plants is in the range of
USD 020kWh to USD 035kWh and that of solar towers between USD 017kWh and
USD 029kWh However in areas with excellent solar resources the range could be as low
as USD 014kWh to USD 018kWh
The following considerations have been taken into account for OampM cost learning rates
forecast
WorleyParsons LCOE estimations as set out above
Potential average envisaged LCOE reductions of 475 per cent by 2025 based on Figure
7 above
OPEX contribution on LCOE of 20 per cent and
53
assuming that all components involved in the LCOE (CAPEX OPEX and financial
expenses) reduce at the same rate so percentage contributions remain constant
According to these considerations WorleyParsons estimates that OPEX values by 2025 could
reach from 0021 to 0037 USDkWh for PT technology and from 0018 to 0031 USDkWh
for ST technology
Technological improvements have reduced the requirement of replacing mirrors and
receivers Automation has reduced the cost of other OampM procedures by as much 30 per
cent As a result of OampM procedure improvements (both cost and plant performance) the
total OampM costs of CSP plants in the long-term are likely to be below USD 0025kWh
(IRENA 2013b)
Parabolic trough system in the United States would have OampM costs of around USD 002 to
USD 003kWh meanwhile the OampM costs of parabolic trough and solar tower power plants
currently under construction in South Africa have estimated OampM costs of between USD
0029 and USD 0036kWh (also IRENA 2013b)
WorleyParsons estimations are in alignment with IRENA estimations in terms of current and
envisaged CSP OPEX costs
4635 CONCLUSIONS ndash CSP
The following main conclusions were made based on this study in relation to CSP
technologies
the 2013 WorleyParsons CSP OampM costs update resulted in values between 0023 and
0043 USDkWh based on 2012 USD
reductions in CSP OampM costs between 8 per cent and 27 per cent were obtained in
comparison to values provide in AETA 2012 report
the total OampM costs of CSP Plants in the long-term are likely to be below USD
0025kWh
the updated values for 2013 by WorleyParsons are in alignment with the values
provided by recognised international institutions and
at the time of this report the only CSP technology with substantial operation capacity
was PT Only three utility-scale ST plants were in operation at the time of this report
(PS-10 PS-20 and Gemasolar) of which only one (Gemasolar) uses TES Though
several process steam and small-scale LFR Plants are currently in operation only one
utility-scale LFR (Puerto Erradio 2) was in operation at the time of this report
47 AETA 2013 OampM Learning Rate recommendation
The learning rate used in AETA 2012 for OampM is applied to all technologies assessed and
includes fossil fuel technologies and emerging technologies The learning rate is set at an
improvement of 02 per cent per annum
In addition to the improvement rate OampM is escalated at a rate of 150 per cent of CPI per
year based on experience with increases in parts and labour costs
The CPI rate set in the model is 25 per cent per annum
54
OampM cost information in the public domain in both quantum and quality is poor for
contemporary data Information supporting OampM learning rates is equally poor There are
indications that emerging technologies do have the potential for increased OampM learning
rates relative to mature technologies
For the renewable energy technologies studied in this report onshore wind is considered
mature and it is recommended that the AETA 2012 report value of 02 per cent is maintained
For all other renewable energy technologies studied in this report a more aggressive learning
rate of 25 per cent is recommended This will effectively cancel out the CPI escalation
adjustment and provide a ldquoflat linerdquo OampM rate for future years This will provide a value in
line with the learning rate conclusions for PV
The learning rate for CSP is considered to have greater potential for reduction but due to the
high level of analysis in this report (and therefore uncertainty) it is proposed that a maximum
of two learning rates is appropriate for the AETA model
Table 17 AETA Learning Rate Comparison
AETA 2012 Learning Rate AETA 2013 update Learning Rate
Onshore Wind 02 per cent 02 per cent
Offshore Wind
PV ndash all technologies
CSP ndash all technologies
02 per cent 25 per cent
55
5 CHANGES TO THE LCOE
Changes to the model parameters described in the earlier sections have resulted in changes to
the LCOE estimates for a number of technologies The LCOE estimate values for all
technologies and associated range of uncertainty are shown in the Figures 8 to 13 below
Note that the values listed are for a base value carbon price modifier of zero per cent which
places no value on carbon emissions
For selected technologies where there are significant cost differences Figure 14 provides a
comparison of mid-range LCOE values for the AETA 2013 and AETA 2012 Models Key
features of the Figures 8 to 14 are as follows
both in AETA 2012 and 2013 Model update LCOE costs are provided for the years
2012 2020 2025 2030 2040 and 2050
cost ranges are provided for each technology that accounts for differences in fuel prices
and state-based variations
LCOE costs vary substantially across the technologies from $89MWh (combined cycle
gas turbine) to $351MWh (solar thermal linear fresnel) in 2012 and $73MWh (PV
non-tracking) to $247MWh (IGCC black coal CCS) in 2050
the inter-technology LCOE comparisons figures (Figures 8 to 13) reveal changes in
relative costs of technologies over time Key results include renewable technologies
have higher LCOEs than the lowest cost non-renewable technologies and the relative
LCOE rankings significantly change post 2030 The LCOE of solar PV become lower
than the non-renewables from mid 2030 onwards and
large changes in LCOE results between AETA 2013 Update and AETA 2012 are
depicted in Figures14 below Figure 14 compares LCOEs at 2050 between the AETA
2013 Update and AETA 2012 for a selected number of technologies that have changed
significantly for NSW (AETA developed LCOEs by each Australian state) Differences
in technology LCOEs are explained by a multiplicity of factors including the technical
developments OampM costs and learning rate changes
56
Figure 8 Updated LCOEs for AETA 2013 Model technologies values for 2012 (NSW) with carbon price set to zero
0
50
100
150
200
250
300
350
400
450
500
LCO
E ($
MW
h)
LCOE FOR 2012 TECHNOLOGIES (NSW) Note Default region is NSW except bown coal
technologies (VIC) and SWIS scale (as specified)
LCOE includes where relevant allowance for- Carbon Price- CO2 transport and sequestration cost- Plant capital cost (EPC basis) within battery limits- Owners costs excluding interest during construction- Fixed and variable operating costs- Fuel costs- Economic escalation factors
57
Figure 9 Updated LCOEs for AETA 2013 Model technologies values for 2020 (NSW) with carbon price set to zero
0
50
100
150
200
250
300
350
400
450
LCO
E ($
MW
h)
LCOE FOR 2020 TECHNOLOGIES (NSW) Note Default region is NSW except bown coal
technologies (VIC) and SWIS scale (as specified)
LCOE includes where relevant allowance for- Carbon Price- CO2 transport and sequestration cost- Plant capital cost (EPC basis) within battery limits- Owners costs excluding interest during construction- Fixed and variable operating costs- Fuel costs- Economic escalation factors
58
Figure 10 Updated LCOEs for AETA 2013 Model technologies values for 2025 (NSW) with carbon price set to zero
0
50
100
150
200
250
300
350
400
LCO
E ($
MW
h)
LCOE FOR 2025 TECHNOLOGIES (NSW) Note Default region is NSW except bown coal
technologies (VIC) and SWIS scale (as specified)
LCOE includes where relevant allowance for- Carbon Price- CO2 transport and sequestration cost- Plant capital cost (EPC basis) within battery limits- Owners costs excluding interest during construction- Fixed and variable operating costs- Fuel costs- Economic escalation factors
59
Figure 11 Updated LCOEs for AETA 2013 Model technologies values for 2030 (NSW) with carbon price set to zero
0
50
100
150
200
250
300
350
400
LCO
E ($
MW
h)
LCOE FOR 2030 TECHNOLOGIES (NSW) Note Default region is NSW except bown coal
technologies (VIC) and SWIS scale (as specified)
LCOE includes where relevant allowance for- Carbon Price- CO2 transport and sequestration cost- Plant capital cost (EPC basis) within battery limits- Owners costs excluding interest during construction- Fixed and variable operating costs- Fuel costs- Economic escalation factors
60
Figure 12 Updated LCOEs for AETA 2013 Model technologies values for 2040 (NSW) with carbon price set to zero
0
50
100
150
200
250
300
350
400
LCO
E ($
MW
h)
LCOE FOR 2040 TECHNOLOGIES (NSW) Note Default region is NSW except bown coal
technologies (VIC) and SWIS scale (as specified)
LCOE includes where relevant allowance for- Carbon Price- CO2 transport and sequestration cost- Plant capital cost (EPC basis) within battery limits- Owners costs excluding interest during construction- Fixed and variable operating costs- Fuel costs- Economic escalation factors
61
Figure 13 Updated LCOEs for AETA 2013 Model technologies values for 2050 (NSW) with carbon price set to zero
0
50
100
150
200
250
300
350
400
LCO
E ($
MW
h)
LCOE FOR 2050 TECHNOLOGIES (NSW)
LCOE includes where relevant allowance for- Carbon Price- CO2 transport and sequestration cost- Plant capital cost (EPC basis) within battery limits- Owners costs excluding interest during construction- Fixed and variable operating costs- Fuel costs- Economic escalation factors
Note Default region is NSW except bown coal
technologies (VIC) and SWIS scale (as specified)
62
Figure 14 Comparison of AETA 2013 Model and AETA 2012 Model LCOE estimates selected technologies 2050
0
50
100
150
200
250
AETA 2012
AETA 2013
63
51 Conclusions
The Australian Energy Technology Assessment (AETA 2012) provided the best available and most up-to-
date cost estimates for 40 electricity generation technologies under Australian conditions To ensure that
the cost estimates for the various technologies are consistent all common input costs (eg labour
materials components carbon price) were itemised To ensure that the AETA costings remain up to date
AETA costs are reviewed in this AETA 2013 Model Update report
The AETA 2013 refresh was developed in close consultation with a stakeholder reference group drawn
from industry and researchacademic organisations with interests and expertise in a diverse range of
electricity generation technologies
The AETA 2013 Model results reflect the change to exclude the value of a carbon price in the Levelised
Cost of Energy (LCOE) All technologies have experienced a minor reduction in LCOE relative to 2012
(offset in some cases by other factors) due to the change to an amortisation period of 30 years plus the
construction period
Comparing the 2012 AETA results without a carbon price to the 2013 results without a carbon price there
are significant reductions in the LCOE of solar technologies and onshore wind This is as a consequence of
changes to the fixed and variable Operations and Maintenance (OampM) costs for these technologies For the
solar technologies the adjustment of the capital learning rate to 25 per cent has also contributed to the
LCOE reduction Offshore wind also has an increased learning rate but this has been offset to a large extent
by increased variable OampM costs
Nuclear LCOE has increased significantly due to higher estimates for capital costs
Efficiency for coal fired plants with CCS retrofits has been revised downwards to better reflect the expected
efficiency of these plants and has the effect of increasing the LCOE
64
REFERENCES
Albers A 2009 OampM Cost Modeling Technical Losses and Associated Uncertainties Proceedings of the
2009 European Wind Energy Conference Marseilles France March
AWEA (American Wind Energy Association) 2013 AWEA US Wind Industry Annual Report ndash Year
Ending 2012 USA
BNEF (Bloomberg New Energy Finance) 2013 Operations and Maintenance (OampM) Price Index Issue II
Wind Research Note April
BREE (Bureau of Resources and Energy Economics) 2012 AETA Report and Model Version 1_0 2012
Australian httpwwwbreegovau
CEC (Clean Energy Council) 2013 Australian Energy Technology Assessment 2013 Review Letter to
BREE of 20 May 2013 from the Clean Energy Council (Mr Russel Marsh signatory for the CEC)
CEC (Clean Energy Council) 2013 Clean Energy Council Renewable Energy Map Australia June (data
noted as current as of 21 August 2012)
httpwwwcleanenergycouncilorgauresourcecentreplantregistermaphtml
Crown Estate 2012 Offshore Wind Cost Reduction Pathways Study United Kingdom May
CSP 2012a CSP Parabolic Trough Report Cost Performance and Key Trends CSP Today
CSP 2012b CSP Solar Tower Report Cost Performance and Key Trends CSP Today
Deloitte amp Touche 2012 European Wind Services Study Find Out Which Way the Wind Blows Deloitte amp
Touche GmbH Wirtschaftspruumlfungsgesellschaft August
Deloitte 2011 Economics of wind development in New Zealand Deloitte for the for the New Zealand Wind
Energy Association
Ebert P amp Ware J 2013 The Role of Independents in the Wind Farm Operations amp Maintenance
Proceedings of the 2013 New Zealand Wind Energy Conference and Exhibition March
EPRI (Electric Power Research Institute) 2010 Engineering and Economic Evaluation of Central-Station
Solar Photovoltaic Power Plants USA March
GlobalData 2012 Wind Operations amp Maintenance (OampM) Market ndash Global Market Size Share by
Component Competitive Landscape and Key Country Analysis to 2020 GlobalData reference code
GDAE1054MAR January
Hand M 2013 Wind Plant Cost of Energy Proceedings of the 2nd NREL Wind Energy System
Engineering Workshop January
Hassan G 2011 Review of the Australian Wind Energy Industry Clean Energy Council Australia 2011
Houston C 2013 The Real Truth About Wind Farm OampM Costs North American WindPower March
IEA (International Energy Agency) 2008 Technology Roadmap Solar photovoltaic energy France
httpwwwieaorgpublicationsfreepublicationspublicationpv_roadmappdf
IRENA (International Renewable Energy Agency) 2013a Solar Photovoltaics Technology Brief Germany
January httpwwwirenaorgDocumentDownloadsPublicationsIRENA-ETSAPper
cent20Techper cent 20Briefper cent20E11per cent20Solarper cent20PVpdf
65
IRENA (International Renewable Energy Agency) 2013b Concentrating Solar Power Technology Brief
Germany January
IRENA (International Renewable Energy Agency) 2013c Renewable Power Generation Costs in 2012 An
Overview Germany
IT Power 2013 Analysis of the AETA 2012 cost estimates of CSP technologies Clean Energy Council
submission to the Bureau of Resources and Energy Economics May
Kann S 2012 US Solar Market Insight Report Q3 California USA
Kearny A 2010 Solar Thermal Electricity 2025 ndash clean electricity on demand attractive STE costs
stabilize energy production ATKearny consultants Dusseldorf Germany
Muirhead J 2013 SEGS experience suggests that CSP will age gracefully CSP Today South Africa
httpsocialcsptodaycommarketssegs-experience-suggests-csp-will-age-
gracefullysthash6VkxFaD0dpuf
NREL (National Renewable Energy Laboratories) 2011 IEA Wind Task 26 ndash Multi-national Case Study of
the Financial Cost of Wind Energy Technical Report NRELTP-6A2-48-48155 March
NREL (National Renewable Energy Laboratories) 2012 Cost and Performance Data for Power Generation
Technologies USA February
NREL (National Renewable Energy Laboratories) 2013 Breakeven Prices for Photovoltaics on
Supermarkets in the United States March httpwwwnrelgovdocsfy13osti57276pdf
NREL (National Renewable Energy Laboratories) 2013 Breakeven Prices for Photovoltaics on
Supermarkets in the United States USA March httpwwwnrelgovdocsfy13osti57276pdf
Photon 2012 The True Cost of Solar Power 2012 Temple of Doom Solar Power in Focus Series Photon
Consulting
Photon 2013 Solar Annual 2013 Build Your Empire Photon Consulting
Podewils C 2008 Photovoltaic vs Solar Thermal where PV has the upper hand and where solar thermal
strikes back Photon International Germany November
Poore R and Walford C 2008 Development of an Operations and Maintenance Cost Model to Identify
Cost of Energy Savings for Low Wind Speed Turbines Report NRELSR-500-40581 National
Renewable Energy Laboratory January
RolandBerger 2013 Offshore Wind Towards 2020 On the Pathway to Cost Competitiveness RolandBerger
Consultants Germany April
See wwwcsptodaycom
See wwwepiaorg
See wwwestelasolarde
See wwwidaees
See wwwieaorg
See wwwirenaorg
See wwwnrelgov
See wwwprotermosolares
66
See wwwrenoveteces
See wwwseiaorgau
See wwwsolarelectricpowerorg
See wwwworldbankorg
UK Crown Estate 2012 Offshore Wind Cost reduction Study May
US DoE (Department of Energy) 2013 Award Number DE-EE0005360 USA February
Wiser R Lantz E Bolinger M amp Hand M 2012 Recent Developments in the Levelized Cost of Energy
from US Wind Power Projects Contract No DE-AC02-05CH11231 National Renewable Energy
Laboratories February
67
Appendix A
Electricity Generation Technologies in AETA 2012 Report and Model
The 40 AETA electricity generation technologies are
1 Integrated Gasification and Combined Cycle (IGCC) plant based on brown coal
2 IGCC plant with Carbon Capture and Sequestration (CCS) based on brown coal
3 IGCC plant based on bituminous coal
4 IGCC plant with CCS based on bituminous coal
5 Direct injection coal engine (clean lignite eg brown coal technology)
6 Pulverised coal supercritical plant based on brown coal
7 Pulverised coal supercritical plant with post combustion CCS based on brown coal
8 Pulverised coal subcritical plant with post combustion CCS based on brown coal (retrofit)
9 Pulverised coal supercritical plant based on bituminous coal
10 Pulverised coal supercritical plant based on bituminous coal - SWIS relevant scale
11 Pulverised coal supercritical plant with CCS based on bituminous coal
12 Pulverised coal subcritical plant with post combustion CCS based on bituminous coal (retrofit)
13 Adding CCS to existing Combined Cycle Gas Turbine (CCGT) power plants (retrofitting)
14 Oxy combustion pulverised coal supercritical plant based on bituminous coal
15 Oxy combustion pulverised coal supercritical plant with CCS based on bituminous coal
16 Combined cycle plant burning natural gas
17 Combined cycle plant burning natural gas - SWIS relevant scale
18 Combined cycle plant with post combustion CCS
19 Open cycle plant burning natural gas
20 Solar thermal plant using compact linear fresnal reflector technology wo storage
21 Solar thermal plant using parabolic trough technology wo storage
22 Solar thermal plant using parabolic trough technology with storage
23 Solar thermal plant using compact linear fresnal reflector technology with storage
24 Solar thermal plant using central receiver technology wo storage
25 Solar thermal plant using central receiver technology with storage
26 Solar photovoltaic (PV) - non-tracking
27 Solar photovoltaic (PV) - single axis tracking
28 Solar photovoltaic (PV) - dual axis tracking
29 Wind (on-shore)
30 Wind (off-shore)
31 WaveOcean
68
32 Geothermal - hot sedimentary aquifer (HSA)
33 Geothermal - enhances geothermal system (EGS)
34 Landfill gas power plant
35 Sugar cane waste power plant
36 Other biomass waste power plant (eg wood)
37 Nuclear Gen 3+
38 Nuclear Small Modular Reactors (SMR)
39 Solarcoal hybrid
40 Integrated solar combined cycle (ISCS) ndash parabolic trough with combined cycle gas
69
Appendix B
Consultations with Stakeholders
This study has been undertaken in close consultation with a Stakeholder Reference Group drawn from
Australian industry and domestic as well as overseas researchacademic organisations with interests and
expertise in a diverse range of electricity generation technologies These stakeholders were invited to
provide evidence of the latest estimates for the costs and performance of various technologies
In addition the AETA project also had a Project Steering Committee comprising staff from BREE
AEMO CSIRO and other independent experts to provide technical advice and support The following
agencies participated in the stakeholder reference group meetings or were forwarded the documents
presented at the meetings
AETA Stakeholder Reference Group
Australian Coal Association
Australian Energy Market Operator
Australian Geothermal Energy Association
Australian National Low Emissions Coal RampD
Australian National University
Australian Renewable Energy Agency
Australian Solar Thermal Energy Association
Australian Sugar Milling Council
Australian Treasury
Bureau of Resources and Energy Economics
Clean Energy Council
CSIRO
Department of Industry
Economic Research Institute for ASEAN and East Asia
Energy Retailers Association of Australia
Energy Users Association of Australia
Evans and Peck
Ferrostaal
Global CCS Institute
Grid Australia
Intergen
International Energy Agency France
International Power Suez
IRENA Innovation and Technology Centre Germany
70
National Generators Forum
Oceanlinx Limited
Origin Energy
Private Generators Group
The Institute of Energy Economics Japan
The Energy Research Institute New Delhi
University of Melbourne Energy Institute
University of Queensland Energy Initiative
UQ Energy Economics amp Management Group
Wyldgroup
WorleyParsons
Two AETA Stakeholders Reference Group meetings took place on 30 April 2013 and 17 July 2013 In
addition the AETA Project Steering Committee met on 24 June 2013
71
BREE contacts Executive Director BREE Bruce Wilson brucewilsonretgovau
(02) 6243 7901
Deputy Executive Director Wayne Calder waynecalderbreegovau
(02) 6243 7718
Modelling amp Policy Integration Arif Syed arifsyedbreegovau
Program Leader (02) 6243 7504
Data Statistics Geoff Armitage geoffarmitagebreegovau
Program Leader (02) 6243 7510
Energy and Quantitative Analysis Allison Ball allisonballbreegovau
Program Leader (02) 6243 7539
Resources ndash Program Leader John Barber johnbarberbreegovau
(02) 6243 7988
72

7
TABLE OF FIGURES
Figure 1 - Effect of country variables on LCOE of wind plant 31
Figure 2 - Typical cost increasing trends in wind farm OampM costs with commercial
operations date 32
Figure 3 - Trends in offshore wind farms and estimated impact on LCOE 33
Figure 4 - OampM Costs (per MW) and Technician Numbers (per 100MW) for total wind
turbine OampM (Opex) 34
Figure 5 - AETA 2012 FOM and VOM Percentages of Total OPEX Costs 46
Figure 6 - Comparison of OPEX Costs per Total Annual Plant Production per Year
AETA 2012 Report and 2013 Update 49
Figure 7 - Expected LCOE Reductions for CSP Technology from 2012 to 2025 52
Figure 8 Updated LCOEs for AETA 2013 Model technologies values for 2012 (NSW) with
carbon price set to zero 56
Figure 9 Updated LCOEs for AETA 2013 Model technologies values for 2020 (NSW) with
carbon price set to zero 57
Figure 10 Updated LCOEs for AETA 2013 Model technologies values for 2025 (NSW) with
carbon price set to zero 58
Figure 11 Updated LCOEs for AETA 2013 Model technologies values for 2030 (NSW) with
carbon price set to zero 59
Figure 12 Updated LCOEs for AETA 2013 Model technologies values for 2040 (NSW) with
carbon price set to zero 60
Figure 13 Updated LCOEs for AETA 2013 Model technologies values for 2050 (NSW) with
carbon price set to zero 61
Figure 14 Comparison of AETA 2013 Model Update and AETA 2012 LCOE estimates
selected technologies 62
8
ACRONYMSABBREVIATIONS
AETA Australian Energy Technology Assessment
BREE Bureau of Resources and Energy Economics
CAPEX Total capital expenditures
CSP Concentrating Solar Power Technologies
DAT Dual axis tracking
EPIA European Photovoltaic Industry Association
EPRI Electric Power Research Institute
ESTELA European Solar Thermal Electricity Association
FOM Fixed operation and maintenance costs
FT Fixed Tilt
h Hours
IDEA Institute for Energy Diversification and Saving
IEA International Energy Agency
IRENA International Renewable Energy Agency
kW Kilowatts
kWh Kilowatt hours
LCOE Levelised Cost of Energy
LF Lineal Fresnel Reflector CSP Technology
m2 Square Meters
MENA Middle East and North Africa region
MW Megawatts
MWh Megawatt hours
MWe Megawatt hours electric
NREL National Renewable Energy Laboratory
OampM Operation and maintenance
OEM Original Equipment Manufacturer
OPEX Total operating expenditures
PT Parabolic Trough CSP Technology
PV Photovoltaic
RampD Research and Development
SAT Single axis tracking
SEGS Solar Electricity Generating System
SEIA Solar Energy Industries Association
SEPA Solar Electric Power Association
ST Solar Tower CSP Technology
TES Thermal Energy Storage System
USD United States Dollar
VOM Variable operation and maintenance costs
WB The World Bank organization
9
GLOSSARY
Amortisation Period the period over which a plant must achieve its economic return
Auxiliary Load the internal or parasitic load from the electricity required to sustain the
operation of a plant
Capacity Factor the ratio of the actual output of a power plant over a period of time and its
potential output if it had operated at full nameplate capacity the entire time
Capital Cost the cost of delivery of a plant not including the cost of finance
Discount Rate the rate at which future values are discounted or converted to a present
value
First-of-a-Kind Plant cost costs necessary to put a first commercial plant in place and that
will not be incurred for subsequent plants Design and certification costs are examples of
such costs
First Year Available for Construction the year in which the technology will be available
for commercial deployment globally
Gross Capacity maximum or rated generation from a power plant without losses and
auxiliary loads taken into account
International Equipment Cost the cost for internationally sourced equipment associated
with the project
Labour Cost the component of the delivery cost for a plant associated with local
(Australian) labour
Lead time for Development the time taken from inception to financial close This includes
permitting approvals and engineering design
Levelised Cost of Energy the minimum cost of energy at which a generator must sell the
produced electricity in order to achieve its desired economic return
Local Equipment Cost the cost of locally sourced (Australia) plant and equipment for the
project
Net Capacity the export capacity of a generation plant ndash ie the Gross Capacity less the
losses and auxiliary loads of the plant
Nth-of-a-kind plant cost all engineering equipment construction testing tooling project
management and other costs that are repetitive in nature and would be incurred if a plant
identical to a FOAK plant were built The NOAK plant is the nth-of-a-kind or equilibrium
commercial plant of identical design to the FOAK plant
Sequestration the process of transport and storage of Carbon Dioxide (CO2)
Thermal Efficiency the ratio between the useful energy output of a generator and inputs
10
EXECUTIVE SUMMARY
This Report provides electricity generation technology cost parameters as an update to those
presented in the Australian Energy Technology Assessment (AETA) Report and Model
published in July 2012 This update takes into account a range of new material reported in the
public and private domain further discussions with asset owners and technology developers
and input from key experts in relation to these costs
The AETA 2012 Model estimated levelised costs of energy (LCOE) for a set of 40 market
ready and prospective electricity generation technologies LCOE can be interpreted as the
long-run marginal cost of electricity generation These were estimated by breaking down
the cost drivers for a technology into its key constituent parts such as capital cost fixed and
variable lsquooperations and maintenancersquo (OampM) costs and where applicable fuel costs and
CO2 storage costs While the LCOEs included carbon costs project specific regulatory or
system based costs were not included although clearly these may have a significant impact
on the delivered price of electricity
The AETA 2013 Model update generally follows the same approach although comparable
LCOE results are presented without carbon costs reflecting the Governmentrsquos intention to
repeal carbon pricing To the extent that alternative emissions reduction measures impact on
the electricity generation sector this may have different implications for fossil fuel andor
renewable based technologies
For these reasons some caution should be applied when interpreting LCOE estimates These
estimates best illustrate potential and relative ldquooff-the-shelfrdquo cost competitiveness rather than
a firm predictor of market outcomes or the commercial viability of individual projects
The key features of the LCOE cost parameters in the AETA 2013 Model update with respect
to the AETA 2012 Model can be summarised as follows
renewable technologies have generally higher LCOEs than the lowest cost non-
renewable technologies and the relative LCOE rankings significantly change post
2030 The LCOE of solar PV becomes lower than the non-renewables from mid-
2030 onwards
however wind based generation is estimated to already have a lower LCOE than
many new build comparable fossil-fuel generation technologies
LCOE costs vary substantially across the technologies from $89MWh (combined
cycle gas turbine) to $351MWh (solar thermal Linear Fresnel) in 2012 and
$73MWh (PV non-tracking) to $247MWh (IGCC black coal CCS) in 2050
changes are made to nuclear capital costs and nuclear technology plantrsquos lsquofirst year of
constructionrsquo carbon capture and storage (CCS) retrofit thermal efficiency and
amortisation period for various technologies to include construction period
a reduction in onshore wind OampM costs of 18 per cent
11
a reduction in offshore wind fixed OampM costs and a three-fold increase in offshore
wind variable OampM costs resulting in an overall increase of 50 per cent total OampM
costs
fixed tilt PV configurations have not seen significant changes in OampM costs
single axis tracking and dual axis tracking PV configurations are approximately 20-30
per cent reduced based on a better understanding of the associated OampM costs
concentrating solar power (solar thermal) OampM cost reduced between 8 per cent and 27
per cent and
the OampM learning rate for offshore wind and all solar technologies are increased from
02 to 25 per cent
The overall impact of parameter changes by technology is given in the AETA 2013 Model
and in this report As in the AETA 2012 the 2013 Model update provides technology
LCOEs for the years 2012 2020 2025 2030 2040 and 2050
12
1 INTRODUCTION
The Australian Energy Technology Assessment (AETA) 2012 report published in July 2012
by the Bureau of Resources and Energy Economics (BREE 2012) undertook costing of 40
electricity generation technologies This report made a provision that due to the fast changing
technology cost environment cost and performance parameters assessed in the AETA 2012
model may be updated every year In addition a full report and lsquobottom uprsquo study will be
undertaken biennially with the next report to be released in 2014
The next fully updated AETA report is scheduled for completion in 2014 To ensure that cost
estimates for electricity generation technologies are current and take into consideration the latest
developments parameter estimates for the 40 technologies will be updated where appropriate
every six months in a manner consistent with the methods outlined in this report and in consultation
with the stakeholder reference group (BREE 2012 p 24)
The purpose of this AETA 2013 Model Update report is to present findings arising from a
review of specific technologies by BREE This review was assisted by comments made by
the AETA Project Steering Committee (PSC) members and AETA Stakeholders Reference
Group (SRG) WorleyParsons was commissioned to review cost parameters for the
technologies considered in the AETA 2012 model Given the fast changing nature of solar
and wind technology operating costs especial emphasis was placed on reviewing OampM costs
for wind and solar technologies Changes to the model for the 2013 update are discussed in
the following sections
11 Background to the AETA 2012 report
BREE engaged WorleyParsons in 2011-12 to develop cost estimates for 40 electricity
generation technologies under Australian conditions for AETA 2012 The AETA cost
estimates were developed with the active collaboration of the Australian Energy Market
Operator (AEMO) which utilised the AETA cost estimates for its National Transmission
Network Development Plan (NTNDP) In addition the Commonwealth Scientific and
Industrial Research Organisation (CSIRO) provided technical advice as part of the AETA
project steering committee The AETA 2012 provided technology costs for the years 2012
2020 2025 2030 2040 and 2050 These technologies encompass a diverse range of
energy sources including renewable energy (such as wind solar geothermal biomass and
wave power) fossil fuels (such as coal and gas) and nuclear power (Appendix A) Since its
publication in July 2012 more than 1000 requests have been made from BREE for the
AETA 2012 cost estimates (model) by domestic and international sources
12 Methods and Assumptions of the AETA 2012 Report and Model
121 Macro assumptions
Key macroeconomic assumptions are consistent with those detailed by the Australian
Energy Market Operator in its National Transmission Network Development Plan and by
the Australian Treasury (see BREE 2012 for a full set of assumptions)
13
122 Technical assumptions
all technologies were costed on a consistent and transparent basis with itemisation of
component costs
capital costs included direct (eg engineering procurement and construction) and
indirect (eg owners) costs but exclude transmission and decommissioning costs
future cost estimates included assumptions about the exchange rate productivity
variation commodity variation and technology improvements
fuel cost estimates were based on ACIL Tasman projections and
projected growth rates for future operating and maintenance costs were provided
123 Levelised cost of energy (LCOE)
LCOE can be interpreted as the long-run marginal cost of electricity generation Key
factors used to calculate LCOE by technology include amortisation period discount rate
capacity factor CO2 emissions factor CO2 capture rate emissions price CO2 storage cost
fuel cost variable and fixed OampM cost and the capital cost
LCOE is a key comparative cost indicator across technologies that is expressed in real
Australian dollars per Megawatt hour of electricity generation ($MWh) The LCOE is the
price at which electricity must be generated from a specific plant to break even taking into
account the costs incurred over the life of the plant (capital cost cost of capitalfinancing
operations and maintenance costs cost of fuel emissions price if applicable and CO2
sequestration) While LCOE is an invaluable tool for comparing technology costs power
generation companies andor investors who wish to choose a technology to deploy would
also need to consider other criteria such as site-specific costs technology performance
characteristics and experience with the technology prior to any final investment decision
AETA cost estimates are developed to provide design basis and plant characteristics
performance parameters capital cost estimates fuel cost estimates OampM cost estimates
and LCOE estimates
Regional impacts on capital and operating costs have been incorporated in the analysis
These regions include Victoria New South Wales (including ACT) South Queensland
(incorporating the South East Queensland and Central Queensland AEMO regions) North
Queensland (incorporating the North Queensland AEMO region) Northern Territory
North WA (Pilbara region) South WA (the South West Interconnected System region)
South Australia and Tasmania
13 Methodology of the AETA 2013 Model Update
As part of the AETA 2013 Model Update BREE invited submissions from the AETA
Steering Committee and the Stakeholder Reference Group to provide commentary and
recommendations on the AETA 2012 Report and Model Eight written submissions were
received in this regard Changes were only recommended where specific substantiated
changes were received The AETA 2013 model has been updated in accordance with the
above consultations and under the same macro economic and technical assumptions as in
AETA 2012 The AETA 2013 model is freely available on request from BREE
(infobreegovau)
Within this context this report provides updated costs based on
14
relevant Australian and international reports on generation technologies that have been
published since AETA 2012 or have been newly discovered
new public domain information
new information from private sources that could be obtained
in-house experience of WorleyParsons and
input on OampM costs and learning rates from a number of industry stakeholders
This AETA 2013 Model Update report provides supporting explanations and references and
justifies amendments to the cost parameters of technologies especially the OampM costs for
wind and solar technologies that were covered in AETA 2012 model
131 Caveats on the use of LCOE
LCOE provides a generalised cost estimate and does not account for site specific factors
that would be encountered when constructing an actual power plant As a result the costs
associated with integrating a particular technology in a specific location to a specific
electricity network are not considered
Projected LCOE does not necessarily provide a reliable indicator of the relative market
value of generation technologies because of differences in the role of technologies in a
wholesale electricity market For example projected LCOE does not provide a direct
indicator of electricity demand or generation in isolation with other emissions abatement
policies Similarly many technologies involve integration costs in addition to the LCOE to
be able to reliably supply to the system The value of variable (or intermittent) power plants
(such as wind and solar) will depend upon the extent to which such plants generate
electricity during peak periods and the impact these plants have on the reliability of the
electricity system Unlike dispatchable power plants (such as coal natural gas biomass
and hydroelectric) ndash which are reliant on some form of stored energy (eg fuels water
storage or battery storage) ndash wind and photovoltaic power plants do not typically include
energy storage Dispatchable plants such as coal or gas fired plants may involve negative
externalities (environment fuel disposal or insurance costs etc) which are not always
reflected in their LCOEs
The AETA LCOEs are restricted to only utility-scale or large scale technologies
Consequently small-scale technologies (eg small roof-top photovoltaics fuel cells co-
generation and trigeneration) that may be relevant to distributed generation were not
included in the AETA 2012 analysis LCOE cost estimates associated with distributed
photovoltaics are likely to differ substantially from utility-scale photovoltaic systems as a
result of differences in component costs (eg capital costs operating and maintenance
costs) and performance characteristics (eg capacity factor)
132 Organisation of the report
This report is organised in five sections After a brief introduction and purpose of the report
in this section section 2 discusses the changes made to the AETA 2013 Model parameters as
a result of the discussions with Stakeholders and Steering Committee members on the
individual issues and technologies Section 3 presents the issues that were considered but did
not result in the AETA Model parameter changes Section 4 presents in detail the OampM cost
15
changes for wind and solar technologies covered in AETA 2012 Updated LCOE graphs as
well as a comparison of the resultant AETA 2013 Model and AETA 2012 Model LCOEs are
presented in section 5 which also presents concluding comments
16
2 AETA MODEL PARAMETER CHANGES
21 Stakeholder Initiated Changes
Consultations for the AETA 2013 Model update identified the following issues for
consideration
nuclear technology capital costs and lsquofirst year available for constructionrsquo
CCS retrofit thermal efficiency
amortisation period for all technologies and
OampM costs
The OampM issue is discussed in section 4 whereas rest of the issues are discussed below
211 Nuclear Capital Costs
The AETA 2012 report and model presents costs for first of a kind (FOAK) and Nth of a kind
(NOAK) nuclear technologies There could have been some confusion from the original
wording of Section 310 of AETA 2012 report It starts by discussing Gen III plants currently
sold (presumably NOAK) however further in the document Gen III plants are referred to as
FOAK The AETA 2012 report states that the capital costs are based on nuclear power plants
in the US The NOAK value is what is represented in Table 3101 in the AETA 2012 report
and model
Although there are cost adjusting factors used for other technologies studied in the AETA
2012 report there is no adjustment of the US cost base for Australian labour costs and for
adjustment of Australian equipment costs Submissions indicated that an adjustment to costs
should also be used for nuclear to ensure there is commonality in the comparison
This suggestion was considered appropriate and adjustment to the costs for nuclear
technologies was made Based on the factors to convert US rates to Australian rates used in
the fossil fuel technologies ie the factors from the Thermoflow software the new nuclear
capital costs were calculated The multiplier from Thermoflow for labour costs is 205 and
the factor for equipment costs is 13 both US to Australia
Additionally it was submitted that the first year available for construction of nuclear
technologies be extended In support of this the submission argued that nuclear technologies
are examples of generation technology where legislation regulation and public policy
planning is highly region-dependent and must therefore precede deployment by several years
This was considered an appropriate submission and therefore the first year available for
construction in the model has been changed from 2012 to 2020 These changes are shown in
Table 1
17
Table 1 Model Changes Nuclear Technologies
AETA 2012 report reference AETA 2012 model value AETA 2013 update
Technology 37 Nuclear (GW Scale LWR)
Change first year available for Construction
2012
2020
Technology 37 Nuclear (GW Scale LWR)
Convert FOAK Capital Cost to Australian productivity
and commodity costs
4210
6392
Technology 37 Nuclear (GW Scale LWR)
Convert NOAK Capital Cost to Australian productivity
and commodity costs
3470
5268
Technology 38 Nuclear (SMR)
Convert FOAK Capital Cost to Australian productivity
and commodity costs
7908
11778
Technology 38 Nuclear (SMR)
Convert NOAK Capital Cost to Australian productivity
and commodity costs
4778
7116
The overall impact of these parameters on individual technology LCOE changes is given in
the AETA 2013 Model and in Section 5
212 Carbon Capture and Storage (CCS) Retrofit Thermal Efficiency
Subcritical coal technologies with CCS retrofit were reported to have only slightly lower
thermal efficiency values compared with new build supercritical technologies with CCS in
the AETA 2012 Model This was an oversight in the AETA 2012 Model
The AETA 2012 report identified the thermal efficiency to retrofit subcritical brown and
black coal plants as 216 per cent and 301 per cent respectively (Table 312) In the same
table the efficiency for new build supercritical brown and black coal plants is reported to be
208 per cent and 314 per cent respectively
The thermal efficiencies were revised down based on actual operating efficiencies of existing
coal facilities in Victoria and NSW and factored based on the thermal efficiency ratio of new
coal facilities with and without CCS
A reduction in thermal efficiency is to be expected when applying a retrofit CCS to the plant
The CCS factor in the following representation refers the efficiency reduction factors for
adding CCS to a coal fired power station The useful output will reduce from the new
parasitic loads to run the CCS equipment
Thermal efficiency of existing brown coal plant in Victoria is 265 per cent and the CCS
factor is 064 Similarly the thermal efficiency of existing bituminous coal plant in NSW is
355 per cent and the CCS factor is 075
Table 311 and 312 of the AETA 2012 report show a reduction is present when comparing
the supercritical with no CCS compared to supercritical with CCS However the retrofit case
was only provided for the subcritical technology only and no case was included in the AETA
2012 for a subcritical plant with any CCS
A review of the values in Table 312 through comparison to the existing efficiency of
installed black and brown coal fleet in Australia was undertaken For brown coal the current
18
sent out thermal efficiency is 265 per cent for a 500 MW subcritical unit For supercritical
brown coal without CCS the sent out efficiency is 323 per cent Applying the same reduction
factor the thermal efficiency with CCS retrofitted should be 17 per cent in lieu of 216 per
cent as published in AETA 2012 report
For black coal the current sent out thermal efficiency is 355 per cent for a 660 MW
subcritical unit For supercritical black coal without CCS the sent out efficiency is 419 per
cent Applying the same reduction factor the thermal efficiency with CCS retrofitted should
be 266 per cent in lieu of 301 per cent as published AETA 2012 report (Table 2)
Table 2 Model Changes CCS Retrofit Thermal Technologies
AETA 2012 report reference AETA 2012 model value AETA 2013 update
Technology 8 Pulverised coal subcritical plant
with post combustion CCS based on brown coal
(retrofit)
Thermal Efficiency
216
170
Technology 12 Pulverised coal subcritical plant
with post combustion CCS based on bituminous
coal (retrofit)
Thermal Efficiency
301
266
19
213 Amortisation period
There was stakeholder consensus that the operating period for all technologies needs to be set
to thirty years and that the construction time is in addition to the operating time The financial
amortisation period is common for all technologies and is set at 30 years In the AETA 2012
model section 24 (a) nominates that the amortisation period of 30 years is from the
commencement of construction The amortisation period has now been changed (Table 3)
Examples of the change are
Nuclear LWR ndash GW scale In AETA 2012 report amortisation period was 30 years inclusive
of construction and operation The amortisation period has now changed to 36 years (30
operating and 6 years construction)
Solar parabolic trough In AETA 2012 report amortisation period was 30 years inclusive of
construction and operation The amortisation period has now changed to 33 years (30
operating and 3 years construction)
Table 3 Model Changes amortisation period
AETA 2012 report reference AETA 2012 model value AETA 2013 update
Common Amortisation period
for construction and operation
Amortisation period for
operation includes
construction for all
technologies
Amortisation period for
operation to exclude
construction for all
technologies
22 No Carbon Pricing
For the 2013 AETA update the carbon price modifier has been set to zero per cent as the
base value for the results presented in this report with the effect of applying a zero carbon
price to all technologies throughout the study period to 2050 The AETA 2013 Model
however has the option of changing this parameter by the user
20
3 CONSIDERATION OF OTHER ISSUES
This section summarises the issues that were discussed during the AETA 2013 Model Update
with AETA stakeholders but have not led to a change in the model However these issues do
not cover the OampM costs considerations that are detailed in section 4
31 Representation of Uncertainty
The recognition of uncertainty within the model was discussed including both the level of
representation and potential uncertainties with respect to First-of-a-Kind and lsquoEarly Moverrsquo
Technologies
A number of factors were identified that lead to uncertainty in estimates ndash particularly for
emerging technologies For conventional coal and gas technologies even though the
technology is mature the addition of carbon capture introduces cost and performance
uncertainty Cost estimates have inherent uncertainty due to the market uncertainties and
unforeseeable technological developments and due to
- Volatility in equipment pricing
- Volatility in economic conditions (during post Global Financial Crisis) and
- Volatility in labour pricing due to ldquootherrdquo heavy construction projects in specific areas
For technologies where the costs are well understood it was considered that the error bars
should be reduced compared to immediate and emerging technologies and that the error bars
should be lower for technology costs in 2012 compared to later years
There is strong agreement from two key stakeholder submissions with all the factors causing
uncertainty that have been identified in AETA 2012 In particular the labour cost has varied
(increased) significantly due to large construction projects which have increased costs due to
a shortage of labour and a lower productivity due to less experienced personnel The
uncertainties provided in the AETA model are available on a per technology and a per
selected years basis BREE will consider whether or not to include more detail on
uncertainty by technology in the 2014 review of the model
32 Application of Learning Curves
It was raised during the consultation process that the AETA model revision could allow for
learning curve cost reduction assumptions to be altered by the end user This has not been
incorporated in the 2013 update as it is a structural change to the AETA Model
Stakeholders also raised the question as to whether it is possible within the application of
learning curves to distinguish between the potential for cost reductions on manufactured
components like PV panels versus the Balance of Project (BoP) costs which may involve
routine assembly and erection activities which are not subject to significant learning by
doing
However there are opportunities for cost reductions particularly where many repetitive tasks
are involved such as solar field construction modular construction techniques
rationalization of components in the BoP design or reduction in assembly or placement time
21
This is supported in the US Solar Market Insight Report 2012 (Kann 2012) which identified
continued savings in inverter and racking costs as follows
ldquohellip falling equipment costs and fine-tuning of installation practices have made large-
scale solar less expensive QQrdquo
ldquohellip with the continuing maturation of the industry we expect continued focus on
reducing PV balance-of-systems costs (BOS) and that the increased worry over high
penetration PV will drive adoption of 1000Vdc and advanced inverters
respectivelyrdquo and
ldquoMounting structure manufacturers noted that the past year has seen tremendous
pricing pressure accounting for price declines of anywhere between 10 per cent and
30 per cent over the past yearrdquo
Given that the balance of plant costs can also be subject to cost reductions it is not
considered necessary to distinguish learning curves for discrete project costs in the model
33 General Costs Considerations
331 Fuel Costs
The outlook for fuel costs for gas coal and carbon was claimed to have materially shifted
since the AETA 2012 model While there was no evidence provided to support this
consideration will be given to this issue in the 2014 model update
332 CCS Costs
A submission cited the ZeroGen Case Study and sought to clarify the differences in CCS
cost between ZeroGen and lower values estimated for AETA 2012 This is a valid
comparison however BREE notes the following issues which contribute to explaining the
differences The international cost component is as follows AETA 52 per cent ZeroGen 34
per cent With the USD exchange rate AETA 1 ZeroGen at 08 adjusting the AETA value
for exchange rate variation would add A$952kWnet to the AETA value There is a
difference in plant size with AETA at 557 MW net and Zerogen 400 MW net A bigger plant
size would typically provide a lower cost kW installed
Additionally section 112 of Chapter One of the ZeroGen report advises escalation based on
project delivery from 2011 to 2017 AETA costs are for 2012 basis and do not include
escalation beyond this time A portion of the Zerogen costs will be inflated over the
comparable AETA cost Also section 113 of Chapter One of the ZeroGen report identifies
significant enabling works This is likely to be more inclusive than considered in the AETA
2012 report as identified in section 23 (a)
Overall it is considered likely that a number of estimate basis items in the ZeroGen study are
different and once equalised will show a smaller difference between the AETA and
ZeroGen values Therefore there is no immediate action but the basis and assumptions of the
model may be reviewed during 2014 AETA update
With regard to CCS efficiency one submission proposed that the AETA estimates were
overly optimistic However no references were cited to support this view and no change has
been made to the model
22
333 Opportunity Costs
A submission was made that footnotes be included regarding retrofit costs to indicate that
make-up power costs are not included This was not adopted because AETA parameters for
each technology are calculated for that technology alone and do not consider the impact of
reduced output of a retrofit project where additional output needs to be generated from
alternate higher cost generation Opportunity costs are specifically related to business cases
for specific projects and are not considered for any cases presented in the AETA report
Moreover retrofitting does not make electricity generation uncertain or intermittent It only
lowers the flow of generation at a constant rate (due to lower thermal efficiency) relative to
the non-retrofit case
34 Capital and Construction Costs
A submission was made to update the AETA values for the mid-point capital cost for several
technologies based on a study provided in support of the submission The technologies
asserted were
IGCC (Integrated Gasification and Combined Cycle) with 90 per cent capture fuelled
with Victorian brown coal
IGCC with no capture fuelled with black coal
IGCC with 90 per cent capture fuelled with black coal
Pulverised Fuel power plant with 90 per cent capture fuelled with Victorian brown
coal
Pulverised Fuel power plant with 90 per cent capture fuelled with black coal and
OCGT with no capture fuelled with natural gas
There is a key difference in the magnitude of the labour component in Australia compared
with the labour costs associated with the supporting material (from the USA) While no
changes have been made to the model in this update the ldquoshort termrdquo impact of labour
pricing on technology costs may be considered in further updates
Similarly it was submitted that the capital cost values for combined Cycle Gas Turbine
(CCGT) (with and without capture) could be revised As no documentary evidence was
provided to support this no change was made
For Direct Injection Coal Emulsion (DICE) power plant with no capture fuelled with
Victorian brown coal it is also suggested that the values be reviewed with a number of
papers provided for reference However these papers do not address capital cost in any depth
and it is unclear if the balance of project costs included are comparable with AETA DICE
technology is not mature and is probably best described as in the demonstration to
deployment phase of development which brings uncertainty into the cost analysis Therefore
data is needed to substantiate this submission As this was not available at the time of
preparing this report consideration of this issue is deferred to a later time when the necessary
data is available
An increase in the capital costs for Solar thermal trough (6 hrs storage) and Solar thermal
central receiver (6 hours storage) were proposed based on a supporting study by the Electric
Power Research institute (EPRI) The proposed values are substantially larger than the AETA
23
2012 but it is not clear what basis is used to generate these revised values A separate
submission received from another AETA stakeholder has supported the AETA values
Additionally the cited reference for solar thermal trough the Energy Power Research
Institute (EPRI) plant configuration is based on air cooling ndash while for AETA the plant
configuration assumes water cooling The difference in plant configuration will account for a
small part of the difference The AETA value is based on a reference report as issued in 2012
by the US National Renewable Energy Laboratory (NREL 2012)
The AETA value for the central receiver technology is based on a small (20MW) plant
(Gemasolar) with factors for adjustment to field size for thermal storage capacity and post
FOAK learning These factors will align with increased uncertainty in the AETA value It is
likely that additional cost information may now be available for the Brightsource Ivanpah
plant (no storage) and other tower plants being considered under construction
Further investigation of these issues has been sought with stakeholders but is as yet
unavailable
Another suggestion was made to consider capital costs on a component basis The capital
costs used in AETA 2012 for existing technologies were based on actual costs that could be
sourced on published documents (locally andor internationally) or from WorleyParsons
internal data For developing technologies costs were not considered on a component level
For this reason in technologies that are not commercialised a number of assumptions would
need to be made which may limit lsquorealrsquo costs being available No change to the model arose
from this submission
A reassessment of the construction expenditure profile for concentrating solar power (CSP)
technology options was sought in another stakeholder submission and supported by a
referenced report (IT Power 2012) However the plant sizes considered in the AETA report
are larger capacity (100 MW+) than those discussed in the cited report and consequently
have a longer duration construction period As three years is considered to be an appropriate
time period to spread the construction expenditure profile no change to the model was made
35 Costs Associated with Solar Technologies
A change to the model was sought with regard to the significant downward trends in the cost
of solar PV The stakeholder submission cited pricing data from the Australian Photovoltaic
Institute (APVI) Consultation with the APVI identified that evidence based information for
utility scale PV costs in Australia is limited because Australia has no PV systems 100 MW or
larger It is acknowledged however that there is significant and continued volatility in the
solar PV market including volatility due to competition oversupply in the PV module
market as well as continued price reductions for balance of system and installation costs
A$338 Wnet was a reasonable valuation for 2012 AETA The AETA 2012 value will be
maintained but may be reviewed in the 2014 model update
It was also suggested that solar thermal costs could be better represented in the model by
allowing for different periods of storage rather than a standard 6 hours The AETA 2012
scope was based on fixed plant designs which included fixed thermal storage sizing where
thermal storage was included With thermal storage there are a number of variables that can
be considered including differing field sizes (solar multiple) as well as actual thermal storage
capacities This is likely to add significant complexity to the report and to the model the
benefit of which at this stage does not warrant the changes
24
36 Costs Associated with Nuclear Technologies
It was submitted that consideration be given to including the impact on LCOE for nuclear
technology of the relatively high insurance costs for nuclear technologies This issue will be
considered in the 2014 review of the AETA model However insurance costs or plant
decommissioning costs are not considered for any of the 40 AETA technologies
Also the OampM improvement rate for Nuclear was not reconsidered as there is no OampM
improvement rate for Nuclear in the model
37 Further Technologies
A proposal was received which recommended that further technologies (DICE power plant
based on black coal with and without capture and DICE brown coal with capture and
medium speed DICE technologies) be incorporated into the AETA Model However as
mentioned earlier this update of the AETA 2012 Model only considered the technologies
included in that model This update of the model is not intended to broaden the technologies
38 Auxiliary Loads
Another example used for the purposes of drawing comparisons with the AETA model was
the SaskPower Post Combustion Retrofit It is difficult to distil the SaskPower project data
into a direct comparison with the AETA study and consequently there is insufficient data
certainty to warrant changes to the AETA 2012 values The SaskPower Post Combustion
Retrofit was also cited as to its conservative auxiliary loads for brown and black coal
However upon further investigation this was not substantiated within the SaskPower
example
25
4 WIND PV AND CSP OPERATIONS AND MAINTENANCE (OampM) COST UPDATE
41 Operation and Maintenance Costs
OPERATING AND MAINTENANCE COST DEFINITIONS
In considering the costing of OampM there is no absolutely clear definition of which costs
should be considered as fixed and which variable with the breakdown varying based on a
range of issues including technology location and resource type For this reason in the future
AETA reports OampM costs may be compared in terms of annual total operating expenditure
(OPEX) per MW of generation This method is widely used by most international institutions
to analyse OampM costs and to avoid subjective considerations
For this report fixed and variable costs are reported to provide direct comparison with AETA
2012 In this regard in general fixed costs are independent of the electrical generation of the
plant and are expressed as annual cost per MW capacity Fixed costs include items such as
fixed labour
equipment and
vehicles
Variable costs are proportional to the electrical generation of the Plant and are expressed as
cost rate per kWh energy output Variable costs include items such as
variable labour
consumables and
spare parts
As both public and private domain material vary in the way they approach and report on
fixed and variable maintenance within the following text where an interpretation has been
used for comparison purposes this is described
A submission was made to remove the operations and maintenance (OampM) cost escalation
factors This was not taken up as there is an increase in the OampM costs over CPI which is
borne out historically A review of the basis for this escalation determined that the
underlying assumptions were appropriate The review also considered adopting a generic
learning curve approach for OampM improvement rates as was suggested in one submission
This was not adopted as the model has an OampM improvement rate (set at 02 per cent per
annum) which can be varied by the user for wind and solar technologies This value accounts
for more efficient practices balancing the increase in labour and material costs over and
above CPI However changes to OampM improvement rates for selected technologies were
made as mentioned earlier OampM improvement rate values may be further considered for
emerging technologies in 2014 AETA study
A number of submissions referred to the improvement rate of OampM costs with evidence for
existing technologies to support these rising at 150 per cent CPI It was suggested that for
26
developing technologies it could reasonably be assumed that there would be reductions in
OampM between the first commercial installation and subsequent installations
While it is generally acknowledged that the LCOE of delivered energy from wind is falling
within the literature there is conflicting evidence around trends in OampM costs with recent
reports indicating both significant decreases and increases in OampM (see section 432)
Solar thermal plants consist of technology components that can be considered mature (eg
steam turbine) and components that are undergoing further development such as the solar
field and thermal storage Solar thermal plants require manning for operation as opposed to
wind turbines that do not require the same level of manning
A recent article (Muirhead 2013) advised for the Solar Energy Generating Systems (SEGS)
plants in California that have been operating since the early 1990rsquos ldquoMy understanding is
that the performance of the SEGS plants has significantly improved over time This is due
primarily to replacement of first generation receivers with newer receivers that are much
more efficient OampM practices at the plants have also improved over time based on the now
long history of operating these plants resulting in increased output in addition to reduced
OampM costs
In the AEMO report 100 Per Cent Renewables Study - Draft Modelling Outcomes Scenario 1
assumes that rapid technology transformation will drive real reductions in OampM costs
outweighing any increases projected in the AETA 2012 so OampM costs reduce by 125 per
cent by 2030 and 25 per cent by 2050 Scenario 2 uses the AETA 2012 assumption that
OampM costs escalate at around 150 per cent of Consumer Price Index (CPI) which leads to
cost increases of 27 per cent by 2030 and 46 per cent by 2050 It should be noted that the
Scenario 1 reductions are assumptions without further analysis of what will bring the
assumptions to fruition
In AETA 2012 the common OampM improvement rate for most technologies is set at 02 per
cent and can be varied as a user input The OampM improvement rate for emerging
technologies solar thermal and photovoltaic technology options and offshore wind is set to
25 per cent and can also be varied as a user input The improvement rate is now compounds
on the previous yearrsquos value
The OampM improvement rate values may be further considered for emerging technologies in
2014 AETA study
42 Operating and Maintenance (OampM) Changes in summary
As part of the Model Update special emphasis was placed in this report on the Operational
and Maintenance (OampM) costs and OampM improvement rates for all wind solar thermal and
solar PV renewable technologies covered in AETA 2012 As mentioned earlier this took into
account relevant Australian and international reports public domain information private
sources as well BREE and WorleyParsonsrsquo in-house experience The updated OampM values
are shown in Table 4 Reductions in CSP OampM costs of between 8 per cent and 27 per cent
were obtained in comparison to values provide in AETA 2012 report
The review included a detailed review of a report by IT Power cited as part of one of the
stakeholder submissions In that report reference is made to a case where $18MWh of OampM
costs comes from 64MW trough plant however it does not specify the relevant location hour
27
of thermal energy storage (TES) capacity factor type of cooling and back-up fuel and
therefore cannot be fully analysed nor used towards this AETA update
OampM costs for solar thermal plants are significantly affected by the costs of manpower To
demonstrate this with an example $18MWh for a 100MW plant with a 23 per cent capacity
factor (the IT Power report consideration) would result in an annual OampM cost of
approximately $36 million A 100MW plant will need at least 28 full time employees to be
properly manned 7 daysweek as there needs to be multiple shifts With this amount of
labour there are insufficient funds for site services utilities and materialsmaintenance If the
value is based on another location such as the Far or the Middle East region where labour
costs are significantly lower then a lower OampM cost may be feasible however for Australia
this does not appear to be feasible
The changes to OampM values for the 2013 AETA model refresh are summarised below
Table 4 Model Changes OampM costs
AETA 2012 report reference AETA 2012 model value AETA 2013 update
Section 23 Technical Assumptions
Operating and Maintenance Cost
Estimates
OampM improvement rate 02per
cent all technologies
OampM improvement rate maintained at
02per cent for
Coal based technology options
Gas based technology options
Solar thermal hybrid options
Onshore wind
Biomass technology options
Wave technology options
Geothermal technology options
Nuclear technology options
OampM improvement rate changed to 25per
cent for
Solar thermal technology options
Photovoltaic technology options
Offshore wind
The OampM improvement rate is compounded
from the previous yearsrsquo value
Section 33 Solar thermal
technologies
Solar thermal - Parabolic Trough wo
storage
Fixed OampM (AUS$MWyear)
Variable OampM (AUS$MWh)
60000
15
59176
1519
Solar thermal - Parabolic Trough with
storage
Fixed OampM (AUS$MWyear)
Variable OampM (AUS$MWh)
65000
20
72381
1139
Solar thermal - central receiver
technology wo storage
28
AETA 2012 report reference AETA 2012 model value AETA 2013 update
Fixed OampM (AUS$MWyear)
Variable OampM (AUS$MWh)
70000
15
58285
707
Solar thermal - central receiver
technology with storage
Fixed OampM (AUS$MWyear)
Variable OampM (AUS$MWh)
60000
15
71312
565
Solar thermal - Linear Fresnel wo
storage
Fixed OampM (AUS$MWyear)
Variable OampM (AUS$MWh)
60000
1500
64105
1519
Solar thermal - Linear Fresnel with
storage
Fixed OampM (AUS$MWyear)
Variable OampM (AUS$MWh)
65000
20
72381
1139
Section 35 Photovoltaic
technologies
PV ndash non tracking
Fixed OampM (AUS$MWyear)
25000
25000 (no change)
PV - Single Axis Tracking
Fixed OampM (AUS$MWyear)
38000
30000
PV - Dual Axis Tracking
Fixed OampM (AUS$MWyear)
47000
39000
Section 36 Wind Technologies
Wind Onshore
Fixed OampM (AUS$MWyear)
Variable OampM (AUS$MWh)
40000
12
32500
10
Wind Offshore
Fixed OampM (AUS$MWyear)
Variable OampM (AUS$MWh)
80000
12
77600
30
43 Wind
431 Introduction
This Section reviews onshore and offshore wind operations and maintenance (OampM) costs
used in AETA 2012 The values scrutinised are the fixed and variable OampM given in Table
361 of that report summarised in Table 5 below
29
Table 5 Wind OampM costs used in the AETA 2012 report
Option Fixed OampM (AUS$MW) Variable OampM (AUS$MWh)
Onshore 40000 12
Offshore 80000 12
OampM covers all of the services required to keep the wind farm operating as contracted to
supply energy and renewable energy certificates for its lifetime inclusive of
turbines and all balance of plant (roads buildings electrical equipment SCADA
control equipment) up to the high voltage connection point on the wind farm
substation
labour (both trades and professional)
facilities (workshops stores offices)
equipment (tools jigs vehicles rigging safety equipment craneage)
spare parts and
consumables (such as oil grease and office consumables)
Windfarm size was not specified in AETA 2012 however it was noted that wind farms
greater than 100MW are becoming more common Since then within Australia wind farms
of larger and smaller sizes have been constructed for example the 420 MW Macarthur Wind
Farm in Victoria and the 55 MW Mumbida Wind Farm in Western Australia with both larger
and smaller wind farms under proposal For this review a nominal size of 100-150 MW is
used as representative of current and future facilities
432 Review of Evidence
As mentioned earlier the review of public literature by BREE and WorleyParsons the
procurement of private studies consultations with owneroperators in the wind farm OampM
sector in Australia AETA Stakeholders and project Steering Committee members were used
to assist the current Model Update process Where possible these sources are noted in the
text however some of these sources have asked to remain anonymous and where so the
term ldquoprivate sourcerdquo has been used
As noted by one reviewer in NREL 2011 OampM cost information in the public domain in
both quantum and quality is poor and the situation appears no better in 2013 particularly in
the discrimination of fixed and variable costs One reason for this is the commercial and
increasingly competitive nature of the sector with wind farm OampM now a significant
business worldwide with subsequent confidentiality around actual costs
What constitutes wind farm OampM is also changing This is driven in part by technological
change as the wind fleet ages as new turbines become larger and more sophisticated
particularly offshore Competition in the provision of OampM services is also changing with
maturing of the wind energy product As an example the following industry trends are now
evident
30
a growing role of independents in the wind OampM market ndash around 25 per cent of the
wind fleet in the US is expected to be operated and maintained by independents by
2025 (Ebert and Ware 2013) as opposed to original equipment manufacturers (OEMs) -
wind is largely a commodity market and easier for new participants to enter something
not necessarily seen with other generation technologies
tighter supply markets ndash general economic volatility is tightening the supply and
project development chain for wind moving interest into the OampM sector bringing
price volatility and more competition
a more sophisticated asset management model ndash where OampM providers are linking
operational data with long term condition monitoring output forecasting and work
order scheduling to deliver what is termed ldquolifecycle optimisationrdquo squeezing more
energy out of the asset
older turbines exceeding planned maintenance budgets ndash with the chief issue being
keeping the variable OampM from unforeseen breakdowns
a push for larger turbines particularly offshore (5-10 MW) and in deeper waters and
linking OampM to turbine contracts ndash there is evidence (including in Australia private
source) that wind farm OampM is becoming an even more significant bargaining
component of turbine supply contracts where lower supply costs are balanced by
longer OampM contracts
Costs of wind OampM are difficult to summarise as they are dependent on many issues As just
one example in the NREL 2011 study cited earlier a wide variability in wind farm OampM
costs was found across a range of countries (Figure 1) This reference demonstrates this
variability from the average reference case in terms of Levelised Cost of Energy (LCOE)
31
Figure 1 Effect of country variables on LCOE of wind plant
Source NREL (2011)
Other issues which affect the contracted cost of OampM for wind include
regional variations in labour and transport costs
wind farm environment particularly wind regime and proximity to the ocean
(corrosion)
the maturity and availability of wind turbine technicians
the spread of facilities geographically and the wind farm asset sizes in a portfolio
the turbine type and brand particularly the support establishment within a Region
the age of the asset OampM history and existence of Type (or systematic) failures of
major components
the ability of the OampM provider under the contract to source third party spares andor
try varied maintenance practices and
the nature of the OampM contract ndash for example does it include risk reward elements or
have a link to the wind turbine supply contract or is it a ldquoproduction availabilityrdquo
contract type
While it is generally acknowledged that the LCOE of delivered energy is falling for wind
technology (Hand 2013) within the literature there is conflicting evidence around trends in
OampM costs with recent reports indicating both significant decreases (BNEF 2013) and
increases (Ebert and Ware 2013) It is generally acknowledged that increased competition in
the OampM market is delivering lower cost service provision but this may in part be offset by
an ageing fleet requiring more variable maintenance and a more sophisticated and costly
32
response Several studies have demonstrated that the costs of maintaining wind turbines
generally increase with time following a trend similar in shape to that in Figure 2 (Hand
2013) with estimates in Albers (2009) indicating a doubling in turbine OampM costs by mid
plant life The term COD in Figure 2 refers to commercial operations date
Figure 2 Typical cost increasing trends in wind farm OampM costs with commercial operations
date
Source Adapted by WorleyParsons from Houston (2013)
In Australia this trend is also evident in post 10-year aged machines (private source)
particularly in relation to variable maintenance The nature of any similar increase with more
modern turbines is unpredictable although turbine availability is improving and there is
evidence that OampM costs with each generation of turbine are lowering see Wiser et al
(2012)
The OampM costs for offshore wind farms are particularly difficult to estimate as the industry
is still at the early stages of development including the progression of much larger turbines
into deeper water and the more complex nature of the task Such progression is indicated in
Figure 3 taken from RolandBerger (2013) which indicates an expected decrease in OampM
costs These costs are of the same order of that published in other recent publications UK
Crown Estate (2012) and US DoE (2013)
33
Figure 3 Trends in offshore wind farms and estimated impact on LCOE
Source RolandBerger (2013)
433 Updated OampM Figures for Australia
It is not a simple matter to transfer international costs to Australia as despite trends there are
significant differences between regions including
size of market ndash despite growth the Australian wind market is small with respect to
other world regions For example the total wind fleet is 4 GW (CEC 2013) for
Australia versus 60 GW for the US (AWEA 2013)
labour and material rates in certain parts of Australia are high by world standards
the logistics of getting to and within Australia generally involve longer distances than
other areas of the world particularly due to the remoteness from major equipment
suppliers
volatility of the Australian dollar particularly against the US and
the size of Australian wind farms tends to be larger
These differences can be seen in Figure 4 supplied by a turbine equipment supplier (private
source) and showing the relative OampM costs (per MW) and technician numbers (per 100
MW) across various world regions in 2012 for wind turbine maintenance only and excluding
balance of plant Numbers and scales between the two indices have been removed to protect
the confidentiality of this supplier with data believed to cover the entire global portfolio
under management This shows a significant difference between regions for onshore in both
indices for example almost a 45 per cent difference in costs between Europe and America
Australia would sit within ldquoAsiaPacificrdquo and while the Figure indicates generally lower
OampM costs and higher technician numbers for this region this presumably covers a very
diverse area (including South East Asia New Zealand and Oceania) which may skew results
34
Unlike many larger global markets the wind OampM sector in Australia is dominated by
turbine equipment suppliers with original equipment manufacturer (OEM) contracts
estimated to cover more than 95 per cent of the fleet The evidence for this is mostly
anecdotal although a number of smaller independent suppliers are now known to be
undertaking full service OampM for older plant (gt10+ years) with many of the drivers for this
covered in Ebert et al (2013) There is also evidence (private source) that wind turbine
suppliers in Australia are seeking OampM contracts with much longer terms and tying these to
reductions in turbine supply prices This may indicate a lack of competitive pressure on
OampM pricing in the near to mid-term and as the size of the overall market is small it is
unknown whether independents will grow market share as has been the case in many larger
global markets see for example Deloitte amp Touche (2012)
The most recent contemporary literature comments on onshore wind farm OampM pricing in
Australia and surrounds that could be found in the public domain and not used for the AETA
2012 work are from Hassan (2011) and Deloitte (2011) These are summarised with other
new international references cited in Table 6 with assumptions on any conversions noted
below the table As no offshore wind farm projects have been progressed in Australia the
table includes values from new sources for offshore projects from the international public
domain literature - the significant difference to onshore costs is evident in the values
Figure 4 OampM Costs (per MW) and Technician Numbers (per 100MW) for total wind turbine
OampM (Opex)
Source Private - values and scales removed to protect confidentiality
From Table 6 and considering the differences in markets it appears that for onshore wind the
AETA 2012 estimates may be slightly high with an updated AETA 2013 recommendation
given in Table 7 This value has been arrived at by considering
the size of the Australian wind market and lack of competitive pressure from
independent OampM service providers
35
supply side pressures on OEMs driving them to protect their OampM businesses and
lowering costs
the likely increase in fleet installations to comply with RET legislation skewing the
fleet age to more a modern generation of turbines although it is noted that there is some
uncertainty around long term OampM cost trends particularly variable maintenance ndash an
asset age of around 5 years is assumed here
uncertainties in what is included in referenced values and differences in markets and
advice from actual asset owners and OampM providers (private sources) on current actual
costs
Table 6 Comparison of AETA 2012 wind OampM estimates with new references for 2013
Source Region
Fixed OampM
(AUS$MW)
Variable OampM
(AUS$MWh)
Total OPEX
(AUS$MW)
On
sh
ore
AETA 2012 Australia 40000 12 799451
Houston 2013 US - - 35-380002
BNEF 2013 Global - - 25000
3
Private Source (2013) (gt 10 yr old
plant) Australia - - 70000
Private Source (2013)
(lt 2 yr old out of warranty plant) Australia - - 55000
Hassan 2011 Australia - - 83-99000
4
Deloitte 2011 New Zealand - - 450005
Off
sh
ore
AETA 2012 Australia 80000 12 1262526
Crown Estate 2012 UK - - 275000
7
Hassan (2013) UK - - 2391567
RolandBerger 2013 Europe - - 198000
8
US DoE 2013 US - - 144970
9
1 Assumes a 38 capacity factor
2 USAUD = 109 extrapolated from Figure approximately to 2013
3 EUROAUD = 142 uncertain if this includes all balance of plant or VOM and only includes OEM providers
4 Assumes a 38 capacity factor
5 Assumes NZAUD = 084 a 38 capacity factor and the mid-range estimate for OampM
6 Assumes a 44 capacity factor
7 Assumes GBPAUD = 167 and taking midpoint of estimates stated
8 Assumes GBPAUD = 167 and taking value for 3MW turbines
9 Assumes USAUD = 109
36
The figures shown for onshore projects in Table 7 represent a 15 per cent decrease in the
expected OampM costs of wind farms in Australia compared to AETA 2012 This change
reflects the volatility in this market noted in previous sections and in referenced material
internationally plus the appearance of significant downward pressure on wind OampM prices
primarily through increased global competition The values allow for the rising price of
turbine OampM as the turbine ages during its life
For offshore wind it appears that the OampM costs in AETA 2012 are too low and although it
is tempting to align costs with the most recent US figures due to their lower costs and similar
coastal conditions to Australia the European offshore fleet is significantly larger and more
mature Average figures across the 2013 referenced material including Europe is
recommended This is also shown in Table 7 and represents a significant increase in estimate
costs (around 33per cent) which reflects this evolving sector
There is very little contemporary information available on the breakdown of fixed and
variable maintenance on wind plant making judgment around this for the AETA requirements
is difficult However there is some published but copyrighted material eg GlobalData 2012
which combined with others (private sources) indicates that for onshore and offshore wind
plant respectively a 5050 and 4060 FOM VOM split is appropriate This has been used to
adjust the total OPEX figure in Table 7 to the AETA scheduled and variable indices
requirements using a 38 per cent and a 44 per cent capacity factor for onshore and offshore
projects respectively
Table 7 Recommended AETA (2013) values
AETA (2013) update Fixed OampM
(AUS$MW)
Variable OampM
(AUS$MWh)
Total OPEX
(AUS$MW)
Onshore $32500 $10 $65790
Offshore $77600 $30 $194000
44 Solar Photovoltaics (PV)
441 Introduction
This Section of the report focuses on the OampM costs for ground-mount photovoltaic (PV)
technologies broken down by the following mounting system configurations
Fixed Tilt (FT)
Single Axis Tracking (SAT)
Dual Axis Tracking (DAT)
Although different PV panel technology types (eg poly-crystalline mono-crystalline or thin
film CdTe) affect the capacity factor and land use the OampM costs are comparable The
estimates for this Report are based on polycrystalline PV technology which provides an
average cost on a per Watt basis with mono-crystalline OampM costs being slightly lower and
thin film OampM costs being slightly higher
With the aim to provide comparable results between technologies WorleyParsons has
analysed and updated the PV OampM costs in terms of both fixed operation and maintenance
37
costs (FOM) and total operating expenditures (OPEX) based on reference plants of similar
characteristics
Assumptions interpretations and considerations based on their in-house data and global
market trends are described in the following Sections
442 Review of the Evidence
Since the AETA 2012 report release few new public domain reports related to OampM costs
for PV systems have been published To confirm this the following organisations have been
consulted by WorleyParsons to provide the 2013 OampM costs update for the selected PV
configurations
International Renewable Energy Agency (IRENA) (wwwirenaorg)
International Energy Agency (IEA) (wwwieaorg)
The World Bank (WB) (wwwworldbankorg)
The US National Renewable Energy Laboratory (NREL) (wwwnrelgov)
Solar Energy Industries Association (SEIA) (wwwseiaorgau)
European Photovoltaic Industry Association (EPIA) (wwwepiaorg) and
Solar Electric Power Association (SEPA) (wwwsolarelectricpowerorg)
Upon review of the available information when compared to AETA 2012 the listed
organisations do not have any new public information related to large-scale PV OampM costs
If OampM costs are mentioned they are normally referenced as a per cent of the total Capital
Expenditure (CAPEX) for the plant (around 1 per cent) and provide little useful information
about OampM Cost changes
Due to insufficient detailed and recent information in the public domain WorleyParsons
obtained the following market reports from Photon a private organisation focused on market
news political discussions and technology analysis for the PV industry
Photon 2013 ldquoThe True Cost of Solar Power - Temple of Doomrdquo and
Photon 2013 ldquoSolar Annual 2013 - Build your Empirerdquo
These private reports had minimal focus on OampM costs To provide further input in this
area private OampM service providers were contacted for pricing estimates and market trends
443 AETA 2012 OampM PV costs report comparison
Typical power plant OampM costs are expressed as a combination of a variable component
(proportional to generation) and a fixed component (occurs irrespective of generated output)
Since the generation of a PV plant is dependent on solar radiation (not requiring fossil fuel or
water which make up the major components of variable costs for conventional generation) it
is typical to express the OampM costs only as Fixed OampM (FOM) costs proportional to the
plant size due to the simplicity of PV systems The AETA 2012 report follows this practice
and estimates the PV OampM costs as FOM only relative to plant size (kW) expressed on a per
year basis
38
In order to facilitate comparisons of these costs with other electricity technologies the FOM
costs in the AETA 2012 report are also presented as OPEX costs per MW of generating
capacity per year
ASSUMPTIONS AND CONSIDERATIONS
The following costs are included in the FOM estimates as an annual cost per kW capacity
labor and administrative expenses
panel washing (twice per year at $300 kl for water)
weed abatement (seasonal herbicide applications)
inverter replacement reserve (replaced at operational year 10) and
materials and maintenance spare parts civil works preventative and corrective
equipment maintenance
Although the cost of water is variable depending on location and usage it is such a small
portion of the total OampM costs that it is adequate to assume it as a fixed cost using the
assumptions listed above
AETA 2012 PV OampM COSTS COMPARISON REPORT
The technical characteristics of the reference PV plants used in the AETA 2012 report have
been extracted from the AETA 2012 Model (Version 1_0 Rev B BREE 2012) and are
summarised in Table 8
Based on this information the following parameters for the PV technologies are estimated
Total net energy production in terms of MWh sent out per year
Total plant acreage
FOM in terms of USD per year and
Total OPEX costs in terms of USD per year and USD per total net energy production
per year
39
Table 8 AETA 2012 reference plants technical characteristics and OPEX costs
Plant Characteristics Units Fixed Tilt (FT) Single Axis Tracking (SAT)
Dual Axis Tracking (DAT)
Plant Characteristics
Plant Net Capacity MW 100 100 100
Capacity Factor per cent 21 24 26
FOM $kWyear 25 38 47
Net Energy MWhyear 183960 210240 227760
Plant Acreage acres 500 800 900
Total FOM $year 2500000 3800000 4700000
Total OPEX $year 2500000 3800000 4700000
Total OPEX $kWh 00136 00181 00206
Total OPEX costs are between 00136 and 00206 USDkWh as shown in Table 8 above
These values are conservative cost estimates but reasonable for a large-scale PV plant with
comprehensive OampM service As is expected the FOM or OPEX costs increase as the plant
footprint increases and the complexity of the mounting system increases However the
increases to single and double axis tracking technologies are larger than would be expected
The increased complexity of the trackers does add costs to OampM in terms of labor parts and
even physical plant size but these additions are minor in comparison to the larger OampM
budget items such as the inverter replacement reserve and general electrical maintenance
which are irrespective of mounting system
These values although conservative still show the cost reductions from the industry learning
curve and expanded competition over the past few years when compared to past estimates of
OampM costs This can be seen in the following Table 9 of Fixed Tilt (FT) costs which
provides some estimates found in previous publications by IEA (2008) and EPRI (2010) The
tracking estimates are not shown since minimal data is available This corresponds to the
historical market trend of the industry being more willing to install fixed tilt systems rather
than tracking systems due to lower costs and technology risk
Table 9 Comparison of historical estimated PV and OampM costs in the public domain
PV Configuration OampM Costs Units IEA 200810
EPRI 2010 AETA 2012
Fixed Tilt (FT) FOM $kWyear 40 32 to 37 25
values in Italics are derived from reported data
10
Report assumed 1 of capital costs and 23 capacity factor
40
45 AETA 2013 PV OampM Costs Update
Using the same plant characteristic assumptions as the 2012 AETA Model the 2013 OampM
costs were estimated by WorleyParsons based on the references described in review of the
evidence in Section 442 The comparison of the AETA 2013 and 2012 OampM costs are
presented in Table 10 below
Table 10 2013 PV OampM costs compared to 2012 PV OampM costs PV Configuration OampM Costs Units AETA 2012 WorleyParsons
2013 Update
Fixed Tilt (FT) FOM $kWyear 25 25
OPEX $kWh 00136 00134
Single Axis Tracking (SAT) FOM $kWyear 38 30
OPEX $kWh 00181 00141
Dual Axis Tracking (DAT) FOM $kWyear 47 39
OPEX $kWh 00206 00173
Although the OampM costs for FT systems are approximately the same SAT and DAT OampM
costs reduced by around 20-30 per cent in this 2013 update compared to the AETA 2012
report The consistency of the FT costs is reasonable and expected to continue for the next
few years as discussed further in Section 451
Regarding the SAT and DAT costs although there have been improvements in the design of
trackers for PV applications this OampM cost reduction is due to a better understanding of the
costs associated with electrical and tracking system maintenance The cost differences
between tracking systems was corroborated by quotes from private OampM service companies
who indicated that there was only a slight increase in costs from FT to SAT but a larger
increase in costs from SAT to DAT
As compared to the references mentioned in Section 442 the updated cost estimates are
conservative Table 11 compares the estimated 2013 OampM costs with those references
However since these publications focused primarily on the CAPEX with very general OampM
cost assumptions the OampM costs presented therein are not considered representative
baselines for large-scale solar projects Furthermore they attest to the industryrsquos tendency to
focus strictly on installation costs and not lifecycle costs which is discussed further in Section
451
41
Table 11 2013 updated OampM costs compared to new referenced OampM costs (7-2) PV Configuration
OampM Costs
Units WorleyParsons 2013 Update
11
NREL 2013
12
IRENA 2013a
13
Photon 2013
14
Private OampM Service Providers
201315
Fixed Tilt (FT) FOM $kWyear 25 235 17 to 21 18 17 to 23
OPEX $kWh 00134 00216 to
00383
00121 to 00266
00098 00094 to 00127
Single Axis Tracking (SAT)
FOM $kWyear 30 Not provided
Not provided
Not provided
25 to 27
OPEX $kWh 00141 Not provided
Not provided
Not provided
00136 to 00147
Dual Axis Tracking (DAT)
FOM $kWyear 39 Not provided
Not provided
Not provided
32 to 34
OPEX $kWh 00173 Not provided
Not provided
Not provided
00174 to 00185
values in Italics are derived from reported data
451 OampM Learning Rates
In the rapid PV industry growth of the last three years WorleyParsons and anecdotal
experience is that PV was considered generally to require little to no maintenance causing a
general disregard for OampM planning This appears to have resulted in complications as
owners struggle to resolve reliability performance and budget issues as the projects mature
(multiple private sources) Although the maintenance costs are smaller compared to standard
power plants OampM awareness has been increasing in the industry and therefore the OampM
cost estimates have subsequently increased
This is supported through the recent focus of OampM at PV conferences (such as Sandia
National Laboratory and Solar Energy International events) on increasing the investment in
OampM practices in addition to improving the current practices products and services so that
PV plants can be better maintained to achieve higher reliability throughout the plant life
cycle Currently the majority of OampM expenses for PV systems consist of maintaining and
replacing the inverters followed by the Balance of System maintenance In general once the
appropriate level of investment in OampM for PV is reached then OampM costs will begin to
decrease as the following issues develop to maturity
technology improvement
inverter design for reliability and longevity
data monitoring for preventative and corrective maintenance support
system efficiency to increase system output for the same OampM expense
decreased capital costs for major equipment
decreased spare parts costs
11
See assumptions in Section 433 and 443 12
Report assumed 250kW rooftop at 7 to 10 capacity factor 13
Report assumed 1 of CAPEX and 9 to16 capacity factor 14
Values derived from the global weighted average calculations assuming 21 capacity factor and 20 year lifecycle Report assumed a
simple percentage of average selling price 15
Quote excluded weed abatement panel washing and inverter replacement reserve which were supplemented from the WP estimate
Calculations assumed 21 capacity factor
42
industry maturity and stability
reliable OEM support from product consistency and commercial stability
improved codes and standards for PV equipment system design installation
commissioning and OampM and
experience
trained and experienced personnel in the installation and maintenance of PV plants
In line with this trend owners system designers installers and OEMs are now including
OampM considerations in their finances designs services and products Even though there
have been and will continue to be cost reductions in OampM due to the industry maturation
stabilization and competition those cost reductions are balanced with the necessary
increases in OampM investment to meet the maintenance needs of existing and planned PV
plants resulting in a level OampM cost estimate for the next five years
Photon (2013) follows this assumption of consistent OampM costs for the next ten years as well
as WorleyParsons discussions with OampM service providers Therefore the assumption that
PV OampM costs will remain somewhat constant over the next five years before reducing again
appears to follow the projections in the industry
452 Conclusions - PV
The key findings from the AETA 2012 review and update of the PV OampM costs are as
follows
The 2013 WorleyParsons PV OampM costs update resulted in values of
$25kWyear for FT systems
$30kWyear for SAT
$39kWyear for SAT in 2012 USD
Fixed tilt configurations have not seen significant changes in OampM costs compared to
the 2012 AETA estimates while SAT and DAT configurations cost estimates have
reduced approximately 20-30 per cent based on a better understanding of the associated
OampM costs
Values obtained in the 2013 WorleyParsons update are more conservative but are
aligned with values provided by recognised international institutions even though few
detailed OampM breakdowns are available and
OampM costs for PV are expected to remain constant over the next five years before
reducing as the industry matures in both experience and long-term planning
capabilities
43
46 Concentrating Solar Power (CSP)
461 Introduction
This Section of the report focuses on the OampM costs for the following Concentrating Solar
Power (CSP) technologies
Parabolic Trough (PT)
Solar Tower (ST) and
Linear Fresnel (LF)
CSP OampM costs were analysed in terms of
Fixed Operating and Maintenance Costs (FOM)
Variable Operating and Maintenance Costs (VOM) and
Total Operating Expenditures (OPEX)
In order to arrive at comparable results between technologies BREE and WorleyParsons
estimated the OampM costs based on
Reference Plants with similar Solar Plant characteristics localisation net capacity
capacity factor hours of Thermal Energy Storage (TES) and type of cooling system(s)
and
Cost estimate amounts that were updated to 2012 USD
When information was not available necessary estimates were made using WorleyParsonsrsquo
in-house data and based on global market trends observed in various publications
462 Review of the evidence
The following international organisations were consulted to provide the AETA 2013 OampM
costs update for the selected CSP technologies
International Renewable Energy Agency (IRENA) (wwwirenaorg)
International Energy Agency (IEA) (wwwieaorg)
European Solar Thermal Electricity Association (ESTELA) (wwwestelarde)
The World Bank (WB) (wwwworldbankorg)
National Renewable Energy Laboratory (NREL) (wwwnrelgov)
Protermosolar (wwwprotermosolares)
Institute for Energy Diversification and Saving (IDEA) (wwwideaes)
Renovetec (wwwrenoveteces) and
CSP Today (wwwcsptodaycom)
The approach in reviewing OampM costs for the 2013 update for CSP technology was only to
use new sources of information published since the AETA 2012 report was written This was
44
maintained for all but the learning rates estimation which is due to the lack of any new
updated information published since 2012 in relation to this
Upon review of the available public domain information it was found that IEA ESTELA
WB Protermosolar Renovetec and IDEA do not have any new relevant public information
related to CSP OampM costs However IRENA 2013b IRENA 2013c and NREL 2012 are
new references from IRENA and NREL that are considered relevant and which were used in
this report
The information contained in these references did not provide updated costs for all of the
CSP technologies being considered in this Report and the values offered were not provided
in terms of FOM and VOM costs as preferred
Due to the lack of new relevant information in the public domain the AETA 2013 Model
Update process obtained reports from CSP Today a private international organisation
focused on news events reports updates and information for the CSP industry in markets
such as India South Africa Spain USA Chile and MENA regions The Update acquired the
last edition of PT and ST reports CSP Today 2012a and CSP Today 2012b for which OPEX
costs were analysed
463 AETA 2012 OampM CSP costs report comparison
Operating and Maintenance expenses were provided in terms of fixed and variable costs in
the AETA 2012 report and this Model Update has modified these for 2013 for PT ST and LF
technologies based on the references cited above and further consideration of learning rates
for the CSP industry
Most CSP projects with commercial operational experience are parabolic trough technology
as it is the most mature technology and currently more is reported and known about actual
costs than other CSP technologies Nevada Solar One as an example is a 64MWe parabolic
trough plant based in California which was commissioned in 2007 and it is the first plant
built after the SEGS development during the 1980-90s also in California
Andasol 1 the 50 MWe parabolic trough plant based in Spain is also the first CSP plant
worldwide to implement a commercial thermal energy storage system with a capacity of 75
hours of full load storage It commenced operation at the end of 2008 and other similar and
larger trough projects are now operating or being constructed
As the most mature CSP technology trough plant should be further down the operational and
design operability maturity path and hence have a lower opportunity for OampM cost
reductions through learning By contrast Solar Tower and Linear Fresnel systems are only
beginning to be deployed at larger scale and hence there is expected to be more potential to
reduce their capital and operating costs and improve performance
Learning rates have been argued by stakeholders as being very significant for CSP plant with
comments of the AETA 2012 report centring on this issue Disappointingly there is no new
published evidence or actual plant report data that could be found by the AETA stakeholders
and WorleyParsons to add to that used for the 2012 report There is however new evidence
on the reduction in LCOE for CSP technologies and WorleyParsons linked OPEX
contribution to these LCOE predictions so that a sense of future reductions could be made
This is outlined further in the following Sections
45
4631 ASSUMPTIONS AND CONSIDERATIONS
FOM and VOM Breakdown
The following costs are included in proceeding FOM cost estimates for CSP technologies as
an annual cost per MW capacity
Insurance
Labour costs and
Fixed service maintenance contracts
Similarly the following costs are included in the VOM cost estimates as a cost rate per MWh
of sent out energy
Material and maintenance costs spare parts equipment maintenance and unscheduled
inspections and
Utilities costs water auxiliary fuel and auxiliary power when applicable
Some items such as spare parts for scheduled maintenance could be considered FOM costs
However to simplify the comparison and to homogenise all of the analyses across
technologies all concepts related to plant material and maintenance were included in the
VOM costs
4632 AETA 2012 OampM CSP COSTS COMPARISON REPORT
The technical characteristics of the reference CSP Plants used in the AETA 2012 report have
been extracted from the AETA Model Version 1_0 (BREE 2012) and are summarised in
Table 12
Table 12 AETA 2012 Reference Plant Technical Characteristics
Plant
Characteristics
Units Parabolic
Trough
without
Storage
Parabolic
Trough
with
Storage
Solar
Tower
without
Storage
Solar
Tower
with
Storage
Linear
Fresnel
without
Storage
Linear
Fresnel
with
Storage
Plant Net Capacity MW 138 135 122 18 230 225
Location NA Unknown Unknown Unknown Unknown Unknown Unknown
Isolation kWhm2year Unknown Unknown Unknown Unknown Unknown Unknown
Hours of TES h - 7 - 6 - 6
Capacity Factor per cent 23 42 31 42 23 42
Type of Cooling NA Unknown Unknown Unknown Unknown Unknown Unknown
FOM $MWyear 60000 65000 70000 60000 65000 65000
VOM $MWh sent out 15 20 15 15 15 20
Based on the information above this Model Update estimated the following parameters for
the CSP technologies evaluated in this study
46
Total net energy production in terms of MWh delivered per year
FOM and VOM in terms of USD per year and
Total OPEX costs in terms of USD per year and USD per total net energy production
per year
The results are listed in Table 13 below Table 13 AETA 2012 OampM Opex costs on a per kWh basis
Plant
Characteristics
Units Parabolic
Trough
without
Storage
Parabolic
Trough
with
Storage
Solar
Tower
without
Storage
Solar
Tower
with
Storage
Linear
Fresnel
without
Storage
Linear
Fresnel
with
Storage
Plant Net Capacity MW 138 135 122 18 230 225
Net Energy sent out MWhyear 2780424 496692 3313032 662256 463404 827820
FOM $year 8280000 8775000 8540000 1080000 14950000 14625000
VOM $year 4170636 9933840 4969548 993384 6951060 16556400
OPEX $year 12450636 18708840 13509548 2073384 21901060 31181400
OPEX $kWh 00448 00377 00408 00313 00473 00377
FOM per cent 6650 4690 6321 5209 6826 4690
VOM per cent 3350 5310 3679 4791 3174 5310
The percentages of FOM and VOM costs as part of the total OPEX costs are presented in
Figure 5
Figure 5 AETA 2012 FOM and VOM Percentages of Total OPEX Costs
47
In Figure 5 FOM costs are in general terms significantly higher than VOM costs because
they include the higher cost items such as insurance labour costs and fixed service contracts
However as shown in the Figure VOM costs are higher or approximately equal to FOM
costs for technologies with energy storage given the criteria selected for the breakdown
between FOM costs and VOM costs FOM costs will remain relatively consistent from year-
to-year while VOM costs should be broken down even further since the costs of water
natural gas (if required) and electricity vary between locations and from one year to another
Total OPEX costs are expressed in terms of USD per total net energy production per year and
are between 00313 and 00473 USDkWh as listed in Table 13 These values are aligned
with the values provided by international institutions cited although they appear to be
somewhat inflated in comparison with those values that are closer to 0025 and 0035
USDkWh as published by others (eg IRENA)
4633 AETA 2013 OampM COSTS UPDATE
Similar Plant characteristics to AETA 2012 were considered for the appropriate comparison
of OampM costs for this update Plant characteristics include location net capacity capacity
factor hours of TES and type of cooling For this Report the characteristics of the reference
plants used are described in Table 14
Table 14 PT and ST Reference Plant Characteristics
Plant
characteristics
Units Parabolic
Trough without
Storage
Parabolic
Trough with
Storage
Solar Tower
without
Storage
Solar Tower
with Storage
Plant Net Capacity MW 100 100 100 100
Location NA MENA region MENA region MENA region MENA region
Isolation kWhm2year 2400 2400 2400 2400
Hours of TES h 0 6 0 6
Capacity Factor per cent 26 46 275 476
Type of Cooling NA Dry Dry Dry Dry
Source NA WorleyParsons CSP Today 2012a WorleyParsons CSP Today 2012b
The 2013 OampM costs were estimated using as a basis the information provided in the CSP
2012 reports (CSP 2012a and 2012 b) The following considerations were taken into account
the CSP Today reports only consider PT and ST plants with thermal storage
WorleyParsons made the following estimates based on experience with solar and
conventional power plants based on PT and ST technologies without TES
estimated the capacity factor based on plant capacity location and type of cooling
adjusted the insurance material and maintenance and labour costs based on the
solar field reduction factor when applicable
adjusted the steam turbine maintenance based on the potential hours of operation
48
adjusted the plant electricity and water consumption based on the total net
production
assumed similar auxiliary fuel consumption for the plant with and without TES This
assumption is due to the reference plants being based in the same location thus
requiring similar auxiliary fuel consumption for start-up Minimal differences in
auxiliary fuel consumption for freeze protection due to increased time offline for a
plant without TES system compared to a plant with TES are expected but not
considered in this Report as the impact would be minor
the capacity factor provided by CSP Today for PT with thermal storage is considered
high Based on the plant location and capacity WorleyParsons would anticipate the
capacity factor to be closer to 42 per cent instead of 46 per cent as indicated in Table
14 above This difference in capacity factor directly impacts the estimated VOM cost
which is correlated with plant production For comparison purposes the value provided
by CSP Today has maintained and
with respect to Linear Fresnel technology updated information has not been published
since the AETA 2012 report release by the references listed in Section 462 which
WorleyParsons consulted For the purpose of updating the estimates to 2013 it was
assumed that the evolution of the OampM costs would be similar to that of parabolic
trough plants and the same escalation factors were applied
The resulting 2013 and 2012 OampM costs are listed in Table 15 below for comparison
Table 15 2013 CSP OampM Costs Compared to 2012 OampM Costs
CSP Technology OampM Costs AETA 2012 WorleyParsons 2013 update
Parabolic Trough
without Storage
FOM $MWyear 60000 59176
VOM $MWh sent out 1500 1519
OPEX $kWh 00448 00412
Parabolic Trough with
Storage
FOM $MWyear 65000 72381
VOM $MWh sent out 2000 1139
OPEX $kWh 00377 00293
Solar Tower without
Storage
FOM $MWyear 70000 58285
VOM $MWh sent out 1500 707
OPEX $kWh 00408 00313
Solar Tower with
Storage
FOM $MWyear 60000 71372
VOM $MWh sent out 1500 565
OPEX $kWh 00313 00228
Linear Fresnel without
Storage
FOM $MWyear 65000 64107
VOM $MWh sent out 1500 1519
OPEX $kWh 00473 00434
49
CSP Technology OampM Costs AETA 2012 WorleyParsons 2013 update
Linear Fresnel with
Storage
FOM $MWyear 65000 72381
VOM $MWh sent out 2000 1139
OPEX $kWh 00377 00293
The total OPEX costs per year from the AETA 2012 report and the WorleyParsonsrsquo estimates
that were updated for 2013 are compared in Figure 6 below
Figure 6 Comparison of OPEX Costs per Total Annual Plant Production per Year AETA 2012
Report and 2013 Update
Reductions of approximately 20 - 27 per cent in OampM costs would be realised by CSP with
TES according to the updated 2013 WorleyParsons estimates compared to the same costs
reported in the AETA 2012 report However reductions for PT and LF without TES were
found to be lower at approximately 8 per cent
The IRENA reports (IRENA 2013b IRENA 2013c) provide values for OPEX between 0025
and 0035 USDkWh for PT and ST technologies with and without TES Values updated to
2013 by WorleyParsons are between 0023 and 00412 USDkWh for PT and ST
technologies which align with the IRENA values However IRENA does not differentiate
between the utilisation of TES Solar technologies without TES have fewer hours of
production and although OPEX costs are lower in terms of USDMW compared with solar
technologies with TES OPEX costs in terms of costs per total annual plant production per
year will typically be higher for technologies that do not use TES
4634 OampM CSP LEARNING RATES
Cost reductions on CSP technologies are expected to come from the following main actions
economies of scale in the plant size and manufacturing industry
learning impacts on design construction and operation phases
50
advances in RampD of the following factors
Components Solar receivers mirrors HTF storage media supporting structures
trackers and auxiliary systems
Systems Direct steam generation storage systems or hybrid cooling systems
Configurations Hybridisation or duel electricity water plants
a more competitive supply chain
improvements in the performance of the solar field solar-to-electric efficiency and
thermal energy storage systems
increases in the life of plants and
reduced financial costs
Based on the parameters listed above the LCOE from Solar Thermal technologies is likely to
be continuously decreasing and this is born out in the literature that has been reviewed Based
on the IRENA 2013b report the evolution of the LCOE from trough and power tower CSP
technologies shows how the LCOE is decreasing as technology development increases in
Table 16 below Estimates for LCOE for the hypothetical trough and tower CSP plants in
2014 are also included
51
Table 16 Estimated LCOE form Existing and Hypothetical Trough and Solar Tower CSP Technologies
CSP
Technology
Year Capacity
(MW)
Plant Name Location DNI
(kWhm2year)
LCOE 2012
$kWh Installed
Trough
1981 05 PSA Spain 2000 064
1983 138 SEGS I California 2700 039
1989 30 SEGS II ndash VIII California 2700 026
1992 80 SEGS VIII amp IX California 2700 020
2008 - 2009 50 Andasol 1 2 Spain 2000 035
2010 50 Solnova 1 amp 3 Spain 2000 034
2010 - 2011 50 Extresol 1 amp 2 Spain 2000 035
2014 250 Unspecified (wet
cooling no storage)
Not provided Not provided 020
Tower
1987 10 Solar One California 2700 058
2007 11 PS10 Spain 2000 034
2009 20 PS20 Spain 2000 036
2011 199 Gemasolar (wet
cooling 15hr
storage)
Spain 2000 033
2014 120 Unspecified
(dry cooling
storage)
Not Provided Not provided 015
International Institutions such as IRENA ESTELA or the World Bank agree that the LCOE
and capital cost reductions of 28 per cent to 60 per cent are envisioned by 2020 ndash 2025 for
such plant Estimates of possible LCOE reductions for CSP technology from 2012 to 2025
are provided in Figure 7 taken from Kearny (2010)
52
Figure 7 Expected LCOE Reductions for CSP Technology from 2012 to 2025
Source (Kearny 2010)
The OampM maintenance costs of modern CSP Plants are lower than those for Californian
SEGS Plants built in the 1980s and 1990s which has a total combined capacity of 354 MW
and estimated OampM costs of USD 004kWh (IRENA 2013b) However CSP experienced no
growth from early 1990s until the mid-2000s as can be seen in Table 16 above
As stated at the beginning of Section 462 Andasol 1 was the first 50 MWe parabolic trough
plant built after SEGS which included a thermal energy storage system It commenced
operation at the end of 2008 Podewils (2008) estimated Andasol 1 OampM costs of EUR
0072kWh or USD 0095kWh (considering 2012 medium rate exchange EURUSD of
07553) This value is high compared to OPEX estimations for PT with TES provided by
both this 2013 update and the AETA 2012 report (00293 and 00377 USDkWh
respectively) Therefore according to the information detailed above considerable learning
improvements to OampM costs have been already achieved from the commencement of
operation of Andasol 1 to the time of this Report
`WorleyParsonsrsquo estimations on the LCOE of parabolic trough plants is in the range of
USD 020kWh to USD 035kWh and that of solar towers between USD 017kWh and
USD 029kWh However in areas with excellent solar resources the range could be as low
as USD 014kWh to USD 018kWh
The following considerations have been taken into account for OampM cost learning rates
forecast
WorleyParsons LCOE estimations as set out above
Potential average envisaged LCOE reductions of 475 per cent by 2025 based on Figure
7 above
OPEX contribution on LCOE of 20 per cent and
53
assuming that all components involved in the LCOE (CAPEX OPEX and financial
expenses) reduce at the same rate so percentage contributions remain constant
According to these considerations WorleyParsons estimates that OPEX values by 2025 could
reach from 0021 to 0037 USDkWh for PT technology and from 0018 to 0031 USDkWh
for ST technology
Technological improvements have reduced the requirement of replacing mirrors and
receivers Automation has reduced the cost of other OampM procedures by as much 30 per
cent As a result of OampM procedure improvements (both cost and plant performance) the
total OampM costs of CSP plants in the long-term are likely to be below USD 0025kWh
(IRENA 2013b)
Parabolic trough system in the United States would have OampM costs of around USD 002 to
USD 003kWh meanwhile the OampM costs of parabolic trough and solar tower power plants
currently under construction in South Africa have estimated OampM costs of between USD
0029 and USD 0036kWh (also IRENA 2013b)
WorleyParsons estimations are in alignment with IRENA estimations in terms of current and
envisaged CSP OPEX costs
4635 CONCLUSIONS ndash CSP
The following main conclusions were made based on this study in relation to CSP
technologies
the 2013 WorleyParsons CSP OampM costs update resulted in values between 0023 and
0043 USDkWh based on 2012 USD
reductions in CSP OampM costs between 8 per cent and 27 per cent were obtained in
comparison to values provide in AETA 2012 report
the total OampM costs of CSP Plants in the long-term are likely to be below USD
0025kWh
the updated values for 2013 by WorleyParsons are in alignment with the values
provided by recognised international institutions and
at the time of this report the only CSP technology with substantial operation capacity
was PT Only three utility-scale ST plants were in operation at the time of this report
(PS-10 PS-20 and Gemasolar) of which only one (Gemasolar) uses TES Though
several process steam and small-scale LFR Plants are currently in operation only one
utility-scale LFR (Puerto Erradio 2) was in operation at the time of this report
47 AETA 2013 OampM Learning Rate recommendation
The learning rate used in AETA 2012 for OampM is applied to all technologies assessed and
includes fossil fuel technologies and emerging technologies The learning rate is set at an
improvement of 02 per cent per annum
In addition to the improvement rate OampM is escalated at a rate of 150 per cent of CPI per
year based on experience with increases in parts and labour costs
The CPI rate set in the model is 25 per cent per annum
54
OampM cost information in the public domain in both quantum and quality is poor for
contemporary data Information supporting OampM learning rates is equally poor There are
indications that emerging technologies do have the potential for increased OampM learning
rates relative to mature technologies
For the renewable energy technologies studied in this report onshore wind is considered
mature and it is recommended that the AETA 2012 report value of 02 per cent is maintained
For all other renewable energy technologies studied in this report a more aggressive learning
rate of 25 per cent is recommended This will effectively cancel out the CPI escalation
adjustment and provide a ldquoflat linerdquo OampM rate for future years This will provide a value in
line with the learning rate conclusions for PV
The learning rate for CSP is considered to have greater potential for reduction but due to the
high level of analysis in this report (and therefore uncertainty) it is proposed that a maximum
of two learning rates is appropriate for the AETA model
Table 17 AETA Learning Rate Comparison
AETA 2012 Learning Rate AETA 2013 update Learning Rate
Onshore Wind 02 per cent 02 per cent
Offshore Wind
PV ndash all technologies
CSP ndash all technologies
02 per cent 25 per cent
55
5 CHANGES TO THE LCOE
Changes to the model parameters described in the earlier sections have resulted in changes to
the LCOE estimates for a number of technologies The LCOE estimate values for all
technologies and associated range of uncertainty are shown in the Figures 8 to 13 below
Note that the values listed are for a base value carbon price modifier of zero per cent which
places no value on carbon emissions
For selected technologies where there are significant cost differences Figure 14 provides a
comparison of mid-range LCOE values for the AETA 2013 and AETA 2012 Models Key
features of the Figures 8 to 14 are as follows
both in AETA 2012 and 2013 Model update LCOE costs are provided for the years
2012 2020 2025 2030 2040 and 2050
cost ranges are provided for each technology that accounts for differences in fuel prices
and state-based variations
LCOE costs vary substantially across the technologies from $89MWh (combined cycle
gas turbine) to $351MWh (solar thermal linear fresnel) in 2012 and $73MWh (PV
non-tracking) to $247MWh (IGCC black coal CCS) in 2050
the inter-technology LCOE comparisons figures (Figures 8 to 13) reveal changes in
relative costs of technologies over time Key results include renewable technologies
have higher LCOEs than the lowest cost non-renewable technologies and the relative
LCOE rankings significantly change post 2030 The LCOE of solar PV become lower
than the non-renewables from mid 2030 onwards and
large changes in LCOE results between AETA 2013 Update and AETA 2012 are
depicted in Figures14 below Figure 14 compares LCOEs at 2050 between the AETA
2013 Update and AETA 2012 for a selected number of technologies that have changed
significantly for NSW (AETA developed LCOEs by each Australian state) Differences
in technology LCOEs are explained by a multiplicity of factors including the technical
developments OampM costs and learning rate changes
56
Figure 8 Updated LCOEs for AETA 2013 Model technologies values for 2012 (NSW) with carbon price set to zero
0
50
100
150
200
250
300
350
400
450
500
LCO
E ($
MW
h)
LCOE FOR 2012 TECHNOLOGIES (NSW) Note Default region is NSW except bown coal
technologies (VIC) and SWIS scale (as specified)
LCOE includes where relevant allowance for- Carbon Price- CO2 transport and sequestration cost- Plant capital cost (EPC basis) within battery limits- Owners costs excluding interest during construction- Fixed and variable operating costs- Fuel costs- Economic escalation factors
57
Figure 9 Updated LCOEs for AETA 2013 Model technologies values for 2020 (NSW) with carbon price set to zero
0
50
100
150
200
250
300
350
400
450
LCO
E ($
MW
h)
LCOE FOR 2020 TECHNOLOGIES (NSW) Note Default region is NSW except bown coal
technologies (VIC) and SWIS scale (as specified)
LCOE includes where relevant allowance for- Carbon Price- CO2 transport and sequestration cost- Plant capital cost (EPC basis) within battery limits- Owners costs excluding interest during construction- Fixed and variable operating costs- Fuel costs- Economic escalation factors
58
Figure 10 Updated LCOEs for AETA 2013 Model technologies values for 2025 (NSW) with carbon price set to zero
0
50
100
150
200
250
300
350
400
LCO
E ($
MW
h)
LCOE FOR 2025 TECHNOLOGIES (NSW) Note Default region is NSW except bown coal
technologies (VIC) and SWIS scale (as specified)
LCOE includes where relevant allowance for- Carbon Price- CO2 transport and sequestration cost- Plant capital cost (EPC basis) within battery limits- Owners costs excluding interest during construction- Fixed and variable operating costs- Fuel costs- Economic escalation factors
59
Figure 11 Updated LCOEs for AETA 2013 Model technologies values for 2030 (NSW) with carbon price set to zero
0
50
100
150
200
250
300
350
400
LCO
E ($
MW
h)
LCOE FOR 2030 TECHNOLOGIES (NSW) Note Default region is NSW except bown coal
technologies (VIC) and SWIS scale (as specified)
LCOE includes where relevant allowance for- Carbon Price- CO2 transport and sequestration cost- Plant capital cost (EPC basis) within battery limits- Owners costs excluding interest during construction- Fixed and variable operating costs- Fuel costs- Economic escalation factors
60
Figure 12 Updated LCOEs for AETA 2013 Model technologies values for 2040 (NSW) with carbon price set to zero
0
50
100
150
200
250
300
350
400
LCO
E ($
MW
h)
LCOE FOR 2040 TECHNOLOGIES (NSW) Note Default region is NSW except bown coal
technologies (VIC) and SWIS scale (as specified)
LCOE includes where relevant allowance for- Carbon Price- CO2 transport and sequestration cost- Plant capital cost (EPC basis) within battery limits- Owners costs excluding interest during construction- Fixed and variable operating costs- Fuel costs- Economic escalation factors
61
Figure 13 Updated LCOEs for AETA 2013 Model technologies values for 2050 (NSW) with carbon price set to zero
0
50
100
150
200
250
300
350
400
LCO
E ($
MW
h)
LCOE FOR 2050 TECHNOLOGIES (NSW)
LCOE includes where relevant allowance for- Carbon Price- CO2 transport and sequestration cost- Plant capital cost (EPC basis) within battery limits- Owners costs excluding interest during construction- Fixed and variable operating costs- Fuel costs- Economic escalation factors
Note Default region is NSW except bown coal
technologies (VIC) and SWIS scale (as specified)
62
Figure 14 Comparison of AETA 2013 Model and AETA 2012 Model LCOE estimates selected technologies 2050
0
50
100
150
200
250
AETA 2012
AETA 2013
63
51 Conclusions
The Australian Energy Technology Assessment (AETA 2012) provided the best available and most up-to-
date cost estimates for 40 electricity generation technologies under Australian conditions To ensure that
the cost estimates for the various technologies are consistent all common input costs (eg labour
materials components carbon price) were itemised To ensure that the AETA costings remain up to date
AETA costs are reviewed in this AETA 2013 Model Update report
The AETA 2013 refresh was developed in close consultation with a stakeholder reference group drawn
from industry and researchacademic organisations with interests and expertise in a diverse range of
electricity generation technologies
The AETA 2013 Model results reflect the change to exclude the value of a carbon price in the Levelised
Cost of Energy (LCOE) All technologies have experienced a minor reduction in LCOE relative to 2012
(offset in some cases by other factors) due to the change to an amortisation period of 30 years plus the
construction period
Comparing the 2012 AETA results without a carbon price to the 2013 results without a carbon price there
are significant reductions in the LCOE of solar technologies and onshore wind This is as a consequence of
changes to the fixed and variable Operations and Maintenance (OampM) costs for these technologies For the
solar technologies the adjustment of the capital learning rate to 25 per cent has also contributed to the
LCOE reduction Offshore wind also has an increased learning rate but this has been offset to a large extent
by increased variable OampM costs
Nuclear LCOE has increased significantly due to higher estimates for capital costs
Efficiency for coal fired plants with CCS retrofits has been revised downwards to better reflect the expected
efficiency of these plants and has the effect of increasing the LCOE
64
REFERENCES
Albers A 2009 OampM Cost Modeling Technical Losses and Associated Uncertainties Proceedings of the
2009 European Wind Energy Conference Marseilles France March
AWEA (American Wind Energy Association) 2013 AWEA US Wind Industry Annual Report ndash Year
Ending 2012 USA
BNEF (Bloomberg New Energy Finance) 2013 Operations and Maintenance (OampM) Price Index Issue II
Wind Research Note April
BREE (Bureau of Resources and Energy Economics) 2012 AETA Report and Model Version 1_0 2012
Australian httpwwwbreegovau
CEC (Clean Energy Council) 2013 Australian Energy Technology Assessment 2013 Review Letter to
BREE of 20 May 2013 from the Clean Energy Council (Mr Russel Marsh signatory for the CEC)
CEC (Clean Energy Council) 2013 Clean Energy Council Renewable Energy Map Australia June (data
noted as current as of 21 August 2012)
httpwwwcleanenergycouncilorgauresourcecentreplantregistermaphtml
Crown Estate 2012 Offshore Wind Cost Reduction Pathways Study United Kingdom May
CSP 2012a CSP Parabolic Trough Report Cost Performance and Key Trends CSP Today
CSP 2012b CSP Solar Tower Report Cost Performance and Key Trends CSP Today
Deloitte amp Touche 2012 European Wind Services Study Find Out Which Way the Wind Blows Deloitte amp
Touche GmbH Wirtschaftspruumlfungsgesellschaft August
Deloitte 2011 Economics of wind development in New Zealand Deloitte for the for the New Zealand Wind
Energy Association
Ebert P amp Ware J 2013 The Role of Independents in the Wind Farm Operations amp Maintenance
Proceedings of the 2013 New Zealand Wind Energy Conference and Exhibition March
EPRI (Electric Power Research Institute) 2010 Engineering and Economic Evaluation of Central-Station
Solar Photovoltaic Power Plants USA March
GlobalData 2012 Wind Operations amp Maintenance (OampM) Market ndash Global Market Size Share by
Component Competitive Landscape and Key Country Analysis to 2020 GlobalData reference code
GDAE1054MAR January
Hand M 2013 Wind Plant Cost of Energy Proceedings of the 2nd NREL Wind Energy System
Engineering Workshop January
Hassan G 2011 Review of the Australian Wind Energy Industry Clean Energy Council Australia 2011
Houston C 2013 The Real Truth About Wind Farm OampM Costs North American WindPower March
IEA (International Energy Agency) 2008 Technology Roadmap Solar photovoltaic energy France
httpwwwieaorgpublicationsfreepublicationspublicationpv_roadmappdf
IRENA (International Renewable Energy Agency) 2013a Solar Photovoltaics Technology Brief Germany
January httpwwwirenaorgDocumentDownloadsPublicationsIRENA-ETSAPper
cent20Techper cent 20Briefper cent20E11per cent20Solarper cent20PVpdf
65
IRENA (International Renewable Energy Agency) 2013b Concentrating Solar Power Technology Brief
Germany January
IRENA (International Renewable Energy Agency) 2013c Renewable Power Generation Costs in 2012 An
Overview Germany
IT Power 2013 Analysis of the AETA 2012 cost estimates of CSP technologies Clean Energy Council
submission to the Bureau of Resources and Energy Economics May
Kann S 2012 US Solar Market Insight Report Q3 California USA
Kearny A 2010 Solar Thermal Electricity 2025 ndash clean electricity on demand attractive STE costs
stabilize energy production ATKearny consultants Dusseldorf Germany
Muirhead J 2013 SEGS experience suggests that CSP will age gracefully CSP Today South Africa
httpsocialcsptodaycommarketssegs-experience-suggests-csp-will-age-
gracefullysthash6VkxFaD0dpuf
NREL (National Renewable Energy Laboratories) 2011 IEA Wind Task 26 ndash Multi-national Case Study of
the Financial Cost of Wind Energy Technical Report NRELTP-6A2-48-48155 March
NREL (National Renewable Energy Laboratories) 2012 Cost and Performance Data for Power Generation
Technologies USA February
NREL (National Renewable Energy Laboratories) 2013 Breakeven Prices for Photovoltaics on
Supermarkets in the United States March httpwwwnrelgovdocsfy13osti57276pdf
NREL (National Renewable Energy Laboratories) 2013 Breakeven Prices for Photovoltaics on
Supermarkets in the United States USA March httpwwwnrelgovdocsfy13osti57276pdf
Photon 2012 The True Cost of Solar Power 2012 Temple of Doom Solar Power in Focus Series Photon
Consulting
Photon 2013 Solar Annual 2013 Build Your Empire Photon Consulting
Podewils C 2008 Photovoltaic vs Solar Thermal where PV has the upper hand and where solar thermal
strikes back Photon International Germany November
Poore R and Walford C 2008 Development of an Operations and Maintenance Cost Model to Identify
Cost of Energy Savings for Low Wind Speed Turbines Report NRELSR-500-40581 National
Renewable Energy Laboratory January
RolandBerger 2013 Offshore Wind Towards 2020 On the Pathway to Cost Competitiveness RolandBerger
Consultants Germany April
See wwwcsptodaycom
See wwwepiaorg
See wwwestelasolarde
See wwwidaees
See wwwieaorg
See wwwirenaorg
See wwwnrelgov
See wwwprotermosolares
66
See wwwrenoveteces
See wwwseiaorgau
See wwwsolarelectricpowerorg
See wwwworldbankorg
UK Crown Estate 2012 Offshore Wind Cost reduction Study May
US DoE (Department of Energy) 2013 Award Number DE-EE0005360 USA February
Wiser R Lantz E Bolinger M amp Hand M 2012 Recent Developments in the Levelized Cost of Energy
from US Wind Power Projects Contract No DE-AC02-05CH11231 National Renewable Energy
Laboratories February
67
Appendix A
Electricity Generation Technologies in AETA 2012 Report and Model
The 40 AETA electricity generation technologies are
1 Integrated Gasification and Combined Cycle (IGCC) plant based on brown coal
2 IGCC plant with Carbon Capture and Sequestration (CCS) based on brown coal
3 IGCC plant based on bituminous coal
4 IGCC plant with CCS based on bituminous coal
5 Direct injection coal engine (clean lignite eg brown coal technology)
6 Pulverised coal supercritical plant based on brown coal
7 Pulverised coal supercritical plant with post combustion CCS based on brown coal
8 Pulverised coal subcritical plant with post combustion CCS based on brown coal (retrofit)
9 Pulverised coal supercritical plant based on bituminous coal
10 Pulverised coal supercritical plant based on bituminous coal - SWIS relevant scale
11 Pulverised coal supercritical plant with CCS based on bituminous coal
12 Pulverised coal subcritical plant with post combustion CCS based on bituminous coal (retrofit)
13 Adding CCS to existing Combined Cycle Gas Turbine (CCGT) power plants (retrofitting)
14 Oxy combustion pulverised coal supercritical plant based on bituminous coal
15 Oxy combustion pulverised coal supercritical plant with CCS based on bituminous coal
16 Combined cycle plant burning natural gas
17 Combined cycle plant burning natural gas - SWIS relevant scale
18 Combined cycle plant with post combustion CCS
19 Open cycle plant burning natural gas
20 Solar thermal plant using compact linear fresnal reflector technology wo storage
21 Solar thermal plant using parabolic trough technology wo storage
22 Solar thermal plant using parabolic trough technology with storage
23 Solar thermal plant using compact linear fresnal reflector technology with storage
24 Solar thermal plant using central receiver technology wo storage
25 Solar thermal plant using central receiver technology with storage
26 Solar photovoltaic (PV) - non-tracking
27 Solar photovoltaic (PV) - single axis tracking
28 Solar photovoltaic (PV) - dual axis tracking
29 Wind (on-shore)
30 Wind (off-shore)
31 WaveOcean
68
32 Geothermal - hot sedimentary aquifer (HSA)
33 Geothermal - enhances geothermal system (EGS)
34 Landfill gas power plant
35 Sugar cane waste power plant
36 Other biomass waste power plant (eg wood)
37 Nuclear Gen 3+
38 Nuclear Small Modular Reactors (SMR)
39 Solarcoal hybrid
40 Integrated solar combined cycle (ISCS) ndash parabolic trough with combined cycle gas
69
Appendix B
Consultations with Stakeholders
This study has been undertaken in close consultation with a Stakeholder Reference Group drawn from
Australian industry and domestic as well as overseas researchacademic organisations with interests and
expertise in a diverse range of electricity generation technologies These stakeholders were invited to
provide evidence of the latest estimates for the costs and performance of various technologies
In addition the AETA project also had a Project Steering Committee comprising staff from BREE
AEMO CSIRO and other independent experts to provide technical advice and support The following
agencies participated in the stakeholder reference group meetings or were forwarded the documents
presented at the meetings
AETA Stakeholder Reference Group
Australian Coal Association
Australian Energy Market Operator
Australian Geothermal Energy Association
Australian National Low Emissions Coal RampD
Australian National University
Australian Renewable Energy Agency
Australian Solar Thermal Energy Association
Australian Sugar Milling Council
Australian Treasury
Bureau of Resources and Energy Economics
Clean Energy Council
CSIRO
Department of Industry
Economic Research Institute for ASEAN and East Asia
Energy Retailers Association of Australia
Energy Users Association of Australia
Evans and Peck
Ferrostaal
Global CCS Institute
Grid Australia
Intergen
International Energy Agency France
International Power Suez
IRENA Innovation and Technology Centre Germany
70
National Generators Forum
Oceanlinx Limited
Origin Energy
Private Generators Group
The Institute of Energy Economics Japan
The Energy Research Institute New Delhi
University of Melbourne Energy Institute
University of Queensland Energy Initiative
UQ Energy Economics amp Management Group
Wyldgroup
WorleyParsons
Two AETA Stakeholders Reference Group meetings took place on 30 April 2013 and 17 July 2013 In
addition the AETA Project Steering Committee met on 24 June 2013
71
BREE contacts Executive Director BREE Bruce Wilson brucewilsonretgovau
(02) 6243 7901
Deputy Executive Director Wayne Calder waynecalderbreegovau
(02) 6243 7718
Modelling amp Policy Integration Arif Syed arifsyedbreegovau
Program Leader (02) 6243 7504
Data Statistics Geoff Armitage geoffarmitagebreegovau
Program Leader (02) 6243 7510
Energy and Quantitative Analysis Allison Ball allisonballbreegovau
Program Leader (02) 6243 7539
Resources ndash Program Leader John Barber johnbarberbreegovau
(02) 6243 7988
72

8
ACRONYMSABBREVIATIONS
AETA Australian Energy Technology Assessment
BREE Bureau of Resources and Energy Economics
CAPEX Total capital expenditures
CSP Concentrating Solar Power Technologies
DAT Dual axis tracking
EPIA European Photovoltaic Industry Association
EPRI Electric Power Research Institute
ESTELA European Solar Thermal Electricity Association
FOM Fixed operation and maintenance costs
FT Fixed Tilt
h Hours
IDEA Institute for Energy Diversification and Saving
IEA International Energy Agency
IRENA International Renewable Energy Agency
kW Kilowatts
kWh Kilowatt hours
LCOE Levelised Cost of Energy
LF Lineal Fresnel Reflector CSP Technology
m2 Square Meters
MENA Middle East and North Africa region
MW Megawatts
MWh Megawatt hours
MWe Megawatt hours electric
NREL National Renewable Energy Laboratory
OampM Operation and maintenance
OEM Original Equipment Manufacturer
OPEX Total operating expenditures
PT Parabolic Trough CSP Technology
PV Photovoltaic
RampD Research and Development
SAT Single axis tracking
SEGS Solar Electricity Generating System
SEIA Solar Energy Industries Association
SEPA Solar Electric Power Association
ST Solar Tower CSP Technology
TES Thermal Energy Storage System
USD United States Dollar
VOM Variable operation and maintenance costs
WB The World Bank organization
9
GLOSSARY
Amortisation Period the period over which a plant must achieve its economic return
Auxiliary Load the internal or parasitic load from the electricity required to sustain the
operation of a plant
Capacity Factor the ratio of the actual output of a power plant over a period of time and its
potential output if it had operated at full nameplate capacity the entire time
Capital Cost the cost of delivery of a plant not including the cost of finance
Discount Rate the rate at which future values are discounted or converted to a present
value
First-of-a-Kind Plant cost costs necessary to put a first commercial plant in place and that
will not be incurred for subsequent plants Design and certification costs are examples of
such costs
First Year Available for Construction the year in which the technology will be available
for commercial deployment globally
Gross Capacity maximum or rated generation from a power plant without losses and
auxiliary loads taken into account
International Equipment Cost the cost for internationally sourced equipment associated
with the project
Labour Cost the component of the delivery cost for a plant associated with local
(Australian) labour
Lead time for Development the time taken from inception to financial close This includes
permitting approvals and engineering design
Levelised Cost of Energy the minimum cost of energy at which a generator must sell the
produced electricity in order to achieve its desired economic return
Local Equipment Cost the cost of locally sourced (Australia) plant and equipment for the
project
Net Capacity the export capacity of a generation plant ndash ie the Gross Capacity less the
losses and auxiliary loads of the plant
Nth-of-a-kind plant cost all engineering equipment construction testing tooling project
management and other costs that are repetitive in nature and would be incurred if a plant
identical to a FOAK plant were built The NOAK plant is the nth-of-a-kind or equilibrium
commercial plant of identical design to the FOAK plant
Sequestration the process of transport and storage of Carbon Dioxide (CO2)
Thermal Efficiency the ratio between the useful energy output of a generator and inputs
10
EXECUTIVE SUMMARY
This Report provides electricity generation technology cost parameters as an update to those
presented in the Australian Energy Technology Assessment (AETA) Report and Model
published in July 2012 This update takes into account a range of new material reported in the
public and private domain further discussions with asset owners and technology developers
and input from key experts in relation to these costs
The AETA 2012 Model estimated levelised costs of energy (LCOE) for a set of 40 market
ready and prospective electricity generation technologies LCOE can be interpreted as the
long-run marginal cost of electricity generation These were estimated by breaking down
the cost drivers for a technology into its key constituent parts such as capital cost fixed and
variable lsquooperations and maintenancersquo (OampM) costs and where applicable fuel costs and
CO2 storage costs While the LCOEs included carbon costs project specific regulatory or
system based costs were not included although clearly these may have a significant impact
on the delivered price of electricity
The AETA 2013 Model update generally follows the same approach although comparable
LCOE results are presented without carbon costs reflecting the Governmentrsquos intention to
repeal carbon pricing To the extent that alternative emissions reduction measures impact on
the electricity generation sector this may have different implications for fossil fuel andor
renewable based technologies
For these reasons some caution should be applied when interpreting LCOE estimates These
estimates best illustrate potential and relative ldquooff-the-shelfrdquo cost competitiveness rather than
a firm predictor of market outcomes or the commercial viability of individual projects
The key features of the LCOE cost parameters in the AETA 2013 Model update with respect
to the AETA 2012 Model can be summarised as follows
renewable technologies have generally higher LCOEs than the lowest cost non-
renewable technologies and the relative LCOE rankings significantly change post
2030 The LCOE of solar PV becomes lower than the non-renewables from mid-
2030 onwards
however wind based generation is estimated to already have a lower LCOE than
many new build comparable fossil-fuel generation technologies
LCOE costs vary substantially across the technologies from $89MWh (combined
cycle gas turbine) to $351MWh (solar thermal Linear Fresnel) in 2012 and
$73MWh (PV non-tracking) to $247MWh (IGCC black coal CCS) in 2050
changes are made to nuclear capital costs and nuclear technology plantrsquos lsquofirst year of
constructionrsquo carbon capture and storage (CCS) retrofit thermal efficiency and
amortisation period for various technologies to include construction period
a reduction in onshore wind OampM costs of 18 per cent
11
a reduction in offshore wind fixed OampM costs and a three-fold increase in offshore
wind variable OampM costs resulting in an overall increase of 50 per cent total OampM
costs
fixed tilt PV configurations have not seen significant changes in OampM costs
single axis tracking and dual axis tracking PV configurations are approximately 20-30
per cent reduced based on a better understanding of the associated OampM costs
concentrating solar power (solar thermal) OampM cost reduced between 8 per cent and 27
per cent and
the OampM learning rate for offshore wind and all solar technologies are increased from
02 to 25 per cent
The overall impact of parameter changes by technology is given in the AETA 2013 Model
and in this report As in the AETA 2012 the 2013 Model update provides technology
LCOEs for the years 2012 2020 2025 2030 2040 and 2050
12
1 INTRODUCTION
The Australian Energy Technology Assessment (AETA) 2012 report published in July 2012
by the Bureau of Resources and Energy Economics (BREE 2012) undertook costing of 40
electricity generation technologies This report made a provision that due to the fast changing
technology cost environment cost and performance parameters assessed in the AETA 2012
model may be updated every year In addition a full report and lsquobottom uprsquo study will be
undertaken biennially with the next report to be released in 2014
The next fully updated AETA report is scheduled for completion in 2014 To ensure that cost
estimates for electricity generation technologies are current and take into consideration the latest
developments parameter estimates for the 40 technologies will be updated where appropriate
every six months in a manner consistent with the methods outlined in this report and in consultation
with the stakeholder reference group (BREE 2012 p 24)
The purpose of this AETA 2013 Model Update report is to present findings arising from a
review of specific technologies by BREE This review was assisted by comments made by
the AETA Project Steering Committee (PSC) members and AETA Stakeholders Reference
Group (SRG) WorleyParsons was commissioned to review cost parameters for the
technologies considered in the AETA 2012 model Given the fast changing nature of solar
and wind technology operating costs especial emphasis was placed on reviewing OampM costs
for wind and solar technologies Changes to the model for the 2013 update are discussed in
the following sections
11 Background to the AETA 2012 report
BREE engaged WorleyParsons in 2011-12 to develop cost estimates for 40 electricity
generation technologies under Australian conditions for AETA 2012 The AETA cost
estimates were developed with the active collaboration of the Australian Energy Market
Operator (AEMO) which utilised the AETA cost estimates for its National Transmission
Network Development Plan (NTNDP) In addition the Commonwealth Scientific and
Industrial Research Organisation (CSIRO) provided technical advice as part of the AETA
project steering committee The AETA 2012 provided technology costs for the years 2012
2020 2025 2030 2040 and 2050 These technologies encompass a diverse range of
energy sources including renewable energy (such as wind solar geothermal biomass and
wave power) fossil fuels (such as coal and gas) and nuclear power (Appendix A) Since its
publication in July 2012 more than 1000 requests have been made from BREE for the
AETA 2012 cost estimates (model) by domestic and international sources
12 Methods and Assumptions of the AETA 2012 Report and Model
121 Macro assumptions
Key macroeconomic assumptions are consistent with those detailed by the Australian
Energy Market Operator in its National Transmission Network Development Plan and by
the Australian Treasury (see BREE 2012 for a full set of assumptions)
13
122 Technical assumptions
all technologies were costed on a consistent and transparent basis with itemisation of
component costs
capital costs included direct (eg engineering procurement and construction) and
indirect (eg owners) costs but exclude transmission and decommissioning costs
future cost estimates included assumptions about the exchange rate productivity
variation commodity variation and technology improvements
fuel cost estimates were based on ACIL Tasman projections and
projected growth rates for future operating and maintenance costs were provided
123 Levelised cost of energy (LCOE)
LCOE can be interpreted as the long-run marginal cost of electricity generation Key
factors used to calculate LCOE by technology include amortisation period discount rate
capacity factor CO2 emissions factor CO2 capture rate emissions price CO2 storage cost
fuel cost variable and fixed OampM cost and the capital cost
LCOE is a key comparative cost indicator across technologies that is expressed in real
Australian dollars per Megawatt hour of electricity generation ($MWh) The LCOE is the
price at which electricity must be generated from a specific plant to break even taking into
account the costs incurred over the life of the plant (capital cost cost of capitalfinancing
operations and maintenance costs cost of fuel emissions price if applicable and CO2
sequestration) While LCOE is an invaluable tool for comparing technology costs power
generation companies andor investors who wish to choose a technology to deploy would
also need to consider other criteria such as site-specific costs technology performance
characteristics and experience with the technology prior to any final investment decision
AETA cost estimates are developed to provide design basis and plant characteristics
performance parameters capital cost estimates fuel cost estimates OampM cost estimates
and LCOE estimates
Regional impacts on capital and operating costs have been incorporated in the analysis
These regions include Victoria New South Wales (including ACT) South Queensland
(incorporating the South East Queensland and Central Queensland AEMO regions) North
Queensland (incorporating the North Queensland AEMO region) Northern Territory
North WA (Pilbara region) South WA (the South West Interconnected System region)
South Australia and Tasmania
13 Methodology of the AETA 2013 Model Update
As part of the AETA 2013 Model Update BREE invited submissions from the AETA
Steering Committee and the Stakeholder Reference Group to provide commentary and
recommendations on the AETA 2012 Report and Model Eight written submissions were
received in this regard Changes were only recommended where specific substantiated
changes were received The AETA 2013 model has been updated in accordance with the
above consultations and under the same macro economic and technical assumptions as in
AETA 2012 The AETA 2013 model is freely available on request from BREE
(infobreegovau)
Within this context this report provides updated costs based on
14
relevant Australian and international reports on generation technologies that have been
published since AETA 2012 or have been newly discovered
new public domain information
new information from private sources that could be obtained
in-house experience of WorleyParsons and
input on OampM costs and learning rates from a number of industry stakeholders
This AETA 2013 Model Update report provides supporting explanations and references and
justifies amendments to the cost parameters of technologies especially the OampM costs for
wind and solar technologies that were covered in AETA 2012 model
131 Caveats on the use of LCOE
LCOE provides a generalised cost estimate and does not account for site specific factors
that would be encountered when constructing an actual power plant As a result the costs
associated with integrating a particular technology in a specific location to a specific
electricity network are not considered
Projected LCOE does not necessarily provide a reliable indicator of the relative market
value of generation technologies because of differences in the role of technologies in a
wholesale electricity market For example projected LCOE does not provide a direct
indicator of electricity demand or generation in isolation with other emissions abatement
policies Similarly many technologies involve integration costs in addition to the LCOE to
be able to reliably supply to the system The value of variable (or intermittent) power plants
(such as wind and solar) will depend upon the extent to which such plants generate
electricity during peak periods and the impact these plants have on the reliability of the
electricity system Unlike dispatchable power plants (such as coal natural gas biomass
and hydroelectric) ndash which are reliant on some form of stored energy (eg fuels water
storage or battery storage) ndash wind and photovoltaic power plants do not typically include
energy storage Dispatchable plants such as coal or gas fired plants may involve negative
externalities (environment fuel disposal or insurance costs etc) which are not always
reflected in their LCOEs
The AETA LCOEs are restricted to only utility-scale or large scale technologies
Consequently small-scale technologies (eg small roof-top photovoltaics fuel cells co-
generation and trigeneration) that may be relevant to distributed generation were not
included in the AETA 2012 analysis LCOE cost estimates associated with distributed
photovoltaics are likely to differ substantially from utility-scale photovoltaic systems as a
result of differences in component costs (eg capital costs operating and maintenance
costs) and performance characteristics (eg capacity factor)
132 Organisation of the report
This report is organised in five sections After a brief introduction and purpose of the report
in this section section 2 discusses the changes made to the AETA 2013 Model parameters as
a result of the discussions with Stakeholders and Steering Committee members on the
individual issues and technologies Section 3 presents the issues that were considered but did
not result in the AETA Model parameter changes Section 4 presents in detail the OampM cost
15
changes for wind and solar technologies covered in AETA 2012 Updated LCOE graphs as
well as a comparison of the resultant AETA 2013 Model and AETA 2012 Model LCOEs are
presented in section 5 which also presents concluding comments
16
2 AETA MODEL PARAMETER CHANGES
21 Stakeholder Initiated Changes
Consultations for the AETA 2013 Model update identified the following issues for
consideration
nuclear technology capital costs and lsquofirst year available for constructionrsquo
CCS retrofit thermal efficiency
amortisation period for all technologies and
OampM costs
The OampM issue is discussed in section 4 whereas rest of the issues are discussed below
211 Nuclear Capital Costs
The AETA 2012 report and model presents costs for first of a kind (FOAK) and Nth of a kind
(NOAK) nuclear technologies There could have been some confusion from the original
wording of Section 310 of AETA 2012 report It starts by discussing Gen III plants currently
sold (presumably NOAK) however further in the document Gen III plants are referred to as
FOAK The AETA 2012 report states that the capital costs are based on nuclear power plants
in the US The NOAK value is what is represented in Table 3101 in the AETA 2012 report
and model
Although there are cost adjusting factors used for other technologies studied in the AETA
2012 report there is no adjustment of the US cost base for Australian labour costs and for
adjustment of Australian equipment costs Submissions indicated that an adjustment to costs
should also be used for nuclear to ensure there is commonality in the comparison
This suggestion was considered appropriate and adjustment to the costs for nuclear
technologies was made Based on the factors to convert US rates to Australian rates used in
the fossil fuel technologies ie the factors from the Thermoflow software the new nuclear
capital costs were calculated The multiplier from Thermoflow for labour costs is 205 and
the factor for equipment costs is 13 both US to Australia
Additionally it was submitted that the first year available for construction of nuclear
technologies be extended In support of this the submission argued that nuclear technologies
are examples of generation technology where legislation regulation and public policy
planning is highly region-dependent and must therefore precede deployment by several years
This was considered an appropriate submission and therefore the first year available for
construction in the model has been changed from 2012 to 2020 These changes are shown in
Table 1
17
Table 1 Model Changes Nuclear Technologies
AETA 2012 report reference AETA 2012 model value AETA 2013 update
Technology 37 Nuclear (GW Scale LWR)
Change first year available for Construction
2012
2020
Technology 37 Nuclear (GW Scale LWR)
Convert FOAK Capital Cost to Australian productivity
and commodity costs
4210
6392
Technology 37 Nuclear (GW Scale LWR)
Convert NOAK Capital Cost to Australian productivity
and commodity costs
3470
5268
Technology 38 Nuclear (SMR)
Convert FOAK Capital Cost to Australian productivity
and commodity costs
7908
11778
Technology 38 Nuclear (SMR)
Convert NOAK Capital Cost to Australian productivity
and commodity costs
4778
7116
The overall impact of these parameters on individual technology LCOE changes is given in
the AETA 2013 Model and in Section 5
212 Carbon Capture and Storage (CCS) Retrofit Thermal Efficiency
Subcritical coal technologies with CCS retrofit were reported to have only slightly lower
thermal efficiency values compared with new build supercritical technologies with CCS in
the AETA 2012 Model This was an oversight in the AETA 2012 Model
The AETA 2012 report identified the thermal efficiency to retrofit subcritical brown and
black coal plants as 216 per cent and 301 per cent respectively (Table 312) In the same
table the efficiency for new build supercritical brown and black coal plants is reported to be
208 per cent and 314 per cent respectively
The thermal efficiencies were revised down based on actual operating efficiencies of existing
coal facilities in Victoria and NSW and factored based on the thermal efficiency ratio of new
coal facilities with and without CCS
A reduction in thermal efficiency is to be expected when applying a retrofit CCS to the plant
The CCS factor in the following representation refers the efficiency reduction factors for
adding CCS to a coal fired power station The useful output will reduce from the new
parasitic loads to run the CCS equipment
Thermal efficiency of existing brown coal plant in Victoria is 265 per cent and the CCS
factor is 064 Similarly the thermal efficiency of existing bituminous coal plant in NSW is
355 per cent and the CCS factor is 075
Table 311 and 312 of the AETA 2012 report show a reduction is present when comparing
the supercritical with no CCS compared to supercritical with CCS However the retrofit case
was only provided for the subcritical technology only and no case was included in the AETA
2012 for a subcritical plant with any CCS
A review of the values in Table 312 through comparison to the existing efficiency of
installed black and brown coal fleet in Australia was undertaken For brown coal the current
18
sent out thermal efficiency is 265 per cent for a 500 MW subcritical unit For supercritical
brown coal without CCS the sent out efficiency is 323 per cent Applying the same reduction
factor the thermal efficiency with CCS retrofitted should be 17 per cent in lieu of 216 per
cent as published in AETA 2012 report
For black coal the current sent out thermal efficiency is 355 per cent for a 660 MW
subcritical unit For supercritical black coal without CCS the sent out efficiency is 419 per
cent Applying the same reduction factor the thermal efficiency with CCS retrofitted should
be 266 per cent in lieu of 301 per cent as published AETA 2012 report (Table 2)
Table 2 Model Changes CCS Retrofit Thermal Technologies
AETA 2012 report reference AETA 2012 model value AETA 2013 update
Technology 8 Pulverised coal subcritical plant
with post combustion CCS based on brown coal
(retrofit)
Thermal Efficiency
216
170
Technology 12 Pulverised coal subcritical plant
with post combustion CCS based on bituminous
coal (retrofit)
Thermal Efficiency
301
266
19
213 Amortisation period
There was stakeholder consensus that the operating period for all technologies needs to be set
to thirty years and that the construction time is in addition to the operating time The financial
amortisation period is common for all technologies and is set at 30 years In the AETA 2012
model section 24 (a) nominates that the amortisation period of 30 years is from the
commencement of construction The amortisation period has now been changed (Table 3)
Examples of the change are
Nuclear LWR ndash GW scale In AETA 2012 report amortisation period was 30 years inclusive
of construction and operation The amortisation period has now changed to 36 years (30
operating and 6 years construction)
Solar parabolic trough In AETA 2012 report amortisation period was 30 years inclusive of
construction and operation The amortisation period has now changed to 33 years (30
operating and 3 years construction)
Table 3 Model Changes amortisation period
AETA 2012 report reference AETA 2012 model value AETA 2013 update
Common Amortisation period
for construction and operation
Amortisation period for
operation includes
construction for all
technologies
Amortisation period for
operation to exclude
construction for all
technologies
22 No Carbon Pricing
For the 2013 AETA update the carbon price modifier has been set to zero per cent as the
base value for the results presented in this report with the effect of applying a zero carbon
price to all technologies throughout the study period to 2050 The AETA 2013 Model
however has the option of changing this parameter by the user
20
3 CONSIDERATION OF OTHER ISSUES
This section summarises the issues that were discussed during the AETA 2013 Model Update
with AETA stakeholders but have not led to a change in the model However these issues do
not cover the OampM costs considerations that are detailed in section 4
31 Representation of Uncertainty
The recognition of uncertainty within the model was discussed including both the level of
representation and potential uncertainties with respect to First-of-a-Kind and lsquoEarly Moverrsquo
Technologies
A number of factors were identified that lead to uncertainty in estimates ndash particularly for
emerging technologies For conventional coal and gas technologies even though the
technology is mature the addition of carbon capture introduces cost and performance
uncertainty Cost estimates have inherent uncertainty due to the market uncertainties and
unforeseeable technological developments and due to
- Volatility in equipment pricing
- Volatility in economic conditions (during post Global Financial Crisis) and
- Volatility in labour pricing due to ldquootherrdquo heavy construction projects in specific areas
For technologies where the costs are well understood it was considered that the error bars
should be reduced compared to immediate and emerging technologies and that the error bars
should be lower for technology costs in 2012 compared to later years
There is strong agreement from two key stakeholder submissions with all the factors causing
uncertainty that have been identified in AETA 2012 In particular the labour cost has varied
(increased) significantly due to large construction projects which have increased costs due to
a shortage of labour and a lower productivity due to less experienced personnel The
uncertainties provided in the AETA model are available on a per technology and a per
selected years basis BREE will consider whether or not to include more detail on
uncertainty by technology in the 2014 review of the model
32 Application of Learning Curves
It was raised during the consultation process that the AETA model revision could allow for
learning curve cost reduction assumptions to be altered by the end user This has not been
incorporated in the 2013 update as it is a structural change to the AETA Model
Stakeholders also raised the question as to whether it is possible within the application of
learning curves to distinguish between the potential for cost reductions on manufactured
components like PV panels versus the Balance of Project (BoP) costs which may involve
routine assembly and erection activities which are not subject to significant learning by
doing
However there are opportunities for cost reductions particularly where many repetitive tasks
are involved such as solar field construction modular construction techniques
rationalization of components in the BoP design or reduction in assembly or placement time
21
This is supported in the US Solar Market Insight Report 2012 (Kann 2012) which identified
continued savings in inverter and racking costs as follows
ldquohellip falling equipment costs and fine-tuning of installation practices have made large-
scale solar less expensive QQrdquo
ldquohellip with the continuing maturation of the industry we expect continued focus on
reducing PV balance-of-systems costs (BOS) and that the increased worry over high
penetration PV will drive adoption of 1000Vdc and advanced inverters
respectivelyrdquo and
ldquoMounting structure manufacturers noted that the past year has seen tremendous
pricing pressure accounting for price declines of anywhere between 10 per cent and
30 per cent over the past yearrdquo
Given that the balance of plant costs can also be subject to cost reductions it is not
considered necessary to distinguish learning curves for discrete project costs in the model
33 General Costs Considerations
331 Fuel Costs
The outlook for fuel costs for gas coal and carbon was claimed to have materially shifted
since the AETA 2012 model While there was no evidence provided to support this
consideration will be given to this issue in the 2014 model update
332 CCS Costs
A submission cited the ZeroGen Case Study and sought to clarify the differences in CCS
cost between ZeroGen and lower values estimated for AETA 2012 This is a valid
comparison however BREE notes the following issues which contribute to explaining the
differences The international cost component is as follows AETA 52 per cent ZeroGen 34
per cent With the USD exchange rate AETA 1 ZeroGen at 08 adjusting the AETA value
for exchange rate variation would add A$952kWnet to the AETA value There is a
difference in plant size with AETA at 557 MW net and Zerogen 400 MW net A bigger plant
size would typically provide a lower cost kW installed
Additionally section 112 of Chapter One of the ZeroGen report advises escalation based on
project delivery from 2011 to 2017 AETA costs are for 2012 basis and do not include
escalation beyond this time A portion of the Zerogen costs will be inflated over the
comparable AETA cost Also section 113 of Chapter One of the ZeroGen report identifies
significant enabling works This is likely to be more inclusive than considered in the AETA
2012 report as identified in section 23 (a)
Overall it is considered likely that a number of estimate basis items in the ZeroGen study are
different and once equalised will show a smaller difference between the AETA and
ZeroGen values Therefore there is no immediate action but the basis and assumptions of the
model may be reviewed during 2014 AETA update
With regard to CCS efficiency one submission proposed that the AETA estimates were
overly optimistic However no references were cited to support this view and no change has
been made to the model
22
333 Opportunity Costs
A submission was made that footnotes be included regarding retrofit costs to indicate that
make-up power costs are not included This was not adopted because AETA parameters for
each technology are calculated for that technology alone and do not consider the impact of
reduced output of a retrofit project where additional output needs to be generated from
alternate higher cost generation Opportunity costs are specifically related to business cases
for specific projects and are not considered for any cases presented in the AETA report
Moreover retrofitting does not make electricity generation uncertain or intermittent It only
lowers the flow of generation at a constant rate (due to lower thermal efficiency) relative to
the non-retrofit case
34 Capital and Construction Costs
A submission was made to update the AETA values for the mid-point capital cost for several
technologies based on a study provided in support of the submission The technologies
asserted were
IGCC (Integrated Gasification and Combined Cycle) with 90 per cent capture fuelled
with Victorian brown coal
IGCC with no capture fuelled with black coal
IGCC with 90 per cent capture fuelled with black coal
Pulverised Fuel power plant with 90 per cent capture fuelled with Victorian brown
coal
Pulverised Fuel power plant with 90 per cent capture fuelled with black coal and
OCGT with no capture fuelled with natural gas
There is a key difference in the magnitude of the labour component in Australia compared
with the labour costs associated with the supporting material (from the USA) While no
changes have been made to the model in this update the ldquoshort termrdquo impact of labour
pricing on technology costs may be considered in further updates
Similarly it was submitted that the capital cost values for combined Cycle Gas Turbine
(CCGT) (with and without capture) could be revised As no documentary evidence was
provided to support this no change was made
For Direct Injection Coal Emulsion (DICE) power plant with no capture fuelled with
Victorian brown coal it is also suggested that the values be reviewed with a number of
papers provided for reference However these papers do not address capital cost in any depth
and it is unclear if the balance of project costs included are comparable with AETA DICE
technology is not mature and is probably best described as in the demonstration to
deployment phase of development which brings uncertainty into the cost analysis Therefore
data is needed to substantiate this submission As this was not available at the time of
preparing this report consideration of this issue is deferred to a later time when the necessary
data is available
An increase in the capital costs for Solar thermal trough (6 hrs storage) and Solar thermal
central receiver (6 hours storage) were proposed based on a supporting study by the Electric
Power Research institute (EPRI) The proposed values are substantially larger than the AETA
23
2012 but it is not clear what basis is used to generate these revised values A separate
submission received from another AETA stakeholder has supported the AETA values
Additionally the cited reference for solar thermal trough the Energy Power Research
Institute (EPRI) plant configuration is based on air cooling ndash while for AETA the plant
configuration assumes water cooling The difference in plant configuration will account for a
small part of the difference The AETA value is based on a reference report as issued in 2012
by the US National Renewable Energy Laboratory (NREL 2012)
The AETA value for the central receiver technology is based on a small (20MW) plant
(Gemasolar) with factors for adjustment to field size for thermal storage capacity and post
FOAK learning These factors will align with increased uncertainty in the AETA value It is
likely that additional cost information may now be available for the Brightsource Ivanpah
plant (no storage) and other tower plants being considered under construction
Further investigation of these issues has been sought with stakeholders but is as yet
unavailable
Another suggestion was made to consider capital costs on a component basis The capital
costs used in AETA 2012 for existing technologies were based on actual costs that could be
sourced on published documents (locally andor internationally) or from WorleyParsons
internal data For developing technologies costs were not considered on a component level
For this reason in technologies that are not commercialised a number of assumptions would
need to be made which may limit lsquorealrsquo costs being available No change to the model arose
from this submission
A reassessment of the construction expenditure profile for concentrating solar power (CSP)
technology options was sought in another stakeholder submission and supported by a
referenced report (IT Power 2012) However the plant sizes considered in the AETA report
are larger capacity (100 MW+) than those discussed in the cited report and consequently
have a longer duration construction period As three years is considered to be an appropriate
time period to spread the construction expenditure profile no change to the model was made
35 Costs Associated with Solar Technologies
A change to the model was sought with regard to the significant downward trends in the cost
of solar PV The stakeholder submission cited pricing data from the Australian Photovoltaic
Institute (APVI) Consultation with the APVI identified that evidence based information for
utility scale PV costs in Australia is limited because Australia has no PV systems 100 MW or
larger It is acknowledged however that there is significant and continued volatility in the
solar PV market including volatility due to competition oversupply in the PV module
market as well as continued price reductions for balance of system and installation costs
A$338 Wnet was a reasonable valuation for 2012 AETA The AETA 2012 value will be
maintained but may be reviewed in the 2014 model update
It was also suggested that solar thermal costs could be better represented in the model by
allowing for different periods of storage rather than a standard 6 hours The AETA 2012
scope was based on fixed plant designs which included fixed thermal storage sizing where
thermal storage was included With thermal storage there are a number of variables that can
be considered including differing field sizes (solar multiple) as well as actual thermal storage
capacities This is likely to add significant complexity to the report and to the model the
benefit of which at this stage does not warrant the changes
24
36 Costs Associated with Nuclear Technologies
It was submitted that consideration be given to including the impact on LCOE for nuclear
technology of the relatively high insurance costs for nuclear technologies This issue will be
considered in the 2014 review of the AETA model However insurance costs or plant
decommissioning costs are not considered for any of the 40 AETA technologies
Also the OampM improvement rate for Nuclear was not reconsidered as there is no OampM
improvement rate for Nuclear in the model
37 Further Technologies
A proposal was received which recommended that further technologies (DICE power plant
based on black coal with and without capture and DICE brown coal with capture and
medium speed DICE technologies) be incorporated into the AETA Model However as
mentioned earlier this update of the AETA 2012 Model only considered the technologies
included in that model This update of the model is not intended to broaden the technologies
38 Auxiliary Loads
Another example used for the purposes of drawing comparisons with the AETA model was
the SaskPower Post Combustion Retrofit It is difficult to distil the SaskPower project data
into a direct comparison with the AETA study and consequently there is insufficient data
certainty to warrant changes to the AETA 2012 values The SaskPower Post Combustion
Retrofit was also cited as to its conservative auxiliary loads for brown and black coal
However upon further investigation this was not substantiated within the SaskPower
example
25
4 WIND PV AND CSP OPERATIONS AND MAINTENANCE (OampM) COST UPDATE
41 Operation and Maintenance Costs
OPERATING AND MAINTENANCE COST DEFINITIONS
In considering the costing of OampM there is no absolutely clear definition of which costs
should be considered as fixed and which variable with the breakdown varying based on a
range of issues including technology location and resource type For this reason in the future
AETA reports OampM costs may be compared in terms of annual total operating expenditure
(OPEX) per MW of generation This method is widely used by most international institutions
to analyse OampM costs and to avoid subjective considerations
For this report fixed and variable costs are reported to provide direct comparison with AETA
2012 In this regard in general fixed costs are independent of the electrical generation of the
plant and are expressed as annual cost per MW capacity Fixed costs include items such as
fixed labour
equipment and
vehicles
Variable costs are proportional to the electrical generation of the Plant and are expressed as
cost rate per kWh energy output Variable costs include items such as
variable labour
consumables and
spare parts
As both public and private domain material vary in the way they approach and report on
fixed and variable maintenance within the following text where an interpretation has been
used for comparison purposes this is described
A submission was made to remove the operations and maintenance (OampM) cost escalation
factors This was not taken up as there is an increase in the OampM costs over CPI which is
borne out historically A review of the basis for this escalation determined that the
underlying assumptions were appropriate The review also considered adopting a generic
learning curve approach for OampM improvement rates as was suggested in one submission
This was not adopted as the model has an OampM improvement rate (set at 02 per cent per
annum) which can be varied by the user for wind and solar technologies This value accounts
for more efficient practices balancing the increase in labour and material costs over and
above CPI However changes to OampM improvement rates for selected technologies were
made as mentioned earlier OampM improvement rate values may be further considered for
emerging technologies in 2014 AETA study
A number of submissions referred to the improvement rate of OampM costs with evidence for
existing technologies to support these rising at 150 per cent CPI It was suggested that for
26
developing technologies it could reasonably be assumed that there would be reductions in
OampM between the first commercial installation and subsequent installations
While it is generally acknowledged that the LCOE of delivered energy from wind is falling
within the literature there is conflicting evidence around trends in OampM costs with recent
reports indicating both significant decreases and increases in OampM (see section 432)
Solar thermal plants consist of technology components that can be considered mature (eg
steam turbine) and components that are undergoing further development such as the solar
field and thermal storage Solar thermal plants require manning for operation as opposed to
wind turbines that do not require the same level of manning
A recent article (Muirhead 2013) advised for the Solar Energy Generating Systems (SEGS)
plants in California that have been operating since the early 1990rsquos ldquoMy understanding is
that the performance of the SEGS plants has significantly improved over time This is due
primarily to replacement of first generation receivers with newer receivers that are much
more efficient OampM practices at the plants have also improved over time based on the now
long history of operating these plants resulting in increased output in addition to reduced
OampM costs
In the AEMO report 100 Per Cent Renewables Study - Draft Modelling Outcomes Scenario 1
assumes that rapid technology transformation will drive real reductions in OampM costs
outweighing any increases projected in the AETA 2012 so OampM costs reduce by 125 per
cent by 2030 and 25 per cent by 2050 Scenario 2 uses the AETA 2012 assumption that
OampM costs escalate at around 150 per cent of Consumer Price Index (CPI) which leads to
cost increases of 27 per cent by 2030 and 46 per cent by 2050 It should be noted that the
Scenario 1 reductions are assumptions without further analysis of what will bring the
assumptions to fruition
In AETA 2012 the common OampM improvement rate for most technologies is set at 02 per
cent and can be varied as a user input The OampM improvement rate for emerging
technologies solar thermal and photovoltaic technology options and offshore wind is set to
25 per cent and can also be varied as a user input The improvement rate is now compounds
on the previous yearrsquos value
The OampM improvement rate values may be further considered for emerging technologies in
2014 AETA study
42 Operating and Maintenance (OampM) Changes in summary
As part of the Model Update special emphasis was placed in this report on the Operational
and Maintenance (OampM) costs and OampM improvement rates for all wind solar thermal and
solar PV renewable technologies covered in AETA 2012 As mentioned earlier this took into
account relevant Australian and international reports public domain information private
sources as well BREE and WorleyParsonsrsquo in-house experience The updated OampM values
are shown in Table 4 Reductions in CSP OampM costs of between 8 per cent and 27 per cent
were obtained in comparison to values provide in AETA 2012 report
The review included a detailed review of a report by IT Power cited as part of one of the
stakeholder submissions In that report reference is made to a case where $18MWh of OampM
costs comes from 64MW trough plant however it does not specify the relevant location hour
27
of thermal energy storage (TES) capacity factor type of cooling and back-up fuel and
therefore cannot be fully analysed nor used towards this AETA update
OampM costs for solar thermal plants are significantly affected by the costs of manpower To
demonstrate this with an example $18MWh for a 100MW plant with a 23 per cent capacity
factor (the IT Power report consideration) would result in an annual OampM cost of
approximately $36 million A 100MW plant will need at least 28 full time employees to be
properly manned 7 daysweek as there needs to be multiple shifts With this amount of
labour there are insufficient funds for site services utilities and materialsmaintenance If the
value is based on another location such as the Far or the Middle East region where labour
costs are significantly lower then a lower OampM cost may be feasible however for Australia
this does not appear to be feasible
The changes to OampM values for the 2013 AETA model refresh are summarised below
Table 4 Model Changes OampM costs
AETA 2012 report reference AETA 2012 model value AETA 2013 update
Section 23 Technical Assumptions
Operating and Maintenance Cost
Estimates
OampM improvement rate 02per
cent all technologies
OampM improvement rate maintained at
02per cent for
Coal based technology options
Gas based technology options
Solar thermal hybrid options
Onshore wind
Biomass technology options
Wave technology options
Geothermal technology options
Nuclear technology options
OampM improvement rate changed to 25per
cent for
Solar thermal technology options
Photovoltaic technology options
Offshore wind
The OampM improvement rate is compounded
from the previous yearsrsquo value
Section 33 Solar thermal
technologies
Solar thermal - Parabolic Trough wo
storage
Fixed OampM (AUS$MWyear)
Variable OampM (AUS$MWh)
60000
15
59176
1519
Solar thermal - Parabolic Trough with
storage
Fixed OampM (AUS$MWyear)
Variable OampM (AUS$MWh)
65000
20
72381
1139
Solar thermal - central receiver
technology wo storage
28
AETA 2012 report reference AETA 2012 model value AETA 2013 update
Fixed OampM (AUS$MWyear)
Variable OampM (AUS$MWh)
70000
15
58285
707
Solar thermal - central receiver
technology with storage
Fixed OampM (AUS$MWyear)
Variable OampM (AUS$MWh)
60000
15
71312
565
Solar thermal - Linear Fresnel wo
storage
Fixed OampM (AUS$MWyear)
Variable OampM (AUS$MWh)
60000
1500
64105
1519
Solar thermal - Linear Fresnel with
storage
Fixed OampM (AUS$MWyear)
Variable OampM (AUS$MWh)
65000
20
72381
1139
Section 35 Photovoltaic
technologies
PV ndash non tracking
Fixed OampM (AUS$MWyear)
25000
25000 (no change)
PV - Single Axis Tracking
Fixed OampM (AUS$MWyear)
38000
30000
PV - Dual Axis Tracking
Fixed OampM (AUS$MWyear)
47000
39000
Section 36 Wind Technologies
Wind Onshore
Fixed OampM (AUS$MWyear)
Variable OampM (AUS$MWh)
40000
12
32500
10
Wind Offshore
Fixed OampM (AUS$MWyear)
Variable OampM (AUS$MWh)
80000
12
77600
30
43 Wind
431 Introduction
This Section reviews onshore and offshore wind operations and maintenance (OampM) costs
used in AETA 2012 The values scrutinised are the fixed and variable OampM given in Table
361 of that report summarised in Table 5 below
29
Table 5 Wind OampM costs used in the AETA 2012 report
Option Fixed OampM (AUS$MW) Variable OampM (AUS$MWh)
Onshore 40000 12
Offshore 80000 12
OampM covers all of the services required to keep the wind farm operating as contracted to
supply energy and renewable energy certificates for its lifetime inclusive of
turbines and all balance of plant (roads buildings electrical equipment SCADA
control equipment) up to the high voltage connection point on the wind farm
substation
labour (both trades and professional)
facilities (workshops stores offices)
equipment (tools jigs vehicles rigging safety equipment craneage)
spare parts and
consumables (such as oil grease and office consumables)
Windfarm size was not specified in AETA 2012 however it was noted that wind farms
greater than 100MW are becoming more common Since then within Australia wind farms
of larger and smaller sizes have been constructed for example the 420 MW Macarthur Wind
Farm in Victoria and the 55 MW Mumbida Wind Farm in Western Australia with both larger
and smaller wind farms under proposal For this review a nominal size of 100-150 MW is
used as representative of current and future facilities
432 Review of Evidence
As mentioned earlier the review of public literature by BREE and WorleyParsons the
procurement of private studies consultations with owneroperators in the wind farm OampM
sector in Australia AETA Stakeholders and project Steering Committee members were used
to assist the current Model Update process Where possible these sources are noted in the
text however some of these sources have asked to remain anonymous and where so the
term ldquoprivate sourcerdquo has been used
As noted by one reviewer in NREL 2011 OampM cost information in the public domain in
both quantum and quality is poor and the situation appears no better in 2013 particularly in
the discrimination of fixed and variable costs One reason for this is the commercial and
increasingly competitive nature of the sector with wind farm OampM now a significant
business worldwide with subsequent confidentiality around actual costs
What constitutes wind farm OampM is also changing This is driven in part by technological
change as the wind fleet ages as new turbines become larger and more sophisticated
particularly offshore Competition in the provision of OampM services is also changing with
maturing of the wind energy product As an example the following industry trends are now
evident
30
a growing role of independents in the wind OampM market ndash around 25 per cent of the
wind fleet in the US is expected to be operated and maintained by independents by
2025 (Ebert and Ware 2013) as opposed to original equipment manufacturers (OEMs) -
wind is largely a commodity market and easier for new participants to enter something
not necessarily seen with other generation technologies
tighter supply markets ndash general economic volatility is tightening the supply and
project development chain for wind moving interest into the OampM sector bringing
price volatility and more competition
a more sophisticated asset management model ndash where OampM providers are linking
operational data with long term condition monitoring output forecasting and work
order scheduling to deliver what is termed ldquolifecycle optimisationrdquo squeezing more
energy out of the asset
older turbines exceeding planned maintenance budgets ndash with the chief issue being
keeping the variable OampM from unforeseen breakdowns
a push for larger turbines particularly offshore (5-10 MW) and in deeper waters and
linking OampM to turbine contracts ndash there is evidence (including in Australia private
source) that wind farm OampM is becoming an even more significant bargaining
component of turbine supply contracts where lower supply costs are balanced by
longer OampM contracts
Costs of wind OampM are difficult to summarise as they are dependent on many issues As just
one example in the NREL 2011 study cited earlier a wide variability in wind farm OampM
costs was found across a range of countries (Figure 1) This reference demonstrates this
variability from the average reference case in terms of Levelised Cost of Energy (LCOE)
31
Figure 1 Effect of country variables on LCOE of wind plant
Source NREL (2011)
Other issues which affect the contracted cost of OampM for wind include
regional variations in labour and transport costs
wind farm environment particularly wind regime and proximity to the ocean
(corrosion)
the maturity and availability of wind turbine technicians
the spread of facilities geographically and the wind farm asset sizes in a portfolio
the turbine type and brand particularly the support establishment within a Region
the age of the asset OampM history and existence of Type (or systematic) failures of
major components
the ability of the OampM provider under the contract to source third party spares andor
try varied maintenance practices and
the nature of the OampM contract ndash for example does it include risk reward elements or
have a link to the wind turbine supply contract or is it a ldquoproduction availabilityrdquo
contract type
While it is generally acknowledged that the LCOE of delivered energy is falling for wind
technology (Hand 2013) within the literature there is conflicting evidence around trends in
OampM costs with recent reports indicating both significant decreases (BNEF 2013) and
increases (Ebert and Ware 2013) It is generally acknowledged that increased competition in
the OampM market is delivering lower cost service provision but this may in part be offset by
an ageing fleet requiring more variable maintenance and a more sophisticated and costly
32
response Several studies have demonstrated that the costs of maintaining wind turbines
generally increase with time following a trend similar in shape to that in Figure 2 (Hand
2013) with estimates in Albers (2009) indicating a doubling in turbine OampM costs by mid
plant life The term COD in Figure 2 refers to commercial operations date
Figure 2 Typical cost increasing trends in wind farm OampM costs with commercial operations
date
Source Adapted by WorleyParsons from Houston (2013)
In Australia this trend is also evident in post 10-year aged machines (private source)
particularly in relation to variable maintenance The nature of any similar increase with more
modern turbines is unpredictable although turbine availability is improving and there is
evidence that OampM costs with each generation of turbine are lowering see Wiser et al
(2012)
The OampM costs for offshore wind farms are particularly difficult to estimate as the industry
is still at the early stages of development including the progression of much larger turbines
into deeper water and the more complex nature of the task Such progression is indicated in
Figure 3 taken from RolandBerger (2013) which indicates an expected decrease in OampM
costs These costs are of the same order of that published in other recent publications UK
Crown Estate (2012) and US DoE (2013)
33
Figure 3 Trends in offshore wind farms and estimated impact on LCOE
Source RolandBerger (2013)
433 Updated OampM Figures for Australia
It is not a simple matter to transfer international costs to Australia as despite trends there are
significant differences between regions including
size of market ndash despite growth the Australian wind market is small with respect to
other world regions For example the total wind fleet is 4 GW (CEC 2013) for
Australia versus 60 GW for the US (AWEA 2013)
labour and material rates in certain parts of Australia are high by world standards
the logistics of getting to and within Australia generally involve longer distances than
other areas of the world particularly due to the remoteness from major equipment
suppliers
volatility of the Australian dollar particularly against the US and
the size of Australian wind farms tends to be larger
These differences can be seen in Figure 4 supplied by a turbine equipment supplier (private
source) and showing the relative OampM costs (per MW) and technician numbers (per 100
MW) across various world regions in 2012 for wind turbine maintenance only and excluding
balance of plant Numbers and scales between the two indices have been removed to protect
the confidentiality of this supplier with data believed to cover the entire global portfolio
under management This shows a significant difference between regions for onshore in both
indices for example almost a 45 per cent difference in costs between Europe and America
Australia would sit within ldquoAsiaPacificrdquo and while the Figure indicates generally lower
OampM costs and higher technician numbers for this region this presumably covers a very
diverse area (including South East Asia New Zealand and Oceania) which may skew results
34
Unlike many larger global markets the wind OampM sector in Australia is dominated by
turbine equipment suppliers with original equipment manufacturer (OEM) contracts
estimated to cover more than 95 per cent of the fleet The evidence for this is mostly
anecdotal although a number of smaller independent suppliers are now known to be
undertaking full service OampM for older plant (gt10+ years) with many of the drivers for this
covered in Ebert et al (2013) There is also evidence (private source) that wind turbine
suppliers in Australia are seeking OampM contracts with much longer terms and tying these to
reductions in turbine supply prices This may indicate a lack of competitive pressure on
OampM pricing in the near to mid-term and as the size of the overall market is small it is
unknown whether independents will grow market share as has been the case in many larger
global markets see for example Deloitte amp Touche (2012)
The most recent contemporary literature comments on onshore wind farm OampM pricing in
Australia and surrounds that could be found in the public domain and not used for the AETA
2012 work are from Hassan (2011) and Deloitte (2011) These are summarised with other
new international references cited in Table 6 with assumptions on any conversions noted
below the table As no offshore wind farm projects have been progressed in Australia the
table includes values from new sources for offshore projects from the international public
domain literature - the significant difference to onshore costs is evident in the values
Figure 4 OampM Costs (per MW) and Technician Numbers (per 100MW) for total wind turbine
OampM (Opex)
Source Private - values and scales removed to protect confidentiality
From Table 6 and considering the differences in markets it appears that for onshore wind the
AETA 2012 estimates may be slightly high with an updated AETA 2013 recommendation
given in Table 7 This value has been arrived at by considering
the size of the Australian wind market and lack of competitive pressure from
independent OampM service providers
35
supply side pressures on OEMs driving them to protect their OampM businesses and
lowering costs
the likely increase in fleet installations to comply with RET legislation skewing the
fleet age to more a modern generation of turbines although it is noted that there is some
uncertainty around long term OampM cost trends particularly variable maintenance ndash an
asset age of around 5 years is assumed here
uncertainties in what is included in referenced values and differences in markets and
advice from actual asset owners and OampM providers (private sources) on current actual
costs
Table 6 Comparison of AETA 2012 wind OampM estimates with new references for 2013
Source Region
Fixed OampM
(AUS$MW)
Variable OampM
(AUS$MWh)
Total OPEX
(AUS$MW)
On
sh
ore
AETA 2012 Australia 40000 12 799451
Houston 2013 US - - 35-380002
BNEF 2013 Global - - 25000
3
Private Source (2013) (gt 10 yr old
plant) Australia - - 70000
Private Source (2013)
(lt 2 yr old out of warranty plant) Australia - - 55000
Hassan 2011 Australia - - 83-99000
4
Deloitte 2011 New Zealand - - 450005
Off
sh
ore
AETA 2012 Australia 80000 12 1262526
Crown Estate 2012 UK - - 275000
7
Hassan (2013) UK - - 2391567
RolandBerger 2013 Europe - - 198000
8
US DoE 2013 US - - 144970
9
1 Assumes a 38 capacity factor
2 USAUD = 109 extrapolated from Figure approximately to 2013
3 EUROAUD = 142 uncertain if this includes all balance of plant or VOM and only includes OEM providers
4 Assumes a 38 capacity factor
5 Assumes NZAUD = 084 a 38 capacity factor and the mid-range estimate for OampM
6 Assumes a 44 capacity factor
7 Assumes GBPAUD = 167 and taking midpoint of estimates stated
8 Assumes GBPAUD = 167 and taking value for 3MW turbines
9 Assumes USAUD = 109
36
The figures shown for onshore projects in Table 7 represent a 15 per cent decrease in the
expected OampM costs of wind farms in Australia compared to AETA 2012 This change
reflects the volatility in this market noted in previous sections and in referenced material
internationally plus the appearance of significant downward pressure on wind OampM prices
primarily through increased global competition The values allow for the rising price of
turbine OampM as the turbine ages during its life
For offshore wind it appears that the OampM costs in AETA 2012 are too low and although it
is tempting to align costs with the most recent US figures due to their lower costs and similar
coastal conditions to Australia the European offshore fleet is significantly larger and more
mature Average figures across the 2013 referenced material including Europe is
recommended This is also shown in Table 7 and represents a significant increase in estimate
costs (around 33per cent) which reflects this evolving sector
There is very little contemporary information available on the breakdown of fixed and
variable maintenance on wind plant making judgment around this for the AETA requirements
is difficult However there is some published but copyrighted material eg GlobalData 2012
which combined with others (private sources) indicates that for onshore and offshore wind
plant respectively a 5050 and 4060 FOM VOM split is appropriate This has been used to
adjust the total OPEX figure in Table 7 to the AETA scheduled and variable indices
requirements using a 38 per cent and a 44 per cent capacity factor for onshore and offshore
projects respectively
Table 7 Recommended AETA (2013) values
AETA (2013) update Fixed OampM
(AUS$MW)
Variable OampM
(AUS$MWh)
Total OPEX
(AUS$MW)
Onshore $32500 $10 $65790
Offshore $77600 $30 $194000
44 Solar Photovoltaics (PV)
441 Introduction
This Section of the report focuses on the OampM costs for ground-mount photovoltaic (PV)
technologies broken down by the following mounting system configurations
Fixed Tilt (FT)
Single Axis Tracking (SAT)
Dual Axis Tracking (DAT)
Although different PV panel technology types (eg poly-crystalline mono-crystalline or thin
film CdTe) affect the capacity factor and land use the OampM costs are comparable The
estimates for this Report are based on polycrystalline PV technology which provides an
average cost on a per Watt basis with mono-crystalline OampM costs being slightly lower and
thin film OampM costs being slightly higher
With the aim to provide comparable results between technologies WorleyParsons has
analysed and updated the PV OampM costs in terms of both fixed operation and maintenance
37
costs (FOM) and total operating expenditures (OPEX) based on reference plants of similar
characteristics
Assumptions interpretations and considerations based on their in-house data and global
market trends are described in the following Sections
442 Review of the Evidence
Since the AETA 2012 report release few new public domain reports related to OampM costs
for PV systems have been published To confirm this the following organisations have been
consulted by WorleyParsons to provide the 2013 OampM costs update for the selected PV
configurations
International Renewable Energy Agency (IRENA) (wwwirenaorg)
International Energy Agency (IEA) (wwwieaorg)
The World Bank (WB) (wwwworldbankorg)
The US National Renewable Energy Laboratory (NREL) (wwwnrelgov)
Solar Energy Industries Association (SEIA) (wwwseiaorgau)
European Photovoltaic Industry Association (EPIA) (wwwepiaorg) and
Solar Electric Power Association (SEPA) (wwwsolarelectricpowerorg)
Upon review of the available information when compared to AETA 2012 the listed
organisations do not have any new public information related to large-scale PV OampM costs
If OampM costs are mentioned they are normally referenced as a per cent of the total Capital
Expenditure (CAPEX) for the plant (around 1 per cent) and provide little useful information
about OampM Cost changes
Due to insufficient detailed and recent information in the public domain WorleyParsons
obtained the following market reports from Photon a private organisation focused on market
news political discussions and technology analysis for the PV industry
Photon 2013 ldquoThe True Cost of Solar Power - Temple of Doomrdquo and
Photon 2013 ldquoSolar Annual 2013 - Build your Empirerdquo
These private reports had minimal focus on OampM costs To provide further input in this
area private OampM service providers were contacted for pricing estimates and market trends
443 AETA 2012 OampM PV costs report comparison
Typical power plant OampM costs are expressed as a combination of a variable component
(proportional to generation) and a fixed component (occurs irrespective of generated output)
Since the generation of a PV plant is dependent on solar radiation (not requiring fossil fuel or
water which make up the major components of variable costs for conventional generation) it
is typical to express the OampM costs only as Fixed OampM (FOM) costs proportional to the
plant size due to the simplicity of PV systems The AETA 2012 report follows this practice
and estimates the PV OampM costs as FOM only relative to plant size (kW) expressed on a per
year basis
38
In order to facilitate comparisons of these costs with other electricity technologies the FOM
costs in the AETA 2012 report are also presented as OPEX costs per MW of generating
capacity per year
ASSUMPTIONS AND CONSIDERATIONS
The following costs are included in the FOM estimates as an annual cost per kW capacity
labor and administrative expenses
panel washing (twice per year at $300 kl for water)
weed abatement (seasonal herbicide applications)
inverter replacement reserve (replaced at operational year 10) and
materials and maintenance spare parts civil works preventative and corrective
equipment maintenance
Although the cost of water is variable depending on location and usage it is such a small
portion of the total OampM costs that it is adequate to assume it as a fixed cost using the
assumptions listed above
AETA 2012 PV OampM COSTS COMPARISON REPORT
The technical characteristics of the reference PV plants used in the AETA 2012 report have
been extracted from the AETA 2012 Model (Version 1_0 Rev B BREE 2012) and are
summarised in Table 8
Based on this information the following parameters for the PV technologies are estimated
Total net energy production in terms of MWh sent out per year
Total plant acreage
FOM in terms of USD per year and
Total OPEX costs in terms of USD per year and USD per total net energy production
per year
39
Table 8 AETA 2012 reference plants technical characteristics and OPEX costs
Plant Characteristics Units Fixed Tilt (FT) Single Axis Tracking (SAT)
Dual Axis Tracking (DAT)
Plant Characteristics
Plant Net Capacity MW 100 100 100
Capacity Factor per cent 21 24 26
FOM $kWyear 25 38 47
Net Energy MWhyear 183960 210240 227760
Plant Acreage acres 500 800 900
Total FOM $year 2500000 3800000 4700000
Total OPEX $year 2500000 3800000 4700000
Total OPEX $kWh 00136 00181 00206
Total OPEX costs are between 00136 and 00206 USDkWh as shown in Table 8 above
These values are conservative cost estimates but reasonable for a large-scale PV plant with
comprehensive OampM service As is expected the FOM or OPEX costs increase as the plant
footprint increases and the complexity of the mounting system increases However the
increases to single and double axis tracking technologies are larger than would be expected
The increased complexity of the trackers does add costs to OampM in terms of labor parts and
even physical plant size but these additions are minor in comparison to the larger OampM
budget items such as the inverter replacement reserve and general electrical maintenance
which are irrespective of mounting system
These values although conservative still show the cost reductions from the industry learning
curve and expanded competition over the past few years when compared to past estimates of
OampM costs This can be seen in the following Table 9 of Fixed Tilt (FT) costs which
provides some estimates found in previous publications by IEA (2008) and EPRI (2010) The
tracking estimates are not shown since minimal data is available This corresponds to the
historical market trend of the industry being more willing to install fixed tilt systems rather
than tracking systems due to lower costs and technology risk
Table 9 Comparison of historical estimated PV and OampM costs in the public domain
PV Configuration OampM Costs Units IEA 200810
EPRI 2010 AETA 2012
Fixed Tilt (FT) FOM $kWyear 40 32 to 37 25
values in Italics are derived from reported data
10
Report assumed 1 of capital costs and 23 capacity factor
40
45 AETA 2013 PV OampM Costs Update
Using the same plant characteristic assumptions as the 2012 AETA Model the 2013 OampM
costs were estimated by WorleyParsons based on the references described in review of the
evidence in Section 442 The comparison of the AETA 2013 and 2012 OampM costs are
presented in Table 10 below
Table 10 2013 PV OampM costs compared to 2012 PV OampM costs PV Configuration OampM Costs Units AETA 2012 WorleyParsons
2013 Update
Fixed Tilt (FT) FOM $kWyear 25 25
OPEX $kWh 00136 00134
Single Axis Tracking (SAT) FOM $kWyear 38 30
OPEX $kWh 00181 00141
Dual Axis Tracking (DAT) FOM $kWyear 47 39
OPEX $kWh 00206 00173
Although the OampM costs for FT systems are approximately the same SAT and DAT OampM
costs reduced by around 20-30 per cent in this 2013 update compared to the AETA 2012
report The consistency of the FT costs is reasonable and expected to continue for the next
few years as discussed further in Section 451
Regarding the SAT and DAT costs although there have been improvements in the design of
trackers for PV applications this OampM cost reduction is due to a better understanding of the
costs associated with electrical and tracking system maintenance The cost differences
between tracking systems was corroborated by quotes from private OampM service companies
who indicated that there was only a slight increase in costs from FT to SAT but a larger
increase in costs from SAT to DAT
As compared to the references mentioned in Section 442 the updated cost estimates are
conservative Table 11 compares the estimated 2013 OampM costs with those references
However since these publications focused primarily on the CAPEX with very general OampM
cost assumptions the OampM costs presented therein are not considered representative
baselines for large-scale solar projects Furthermore they attest to the industryrsquos tendency to
focus strictly on installation costs and not lifecycle costs which is discussed further in Section
451
41
Table 11 2013 updated OampM costs compared to new referenced OampM costs (7-2) PV Configuration
OampM Costs
Units WorleyParsons 2013 Update
11
NREL 2013
12
IRENA 2013a
13
Photon 2013
14
Private OampM Service Providers
201315
Fixed Tilt (FT) FOM $kWyear 25 235 17 to 21 18 17 to 23
OPEX $kWh 00134 00216 to
00383
00121 to 00266
00098 00094 to 00127
Single Axis Tracking (SAT)
FOM $kWyear 30 Not provided
Not provided
Not provided
25 to 27
OPEX $kWh 00141 Not provided
Not provided
Not provided
00136 to 00147
Dual Axis Tracking (DAT)
FOM $kWyear 39 Not provided
Not provided
Not provided
32 to 34
OPEX $kWh 00173 Not provided
Not provided
Not provided
00174 to 00185
values in Italics are derived from reported data
451 OampM Learning Rates
In the rapid PV industry growth of the last three years WorleyParsons and anecdotal
experience is that PV was considered generally to require little to no maintenance causing a
general disregard for OampM planning This appears to have resulted in complications as
owners struggle to resolve reliability performance and budget issues as the projects mature
(multiple private sources) Although the maintenance costs are smaller compared to standard
power plants OampM awareness has been increasing in the industry and therefore the OampM
cost estimates have subsequently increased
This is supported through the recent focus of OampM at PV conferences (such as Sandia
National Laboratory and Solar Energy International events) on increasing the investment in
OampM practices in addition to improving the current practices products and services so that
PV plants can be better maintained to achieve higher reliability throughout the plant life
cycle Currently the majority of OampM expenses for PV systems consist of maintaining and
replacing the inverters followed by the Balance of System maintenance In general once the
appropriate level of investment in OampM for PV is reached then OampM costs will begin to
decrease as the following issues develop to maturity
technology improvement
inverter design for reliability and longevity
data monitoring for preventative and corrective maintenance support
system efficiency to increase system output for the same OampM expense
decreased capital costs for major equipment
decreased spare parts costs
11
See assumptions in Section 433 and 443 12
Report assumed 250kW rooftop at 7 to 10 capacity factor 13
Report assumed 1 of CAPEX and 9 to16 capacity factor 14
Values derived from the global weighted average calculations assuming 21 capacity factor and 20 year lifecycle Report assumed a
simple percentage of average selling price 15
Quote excluded weed abatement panel washing and inverter replacement reserve which were supplemented from the WP estimate
Calculations assumed 21 capacity factor
42
industry maturity and stability
reliable OEM support from product consistency and commercial stability
improved codes and standards for PV equipment system design installation
commissioning and OampM and
experience
trained and experienced personnel in the installation and maintenance of PV plants
In line with this trend owners system designers installers and OEMs are now including
OampM considerations in their finances designs services and products Even though there
have been and will continue to be cost reductions in OampM due to the industry maturation
stabilization and competition those cost reductions are balanced with the necessary
increases in OampM investment to meet the maintenance needs of existing and planned PV
plants resulting in a level OampM cost estimate for the next five years
Photon (2013) follows this assumption of consistent OampM costs for the next ten years as well
as WorleyParsons discussions with OampM service providers Therefore the assumption that
PV OampM costs will remain somewhat constant over the next five years before reducing again
appears to follow the projections in the industry
452 Conclusions - PV
The key findings from the AETA 2012 review and update of the PV OampM costs are as
follows
The 2013 WorleyParsons PV OampM costs update resulted in values of
$25kWyear for FT systems
$30kWyear for SAT
$39kWyear for SAT in 2012 USD
Fixed tilt configurations have not seen significant changes in OampM costs compared to
the 2012 AETA estimates while SAT and DAT configurations cost estimates have
reduced approximately 20-30 per cent based on a better understanding of the associated
OampM costs
Values obtained in the 2013 WorleyParsons update are more conservative but are
aligned with values provided by recognised international institutions even though few
detailed OampM breakdowns are available and
OampM costs for PV are expected to remain constant over the next five years before
reducing as the industry matures in both experience and long-term planning
capabilities
43
46 Concentrating Solar Power (CSP)
461 Introduction
This Section of the report focuses on the OampM costs for the following Concentrating Solar
Power (CSP) technologies
Parabolic Trough (PT)
Solar Tower (ST) and
Linear Fresnel (LF)
CSP OampM costs were analysed in terms of
Fixed Operating and Maintenance Costs (FOM)
Variable Operating and Maintenance Costs (VOM) and
Total Operating Expenditures (OPEX)
In order to arrive at comparable results between technologies BREE and WorleyParsons
estimated the OampM costs based on
Reference Plants with similar Solar Plant characteristics localisation net capacity
capacity factor hours of Thermal Energy Storage (TES) and type of cooling system(s)
and
Cost estimate amounts that were updated to 2012 USD
When information was not available necessary estimates were made using WorleyParsonsrsquo
in-house data and based on global market trends observed in various publications
462 Review of the evidence
The following international organisations were consulted to provide the AETA 2013 OampM
costs update for the selected CSP technologies
International Renewable Energy Agency (IRENA) (wwwirenaorg)
International Energy Agency (IEA) (wwwieaorg)
European Solar Thermal Electricity Association (ESTELA) (wwwestelarde)
The World Bank (WB) (wwwworldbankorg)
National Renewable Energy Laboratory (NREL) (wwwnrelgov)
Protermosolar (wwwprotermosolares)
Institute for Energy Diversification and Saving (IDEA) (wwwideaes)
Renovetec (wwwrenoveteces) and
CSP Today (wwwcsptodaycom)
The approach in reviewing OampM costs for the 2013 update for CSP technology was only to
use new sources of information published since the AETA 2012 report was written This was
44
maintained for all but the learning rates estimation which is due to the lack of any new
updated information published since 2012 in relation to this
Upon review of the available public domain information it was found that IEA ESTELA
WB Protermosolar Renovetec and IDEA do not have any new relevant public information
related to CSP OampM costs However IRENA 2013b IRENA 2013c and NREL 2012 are
new references from IRENA and NREL that are considered relevant and which were used in
this report
The information contained in these references did not provide updated costs for all of the
CSP technologies being considered in this Report and the values offered were not provided
in terms of FOM and VOM costs as preferred
Due to the lack of new relevant information in the public domain the AETA 2013 Model
Update process obtained reports from CSP Today a private international organisation
focused on news events reports updates and information for the CSP industry in markets
such as India South Africa Spain USA Chile and MENA regions The Update acquired the
last edition of PT and ST reports CSP Today 2012a and CSP Today 2012b for which OPEX
costs were analysed
463 AETA 2012 OampM CSP costs report comparison
Operating and Maintenance expenses were provided in terms of fixed and variable costs in
the AETA 2012 report and this Model Update has modified these for 2013 for PT ST and LF
technologies based on the references cited above and further consideration of learning rates
for the CSP industry
Most CSP projects with commercial operational experience are parabolic trough technology
as it is the most mature technology and currently more is reported and known about actual
costs than other CSP technologies Nevada Solar One as an example is a 64MWe parabolic
trough plant based in California which was commissioned in 2007 and it is the first plant
built after the SEGS development during the 1980-90s also in California
Andasol 1 the 50 MWe parabolic trough plant based in Spain is also the first CSP plant
worldwide to implement a commercial thermal energy storage system with a capacity of 75
hours of full load storage It commenced operation at the end of 2008 and other similar and
larger trough projects are now operating or being constructed
As the most mature CSP technology trough plant should be further down the operational and
design operability maturity path and hence have a lower opportunity for OampM cost
reductions through learning By contrast Solar Tower and Linear Fresnel systems are only
beginning to be deployed at larger scale and hence there is expected to be more potential to
reduce their capital and operating costs and improve performance
Learning rates have been argued by stakeholders as being very significant for CSP plant with
comments of the AETA 2012 report centring on this issue Disappointingly there is no new
published evidence or actual plant report data that could be found by the AETA stakeholders
and WorleyParsons to add to that used for the 2012 report There is however new evidence
on the reduction in LCOE for CSP technologies and WorleyParsons linked OPEX
contribution to these LCOE predictions so that a sense of future reductions could be made
This is outlined further in the following Sections
45
4631 ASSUMPTIONS AND CONSIDERATIONS
FOM and VOM Breakdown
The following costs are included in proceeding FOM cost estimates for CSP technologies as
an annual cost per MW capacity
Insurance
Labour costs and
Fixed service maintenance contracts
Similarly the following costs are included in the VOM cost estimates as a cost rate per MWh
of sent out energy
Material and maintenance costs spare parts equipment maintenance and unscheduled
inspections and
Utilities costs water auxiliary fuel and auxiliary power when applicable
Some items such as spare parts for scheduled maintenance could be considered FOM costs
However to simplify the comparison and to homogenise all of the analyses across
technologies all concepts related to plant material and maintenance were included in the
VOM costs
4632 AETA 2012 OampM CSP COSTS COMPARISON REPORT
The technical characteristics of the reference CSP Plants used in the AETA 2012 report have
been extracted from the AETA Model Version 1_0 (BREE 2012) and are summarised in
Table 12
Table 12 AETA 2012 Reference Plant Technical Characteristics
Plant
Characteristics
Units Parabolic
Trough
without
Storage
Parabolic
Trough
with
Storage
Solar
Tower
without
Storage
Solar
Tower
with
Storage
Linear
Fresnel
without
Storage
Linear
Fresnel
with
Storage
Plant Net Capacity MW 138 135 122 18 230 225
Location NA Unknown Unknown Unknown Unknown Unknown Unknown
Isolation kWhm2year Unknown Unknown Unknown Unknown Unknown Unknown
Hours of TES h - 7 - 6 - 6
Capacity Factor per cent 23 42 31 42 23 42
Type of Cooling NA Unknown Unknown Unknown Unknown Unknown Unknown
FOM $MWyear 60000 65000 70000 60000 65000 65000
VOM $MWh sent out 15 20 15 15 15 20
Based on the information above this Model Update estimated the following parameters for
the CSP technologies evaluated in this study
46
Total net energy production in terms of MWh delivered per year
FOM and VOM in terms of USD per year and
Total OPEX costs in terms of USD per year and USD per total net energy production
per year
The results are listed in Table 13 below Table 13 AETA 2012 OampM Opex costs on a per kWh basis
Plant
Characteristics
Units Parabolic
Trough
without
Storage
Parabolic
Trough
with
Storage
Solar
Tower
without
Storage
Solar
Tower
with
Storage
Linear
Fresnel
without
Storage
Linear
Fresnel
with
Storage
Plant Net Capacity MW 138 135 122 18 230 225
Net Energy sent out MWhyear 2780424 496692 3313032 662256 463404 827820
FOM $year 8280000 8775000 8540000 1080000 14950000 14625000
VOM $year 4170636 9933840 4969548 993384 6951060 16556400
OPEX $year 12450636 18708840 13509548 2073384 21901060 31181400
OPEX $kWh 00448 00377 00408 00313 00473 00377
FOM per cent 6650 4690 6321 5209 6826 4690
VOM per cent 3350 5310 3679 4791 3174 5310
The percentages of FOM and VOM costs as part of the total OPEX costs are presented in
Figure 5
Figure 5 AETA 2012 FOM and VOM Percentages of Total OPEX Costs
47
In Figure 5 FOM costs are in general terms significantly higher than VOM costs because
they include the higher cost items such as insurance labour costs and fixed service contracts
However as shown in the Figure VOM costs are higher or approximately equal to FOM
costs for technologies with energy storage given the criteria selected for the breakdown
between FOM costs and VOM costs FOM costs will remain relatively consistent from year-
to-year while VOM costs should be broken down even further since the costs of water
natural gas (if required) and electricity vary between locations and from one year to another
Total OPEX costs are expressed in terms of USD per total net energy production per year and
are between 00313 and 00473 USDkWh as listed in Table 13 These values are aligned
with the values provided by international institutions cited although they appear to be
somewhat inflated in comparison with those values that are closer to 0025 and 0035
USDkWh as published by others (eg IRENA)
4633 AETA 2013 OampM COSTS UPDATE
Similar Plant characteristics to AETA 2012 were considered for the appropriate comparison
of OampM costs for this update Plant characteristics include location net capacity capacity
factor hours of TES and type of cooling For this Report the characteristics of the reference
plants used are described in Table 14
Table 14 PT and ST Reference Plant Characteristics
Plant
characteristics
Units Parabolic
Trough without
Storage
Parabolic
Trough with
Storage
Solar Tower
without
Storage
Solar Tower
with Storage
Plant Net Capacity MW 100 100 100 100
Location NA MENA region MENA region MENA region MENA region
Isolation kWhm2year 2400 2400 2400 2400
Hours of TES h 0 6 0 6
Capacity Factor per cent 26 46 275 476
Type of Cooling NA Dry Dry Dry Dry
Source NA WorleyParsons CSP Today 2012a WorleyParsons CSP Today 2012b
The 2013 OampM costs were estimated using as a basis the information provided in the CSP
2012 reports (CSP 2012a and 2012 b) The following considerations were taken into account
the CSP Today reports only consider PT and ST plants with thermal storage
WorleyParsons made the following estimates based on experience with solar and
conventional power plants based on PT and ST technologies without TES
estimated the capacity factor based on plant capacity location and type of cooling
adjusted the insurance material and maintenance and labour costs based on the
solar field reduction factor when applicable
adjusted the steam turbine maintenance based on the potential hours of operation
48
adjusted the plant electricity and water consumption based on the total net
production
assumed similar auxiliary fuel consumption for the plant with and without TES This
assumption is due to the reference plants being based in the same location thus
requiring similar auxiliary fuel consumption for start-up Minimal differences in
auxiliary fuel consumption for freeze protection due to increased time offline for a
plant without TES system compared to a plant with TES are expected but not
considered in this Report as the impact would be minor
the capacity factor provided by CSP Today for PT with thermal storage is considered
high Based on the plant location and capacity WorleyParsons would anticipate the
capacity factor to be closer to 42 per cent instead of 46 per cent as indicated in Table
14 above This difference in capacity factor directly impacts the estimated VOM cost
which is correlated with plant production For comparison purposes the value provided
by CSP Today has maintained and
with respect to Linear Fresnel technology updated information has not been published
since the AETA 2012 report release by the references listed in Section 462 which
WorleyParsons consulted For the purpose of updating the estimates to 2013 it was
assumed that the evolution of the OampM costs would be similar to that of parabolic
trough plants and the same escalation factors were applied
The resulting 2013 and 2012 OampM costs are listed in Table 15 below for comparison
Table 15 2013 CSP OampM Costs Compared to 2012 OampM Costs
CSP Technology OampM Costs AETA 2012 WorleyParsons 2013 update
Parabolic Trough
without Storage
FOM $MWyear 60000 59176
VOM $MWh sent out 1500 1519
OPEX $kWh 00448 00412
Parabolic Trough with
Storage
FOM $MWyear 65000 72381
VOM $MWh sent out 2000 1139
OPEX $kWh 00377 00293
Solar Tower without
Storage
FOM $MWyear 70000 58285
VOM $MWh sent out 1500 707
OPEX $kWh 00408 00313
Solar Tower with
Storage
FOM $MWyear 60000 71372
VOM $MWh sent out 1500 565
OPEX $kWh 00313 00228
Linear Fresnel without
Storage
FOM $MWyear 65000 64107
VOM $MWh sent out 1500 1519
OPEX $kWh 00473 00434
49
CSP Technology OampM Costs AETA 2012 WorleyParsons 2013 update
Linear Fresnel with
Storage
FOM $MWyear 65000 72381
VOM $MWh sent out 2000 1139
OPEX $kWh 00377 00293
The total OPEX costs per year from the AETA 2012 report and the WorleyParsonsrsquo estimates
that were updated for 2013 are compared in Figure 6 below
Figure 6 Comparison of OPEX Costs per Total Annual Plant Production per Year AETA 2012
Report and 2013 Update
Reductions of approximately 20 - 27 per cent in OampM costs would be realised by CSP with
TES according to the updated 2013 WorleyParsons estimates compared to the same costs
reported in the AETA 2012 report However reductions for PT and LF without TES were
found to be lower at approximately 8 per cent
The IRENA reports (IRENA 2013b IRENA 2013c) provide values for OPEX between 0025
and 0035 USDkWh for PT and ST technologies with and without TES Values updated to
2013 by WorleyParsons are between 0023 and 00412 USDkWh for PT and ST
technologies which align with the IRENA values However IRENA does not differentiate
between the utilisation of TES Solar technologies without TES have fewer hours of
production and although OPEX costs are lower in terms of USDMW compared with solar
technologies with TES OPEX costs in terms of costs per total annual plant production per
year will typically be higher for technologies that do not use TES
4634 OampM CSP LEARNING RATES
Cost reductions on CSP technologies are expected to come from the following main actions
economies of scale in the plant size and manufacturing industry
learning impacts on design construction and operation phases
50
advances in RampD of the following factors
Components Solar receivers mirrors HTF storage media supporting structures
trackers and auxiliary systems
Systems Direct steam generation storage systems or hybrid cooling systems
Configurations Hybridisation or duel electricity water plants
a more competitive supply chain
improvements in the performance of the solar field solar-to-electric efficiency and
thermal energy storage systems
increases in the life of plants and
reduced financial costs
Based on the parameters listed above the LCOE from Solar Thermal technologies is likely to
be continuously decreasing and this is born out in the literature that has been reviewed Based
on the IRENA 2013b report the evolution of the LCOE from trough and power tower CSP
technologies shows how the LCOE is decreasing as technology development increases in
Table 16 below Estimates for LCOE for the hypothetical trough and tower CSP plants in
2014 are also included
51
Table 16 Estimated LCOE form Existing and Hypothetical Trough and Solar Tower CSP Technologies
CSP
Technology
Year Capacity
(MW)
Plant Name Location DNI
(kWhm2year)
LCOE 2012
$kWh Installed
Trough
1981 05 PSA Spain 2000 064
1983 138 SEGS I California 2700 039
1989 30 SEGS II ndash VIII California 2700 026
1992 80 SEGS VIII amp IX California 2700 020
2008 - 2009 50 Andasol 1 2 Spain 2000 035
2010 50 Solnova 1 amp 3 Spain 2000 034
2010 - 2011 50 Extresol 1 amp 2 Spain 2000 035
2014 250 Unspecified (wet
cooling no storage)
Not provided Not provided 020
Tower
1987 10 Solar One California 2700 058
2007 11 PS10 Spain 2000 034
2009 20 PS20 Spain 2000 036
2011 199 Gemasolar (wet
cooling 15hr
storage)
Spain 2000 033
2014 120 Unspecified
(dry cooling
storage)
Not Provided Not provided 015
International Institutions such as IRENA ESTELA or the World Bank agree that the LCOE
and capital cost reductions of 28 per cent to 60 per cent are envisioned by 2020 ndash 2025 for
such plant Estimates of possible LCOE reductions for CSP technology from 2012 to 2025
are provided in Figure 7 taken from Kearny (2010)
52
Figure 7 Expected LCOE Reductions for CSP Technology from 2012 to 2025
Source (Kearny 2010)
The OampM maintenance costs of modern CSP Plants are lower than those for Californian
SEGS Plants built in the 1980s and 1990s which has a total combined capacity of 354 MW
and estimated OampM costs of USD 004kWh (IRENA 2013b) However CSP experienced no
growth from early 1990s until the mid-2000s as can be seen in Table 16 above
As stated at the beginning of Section 462 Andasol 1 was the first 50 MWe parabolic trough
plant built after SEGS which included a thermal energy storage system It commenced
operation at the end of 2008 Podewils (2008) estimated Andasol 1 OampM costs of EUR
0072kWh or USD 0095kWh (considering 2012 medium rate exchange EURUSD of
07553) This value is high compared to OPEX estimations for PT with TES provided by
both this 2013 update and the AETA 2012 report (00293 and 00377 USDkWh
respectively) Therefore according to the information detailed above considerable learning
improvements to OampM costs have been already achieved from the commencement of
operation of Andasol 1 to the time of this Report
`WorleyParsonsrsquo estimations on the LCOE of parabolic trough plants is in the range of
USD 020kWh to USD 035kWh and that of solar towers between USD 017kWh and
USD 029kWh However in areas with excellent solar resources the range could be as low
as USD 014kWh to USD 018kWh
The following considerations have been taken into account for OampM cost learning rates
forecast
WorleyParsons LCOE estimations as set out above
Potential average envisaged LCOE reductions of 475 per cent by 2025 based on Figure
7 above
OPEX contribution on LCOE of 20 per cent and
53
assuming that all components involved in the LCOE (CAPEX OPEX and financial
expenses) reduce at the same rate so percentage contributions remain constant
According to these considerations WorleyParsons estimates that OPEX values by 2025 could
reach from 0021 to 0037 USDkWh for PT technology and from 0018 to 0031 USDkWh
for ST technology
Technological improvements have reduced the requirement of replacing mirrors and
receivers Automation has reduced the cost of other OampM procedures by as much 30 per
cent As a result of OampM procedure improvements (both cost and plant performance) the
total OampM costs of CSP plants in the long-term are likely to be below USD 0025kWh
(IRENA 2013b)
Parabolic trough system in the United States would have OampM costs of around USD 002 to
USD 003kWh meanwhile the OampM costs of parabolic trough and solar tower power plants
currently under construction in South Africa have estimated OampM costs of between USD
0029 and USD 0036kWh (also IRENA 2013b)
WorleyParsons estimations are in alignment with IRENA estimations in terms of current and
envisaged CSP OPEX costs
4635 CONCLUSIONS ndash CSP
The following main conclusions were made based on this study in relation to CSP
technologies
the 2013 WorleyParsons CSP OampM costs update resulted in values between 0023 and
0043 USDkWh based on 2012 USD
reductions in CSP OampM costs between 8 per cent and 27 per cent were obtained in
comparison to values provide in AETA 2012 report
the total OampM costs of CSP Plants in the long-term are likely to be below USD
0025kWh
the updated values for 2013 by WorleyParsons are in alignment with the values
provided by recognised international institutions and
at the time of this report the only CSP technology with substantial operation capacity
was PT Only three utility-scale ST plants were in operation at the time of this report
(PS-10 PS-20 and Gemasolar) of which only one (Gemasolar) uses TES Though
several process steam and small-scale LFR Plants are currently in operation only one
utility-scale LFR (Puerto Erradio 2) was in operation at the time of this report
47 AETA 2013 OampM Learning Rate recommendation
The learning rate used in AETA 2012 for OampM is applied to all technologies assessed and
includes fossil fuel technologies and emerging technologies The learning rate is set at an
improvement of 02 per cent per annum
In addition to the improvement rate OampM is escalated at a rate of 150 per cent of CPI per
year based on experience with increases in parts and labour costs
The CPI rate set in the model is 25 per cent per annum
54
OampM cost information in the public domain in both quantum and quality is poor for
contemporary data Information supporting OampM learning rates is equally poor There are
indications that emerging technologies do have the potential for increased OampM learning
rates relative to mature technologies
For the renewable energy technologies studied in this report onshore wind is considered
mature and it is recommended that the AETA 2012 report value of 02 per cent is maintained
For all other renewable energy technologies studied in this report a more aggressive learning
rate of 25 per cent is recommended This will effectively cancel out the CPI escalation
adjustment and provide a ldquoflat linerdquo OampM rate for future years This will provide a value in
line with the learning rate conclusions for PV
The learning rate for CSP is considered to have greater potential for reduction but due to the
high level of analysis in this report (and therefore uncertainty) it is proposed that a maximum
of two learning rates is appropriate for the AETA model
Table 17 AETA Learning Rate Comparison
AETA 2012 Learning Rate AETA 2013 update Learning Rate
Onshore Wind 02 per cent 02 per cent
Offshore Wind
PV ndash all technologies
CSP ndash all technologies
02 per cent 25 per cent
55
5 CHANGES TO THE LCOE
Changes to the model parameters described in the earlier sections have resulted in changes to
the LCOE estimates for a number of technologies The LCOE estimate values for all
technologies and associated range of uncertainty are shown in the Figures 8 to 13 below
Note that the values listed are for a base value carbon price modifier of zero per cent which
places no value on carbon emissions
For selected technologies where there are significant cost differences Figure 14 provides a
comparison of mid-range LCOE values for the AETA 2013 and AETA 2012 Models Key
features of the Figures 8 to 14 are as follows
both in AETA 2012 and 2013 Model update LCOE costs are provided for the years
2012 2020 2025 2030 2040 and 2050
cost ranges are provided for each technology that accounts for differences in fuel prices
and state-based variations
LCOE costs vary substantially across the technologies from $89MWh (combined cycle
gas turbine) to $351MWh (solar thermal linear fresnel) in 2012 and $73MWh (PV
non-tracking) to $247MWh (IGCC black coal CCS) in 2050
the inter-technology LCOE comparisons figures (Figures 8 to 13) reveal changes in
relative costs of technologies over time Key results include renewable technologies
have higher LCOEs than the lowest cost non-renewable technologies and the relative
LCOE rankings significantly change post 2030 The LCOE of solar PV become lower
than the non-renewables from mid 2030 onwards and
large changes in LCOE results between AETA 2013 Update and AETA 2012 are
depicted in Figures14 below Figure 14 compares LCOEs at 2050 between the AETA
2013 Update and AETA 2012 for a selected number of technologies that have changed
significantly for NSW (AETA developed LCOEs by each Australian state) Differences
in technology LCOEs are explained by a multiplicity of factors including the technical
developments OampM costs and learning rate changes
56
Figure 8 Updated LCOEs for AETA 2013 Model technologies values for 2012 (NSW) with carbon price set to zero
0
50
100
150
200
250
300
350
400
450
500
LCO
E ($
MW
h)
LCOE FOR 2012 TECHNOLOGIES (NSW) Note Default region is NSW except bown coal
technologies (VIC) and SWIS scale (as specified)
LCOE includes where relevant allowance for- Carbon Price- CO2 transport and sequestration cost- Plant capital cost (EPC basis) within battery limits- Owners costs excluding interest during construction- Fixed and variable operating costs- Fuel costs- Economic escalation factors
57
Figure 9 Updated LCOEs for AETA 2013 Model technologies values for 2020 (NSW) with carbon price set to zero
0
50
100
150
200
250
300
350
400
450
LCO
E ($
MW
h)
LCOE FOR 2020 TECHNOLOGIES (NSW) Note Default region is NSW except bown coal
technologies (VIC) and SWIS scale (as specified)
LCOE includes where relevant allowance for- Carbon Price- CO2 transport and sequestration cost- Plant capital cost (EPC basis) within battery limits- Owners costs excluding interest during construction- Fixed and variable operating costs- Fuel costs- Economic escalation factors
58
Figure 10 Updated LCOEs for AETA 2013 Model technologies values for 2025 (NSW) with carbon price set to zero
0
50
100
150
200
250
300
350
400
LCO
E ($
MW
h)
LCOE FOR 2025 TECHNOLOGIES (NSW) Note Default region is NSW except bown coal
technologies (VIC) and SWIS scale (as specified)
LCOE includes where relevant allowance for- Carbon Price- CO2 transport and sequestration cost- Plant capital cost (EPC basis) within battery limits- Owners costs excluding interest during construction- Fixed and variable operating costs- Fuel costs- Economic escalation factors
59
Figure 11 Updated LCOEs for AETA 2013 Model technologies values for 2030 (NSW) with carbon price set to zero
0
50
100
150
200
250
300
350
400
LCO
E ($
MW
h)
LCOE FOR 2030 TECHNOLOGIES (NSW) Note Default region is NSW except bown coal
technologies (VIC) and SWIS scale (as specified)
LCOE includes where relevant allowance for- Carbon Price- CO2 transport and sequestration cost- Plant capital cost (EPC basis) within battery limits- Owners costs excluding interest during construction- Fixed and variable operating costs- Fuel costs- Economic escalation factors
60
Figure 12 Updated LCOEs for AETA 2013 Model technologies values for 2040 (NSW) with carbon price set to zero
0
50
100
150
200
250
300
350
400
LCO
E ($
MW
h)
LCOE FOR 2040 TECHNOLOGIES (NSW) Note Default region is NSW except bown coal
technologies (VIC) and SWIS scale (as specified)
LCOE includes where relevant allowance for- Carbon Price- CO2 transport and sequestration cost- Plant capital cost (EPC basis) within battery limits- Owners costs excluding interest during construction- Fixed and variable operating costs- Fuel costs- Economic escalation factors
61
Figure 13 Updated LCOEs for AETA 2013 Model technologies values for 2050 (NSW) with carbon price set to zero
0
50
100
150
200
250
300
350
400
LCO
E ($
MW
h)
LCOE FOR 2050 TECHNOLOGIES (NSW)
LCOE includes where relevant allowance for- Carbon Price- CO2 transport and sequestration cost- Plant capital cost (EPC basis) within battery limits- Owners costs excluding interest during construction- Fixed and variable operating costs- Fuel costs- Economic escalation factors
Note Default region is NSW except bown coal
technologies (VIC) and SWIS scale (as specified)
62
Figure 14 Comparison of AETA 2013 Model and AETA 2012 Model LCOE estimates selected technologies 2050
0
50
100
150
200
250
AETA 2012
AETA 2013
63
51 Conclusions
The Australian Energy Technology Assessment (AETA 2012) provided the best available and most up-to-
date cost estimates for 40 electricity generation technologies under Australian conditions To ensure that
the cost estimates for the various technologies are consistent all common input costs (eg labour
materials components carbon price) were itemised To ensure that the AETA costings remain up to date
AETA costs are reviewed in this AETA 2013 Model Update report
The AETA 2013 refresh was developed in close consultation with a stakeholder reference group drawn
from industry and researchacademic organisations with interests and expertise in a diverse range of
electricity generation technologies
The AETA 2013 Model results reflect the change to exclude the value of a carbon price in the Levelised
Cost of Energy (LCOE) All technologies have experienced a minor reduction in LCOE relative to 2012
(offset in some cases by other factors) due to the change to an amortisation period of 30 years plus the
construction period
Comparing the 2012 AETA results without a carbon price to the 2013 results without a carbon price there
are significant reductions in the LCOE of solar technologies and onshore wind This is as a consequence of
changes to the fixed and variable Operations and Maintenance (OampM) costs for these technologies For the
solar technologies the adjustment of the capital learning rate to 25 per cent has also contributed to the
LCOE reduction Offshore wind also has an increased learning rate but this has been offset to a large extent
by increased variable OampM costs
Nuclear LCOE has increased significantly due to higher estimates for capital costs
Efficiency for coal fired plants with CCS retrofits has been revised downwards to better reflect the expected
efficiency of these plants and has the effect of increasing the LCOE
64
REFERENCES
Albers A 2009 OampM Cost Modeling Technical Losses and Associated Uncertainties Proceedings of the
2009 European Wind Energy Conference Marseilles France March
AWEA (American Wind Energy Association) 2013 AWEA US Wind Industry Annual Report ndash Year
Ending 2012 USA
BNEF (Bloomberg New Energy Finance) 2013 Operations and Maintenance (OampM) Price Index Issue II
Wind Research Note April
BREE (Bureau of Resources and Energy Economics) 2012 AETA Report and Model Version 1_0 2012
Australian httpwwwbreegovau
CEC (Clean Energy Council) 2013 Australian Energy Technology Assessment 2013 Review Letter to
BREE of 20 May 2013 from the Clean Energy Council (Mr Russel Marsh signatory for the CEC)
CEC (Clean Energy Council) 2013 Clean Energy Council Renewable Energy Map Australia June (data
noted as current as of 21 August 2012)
httpwwwcleanenergycouncilorgauresourcecentreplantregistermaphtml
Crown Estate 2012 Offshore Wind Cost Reduction Pathways Study United Kingdom May
CSP 2012a CSP Parabolic Trough Report Cost Performance and Key Trends CSP Today
CSP 2012b CSP Solar Tower Report Cost Performance and Key Trends CSP Today
Deloitte amp Touche 2012 European Wind Services Study Find Out Which Way the Wind Blows Deloitte amp
Touche GmbH Wirtschaftspruumlfungsgesellschaft August
Deloitte 2011 Economics of wind development in New Zealand Deloitte for the for the New Zealand Wind
Energy Association
Ebert P amp Ware J 2013 The Role of Independents in the Wind Farm Operations amp Maintenance
Proceedings of the 2013 New Zealand Wind Energy Conference and Exhibition March
EPRI (Electric Power Research Institute) 2010 Engineering and Economic Evaluation of Central-Station
Solar Photovoltaic Power Plants USA March
GlobalData 2012 Wind Operations amp Maintenance (OampM) Market ndash Global Market Size Share by
Component Competitive Landscape and Key Country Analysis to 2020 GlobalData reference code
GDAE1054MAR January
Hand M 2013 Wind Plant Cost of Energy Proceedings of the 2nd NREL Wind Energy System
Engineering Workshop January
Hassan G 2011 Review of the Australian Wind Energy Industry Clean Energy Council Australia 2011
Houston C 2013 The Real Truth About Wind Farm OampM Costs North American WindPower March
IEA (International Energy Agency) 2008 Technology Roadmap Solar photovoltaic energy France
httpwwwieaorgpublicationsfreepublicationspublicationpv_roadmappdf
IRENA (International Renewable Energy Agency) 2013a Solar Photovoltaics Technology Brief Germany
January httpwwwirenaorgDocumentDownloadsPublicationsIRENA-ETSAPper
cent20Techper cent 20Briefper cent20E11per cent20Solarper cent20PVpdf
65
IRENA (International Renewable Energy Agency) 2013b Concentrating Solar Power Technology Brief
Germany January
IRENA (International Renewable Energy Agency) 2013c Renewable Power Generation Costs in 2012 An
Overview Germany
IT Power 2013 Analysis of the AETA 2012 cost estimates of CSP technologies Clean Energy Council
submission to the Bureau of Resources and Energy Economics May
Kann S 2012 US Solar Market Insight Report Q3 California USA
Kearny A 2010 Solar Thermal Electricity 2025 ndash clean electricity on demand attractive STE costs
stabilize energy production ATKearny consultants Dusseldorf Germany
Muirhead J 2013 SEGS experience suggests that CSP will age gracefully CSP Today South Africa
httpsocialcsptodaycommarketssegs-experience-suggests-csp-will-age-
gracefullysthash6VkxFaD0dpuf
NREL (National Renewable Energy Laboratories) 2011 IEA Wind Task 26 ndash Multi-national Case Study of
the Financial Cost of Wind Energy Technical Report NRELTP-6A2-48-48155 March
NREL (National Renewable Energy Laboratories) 2012 Cost and Performance Data for Power Generation
Technologies USA February
NREL (National Renewable Energy Laboratories) 2013 Breakeven Prices for Photovoltaics on
Supermarkets in the United States March httpwwwnrelgovdocsfy13osti57276pdf
NREL (National Renewable Energy Laboratories) 2013 Breakeven Prices for Photovoltaics on
Supermarkets in the United States USA March httpwwwnrelgovdocsfy13osti57276pdf
Photon 2012 The True Cost of Solar Power 2012 Temple of Doom Solar Power in Focus Series Photon
Consulting
Photon 2013 Solar Annual 2013 Build Your Empire Photon Consulting
Podewils C 2008 Photovoltaic vs Solar Thermal where PV has the upper hand and where solar thermal
strikes back Photon International Germany November
Poore R and Walford C 2008 Development of an Operations and Maintenance Cost Model to Identify
Cost of Energy Savings for Low Wind Speed Turbines Report NRELSR-500-40581 National
Renewable Energy Laboratory January
RolandBerger 2013 Offshore Wind Towards 2020 On the Pathway to Cost Competitiveness RolandBerger
Consultants Germany April
See wwwcsptodaycom
See wwwepiaorg
See wwwestelasolarde
See wwwidaees
See wwwieaorg
See wwwirenaorg
See wwwnrelgov
See wwwprotermosolares
66
See wwwrenoveteces
See wwwseiaorgau
See wwwsolarelectricpowerorg
See wwwworldbankorg
UK Crown Estate 2012 Offshore Wind Cost reduction Study May
US DoE (Department of Energy) 2013 Award Number DE-EE0005360 USA February
Wiser R Lantz E Bolinger M amp Hand M 2012 Recent Developments in the Levelized Cost of Energy
from US Wind Power Projects Contract No DE-AC02-05CH11231 National Renewable Energy
Laboratories February
67
Appendix A
Electricity Generation Technologies in AETA 2012 Report and Model
The 40 AETA electricity generation technologies are
1 Integrated Gasification and Combined Cycle (IGCC) plant based on brown coal
2 IGCC plant with Carbon Capture and Sequestration (CCS) based on brown coal
3 IGCC plant based on bituminous coal
4 IGCC plant with CCS based on bituminous coal
5 Direct injection coal engine (clean lignite eg brown coal technology)
6 Pulverised coal supercritical plant based on brown coal
7 Pulverised coal supercritical plant with post combustion CCS based on brown coal
8 Pulverised coal subcritical plant with post combustion CCS based on brown coal (retrofit)
9 Pulverised coal supercritical plant based on bituminous coal
10 Pulverised coal supercritical plant based on bituminous coal - SWIS relevant scale
11 Pulverised coal supercritical plant with CCS based on bituminous coal
12 Pulverised coal subcritical plant with post combustion CCS based on bituminous coal (retrofit)
13 Adding CCS to existing Combined Cycle Gas Turbine (CCGT) power plants (retrofitting)
14 Oxy combustion pulverised coal supercritical plant based on bituminous coal
15 Oxy combustion pulverised coal supercritical plant with CCS based on bituminous coal
16 Combined cycle plant burning natural gas
17 Combined cycle plant burning natural gas - SWIS relevant scale
18 Combined cycle plant with post combustion CCS
19 Open cycle plant burning natural gas
20 Solar thermal plant using compact linear fresnal reflector technology wo storage
21 Solar thermal plant using parabolic trough technology wo storage
22 Solar thermal plant using parabolic trough technology with storage
23 Solar thermal plant using compact linear fresnal reflector technology with storage
24 Solar thermal plant using central receiver technology wo storage
25 Solar thermal plant using central receiver technology with storage
26 Solar photovoltaic (PV) - non-tracking
27 Solar photovoltaic (PV) - single axis tracking
28 Solar photovoltaic (PV) - dual axis tracking
29 Wind (on-shore)
30 Wind (off-shore)
31 WaveOcean
68
32 Geothermal - hot sedimentary aquifer (HSA)
33 Geothermal - enhances geothermal system (EGS)
34 Landfill gas power plant
35 Sugar cane waste power plant
36 Other biomass waste power plant (eg wood)
37 Nuclear Gen 3+
38 Nuclear Small Modular Reactors (SMR)
39 Solarcoal hybrid
40 Integrated solar combined cycle (ISCS) ndash parabolic trough with combined cycle gas
69
Appendix B
Consultations with Stakeholders
This study has been undertaken in close consultation with a Stakeholder Reference Group drawn from
Australian industry and domestic as well as overseas researchacademic organisations with interests and
expertise in a diverse range of electricity generation technologies These stakeholders were invited to
provide evidence of the latest estimates for the costs and performance of various technologies
In addition the AETA project also had a Project Steering Committee comprising staff from BREE
AEMO CSIRO and other independent experts to provide technical advice and support The following
agencies participated in the stakeholder reference group meetings or were forwarded the documents
presented at the meetings
AETA Stakeholder Reference Group
Australian Coal Association
Australian Energy Market Operator
Australian Geothermal Energy Association
Australian National Low Emissions Coal RampD
Australian National University
Australian Renewable Energy Agency
Australian Solar Thermal Energy Association
Australian Sugar Milling Council
Australian Treasury
Bureau of Resources and Energy Economics
Clean Energy Council
CSIRO
Department of Industry
Economic Research Institute for ASEAN and East Asia
Energy Retailers Association of Australia
Energy Users Association of Australia
Evans and Peck
Ferrostaal
Global CCS Institute
Grid Australia
Intergen
International Energy Agency France
International Power Suez
IRENA Innovation and Technology Centre Germany
70
National Generators Forum
Oceanlinx Limited
Origin Energy
Private Generators Group
The Institute of Energy Economics Japan
The Energy Research Institute New Delhi
University of Melbourne Energy Institute
University of Queensland Energy Initiative
UQ Energy Economics amp Management Group
Wyldgroup
WorleyParsons
Two AETA Stakeholders Reference Group meetings took place on 30 April 2013 and 17 July 2013 In
addition the AETA Project Steering Committee met on 24 June 2013
71
BREE contacts Executive Director BREE Bruce Wilson brucewilsonretgovau
(02) 6243 7901
Deputy Executive Director Wayne Calder waynecalderbreegovau
(02) 6243 7718
Modelling amp Policy Integration Arif Syed arifsyedbreegovau
Program Leader (02) 6243 7504
Data Statistics Geoff Armitage geoffarmitagebreegovau
Program Leader (02) 6243 7510
Energy and Quantitative Analysis Allison Ball allisonballbreegovau
Program Leader (02) 6243 7539
Resources ndash Program Leader John Barber johnbarberbreegovau
(02) 6243 7988
72

9
GLOSSARY
Amortisation Period the period over which a plant must achieve its economic return
Auxiliary Load the internal or parasitic load from the electricity required to sustain the
operation of a plant
Capacity Factor the ratio of the actual output of a power plant over a period of time and its
potential output if it had operated at full nameplate capacity the entire time
Capital Cost the cost of delivery of a plant not including the cost of finance
Discount Rate the rate at which future values are discounted or converted to a present
value
First-of-a-Kind Plant cost costs necessary to put a first commercial plant in place and that
will not be incurred for subsequent plants Design and certification costs are examples of
such costs
First Year Available for Construction the year in which the technology will be available
for commercial deployment globally
Gross Capacity maximum or rated generation from a power plant without losses and
auxiliary loads taken into account
International Equipment Cost the cost for internationally sourced equipment associated
with the project
Labour Cost the component of the delivery cost for a plant associated with local
(Australian) labour
Lead time for Development the time taken from inception to financial close This includes
permitting approvals and engineering design
Levelised Cost of Energy the minimum cost of energy at which a generator must sell the
produced electricity in order to achieve its desired economic return
Local Equipment Cost the cost of locally sourced (Australia) plant and equipment for the
project
Net Capacity the export capacity of a generation plant ndash ie the Gross Capacity less the
losses and auxiliary loads of the plant
Nth-of-a-kind plant cost all engineering equipment construction testing tooling project
management and other costs that are repetitive in nature and would be incurred if a plant
identical to a FOAK plant were built The NOAK plant is the nth-of-a-kind or equilibrium
commercial plant of identical design to the FOAK plant
Sequestration the process of transport and storage of Carbon Dioxide (CO2)
Thermal Efficiency the ratio between the useful energy output of a generator and inputs
10
EXECUTIVE SUMMARY
This Report provides electricity generation technology cost parameters as an update to those
presented in the Australian Energy Technology Assessment (AETA) Report and Model
published in July 2012 This update takes into account a range of new material reported in the
public and private domain further discussions with asset owners and technology developers
and input from key experts in relation to these costs
The AETA 2012 Model estimated levelised costs of energy (LCOE) for a set of 40 market
ready and prospective electricity generation technologies LCOE can be interpreted as the
long-run marginal cost of electricity generation These were estimated by breaking down
the cost drivers for a technology into its key constituent parts such as capital cost fixed and
variable lsquooperations and maintenancersquo (OampM) costs and where applicable fuel costs and
CO2 storage costs While the LCOEs included carbon costs project specific regulatory or
system based costs were not included although clearly these may have a significant impact
on the delivered price of electricity
The AETA 2013 Model update generally follows the same approach although comparable
LCOE results are presented without carbon costs reflecting the Governmentrsquos intention to
repeal carbon pricing To the extent that alternative emissions reduction measures impact on
the electricity generation sector this may have different implications for fossil fuel andor
renewable based technologies
For these reasons some caution should be applied when interpreting LCOE estimates These
estimates best illustrate potential and relative ldquooff-the-shelfrdquo cost competitiveness rather than
a firm predictor of market outcomes or the commercial viability of individual projects
The key features of the LCOE cost parameters in the AETA 2013 Model update with respect
to the AETA 2012 Model can be summarised as follows
renewable technologies have generally higher LCOEs than the lowest cost non-
renewable technologies and the relative LCOE rankings significantly change post
2030 The LCOE of solar PV becomes lower than the non-renewables from mid-
2030 onwards
however wind based generation is estimated to already have a lower LCOE than
many new build comparable fossil-fuel generation technologies
LCOE costs vary substantially across the technologies from $89MWh (combined
cycle gas turbine) to $351MWh (solar thermal Linear Fresnel) in 2012 and
$73MWh (PV non-tracking) to $247MWh (IGCC black coal CCS) in 2050
changes are made to nuclear capital costs and nuclear technology plantrsquos lsquofirst year of
constructionrsquo carbon capture and storage (CCS) retrofit thermal efficiency and
amortisation period for various technologies to include construction period
a reduction in onshore wind OampM costs of 18 per cent
11
a reduction in offshore wind fixed OampM costs and a three-fold increase in offshore
wind variable OampM costs resulting in an overall increase of 50 per cent total OampM
costs
fixed tilt PV configurations have not seen significant changes in OampM costs
single axis tracking and dual axis tracking PV configurations are approximately 20-30
per cent reduced based on a better understanding of the associated OampM costs
concentrating solar power (solar thermal) OampM cost reduced between 8 per cent and 27
per cent and
the OampM learning rate for offshore wind and all solar technologies are increased from
02 to 25 per cent
The overall impact of parameter changes by technology is given in the AETA 2013 Model
and in this report As in the AETA 2012 the 2013 Model update provides technology
LCOEs for the years 2012 2020 2025 2030 2040 and 2050
12
1 INTRODUCTION
The Australian Energy Technology Assessment (AETA) 2012 report published in July 2012
by the Bureau of Resources and Energy Economics (BREE 2012) undertook costing of 40
electricity generation technologies This report made a provision that due to the fast changing
technology cost environment cost and performance parameters assessed in the AETA 2012
model may be updated every year In addition a full report and lsquobottom uprsquo study will be
undertaken biennially with the next report to be released in 2014
The next fully updated AETA report is scheduled for completion in 2014 To ensure that cost
estimates for electricity generation technologies are current and take into consideration the latest
developments parameter estimates for the 40 technologies will be updated where appropriate
every six months in a manner consistent with the methods outlined in this report and in consultation
with the stakeholder reference group (BREE 2012 p 24)
The purpose of this AETA 2013 Model Update report is to present findings arising from a
review of specific technologies by BREE This review was assisted by comments made by
the AETA Project Steering Committee (PSC) members and AETA Stakeholders Reference
Group (SRG) WorleyParsons was commissioned to review cost parameters for the
technologies considered in the AETA 2012 model Given the fast changing nature of solar
and wind technology operating costs especial emphasis was placed on reviewing OampM costs
for wind and solar technologies Changes to the model for the 2013 update are discussed in
the following sections
11 Background to the AETA 2012 report
BREE engaged WorleyParsons in 2011-12 to develop cost estimates for 40 electricity
generation technologies under Australian conditions for AETA 2012 The AETA cost
estimates were developed with the active collaboration of the Australian Energy Market
Operator (AEMO) which utilised the AETA cost estimates for its National Transmission
Network Development Plan (NTNDP) In addition the Commonwealth Scientific and
Industrial Research Organisation (CSIRO) provided technical advice as part of the AETA
project steering committee The AETA 2012 provided technology costs for the years 2012
2020 2025 2030 2040 and 2050 These technologies encompass a diverse range of
energy sources including renewable energy (such as wind solar geothermal biomass and
wave power) fossil fuels (such as coal and gas) and nuclear power (Appendix A) Since its
publication in July 2012 more than 1000 requests have been made from BREE for the
AETA 2012 cost estimates (model) by domestic and international sources
12 Methods and Assumptions of the AETA 2012 Report and Model
121 Macro assumptions
Key macroeconomic assumptions are consistent with those detailed by the Australian
Energy Market Operator in its National Transmission Network Development Plan and by
the Australian Treasury (see BREE 2012 for a full set of assumptions)
13
122 Technical assumptions
all technologies were costed on a consistent and transparent basis with itemisation of
component costs
capital costs included direct (eg engineering procurement and construction) and
indirect (eg owners) costs but exclude transmission and decommissioning costs
future cost estimates included assumptions about the exchange rate productivity
variation commodity variation and technology improvements
fuel cost estimates were based on ACIL Tasman projections and
projected growth rates for future operating and maintenance costs were provided
123 Levelised cost of energy (LCOE)
LCOE can be interpreted as the long-run marginal cost of electricity generation Key
factors used to calculate LCOE by technology include amortisation period discount rate
capacity factor CO2 emissions factor CO2 capture rate emissions price CO2 storage cost
fuel cost variable and fixed OampM cost and the capital cost
LCOE is a key comparative cost indicator across technologies that is expressed in real
Australian dollars per Megawatt hour of electricity generation ($MWh) The LCOE is the
price at which electricity must be generated from a specific plant to break even taking into
account the costs incurred over the life of the plant (capital cost cost of capitalfinancing
operations and maintenance costs cost of fuel emissions price if applicable and CO2
sequestration) While LCOE is an invaluable tool for comparing technology costs power
generation companies andor investors who wish to choose a technology to deploy would
also need to consider other criteria such as site-specific costs technology performance
characteristics and experience with the technology prior to any final investment decision
AETA cost estimates are developed to provide design basis and plant characteristics
performance parameters capital cost estimates fuel cost estimates OampM cost estimates
and LCOE estimates
Regional impacts on capital and operating costs have been incorporated in the analysis
These regions include Victoria New South Wales (including ACT) South Queensland
(incorporating the South East Queensland and Central Queensland AEMO regions) North
Queensland (incorporating the North Queensland AEMO region) Northern Territory
North WA (Pilbara region) South WA (the South West Interconnected System region)
South Australia and Tasmania
13 Methodology of the AETA 2013 Model Update
As part of the AETA 2013 Model Update BREE invited submissions from the AETA
Steering Committee and the Stakeholder Reference Group to provide commentary and
recommendations on the AETA 2012 Report and Model Eight written submissions were
received in this regard Changes were only recommended where specific substantiated
changes were received The AETA 2013 model has been updated in accordance with the
above consultations and under the same macro economic and technical assumptions as in
AETA 2012 The AETA 2013 model is freely available on request from BREE
(infobreegovau)
Within this context this report provides updated costs based on
14
relevant Australian and international reports on generation technologies that have been
published since AETA 2012 or have been newly discovered
new public domain information
new information from private sources that could be obtained
in-house experience of WorleyParsons and
input on OampM costs and learning rates from a number of industry stakeholders
This AETA 2013 Model Update report provides supporting explanations and references and
justifies amendments to the cost parameters of technologies especially the OampM costs for
wind and solar technologies that were covered in AETA 2012 model
131 Caveats on the use of LCOE
LCOE provides a generalised cost estimate and does not account for site specific factors
that would be encountered when constructing an actual power plant As a result the costs
associated with integrating a particular technology in a specific location to a specific
electricity network are not considered
Projected LCOE does not necessarily provide a reliable indicator of the relative market
value of generation technologies because of differences in the role of technologies in a
wholesale electricity market For example projected LCOE does not provide a direct
indicator of electricity demand or generation in isolation with other emissions abatement
policies Similarly many technologies involve integration costs in addition to the LCOE to
be able to reliably supply to the system The value of variable (or intermittent) power plants
(such as wind and solar) will depend upon the extent to which such plants generate
electricity during peak periods and the impact these plants have on the reliability of the
electricity system Unlike dispatchable power plants (such as coal natural gas biomass
and hydroelectric) ndash which are reliant on some form of stored energy (eg fuels water
storage or battery storage) ndash wind and photovoltaic power plants do not typically include
energy storage Dispatchable plants such as coal or gas fired plants may involve negative
externalities (environment fuel disposal or insurance costs etc) which are not always
reflected in their LCOEs
The AETA LCOEs are restricted to only utility-scale or large scale technologies
Consequently small-scale technologies (eg small roof-top photovoltaics fuel cells co-
generation and trigeneration) that may be relevant to distributed generation were not
included in the AETA 2012 analysis LCOE cost estimates associated with distributed
photovoltaics are likely to differ substantially from utility-scale photovoltaic systems as a
result of differences in component costs (eg capital costs operating and maintenance
costs) and performance characteristics (eg capacity factor)
132 Organisation of the report
This report is organised in five sections After a brief introduction and purpose of the report
in this section section 2 discusses the changes made to the AETA 2013 Model parameters as
a result of the discussions with Stakeholders and Steering Committee members on the
individual issues and technologies Section 3 presents the issues that were considered but did
not result in the AETA Model parameter changes Section 4 presents in detail the OampM cost
15
changes for wind and solar technologies covered in AETA 2012 Updated LCOE graphs as
well as a comparison of the resultant AETA 2013 Model and AETA 2012 Model LCOEs are
presented in section 5 which also presents concluding comments
16
2 AETA MODEL PARAMETER CHANGES
21 Stakeholder Initiated Changes
Consultations for the AETA 2013 Model update identified the following issues for
consideration
nuclear technology capital costs and lsquofirst year available for constructionrsquo
CCS retrofit thermal efficiency
amortisation period for all technologies and
OampM costs
The OampM issue is discussed in section 4 whereas rest of the issues are discussed below
211 Nuclear Capital Costs
The AETA 2012 report and model presents costs for first of a kind (FOAK) and Nth of a kind
(NOAK) nuclear technologies There could have been some confusion from the original
wording of Section 310 of AETA 2012 report It starts by discussing Gen III plants currently
sold (presumably NOAK) however further in the document Gen III plants are referred to as
FOAK The AETA 2012 report states that the capital costs are based on nuclear power plants
in the US The NOAK value is what is represented in Table 3101 in the AETA 2012 report
and model
Although there are cost adjusting factors used for other technologies studied in the AETA
2012 report there is no adjustment of the US cost base for Australian labour costs and for
adjustment of Australian equipment costs Submissions indicated that an adjustment to costs
should also be used for nuclear to ensure there is commonality in the comparison
This suggestion was considered appropriate and adjustment to the costs for nuclear
technologies was made Based on the factors to convert US rates to Australian rates used in
the fossil fuel technologies ie the factors from the Thermoflow software the new nuclear
capital costs were calculated The multiplier from Thermoflow for labour costs is 205 and
the factor for equipment costs is 13 both US to Australia
Additionally it was submitted that the first year available for construction of nuclear
technologies be extended In support of this the submission argued that nuclear technologies
are examples of generation technology where legislation regulation and public policy
planning is highly region-dependent and must therefore precede deployment by several years
This was considered an appropriate submission and therefore the first year available for
construction in the model has been changed from 2012 to 2020 These changes are shown in
Table 1
17
Table 1 Model Changes Nuclear Technologies
AETA 2012 report reference AETA 2012 model value AETA 2013 update
Technology 37 Nuclear (GW Scale LWR)
Change first year available for Construction
2012
2020
Technology 37 Nuclear (GW Scale LWR)
Convert FOAK Capital Cost to Australian productivity
and commodity costs
4210
6392
Technology 37 Nuclear (GW Scale LWR)
Convert NOAK Capital Cost to Australian productivity
and commodity costs
3470
5268
Technology 38 Nuclear (SMR)
Convert FOAK Capital Cost to Australian productivity
and commodity costs
7908
11778
Technology 38 Nuclear (SMR)
Convert NOAK Capital Cost to Australian productivity
and commodity costs
4778
7116
The overall impact of these parameters on individual technology LCOE changes is given in
the AETA 2013 Model and in Section 5
212 Carbon Capture and Storage (CCS) Retrofit Thermal Efficiency
Subcritical coal technologies with CCS retrofit were reported to have only slightly lower
thermal efficiency values compared with new build supercritical technologies with CCS in
the AETA 2012 Model This was an oversight in the AETA 2012 Model
The AETA 2012 report identified the thermal efficiency to retrofit subcritical brown and
black coal plants as 216 per cent and 301 per cent respectively (Table 312) In the same
table the efficiency for new build supercritical brown and black coal plants is reported to be
208 per cent and 314 per cent respectively
The thermal efficiencies were revised down based on actual operating efficiencies of existing
coal facilities in Victoria and NSW and factored based on the thermal efficiency ratio of new
coal facilities with and without CCS
A reduction in thermal efficiency is to be expected when applying a retrofit CCS to the plant
The CCS factor in the following representation refers the efficiency reduction factors for
adding CCS to a coal fired power station The useful output will reduce from the new
parasitic loads to run the CCS equipment
Thermal efficiency of existing brown coal plant in Victoria is 265 per cent and the CCS
factor is 064 Similarly the thermal efficiency of existing bituminous coal plant in NSW is
355 per cent and the CCS factor is 075
Table 311 and 312 of the AETA 2012 report show a reduction is present when comparing
the supercritical with no CCS compared to supercritical with CCS However the retrofit case
was only provided for the subcritical technology only and no case was included in the AETA
2012 for a subcritical plant with any CCS
A review of the values in Table 312 through comparison to the existing efficiency of
installed black and brown coal fleet in Australia was undertaken For brown coal the current
18
sent out thermal efficiency is 265 per cent for a 500 MW subcritical unit For supercritical
brown coal without CCS the sent out efficiency is 323 per cent Applying the same reduction
factor the thermal efficiency with CCS retrofitted should be 17 per cent in lieu of 216 per
cent as published in AETA 2012 report
For black coal the current sent out thermal efficiency is 355 per cent for a 660 MW
subcritical unit For supercritical black coal without CCS the sent out efficiency is 419 per
cent Applying the same reduction factor the thermal efficiency with CCS retrofitted should
be 266 per cent in lieu of 301 per cent as published AETA 2012 report (Table 2)
Table 2 Model Changes CCS Retrofit Thermal Technologies
AETA 2012 report reference AETA 2012 model value AETA 2013 update
Technology 8 Pulverised coal subcritical plant
with post combustion CCS based on brown coal
(retrofit)
Thermal Efficiency
216
170
Technology 12 Pulverised coal subcritical plant
with post combustion CCS based on bituminous
coal (retrofit)
Thermal Efficiency
301
266
19
213 Amortisation period
There was stakeholder consensus that the operating period for all technologies needs to be set
to thirty years and that the construction time is in addition to the operating time The financial
amortisation period is common for all technologies and is set at 30 years In the AETA 2012
model section 24 (a) nominates that the amortisation period of 30 years is from the
commencement of construction The amortisation period has now been changed (Table 3)
Examples of the change are
Nuclear LWR ndash GW scale In AETA 2012 report amortisation period was 30 years inclusive
of construction and operation The amortisation period has now changed to 36 years (30
operating and 6 years construction)
Solar parabolic trough In AETA 2012 report amortisation period was 30 years inclusive of
construction and operation The amortisation period has now changed to 33 years (30
operating and 3 years construction)
Table 3 Model Changes amortisation period
AETA 2012 report reference AETA 2012 model value AETA 2013 update
Common Amortisation period
for construction and operation
Amortisation period for
operation includes
construction for all
technologies
Amortisation period for
operation to exclude
construction for all
technologies
22 No Carbon Pricing
For the 2013 AETA update the carbon price modifier has been set to zero per cent as the
base value for the results presented in this report with the effect of applying a zero carbon
price to all technologies throughout the study period to 2050 The AETA 2013 Model
however has the option of changing this parameter by the user
20
3 CONSIDERATION OF OTHER ISSUES
This section summarises the issues that were discussed during the AETA 2013 Model Update
with AETA stakeholders but have not led to a change in the model However these issues do
not cover the OampM costs considerations that are detailed in section 4
31 Representation of Uncertainty
The recognition of uncertainty within the model was discussed including both the level of
representation and potential uncertainties with respect to First-of-a-Kind and lsquoEarly Moverrsquo
Technologies
A number of factors were identified that lead to uncertainty in estimates ndash particularly for
emerging technologies For conventional coal and gas technologies even though the
technology is mature the addition of carbon capture introduces cost and performance
uncertainty Cost estimates have inherent uncertainty due to the market uncertainties and
unforeseeable technological developments and due to
- Volatility in equipment pricing
- Volatility in economic conditions (during post Global Financial Crisis) and
- Volatility in labour pricing due to ldquootherrdquo heavy construction projects in specific areas
For technologies where the costs are well understood it was considered that the error bars
should be reduced compared to immediate and emerging technologies and that the error bars
should be lower for technology costs in 2012 compared to later years
There is strong agreement from two key stakeholder submissions with all the factors causing
uncertainty that have been identified in AETA 2012 In particular the labour cost has varied
(increased) significantly due to large construction projects which have increased costs due to
a shortage of labour and a lower productivity due to less experienced personnel The
uncertainties provided in the AETA model are available on a per technology and a per
selected years basis BREE will consider whether or not to include more detail on
uncertainty by technology in the 2014 review of the model
32 Application of Learning Curves
It was raised during the consultation process that the AETA model revision could allow for
learning curve cost reduction assumptions to be altered by the end user This has not been
incorporated in the 2013 update as it is a structural change to the AETA Model
Stakeholders also raised the question as to whether it is possible within the application of
learning curves to distinguish between the potential for cost reductions on manufactured
components like PV panels versus the Balance of Project (BoP) costs which may involve
routine assembly and erection activities which are not subject to significant learning by
doing
However there are opportunities for cost reductions particularly where many repetitive tasks
are involved such as solar field construction modular construction techniques
rationalization of components in the BoP design or reduction in assembly or placement time
21
This is supported in the US Solar Market Insight Report 2012 (Kann 2012) which identified
continued savings in inverter and racking costs as follows
ldquohellip falling equipment costs and fine-tuning of installation practices have made large-
scale solar less expensive QQrdquo
ldquohellip with the continuing maturation of the industry we expect continued focus on
reducing PV balance-of-systems costs (BOS) and that the increased worry over high
penetration PV will drive adoption of 1000Vdc and advanced inverters
respectivelyrdquo and
ldquoMounting structure manufacturers noted that the past year has seen tremendous
pricing pressure accounting for price declines of anywhere between 10 per cent and
30 per cent over the past yearrdquo
Given that the balance of plant costs can also be subject to cost reductions it is not
considered necessary to distinguish learning curves for discrete project costs in the model
33 General Costs Considerations
331 Fuel Costs
The outlook for fuel costs for gas coal and carbon was claimed to have materially shifted
since the AETA 2012 model While there was no evidence provided to support this
consideration will be given to this issue in the 2014 model update
332 CCS Costs
A submission cited the ZeroGen Case Study and sought to clarify the differences in CCS
cost between ZeroGen and lower values estimated for AETA 2012 This is a valid
comparison however BREE notes the following issues which contribute to explaining the
differences The international cost component is as follows AETA 52 per cent ZeroGen 34
per cent With the USD exchange rate AETA 1 ZeroGen at 08 adjusting the AETA value
for exchange rate variation would add A$952kWnet to the AETA value There is a
difference in plant size with AETA at 557 MW net and Zerogen 400 MW net A bigger plant
size would typically provide a lower cost kW installed
Additionally section 112 of Chapter One of the ZeroGen report advises escalation based on
project delivery from 2011 to 2017 AETA costs are for 2012 basis and do not include
escalation beyond this time A portion of the Zerogen costs will be inflated over the
comparable AETA cost Also section 113 of Chapter One of the ZeroGen report identifies
significant enabling works This is likely to be more inclusive than considered in the AETA
2012 report as identified in section 23 (a)
Overall it is considered likely that a number of estimate basis items in the ZeroGen study are
different and once equalised will show a smaller difference between the AETA and
ZeroGen values Therefore there is no immediate action but the basis and assumptions of the
model may be reviewed during 2014 AETA update
With regard to CCS efficiency one submission proposed that the AETA estimates were
overly optimistic However no references were cited to support this view and no change has
been made to the model
22
333 Opportunity Costs
A submission was made that footnotes be included regarding retrofit costs to indicate that
make-up power costs are not included This was not adopted because AETA parameters for
each technology are calculated for that technology alone and do not consider the impact of
reduced output of a retrofit project where additional output needs to be generated from
alternate higher cost generation Opportunity costs are specifically related to business cases
for specific projects and are not considered for any cases presented in the AETA report
Moreover retrofitting does not make electricity generation uncertain or intermittent It only
lowers the flow of generation at a constant rate (due to lower thermal efficiency) relative to
the non-retrofit case
34 Capital and Construction Costs
A submission was made to update the AETA values for the mid-point capital cost for several
technologies based on a study provided in support of the submission The technologies
asserted were
IGCC (Integrated Gasification and Combined Cycle) with 90 per cent capture fuelled
with Victorian brown coal
IGCC with no capture fuelled with black coal
IGCC with 90 per cent capture fuelled with black coal
Pulverised Fuel power plant with 90 per cent capture fuelled with Victorian brown
coal
Pulverised Fuel power plant with 90 per cent capture fuelled with black coal and
OCGT with no capture fuelled with natural gas
There is a key difference in the magnitude of the labour component in Australia compared
with the labour costs associated with the supporting material (from the USA) While no
changes have been made to the model in this update the ldquoshort termrdquo impact of labour
pricing on technology costs may be considered in further updates
Similarly it was submitted that the capital cost values for combined Cycle Gas Turbine
(CCGT) (with and without capture) could be revised As no documentary evidence was
provided to support this no change was made
For Direct Injection Coal Emulsion (DICE) power plant with no capture fuelled with
Victorian brown coal it is also suggested that the values be reviewed with a number of
papers provided for reference However these papers do not address capital cost in any depth
and it is unclear if the balance of project costs included are comparable with AETA DICE
technology is not mature and is probably best described as in the demonstration to
deployment phase of development which brings uncertainty into the cost analysis Therefore
data is needed to substantiate this submission As this was not available at the time of
preparing this report consideration of this issue is deferred to a later time when the necessary
data is available
An increase in the capital costs for Solar thermal trough (6 hrs storage) and Solar thermal
central receiver (6 hours storage) were proposed based on a supporting study by the Electric
Power Research institute (EPRI) The proposed values are substantially larger than the AETA
23
2012 but it is not clear what basis is used to generate these revised values A separate
submission received from another AETA stakeholder has supported the AETA values
Additionally the cited reference for solar thermal trough the Energy Power Research
Institute (EPRI) plant configuration is based on air cooling ndash while for AETA the plant
configuration assumes water cooling The difference in plant configuration will account for a
small part of the difference The AETA value is based on a reference report as issued in 2012
by the US National Renewable Energy Laboratory (NREL 2012)
The AETA value for the central receiver technology is based on a small (20MW) plant
(Gemasolar) with factors for adjustment to field size for thermal storage capacity and post
FOAK learning These factors will align with increased uncertainty in the AETA value It is
likely that additional cost information may now be available for the Brightsource Ivanpah
plant (no storage) and other tower plants being considered under construction
Further investigation of these issues has been sought with stakeholders but is as yet
unavailable
Another suggestion was made to consider capital costs on a component basis The capital
costs used in AETA 2012 for existing technologies were based on actual costs that could be
sourced on published documents (locally andor internationally) or from WorleyParsons
internal data For developing technologies costs were not considered on a component level
For this reason in technologies that are not commercialised a number of assumptions would
need to be made which may limit lsquorealrsquo costs being available No change to the model arose
from this submission
A reassessment of the construction expenditure profile for concentrating solar power (CSP)
technology options was sought in another stakeholder submission and supported by a
referenced report (IT Power 2012) However the plant sizes considered in the AETA report
are larger capacity (100 MW+) than those discussed in the cited report and consequently
have a longer duration construction period As three years is considered to be an appropriate
time period to spread the construction expenditure profile no change to the model was made
35 Costs Associated with Solar Technologies
A change to the model was sought with regard to the significant downward trends in the cost
of solar PV The stakeholder submission cited pricing data from the Australian Photovoltaic
Institute (APVI) Consultation with the APVI identified that evidence based information for
utility scale PV costs in Australia is limited because Australia has no PV systems 100 MW or
larger It is acknowledged however that there is significant and continued volatility in the
solar PV market including volatility due to competition oversupply in the PV module
market as well as continued price reductions for balance of system and installation costs
A$338 Wnet was a reasonable valuation for 2012 AETA The AETA 2012 value will be
maintained but may be reviewed in the 2014 model update
It was also suggested that solar thermal costs could be better represented in the model by
allowing for different periods of storage rather than a standard 6 hours The AETA 2012
scope was based on fixed plant designs which included fixed thermal storage sizing where
thermal storage was included With thermal storage there are a number of variables that can
be considered including differing field sizes (solar multiple) as well as actual thermal storage
capacities This is likely to add significant complexity to the report and to the model the
benefit of which at this stage does not warrant the changes
24
36 Costs Associated with Nuclear Technologies
It was submitted that consideration be given to including the impact on LCOE for nuclear
technology of the relatively high insurance costs for nuclear technologies This issue will be
considered in the 2014 review of the AETA model However insurance costs or plant
decommissioning costs are not considered for any of the 40 AETA technologies
Also the OampM improvement rate for Nuclear was not reconsidered as there is no OampM
improvement rate for Nuclear in the model
37 Further Technologies
A proposal was received which recommended that further technologies (DICE power plant
based on black coal with and without capture and DICE brown coal with capture and
medium speed DICE technologies) be incorporated into the AETA Model However as
mentioned earlier this update of the AETA 2012 Model only considered the technologies
included in that model This update of the model is not intended to broaden the technologies
38 Auxiliary Loads
Another example used for the purposes of drawing comparisons with the AETA model was
the SaskPower Post Combustion Retrofit It is difficult to distil the SaskPower project data
into a direct comparison with the AETA study and consequently there is insufficient data
certainty to warrant changes to the AETA 2012 values The SaskPower Post Combustion
Retrofit was also cited as to its conservative auxiliary loads for brown and black coal
However upon further investigation this was not substantiated within the SaskPower
example
25
4 WIND PV AND CSP OPERATIONS AND MAINTENANCE (OampM) COST UPDATE
41 Operation and Maintenance Costs
OPERATING AND MAINTENANCE COST DEFINITIONS
In considering the costing of OampM there is no absolutely clear definition of which costs
should be considered as fixed and which variable with the breakdown varying based on a
range of issues including technology location and resource type For this reason in the future
AETA reports OampM costs may be compared in terms of annual total operating expenditure
(OPEX) per MW of generation This method is widely used by most international institutions
to analyse OampM costs and to avoid subjective considerations
For this report fixed and variable costs are reported to provide direct comparison with AETA
2012 In this regard in general fixed costs are independent of the electrical generation of the
plant and are expressed as annual cost per MW capacity Fixed costs include items such as
fixed labour
equipment and
vehicles
Variable costs are proportional to the electrical generation of the Plant and are expressed as
cost rate per kWh energy output Variable costs include items such as
variable labour
consumables and
spare parts
As both public and private domain material vary in the way they approach and report on
fixed and variable maintenance within the following text where an interpretation has been
used for comparison purposes this is described
A submission was made to remove the operations and maintenance (OampM) cost escalation
factors This was not taken up as there is an increase in the OampM costs over CPI which is
borne out historically A review of the basis for this escalation determined that the
underlying assumptions were appropriate The review also considered adopting a generic
learning curve approach for OampM improvement rates as was suggested in one submission
This was not adopted as the model has an OampM improvement rate (set at 02 per cent per
annum) which can be varied by the user for wind and solar technologies This value accounts
for more efficient practices balancing the increase in labour and material costs over and
above CPI However changes to OampM improvement rates for selected technologies were
made as mentioned earlier OampM improvement rate values may be further considered for
emerging technologies in 2014 AETA study
A number of submissions referred to the improvement rate of OampM costs with evidence for
existing technologies to support these rising at 150 per cent CPI It was suggested that for
26
developing technologies it could reasonably be assumed that there would be reductions in
OampM between the first commercial installation and subsequent installations
While it is generally acknowledged that the LCOE of delivered energy from wind is falling
within the literature there is conflicting evidence around trends in OampM costs with recent
reports indicating both significant decreases and increases in OampM (see section 432)
Solar thermal plants consist of technology components that can be considered mature (eg
steam turbine) and components that are undergoing further development such as the solar
field and thermal storage Solar thermal plants require manning for operation as opposed to
wind turbines that do not require the same level of manning
A recent article (Muirhead 2013) advised for the Solar Energy Generating Systems (SEGS)
plants in California that have been operating since the early 1990rsquos ldquoMy understanding is
that the performance of the SEGS plants has significantly improved over time This is due
primarily to replacement of first generation receivers with newer receivers that are much
more efficient OampM practices at the plants have also improved over time based on the now
long history of operating these plants resulting in increased output in addition to reduced
OampM costs
In the AEMO report 100 Per Cent Renewables Study - Draft Modelling Outcomes Scenario 1
assumes that rapid technology transformation will drive real reductions in OampM costs
outweighing any increases projected in the AETA 2012 so OampM costs reduce by 125 per
cent by 2030 and 25 per cent by 2050 Scenario 2 uses the AETA 2012 assumption that
OampM costs escalate at around 150 per cent of Consumer Price Index (CPI) which leads to
cost increases of 27 per cent by 2030 and 46 per cent by 2050 It should be noted that the
Scenario 1 reductions are assumptions without further analysis of what will bring the
assumptions to fruition
In AETA 2012 the common OampM improvement rate for most technologies is set at 02 per
cent and can be varied as a user input The OampM improvement rate for emerging
technologies solar thermal and photovoltaic technology options and offshore wind is set to
25 per cent and can also be varied as a user input The improvement rate is now compounds
on the previous yearrsquos value
The OampM improvement rate values may be further considered for emerging technologies in
2014 AETA study
42 Operating and Maintenance (OampM) Changes in summary
As part of the Model Update special emphasis was placed in this report on the Operational
and Maintenance (OampM) costs and OampM improvement rates for all wind solar thermal and
solar PV renewable technologies covered in AETA 2012 As mentioned earlier this took into
account relevant Australian and international reports public domain information private
sources as well BREE and WorleyParsonsrsquo in-house experience The updated OampM values
are shown in Table 4 Reductions in CSP OampM costs of between 8 per cent and 27 per cent
were obtained in comparison to values provide in AETA 2012 report
The review included a detailed review of a report by IT Power cited as part of one of the
stakeholder submissions In that report reference is made to a case where $18MWh of OampM
costs comes from 64MW trough plant however it does not specify the relevant location hour
27
of thermal energy storage (TES) capacity factor type of cooling and back-up fuel and
therefore cannot be fully analysed nor used towards this AETA update
OampM costs for solar thermal plants are significantly affected by the costs of manpower To
demonstrate this with an example $18MWh for a 100MW plant with a 23 per cent capacity
factor (the IT Power report consideration) would result in an annual OampM cost of
approximately $36 million A 100MW plant will need at least 28 full time employees to be
properly manned 7 daysweek as there needs to be multiple shifts With this amount of
labour there are insufficient funds for site services utilities and materialsmaintenance If the
value is based on another location such as the Far or the Middle East region where labour
costs are significantly lower then a lower OampM cost may be feasible however for Australia
this does not appear to be feasible
The changes to OampM values for the 2013 AETA model refresh are summarised below
Table 4 Model Changes OampM costs
AETA 2012 report reference AETA 2012 model value AETA 2013 update
Section 23 Technical Assumptions
Operating and Maintenance Cost
Estimates
OampM improvement rate 02per
cent all technologies
OampM improvement rate maintained at
02per cent for
Coal based technology options
Gas based technology options
Solar thermal hybrid options
Onshore wind
Biomass technology options
Wave technology options
Geothermal technology options
Nuclear technology options
OampM improvement rate changed to 25per
cent for
Solar thermal technology options
Photovoltaic technology options
Offshore wind
The OampM improvement rate is compounded
from the previous yearsrsquo value
Section 33 Solar thermal
technologies
Solar thermal - Parabolic Trough wo
storage
Fixed OampM (AUS$MWyear)
Variable OampM (AUS$MWh)
60000
15
59176
1519
Solar thermal - Parabolic Trough with
storage
Fixed OampM (AUS$MWyear)
Variable OampM (AUS$MWh)
65000
20
72381
1139
Solar thermal - central receiver
technology wo storage
28
AETA 2012 report reference AETA 2012 model value AETA 2013 update
Fixed OampM (AUS$MWyear)
Variable OampM (AUS$MWh)
70000
15
58285
707
Solar thermal - central receiver
technology with storage
Fixed OampM (AUS$MWyear)
Variable OampM (AUS$MWh)
60000
15
71312
565
Solar thermal - Linear Fresnel wo
storage
Fixed OampM (AUS$MWyear)
Variable OampM (AUS$MWh)
60000
1500
64105
1519
Solar thermal - Linear Fresnel with
storage
Fixed OampM (AUS$MWyear)
Variable OampM (AUS$MWh)
65000
20
72381
1139
Section 35 Photovoltaic
technologies
PV ndash non tracking
Fixed OampM (AUS$MWyear)
25000
25000 (no change)
PV - Single Axis Tracking
Fixed OampM (AUS$MWyear)
38000
30000
PV - Dual Axis Tracking
Fixed OampM (AUS$MWyear)
47000
39000
Section 36 Wind Technologies
Wind Onshore
Fixed OampM (AUS$MWyear)
Variable OampM (AUS$MWh)
40000
12
32500
10
Wind Offshore
Fixed OampM (AUS$MWyear)
Variable OampM (AUS$MWh)
80000
12
77600
30
43 Wind
431 Introduction
This Section reviews onshore and offshore wind operations and maintenance (OampM) costs
used in AETA 2012 The values scrutinised are the fixed and variable OampM given in Table
361 of that report summarised in Table 5 below
29
Table 5 Wind OampM costs used in the AETA 2012 report
Option Fixed OampM (AUS$MW) Variable OampM (AUS$MWh)
Onshore 40000 12
Offshore 80000 12
OampM covers all of the services required to keep the wind farm operating as contracted to
supply energy and renewable energy certificates for its lifetime inclusive of
turbines and all balance of plant (roads buildings electrical equipment SCADA
control equipment) up to the high voltage connection point on the wind farm
substation
labour (both trades and professional)
facilities (workshops stores offices)
equipment (tools jigs vehicles rigging safety equipment craneage)
spare parts and
consumables (such as oil grease and office consumables)
Windfarm size was not specified in AETA 2012 however it was noted that wind farms
greater than 100MW are becoming more common Since then within Australia wind farms
of larger and smaller sizes have been constructed for example the 420 MW Macarthur Wind
Farm in Victoria and the 55 MW Mumbida Wind Farm in Western Australia with both larger
and smaller wind farms under proposal For this review a nominal size of 100-150 MW is
used as representative of current and future facilities
432 Review of Evidence
As mentioned earlier the review of public literature by BREE and WorleyParsons the
procurement of private studies consultations with owneroperators in the wind farm OampM
sector in Australia AETA Stakeholders and project Steering Committee members were used
to assist the current Model Update process Where possible these sources are noted in the
text however some of these sources have asked to remain anonymous and where so the
term ldquoprivate sourcerdquo has been used
As noted by one reviewer in NREL 2011 OampM cost information in the public domain in
both quantum and quality is poor and the situation appears no better in 2013 particularly in
the discrimination of fixed and variable costs One reason for this is the commercial and
increasingly competitive nature of the sector with wind farm OampM now a significant
business worldwide with subsequent confidentiality around actual costs
What constitutes wind farm OampM is also changing This is driven in part by technological
change as the wind fleet ages as new turbines become larger and more sophisticated
particularly offshore Competition in the provision of OampM services is also changing with
maturing of the wind energy product As an example the following industry trends are now
evident
30
a growing role of independents in the wind OampM market ndash around 25 per cent of the
wind fleet in the US is expected to be operated and maintained by independents by
2025 (Ebert and Ware 2013) as opposed to original equipment manufacturers (OEMs) -
wind is largely a commodity market and easier for new participants to enter something
not necessarily seen with other generation technologies
tighter supply markets ndash general economic volatility is tightening the supply and
project development chain for wind moving interest into the OampM sector bringing
price volatility and more competition
a more sophisticated asset management model ndash where OampM providers are linking
operational data with long term condition monitoring output forecasting and work
order scheduling to deliver what is termed ldquolifecycle optimisationrdquo squeezing more
energy out of the asset
older turbines exceeding planned maintenance budgets ndash with the chief issue being
keeping the variable OampM from unforeseen breakdowns
a push for larger turbines particularly offshore (5-10 MW) and in deeper waters and
linking OampM to turbine contracts ndash there is evidence (including in Australia private
source) that wind farm OampM is becoming an even more significant bargaining
component of turbine supply contracts where lower supply costs are balanced by
longer OampM contracts
Costs of wind OampM are difficult to summarise as they are dependent on many issues As just
one example in the NREL 2011 study cited earlier a wide variability in wind farm OampM
costs was found across a range of countries (Figure 1) This reference demonstrates this
variability from the average reference case in terms of Levelised Cost of Energy (LCOE)
31
Figure 1 Effect of country variables on LCOE of wind plant
Source NREL (2011)
Other issues which affect the contracted cost of OampM for wind include
regional variations in labour and transport costs
wind farm environment particularly wind regime and proximity to the ocean
(corrosion)
the maturity and availability of wind turbine technicians
the spread of facilities geographically and the wind farm asset sizes in a portfolio
the turbine type and brand particularly the support establishment within a Region
the age of the asset OampM history and existence of Type (or systematic) failures of
major components
the ability of the OampM provider under the contract to source third party spares andor
try varied maintenance practices and
the nature of the OampM contract ndash for example does it include risk reward elements or
have a link to the wind turbine supply contract or is it a ldquoproduction availabilityrdquo
contract type
While it is generally acknowledged that the LCOE of delivered energy is falling for wind
technology (Hand 2013) within the literature there is conflicting evidence around trends in
OampM costs with recent reports indicating both significant decreases (BNEF 2013) and
increases (Ebert and Ware 2013) It is generally acknowledged that increased competition in
the OampM market is delivering lower cost service provision but this may in part be offset by
an ageing fleet requiring more variable maintenance and a more sophisticated and costly
32
response Several studies have demonstrated that the costs of maintaining wind turbines
generally increase with time following a trend similar in shape to that in Figure 2 (Hand
2013) with estimates in Albers (2009) indicating a doubling in turbine OampM costs by mid
plant life The term COD in Figure 2 refers to commercial operations date
Figure 2 Typical cost increasing trends in wind farm OampM costs with commercial operations
date
Source Adapted by WorleyParsons from Houston (2013)
In Australia this trend is also evident in post 10-year aged machines (private source)
particularly in relation to variable maintenance The nature of any similar increase with more
modern turbines is unpredictable although turbine availability is improving and there is
evidence that OampM costs with each generation of turbine are lowering see Wiser et al
(2012)
The OampM costs for offshore wind farms are particularly difficult to estimate as the industry
is still at the early stages of development including the progression of much larger turbines
into deeper water and the more complex nature of the task Such progression is indicated in
Figure 3 taken from RolandBerger (2013) which indicates an expected decrease in OampM
costs These costs are of the same order of that published in other recent publications UK
Crown Estate (2012) and US DoE (2013)
33
Figure 3 Trends in offshore wind farms and estimated impact on LCOE
Source RolandBerger (2013)
433 Updated OampM Figures for Australia
It is not a simple matter to transfer international costs to Australia as despite trends there are
significant differences between regions including
size of market ndash despite growth the Australian wind market is small with respect to
other world regions For example the total wind fleet is 4 GW (CEC 2013) for
Australia versus 60 GW for the US (AWEA 2013)
labour and material rates in certain parts of Australia are high by world standards
the logistics of getting to and within Australia generally involve longer distances than
other areas of the world particularly due to the remoteness from major equipment
suppliers
volatility of the Australian dollar particularly against the US and
the size of Australian wind farms tends to be larger
These differences can be seen in Figure 4 supplied by a turbine equipment supplier (private
source) and showing the relative OampM costs (per MW) and technician numbers (per 100
MW) across various world regions in 2012 for wind turbine maintenance only and excluding
balance of plant Numbers and scales between the two indices have been removed to protect
the confidentiality of this supplier with data believed to cover the entire global portfolio
under management This shows a significant difference between regions for onshore in both
indices for example almost a 45 per cent difference in costs between Europe and America
Australia would sit within ldquoAsiaPacificrdquo and while the Figure indicates generally lower
OampM costs and higher technician numbers for this region this presumably covers a very
diverse area (including South East Asia New Zealand and Oceania) which may skew results
34
Unlike many larger global markets the wind OampM sector in Australia is dominated by
turbine equipment suppliers with original equipment manufacturer (OEM) contracts
estimated to cover more than 95 per cent of the fleet The evidence for this is mostly
anecdotal although a number of smaller independent suppliers are now known to be
undertaking full service OampM for older plant (gt10+ years) with many of the drivers for this
covered in Ebert et al (2013) There is also evidence (private source) that wind turbine
suppliers in Australia are seeking OampM contracts with much longer terms and tying these to
reductions in turbine supply prices This may indicate a lack of competitive pressure on
OampM pricing in the near to mid-term and as the size of the overall market is small it is
unknown whether independents will grow market share as has been the case in many larger
global markets see for example Deloitte amp Touche (2012)
The most recent contemporary literature comments on onshore wind farm OampM pricing in
Australia and surrounds that could be found in the public domain and not used for the AETA
2012 work are from Hassan (2011) and Deloitte (2011) These are summarised with other
new international references cited in Table 6 with assumptions on any conversions noted
below the table As no offshore wind farm projects have been progressed in Australia the
table includes values from new sources for offshore projects from the international public
domain literature - the significant difference to onshore costs is evident in the values
Figure 4 OampM Costs (per MW) and Technician Numbers (per 100MW) for total wind turbine
OampM (Opex)
Source Private - values and scales removed to protect confidentiality
From Table 6 and considering the differences in markets it appears that for onshore wind the
AETA 2012 estimates may be slightly high with an updated AETA 2013 recommendation
given in Table 7 This value has been arrived at by considering
the size of the Australian wind market and lack of competitive pressure from
independent OampM service providers
35
supply side pressures on OEMs driving them to protect their OampM businesses and
lowering costs
the likely increase in fleet installations to comply with RET legislation skewing the
fleet age to more a modern generation of turbines although it is noted that there is some
uncertainty around long term OampM cost trends particularly variable maintenance ndash an
asset age of around 5 years is assumed here
uncertainties in what is included in referenced values and differences in markets and
advice from actual asset owners and OampM providers (private sources) on current actual
costs
Table 6 Comparison of AETA 2012 wind OampM estimates with new references for 2013
Source Region
Fixed OampM
(AUS$MW)
Variable OampM
(AUS$MWh)
Total OPEX
(AUS$MW)
On
sh
ore
AETA 2012 Australia 40000 12 799451
Houston 2013 US - - 35-380002
BNEF 2013 Global - - 25000
3
Private Source (2013) (gt 10 yr old
plant) Australia - - 70000
Private Source (2013)
(lt 2 yr old out of warranty plant) Australia - - 55000
Hassan 2011 Australia - - 83-99000
4
Deloitte 2011 New Zealand - - 450005
Off
sh
ore
AETA 2012 Australia 80000 12 1262526
Crown Estate 2012 UK - - 275000
7
Hassan (2013) UK - - 2391567
RolandBerger 2013 Europe - - 198000
8
US DoE 2013 US - - 144970
9
1 Assumes a 38 capacity factor
2 USAUD = 109 extrapolated from Figure approximately to 2013
3 EUROAUD = 142 uncertain if this includes all balance of plant or VOM and only includes OEM providers
4 Assumes a 38 capacity factor
5 Assumes NZAUD = 084 a 38 capacity factor and the mid-range estimate for OampM
6 Assumes a 44 capacity factor
7 Assumes GBPAUD = 167 and taking midpoint of estimates stated
8 Assumes GBPAUD = 167 and taking value for 3MW turbines
9 Assumes USAUD = 109
36
The figures shown for onshore projects in Table 7 represent a 15 per cent decrease in the
expected OampM costs of wind farms in Australia compared to AETA 2012 This change
reflects the volatility in this market noted in previous sections and in referenced material
internationally plus the appearance of significant downward pressure on wind OampM prices
primarily through increased global competition The values allow for the rising price of
turbine OampM as the turbine ages during its life
For offshore wind it appears that the OampM costs in AETA 2012 are too low and although it
is tempting to align costs with the most recent US figures due to their lower costs and similar
coastal conditions to Australia the European offshore fleet is significantly larger and more
mature Average figures across the 2013 referenced material including Europe is
recommended This is also shown in Table 7 and represents a significant increase in estimate
costs (around 33per cent) which reflects this evolving sector
There is very little contemporary information available on the breakdown of fixed and
variable maintenance on wind plant making judgment around this for the AETA requirements
is difficult However there is some published but copyrighted material eg GlobalData 2012
which combined with others (private sources) indicates that for onshore and offshore wind
plant respectively a 5050 and 4060 FOM VOM split is appropriate This has been used to
adjust the total OPEX figure in Table 7 to the AETA scheduled and variable indices
requirements using a 38 per cent and a 44 per cent capacity factor for onshore and offshore
projects respectively
Table 7 Recommended AETA (2013) values
AETA (2013) update Fixed OampM
(AUS$MW)
Variable OampM
(AUS$MWh)
Total OPEX
(AUS$MW)
Onshore $32500 $10 $65790
Offshore $77600 $30 $194000
44 Solar Photovoltaics (PV)
441 Introduction
This Section of the report focuses on the OampM costs for ground-mount photovoltaic (PV)
technologies broken down by the following mounting system configurations
Fixed Tilt (FT)
Single Axis Tracking (SAT)
Dual Axis Tracking (DAT)
Although different PV panel technology types (eg poly-crystalline mono-crystalline or thin
film CdTe) affect the capacity factor and land use the OampM costs are comparable The
estimates for this Report are based on polycrystalline PV technology which provides an
average cost on a per Watt basis with mono-crystalline OampM costs being slightly lower and
thin film OampM costs being slightly higher
With the aim to provide comparable results between technologies WorleyParsons has
analysed and updated the PV OampM costs in terms of both fixed operation and maintenance
37
costs (FOM) and total operating expenditures (OPEX) based on reference plants of similar
characteristics
Assumptions interpretations and considerations based on their in-house data and global
market trends are described in the following Sections
442 Review of the Evidence
Since the AETA 2012 report release few new public domain reports related to OampM costs
for PV systems have been published To confirm this the following organisations have been
consulted by WorleyParsons to provide the 2013 OampM costs update for the selected PV
configurations
International Renewable Energy Agency (IRENA) (wwwirenaorg)
International Energy Agency (IEA) (wwwieaorg)
The World Bank (WB) (wwwworldbankorg)
The US National Renewable Energy Laboratory (NREL) (wwwnrelgov)
Solar Energy Industries Association (SEIA) (wwwseiaorgau)
European Photovoltaic Industry Association (EPIA) (wwwepiaorg) and
Solar Electric Power Association (SEPA) (wwwsolarelectricpowerorg)
Upon review of the available information when compared to AETA 2012 the listed
organisations do not have any new public information related to large-scale PV OampM costs
If OampM costs are mentioned they are normally referenced as a per cent of the total Capital
Expenditure (CAPEX) for the plant (around 1 per cent) and provide little useful information
about OampM Cost changes
Due to insufficient detailed and recent information in the public domain WorleyParsons
obtained the following market reports from Photon a private organisation focused on market
news political discussions and technology analysis for the PV industry
Photon 2013 ldquoThe True Cost of Solar Power - Temple of Doomrdquo and
Photon 2013 ldquoSolar Annual 2013 - Build your Empirerdquo
These private reports had minimal focus on OampM costs To provide further input in this
area private OampM service providers were contacted for pricing estimates and market trends
443 AETA 2012 OampM PV costs report comparison
Typical power plant OampM costs are expressed as a combination of a variable component
(proportional to generation) and a fixed component (occurs irrespective of generated output)
Since the generation of a PV plant is dependent on solar radiation (not requiring fossil fuel or
water which make up the major components of variable costs for conventional generation) it
is typical to express the OampM costs only as Fixed OampM (FOM) costs proportional to the
plant size due to the simplicity of PV systems The AETA 2012 report follows this practice
and estimates the PV OampM costs as FOM only relative to plant size (kW) expressed on a per
year basis
38
In order to facilitate comparisons of these costs with other electricity technologies the FOM
costs in the AETA 2012 report are also presented as OPEX costs per MW of generating
capacity per year
ASSUMPTIONS AND CONSIDERATIONS
The following costs are included in the FOM estimates as an annual cost per kW capacity
labor and administrative expenses
panel washing (twice per year at $300 kl for water)
weed abatement (seasonal herbicide applications)
inverter replacement reserve (replaced at operational year 10) and
materials and maintenance spare parts civil works preventative and corrective
equipment maintenance
Although the cost of water is variable depending on location and usage it is such a small
portion of the total OampM costs that it is adequate to assume it as a fixed cost using the
assumptions listed above
AETA 2012 PV OampM COSTS COMPARISON REPORT
The technical characteristics of the reference PV plants used in the AETA 2012 report have
been extracted from the AETA 2012 Model (Version 1_0 Rev B BREE 2012) and are
summarised in Table 8
Based on this information the following parameters for the PV technologies are estimated
Total net energy production in terms of MWh sent out per year
Total plant acreage
FOM in terms of USD per year and
Total OPEX costs in terms of USD per year and USD per total net energy production
per year
39
Table 8 AETA 2012 reference plants technical characteristics and OPEX costs
Plant Characteristics Units Fixed Tilt (FT) Single Axis Tracking (SAT)
Dual Axis Tracking (DAT)
Plant Characteristics
Plant Net Capacity MW 100 100 100
Capacity Factor per cent 21 24 26
FOM $kWyear 25 38 47
Net Energy MWhyear 183960 210240 227760
Plant Acreage acres 500 800 900
Total FOM $year 2500000 3800000 4700000
Total OPEX $year 2500000 3800000 4700000
Total OPEX $kWh 00136 00181 00206
Total OPEX costs are between 00136 and 00206 USDkWh as shown in Table 8 above
These values are conservative cost estimates but reasonable for a large-scale PV plant with
comprehensive OampM service As is expected the FOM or OPEX costs increase as the plant
footprint increases and the complexity of the mounting system increases However the
increases to single and double axis tracking technologies are larger than would be expected
The increased complexity of the trackers does add costs to OampM in terms of labor parts and
even physical plant size but these additions are minor in comparison to the larger OampM
budget items such as the inverter replacement reserve and general electrical maintenance
which are irrespective of mounting system
These values although conservative still show the cost reductions from the industry learning
curve and expanded competition over the past few years when compared to past estimates of
OampM costs This can be seen in the following Table 9 of Fixed Tilt (FT) costs which
provides some estimates found in previous publications by IEA (2008) and EPRI (2010) The
tracking estimates are not shown since minimal data is available This corresponds to the
historical market trend of the industry being more willing to install fixed tilt systems rather
than tracking systems due to lower costs and technology risk
Table 9 Comparison of historical estimated PV and OampM costs in the public domain
PV Configuration OampM Costs Units IEA 200810
EPRI 2010 AETA 2012
Fixed Tilt (FT) FOM $kWyear 40 32 to 37 25
values in Italics are derived from reported data
10
Report assumed 1 of capital costs and 23 capacity factor
40
45 AETA 2013 PV OampM Costs Update
Using the same plant characteristic assumptions as the 2012 AETA Model the 2013 OampM
costs were estimated by WorleyParsons based on the references described in review of the
evidence in Section 442 The comparison of the AETA 2013 and 2012 OampM costs are
presented in Table 10 below
Table 10 2013 PV OampM costs compared to 2012 PV OampM costs PV Configuration OampM Costs Units AETA 2012 WorleyParsons
2013 Update
Fixed Tilt (FT) FOM $kWyear 25 25
OPEX $kWh 00136 00134
Single Axis Tracking (SAT) FOM $kWyear 38 30
OPEX $kWh 00181 00141
Dual Axis Tracking (DAT) FOM $kWyear 47 39
OPEX $kWh 00206 00173
Although the OampM costs for FT systems are approximately the same SAT and DAT OampM
costs reduced by around 20-30 per cent in this 2013 update compared to the AETA 2012
report The consistency of the FT costs is reasonable and expected to continue for the next
few years as discussed further in Section 451
Regarding the SAT and DAT costs although there have been improvements in the design of
trackers for PV applications this OampM cost reduction is due to a better understanding of the
costs associated with electrical and tracking system maintenance The cost differences
between tracking systems was corroborated by quotes from private OampM service companies
who indicated that there was only a slight increase in costs from FT to SAT but a larger
increase in costs from SAT to DAT
As compared to the references mentioned in Section 442 the updated cost estimates are
conservative Table 11 compares the estimated 2013 OampM costs with those references
However since these publications focused primarily on the CAPEX with very general OampM
cost assumptions the OampM costs presented therein are not considered representative
baselines for large-scale solar projects Furthermore they attest to the industryrsquos tendency to
focus strictly on installation costs and not lifecycle costs which is discussed further in Section
451
41
Table 11 2013 updated OampM costs compared to new referenced OampM costs (7-2) PV Configuration
OampM Costs
Units WorleyParsons 2013 Update
11
NREL 2013
12
IRENA 2013a
13
Photon 2013
14
Private OampM Service Providers
201315
Fixed Tilt (FT) FOM $kWyear 25 235 17 to 21 18 17 to 23
OPEX $kWh 00134 00216 to
00383
00121 to 00266
00098 00094 to 00127
Single Axis Tracking (SAT)
FOM $kWyear 30 Not provided
Not provided
Not provided
25 to 27
OPEX $kWh 00141 Not provided
Not provided
Not provided
00136 to 00147
Dual Axis Tracking (DAT)
FOM $kWyear 39 Not provided
Not provided
Not provided
32 to 34
OPEX $kWh 00173 Not provided
Not provided
Not provided
00174 to 00185
values in Italics are derived from reported data
451 OampM Learning Rates
In the rapid PV industry growth of the last three years WorleyParsons and anecdotal
experience is that PV was considered generally to require little to no maintenance causing a
general disregard for OampM planning This appears to have resulted in complications as
owners struggle to resolve reliability performance and budget issues as the projects mature
(multiple private sources) Although the maintenance costs are smaller compared to standard
power plants OampM awareness has been increasing in the industry and therefore the OampM
cost estimates have subsequently increased
This is supported through the recent focus of OampM at PV conferences (such as Sandia
National Laboratory and Solar Energy International events) on increasing the investment in
OampM practices in addition to improving the current practices products and services so that
PV plants can be better maintained to achieve higher reliability throughout the plant life
cycle Currently the majority of OampM expenses for PV systems consist of maintaining and
replacing the inverters followed by the Balance of System maintenance In general once the
appropriate level of investment in OampM for PV is reached then OampM costs will begin to
decrease as the following issues develop to maturity
technology improvement
inverter design for reliability and longevity
data monitoring for preventative and corrective maintenance support
system efficiency to increase system output for the same OampM expense
decreased capital costs for major equipment
decreased spare parts costs
11
See assumptions in Section 433 and 443 12
Report assumed 250kW rooftop at 7 to 10 capacity factor 13
Report assumed 1 of CAPEX and 9 to16 capacity factor 14
Values derived from the global weighted average calculations assuming 21 capacity factor and 20 year lifecycle Report assumed a
simple percentage of average selling price 15
Quote excluded weed abatement panel washing and inverter replacement reserve which were supplemented from the WP estimate
Calculations assumed 21 capacity factor
42
industry maturity and stability
reliable OEM support from product consistency and commercial stability
improved codes and standards for PV equipment system design installation
commissioning and OampM and
experience
trained and experienced personnel in the installation and maintenance of PV plants
In line with this trend owners system designers installers and OEMs are now including
OampM considerations in their finances designs services and products Even though there
have been and will continue to be cost reductions in OampM due to the industry maturation
stabilization and competition those cost reductions are balanced with the necessary
increases in OampM investment to meet the maintenance needs of existing and planned PV
plants resulting in a level OampM cost estimate for the next five years
Photon (2013) follows this assumption of consistent OampM costs for the next ten years as well
as WorleyParsons discussions with OampM service providers Therefore the assumption that
PV OampM costs will remain somewhat constant over the next five years before reducing again
appears to follow the projections in the industry
452 Conclusions - PV
The key findings from the AETA 2012 review and update of the PV OampM costs are as
follows
The 2013 WorleyParsons PV OampM costs update resulted in values of
$25kWyear for FT systems
$30kWyear for SAT
$39kWyear for SAT in 2012 USD
Fixed tilt configurations have not seen significant changes in OampM costs compared to
the 2012 AETA estimates while SAT and DAT configurations cost estimates have
reduced approximately 20-30 per cent based on a better understanding of the associated
OampM costs
Values obtained in the 2013 WorleyParsons update are more conservative but are
aligned with values provided by recognised international institutions even though few
detailed OampM breakdowns are available and
OampM costs for PV are expected to remain constant over the next five years before
reducing as the industry matures in both experience and long-term planning
capabilities
43
46 Concentrating Solar Power (CSP)
461 Introduction
This Section of the report focuses on the OampM costs for the following Concentrating Solar
Power (CSP) technologies
Parabolic Trough (PT)
Solar Tower (ST) and
Linear Fresnel (LF)
CSP OampM costs were analysed in terms of
Fixed Operating and Maintenance Costs (FOM)
Variable Operating and Maintenance Costs (VOM) and
Total Operating Expenditures (OPEX)
In order to arrive at comparable results between technologies BREE and WorleyParsons
estimated the OampM costs based on
Reference Plants with similar Solar Plant characteristics localisation net capacity
capacity factor hours of Thermal Energy Storage (TES) and type of cooling system(s)
and
Cost estimate amounts that were updated to 2012 USD
When information was not available necessary estimates were made using WorleyParsonsrsquo
in-house data and based on global market trends observed in various publications
462 Review of the evidence
The following international organisations were consulted to provide the AETA 2013 OampM
costs update for the selected CSP technologies
International Renewable Energy Agency (IRENA) (wwwirenaorg)
International Energy Agency (IEA) (wwwieaorg)
European Solar Thermal Electricity Association (ESTELA) (wwwestelarde)
The World Bank (WB) (wwwworldbankorg)
National Renewable Energy Laboratory (NREL) (wwwnrelgov)
Protermosolar (wwwprotermosolares)
Institute for Energy Diversification and Saving (IDEA) (wwwideaes)
Renovetec (wwwrenoveteces) and
CSP Today (wwwcsptodaycom)
The approach in reviewing OampM costs for the 2013 update for CSP technology was only to
use new sources of information published since the AETA 2012 report was written This was
44
maintained for all but the learning rates estimation which is due to the lack of any new
updated information published since 2012 in relation to this
Upon review of the available public domain information it was found that IEA ESTELA
WB Protermosolar Renovetec and IDEA do not have any new relevant public information
related to CSP OampM costs However IRENA 2013b IRENA 2013c and NREL 2012 are
new references from IRENA and NREL that are considered relevant and which were used in
this report
The information contained in these references did not provide updated costs for all of the
CSP technologies being considered in this Report and the values offered were not provided
in terms of FOM and VOM costs as preferred
Due to the lack of new relevant information in the public domain the AETA 2013 Model
Update process obtained reports from CSP Today a private international organisation
focused on news events reports updates and information for the CSP industry in markets
such as India South Africa Spain USA Chile and MENA regions The Update acquired the
last edition of PT and ST reports CSP Today 2012a and CSP Today 2012b for which OPEX
costs were analysed
463 AETA 2012 OampM CSP costs report comparison
Operating and Maintenance expenses were provided in terms of fixed and variable costs in
the AETA 2012 report and this Model Update has modified these for 2013 for PT ST and LF
technologies based on the references cited above and further consideration of learning rates
for the CSP industry
Most CSP projects with commercial operational experience are parabolic trough technology
as it is the most mature technology and currently more is reported and known about actual
costs than other CSP technologies Nevada Solar One as an example is a 64MWe parabolic
trough plant based in California which was commissioned in 2007 and it is the first plant
built after the SEGS development during the 1980-90s also in California
Andasol 1 the 50 MWe parabolic trough plant based in Spain is also the first CSP plant
worldwide to implement a commercial thermal energy storage system with a capacity of 75
hours of full load storage It commenced operation at the end of 2008 and other similar and
larger trough projects are now operating or being constructed
As the most mature CSP technology trough plant should be further down the operational and
design operability maturity path and hence have a lower opportunity for OampM cost
reductions through learning By contrast Solar Tower and Linear Fresnel systems are only
beginning to be deployed at larger scale and hence there is expected to be more potential to
reduce their capital and operating costs and improve performance
Learning rates have been argued by stakeholders as being very significant for CSP plant with
comments of the AETA 2012 report centring on this issue Disappointingly there is no new
published evidence or actual plant report data that could be found by the AETA stakeholders
and WorleyParsons to add to that used for the 2012 report There is however new evidence
on the reduction in LCOE for CSP technologies and WorleyParsons linked OPEX
contribution to these LCOE predictions so that a sense of future reductions could be made
This is outlined further in the following Sections
45
4631 ASSUMPTIONS AND CONSIDERATIONS
FOM and VOM Breakdown
The following costs are included in proceeding FOM cost estimates for CSP technologies as
an annual cost per MW capacity
Insurance
Labour costs and
Fixed service maintenance contracts
Similarly the following costs are included in the VOM cost estimates as a cost rate per MWh
of sent out energy
Material and maintenance costs spare parts equipment maintenance and unscheduled
inspections and
Utilities costs water auxiliary fuel and auxiliary power when applicable
Some items such as spare parts for scheduled maintenance could be considered FOM costs
However to simplify the comparison and to homogenise all of the analyses across
technologies all concepts related to plant material and maintenance were included in the
VOM costs
4632 AETA 2012 OampM CSP COSTS COMPARISON REPORT
The technical characteristics of the reference CSP Plants used in the AETA 2012 report have
been extracted from the AETA Model Version 1_0 (BREE 2012) and are summarised in
Table 12
Table 12 AETA 2012 Reference Plant Technical Characteristics
Plant
Characteristics
Units Parabolic
Trough
without
Storage
Parabolic
Trough
with
Storage
Solar
Tower
without
Storage
Solar
Tower
with
Storage
Linear
Fresnel
without
Storage
Linear
Fresnel
with
Storage
Plant Net Capacity MW 138 135 122 18 230 225
Location NA Unknown Unknown Unknown Unknown Unknown Unknown
Isolation kWhm2year Unknown Unknown Unknown Unknown Unknown Unknown
Hours of TES h - 7 - 6 - 6
Capacity Factor per cent 23 42 31 42 23 42
Type of Cooling NA Unknown Unknown Unknown Unknown Unknown Unknown
FOM $MWyear 60000 65000 70000 60000 65000 65000
VOM $MWh sent out 15 20 15 15 15 20
Based on the information above this Model Update estimated the following parameters for
the CSP technologies evaluated in this study
46
Total net energy production in terms of MWh delivered per year
FOM and VOM in terms of USD per year and
Total OPEX costs in terms of USD per year and USD per total net energy production
per year
The results are listed in Table 13 below Table 13 AETA 2012 OampM Opex costs on a per kWh basis
Plant
Characteristics
Units Parabolic
Trough
without
Storage
Parabolic
Trough
with
Storage
Solar
Tower
without
Storage
Solar
Tower
with
Storage
Linear
Fresnel
without
Storage
Linear
Fresnel
with
Storage
Plant Net Capacity MW 138 135 122 18 230 225
Net Energy sent out MWhyear 2780424 496692 3313032 662256 463404 827820
FOM $year 8280000 8775000 8540000 1080000 14950000 14625000
VOM $year 4170636 9933840 4969548 993384 6951060 16556400
OPEX $year 12450636 18708840 13509548 2073384 21901060 31181400
OPEX $kWh 00448 00377 00408 00313 00473 00377
FOM per cent 6650 4690 6321 5209 6826 4690
VOM per cent 3350 5310 3679 4791 3174 5310
The percentages of FOM and VOM costs as part of the total OPEX costs are presented in
Figure 5
Figure 5 AETA 2012 FOM and VOM Percentages of Total OPEX Costs
47
In Figure 5 FOM costs are in general terms significantly higher than VOM costs because
they include the higher cost items such as insurance labour costs and fixed service contracts
However as shown in the Figure VOM costs are higher or approximately equal to FOM
costs for technologies with energy storage given the criteria selected for the breakdown
between FOM costs and VOM costs FOM costs will remain relatively consistent from year-
to-year while VOM costs should be broken down even further since the costs of water
natural gas (if required) and electricity vary between locations and from one year to another
Total OPEX costs are expressed in terms of USD per total net energy production per year and
are between 00313 and 00473 USDkWh as listed in Table 13 These values are aligned
with the values provided by international institutions cited although they appear to be
somewhat inflated in comparison with those values that are closer to 0025 and 0035
USDkWh as published by others (eg IRENA)
4633 AETA 2013 OampM COSTS UPDATE
Similar Plant characteristics to AETA 2012 were considered for the appropriate comparison
of OampM costs for this update Plant characteristics include location net capacity capacity
factor hours of TES and type of cooling For this Report the characteristics of the reference
plants used are described in Table 14
Table 14 PT and ST Reference Plant Characteristics
Plant
characteristics
Units Parabolic
Trough without
Storage
Parabolic
Trough with
Storage
Solar Tower
without
Storage
Solar Tower
with Storage
Plant Net Capacity MW 100 100 100 100
Location NA MENA region MENA region MENA region MENA region
Isolation kWhm2year 2400 2400 2400 2400
Hours of TES h 0 6 0 6
Capacity Factor per cent 26 46 275 476
Type of Cooling NA Dry Dry Dry Dry
Source NA WorleyParsons CSP Today 2012a WorleyParsons CSP Today 2012b
The 2013 OampM costs were estimated using as a basis the information provided in the CSP
2012 reports (CSP 2012a and 2012 b) The following considerations were taken into account
the CSP Today reports only consider PT and ST plants with thermal storage
WorleyParsons made the following estimates based on experience with solar and
conventional power plants based on PT and ST technologies without TES
estimated the capacity factor based on plant capacity location and type of cooling
adjusted the insurance material and maintenance and labour costs based on the
solar field reduction factor when applicable
adjusted the steam turbine maintenance based on the potential hours of operation
48
adjusted the plant electricity and water consumption based on the total net
production
assumed similar auxiliary fuel consumption for the plant with and without TES This
assumption is due to the reference plants being based in the same location thus
requiring similar auxiliary fuel consumption for start-up Minimal differences in
auxiliary fuel consumption for freeze protection due to increased time offline for a
plant without TES system compared to a plant with TES are expected but not
considered in this Report as the impact would be minor
the capacity factor provided by CSP Today for PT with thermal storage is considered
high Based on the plant location and capacity WorleyParsons would anticipate the
capacity factor to be closer to 42 per cent instead of 46 per cent as indicated in Table
14 above This difference in capacity factor directly impacts the estimated VOM cost
which is correlated with plant production For comparison purposes the value provided
by CSP Today has maintained and
with respect to Linear Fresnel technology updated information has not been published
since the AETA 2012 report release by the references listed in Section 462 which
WorleyParsons consulted For the purpose of updating the estimates to 2013 it was
assumed that the evolution of the OampM costs would be similar to that of parabolic
trough plants and the same escalation factors were applied
The resulting 2013 and 2012 OampM costs are listed in Table 15 below for comparison
Table 15 2013 CSP OampM Costs Compared to 2012 OampM Costs
CSP Technology OampM Costs AETA 2012 WorleyParsons 2013 update
Parabolic Trough
without Storage
FOM $MWyear 60000 59176
VOM $MWh sent out 1500 1519
OPEX $kWh 00448 00412
Parabolic Trough with
Storage
FOM $MWyear 65000 72381
VOM $MWh sent out 2000 1139
OPEX $kWh 00377 00293
Solar Tower without
Storage
FOM $MWyear 70000 58285
VOM $MWh sent out 1500 707
OPEX $kWh 00408 00313
Solar Tower with
Storage
FOM $MWyear 60000 71372
VOM $MWh sent out 1500 565
OPEX $kWh 00313 00228
Linear Fresnel without
Storage
FOM $MWyear 65000 64107
VOM $MWh sent out 1500 1519
OPEX $kWh 00473 00434
49
CSP Technology OampM Costs AETA 2012 WorleyParsons 2013 update
Linear Fresnel with
Storage
FOM $MWyear 65000 72381
VOM $MWh sent out 2000 1139
OPEX $kWh 00377 00293
The total OPEX costs per year from the AETA 2012 report and the WorleyParsonsrsquo estimates
that were updated for 2013 are compared in Figure 6 below
Figure 6 Comparison of OPEX Costs per Total Annual Plant Production per Year AETA 2012
Report and 2013 Update
Reductions of approximately 20 - 27 per cent in OampM costs would be realised by CSP with
TES according to the updated 2013 WorleyParsons estimates compared to the same costs
reported in the AETA 2012 report However reductions for PT and LF without TES were
found to be lower at approximately 8 per cent
The IRENA reports (IRENA 2013b IRENA 2013c) provide values for OPEX between 0025
and 0035 USDkWh for PT and ST technologies with and without TES Values updated to
2013 by WorleyParsons are between 0023 and 00412 USDkWh for PT and ST
technologies which align with the IRENA values However IRENA does not differentiate
between the utilisation of TES Solar technologies without TES have fewer hours of
production and although OPEX costs are lower in terms of USDMW compared with solar
technologies with TES OPEX costs in terms of costs per total annual plant production per
year will typically be higher for technologies that do not use TES
4634 OampM CSP LEARNING RATES
Cost reductions on CSP technologies are expected to come from the following main actions
economies of scale in the plant size and manufacturing industry
learning impacts on design construction and operation phases
50
advances in RampD of the following factors
Components Solar receivers mirrors HTF storage media supporting structures
trackers and auxiliary systems
Systems Direct steam generation storage systems or hybrid cooling systems
Configurations Hybridisation or duel electricity water plants
a more competitive supply chain
improvements in the performance of the solar field solar-to-electric efficiency and
thermal energy storage systems
increases in the life of plants and
reduced financial costs
Based on the parameters listed above the LCOE from Solar Thermal technologies is likely to
be continuously decreasing and this is born out in the literature that has been reviewed Based
on the IRENA 2013b report the evolution of the LCOE from trough and power tower CSP
technologies shows how the LCOE is decreasing as technology development increases in
Table 16 below Estimates for LCOE for the hypothetical trough and tower CSP plants in
2014 are also included
51
Table 16 Estimated LCOE form Existing and Hypothetical Trough and Solar Tower CSP Technologies
CSP
Technology
Year Capacity
(MW)
Plant Name Location DNI
(kWhm2year)
LCOE 2012
$kWh Installed
Trough
1981 05 PSA Spain 2000 064
1983 138 SEGS I California 2700 039
1989 30 SEGS II ndash VIII California 2700 026
1992 80 SEGS VIII amp IX California 2700 020
2008 - 2009 50 Andasol 1 2 Spain 2000 035
2010 50 Solnova 1 amp 3 Spain 2000 034
2010 - 2011 50 Extresol 1 amp 2 Spain 2000 035
2014 250 Unspecified (wet
cooling no storage)
Not provided Not provided 020
Tower
1987 10 Solar One California 2700 058
2007 11 PS10 Spain 2000 034
2009 20 PS20 Spain 2000 036
2011 199 Gemasolar (wet
cooling 15hr
storage)
Spain 2000 033
2014 120 Unspecified
(dry cooling
storage)
Not Provided Not provided 015
International Institutions such as IRENA ESTELA or the World Bank agree that the LCOE
and capital cost reductions of 28 per cent to 60 per cent are envisioned by 2020 ndash 2025 for
such plant Estimates of possible LCOE reductions for CSP technology from 2012 to 2025
are provided in Figure 7 taken from Kearny (2010)
52
Figure 7 Expected LCOE Reductions for CSP Technology from 2012 to 2025
Source (Kearny 2010)
The OampM maintenance costs of modern CSP Plants are lower than those for Californian
SEGS Plants built in the 1980s and 1990s which has a total combined capacity of 354 MW
and estimated OampM costs of USD 004kWh (IRENA 2013b) However CSP experienced no
growth from early 1990s until the mid-2000s as can be seen in Table 16 above
As stated at the beginning of Section 462 Andasol 1 was the first 50 MWe parabolic trough
plant built after SEGS which included a thermal energy storage system It commenced
operation at the end of 2008 Podewils (2008) estimated Andasol 1 OampM costs of EUR
0072kWh or USD 0095kWh (considering 2012 medium rate exchange EURUSD of
07553) This value is high compared to OPEX estimations for PT with TES provided by
both this 2013 update and the AETA 2012 report (00293 and 00377 USDkWh
respectively) Therefore according to the information detailed above considerable learning
improvements to OampM costs have been already achieved from the commencement of
operation of Andasol 1 to the time of this Report
`WorleyParsonsrsquo estimations on the LCOE of parabolic trough plants is in the range of
USD 020kWh to USD 035kWh and that of solar towers between USD 017kWh and
USD 029kWh However in areas with excellent solar resources the range could be as low
as USD 014kWh to USD 018kWh
The following considerations have been taken into account for OampM cost learning rates
forecast
WorleyParsons LCOE estimations as set out above
Potential average envisaged LCOE reductions of 475 per cent by 2025 based on Figure
7 above
OPEX contribution on LCOE of 20 per cent and
53
assuming that all components involved in the LCOE (CAPEX OPEX and financial
expenses) reduce at the same rate so percentage contributions remain constant
According to these considerations WorleyParsons estimates that OPEX values by 2025 could
reach from 0021 to 0037 USDkWh for PT technology and from 0018 to 0031 USDkWh
for ST technology
Technological improvements have reduced the requirement of replacing mirrors and
receivers Automation has reduced the cost of other OampM procedures by as much 30 per
cent As a result of OampM procedure improvements (both cost and plant performance) the
total OampM costs of CSP plants in the long-term are likely to be below USD 0025kWh
(IRENA 2013b)
Parabolic trough system in the United States would have OampM costs of around USD 002 to
USD 003kWh meanwhile the OampM costs of parabolic trough and solar tower power plants
currently under construction in South Africa have estimated OampM costs of between USD
0029 and USD 0036kWh (also IRENA 2013b)
WorleyParsons estimations are in alignment with IRENA estimations in terms of current and
envisaged CSP OPEX costs
4635 CONCLUSIONS ndash CSP
The following main conclusions were made based on this study in relation to CSP
technologies
the 2013 WorleyParsons CSP OampM costs update resulted in values between 0023 and
0043 USDkWh based on 2012 USD
reductions in CSP OampM costs between 8 per cent and 27 per cent were obtained in
comparison to values provide in AETA 2012 report
the total OampM costs of CSP Plants in the long-term are likely to be below USD
0025kWh
the updated values for 2013 by WorleyParsons are in alignment with the values
provided by recognised international institutions and
at the time of this report the only CSP technology with substantial operation capacity
was PT Only three utility-scale ST plants were in operation at the time of this report
(PS-10 PS-20 and Gemasolar) of which only one (Gemasolar) uses TES Though
several process steam and small-scale LFR Plants are currently in operation only one
utility-scale LFR (Puerto Erradio 2) was in operation at the time of this report
47 AETA 2013 OampM Learning Rate recommendation
The learning rate used in AETA 2012 for OampM is applied to all technologies assessed and
includes fossil fuel technologies and emerging technologies The learning rate is set at an
improvement of 02 per cent per annum
In addition to the improvement rate OampM is escalated at a rate of 150 per cent of CPI per
year based on experience with increases in parts and labour costs
The CPI rate set in the model is 25 per cent per annum
54
OampM cost information in the public domain in both quantum and quality is poor for
contemporary data Information supporting OampM learning rates is equally poor There are
indications that emerging technologies do have the potential for increased OampM learning
rates relative to mature technologies
For the renewable energy technologies studied in this report onshore wind is considered
mature and it is recommended that the AETA 2012 report value of 02 per cent is maintained
For all other renewable energy technologies studied in this report a more aggressive learning
rate of 25 per cent is recommended This will effectively cancel out the CPI escalation
adjustment and provide a ldquoflat linerdquo OampM rate for future years This will provide a value in
line with the learning rate conclusions for PV
The learning rate for CSP is considered to have greater potential for reduction but due to the
high level of analysis in this report (and therefore uncertainty) it is proposed that a maximum
of two learning rates is appropriate for the AETA model
Table 17 AETA Learning Rate Comparison
AETA 2012 Learning Rate AETA 2013 update Learning Rate
Onshore Wind 02 per cent 02 per cent
Offshore Wind
PV ndash all technologies
CSP ndash all technologies
02 per cent 25 per cent
55
5 CHANGES TO THE LCOE
Changes to the model parameters described in the earlier sections have resulted in changes to
the LCOE estimates for a number of technologies The LCOE estimate values for all
technologies and associated range of uncertainty are shown in the Figures 8 to 13 below
Note that the values listed are for a base value carbon price modifier of zero per cent which
places no value on carbon emissions
For selected technologies where there are significant cost differences Figure 14 provides a
comparison of mid-range LCOE values for the AETA 2013 and AETA 2012 Models Key
features of the Figures 8 to 14 are as follows
both in AETA 2012 and 2013 Model update LCOE costs are provided for the years
2012 2020 2025 2030 2040 and 2050
cost ranges are provided for each technology that accounts for differences in fuel prices
and state-based variations
LCOE costs vary substantially across the technologies from $89MWh (combined cycle
gas turbine) to $351MWh (solar thermal linear fresnel) in 2012 and $73MWh (PV
non-tracking) to $247MWh (IGCC black coal CCS) in 2050
the inter-technology LCOE comparisons figures (Figures 8 to 13) reveal changes in
relative costs of technologies over time Key results include renewable technologies
have higher LCOEs than the lowest cost non-renewable technologies and the relative
LCOE rankings significantly change post 2030 The LCOE of solar PV become lower
than the non-renewables from mid 2030 onwards and
large changes in LCOE results between AETA 2013 Update and AETA 2012 are
depicted in Figures14 below Figure 14 compares LCOEs at 2050 between the AETA
2013 Update and AETA 2012 for a selected number of technologies that have changed
significantly for NSW (AETA developed LCOEs by each Australian state) Differences
in technology LCOEs are explained by a multiplicity of factors including the technical
developments OampM costs and learning rate changes
56
Figure 8 Updated LCOEs for AETA 2013 Model technologies values for 2012 (NSW) with carbon price set to zero
0
50
100
150
200
250
300
350
400
450
500
LCO
E ($
MW
h)
LCOE FOR 2012 TECHNOLOGIES (NSW) Note Default region is NSW except bown coal
technologies (VIC) and SWIS scale (as specified)
LCOE includes where relevant allowance for- Carbon Price- CO2 transport and sequestration cost- Plant capital cost (EPC basis) within battery limits- Owners costs excluding interest during construction- Fixed and variable operating costs- Fuel costs- Economic escalation factors
57
Figure 9 Updated LCOEs for AETA 2013 Model technologies values for 2020 (NSW) with carbon price set to zero
0
50
100
150
200
250
300
350
400
450
LCO
E ($
MW
h)
LCOE FOR 2020 TECHNOLOGIES (NSW) Note Default region is NSW except bown coal
technologies (VIC) and SWIS scale (as specified)
LCOE includes where relevant allowance for- Carbon Price- CO2 transport and sequestration cost- Plant capital cost (EPC basis) within battery limits- Owners costs excluding interest during construction- Fixed and variable operating costs- Fuel costs- Economic escalation factors
58
Figure 10 Updated LCOEs for AETA 2013 Model technologies values for 2025 (NSW) with carbon price set to zero
0
50
100
150
200
250
300
350
400
LCO
E ($
MW
h)
LCOE FOR 2025 TECHNOLOGIES (NSW) Note Default region is NSW except bown coal
technologies (VIC) and SWIS scale (as specified)
LCOE includes where relevant allowance for- Carbon Price- CO2 transport and sequestration cost- Plant capital cost (EPC basis) within battery limits- Owners costs excluding interest during construction- Fixed and variable operating costs- Fuel costs- Economic escalation factors
59
Figure 11 Updated LCOEs for AETA 2013 Model technologies values for 2030 (NSW) with carbon price set to zero
0
50
100
150
200
250
300
350
400
LCO
E ($
MW
h)
LCOE FOR 2030 TECHNOLOGIES (NSW) Note Default region is NSW except bown coal
technologies (VIC) and SWIS scale (as specified)
LCOE includes where relevant allowance for- Carbon Price- CO2 transport and sequestration cost- Plant capital cost (EPC basis) within battery limits- Owners costs excluding interest during construction- Fixed and variable operating costs- Fuel costs- Economic escalation factors
60
Figure 12 Updated LCOEs for AETA 2013 Model technologies values for 2040 (NSW) with carbon price set to zero
0
50
100
150
200
250
300
350
400
LCO
E ($
MW
h)
LCOE FOR 2040 TECHNOLOGIES (NSW) Note Default region is NSW except bown coal
technologies (VIC) and SWIS scale (as specified)
LCOE includes where relevant allowance for- Carbon Price- CO2 transport and sequestration cost- Plant capital cost (EPC basis) within battery limits- Owners costs excluding interest during construction- Fixed and variable operating costs- Fuel costs- Economic escalation factors
61
Figure 13 Updated LCOEs for AETA 2013 Model technologies values for 2050 (NSW) with carbon price set to zero
0
50
100
150
200
250
300
350
400
LCO
E ($
MW
h)
LCOE FOR 2050 TECHNOLOGIES (NSW)
LCOE includes where relevant allowance for- Carbon Price- CO2 transport and sequestration cost- Plant capital cost (EPC basis) within battery limits- Owners costs excluding interest during construction- Fixed and variable operating costs- Fuel costs- Economic escalation factors
Note Default region is NSW except bown coal
technologies (VIC) and SWIS scale (as specified)
62
Figure 14 Comparison of AETA 2013 Model and AETA 2012 Model LCOE estimates selected technologies 2050
0
50
100
150
200
250
AETA 2012
AETA 2013
63
51 Conclusions
The Australian Energy Technology Assessment (AETA 2012) provided the best available and most up-to-
date cost estimates for 40 electricity generation technologies under Australian conditions To ensure that
the cost estimates for the various technologies are consistent all common input costs (eg labour
materials components carbon price) were itemised To ensure that the AETA costings remain up to date
AETA costs are reviewed in this AETA 2013 Model Update report
The AETA 2013 refresh was developed in close consultation with a stakeholder reference group drawn
from industry and researchacademic organisations with interests and expertise in a diverse range of
electricity generation technologies
The AETA 2013 Model results reflect the change to exclude the value of a carbon price in the Levelised
Cost of Energy (LCOE) All technologies have experienced a minor reduction in LCOE relative to 2012
(offset in some cases by other factors) due to the change to an amortisation period of 30 years plus the
construction period
Comparing the 2012 AETA results without a carbon price to the 2013 results without a carbon price there
are significant reductions in the LCOE of solar technologies and onshore wind This is as a consequence of
changes to the fixed and variable Operations and Maintenance (OampM) costs for these technologies For the
solar technologies the adjustment of the capital learning rate to 25 per cent has also contributed to the
LCOE reduction Offshore wind also has an increased learning rate but this has been offset to a large extent
by increased variable OampM costs
Nuclear LCOE has increased significantly due to higher estimates for capital costs
Efficiency for coal fired plants with CCS retrofits has been revised downwards to better reflect the expected
efficiency of these plants and has the effect of increasing the LCOE
64
REFERENCES
Albers A 2009 OampM Cost Modeling Technical Losses and Associated Uncertainties Proceedings of the
2009 European Wind Energy Conference Marseilles France March
AWEA (American Wind Energy Association) 2013 AWEA US Wind Industry Annual Report ndash Year
Ending 2012 USA
BNEF (Bloomberg New Energy Finance) 2013 Operations and Maintenance (OampM) Price Index Issue II
Wind Research Note April
BREE (Bureau of Resources and Energy Economics) 2012 AETA Report and Model Version 1_0 2012
Australian httpwwwbreegovau
CEC (Clean Energy Council) 2013 Australian Energy Technology Assessment 2013 Review Letter to
BREE of 20 May 2013 from the Clean Energy Council (Mr Russel Marsh signatory for the CEC)
CEC (Clean Energy Council) 2013 Clean Energy Council Renewable Energy Map Australia June (data
noted as current as of 21 August 2012)
httpwwwcleanenergycouncilorgauresourcecentreplantregistermaphtml
Crown Estate 2012 Offshore Wind Cost Reduction Pathways Study United Kingdom May
CSP 2012a CSP Parabolic Trough Report Cost Performance and Key Trends CSP Today
CSP 2012b CSP Solar Tower Report Cost Performance and Key Trends CSP Today
Deloitte amp Touche 2012 European Wind Services Study Find Out Which Way the Wind Blows Deloitte amp
Touche GmbH Wirtschaftspruumlfungsgesellschaft August
Deloitte 2011 Economics of wind development in New Zealand Deloitte for the for the New Zealand Wind
Energy Association
Ebert P amp Ware J 2013 The Role of Independents in the Wind Farm Operations amp Maintenance
Proceedings of the 2013 New Zealand Wind Energy Conference and Exhibition March
EPRI (Electric Power Research Institute) 2010 Engineering and Economic Evaluation of Central-Station
Solar Photovoltaic Power Plants USA March
GlobalData 2012 Wind Operations amp Maintenance (OampM) Market ndash Global Market Size Share by
Component Competitive Landscape and Key Country Analysis to 2020 GlobalData reference code
GDAE1054MAR January
Hand M 2013 Wind Plant Cost of Energy Proceedings of the 2nd NREL Wind Energy System
Engineering Workshop January
Hassan G 2011 Review of the Australian Wind Energy Industry Clean Energy Council Australia 2011
Houston C 2013 The Real Truth About Wind Farm OampM Costs North American WindPower March
IEA (International Energy Agency) 2008 Technology Roadmap Solar photovoltaic energy France
httpwwwieaorgpublicationsfreepublicationspublicationpv_roadmappdf
IRENA (International Renewable Energy Agency) 2013a Solar Photovoltaics Technology Brief Germany
January httpwwwirenaorgDocumentDownloadsPublicationsIRENA-ETSAPper
cent20Techper cent 20Briefper cent20E11per cent20Solarper cent20PVpdf
65
IRENA (International Renewable Energy Agency) 2013b Concentrating Solar Power Technology Brief
Germany January
IRENA (International Renewable Energy Agency) 2013c Renewable Power Generation Costs in 2012 An
Overview Germany
IT Power 2013 Analysis of the AETA 2012 cost estimates of CSP technologies Clean Energy Council
submission to the Bureau of Resources and Energy Economics May
Kann S 2012 US Solar Market Insight Report Q3 California USA
Kearny A 2010 Solar Thermal Electricity 2025 ndash clean electricity on demand attractive STE costs
stabilize energy production ATKearny consultants Dusseldorf Germany
Muirhead J 2013 SEGS experience suggests that CSP will age gracefully CSP Today South Africa
httpsocialcsptodaycommarketssegs-experience-suggests-csp-will-age-
gracefullysthash6VkxFaD0dpuf
NREL (National Renewable Energy Laboratories) 2011 IEA Wind Task 26 ndash Multi-national Case Study of
the Financial Cost of Wind Energy Technical Report NRELTP-6A2-48-48155 March
NREL (National Renewable Energy Laboratories) 2012 Cost and Performance Data for Power Generation
Technologies USA February
NREL (National Renewable Energy Laboratories) 2013 Breakeven Prices for Photovoltaics on
Supermarkets in the United States March httpwwwnrelgovdocsfy13osti57276pdf
NREL (National Renewable Energy Laboratories) 2013 Breakeven Prices for Photovoltaics on
Supermarkets in the United States USA March httpwwwnrelgovdocsfy13osti57276pdf
Photon 2012 The True Cost of Solar Power 2012 Temple of Doom Solar Power in Focus Series Photon
Consulting
Photon 2013 Solar Annual 2013 Build Your Empire Photon Consulting
Podewils C 2008 Photovoltaic vs Solar Thermal where PV has the upper hand and where solar thermal
strikes back Photon International Germany November
Poore R and Walford C 2008 Development of an Operations and Maintenance Cost Model to Identify
Cost of Energy Savings for Low Wind Speed Turbines Report NRELSR-500-40581 National
Renewable Energy Laboratory January
RolandBerger 2013 Offshore Wind Towards 2020 On the Pathway to Cost Competitiveness RolandBerger
Consultants Germany April
See wwwcsptodaycom
See wwwepiaorg
See wwwestelasolarde
See wwwidaees
See wwwieaorg
See wwwirenaorg
See wwwnrelgov
See wwwprotermosolares
66
See wwwrenoveteces
See wwwseiaorgau
See wwwsolarelectricpowerorg
See wwwworldbankorg
UK Crown Estate 2012 Offshore Wind Cost reduction Study May
US DoE (Department of Energy) 2013 Award Number DE-EE0005360 USA February
Wiser R Lantz E Bolinger M amp Hand M 2012 Recent Developments in the Levelized Cost of Energy
from US Wind Power Projects Contract No DE-AC02-05CH11231 National Renewable Energy
Laboratories February
67
Appendix A
Electricity Generation Technologies in AETA 2012 Report and Model
The 40 AETA electricity generation technologies are
1 Integrated Gasification and Combined Cycle (IGCC) plant based on brown coal
2 IGCC plant with Carbon Capture and Sequestration (CCS) based on brown coal
3 IGCC plant based on bituminous coal
4 IGCC plant with CCS based on bituminous coal
5 Direct injection coal engine (clean lignite eg brown coal technology)
6 Pulverised coal supercritical plant based on brown coal
7 Pulverised coal supercritical plant with post combustion CCS based on brown coal
8 Pulverised coal subcritical plant with post combustion CCS based on brown coal (retrofit)
9 Pulverised coal supercritical plant based on bituminous coal
10 Pulverised coal supercritical plant based on bituminous coal - SWIS relevant scale
11 Pulverised coal supercritical plant with CCS based on bituminous coal
12 Pulverised coal subcritical plant with post combustion CCS based on bituminous coal (retrofit)
13 Adding CCS to existing Combined Cycle Gas Turbine (CCGT) power plants (retrofitting)
14 Oxy combustion pulverised coal supercritical plant based on bituminous coal
15 Oxy combustion pulverised coal supercritical plant with CCS based on bituminous coal
16 Combined cycle plant burning natural gas
17 Combined cycle plant burning natural gas - SWIS relevant scale
18 Combined cycle plant with post combustion CCS
19 Open cycle plant burning natural gas
20 Solar thermal plant using compact linear fresnal reflector technology wo storage
21 Solar thermal plant using parabolic trough technology wo storage
22 Solar thermal plant using parabolic trough technology with storage
23 Solar thermal plant using compact linear fresnal reflector technology with storage
24 Solar thermal plant using central receiver technology wo storage
25 Solar thermal plant using central receiver technology with storage
26 Solar photovoltaic (PV) - non-tracking
27 Solar photovoltaic (PV) - single axis tracking
28 Solar photovoltaic (PV) - dual axis tracking
29 Wind (on-shore)
30 Wind (off-shore)
31 WaveOcean
68
32 Geothermal - hot sedimentary aquifer (HSA)
33 Geothermal - enhances geothermal system (EGS)
34 Landfill gas power plant
35 Sugar cane waste power plant
36 Other biomass waste power plant (eg wood)
37 Nuclear Gen 3+
38 Nuclear Small Modular Reactors (SMR)
39 Solarcoal hybrid
40 Integrated solar combined cycle (ISCS) ndash parabolic trough with combined cycle gas
69
Appendix B
Consultations with Stakeholders
This study has been undertaken in close consultation with a Stakeholder Reference Group drawn from
Australian industry and domestic as well as overseas researchacademic organisations with interests and
expertise in a diverse range of electricity generation technologies These stakeholders were invited to
provide evidence of the latest estimates for the costs and performance of various technologies
In addition the AETA project also had a Project Steering Committee comprising staff from BREE
AEMO CSIRO and other independent experts to provide technical advice and support The following
agencies participated in the stakeholder reference group meetings or were forwarded the documents
presented at the meetings
AETA Stakeholder Reference Group
Australian Coal Association
Australian Energy Market Operator
Australian Geothermal Energy Association
Australian National Low Emissions Coal RampD
Australian National University
Australian Renewable Energy Agency
Australian Solar Thermal Energy Association
Australian Sugar Milling Council
Australian Treasury
Bureau of Resources and Energy Economics
Clean Energy Council
CSIRO
Department of Industry
Economic Research Institute for ASEAN and East Asia
Energy Retailers Association of Australia
Energy Users Association of Australia
Evans and Peck
Ferrostaal
Global CCS Institute
Grid Australia
Intergen
International Energy Agency France
International Power Suez
IRENA Innovation and Technology Centre Germany
70
National Generators Forum
Oceanlinx Limited
Origin Energy
Private Generators Group
The Institute of Energy Economics Japan
The Energy Research Institute New Delhi
University of Melbourne Energy Institute
University of Queensland Energy Initiative
UQ Energy Economics amp Management Group
Wyldgroup
WorleyParsons
Two AETA Stakeholders Reference Group meetings took place on 30 April 2013 and 17 July 2013 In
addition the AETA Project Steering Committee met on 24 June 2013
71
BREE contacts Executive Director BREE Bruce Wilson brucewilsonretgovau
(02) 6243 7901
Deputy Executive Director Wayne Calder waynecalderbreegovau
(02) 6243 7718
Modelling amp Policy Integration Arif Syed arifsyedbreegovau
Program Leader (02) 6243 7504
Data Statistics Geoff Armitage geoffarmitagebreegovau
Program Leader (02) 6243 7510
Energy and Quantitative Analysis Allison Ball allisonballbreegovau
Program Leader (02) 6243 7539
Resources ndash Program Leader John Barber johnbarberbreegovau
(02) 6243 7988
72
10
EXECUTIVE SUMMARY
This Report provides electricity generation technology cost parameters as an update to those
presented in the Australian Energy Technology Assessment (AETA) Report and Model
published in July 2012 This update takes into account a range of new material reported in the
public and private domain further discussions with asset owners and technology developers
and input from key experts in relation to these costs
The AETA 2012 Model estimated levelised costs of energy (LCOE) for a set of 40 market
ready and prospective electricity generation technologies LCOE can be interpreted as the
long-run marginal cost of electricity generation These were estimated by breaking down
the cost drivers for a technology into its key constituent parts such as capital cost fixed and
variable lsquooperations and maintenancersquo (OampM) costs and where applicable fuel costs and
CO2 storage costs While the LCOEs included carbon costs project specific regulatory or
system based costs were not included although clearly these may have a significant impact
on the delivered price of electricity
The AETA 2013 Model update generally follows the same approach although comparable
LCOE results are presented without carbon costs reflecting the Governmentrsquos intention to
repeal carbon pricing To the extent that alternative emissions reduction measures impact on
the electricity generation sector this may have different implications for fossil fuel andor
renewable based technologies
For these reasons some caution should be applied when interpreting LCOE estimates These
estimates best illustrate potential and relative ldquooff-the-shelfrdquo cost competitiveness rather than
a firm predictor of market outcomes or the commercial viability of individual projects
The key features of the LCOE cost parameters in the AETA 2013 Model update with respect
to the AETA 2012 Model can be summarised as follows
renewable technologies have generally higher LCOEs than the lowest cost non-
renewable technologies and the relative LCOE rankings significantly change post
2030 The LCOE of solar PV becomes lower than the non-renewables from mid-
2030 onwards
however wind based generation is estimated to already have a lower LCOE than
many new build comparable fossil-fuel generation technologies
LCOE costs vary substantially across the technologies from $89MWh (combined
cycle gas turbine) to $351MWh (solar thermal Linear Fresnel) in 2012 and
$73MWh (PV non-tracking) to $247MWh (IGCC black coal CCS) in 2050
changes are made to nuclear capital costs and nuclear technology plantrsquos lsquofirst year of
constructionrsquo carbon capture and storage (CCS) retrofit thermal efficiency and
amortisation period for various technologies to include construction period
a reduction in onshore wind OampM costs of 18 per cent
11
a reduction in offshore wind fixed OampM costs and a three-fold increase in offshore
wind variable OampM costs resulting in an overall increase of 50 per cent total OampM
costs
fixed tilt PV configurations have not seen significant changes in OampM costs
single axis tracking and dual axis tracking PV configurations are approximately 20-30
per cent reduced based on a better understanding of the associated OampM costs
concentrating solar power (solar thermal) OampM cost reduced between 8 per cent and 27
per cent and
the OampM learning rate for offshore wind and all solar technologies are increased from
02 to 25 per cent
The overall impact of parameter changes by technology is given in the AETA 2013 Model
and in this report As in the AETA 2012 the 2013 Model update provides technology
LCOEs for the years 2012 2020 2025 2030 2040 and 2050
12
1 INTRODUCTION
The Australian Energy Technology Assessment (AETA) 2012 report published in July 2012
by the Bureau of Resources and Energy Economics (BREE 2012) undertook costing of 40
electricity generation technologies This report made a provision that due to the fast changing
technology cost environment cost and performance parameters assessed in the AETA 2012
model may be updated every year In addition a full report and lsquobottom uprsquo study will be
undertaken biennially with the next report to be released in 2014
The next fully updated AETA report is scheduled for completion in 2014 To ensure that cost
estimates for electricity generation technologies are current and take into consideration the latest
developments parameter estimates for the 40 technologies will be updated where appropriate
every six months in a manner consistent with the methods outlined in this report and in consultation
with the stakeholder reference group (BREE 2012 p 24)
The purpose of this AETA 2013 Model Update report is to present findings arising from a
review of specific technologies by BREE This review was assisted by comments made by
the AETA Project Steering Committee (PSC) members and AETA Stakeholders Reference
Group (SRG) WorleyParsons was commissioned to review cost parameters for the
technologies considered in the AETA 2012 model Given the fast changing nature of solar
and wind technology operating costs especial emphasis was placed on reviewing OampM costs
for wind and solar technologies Changes to the model for the 2013 update are discussed in
the following sections
11 Background to the AETA 2012 report
BREE engaged WorleyParsons in 2011-12 to develop cost estimates for 40 electricity
generation technologies under Australian conditions for AETA 2012 The AETA cost
estimates were developed with the active collaboration of the Australian Energy Market
Operator (AEMO) which utilised the AETA cost estimates for its National Transmission
Network Development Plan (NTNDP) In addition the Commonwealth Scientific and
Industrial Research Organisation (CSIRO) provided technical advice as part of the AETA
project steering committee The AETA 2012 provided technology costs for the years 2012
2020 2025 2030 2040 and 2050 These technologies encompass a diverse range of
energy sources including renewable energy (such as wind solar geothermal biomass and
wave power) fossil fuels (such as coal and gas) and nuclear power (Appendix A) Since its
publication in July 2012 more than 1000 requests have been made from BREE for the
AETA 2012 cost estimates (model) by domestic and international sources
12 Methods and Assumptions of the AETA 2012 Report and Model
121 Macro assumptions
Key macroeconomic assumptions are consistent with those detailed by the Australian
Energy Market Operator in its National Transmission Network Development Plan and by
the Australian Treasury (see BREE 2012 for a full set of assumptions)
13
122 Technical assumptions
all technologies were costed on a consistent and transparent basis with itemisation of
component costs
capital costs included direct (eg engineering procurement and construction) and
indirect (eg owners) costs but exclude transmission and decommissioning costs
future cost estimates included assumptions about the exchange rate productivity
variation commodity variation and technology improvements
fuel cost estimates were based on ACIL Tasman projections and
projected growth rates for future operating and maintenance costs were provided
123 Levelised cost of energy (LCOE)
LCOE can be interpreted as the long-run marginal cost of electricity generation Key
factors used to calculate LCOE by technology include amortisation period discount rate
capacity factor CO2 emissions factor CO2 capture rate emissions price CO2 storage cost
fuel cost variable and fixed OampM cost and the capital cost
LCOE is a key comparative cost indicator across technologies that is expressed in real
Australian dollars per Megawatt hour of electricity generation ($MWh) The LCOE is the
price at which electricity must be generated from a specific plant to break even taking into
account the costs incurred over the life of the plant (capital cost cost of capitalfinancing
operations and maintenance costs cost of fuel emissions price if applicable and CO2
sequestration) While LCOE is an invaluable tool for comparing technology costs power
generation companies andor investors who wish to choose a technology to deploy would
also need to consider other criteria such as site-specific costs technology performance
characteristics and experience with the technology prior to any final investment decision
AETA cost estimates are developed to provide design basis and plant characteristics
performance parameters capital cost estimates fuel cost estimates OampM cost estimates
and LCOE estimates
Regional impacts on capital and operating costs have been incorporated in the analysis
These regions include Victoria New South Wales (including ACT) South Queensland
(incorporating the South East Queensland and Central Queensland AEMO regions) North
Queensland (incorporating the North Queensland AEMO region) Northern Territory
North WA (Pilbara region) South WA (the South West Interconnected System region)
South Australia and Tasmania
13 Methodology of the AETA 2013 Model Update
As part of the AETA 2013 Model Update BREE invited submissions from the AETA
Steering Committee and the Stakeholder Reference Group to provide commentary and
recommendations on the AETA 2012 Report and Model Eight written submissions were
received in this regard Changes were only recommended where specific substantiated
changes were received The AETA 2013 model has been updated in accordance with the
above consultations and under the same macro economic and technical assumptions as in
AETA 2012 The AETA 2013 model is freely available on request from BREE
(infobreegovau)
Within this context this report provides updated costs based on
14
relevant Australian and international reports on generation technologies that have been
published since AETA 2012 or have been newly discovered
new public domain information
new information from private sources that could be obtained
in-house experience of WorleyParsons and
input on OampM costs and learning rates from a number of industry stakeholders
This AETA 2013 Model Update report provides supporting explanations and references and
justifies amendments to the cost parameters of technologies especially the OampM costs for
wind and solar technologies that were covered in AETA 2012 model
131 Caveats on the use of LCOE
LCOE provides a generalised cost estimate and does not account for site specific factors
that would be encountered when constructing an actual power plant As a result the costs
associated with integrating a particular technology in a specific location to a specific
electricity network are not considered
Projected LCOE does not necessarily provide a reliable indicator of the relative market
value of generation technologies because of differences in the role of technologies in a
wholesale electricity market For example projected LCOE does not provide a direct
indicator of electricity demand or generation in isolation with other emissions abatement
policies Similarly many technologies involve integration costs in addition to the LCOE to
be able to reliably supply to the system The value of variable (or intermittent) power plants
(such as wind and solar) will depend upon the extent to which such plants generate
electricity during peak periods and the impact these plants have on the reliability of the
electricity system Unlike dispatchable power plants (such as coal natural gas biomass
and hydroelectric) ndash which are reliant on some form of stored energy (eg fuels water
storage or battery storage) ndash wind and photovoltaic power plants do not typically include
energy storage Dispatchable plants such as coal or gas fired plants may involve negative
externalities (environment fuel disposal or insurance costs etc) which are not always
reflected in their LCOEs
The AETA LCOEs are restricted to only utility-scale or large scale technologies
Consequently small-scale technologies (eg small roof-top photovoltaics fuel cells co-
generation and trigeneration) that may be relevant to distributed generation were not
included in the AETA 2012 analysis LCOE cost estimates associated with distributed
photovoltaics are likely to differ substantially from utility-scale photovoltaic systems as a
result of differences in component costs (eg capital costs operating and maintenance
costs) and performance characteristics (eg capacity factor)
132 Organisation of the report
This report is organised in five sections After a brief introduction and purpose of the report
in this section section 2 discusses the changes made to the AETA 2013 Model parameters as
a result of the discussions with Stakeholders and Steering Committee members on the
individual issues and technologies Section 3 presents the issues that were considered but did
not result in the AETA Model parameter changes Section 4 presents in detail the OampM cost
15
changes for wind and solar technologies covered in AETA 2012 Updated LCOE graphs as
well as a comparison of the resultant AETA 2013 Model and AETA 2012 Model LCOEs are
presented in section 5 which also presents concluding comments
16
2 AETA MODEL PARAMETER CHANGES
21 Stakeholder Initiated Changes
Consultations for the AETA 2013 Model update identified the following issues for
consideration
nuclear technology capital costs and lsquofirst year available for constructionrsquo
CCS retrofit thermal efficiency
amortisation period for all technologies and
OampM costs
The OampM issue is discussed in section 4 whereas rest of the issues are discussed below
211 Nuclear Capital Costs
The AETA 2012 report and model presents costs for first of a kind (FOAK) and Nth of a kind
(NOAK) nuclear technologies There could have been some confusion from the original
wording of Section 310 of AETA 2012 report It starts by discussing Gen III plants currently
sold (presumably NOAK) however further in the document Gen III plants are referred to as
FOAK The AETA 2012 report states that the capital costs are based on nuclear power plants
in the US The NOAK value is what is represented in Table 3101 in the AETA 2012 report
and model
Although there are cost adjusting factors used for other technologies studied in the AETA
2012 report there is no adjustment of the US cost base for Australian labour costs and for
adjustment of Australian equipment costs Submissions indicated that an adjustment to costs
should also be used for nuclear to ensure there is commonality in the comparison
This suggestion was considered appropriate and adjustment to the costs for nuclear
technologies was made Based on the factors to convert US rates to Australian rates used in
the fossil fuel technologies ie the factors from the Thermoflow software the new nuclear
capital costs were calculated The multiplier from Thermoflow for labour costs is 205 and
the factor for equipment costs is 13 both US to Australia
Additionally it was submitted that the first year available for construction of nuclear
technologies be extended In support of this the submission argued that nuclear technologies
are examples of generation technology where legislation regulation and public policy
planning is highly region-dependent and must therefore precede deployment by several years
This was considered an appropriate submission and therefore the first year available for
construction in the model has been changed from 2012 to 2020 These changes are shown in
Table 1
17
Table 1 Model Changes Nuclear Technologies
AETA 2012 report reference AETA 2012 model value AETA 2013 update
Technology 37 Nuclear (GW Scale LWR)
Change first year available for Construction
2012
2020
Technology 37 Nuclear (GW Scale LWR)
Convert FOAK Capital Cost to Australian productivity
and commodity costs
4210
6392
Technology 37 Nuclear (GW Scale LWR)
Convert NOAK Capital Cost to Australian productivity
and commodity costs
3470
5268
Technology 38 Nuclear (SMR)
Convert FOAK Capital Cost to Australian productivity
and commodity costs
7908
11778
Technology 38 Nuclear (SMR)
Convert NOAK Capital Cost to Australian productivity
and commodity costs
4778
7116
The overall impact of these parameters on individual technology LCOE changes is given in
the AETA 2013 Model and in Section 5
212 Carbon Capture and Storage (CCS) Retrofit Thermal Efficiency
Subcritical coal technologies with CCS retrofit were reported to have only slightly lower
thermal efficiency values compared with new build supercritical technologies with CCS in
the AETA 2012 Model This was an oversight in the AETA 2012 Model
The AETA 2012 report identified the thermal efficiency to retrofit subcritical brown and
black coal plants as 216 per cent and 301 per cent respectively (Table 312) In the same
table the efficiency for new build supercritical brown and black coal plants is reported to be
208 per cent and 314 per cent respectively
The thermal efficiencies were revised down based on actual operating efficiencies of existing
coal facilities in Victoria and NSW and factored based on the thermal efficiency ratio of new
coal facilities with and without CCS
A reduction in thermal efficiency is to be expected when applying a retrofit CCS to the plant
The CCS factor in the following representation refers the efficiency reduction factors for
adding CCS to a coal fired power station The useful output will reduce from the new
parasitic loads to run the CCS equipment
Thermal efficiency of existing brown coal plant in Victoria is 265 per cent and the CCS
factor is 064 Similarly the thermal efficiency of existing bituminous coal plant in NSW is
355 per cent and the CCS factor is 075
Table 311 and 312 of the AETA 2012 report show a reduction is present when comparing
the supercritical with no CCS compared to supercritical with CCS However the retrofit case
was only provided for the subcritical technology only and no case was included in the AETA
2012 for a subcritical plant with any CCS
A review of the values in Table 312 through comparison to the existing efficiency of
installed black and brown coal fleet in Australia was undertaken For brown coal the current
18
sent out thermal efficiency is 265 per cent for a 500 MW subcritical unit For supercritical
brown coal without CCS the sent out efficiency is 323 per cent Applying the same reduction
factor the thermal efficiency with CCS retrofitted should be 17 per cent in lieu of 216 per
cent as published in AETA 2012 report
For black coal the current sent out thermal efficiency is 355 per cent for a 660 MW
subcritical unit For supercritical black coal without CCS the sent out efficiency is 419 per
cent Applying the same reduction factor the thermal efficiency with CCS retrofitted should
be 266 per cent in lieu of 301 per cent as published AETA 2012 report (Table 2)
Table 2 Model Changes CCS Retrofit Thermal Technologies
AETA 2012 report reference AETA 2012 model value AETA 2013 update
Technology 8 Pulverised coal subcritical plant
with post combustion CCS based on brown coal
(retrofit)
Thermal Efficiency
216
170
Technology 12 Pulverised coal subcritical plant
with post combustion CCS based on bituminous
coal (retrofit)
Thermal Efficiency
301
266
19
213 Amortisation period
There was stakeholder consensus that the operating period for all technologies needs to be set
to thirty years and that the construction time is in addition to the operating time The financial
amortisation period is common for all technologies and is set at 30 years In the AETA 2012
model section 24 (a) nominates that the amortisation period of 30 years is from the
commencement of construction The amortisation period has now been changed (Table 3)
Examples of the change are
Nuclear LWR ndash GW scale In AETA 2012 report amortisation period was 30 years inclusive
of construction and operation The amortisation period has now changed to 36 years (30
operating and 6 years construction)
Solar parabolic trough In AETA 2012 report amortisation period was 30 years inclusive of
construction and operation The amortisation period has now changed to 33 years (30
operating and 3 years construction)
Table 3 Model Changes amortisation period
AETA 2012 report reference AETA 2012 model value AETA 2013 update
Common Amortisation period
for construction and operation
Amortisation period for
operation includes
construction for all
technologies
Amortisation period for
operation to exclude
construction for all
technologies
22 No Carbon Pricing
For the 2013 AETA update the carbon price modifier has been set to zero per cent as the
base value for the results presented in this report with the effect of applying a zero carbon
price to all technologies throughout the study period to 2050 The AETA 2013 Model
however has the option of changing this parameter by the user
20
3 CONSIDERATION OF OTHER ISSUES
This section summarises the issues that were discussed during the AETA 2013 Model Update
with AETA stakeholders but have not led to a change in the model However these issues do
not cover the OampM costs considerations that are detailed in section 4
31 Representation of Uncertainty
The recognition of uncertainty within the model was discussed including both the level of
representation and potential uncertainties with respect to First-of-a-Kind and lsquoEarly Moverrsquo
Technologies
A number of factors were identified that lead to uncertainty in estimates ndash particularly for
emerging technologies For conventional coal and gas technologies even though the
technology is mature the addition of carbon capture introduces cost and performance
uncertainty Cost estimates have inherent uncertainty due to the market uncertainties and
unforeseeable technological developments and due to
- Volatility in equipment pricing
- Volatility in economic conditions (during post Global Financial Crisis) and
- Volatility in labour pricing due to ldquootherrdquo heavy construction projects in specific areas
For technologies where the costs are well understood it was considered that the error bars
should be reduced compared to immediate and emerging technologies and that the error bars
should be lower for technology costs in 2012 compared to later years
There is strong agreement from two key stakeholder submissions with all the factors causing
uncertainty that have been identified in AETA 2012 In particular the labour cost has varied
(increased) significantly due to large construction projects which have increased costs due to
a shortage of labour and a lower productivity due to less experienced personnel The
uncertainties provided in the AETA model are available on a per technology and a per
selected years basis BREE will consider whether or not to include more detail on
uncertainty by technology in the 2014 review of the model
32 Application of Learning Curves
It was raised during the consultation process that the AETA model revision could allow for
learning curve cost reduction assumptions to be altered by the end user This has not been
incorporated in the 2013 update as it is a structural change to the AETA Model
Stakeholders also raised the question as to whether it is possible within the application of
learning curves to distinguish between the potential for cost reductions on manufactured
components like PV panels versus the Balance of Project (BoP) costs which may involve
routine assembly and erection activities which are not subject to significant learning by
doing
However there are opportunities for cost reductions particularly where many repetitive tasks
are involved such as solar field construction modular construction techniques
rationalization of components in the BoP design or reduction in assembly or placement time
21
This is supported in the US Solar Market Insight Report 2012 (Kann 2012) which identified
continued savings in inverter and racking costs as follows
ldquohellip falling equipment costs and fine-tuning of installation practices have made large-
scale solar less expensive QQrdquo
ldquohellip with the continuing maturation of the industry we expect continued focus on
reducing PV balance-of-systems costs (BOS) and that the increased worry over high
penetration PV will drive adoption of 1000Vdc and advanced inverters
respectivelyrdquo and
ldquoMounting structure manufacturers noted that the past year has seen tremendous
pricing pressure accounting for price declines of anywhere between 10 per cent and
30 per cent over the past yearrdquo
Given that the balance of plant costs can also be subject to cost reductions it is not
considered necessary to distinguish learning curves for discrete project costs in the model
33 General Costs Considerations
331 Fuel Costs
The outlook for fuel costs for gas coal and carbon was claimed to have materially shifted
since the AETA 2012 model While there was no evidence provided to support this
consideration will be given to this issue in the 2014 model update
332 CCS Costs
A submission cited the ZeroGen Case Study and sought to clarify the differences in CCS
cost between ZeroGen and lower values estimated for AETA 2012 This is a valid
comparison however BREE notes the following issues which contribute to explaining the
differences The international cost component is as follows AETA 52 per cent ZeroGen 34
per cent With the USD exchange rate AETA 1 ZeroGen at 08 adjusting the AETA value
for exchange rate variation would add A$952kWnet to the AETA value There is a
difference in plant size with AETA at 557 MW net and Zerogen 400 MW net A bigger plant
size would typically provide a lower cost kW installed
Additionally section 112 of Chapter One of the ZeroGen report advises escalation based on
project delivery from 2011 to 2017 AETA costs are for 2012 basis and do not include
escalation beyond this time A portion of the Zerogen costs will be inflated over the
comparable AETA cost Also section 113 of Chapter One of the ZeroGen report identifies
significant enabling works This is likely to be more inclusive than considered in the AETA
2012 report as identified in section 23 (a)
Overall it is considered likely that a number of estimate basis items in the ZeroGen study are
different and once equalised will show a smaller difference between the AETA and
ZeroGen values Therefore there is no immediate action but the basis and assumptions of the
model may be reviewed during 2014 AETA update
With regard to CCS efficiency one submission proposed that the AETA estimates were
overly optimistic However no references were cited to support this view and no change has
been made to the model
22
333 Opportunity Costs
A submission was made that footnotes be included regarding retrofit costs to indicate that
make-up power costs are not included This was not adopted because AETA parameters for
each technology are calculated for that technology alone and do not consider the impact of
reduced output of a retrofit project where additional output needs to be generated from
alternate higher cost generation Opportunity costs are specifically related to business cases
for specific projects and are not considered for any cases presented in the AETA report
Moreover retrofitting does not make electricity generation uncertain or intermittent It only
lowers the flow of generation at a constant rate (due to lower thermal efficiency) relative to
the non-retrofit case
34 Capital and Construction Costs
A submission was made to update the AETA values for the mid-point capital cost for several
technologies based on a study provided in support of the submission The technologies
asserted were
IGCC (Integrated Gasification and Combined Cycle) with 90 per cent capture fuelled
with Victorian brown coal
IGCC with no capture fuelled with black coal
IGCC with 90 per cent capture fuelled with black coal
Pulverised Fuel power plant with 90 per cent capture fuelled with Victorian brown
coal
Pulverised Fuel power plant with 90 per cent capture fuelled with black coal and
OCGT with no capture fuelled with natural gas
There is a key difference in the magnitude of the labour component in Australia compared
with the labour costs associated with the supporting material (from the USA) While no
changes have been made to the model in this update the ldquoshort termrdquo impact of labour
pricing on technology costs may be considered in further updates
Similarly it was submitted that the capital cost values for combined Cycle Gas Turbine
(CCGT) (with and without capture) could be revised As no documentary evidence was
provided to support this no change was made
For Direct Injection Coal Emulsion (DICE) power plant with no capture fuelled with
Victorian brown coal it is also suggested that the values be reviewed with a number of
papers provided for reference However these papers do not address capital cost in any depth
and it is unclear if the balance of project costs included are comparable with AETA DICE
technology is not mature and is probably best described as in the demonstration to
deployment phase of development which brings uncertainty into the cost analysis Therefore
data is needed to substantiate this submission As this was not available at the time of
preparing this report consideration of this issue is deferred to a later time when the necessary
data is available
An increase in the capital costs for Solar thermal trough (6 hrs storage) and Solar thermal
central receiver (6 hours storage) were proposed based on a supporting study by the Electric
Power Research institute (EPRI) The proposed values are substantially larger than the AETA
23
2012 but it is not clear what basis is used to generate these revised values A separate
submission received from another AETA stakeholder has supported the AETA values
Additionally the cited reference for solar thermal trough the Energy Power Research
Institute (EPRI) plant configuration is based on air cooling ndash while for AETA the plant
configuration assumes water cooling The difference in plant configuration will account for a
small part of the difference The AETA value is based on a reference report as issued in 2012
by the US National Renewable Energy Laboratory (NREL 2012)
The AETA value for the central receiver technology is based on a small (20MW) plant
(Gemasolar) with factors for adjustment to field size for thermal storage capacity and post
FOAK learning These factors will align with increased uncertainty in the AETA value It is
likely that additional cost information may now be available for the Brightsource Ivanpah
plant (no storage) and other tower plants being considered under construction
Further investigation of these issues has been sought with stakeholders but is as yet
unavailable
Another suggestion was made to consider capital costs on a component basis The capital
costs used in AETA 2012 for existing technologies were based on actual costs that could be
sourced on published documents (locally andor internationally) or from WorleyParsons
internal data For developing technologies costs were not considered on a component level
For this reason in technologies that are not commercialised a number of assumptions would
need to be made which may limit lsquorealrsquo costs being available No change to the model arose
from this submission
A reassessment of the construction expenditure profile for concentrating solar power (CSP)
technology options was sought in another stakeholder submission and supported by a
referenced report (IT Power 2012) However the plant sizes considered in the AETA report
are larger capacity (100 MW+) than those discussed in the cited report and consequently
have a longer duration construction period As three years is considered to be an appropriate
time period to spread the construction expenditure profile no change to the model was made
35 Costs Associated with Solar Technologies
A change to the model was sought with regard to the significant downward trends in the cost
of solar PV The stakeholder submission cited pricing data from the Australian Photovoltaic
Institute (APVI) Consultation with the APVI identified that evidence based information for
utility scale PV costs in Australia is limited because Australia has no PV systems 100 MW or
larger It is acknowledged however that there is significant and continued volatility in the
solar PV market including volatility due to competition oversupply in the PV module
market as well as continued price reductions for balance of system and installation costs
A$338 Wnet was a reasonable valuation for 2012 AETA The AETA 2012 value will be
maintained but may be reviewed in the 2014 model update
It was also suggested that solar thermal costs could be better represented in the model by
allowing for different periods of storage rather than a standard 6 hours The AETA 2012
scope was based on fixed plant designs which included fixed thermal storage sizing where
thermal storage was included With thermal storage there are a number of variables that can
be considered including differing field sizes (solar multiple) as well as actual thermal storage
capacities This is likely to add significant complexity to the report and to the model the
benefit of which at this stage does not warrant the changes
24
36 Costs Associated with Nuclear Technologies
It was submitted that consideration be given to including the impact on LCOE for nuclear
technology of the relatively high insurance costs for nuclear technologies This issue will be
considered in the 2014 review of the AETA model However insurance costs or plant
decommissioning costs are not considered for any of the 40 AETA technologies
Also the OampM improvement rate for Nuclear was not reconsidered as there is no OampM
improvement rate for Nuclear in the model
37 Further Technologies
A proposal was received which recommended that further technologies (DICE power plant
based on black coal with and without capture and DICE brown coal with capture and
medium speed DICE technologies) be incorporated into the AETA Model However as
mentioned earlier this update of the AETA 2012 Model only considered the technologies
included in that model This update of the model is not intended to broaden the technologies
38 Auxiliary Loads
Another example used for the purposes of drawing comparisons with the AETA model was
the SaskPower Post Combustion Retrofit It is difficult to distil the SaskPower project data
into a direct comparison with the AETA study and consequently there is insufficient data
certainty to warrant changes to the AETA 2012 values The SaskPower Post Combustion
Retrofit was also cited as to its conservative auxiliary loads for brown and black coal
However upon further investigation this was not substantiated within the SaskPower
example
25
4 WIND PV AND CSP OPERATIONS AND MAINTENANCE (OampM) COST UPDATE
41 Operation and Maintenance Costs
OPERATING AND MAINTENANCE COST DEFINITIONS
In considering the costing of OampM there is no absolutely clear definition of which costs
should be considered as fixed and which variable with the breakdown varying based on a
range of issues including technology location and resource type For this reason in the future
AETA reports OampM costs may be compared in terms of annual total operating expenditure
(OPEX) per MW of generation This method is widely used by most international institutions
to analyse OampM costs and to avoid subjective considerations
For this report fixed and variable costs are reported to provide direct comparison with AETA
2012 In this regard in general fixed costs are independent of the electrical generation of the
plant and are expressed as annual cost per MW capacity Fixed costs include items such as
fixed labour
equipment and
vehicles
Variable costs are proportional to the electrical generation of the Plant and are expressed as
cost rate per kWh energy output Variable costs include items such as
variable labour
consumables and
spare parts
As both public and private domain material vary in the way they approach and report on
fixed and variable maintenance within the following text where an interpretation has been
used for comparison purposes this is described
A submission was made to remove the operations and maintenance (OampM) cost escalation
factors This was not taken up as there is an increase in the OampM costs over CPI which is
borne out historically A review of the basis for this escalation determined that the
underlying assumptions were appropriate The review also considered adopting a generic
learning curve approach for OampM improvement rates as was suggested in one submission
This was not adopted as the model has an OampM improvement rate (set at 02 per cent per
annum) which can be varied by the user for wind and solar technologies This value accounts
for more efficient practices balancing the increase in labour and material costs over and
above CPI However changes to OampM improvement rates for selected technologies were
made as mentioned earlier OampM improvement rate values may be further considered for
emerging technologies in 2014 AETA study
A number of submissions referred to the improvement rate of OampM costs with evidence for
existing technologies to support these rising at 150 per cent CPI It was suggested that for
26
developing technologies it could reasonably be assumed that there would be reductions in
OampM between the first commercial installation and subsequent installations
While it is generally acknowledged that the LCOE of delivered energy from wind is falling
within the literature there is conflicting evidence around trends in OampM costs with recent
reports indicating both significant decreases and increases in OampM (see section 432)
Solar thermal plants consist of technology components that can be considered mature (eg
steam turbine) and components that are undergoing further development such as the solar
field and thermal storage Solar thermal plants require manning for operation as opposed to
wind turbines that do not require the same level of manning
A recent article (Muirhead 2013) advised for the Solar Energy Generating Systems (SEGS)
plants in California that have been operating since the early 1990rsquos ldquoMy understanding is
that the performance of the SEGS plants has significantly improved over time This is due
primarily to replacement of first generation receivers with newer receivers that are much
more efficient OampM practices at the plants have also improved over time based on the now
long history of operating these plants resulting in increased output in addition to reduced
OampM costs
In the AEMO report 100 Per Cent Renewables Study - Draft Modelling Outcomes Scenario 1
assumes that rapid technology transformation will drive real reductions in OampM costs
outweighing any increases projected in the AETA 2012 so OampM costs reduce by 125 per
cent by 2030 and 25 per cent by 2050 Scenario 2 uses the AETA 2012 assumption that
OampM costs escalate at around 150 per cent of Consumer Price Index (CPI) which leads to
cost increases of 27 per cent by 2030 and 46 per cent by 2050 It should be noted that the
Scenario 1 reductions are assumptions without further analysis of what will bring the
assumptions to fruition
In AETA 2012 the common OampM improvement rate for most technologies is set at 02 per
cent and can be varied as a user input The OampM improvement rate for emerging
technologies solar thermal and photovoltaic technology options and offshore wind is set to
25 per cent and can also be varied as a user input The improvement rate is now compounds
on the previous yearrsquos value
The OampM improvement rate values may be further considered for emerging technologies in
2014 AETA study
42 Operating and Maintenance (OampM) Changes in summary
As part of the Model Update special emphasis was placed in this report on the Operational
and Maintenance (OampM) costs and OampM improvement rates for all wind solar thermal and
solar PV renewable technologies covered in AETA 2012 As mentioned earlier this took into
account relevant Australian and international reports public domain information private
sources as well BREE and WorleyParsonsrsquo in-house experience The updated OampM values
are shown in Table 4 Reductions in CSP OampM costs of between 8 per cent and 27 per cent
were obtained in comparison to values provide in AETA 2012 report
The review included a detailed review of a report by IT Power cited as part of one of the
stakeholder submissions In that report reference is made to a case where $18MWh of OampM
costs comes from 64MW trough plant however it does not specify the relevant location hour
27
of thermal energy storage (TES) capacity factor type of cooling and back-up fuel and
therefore cannot be fully analysed nor used towards this AETA update
OampM costs for solar thermal plants are significantly affected by the costs of manpower To
demonstrate this with an example $18MWh for a 100MW plant with a 23 per cent capacity
factor (the IT Power report consideration) would result in an annual OampM cost of
approximately $36 million A 100MW plant will need at least 28 full time employees to be
properly manned 7 daysweek as there needs to be multiple shifts With this amount of
labour there are insufficient funds for site services utilities and materialsmaintenance If the
value is based on another location such as the Far or the Middle East region where labour
costs are significantly lower then a lower OampM cost may be feasible however for Australia
this does not appear to be feasible
The changes to OampM values for the 2013 AETA model refresh are summarised below
Table 4 Model Changes OampM costs
AETA 2012 report reference AETA 2012 model value AETA 2013 update
Section 23 Technical Assumptions
Operating and Maintenance Cost
Estimates
OampM improvement rate 02per
cent all technologies
OampM improvement rate maintained at
02per cent for
Coal based technology options
Gas based technology options
Solar thermal hybrid options
Onshore wind
Biomass technology options
Wave technology options
Geothermal technology options
Nuclear technology options
OampM improvement rate changed to 25per
cent for
Solar thermal technology options
Photovoltaic technology options
Offshore wind
The OampM improvement rate is compounded
from the previous yearsrsquo value
Section 33 Solar thermal
technologies
Solar thermal - Parabolic Trough wo
storage
Fixed OampM (AUS$MWyear)
Variable OampM (AUS$MWh)
60000
15
59176
1519
Solar thermal - Parabolic Trough with
storage
Fixed OampM (AUS$MWyear)
Variable OampM (AUS$MWh)
65000
20
72381
1139
Solar thermal - central receiver
technology wo storage
28
AETA 2012 report reference AETA 2012 model value AETA 2013 update
Fixed OampM (AUS$MWyear)
Variable OampM (AUS$MWh)
70000
15
58285
707
Solar thermal - central receiver
technology with storage
Fixed OampM (AUS$MWyear)
Variable OampM (AUS$MWh)
60000
15
71312
565
Solar thermal - Linear Fresnel wo
storage
Fixed OampM (AUS$MWyear)
Variable OampM (AUS$MWh)
60000
1500
64105
1519
Solar thermal - Linear Fresnel with
storage
Fixed OampM (AUS$MWyear)
Variable OampM (AUS$MWh)
65000
20
72381
1139
Section 35 Photovoltaic
technologies
PV ndash non tracking
Fixed OampM (AUS$MWyear)
25000
25000 (no change)
PV - Single Axis Tracking
Fixed OampM (AUS$MWyear)
38000
30000
PV - Dual Axis Tracking
Fixed OampM (AUS$MWyear)
47000
39000
Section 36 Wind Technologies
Wind Onshore
Fixed OampM (AUS$MWyear)
Variable OampM (AUS$MWh)
40000
12
32500
10
Wind Offshore
Fixed OampM (AUS$MWyear)
Variable OampM (AUS$MWh)
80000
12
77600
30
43 Wind
431 Introduction
This Section reviews onshore and offshore wind operations and maintenance (OampM) costs
used in AETA 2012 The values scrutinised are the fixed and variable OampM given in Table
361 of that report summarised in Table 5 below
29
Table 5 Wind OampM costs used in the AETA 2012 report
Option Fixed OampM (AUS$MW) Variable OampM (AUS$MWh)
Onshore 40000 12
Offshore 80000 12
OampM covers all of the services required to keep the wind farm operating as contracted to
supply energy and renewable energy certificates for its lifetime inclusive of
turbines and all balance of plant (roads buildings electrical equipment SCADA
control equipment) up to the high voltage connection point on the wind farm
substation
labour (both trades and professional)
facilities (workshops stores offices)
equipment (tools jigs vehicles rigging safety equipment craneage)
spare parts and
consumables (such as oil grease and office consumables)
Windfarm size was not specified in AETA 2012 however it was noted that wind farms
greater than 100MW are becoming more common Since then within Australia wind farms
of larger and smaller sizes have been constructed for example the 420 MW Macarthur Wind
Farm in Victoria and the 55 MW Mumbida Wind Farm in Western Australia with both larger
and smaller wind farms under proposal For this review a nominal size of 100-150 MW is
used as representative of current and future facilities
432 Review of Evidence
As mentioned earlier the review of public literature by BREE and WorleyParsons the
procurement of private studies consultations with owneroperators in the wind farm OampM
sector in Australia AETA Stakeholders and project Steering Committee members were used
to assist the current Model Update process Where possible these sources are noted in the
text however some of these sources have asked to remain anonymous and where so the
term ldquoprivate sourcerdquo has been used
As noted by one reviewer in NREL 2011 OampM cost information in the public domain in
both quantum and quality is poor and the situation appears no better in 2013 particularly in
the discrimination of fixed and variable costs One reason for this is the commercial and
increasingly competitive nature of the sector with wind farm OampM now a significant
business worldwide with subsequent confidentiality around actual costs
What constitutes wind farm OampM is also changing This is driven in part by technological
change as the wind fleet ages as new turbines become larger and more sophisticated
particularly offshore Competition in the provision of OampM services is also changing with
maturing of the wind energy product As an example the following industry trends are now
evident
30
a growing role of independents in the wind OampM market ndash around 25 per cent of the
wind fleet in the US is expected to be operated and maintained by independents by
2025 (Ebert and Ware 2013) as opposed to original equipment manufacturers (OEMs) -
wind is largely a commodity market and easier for new participants to enter something
not necessarily seen with other generation technologies
tighter supply markets ndash general economic volatility is tightening the supply and
project development chain for wind moving interest into the OampM sector bringing
price volatility and more competition
a more sophisticated asset management model ndash where OampM providers are linking
operational data with long term condition monitoring output forecasting and work
order scheduling to deliver what is termed ldquolifecycle optimisationrdquo squeezing more
energy out of the asset
older turbines exceeding planned maintenance budgets ndash with the chief issue being
keeping the variable OampM from unforeseen breakdowns
a push for larger turbines particularly offshore (5-10 MW) and in deeper waters and
linking OampM to turbine contracts ndash there is evidence (including in Australia private
source) that wind farm OampM is becoming an even more significant bargaining
component of turbine supply contracts where lower supply costs are balanced by
longer OampM contracts
Costs of wind OampM are difficult to summarise as they are dependent on many issues As just
one example in the NREL 2011 study cited earlier a wide variability in wind farm OampM
costs was found across a range of countries (Figure 1) This reference demonstrates this
variability from the average reference case in terms of Levelised Cost of Energy (LCOE)
31
Figure 1 Effect of country variables on LCOE of wind plant
Source NREL (2011)
Other issues which affect the contracted cost of OampM for wind include
regional variations in labour and transport costs
wind farm environment particularly wind regime and proximity to the ocean
(corrosion)
the maturity and availability of wind turbine technicians
the spread of facilities geographically and the wind farm asset sizes in a portfolio
the turbine type and brand particularly the support establishment within a Region
the age of the asset OampM history and existence of Type (or systematic) failures of
major components
the ability of the OampM provider under the contract to source third party spares andor
try varied maintenance practices and
the nature of the OampM contract ndash for example does it include risk reward elements or
have a link to the wind turbine supply contract or is it a ldquoproduction availabilityrdquo
contract type
While it is generally acknowledged that the LCOE of delivered energy is falling for wind
technology (Hand 2013) within the literature there is conflicting evidence around trends in
OampM costs with recent reports indicating both significant decreases (BNEF 2013) and
increases (Ebert and Ware 2013) It is generally acknowledged that increased competition in
the OampM market is delivering lower cost service provision but this may in part be offset by
an ageing fleet requiring more variable maintenance and a more sophisticated and costly
32
response Several studies have demonstrated that the costs of maintaining wind turbines
generally increase with time following a trend similar in shape to that in Figure 2 (Hand
2013) with estimates in Albers (2009) indicating a doubling in turbine OampM costs by mid
plant life The term COD in Figure 2 refers to commercial operations date
Figure 2 Typical cost increasing trends in wind farm OampM costs with commercial operations
date
Source Adapted by WorleyParsons from Houston (2013)
In Australia this trend is also evident in post 10-year aged machines (private source)
particularly in relation to variable maintenance The nature of any similar increase with more
modern turbines is unpredictable although turbine availability is improving and there is
evidence that OampM costs with each generation of turbine are lowering see Wiser et al
(2012)
The OampM costs for offshore wind farms are particularly difficult to estimate as the industry
is still at the early stages of development including the progression of much larger turbines
into deeper water and the more complex nature of the task Such progression is indicated in
Figure 3 taken from RolandBerger (2013) which indicates an expected decrease in OampM
costs These costs are of the same order of that published in other recent publications UK
Crown Estate (2012) and US DoE (2013)
33
Figure 3 Trends in offshore wind farms and estimated impact on LCOE
Source RolandBerger (2013)
433 Updated OampM Figures for Australia
It is not a simple matter to transfer international costs to Australia as despite trends there are
significant differences between regions including
size of market ndash despite growth the Australian wind market is small with respect to
other world regions For example the total wind fleet is 4 GW (CEC 2013) for
Australia versus 60 GW for the US (AWEA 2013)
labour and material rates in certain parts of Australia are high by world standards
the logistics of getting to and within Australia generally involve longer distances than
other areas of the world particularly due to the remoteness from major equipment
suppliers
volatility of the Australian dollar particularly against the US and
the size of Australian wind farms tends to be larger
These differences can be seen in Figure 4 supplied by a turbine equipment supplier (private
source) and showing the relative OampM costs (per MW) and technician numbers (per 100
MW) across various world regions in 2012 for wind turbine maintenance only and excluding
balance of plant Numbers and scales between the two indices have been removed to protect
the confidentiality of this supplier with data believed to cover the entire global portfolio
under management This shows a significant difference between regions for onshore in both
indices for example almost a 45 per cent difference in costs between Europe and America
Australia would sit within ldquoAsiaPacificrdquo and while the Figure indicates generally lower
OampM costs and higher technician numbers for this region this presumably covers a very
diverse area (including South East Asia New Zealand and Oceania) which may skew results
34
Unlike many larger global markets the wind OampM sector in Australia is dominated by
turbine equipment suppliers with original equipment manufacturer (OEM) contracts
estimated to cover more than 95 per cent of the fleet The evidence for this is mostly
anecdotal although a number of smaller independent suppliers are now known to be
undertaking full service OampM for older plant (gt10+ years) with many of the drivers for this
covered in Ebert et al (2013) There is also evidence (private source) that wind turbine
suppliers in Australia are seeking OampM contracts with much longer terms and tying these to
reductions in turbine supply prices This may indicate a lack of competitive pressure on
OampM pricing in the near to mid-term and as the size of the overall market is small it is
unknown whether independents will grow market share as has been the case in many larger
global markets see for example Deloitte amp Touche (2012)
The most recent contemporary literature comments on onshore wind farm OampM pricing in
Australia and surrounds that could be found in the public domain and not used for the AETA
2012 work are from Hassan (2011) and Deloitte (2011) These are summarised with other
new international references cited in Table 6 with assumptions on any conversions noted
below the table As no offshore wind farm projects have been progressed in Australia the
table includes values from new sources for offshore projects from the international public
domain literature - the significant difference to onshore costs is evident in the values
Figure 4 OampM Costs (per MW) and Technician Numbers (per 100MW) for total wind turbine
OampM (Opex)
Source Private - values and scales removed to protect confidentiality
From Table 6 and considering the differences in markets it appears that for onshore wind the
AETA 2012 estimates may be slightly high with an updated AETA 2013 recommendation
given in Table 7 This value has been arrived at by considering
the size of the Australian wind market and lack of competitive pressure from
independent OampM service providers
35
supply side pressures on OEMs driving them to protect their OampM businesses and
lowering costs
the likely increase in fleet installations to comply with RET legislation skewing the
fleet age to more a modern generation of turbines although it is noted that there is some
uncertainty around long term OampM cost trends particularly variable maintenance ndash an
asset age of around 5 years is assumed here
uncertainties in what is included in referenced values and differences in markets and
advice from actual asset owners and OampM providers (private sources) on current actual
costs
Table 6 Comparison of AETA 2012 wind OampM estimates with new references for 2013
Source Region
Fixed OampM
(AUS$MW)
Variable OampM
(AUS$MWh)
Total OPEX
(AUS$MW)
On
sh
ore
AETA 2012 Australia 40000 12 799451
Houston 2013 US - - 35-380002
BNEF 2013 Global - - 25000
3
Private Source (2013) (gt 10 yr old
plant) Australia - - 70000
Private Source (2013)
(lt 2 yr old out of warranty plant) Australia - - 55000
Hassan 2011 Australia - - 83-99000
4
Deloitte 2011 New Zealand - - 450005
Off
sh
ore
AETA 2012 Australia 80000 12 1262526
Crown Estate 2012 UK - - 275000
7
Hassan (2013) UK - - 2391567
RolandBerger 2013 Europe - - 198000
8
US DoE 2013 US - - 144970
9
1 Assumes a 38 capacity factor
2 USAUD = 109 extrapolated from Figure approximately to 2013
3 EUROAUD = 142 uncertain if this includes all balance of plant or VOM and only includes OEM providers
4 Assumes a 38 capacity factor
5 Assumes NZAUD = 084 a 38 capacity factor and the mid-range estimate for OampM
6 Assumes a 44 capacity factor
7 Assumes GBPAUD = 167 and taking midpoint of estimates stated
8 Assumes GBPAUD = 167 and taking value for 3MW turbines
9 Assumes USAUD = 109
36
The figures shown for onshore projects in Table 7 represent a 15 per cent decrease in the
expected OampM costs of wind farms in Australia compared to AETA 2012 This change
reflects the volatility in this market noted in previous sections and in referenced material
internationally plus the appearance of significant downward pressure on wind OampM prices
primarily through increased global competition The values allow for the rising price of
turbine OampM as the turbine ages during its life
For offshore wind it appears that the OampM costs in AETA 2012 are too low and although it
is tempting to align costs with the most recent US figures due to their lower costs and similar
coastal conditions to Australia the European offshore fleet is significantly larger and more
mature Average figures across the 2013 referenced material including Europe is
recommended This is also shown in Table 7 and represents a significant increase in estimate
costs (around 33per cent) which reflects this evolving sector
There is very little contemporary information available on the breakdown of fixed and
variable maintenance on wind plant making judgment around this for the AETA requirements
is difficult However there is some published but copyrighted material eg GlobalData 2012
which combined with others (private sources) indicates that for onshore and offshore wind
plant respectively a 5050 and 4060 FOM VOM split is appropriate This has been used to
adjust the total OPEX figure in Table 7 to the AETA scheduled and variable indices
requirements using a 38 per cent and a 44 per cent capacity factor for onshore and offshore
projects respectively
Table 7 Recommended AETA (2013) values
AETA (2013) update Fixed OampM
(AUS$MW)
Variable OampM
(AUS$MWh)
Total OPEX
(AUS$MW)
Onshore $32500 $10 $65790
Offshore $77600 $30 $194000
44 Solar Photovoltaics (PV)
441 Introduction
This Section of the report focuses on the OampM costs for ground-mount photovoltaic (PV)
technologies broken down by the following mounting system configurations
Fixed Tilt (FT)
Single Axis Tracking (SAT)
Dual Axis Tracking (DAT)
Although different PV panel technology types (eg poly-crystalline mono-crystalline or thin
film CdTe) affect the capacity factor and land use the OampM costs are comparable The
estimates for this Report are based on polycrystalline PV technology which provides an
average cost on a per Watt basis with mono-crystalline OampM costs being slightly lower and
thin film OampM costs being slightly higher
With the aim to provide comparable results between technologies WorleyParsons has
analysed and updated the PV OampM costs in terms of both fixed operation and maintenance
37
costs (FOM) and total operating expenditures (OPEX) based on reference plants of similar
characteristics
Assumptions interpretations and considerations based on their in-house data and global
market trends are described in the following Sections
442 Review of the Evidence
Since the AETA 2012 report release few new public domain reports related to OampM costs
for PV systems have been published To confirm this the following organisations have been
consulted by WorleyParsons to provide the 2013 OampM costs update for the selected PV
configurations
International Renewable Energy Agency (IRENA) (wwwirenaorg)
International Energy Agency (IEA) (wwwieaorg)
The World Bank (WB) (wwwworldbankorg)
The US National Renewable Energy Laboratory (NREL) (wwwnrelgov)
Solar Energy Industries Association (SEIA) (wwwseiaorgau)
European Photovoltaic Industry Association (EPIA) (wwwepiaorg) and
Solar Electric Power Association (SEPA) (wwwsolarelectricpowerorg)
Upon review of the available information when compared to AETA 2012 the listed
organisations do not have any new public information related to large-scale PV OampM costs
If OampM costs are mentioned they are normally referenced as a per cent of the total Capital
Expenditure (CAPEX) for the plant (around 1 per cent) and provide little useful information
about OampM Cost changes
Due to insufficient detailed and recent information in the public domain WorleyParsons
obtained the following market reports from Photon a private organisation focused on market
news political discussions and technology analysis for the PV industry
Photon 2013 ldquoThe True Cost of Solar Power - Temple of Doomrdquo and
Photon 2013 ldquoSolar Annual 2013 - Build your Empirerdquo
These private reports had minimal focus on OampM costs To provide further input in this
area private OampM service providers were contacted for pricing estimates and market trends
443 AETA 2012 OampM PV costs report comparison
Typical power plant OampM costs are expressed as a combination of a variable component
(proportional to generation) and a fixed component (occurs irrespective of generated output)
Since the generation of a PV plant is dependent on solar radiation (not requiring fossil fuel or
water which make up the major components of variable costs for conventional generation) it
is typical to express the OampM costs only as Fixed OampM (FOM) costs proportional to the
plant size due to the simplicity of PV systems The AETA 2012 report follows this practice
and estimates the PV OampM costs as FOM only relative to plant size (kW) expressed on a per
year basis
38
In order to facilitate comparisons of these costs with other electricity technologies the FOM
costs in the AETA 2012 report are also presented as OPEX costs per MW of generating
capacity per year
ASSUMPTIONS AND CONSIDERATIONS
The following costs are included in the FOM estimates as an annual cost per kW capacity
labor and administrative expenses
panel washing (twice per year at $300 kl for water)
weed abatement (seasonal herbicide applications)
inverter replacement reserve (replaced at operational year 10) and
materials and maintenance spare parts civil works preventative and corrective
equipment maintenance
Although the cost of water is variable depending on location and usage it is such a small
portion of the total OampM costs that it is adequate to assume it as a fixed cost using the
assumptions listed above
AETA 2012 PV OampM COSTS COMPARISON REPORT
The technical characteristics of the reference PV plants used in the AETA 2012 report have
been extracted from the AETA 2012 Model (Version 1_0 Rev B BREE 2012) and are
summarised in Table 8
Based on this information the following parameters for the PV technologies are estimated
Total net energy production in terms of MWh sent out per year
Total plant acreage
FOM in terms of USD per year and
Total OPEX costs in terms of USD per year and USD per total net energy production
per year
39
Table 8 AETA 2012 reference plants technical characteristics and OPEX costs
Plant Characteristics Units Fixed Tilt (FT) Single Axis Tracking (SAT)
Dual Axis Tracking (DAT)
Plant Characteristics
Plant Net Capacity MW 100 100 100
Capacity Factor per cent 21 24 26
FOM $kWyear 25 38 47
Net Energy MWhyear 183960 210240 227760
Plant Acreage acres 500 800 900
Total FOM $year 2500000 3800000 4700000
Total OPEX $year 2500000 3800000 4700000
Total OPEX $kWh 00136 00181 00206
Total OPEX costs are between 00136 and 00206 USDkWh as shown in Table 8 above
These values are conservative cost estimates but reasonable for a large-scale PV plant with
comprehensive OampM service As is expected the FOM or OPEX costs increase as the plant
footprint increases and the complexity of the mounting system increases However the
increases to single and double axis tracking technologies are larger than would be expected
The increased complexity of the trackers does add costs to OampM in terms of labor parts and
even physical plant size but these additions are minor in comparison to the larger OampM
budget items such as the inverter replacement reserve and general electrical maintenance
which are irrespective of mounting system
These values although conservative still show the cost reductions from the industry learning
curve and expanded competition over the past few years when compared to past estimates of
OampM costs This can be seen in the following Table 9 of Fixed Tilt (FT) costs which
provides some estimates found in previous publications by IEA (2008) and EPRI (2010) The
tracking estimates are not shown since minimal data is available This corresponds to the
historical market trend of the industry being more willing to install fixed tilt systems rather
than tracking systems due to lower costs and technology risk
Table 9 Comparison of historical estimated PV and OampM costs in the public domain
PV Configuration OampM Costs Units IEA 200810
EPRI 2010 AETA 2012
Fixed Tilt (FT) FOM $kWyear 40 32 to 37 25
values in Italics are derived from reported data
10
Report assumed 1 of capital costs and 23 capacity factor
40
45 AETA 2013 PV OampM Costs Update
Using the same plant characteristic assumptions as the 2012 AETA Model the 2013 OampM
costs were estimated by WorleyParsons based on the references described in review of the
evidence in Section 442 The comparison of the AETA 2013 and 2012 OampM costs are
presented in Table 10 below
Table 10 2013 PV OampM costs compared to 2012 PV OampM costs PV Configuration OampM Costs Units AETA 2012 WorleyParsons
2013 Update
Fixed Tilt (FT) FOM $kWyear 25 25
OPEX $kWh 00136 00134
Single Axis Tracking (SAT) FOM $kWyear 38 30
OPEX $kWh 00181 00141
Dual Axis Tracking (DAT) FOM $kWyear 47 39
OPEX $kWh 00206 00173
Although the OampM costs for FT systems are approximately the same SAT and DAT OampM
costs reduced by around 20-30 per cent in this 2013 update compared to the AETA 2012
report The consistency of the FT costs is reasonable and expected to continue for the next
few years as discussed further in Section 451
Regarding the SAT and DAT costs although there have been improvements in the design of
trackers for PV applications this OampM cost reduction is due to a better understanding of the
costs associated with electrical and tracking system maintenance The cost differences
between tracking systems was corroborated by quotes from private OampM service companies
who indicated that there was only a slight increase in costs from FT to SAT but a larger
increase in costs from SAT to DAT
As compared to the references mentioned in Section 442 the updated cost estimates are
conservative Table 11 compares the estimated 2013 OampM costs with those references
However since these publications focused primarily on the CAPEX with very general OampM
cost assumptions the OampM costs presented therein are not considered representative
baselines for large-scale solar projects Furthermore they attest to the industryrsquos tendency to
focus strictly on installation costs and not lifecycle costs which is discussed further in Section
451
41
Table 11 2013 updated OampM costs compared to new referenced OampM costs (7-2) PV Configuration
OampM Costs
Units WorleyParsons 2013 Update
11
NREL 2013
12
IRENA 2013a
13
Photon 2013
14
Private OampM Service Providers
201315
Fixed Tilt (FT) FOM $kWyear 25 235 17 to 21 18 17 to 23
OPEX $kWh 00134 00216 to
00383
00121 to 00266
00098 00094 to 00127
Single Axis Tracking (SAT)
FOM $kWyear 30 Not provided
Not provided
Not provided
25 to 27
OPEX $kWh 00141 Not provided
Not provided
Not provided
00136 to 00147
Dual Axis Tracking (DAT)
FOM $kWyear 39 Not provided
Not provided
Not provided
32 to 34
OPEX $kWh 00173 Not provided
Not provided
Not provided
00174 to 00185
values in Italics are derived from reported data
451 OampM Learning Rates
In the rapid PV industry growth of the last three years WorleyParsons and anecdotal
experience is that PV was considered generally to require little to no maintenance causing a
general disregard for OampM planning This appears to have resulted in complications as
owners struggle to resolve reliability performance and budget issues as the projects mature
(multiple private sources) Although the maintenance costs are smaller compared to standard
power plants OampM awareness has been increasing in the industry and therefore the OampM
cost estimates have subsequently increased
This is supported through the recent focus of OampM at PV conferences (such as Sandia
National Laboratory and Solar Energy International events) on increasing the investment in
OampM practices in addition to improving the current practices products and services so that
PV plants can be better maintained to achieve higher reliability throughout the plant life
cycle Currently the majority of OampM expenses for PV systems consist of maintaining and
replacing the inverters followed by the Balance of System maintenance In general once the
appropriate level of investment in OampM for PV is reached then OampM costs will begin to
decrease as the following issues develop to maturity
technology improvement
inverter design for reliability and longevity
data monitoring for preventative and corrective maintenance support
system efficiency to increase system output for the same OampM expense
decreased capital costs for major equipment
decreased spare parts costs
11
See assumptions in Section 433 and 443 12
Report assumed 250kW rooftop at 7 to 10 capacity factor 13
Report assumed 1 of CAPEX and 9 to16 capacity factor 14
Values derived from the global weighted average calculations assuming 21 capacity factor and 20 year lifecycle Report assumed a
simple percentage of average selling price 15
Quote excluded weed abatement panel washing and inverter replacement reserve which were supplemented from the WP estimate
Calculations assumed 21 capacity factor
42
industry maturity and stability
reliable OEM support from product consistency and commercial stability
improved codes and standards for PV equipment system design installation
commissioning and OampM and
experience
trained and experienced personnel in the installation and maintenance of PV plants
In line with this trend owners system designers installers and OEMs are now including
OampM considerations in their finances designs services and products Even though there
have been and will continue to be cost reductions in OampM due to the industry maturation
stabilization and competition those cost reductions are balanced with the necessary
increases in OampM investment to meet the maintenance needs of existing and planned PV
plants resulting in a level OampM cost estimate for the next five years
Photon (2013) follows this assumption of consistent OampM costs for the next ten years as well
as WorleyParsons discussions with OampM service providers Therefore the assumption that
PV OampM costs will remain somewhat constant over the next five years before reducing again
appears to follow the projections in the industry
452 Conclusions - PV
The key findings from the AETA 2012 review and update of the PV OampM costs are as
follows
The 2013 WorleyParsons PV OampM costs update resulted in values of
$25kWyear for FT systems
$30kWyear for SAT
$39kWyear for SAT in 2012 USD
Fixed tilt configurations have not seen significant changes in OampM costs compared to
the 2012 AETA estimates while SAT and DAT configurations cost estimates have
reduced approximately 20-30 per cent based on a better understanding of the associated
OampM costs
Values obtained in the 2013 WorleyParsons update are more conservative but are
aligned with values provided by recognised international institutions even though few
detailed OampM breakdowns are available and
OampM costs for PV are expected to remain constant over the next five years before
reducing as the industry matures in both experience and long-term planning
capabilities
43
46 Concentrating Solar Power (CSP)
461 Introduction
This Section of the report focuses on the OampM costs for the following Concentrating Solar
Power (CSP) technologies
Parabolic Trough (PT)
Solar Tower (ST) and
Linear Fresnel (LF)
CSP OampM costs were analysed in terms of
Fixed Operating and Maintenance Costs (FOM)
Variable Operating and Maintenance Costs (VOM) and
Total Operating Expenditures (OPEX)
In order to arrive at comparable results between technologies BREE and WorleyParsons
estimated the OampM costs based on
Reference Plants with similar Solar Plant characteristics localisation net capacity
capacity factor hours of Thermal Energy Storage (TES) and type of cooling system(s)
and
Cost estimate amounts that were updated to 2012 USD
When information was not available necessary estimates were made using WorleyParsonsrsquo
in-house data and based on global market trends observed in various publications
462 Review of the evidence
The following international organisations were consulted to provide the AETA 2013 OampM
costs update for the selected CSP technologies
International Renewable Energy Agency (IRENA) (wwwirenaorg)
International Energy Agency (IEA) (wwwieaorg)
European Solar Thermal Electricity Association (ESTELA) (wwwestelarde)
The World Bank (WB) (wwwworldbankorg)
National Renewable Energy Laboratory (NREL) (wwwnrelgov)
Protermosolar (wwwprotermosolares)
Institute for Energy Diversification and Saving (IDEA) (wwwideaes)
Renovetec (wwwrenoveteces) and
CSP Today (wwwcsptodaycom)
The approach in reviewing OampM costs for the 2013 update for CSP technology was only to
use new sources of information published since the AETA 2012 report was written This was
44
maintained for all but the learning rates estimation which is due to the lack of any new
updated information published since 2012 in relation to this
Upon review of the available public domain information it was found that IEA ESTELA
WB Protermosolar Renovetec and IDEA do not have any new relevant public information
related to CSP OampM costs However IRENA 2013b IRENA 2013c and NREL 2012 are
new references from IRENA and NREL that are considered relevant and which were used in
this report
The information contained in these references did not provide updated costs for all of the
CSP technologies being considered in this Report and the values offered were not provided
in terms of FOM and VOM costs as preferred
Due to the lack of new relevant information in the public domain the AETA 2013 Model
Update process obtained reports from CSP Today a private international organisation
focused on news events reports updates and information for the CSP industry in markets
such as India South Africa Spain USA Chile and MENA regions The Update acquired the
last edition of PT and ST reports CSP Today 2012a and CSP Today 2012b for which OPEX
costs were analysed
463 AETA 2012 OampM CSP costs report comparison
Operating and Maintenance expenses were provided in terms of fixed and variable costs in
the AETA 2012 report and this Model Update has modified these for 2013 for PT ST and LF
technologies based on the references cited above and further consideration of learning rates
for the CSP industry
Most CSP projects with commercial operational experience are parabolic trough technology
as it is the most mature technology and currently more is reported and known about actual
costs than other CSP technologies Nevada Solar One as an example is a 64MWe parabolic
trough plant based in California which was commissioned in 2007 and it is the first plant
built after the SEGS development during the 1980-90s also in California
Andasol 1 the 50 MWe parabolic trough plant based in Spain is also the first CSP plant
worldwide to implement a commercial thermal energy storage system with a capacity of 75
hours of full load storage It commenced operation at the end of 2008 and other similar and
larger trough projects are now operating or being constructed
As the most mature CSP technology trough plant should be further down the operational and
design operability maturity path and hence have a lower opportunity for OampM cost
reductions through learning By contrast Solar Tower and Linear Fresnel systems are only
beginning to be deployed at larger scale and hence there is expected to be more potential to
reduce their capital and operating costs and improve performance
Learning rates have been argued by stakeholders as being very significant for CSP plant with
comments of the AETA 2012 report centring on this issue Disappointingly there is no new
published evidence or actual plant report data that could be found by the AETA stakeholders
and WorleyParsons to add to that used for the 2012 report There is however new evidence
on the reduction in LCOE for CSP technologies and WorleyParsons linked OPEX
contribution to these LCOE predictions so that a sense of future reductions could be made
This is outlined further in the following Sections
45
4631 ASSUMPTIONS AND CONSIDERATIONS
FOM and VOM Breakdown
The following costs are included in proceeding FOM cost estimates for CSP technologies as
an annual cost per MW capacity
Insurance
Labour costs and
Fixed service maintenance contracts
Similarly the following costs are included in the VOM cost estimates as a cost rate per MWh
of sent out energy
Material and maintenance costs spare parts equipment maintenance and unscheduled
inspections and
Utilities costs water auxiliary fuel and auxiliary power when applicable
Some items such as spare parts for scheduled maintenance could be considered FOM costs
However to simplify the comparison and to homogenise all of the analyses across
technologies all concepts related to plant material and maintenance were included in the
VOM costs
4632 AETA 2012 OampM CSP COSTS COMPARISON REPORT
The technical characteristics of the reference CSP Plants used in the AETA 2012 report have
been extracted from the AETA Model Version 1_0 (BREE 2012) and are summarised in
Table 12
Table 12 AETA 2012 Reference Plant Technical Characteristics
Plant
Characteristics
Units Parabolic
Trough
without
Storage
Parabolic
Trough
with
Storage
Solar
Tower
without
Storage
Solar
Tower
with
Storage
Linear
Fresnel
without
Storage
Linear
Fresnel
with
Storage
Plant Net Capacity MW 138 135 122 18 230 225
Location NA Unknown Unknown Unknown Unknown Unknown Unknown
Isolation kWhm2year Unknown Unknown Unknown Unknown Unknown Unknown
Hours of TES h - 7 - 6 - 6
Capacity Factor per cent 23 42 31 42 23 42
Type of Cooling NA Unknown Unknown Unknown Unknown Unknown Unknown
FOM $MWyear 60000 65000 70000 60000 65000 65000
VOM $MWh sent out 15 20 15 15 15 20
Based on the information above this Model Update estimated the following parameters for
the CSP technologies evaluated in this study
46
Total net energy production in terms of MWh delivered per year
FOM and VOM in terms of USD per year and
Total OPEX costs in terms of USD per year and USD per total net energy production
per year
The results are listed in Table 13 below Table 13 AETA 2012 OampM Opex costs on a per kWh basis
Plant
Characteristics
Units Parabolic
Trough
without
Storage
Parabolic
Trough
with
Storage
Solar
Tower
without
Storage
Solar
Tower
with
Storage
Linear
Fresnel
without
Storage
Linear
Fresnel
with
Storage
Plant Net Capacity MW 138 135 122 18 230 225
Net Energy sent out MWhyear 2780424 496692 3313032 662256 463404 827820
FOM $year 8280000 8775000 8540000 1080000 14950000 14625000
VOM $year 4170636 9933840 4969548 993384 6951060 16556400
OPEX $year 12450636 18708840 13509548 2073384 21901060 31181400
OPEX $kWh 00448 00377 00408 00313 00473 00377
FOM per cent 6650 4690 6321 5209 6826 4690
VOM per cent 3350 5310 3679 4791 3174 5310
The percentages of FOM and VOM costs as part of the total OPEX costs are presented in
Figure 5
Figure 5 AETA 2012 FOM and VOM Percentages of Total OPEX Costs
47
In Figure 5 FOM costs are in general terms significantly higher than VOM costs because
they include the higher cost items such as insurance labour costs and fixed service contracts
However as shown in the Figure VOM costs are higher or approximately equal to FOM
costs for technologies with energy storage given the criteria selected for the breakdown
between FOM costs and VOM costs FOM costs will remain relatively consistent from year-
to-year while VOM costs should be broken down even further since the costs of water
natural gas (if required) and electricity vary between locations and from one year to another
Total OPEX costs are expressed in terms of USD per total net energy production per year and
are between 00313 and 00473 USDkWh as listed in Table 13 These values are aligned
with the values provided by international institutions cited although they appear to be
somewhat inflated in comparison with those values that are closer to 0025 and 0035
USDkWh as published by others (eg IRENA)
4633 AETA 2013 OampM COSTS UPDATE
Similar Plant characteristics to AETA 2012 were considered for the appropriate comparison
of OampM costs for this update Plant characteristics include location net capacity capacity
factor hours of TES and type of cooling For this Report the characteristics of the reference
plants used are described in Table 14
Table 14 PT and ST Reference Plant Characteristics
Plant
characteristics
Units Parabolic
Trough without
Storage
Parabolic
Trough with
Storage
Solar Tower
without
Storage
Solar Tower
with Storage
Plant Net Capacity MW 100 100 100 100
Location NA MENA region MENA region MENA region MENA region
Isolation kWhm2year 2400 2400 2400 2400
Hours of TES h 0 6 0 6
Capacity Factor per cent 26 46 275 476
Type of Cooling NA Dry Dry Dry Dry
Source NA WorleyParsons CSP Today 2012a WorleyParsons CSP Today 2012b
The 2013 OampM costs were estimated using as a basis the information provided in the CSP
2012 reports (CSP 2012a and 2012 b) The following considerations were taken into account
the CSP Today reports only consider PT and ST plants with thermal storage
WorleyParsons made the following estimates based on experience with solar and
conventional power plants based on PT and ST technologies without TES
estimated the capacity factor based on plant capacity location and type of cooling
adjusted the insurance material and maintenance and labour costs based on the
solar field reduction factor when applicable
adjusted the steam turbine maintenance based on the potential hours of operation
48
adjusted the plant electricity and water consumption based on the total net
production
assumed similar auxiliary fuel consumption for the plant with and without TES This
assumption is due to the reference plants being based in the same location thus
requiring similar auxiliary fuel consumption for start-up Minimal differences in
auxiliary fuel consumption for freeze protection due to increased time offline for a
plant without TES system compared to a plant with TES are expected but not
considered in this Report as the impact would be minor
the capacity factor provided by CSP Today for PT with thermal storage is considered
high Based on the plant location and capacity WorleyParsons would anticipate the
capacity factor to be closer to 42 per cent instead of 46 per cent as indicated in Table
14 above This difference in capacity factor directly impacts the estimated VOM cost
which is correlated with plant production For comparison purposes the value provided
by CSP Today has maintained and
with respect to Linear Fresnel technology updated information has not been published
since the AETA 2012 report release by the references listed in Section 462 which
WorleyParsons consulted For the purpose of updating the estimates to 2013 it was
assumed that the evolution of the OampM costs would be similar to that of parabolic
trough plants and the same escalation factors were applied
The resulting 2013 and 2012 OampM costs are listed in Table 15 below for comparison
Table 15 2013 CSP OampM Costs Compared to 2012 OampM Costs
CSP Technology OampM Costs AETA 2012 WorleyParsons 2013 update
Parabolic Trough
without Storage
FOM $MWyear 60000 59176
VOM $MWh sent out 1500 1519
OPEX $kWh 00448 00412
Parabolic Trough with
Storage
FOM $MWyear 65000 72381
VOM $MWh sent out 2000 1139
OPEX $kWh 00377 00293
Solar Tower without
Storage
FOM $MWyear 70000 58285
VOM $MWh sent out 1500 707
OPEX $kWh 00408 00313
Solar Tower with
Storage
FOM $MWyear 60000 71372
VOM $MWh sent out 1500 565
OPEX $kWh 00313 00228
Linear Fresnel without
Storage
FOM $MWyear 65000 64107
VOM $MWh sent out 1500 1519
OPEX $kWh 00473 00434
49
CSP Technology OampM Costs AETA 2012 WorleyParsons 2013 update
Linear Fresnel with
Storage
FOM $MWyear 65000 72381
VOM $MWh sent out 2000 1139
OPEX $kWh 00377 00293
The total OPEX costs per year from the AETA 2012 report and the WorleyParsonsrsquo estimates
that were updated for 2013 are compared in Figure 6 below
Figure 6 Comparison of OPEX Costs per Total Annual Plant Production per Year AETA 2012
Report and 2013 Update
Reductions of approximately 20 - 27 per cent in OampM costs would be realised by CSP with
TES according to the updated 2013 WorleyParsons estimates compared to the same costs
reported in the AETA 2012 report However reductions for PT and LF without TES were
found to be lower at approximately 8 per cent
The IRENA reports (IRENA 2013b IRENA 2013c) provide values for OPEX between 0025
and 0035 USDkWh for PT and ST technologies with and without TES Values updated to
2013 by WorleyParsons are between 0023 and 00412 USDkWh for PT and ST
technologies which align with the IRENA values However IRENA does not differentiate
between the utilisation of TES Solar technologies without TES have fewer hours of
production and although OPEX costs are lower in terms of USDMW compared with solar
technologies with TES OPEX costs in terms of costs per total annual plant production per
year will typically be higher for technologies that do not use TES
4634 OampM CSP LEARNING RATES
Cost reductions on CSP technologies are expected to come from the following main actions
economies of scale in the plant size and manufacturing industry
learning impacts on design construction and operation phases
50
advances in RampD of the following factors
Components Solar receivers mirrors HTF storage media supporting structures
trackers and auxiliary systems
Systems Direct steam generation storage systems or hybrid cooling systems
Configurations Hybridisation or duel electricity water plants
a more competitive supply chain
improvements in the performance of the solar field solar-to-electric efficiency and
thermal energy storage systems
increases in the life of plants and
reduced financial costs
Based on the parameters listed above the LCOE from Solar Thermal technologies is likely to
be continuously decreasing and this is born out in the literature that has been reviewed Based
on the IRENA 2013b report the evolution of the LCOE from trough and power tower CSP
technologies shows how the LCOE is decreasing as technology development increases in
Table 16 below Estimates for LCOE for the hypothetical trough and tower CSP plants in
2014 are also included
51
Table 16 Estimated LCOE form Existing and Hypothetical Trough and Solar Tower CSP Technologies
CSP
Technology
Year Capacity
(MW)
Plant Name Location DNI
(kWhm2year)
LCOE 2012
$kWh Installed
Trough
1981 05 PSA Spain 2000 064
1983 138 SEGS I California 2700 039
1989 30 SEGS II ndash VIII California 2700 026
1992 80 SEGS VIII amp IX California 2700 020
2008 - 2009 50 Andasol 1 2 Spain 2000 035
2010 50 Solnova 1 amp 3 Spain 2000 034
2010 - 2011 50 Extresol 1 amp 2 Spain 2000 035
2014 250 Unspecified (wet
cooling no storage)
Not provided Not provided 020
Tower
1987 10 Solar One California 2700 058
2007 11 PS10 Spain 2000 034
2009 20 PS20 Spain 2000 036
2011 199 Gemasolar (wet
cooling 15hr
storage)
Spain 2000 033
2014 120 Unspecified
(dry cooling
storage)
Not Provided Not provided 015
International Institutions such as IRENA ESTELA or the World Bank agree that the LCOE
and capital cost reductions of 28 per cent to 60 per cent are envisioned by 2020 ndash 2025 for
such plant Estimates of possible LCOE reductions for CSP technology from 2012 to 2025
are provided in Figure 7 taken from Kearny (2010)
52
Figure 7 Expected LCOE Reductions for CSP Technology from 2012 to 2025
Source (Kearny 2010)
The OampM maintenance costs of modern CSP Plants are lower than those for Californian
SEGS Plants built in the 1980s and 1990s which has a total combined capacity of 354 MW
and estimated OampM costs of USD 004kWh (IRENA 2013b) However CSP experienced no
growth from early 1990s until the mid-2000s as can be seen in Table 16 above
As stated at the beginning of Section 462 Andasol 1 was the first 50 MWe parabolic trough
plant built after SEGS which included a thermal energy storage system It commenced
operation at the end of 2008 Podewils (2008) estimated Andasol 1 OampM costs of EUR
0072kWh or USD 0095kWh (considering 2012 medium rate exchange EURUSD of
07553) This value is high compared to OPEX estimations for PT with TES provided by
both this 2013 update and the AETA 2012 report (00293 and 00377 USDkWh
respectively) Therefore according to the information detailed above considerable learning
improvements to OampM costs have been already achieved from the commencement of
operation of Andasol 1 to the time of this Report
`WorleyParsonsrsquo estimations on the LCOE of parabolic trough plants is in the range of
USD 020kWh to USD 035kWh and that of solar towers between USD 017kWh and
USD 029kWh However in areas with excellent solar resources the range could be as low
as USD 014kWh to USD 018kWh
The following considerations have been taken into account for OampM cost learning rates
forecast
WorleyParsons LCOE estimations as set out above
Potential average envisaged LCOE reductions of 475 per cent by 2025 based on Figure
7 above
OPEX contribution on LCOE of 20 per cent and
53
assuming that all components involved in the LCOE (CAPEX OPEX and financial
expenses) reduce at the same rate so percentage contributions remain constant
According to these considerations WorleyParsons estimates that OPEX values by 2025 could
reach from 0021 to 0037 USDkWh for PT technology and from 0018 to 0031 USDkWh
for ST technology
Technological improvements have reduced the requirement of replacing mirrors and
receivers Automation has reduced the cost of other OampM procedures by as much 30 per
cent As a result of OampM procedure improvements (both cost and plant performance) the
total OampM costs of CSP plants in the long-term are likely to be below USD 0025kWh
(IRENA 2013b)
Parabolic trough system in the United States would have OampM costs of around USD 002 to
USD 003kWh meanwhile the OampM costs of parabolic trough and solar tower power plants
currently under construction in South Africa have estimated OampM costs of between USD
0029 and USD 0036kWh (also IRENA 2013b)
WorleyParsons estimations are in alignment with IRENA estimations in terms of current and
envisaged CSP OPEX costs
4635 CONCLUSIONS ndash CSP
The following main conclusions were made based on this study in relation to CSP
technologies
the 2013 WorleyParsons CSP OampM costs update resulted in values between 0023 and
0043 USDkWh based on 2012 USD
reductions in CSP OampM costs between 8 per cent and 27 per cent were obtained in
comparison to values provide in AETA 2012 report
the total OampM costs of CSP Plants in the long-term are likely to be below USD
0025kWh
the updated values for 2013 by WorleyParsons are in alignment with the values
provided by recognised international institutions and
at the time of this report the only CSP technology with substantial operation capacity
was PT Only three utility-scale ST plants were in operation at the time of this report
(PS-10 PS-20 and Gemasolar) of which only one (Gemasolar) uses TES Though
several process steam and small-scale LFR Plants are currently in operation only one
utility-scale LFR (Puerto Erradio 2) was in operation at the time of this report
47 AETA 2013 OampM Learning Rate recommendation
The learning rate used in AETA 2012 for OampM is applied to all technologies assessed and
includes fossil fuel technologies and emerging technologies The learning rate is set at an
improvement of 02 per cent per annum
In addition to the improvement rate OampM is escalated at a rate of 150 per cent of CPI per
year based on experience with increases in parts and labour costs
The CPI rate set in the model is 25 per cent per annum
54
OampM cost information in the public domain in both quantum and quality is poor for
contemporary data Information supporting OampM learning rates is equally poor There are
indications that emerging technologies do have the potential for increased OampM learning
rates relative to mature technologies
For the renewable energy technologies studied in this report onshore wind is considered
mature and it is recommended that the AETA 2012 report value of 02 per cent is maintained
For all other renewable energy technologies studied in this report a more aggressive learning
rate of 25 per cent is recommended This will effectively cancel out the CPI escalation
adjustment and provide a ldquoflat linerdquo OampM rate for future years This will provide a value in
line with the learning rate conclusions for PV
The learning rate for CSP is considered to have greater potential for reduction but due to the
high level of analysis in this report (and therefore uncertainty) it is proposed that a maximum
of two learning rates is appropriate for the AETA model
Table 17 AETA Learning Rate Comparison
AETA 2012 Learning Rate AETA 2013 update Learning Rate
Onshore Wind 02 per cent 02 per cent
Offshore Wind
PV ndash all technologies
CSP ndash all technologies
02 per cent 25 per cent
55
5 CHANGES TO THE LCOE
Changes to the model parameters described in the earlier sections have resulted in changes to
the LCOE estimates for a number of technologies The LCOE estimate values for all
technologies and associated range of uncertainty are shown in the Figures 8 to 13 below
Note that the values listed are for a base value carbon price modifier of zero per cent which
places no value on carbon emissions
For selected technologies where there are significant cost differences Figure 14 provides a
comparison of mid-range LCOE values for the AETA 2013 and AETA 2012 Models Key
features of the Figures 8 to 14 are as follows
both in AETA 2012 and 2013 Model update LCOE costs are provided for the years
2012 2020 2025 2030 2040 and 2050
cost ranges are provided for each technology that accounts for differences in fuel prices
and state-based variations
LCOE costs vary substantially across the technologies from $89MWh (combined cycle
gas turbine) to $351MWh (solar thermal linear fresnel) in 2012 and $73MWh (PV
non-tracking) to $247MWh (IGCC black coal CCS) in 2050
the inter-technology LCOE comparisons figures (Figures 8 to 13) reveal changes in
relative costs of technologies over time Key results include renewable technologies
have higher LCOEs than the lowest cost non-renewable technologies and the relative
LCOE rankings significantly change post 2030 The LCOE of solar PV become lower
than the non-renewables from mid 2030 onwards and
large changes in LCOE results between AETA 2013 Update and AETA 2012 are
depicted in Figures14 below Figure 14 compares LCOEs at 2050 between the AETA
2013 Update and AETA 2012 for a selected number of technologies that have changed
significantly for NSW (AETA developed LCOEs by each Australian state) Differences
in technology LCOEs are explained by a multiplicity of factors including the technical
developments OampM costs and learning rate changes
56
Figure 8 Updated LCOEs for AETA 2013 Model technologies values for 2012 (NSW) with carbon price set to zero
0
50
100
150
200
250
300
350
400
450
500
LCO
E ($
MW
h)
LCOE FOR 2012 TECHNOLOGIES (NSW) Note Default region is NSW except bown coal
technologies (VIC) and SWIS scale (as specified)
LCOE includes where relevant allowance for- Carbon Price- CO2 transport and sequestration cost- Plant capital cost (EPC basis) within battery limits- Owners costs excluding interest during construction- Fixed and variable operating costs- Fuel costs- Economic escalation factors
57
Figure 9 Updated LCOEs for AETA 2013 Model technologies values for 2020 (NSW) with carbon price set to zero
0
50
100
150
200
250
300
350
400
450
LCO
E ($
MW
h)
LCOE FOR 2020 TECHNOLOGIES (NSW) Note Default region is NSW except bown coal
technologies (VIC) and SWIS scale (as specified)
LCOE includes where relevant allowance for- Carbon Price- CO2 transport and sequestration cost- Plant capital cost (EPC basis) within battery limits- Owners costs excluding interest during construction- Fixed and variable operating costs- Fuel costs- Economic escalation factors
58
Figure 10 Updated LCOEs for AETA 2013 Model technologies values for 2025 (NSW) with carbon price set to zero
0
50
100
150
200
250
300
350
400
LCO
E ($
MW
h)
LCOE FOR 2025 TECHNOLOGIES (NSW) Note Default region is NSW except bown coal
technologies (VIC) and SWIS scale (as specified)
LCOE includes where relevant allowance for- Carbon Price- CO2 transport and sequestration cost- Plant capital cost (EPC basis) within battery limits- Owners costs excluding interest during construction- Fixed and variable operating costs- Fuel costs- Economic escalation factors
59
Figure 11 Updated LCOEs for AETA 2013 Model technologies values for 2030 (NSW) with carbon price set to zero
0
50
100
150
200
250
300
350
400
LCO
E ($
MW
h)
LCOE FOR 2030 TECHNOLOGIES (NSW) Note Default region is NSW except bown coal
technologies (VIC) and SWIS scale (as specified)
LCOE includes where relevant allowance for- Carbon Price- CO2 transport and sequestration cost- Plant capital cost (EPC basis) within battery limits- Owners costs excluding interest during construction- Fixed and variable operating costs- Fuel costs- Economic escalation factors
60
Figure 12 Updated LCOEs for AETA 2013 Model technologies values for 2040 (NSW) with carbon price set to zero
0
50
100
150
200
250
300
350
400
LCO
E ($
MW
h)
LCOE FOR 2040 TECHNOLOGIES (NSW) Note Default region is NSW except bown coal
technologies (VIC) and SWIS scale (as specified)
LCOE includes where relevant allowance for- Carbon Price- CO2 transport and sequestration cost- Plant capital cost (EPC basis) within battery limits- Owners costs excluding interest during construction- Fixed and variable operating costs- Fuel costs- Economic escalation factors
61
Figure 13 Updated LCOEs for AETA 2013 Model technologies values for 2050 (NSW) with carbon price set to zero
0
50
100
150
200
250
300
350
400
LCO
E ($
MW
h)
LCOE FOR 2050 TECHNOLOGIES (NSW)
LCOE includes where relevant allowance for- Carbon Price- CO2 transport and sequestration cost- Plant capital cost (EPC basis) within battery limits- Owners costs excluding interest during construction- Fixed and variable operating costs- Fuel costs- Economic escalation factors
Note Default region is NSW except bown coal
technologies (VIC) and SWIS scale (as specified)
62
Figure 14 Comparison of AETA 2013 Model and AETA 2012 Model LCOE estimates selected technologies 2050
0
50
100
150
200
250
AETA 2012
AETA 2013
63
51 Conclusions
The Australian Energy Technology Assessment (AETA 2012) provided the best available and most up-to-
date cost estimates for 40 electricity generation technologies under Australian conditions To ensure that
the cost estimates for the various technologies are consistent all common input costs (eg labour
materials components carbon price) were itemised To ensure that the AETA costings remain up to date
AETA costs are reviewed in this AETA 2013 Model Update report
The AETA 2013 refresh was developed in close consultation with a stakeholder reference group drawn
from industry and researchacademic organisations with interests and expertise in a diverse range of
electricity generation technologies
The AETA 2013 Model results reflect the change to exclude the value of a carbon price in the Levelised
Cost of Energy (LCOE) All technologies have experienced a minor reduction in LCOE relative to 2012
(offset in some cases by other factors) due to the change to an amortisation period of 30 years plus the
construction period
Comparing the 2012 AETA results without a carbon price to the 2013 results without a carbon price there
are significant reductions in the LCOE of solar technologies and onshore wind This is as a consequence of
changes to the fixed and variable Operations and Maintenance (OampM) costs for these technologies For the
solar technologies the adjustment of the capital learning rate to 25 per cent has also contributed to the
LCOE reduction Offshore wind also has an increased learning rate but this has been offset to a large extent
by increased variable OampM costs
Nuclear LCOE has increased significantly due to higher estimates for capital costs
Efficiency for coal fired plants with CCS retrofits has been revised downwards to better reflect the expected
efficiency of these plants and has the effect of increasing the LCOE
64
REFERENCES
Albers A 2009 OampM Cost Modeling Technical Losses and Associated Uncertainties Proceedings of the
2009 European Wind Energy Conference Marseilles France March
AWEA (American Wind Energy Association) 2013 AWEA US Wind Industry Annual Report ndash Year
Ending 2012 USA
BNEF (Bloomberg New Energy Finance) 2013 Operations and Maintenance (OampM) Price Index Issue II
Wind Research Note April
BREE (Bureau of Resources and Energy Economics) 2012 AETA Report and Model Version 1_0 2012
Australian httpwwwbreegovau
CEC (Clean Energy Council) 2013 Australian Energy Technology Assessment 2013 Review Letter to
BREE of 20 May 2013 from the Clean Energy Council (Mr Russel Marsh signatory for the CEC)
CEC (Clean Energy Council) 2013 Clean Energy Council Renewable Energy Map Australia June (data
noted as current as of 21 August 2012)
httpwwwcleanenergycouncilorgauresourcecentreplantregistermaphtml
Crown Estate 2012 Offshore Wind Cost Reduction Pathways Study United Kingdom May
CSP 2012a CSP Parabolic Trough Report Cost Performance and Key Trends CSP Today
CSP 2012b CSP Solar Tower Report Cost Performance and Key Trends CSP Today
Deloitte amp Touche 2012 European Wind Services Study Find Out Which Way the Wind Blows Deloitte amp
Touche GmbH Wirtschaftspruumlfungsgesellschaft August
Deloitte 2011 Economics of wind development in New Zealand Deloitte for the for the New Zealand Wind
Energy Association
Ebert P amp Ware J 2013 The Role of Independents in the Wind Farm Operations amp Maintenance
Proceedings of the 2013 New Zealand Wind Energy Conference and Exhibition March
EPRI (Electric Power Research Institute) 2010 Engineering and Economic Evaluation of Central-Station
Solar Photovoltaic Power Plants USA March
GlobalData 2012 Wind Operations amp Maintenance (OampM) Market ndash Global Market Size Share by
Component Competitive Landscape and Key Country Analysis to 2020 GlobalData reference code
GDAE1054MAR January
Hand M 2013 Wind Plant Cost of Energy Proceedings of the 2nd NREL Wind Energy System
Engineering Workshop January
Hassan G 2011 Review of the Australian Wind Energy Industry Clean Energy Council Australia 2011
Houston C 2013 The Real Truth About Wind Farm OampM Costs North American WindPower March
IEA (International Energy Agency) 2008 Technology Roadmap Solar photovoltaic energy France
httpwwwieaorgpublicationsfreepublicationspublicationpv_roadmappdf
IRENA (International Renewable Energy Agency) 2013a Solar Photovoltaics Technology Brief Germany
January httpwwwirenaorgDocumentDownloadsPublicationsIRENA-ETSAPper
cent20Techper cent 20Briefper cent20E11per cent20Solarper cent20PVpdf
65
IRENA (International Renewable Energy Agency) 2013b Concentrating Solar Power Technology Brief
Germany January
IRENA (International Renewable Energy Agency) 2013c Renewable Power Generation Costs in 2012 An
Overview Germany
IT Power 2013 Analysis of the AETA 2012 cost estimates of CSP technologies Clean Energy Council
submission to the Bureau of Resources and Energy Economics May
Kann S 2012 US Solar Market Insight Report Q3 California USA
Kearny A 2010 Solar Thermal Electricity 2025 ndash clean electricity on demand attractive STE costs
stabilize energy production ATKearny consultants Dusseldorf Germany
Muirhead J 2013 SEGS experience suggests that CSP will age gracefully CSP Today South Africa
httpsocialcsptodaycommarketssegs-experience-suggests-csp-will-age-
gracefullysthash6VkxFaD0dpuf
NREL (National Renewable Energy Laboratories) 2011 IEA Wind Task 26 ndash Multi-national Case Study of
the Financial Cost of Wind Energy Technical Report NRELTP-6A2-48-48155 March
NREL (National Renewable Energy Laboratories) 2012 Cost and Performance Data for Power Generation
Technologies USA February
NREL (National Renewable Energy Laboratories) 2013 Breakeven Prices for Photovoltaics on
Supermarkets in the United States March httpwwwnrelgovdocsfy13osti57276pdf
NREL (National Renewable Energy Laboratories) 2013 Breakeven Prices for Photovoltaics on
Supermarkets in the United States USA March httpwwwnrelgovdocsfy13osti57276pdf
Photon 2012 The True Cost of Solar Power 2012 Temple of Doom Solar Power in Focus Series Photon
Consulting
Photon 2013 Solar Annual 2013 Build Your Empire Photon Consulting
Podewils C 2008 Photovoltaic vs Solar Thermal where PV has the upper hand and where solar thermal
strikes back Photon International Germany November
Poore R and Walford C 2008 Development of an Operations and Maintenance Cost Model to Identify
Cost of Energy Savings for Low Wind Speed Turbines Report NRELSR-500-40581 National
Renewable Energy Laboratory January
RolandBerger 2013 Offshore Wind Towards 2020 On the Pathway to Cost Competitiveness RolandBerger
Consultants Germany April
See wwwcsptodaycom
See wwwepiaorg
See wwwestelasolarde
See wwwidaees
See wwwieaorg
See wwwirenaorg
See wwwnrelgov
See wwwprotermosolares
66
See wwwrenoveteces
See wwwseiaorgau
See wwwsolarelectricpowerorg
See wwwworldbankorg
UK Crown Estate 2012 Offshore Wind Cost reduction Study May
US DoE (Department of Energy) 2013 Award Number DE-EE0005360 USA February
Wiser R Lantz E Bolinger M amp Hand M 2012 Recent Developments in the Levelized Cost of Energy
from US Wind Power Projects Contract No DE-AC02-05CH11231 National Renewable Energy
Laboratories February
67
Appendix A
Electricity Generation Technologies in AETA 2012 Report and Model
The 40 AETA electricity generation technologies are
1 Integrated Gasification and Combined Cycle (IGCC) plant based on brown coal
2 IGCC plant with Carbon Capture and Sequestration (CCS) based on brown coal
3 IGCC plant based on bituminous coal
4 IGCC plant with CCS based on bituminous coal
5 Direct injection coal engine (clean lignite eg brown coal technology)
6 Pulverised coal supercritical plant based on brown coal
7 Pulverised coal supercritical plant with post combustion CCS based on brown coal
8 Pulverised coal subcritical plant with post combustion CCS based on brown coal (retrofit)
9 Pulverised coal supercritical plant based on bituminous coal
10 Pulverised coal supercritical plant based on bituminous coal - SWIS relevant scale
11 Pulverised coal supercritical plant with CCS based on bituminous coal
12 Pulverised coal subcritical plant with post combustion CCS based on bituminous coal (retrofit)
13 Adding CCS to existing Combined Cycle Gas Turbine (CCGT) power plants (retrofitting)
14 Oxy combustion pulverised coal supercritical plant based on bituminous coal
15 Oxy combustion pulverised coal supercritical plant with CCS based on bituminous coal
16 Combined cycle plant burning natural gas
17 Combined cycle plant burning natural gas - SWIS relevant scale
18 Combined cycle plant with post combustion CCS
19 Open cycle plant burning natural gas
20 Solar thermal plant using compact linear fresnal reflector technology wo storage
21 Solar thermal plant using parabolic trough technology wo storage
22 Solar thermal plant using parabolic trough technology with storage
23 Solar thermal plant using compact linear fresnal reflector technology with storage
24 Solar thermal plant using central receiver technology wo storage
25 Solar thermal plant using central receiver technology with storage
26 Solar photovoltaic (PV) - non-tracking
27 Solar photovoltaic (PV) - single axis tracking
28 Solar photovoltaic (PV) - dual axis tracking
29 Wind (on-shore)
30 Wind (off-shore)
31 WaveOcean
68
32 Geothermal - hot sedimentary aquifer (HSA)
33 Geothermal - enhances geothermal system (EGS)
34 Landfill gas power plant
35 Sugar cane waste power plant
36 Other biomass waste power plant (eg wood)
37 Nuclear Gen 3+
38 Nuclear Small Modular Reactors (SMR)
39 Solarcoal hybrid
40 Integrated solar combined cycle (ISCS) ndash parabolic trough with combined cycle gas
69
Appendix B
Consultations with Stakeholders
This study has been undertaken in close consultation with a Stakeholder Reference Group drawn from
Australian industry and domestic as well as overseas researchacademic organisations with interests and
expertise in a diverse range of electricity generation technologies These stakeholders were invited to
provide evidence of the latest estimates for the costs and performance of various technologies
In addition the AETA project also had a Project Steering Committee comprising staff from BREE
AEMO CSIRO and other independent experts to provide technical advice and support The following
agencies participated in the stakeholder reference group meetings or were forwarded the documents
presented at the meetings
AETA Stakeholder Reference Group
Australian Coal Association
Australian Energy Market Operator
Australian Geothermal Energy Association
Australian National Low Emissions Coal RampD
Australian National University
Australian Renewable Energy Agency
Australian Solar Thermal Energy Association
Australian Sugar Milling Council
Australian Treasury
Bureau of Resources and Energy Economics
Clean Energy Council
CSIRO
Department of Industry
Economic Research Institute for ASEAN and East Asia
Energy Retailers Association of Australia
Energy Users Association of Australia
Evans and Peck
Ferrostaal
Global CCS Institute
Grid Australia
Intergen
International Energy Agency France
International Power Suez
IRENA Innovation and Technology Centre Germany
70
National Generators Forum
Oceanlinx Limited
Origin Energy
Private Generators Group
The Institute of Energy Economics Japan
The Energy Research Institute New Delhi
University of Melbourne Energy Institute
University of Queensland Energy Initiative
UQ Energy Economics amp Management Group
Wyldgroup
WorleyParsons
Two AETA Stakeholders Reference Group meetings took place on 30 April 2013 and 17 July 2013 In
addition the AETA Project Steering Committee met on 24 June 2013
71
BREE contacts Executive Director BREE Bruce Wilson brucewilsonretgovau
(02) 6243 7901
Deputy Executive Director Wayne Calder waynecalderbreegovau
(02) 6243 7718
Modelling amp Policy Integration Arif Syed arifsyedbreegovau
Program Leader (02) 6243 7504
Data Statistics Geoff Armitage geoffarmitagebreegovau
Program Leader (02) 6243 7510
Energy and Quantitative Analysis Allison Ball allisonballbreegovau
Program Leader (02) 6243 7539
Resources ndash Program Leader John Barber johnbarberbreegovau
(02) 6243 7988
72
11
a reduction in offshore wind fixed OampM costs and a three-fold increase in offshore
wind variable OampM costs resulting in an overall increase of 50 per cent total OampM
costs
fixed tilt PV configurations have not seen significant changes in OampM costs
single axis tracking and dual axis tracking PV configurations are approximately 20-30
per cent reduced based on a better understanding of the associated OampM costs
concentrating solar power (solar thermal) OampM cost reduced between 8 per cent and 27
per cent and
the OampM learning rate for offshore wind and all solar technologies are increased from
02 to 25 per cent
The overall impact of parameter changes by technology is given in the AETA 2013 Model
and in this report As in the AETA 2012 the 2013 Model update provides technology
LCOEs for the years 2012 2020 2025 2030 2040 and 2050
12
1 INTRODUCTION
The Australian Energy Technology Assessment (AETA) 2012 report published in July 2012
by the Bureau of Resources and Energy Economics (BREE 2012) undertook costing of 40
electricity generation technologies This report made a provision that due to the fast changing
technology cost environment cost and performance parameters assessed in the AETA 2012
model may be updated every year In addition a full report and lsquobottom uprsquo study will be
undertaken biennially with the next report to be released in 2014
The next fully updated AETA report is scheduled for completion in 2014 To ensure that cost
estimates for electricity generation technologies are current and take into consideration the latest
developments parameter estimates for the 40 technologies will be updated where appropriate
every six months in a manner consistent with the methods outlined in this report and in consultation
with the stakeholder reference group (BREE 2012 p 24)
The purpose of this AETA 2013 Model Update report is to present findings arising from a
review of specific technologies by BREE This review was assisted by comments made by
the AETA Project Steering Committee (PSC) members and AETA Stakeholders Reference
Group (SRG) WorleyParsons was commissioned to review cost parameters for the
technologies considered in the AETA 2012 model Given the fast changing nature of solar
and wind technology operating costs especial emphasis was placed on reviewing OampM costs
for wind and solar technologies Changes to the model for the 2013 update are discussed in
the following sections
11 Background to the AETA 2012 report
BREE engaged WorleyParsons in 2011-12 to develop cost estimates for 40 electricity
generation technologies under Australian conditions for AETA 2012 The AETA cost
estimates were developed with the active collaboration of the Australian Energy Market
Operator (AEMO) which utilised the AETA cost estimates for its National Transmission
Network Development Plan (NTNDP) In addition the Commonwealth Scientific and
Industrial Research Organisation (CSIRO) provided technical advice as part of the AETA
project steering committee The AETA 2012 provided technology costs for the years 2012
2020 2025 2030 2040 and 2050 These technologies encompass a diverse range of
energy sources including renewable energy (such as wind solar geothermal biomass and
wave power) fossil fuels (such as coal and gas) and nuclear power (Appendix A) Since its
publication in July 2012 more than 1000 requests have been made from BREE for the
AETA 2012 cost estimates (model) by domestic and international sources
12 Methods and Assumptions of the AETA 2012 Report and Model
121 Macro assumptions
Key macroeconomic assumptions are consistent with those detailed by the Australian
Energy Market Operator in its National Transmission Network Development Plan and by
the Australian Treasury (see BREE 2012 for a full set of assumptions)
13
122 Technical assumptions
all technologies were costed on a consistent and transparent basis with itemisation of
component costs
capital costs included direct (eg engineering procurement and construction) and
indirect (eg owners) costs but exclude transmission and decommissioning costs
future cost estimates included assumptions about the exchange rate productivity
variation commodity variation and technology improvements
fuel cost estimates were based on ACIL Tasman projections and
projected growth rates for future operating and maintenance costs were provided
123 Levelised cost of energy (LCOE)
LCOE can be interpreted as the long-run marginal cost of electricity generation Key
factors used to calculate LCOE by technology include amortisation period discount rate
capacity factor CO2 emissions factor CO2 capture rate emissions price CO2 storage cost
fuel cost variable and fixed OampM cost and the capital cost
LCOE is a key comparative cost indicator across technologies that is expressed in real
Australian dollars per Megawatt hour of electricity generation ($MWh) The LCOE is the
price at which electricity must be generated from a specific plant to break even taking into
account the costs incurred over the life of the plant (capital cost cost of capitalfinancing
operations and maintenance costs cost of fuel emissions price if applicable and CO2
sequestration) While LCOE is an invaluable tool for comparing technology costs power
generation companies andor investors who wish to choose a technology to deploy would
also need to consider other criteria such as site-specific costs technology performance
characteristics and experience with the technology prior to any final investment decision
AETA cost estimates are developed to provide design basis and plant characteristics
performance parameters capital cost estimates fuel cost estimates OampM cost estimates
and LCOE estimates
Regional impacts on capital and operating costs have been incorporated in the analysis
These regions include Victoria New South Wales (including ACT) South Queensland
(incorporating the South East Queensland and Central Queensland AEMO regions) North
Queensland (incorporating the North Queensland AEMO region) Northern Territory
North WA (Pilbara region) South WA (the South West Interconnected System region)
South Australia and Tasmania
13 Methodology of the AETA 2013 Model Update
As part of the AETA 2013 Model Update BREE invited submissions from the AETA
Steering Committee and the Stakeholder Reference Group to provide commentary and
recommendations on the AETA 2012 Report and Model Eight written submissions were
received in this regard Changes were only recommended where specific substantiated
changes were received The AETA 2013 model has been updated in accordance with the
above consultations and under the same macro economic and technical assumptions as in
AETA 2012 The AETA 2013 model is freely available on request from BREE
(infobreegovau)
Within this context this report provides updated costs based on
14
relevant Australian and international reports on generation technologies that have been
published since AETA 2012 or have been newly discovered
new public domain information
new information from private sources that could be obtained
in-house experience of WorleyParsons and
input on OampM costs and learning rates from a number of industry stakeholders
This AETA 2013 Model Update report provides supporting explanations and references and
justifies amendments to the cost parameters of technologies especially the OampM costs for
wind and solar technologies that were covered in AETA 2012 model
131 Caveats on the use of LCOE
LCOE provides a generalised cost estimate and does not account for site specific factors
that would be encountered when constructing an actual power plant As a result the costs
associated with integrating a particular technology in a specific location to a specific
electricity network are not considered
Projected LCOE does not necessarily provide a reliable indicator of the relative market
value of generation technologies because of differences in the role of technologies in a
wholesale electricity market For example projected LCOE does not provide a direct
indicator of electricity demand or generation in isolation with other emissions abatement
policies Similarly many technologies involve integration costs in addition to the LCOE to
be able to reliably supply to the system The value of variable (or intermittent) power plants
(such as wind and solar) will depend upon the extent to which such plants generate
electricity during peak periods and the impact these plants have on the reliability of the
electricity system Unlike dispatchable power plants (such as coal natural gas biomass
and hydroelectric) ndash which are reliant on some form of stored energy (eg fuels water
storage or battery storage) ndash wind and photovoltaic power plants do not typically include
energy storage Dispatchable plants such as coal or gas fired plants may involve negative
externalities (environment fuel disposal or insurance costs etc) which are not always
reflected in their LCOEs
The AETA LCOEs are restricted to only utility-scale or large scale technologies
Consequently small-scale technologies (eg small roof-top photovoltaics fuel cells co-
generation and trigeneration) that may be relevant to distributed generation were not
included in the AETA 2012 analysis LCOE cost estimates associated with distributed
photovoltaics are likely to differ substantially from utility-scale photovoltaic systems as a
result of differences in component costs (eg capital costs operating and maintenance
costs) and performance characteristics (eg capacity factor)
132 Organisation of the report
This report is organised in five sections After a brief introduction and purpose of the report
in this section section 2 discusses the changes made to the AETA 2013 Model parameters as
a result of the discussions with Stakeholders and Steering Committee members on the
individual issues and technologies Section 3 presents the issues that were considered but did
not result in the AETA Model parameter changes Section 4 presents in detail the OampM cost
15
changes for wind and solar technologies covered in AETA 2012 Updated LCOE graphs as
well as a comparison of the resultant AETA 2013 Model and AETA 2012 Model LCOEs are
presented in section 5 which also presents concluding comments
16
2 AETA MODEL PARAMETER CHANGES
21 Stakeholder Initiated Changes
Consultations for the AETA 2013 Model update identified the following issues for
consideration
nuclear technology capital costs and lsquofirst year available for constructionrsquo
CCS retrofit thermal efficiency
amortisation period for all technologies and
OampM costs
The OampM issue is discussed in section 4 whereas rest of the issues are discussed below
211 Nuclear Capital Costs
The AETA 2012 report and model presents costs for first of a kind (FOAK) and Nth of a kind
(NOAK) nuclear technologies There could have been some confusion from the original
wording of Section 310 of AETA 2012 report It starts by discussing Gen III plants currently
sold (presumably NOAK) however further in the document Gen III plants are referred to as
FOAK The AETA 2012 report states that the capital costs are based on nuclear power plants
in the US The NOAK value is what is represented in Table 3101 in the AETA 2012 report
and model
Although there are cost adjusting factors used for other technologies studied in the AETA
2012 report there is no adjustment of the US cost base for Australian labour costs and for
adjustment of Australian equipment costs Submissions indicated that an adjustment to costs
should also be used for nuclear to ensure there is commonality in the comparison
This suggestion was considered appropriate and adjustment to the costs for nuclear
technologies was made Based on the factors to convert US rates to Australian rates used in
the fossil fuel technologies ie the factors from the Thermoflow software the new nuclear
capital costs were calculated The multiplier from Thermoflow for labour costs is 205 and
the factor for equipment costs is 13 both US to Australia
Additionally it was submitted that the first year available for construction of nuclear
technologies be extended In support of this the submission argued that nuclear technologies
are examples of generation technology where legislation regulation and public policy
planning is highly region-dependent and must therefore precede deployment by several years
This was considered an appropriate submission and therefore the first year available for
construction in the model has been changed from 2012 to 2020 These changes are shown in
Table 1
17
Table 1 Model Changes Nuclear Technologies
AETA 2012 report reference AETA 2012 model value AETA 2013 update
Technology 37 Nuclear (GW Scale LWR)
Change first year available for Construction
2012
2020
Technology 37 Nuclear (GW Scale LWR)
Convert FOAK Capital Cost to Australian productivity
and commodity costs
4210
6392
Technology 37 Nuclear (GW Scale LWR)
Convert NOAK Capital Cost to Australian productivity
and commodity costs
3470
5268
Technology 38 Nuclear (SMR)
Convert FOAK Capital Cost to Australian productivity
and commodity costs
7908
11778
Technology 38 Nuclear (SMR)
Convert NOAK Capital Cost to Australian productivity
and commodity costs
4778
7116
The overall impact of these parameters on individual technology LCOE changes is given in
the AETA 2013 Model and in Section 5
212 Carbon Capture and Storage (CCS) Retrofit Thermal Efficiency
Subcritical coal technologies with CCS retrofit were reported to have only slightly lower
thermal efficiency values compared with new build supercritical technologies with CCS in
the AETA 2012 Model This was an oversight in the AETA 2012 Model
The AETA 2012 report identified the thermal efficiency to retrofit subcritical brown and
black coal plants as 216 per cent and 301 per cent respectively (Table 312) In the same
table the efficiency for new build supercritical brown and black coal plants is reported to be
208 per cent and 314 per cent respectively
The thermal efficiencies were revised down based on actual operating efficiencies of existing
coal facilities in Victoria and NSW and factored based on the thermal efficiency ratio of new
coal facilities with and without CCS
A reduction in thermal efficiency is to be expected when applying a retrofit CCS to the plant
The CCS factor in the following representation refers the efficiency reduction factors for
adding CCS to a coal fired power station The useful output will reduce from the new
parasitic loads to run the CCS equipment
Thermal efficiency of existing brown coal plant in Victoria is 265 per cent and the CCS
factor is 064 Similarly the thermal efficiency of existing bituminous coal plant in NSW is
355 per cent and the CCS factor is 075
Table 311 and 312 of the AETA 2012 report show a reduction is present when comparing
the supercritical with no CCS compared to supercritical with CCS However the retrofit case
was only provided for the subcritical technology only and no case was included in the AETA
2012 for a subcritical plant with any CCS
A review of the values in Table 312 through comparison to the existing efficiency of
installed black and brown coal fleet in Australia was undertaken For brown coal the current
18
sent out thermal efficiency is 265 per cent for a 500 MW subcritical unit For supercritical
brown coal without CCS the sent out efficiency is 323 per cent Applying the same reduction
factor the thermal efficiency with CCS retrofitted should be 17 per cent in lieu of 216 per
cent as published in AETA 2012 report
For black coal the current sent out thermal efficiency is 355 per cent for a 660 MW
subcritical unit For supercritical black coal without CCS the sent out efficiency is 419 per
cent Applying the same reduction factor the thermal efficiency with CCS retrofitted should
be 266 per cent in lieu of 301 per cent as published AETA 2012 report (Table 2)
Table 2 Model Changes CCS Retrofit Thermal Technologies
AETA 2012 report reference AETA 2012 model value AETA 2013 update
Technology 8 Pulverised coal subcritical plant
with post combustion CCS based on brown coal
(retrofit)
Thermal Efficiency
216
170
Technology 12 Pulverised coal subcritical plant
with post combustion CCS based on bituminous
coal (retrofit)
Thermal Efficiency
301
266
19
213 Amortisation period
There was stakeholder consensus that the operating period for all technologies needs to be set
to thirty years and that the construction time is in addition to the operating time The financial
amortisation period is common for all technologies and is set at 30 years In the AETA 2012
model section 24 (a) nominates that the amortisation period of 30 years is from the
commencement of construction The amortisation period has now been changed (Table 3)
Examples of the change are
Nuclear LWR ndash GW scale In AETA 2012 report amortisation period was 30 years inclusive
of construction and operation The amortisation period has now changed to 36 years (30
operating and 6 years construction)
Solar parabolic trough In AETA 2012 report amortisation period was 30 years inclusive of
construction and operation The amortisation period has now changed to 33 years (30
operating and 3 years construction)
Table 3 Model Changes amortisation period
AETA 2012 report reference AETA 2012 model value AETA 2013 update
Common Amortisation period
for construction and operation
Amortisation period for
operation includes
construction for all
technologies
Amortisation period for
operation to exclude
construction for all
technologies
22 No Carbon Pricing
For the 2013 AETA update the carbon price modifier has been set to zero per cent as the
base value for the results presented in this report with the effect of applying a zero carbon
price to all technologies throughout the study period to 2050 The AETA 2013 Model
however has the option of changing this parameter by the user
20
3 CONSIDERATION OF OTHER ISSUES
This section summarises the issues that were discussed during the AETA 2013 Model Update
with AETA stakeholders but have not led to a change in the model However these issues do
not cover the OampM costs considerations that are detailed in section 4
31 Representation of Uncertainty
The recognition of uncertainty within the model was discussed including both the level of
representation and potential uncertainties with respect to First-of-a-Kind and lsquoEarly Moverrsquo
Technologies
A number of factors were identified that lead to uncertainty in estimates ndash particularly for
emerging technologies For conventional coal and gas technologies even though the
technology is mature the addition of carbon capture introduces cost and performance
uncertainty Cost estimates have inherent uncertainty due to the market uncertainties and
unforeseeable technological developments and due to
- Volatility in equipment pricing
- Volatility in economic conditions (during post Global Financial Crisis) and
- Volatility in labour pricing due to ldquootherrdquo heavy construction projects in specific areas
For technologies where the costs are well understood it was considered that the error bars
should be reduced compared to immediate and emerging technologies and that the error bars
should be lower for technology costs in 2012 compared to later years
There is strong agreement from two key stakeholder submissions with all the factors causing
uncertainty that have been identified in AETA 2012 In particular the labour cost has varied
(increased) significantly due to large construction projects which have increased costs due to
a shortage of labour and a lower productivity due to less experienced personnel The
uncertainties provided in the AETA model are available on a per technology and a per
selected years basis BREE will consider whether or not to include more detail on
uncertainty by technology in the 2014 review of the model
32 Application of Learning Curves
It was raised during the consultation process that the AETA model revision could allow for
learning curve cost reduction assumptions to be altered by the end user This has not been
incorporated in the 2013 update as it is a structural change to the AETA Model
Stakeholders also raised the question as to whether it is possible within the application of
learning curves to distinguish between the potential for cost reductions on manufactured
components like PV panels versus the Balance of Project (BoP) costs which may involve
routine assembly and erection activities which are not subject to significant learning by
doing
However there are opportunities for cost reductions particularly where many repetitive tasks
are involved such as solar field construction modular construction techniques
rationalization of components in the BoP design or reduction in assembly or placement time
21
This is supported in the US Solar Market Insight Report 2012 (Kann 2012) which identified
continued savings in inverter and racking costs as follows
ldquohellip falling equipment costs and fine-tuning of installation practices have made large-
scale solar less expensive QQrdquo
ldquohellip with the continuing maturation of the industry we expect continued focus on
reducing PV balance-of-systems costs (BOS) and that the increased worry over high
penetration PV will drive adoption of 1000Vdc and advanced inverters
respectivelyrdquo and
ldquoMounting structure manufacturers noted that the past year has seen tremendous
pricing pressure accounting for price declines of anywhere between 10 per cent and
30 per cent over the past yearrdquo
Given that the balance of plant costs can also be subject to cost reductions it is not
considered necessary to distinguish learning curves for discrete project costs in the model
33 General Costs Considerations
331 Fuel Costs
The outlook for fuel costs for gas coal and carbon was claimed to have materially shifted
since the AETA 2012 model While there was no evidence provided to support this
consideration will be given to this issue in the 2014 model update
332 CCS Costs
A submission cited the ZeroGen Case Study and sought to clarify the differences in CCS
cost between ZeroGen and lower values estimated for AETA 2012 This is a valid
comparison however BREE notes the following issues which contribute to explaining the
differences The international cost component is as follows AETA 52 per cent ZeroGen 34
per cent With the USD exchange rate AETA 1 ZeroGen at 08 adjusting the AETA value
for exchange rate variation would add A$952kWnet to the AETA value There is a
difference in plant size with AETA at 557 MW net and Zerogen 400 MW net A bigger plant
size would typically provide a lower cost kW installed
Additionally section 112 of Chapter One of the ZeroGen report advises escalation based on
project delivery from 2011 to 2017 AETA costs are for 2012 basis and do not include
escalation beyond this time A portion of the Zerogen costs will be inflated over the
comparable AETA cost Also section 113 of Chapter One of the ZeroGen report identifies
significant enabling works This is likely to be more inclusive than considered in the AETA
2012 report as identified in section 23 (a)
Overall it is considered likely that a number of estimate basis items in the ZeroGen study are
different and once equalised will show a smaller difference between the AETA and
ZeroGen values Therefore there is no immediate action but the basis and assumptions of the
model may be reviewed during 2014 AETA update
With regard to CCS efficiency one submission proposed that the AETA estimates were
overly optimistic However no references were cited to support this view and no change has
been made to the model
22
333 Opportunity Costs
A submission was made that footnotes be included regarding retrofit costs to indicate that
make-up power costs are not included This was not adopted because AETA parameters for
each technology are calculated for that technology alone and do not consider the impact of
reduced output of a retrofit project where additional output needs to be generated from
alternate higher cost generation Opportunity costs are specifically related to business cases
for specific projects and are not considered for any cases presented in the AETA report
Moreover retrofitting does not make electricity generation uncertain or intermittent It only
lowers the flow of generation at a constant rate (due to lower thermal efficiency) relative to
the non-retrofit case
34 Capital and Construction Costs
A submission was made to update the AETA values for the mid-point capital cost for several
technologies based on a study provided in support of the submission The technologies
asserted were
IGCC (Integrated Gasification and Combined Cycle) with 90 per cent capture fuelled
with Victorian brown coal
IGCC with no capture fuelled with black coal
IGCC with 90 per cent capture fuelled with black coal
Pulverised Fuel power plant with 90 per cent capture fuelled with Victorian brown
coal
Pulverised Fuel power plant with 90 per cent capture fuelled with black coal and
OCGT with no capture fuelled with natural gas
There is a key difference in the magnitude of the labour component in Australia compared
with the labour costs associated with the supporting material (from the USA) While no
changes have been made to the model in this update the ldquoshort termrdquo impact of labour
pricing on technology costs may be considered in further updates
Similarly it was submitted that the capital cost values for combined Cycle Gas Turbine
(CCGT) (with and without capture) could be revised As no documentary evidence was
provided to support this no change was made
For Direct Injection Coal Emulsion (DICE) power plant with no capture fuelled with
Victorian brown coal it is also suggested that the values be reviewed with a number of
papers provided for reference However these papers do not address capital cost in any depth
and it is unclear if the balance of project costs included are comparable with AETA DICE
technology is not mature and is probably best described as in the demonstration to
deployment phase of development which brings uncertainty into the cost analysis Therefore
data is needed to substantiate this submission As this was not available at the time of
preparing this report consideration of this issue is deferred to a later time when the necessary
data is available
An increase in the capital costs for Solar thermal trough (6 hrs storage) and Solar thermal
central receiver (6 hours storage) were proposed based on a supporting study by the Electric
Power Research institute (EPRI) The proposed values are substantially larger than the AETA
23
2012 but it is not clear what basis is used to generate these revised values A separate
submission received from another AETA stakeholder has supported the AETA values
Additionally the cited reference for solar thermal trough the Energy Power Research
Institute (EPRI) plant configuration is based on air cooling ndash while for AETA the plant
configuration assumes water cooling The difference in plant configuration will account for a
small part of the difference The AETA value is based on a reference report as issued in 2012
by the US National Renewable Energy Laboratory (NREL 2012)
The AETA value for the central receiver technology is based on a small (20MW) plant
(Gemasolar) with factors for adjustment to field size for thermal storage capacity and post
FOAK learning These factors will align with increased uncertainty in the AETA value It is
likely that additional cost information may now be available for the Brightsource Ivanpah
plant (no storage) and other tower plants being considered under construction
Further investigation of these issues has been sought with stakeholders but is as yet
unavailable
Another suggestion was made to consider capital costs on a component basis The capital
costs used in AETA 2012 for existing technologies were based on actual costs that could be
sourced on published documents (locally andor internationally) or from WorleyParsons
internal data For developing technologies costs were not considered on a component level
For this reason in technologies that are not commercialised a number of assumptions would
need to be made which may limit lsquorealrsquo costs being available No change to the model arose
from this submission
A reassessment of the construction expenditure profile for concentrating solar power (CSP)
technology options was sought in another stakeholder submission and supported by a
referenced report (IT Power 2012) However the plant sizes considered in the AETA report
are larger capacity (100 MW+) than those discussed in the cited report and consequently
have a longer duration construction period As three years is considered to be an appropriate
time period to spread the construction expenditure profile no change to the model was made
35 Costs Associated with Solar Technologies
A change to the model was sought with regard to the significant downward trends in the cost
of solar PV The stakeholder submission cited pricing data from the Australian Photovoltaic
Institute (APVI) Consultation with the APVI identified that evidence based information for
utility scale PV costs in Australia is limited because Australia has no PV systems 100 MW or
larger It is acknowledged however that there is significant and continued volatility in the
solar PV market including volatility due to competition oversupply in the PV module
market as well as continued price reductions for balance of system and installation costs
A$338 Wnet was a reasonable valuation for 2012 AETA The AETA 2012 value will be
maintained but may be reviewed in the 2014 model update
It was also suggested that solar thermal costs could be better represented in the model by
allowing for different periods of storage rather than a standard 6 hours The AETA 2012
scope was based on fixed plant designs which included fixed thermal storage sizing where
thermal storage was included With thermal storage there are a number of variables that can
be considered including differing field sizes (solar multiple) as well as actual thermal storage
capacities This is likely to add significant complexity to the report and to the model the
benefit of which at this stage does not warrant the changes
24
36 Costs Associated with Nuclear Technologies
It was submitted that consideration be given to including the impact on LCOE for nuclear
technology of the relatively high insurance costs for nuclear technologies This issue will be
considered in the 2014 review of the AETA model However insurance costs or plant
decommissioning costs are not considered for any of the 40 AETA technologies
Also the OampM improvement rate for Nuclear was not reconsidered as there is no OampM
improvement rate for Nuclear in the model
37 Further Technologies
A proposal was received which recommended that further technologies (DICE power plant
based on black coal with and without capture and DICE brown coal with capture and
medium speed DICE technologies) be incorporated into the AETA Model However as
mentioned earlier this update of the AETA 2012 Model only considered the technologies
included in that model This update of the model is not intended to broaden the technologies
38 Auxiliary Loads
Another example used for the purposes of drawing comparisons with the AETA model was
the SaskPower Post Combustion Retrofit It is difficult to distil the SaskPower project data
into a direct comparison with the AETA study and consequently there is insufficient data
certainty to warrant changes to the AETA 2012 values The SaskPower Post Combustion
Retrofit was also cited as to its conservative auxiliary loads for brown and black coal
However upon further investigation this was not substantiated within the SaskPower
example
25
4 WIND PV AND CSP OPERATIONS AND MAINTENANCE (OampM) COST UPDATE
41 Operation and Maintenance Costs
OPERATING AND MAINTENANCE COST DEFINITIONS
In considering the costing of OampM there is no absolutely clear definition of which costs
should be considered as fixed and which variable with the breakdown varying based on a
range of issues including technology location and resource type For this reason in the future
AETA reports OampM costs may be compared in terms of annual total operating expenditure
(OPEX) per MW of generation This method is widely used by most international institutions
to analyse OampM costs and to avoid subjective considerations
For this report fixed and variable costs are reported to provide direct comparison with AETA
2012 In this regard in general fixed costs are independent of the electrical generation of the
plant and are expressed as annual cost per MW capacity Fixed costs include items such as
fixed labour
equipment and
vehicles
Variable costs are proportional to the electrical generation of the Plant and are expressed as
cost rate per kWh energy output Variable costs include items such as
variable labour
consumables and
spare parts
As both public and private domain material vary in the way they approach and report on
fixed and variable maintenance within the following text where an interpretation has been
used for comparison purposes this is described
A submission was made to remove the operations and maintenance (OampM) cost escalation
factors This was not taken up as there is an increase in the OampM costs over CPI which is
borne out historically A review of the basis for this escalation determined that the
underlying assumptions were appropriate The review also considered adopting a generic
learning curve approach for OampM improvement rates as was suggested in one submission
This was not adopted as the model has an OampM improvement rate (set at 02 per cent per
annum) which can be varied by the user for wind and solar technologies This value accounts
for more efficient practices balancing the increase in labour and material costs over and
above CPI However changes to OampM improvement rates for selected technologies were
made as mentioned earlier OampM improvement rate values may be further considered for
emerging technologies in 2014 AETA study
A number of submissions referred to the improvement rate of OampM costs with evidence for
existing technologies to support these rising at 150 per cent CPI It was suggested that for
26
developing technologies it could reasonably be assumed that there would be reductions in
OampM between the first commercial installation and subsequent installations
While it is generally acknowledged that the LCOE of delivered energy from wind is falling
within the literature there is conflicting evidence around trends in OampM costs with recent
reports indicating both significant decreases and increases in OampM (see section 432)
Solar thermal plants consist of technology components that can be considered mature (eg
steam turbine) and components that are undergoing further development such as the solar
field and thermal storage Solar thermal plants require manning for operation as opposed to
wind turbines that do not require the same level of manning
A recent article (Muirhead 2013) advised for the Solar Energy Generating Systems (SEGS)
plants in California that have been operating since the early 1990rsquos ldquoMy understanding is
that the performance of the SEGS plants has significantly improved over time This is due
primarily to replacement of first generation receivers with newer receivers that are much
more efficient OampM practices at the plants have also improved over time based on the now
long history of operating these plants resulting in increased output in addition to reduced
OampM costs
In the AEMO report 100 Per Cent Renewables Study - Draft Modelling Outcomes Scenario 1
assumes that rapid technology transformation will drive real reductions in OampM costs
outweighing any increases projected in the AETA 2012 so OampM costs reduce by 125 per
cent by 2030 and 25 per cent by 2050 Scenario 2 uses the AETA 2012 assumption that
OampM costs escalate at around 150 per cent of Consumer Price Index (CPI) which leads to
cost increases of 27 per cent by 2030 and 46 per cent by 2050 It should be noted that the
Scenario 1 reductions are assumptions without further analysis of what will bring the
assumptions to fruition
In AETA 2012 the common OampM improvement rate for most technologies is set at 02 per
cent and can be varied as a user input The OampM improvement rate for emerging
technologies solar thermal and photovoltaic technology options and offshore wind is set to
25 per cent and can also be varied as a user input The improvement rate is now compounds
on the previous yearrsquos value
The OampM improvement rate values may be further considered for emerging technologies in
2014 AETA study
42 Operating and Maintenance (OampM) Changes in summary
As part of the Model Update special emphasis was placed in this report on the Operational
and Maintenance (OampM) costs and OampM improvement rates for all wind solar thermal and
solar PV renewable technologies covered in AETA 2012 As mentioned earlier this took into
account relevant Australian and international reports public domain information private
sources as well BREE and WorleyParsonsrsquo in-house experience The updated OampM values
are shown in Table 4 Reductions in CSP OampM costs of between 8 per cent and 27 per cent
were obtained in comparison to values provide in AETA 2012 report
The review included a detailed review of a report by IT Power cited as part of one of the
stakeholder submissions In that report reference is made to a case where $18MWh of OampM
costs comes from 64MW trough plant however it does not specify the relevant location hour
27
of thermal energy storage (TES) capacity factor type of cooling and back-up fuel and
therefore cannot be fully analysed nor used towards this AETA update
OampM costs for solar thermal plants are significantly affected by the costs of manpower To
demonstrate this with an example $18MWh for a 100MW plant with a 23 per cent capacity
factor (the IT Power report consideration) would result in an annual OampM cost of
approximately $36 million A 100MW plant will need at least 28 full time employees to be
properly manned 7 daysweek as there needs to be multiple shifts With this amount of
labour there are insufficient funds for site services utilities and materialsmaintenance If the
value is based on another location such as the Far or the Middle East region where labour
costs are significantly lower then a lower OampM cost may be feasible however for Australia
this does not appear to be feasible
The changes to OampM values for the 2013 AETA model refresh are summarised below
Table 4 Model Changes OampM costs
AETA 2012 report reference AETA 2012 model value AETA 2013 update
Section 23 Technical Assumptions
Operating and Maintenance Cost
Estimates
OampM improvement rate 02per
cent all technologies
OampM improvement rate maintained at
02per cent for
Coal based technology options
Gas based technology options
Solar thermal hybrid options
Onshore wind
Biomass technology options
Wave technology options
Geothermal technology options
Nuclear technology options
OampM improvement rate changed to 25per
cent for
Solar thermal technology options
Photovoltaic technology options
Offshore wind
The OampM improvement rate is compounded
from the previous yearsrsquo value
Section 33 Solar thermal
technologies
Solar thermal - Parabolic Trough wo
storage
Fixed OampM (AUS$MWyear)
Variable OampM (AUS$MWh)
60000
15
59176
1519
Solar thermal - Parabolic Trough with
storage
Fixed OampM (AUS$MWyear)
Variable OampM (AUS$MWh)
65000
20
72381
1139
Solar thermal - central receiver
technology wo storage
28
AETA 2012 report reference AETA 2012 model value AETA 2013 update
Fixed OampM (AUS$MWyear)
Variable OampM (AUS$MWh)
70000
15
58285
707
Solar thermal - central receiver
technology with storage
Fixed OampM (AUS$MWyear)
Variable OampM (AUS$MWh)
60000
15
71312
565
Solar thermal - Linear Fresnel wo
storage
Fixed OampM (AUS$MWyear)
Variable OampM (AUS$MWh)
60000
1500
64105
1519
Solar thermal - Linear Fresnel with
storage
Fixed OampM (AUS$MWyear)
Variable OampM (AUS$MWh)
65000
20
72381
1139
Section 35 Photovoltaic
technologies
PV ndash non tracking
Fixed OampM (AUS$MWyear)
25000
25000 (no change)
PV - Single Axis Tracking
Fixed OampM (AUS$MWyear)
38000
30000
PV - Dual Axis Tracking
Fixed OampM (AUS$MWyear)
47000
39000
Section 36 Wind Technologies
Wind Onshore
Fixed OampM (AUS$MWyear)
Variable OampM (AUS$MWh)
40000
12
32500
10
Wind Offshore
Fixed OampM (AUS$MWyear)
Variable OampM (AUS$MWh)
80000
12
77600
30
43 Wind
431 Introduction
This Section reviews onshore and offshore wind operations and maintenance (OampM) costs
used in AETA 2012 The values scrutinised are the fixed and variable OampM given in Table
361 of that report summarised in Table 5 below
29
Table 5 Wind OampM costs used in the AETA 2012 report
Option Fixed OampM (AUS$MW) Variable OampM (AUS$MWh)
Onshore 40000 12
Offshore 80000 12
OampM covers all of the services required to keep the wind farm operating as contracted to
supply energy and renewable energy certificates for its lifetime inclusive of
turbines and all balance of plant (roads buildings electrical equipment SCADA
control equipment) up to the high voltage connection point on the wind farm
substation
labour (both trades and professional)
facilities (workshops stores offices)
equipment (tools jigs vehicles rigging safety equipment craneage)
spare parts and
consumables (such as oil grease and office consumables)
Windfarm size was not specified in AETA 2012 however it was noted that wind farms
greater than 100MW are becoming more common Since then within Australia wind farms
of larger and smaller sizes have been constructed for example the 420 MW Macarthur Wind
Farm in Victoria and the 55 MW Mumbida Wind Farm in Western Australia with both larger
and smaller wind farms under proposal For this review a nominal size of 100-150 MW is
used as representative of current and future facilities
432 Review of Evidence
As mentioned earlier the review of public literature by BREE and WorleyParsons the
procurement of private studies consultations with owneroperators in the wind farm OampM
sector in Australia AETA Stakeholders and project Steering Committee members were used
to assist the current Model Update process Where possible these sources are noted in the
text however some of these sources have asked to remain anonymous and where so the
term ldquoprivate sourcerdquo has been used
As noted by one reviewer in NREL 2011 OampM cost information in the public domain in
both quantum and quality is poor and the situation appears no better in 2013 particularly in
the discrimination of fixed and variable costs One reason for this is the commercial and
increasingly competitive nature of the sector with wind farm OampM now a significant
business worldwide with subsequent confidentiality around actual costs
What constitutes wind farm OampM is also changing This is driven in part by technological
change as the wind fleet ages as new turbines become larger and more sophisticated
particularly offshore Competition in the provision of OampM services is also changing with
maturing of the wind energy product As an example the following industry trends are now
evident
30
a growing role of independents in the wind OampM market ndash around 25 per cent of the
wind fleet in the US is expected to be operated and maintained by independents by
2025 (Ebert and Ware 2013) as opposed to original equipment manufacturers (OEMs) -
wind is largely a commodity market and easier for new participants to enter something
not necessarily seen with other generation technologies
tighter supply markets ndash general economic volatility is tightening the supply and
project development chain for wind moving interest into the OampM sector bringing
price volatility and more competition
a more sophisticated asset management model ndash where OampM providers are linking
operational data with long term condition monitoring output forecasting and work
order scheduling to deliver what is termed ldquolifecycle optimisationrdquo squeezing more
energy out of the asset
older turbines exceeding planned maintenance budgets ndash with the chief issue being
keeping the variable OampM from unforeseen breakdowns
a push for larger turbines particularly offshore (5-10 MW) and in deeper waters and
linking OampM to turbine contracts ndash there is evidence (including in Australia private
source) that wind farm OampM is becoming an even more significant bargaining
component of turbine supply contracts where lower supply costs are balanced by
longer OampM contracts
Costs of wind OampM are difficult to summarise as they are dependent on many issues As just
one example in the NREL 2011 study cited earlier a wide variability in wind farm OampM
costs was found across a range of countries (Figure 1) This reference demonstrates this
variability from the average reference case in terms of Levelised Cost of Energy (LCOE)
31
Figure 1 Effect of country variables on LCOE of wind plant
Source NREL (2011)
Other issues which affect the contracted cost of OampM for wind include
regional variations in labour and transport costs
wind farm environment particularly wind regime and proximity to the ocean
(corrosion)
the maturity and availability of wind turbine technicians
the spread of facilities geographically and the wind farm asset sizes in a portfolio
the turbine type and brand particularly the support establishment within a Region
the age of the asset OampM history and existence of Type (or systematic) failures of
major components
the ability of the OampM provider under the contract to source third party spares andor
try varied maintenance practices and
the nature of the OampM contract ndash for example does it include risk reward elements or
have a link to the wind turbine supply contract or is it a ldquoproduction availabilityrdquo
contract type
While it is generally acknowledged that the LCOE of delivered energy is falling for wind
technology (Hand 2013) within the literature there is conflicting evidence around trends in
OampM costs with recent reports indicating both significant decreases (BNEF 2013) and
increases (Ebert and Ware 2013) It is generally acknowledged that increased competition in
the OampM market is delivering lower cost service provision but this may in part be offset by
an ageing fleet requiring more variable maintenance and a more sophisticated and costly
32
response Several studies have demonstrated that the costs of maintaining wind turbines
generally increase with time following a trend similar in shape to that in Figure 2 (Hand
2013) with estimates in Albers (2009) indicating a doubling in turbine OampM costs by mid
plant life The term COD in Figure 2 refers to commercial operations date
Figure 2 Typical cost increasing trends in wind farm OampM costs with commercial operations
date
Source Adapted by WorleyParsons from Houston (2013)
In Australia this trend is also evident in post 10-year aged machines (private source)
particularly in relation to variable maintenance The nature of any similar increase with more
modern turbines is unpredictable although turbine availability is improving and there is
evidence that OampM costs with each generation of turbine are lowering see Wiser et al
(2012)
The OampM costs for offshore wind farms are particularly difficult to estimate as the industry
is still at the early stages of development including the progression of much larger turbines
into deeper water and the more complex nature of the task Such progression is indicated in
Figure 3 taken from RolandBerger (2013) which indicates an expected decrease in OampM
costs These costs are of the same order of that published in other recent publications UK
Crown Estate (2012) and US DoE (2013)
33
Figure 3 Trends in offshore wind farms and estimated impact on LCOE
Source RolandBerger (2013)
433 Updated OampM Figures for Australia
It is not a simple matter to transfer international costs to Australia as despite trends there are
significant differences between regions including
size of market ndash despite growth the Australian wind market is small with respect to
other world regions For example the total wind fleet is 4 GW (CEC 2013) for
Australia versus 60 GW for the US (AWEA 2013)
labour and material rates in certain parts of Australia are high by world standards
the logistics of getting to and within Australia generally involve longer distances than
other areas of the world particularly due to the remoteness from major equipment
suppliers
volatility of the Australian dollar particularly against the US and
the size of Australian wind farms tends to be larger
These differences can be seen in Figure 4 supplied by a turbine equipment supplier (private
source) and showing the relative OampM costs (per MW) and technician numbers (per 100
MW) across various world regions in 2012 for wind turbine maintenance only and excluding
balance of plant Numbers and scales between the two indices have been removed to protect
the confidentiality of this supplier with data believed to cover the entire global portfolio
under management This shows a significant difference between regions for onshore in both
indices for example almost a 45 per cent difference in costs between Europe and America
Australia would sit within ldquoAsiaPacificrdquo and while the Figure indicates generally lower
OampM costs and higher technician numbers for this region this presumably covers a very
diverse area (including South East Asia New Zealand and Oceania) which may skew results
34
Unlike many larger global markets the wind OampM sector in Australia is dominated by
turbine equipment suppliers with original equipment manufacturer (OEM) contracts
estimated to cover more than 95 per cent of the fleet The evidence for this is mostly
anecdotal although a number of smaller independent suppliers are now known to be
undertaking full service OampM for older plant (gt10+ years) with many of the drivers for this
covered in Ebert et al (2013) There is also evidence (private source) that wind turbine
suppliers in Australia are seeking OampM contracts with much longer terms and tying these to
reductions in turbine supply prices This may indicate a lack of competitive pressure on
OampM pricing in the near to mid-term and as the size of the overall market is small it is
unknown whether independents will grow market share as has been the case in many larger
global markets see for example Deloitte amp Touche (2012)
The most recent contemporary literature comments on onshore wind farm OampM pricing in
Australia and surrounds that could be found in the public domain and not used for the AETA
2012 work are from Hassan (2011) and Deloitte (2011) These are summarised with other
new international references cited in Table 6 with assumptions on any conversions noted
below the table As no offshore wind farm projects have been progressed in Australia the
table includes values from new sources for offshore projects from the international public
domain literature - the significant difference to onshore costs is evident in the values
Figure 4 OampM Costs (per MW) and Technician Numbers (per 100MW) for total wind turbine
OampM (Opex)
Source Private - values and scales removed to protect confidentiality
From Table 6 and considering the differences in markets it appears that for onshore wind the
AETA 2012 estimates may be slightly high with an updated AETA 2013 recommendation
given in Table 7 This value has been arrived at by considering
the size of the Australian wind market and lack of competitive pressure from
independent OampM service providers
35
supply side pressures on OEMs driving them to protect their OampM businesses and
lowering costs
the likely increase in fleet installations to comply with RET legislation skewing the
fleet age to more a modern generation of turbines although it is noted that there is some
uncertainty around long term OampM cost trends particularly variable maintenance ndash an
asset age of around 5 years is assumed here
uncertainties in what is included in referenced values and differences in markets and
advice from actual asset owners and OampM providers (private sources) on current actual
costs
Table 6 Comparison of AETA 2012 wind OampM estimates with new references for 2013
Source Region
Fixed OampM
(AUS$MW)
Variable OampM
(AUS$MWh)
Total OPEX
(AUS$MW)
On
sh
ore
AETA 2012 Australia 40000 12 799451
Houston 2013 US - - 35-380002
BNEF 2013 Global - - 25000
3
Private Source (2013) (gt 10 yr old
plant) Australia - - 70000
Private Source (2013)
(lt 2 yr old out of warranty plant) Australia - - 55000
Hassan 2011 Australia - - 83-99000
4
Deloitte 2011 New Zealand - - 450005
Off
sh
ore
AETA 2012 Australia 80000 12 1262526
Crown Estate 2012 UK - - 275000
7
Hassan (2013) UK - - 2391567
RolandBerger 2013 Europe - - 198000
8
US DoE 2013 US - - 144970
9
1 Assumes a 38 capacity factor
2 USAUD = 109 extrapolated from Figure approximately to 2013
3 EUROAUD = 142 uncertain if this includes all balance of plant or VOM and only includes OEM providers
4 Assumes a 38 capacity factor
5 Assumes NZAUD = 084 a 38 capacity factor and the mid-range estimate for OampM
6 Assumes a 44 capacity factor
7 Assumes GBPAUD = 167 and taking midpoint of estimates stated
8 Assumes GBPAUD = 167 and taking value for 3MW turbines
9 Assumes USAUD = 109
36
The figures shown for onshore projects in Table 7 represent a 15 per cent decrease in the
expected OampM costs of wind farms in Australia compared to AETA 2012 This change
reflects the volatility in this market noted in previous sections and in referenced material
internationally plus the appearance of significant downward pressure on wind OampM prices
primarily through increased global competition The values allow for the rising price of
turbine OampM as the turbine ages during its life
For offshore wind it appears that the OampM costs in AETA 2012 are too low and although it
is tempting to align costs with the most recent US figures due to their lower costs and similar
coastal conditions to Australia the European offshore fleet is significantly larger and more
mature Average figures across the 2013 referenced material including Europe is
recommended This is also shown in Table 7 and represents a significant increase in estimate
costs (around 33per cent) which reflects this evolving sector
There is very little contemporary information available on the breakdown of fixed and
variable maintenance on wind plant making judgment around this for the AETA requirements
is difficult However there is some published but copyrighted material eg GlobalData 2012
which combined with others (private sources) indicates that for onshore and offshore wind
plant respectively a 5050 and 4060 FOM VOM split is appropriate This has been used to
adjust the total OPEX figure in Table 7 to the AETA scheduled and variable indices
requirements using a 38 per cent and a 44 per cent capacity factor for onshore and offshore
projects respectively
Table 7 Recommended AETA (2013) values
AETA (2013) update Fixed OampM
(AUS$MW)
Variable OampM
(AUS$MWh)
Total OPEX
(AUS$MW)
Onshore $32500 $10 $65790
Offshore $77600 $30 $194000
44 Solar Photovoltaics (PV)
441 Introduction
This Section of the report focuses on the OampM costs for ground-mount photovoltaic (PV)
technologies broken down by the following mounting system configurations
Fixed Tilt (FT)
Single Axis Tracking (SAT)
Dual Axis Tracking (DAT)
Although different PV panel technology types (eg poly-crystalline mono-crystalline or thin
film CdTe) affect the capacity factor and land use the OampM costs are comparable The
estimates for this Report are based on polycrystalline PV technology which provides an
average cost on a per Watt basis with mono-crystalline OampM costs being slightly lower and
thin film OampM costs being slightly higher
With the aim to provide comparable results between technologies WorleyParsons has
analysed and updated the PV OampM costs in terms of both fixed operation and maintenance
37
costs (FOM) and total operating expenditures (OPEX) based on reference plants of similar
characteristics
Assumptions interpretations and considerations based on their in-house data and global
market trends are described in the following Sections
442 Review of the Evidence
Since the AETA 2012 report release few new public domain reports related to OampM costs
for PV systems have been published To confirm this the following organisations have been
consulted by WorleyParsons to provide the 2013 OampM costs update for the selected PV
configurations
International Renewable Energy Agency (IRENA) (wwwirenaorg)
International Energy Agency (IEA) (wwwieaorg)
The World Bank (WB) (wwwworldbankorg)
The US National Renewable Energy Laboratory (NREL) (wwwnrelgov)
Solar Energy Industries Association (SEIA) (wwwseiaorgau)
European Photovoltaic Industry Association (EPIA) (wwwepiaorg) and
Solar Electric Power Association (SEPA) (wwwsolarelectricpowerorg)
Upon review of the available information when compared to AETA 2012 the listed
organisations do not have any new public information related to large-scale PV OampM costs
If OampM costs are mentioned they are normally referenced as a per cent of the total Capital
Expenditure (CAPEX) for the plant (around 1 per cent) and provide little useful information
about OampM Cost changes
Due to insufficient detailed and recent information in the public domain WorleyParsons
obtained the following market reports from Photon a private organisation focused on market
news political discussions and technology analysis for the PV industry
Photon 2013 ldquoThe True Cost of Solar Power - Temple of Doomrdquo and
Photon 2013 ldquoSolar Annual 2013 - Build your Empirerdquo
These private reports had minimal focus on OampM costs To provide further input in this
area private OampM service providers were contacted for pricing estimates and market trends
443 AETA 2012 OampM PV costs report comparison
Typical power plant OampM costs are expressed as a combination of a variable component
(proportional to generation) and a fixed component (occurs irrespective of generated output)
Since the generation of a PV plant is dependent on solar radiation (not requiring fossil fuel or
water which make up the major components of variable costs for conventional generation) it
is typical to express the OampM costs only as Fixed OampM (FOM) costs proportional to the
plant size due to the simplicity of PV systems The AETA 2012 report follows this practice
and estimates the PV OampM costs as FOM only relative to plant size (kW) expressed on a per
year basis
38
In order to facilitate comparisons of these costs with other electricity technologies the FOM
costs in the AETA 2012 report are also presented as OPEX costs per MW of generating
capacity per year
ASSUMPTIONS AND CONSIDERATIONS
The following costs are included in the FOM estimates as an annual cost per kW capacity
labor and administrative expenses
panel washing (twice per year at $300 kl for water)
weed abatement (seasonal herbicide applications)
inverter replacement reserve (replaced at operational year 10) and
materials and maintenance spare parts civil works preventative and corrective
equipment maintenance
Although the cost of water is variable depending on location and usage it is such a small
portion of the total OampM costs that it is adequate to assume it as a fixed cost using the
assumptions listed above
AETA 2012 PV OampM COSTS COMPARISON REPORT
The technical characteristics of the reference PV plants used in the AETA 2012 report have
been extracted from the AETA 2012 Model (Version 1_0 Rev B BREE 2012) and are
summarised in Table 8
Based on this information the following parameters for the PV technologies are estimated
Total net energy production in terms of MWh sent out per year
Total plant acreage
FOM in terms of USD per year and
Total OPEX costs in terms of USD per year and USD per total net energy production
per year
39
Table 8 AETA 2012 reference plants technical characteristics and OPEX costs
Plant Characteristics Units Fixed Tilt (FT) Single Axis Tracking (SAT)
Dual Axis Tracking (DAT)
Plant Characteristics
Plant Net Capacity MW 100 100 100
Capacity Factor per cent 21 24 26
FOM $kWyear 25 38 47
Net Energy MWhyear 183960 210240 227760
Plant Acreage acres 500 800 900
Total FOM $year 2500000 3800000 4700000
Total OPEX $year 2500000 3800000 4700000
Total OPEX $kWh 00136 00181 00206
Total OPEX costs are between 00136 and 00206 USDkWh as shown in Table 8 above
These values are conservative cost estimates but reasonable for a large-scale PV plant with
comprehensive OampM service As is expected the FOM or OPEX costs increase as the plant
footprint increases and the complexity of the mounting system increases However the
increases to single and double axis tracking technologies are larger than would be expected
The increased complexity of the trackers does add costs to OampM in terms of labor parts and
even physical plant size but these additions are minor in comparison to the larger OampM
budget items such as the inverter replacement reserve and general electrical maintenance
which are irrespective of mounting system
These values although conservative still show the cost reductions from the industry learning
curve and expanded competition over the past few years when compared to past estimates of
OampM costs This can be seen in the following Table 9 of Fixed Tilt (FT) costs which
provides some estimates found in previous publications by IEA (2008) and EPRI (2010) The
tracking estimates are not shown since minimal data is available This corresponds to the
historical market trend of the industry being more willing to install fixed tilt systems rather
than tracking systems due to lower costs and technology risk
Table 9 Comparison of historical estimated PV and OampM costs in the public domain
PV Configuration OampM Costs Units IEA 200810
EPRI 2010 AETA 2012
Fixed Tilt (FT) FOM $kWyear 40 32 to 37 25
values in Italics are derived from reported data
10
Report assumed 1 of capital costs and 23 capacity factor
40
45 AETA 2013 PV OampM Costs Update
Using the same plant characteristic assumptions as the 2012 AETA Model the 2013 OampM
costs were estimated by WorleyParsons based on the references described in review of the
evidence in Section 442 The comparison of the AETA 2013 and 2012 OampM costs are
presented in Table 10 below
Table 10 2013 PV OampM costs compared to 2012 PV OampM costs PV Configuration OampM Costs Units AETA 2012 WorleyParsons
2013 Update
Fixed Tilt (FT) FOM $kWyear 25 25
OPEX $kWh 00136 00134
Single Axis Tracking (SAT) FOM $kWyear 38 30
OPEX $kWh 00181 00141
Dual Axis Tracking (DAT) FOM $kWyear 47 39
OPEX $kWh 00206 00173
Although the OampM costs for FT systems are approximately the same SAT and DAT OampM
costs reduced by around 20-30 per cent in this 2013 update compared to the AETA 2012
report The consistency of the FT costs is reasonable and expected to continue for the next
few years as discussed further in Section 451
Regarding the SAT and DAT costs although there have been improvements in the design of
trackers for PV applications this OampM cost reduction is due to a better understanding of the
costs associated with electrical and tracking system maintenance The cost differences
between tracking systems was corroborated by quotes from private OampM service companies
who indicated that there was only a slight increase in costs from FT to SAT but a larger
increase in costs from SAT to DAT
As compared to the references mentioned in Section 442 the updated cost estimates are
conservative Table 11 compares the estimated 2013 OampM costs with those references
However since these publications focused primarily on the CAPEX with very general OampM
cost assumptions the OampM costs presented therein are not considered representative
baselines for large-scale solar projects Furthermore they attest to the industryrsquos tendency to
focus strictly on installation costs and not lifecycle costs which is discussed further in Section
451
41
Table 11 2013 updated OampM costs compared to new referenced OampM costs (7-2) PV Configuration
OampM Costs
Units WorleyParsons 2013 Update
11
NREL 2013
12
IRENA 2013a
13
Photon 2013
14
Private OampM Service Providers
201315
Fixed Tilt (FT) FOM $kWyear 25 235 17 to 21 18 17 to 23
OPEX $kWh 00134 00216 to
00383
00121 to 00266
00098 00094 to 00127
Single Axis Tracking (SAT)
FOM $kWyear 30 Not provided
Not provided
Not provided
25 to 27
OPEX $kWh 00141 Not provided
Not provided
Not provided
00136 to 00147
Dual Axis Tracking (DAT)
FOM $kWyear 39 Not provided
Not provided
Not provided
32 to 34
OPEX $kWh 00173 Not provided
Not provided
Not provided
00174 to 00185
values in Italics are derived from reported data
451 OampM Learning Rates
In the rapid PV industry growth of the last three years WorleyParsons and anecdotal
experience is that PV was considered generally to require little to no maintenance causing a
general disregard for OampM planning This appears to have resulted in complications as
owners struggle to resolve reliability performance and budget issues as the projects mature
(multiple private sources) Although the maintenance costs are smaller compared to standard
power plants OampM awareness has been increasing in the industry and therefore the OampM
cost estimates have subsequently increased
This is supported through the recent focus of OampM at PV conferences (such as Sandia
National Laboratory and Solar Energy International events) on increasing the investment in
OampM practices in addition to improving the current practices products and services so that
PV plants can be better maintained to achieve higher reliability throughout the plant life
cycle Currently the majority of OampM expenses for PV systems consist of maintaining and
replacing the inverters followed by the Balance of System maintenance In general once the
appropriate level of investment in OampM for PV is reached then OampM costs will begin to
decrease as the following issues develop to maturity
technology improvement
inverter design for reliability and longevity
data monitoring for preventative and corrective maintenance support
system efficiency to increase system output for the same OampM expense
decreased capital costs for major equipment
decreased spare parts costs
11
See assumptions in Section 433 and 443 12
Report assumed 250kW rooftop at 7 to 10 capacity factor 13
Report assumed 1 of CAPEX and 9 to16 capacity factor 14
Values derived from the global weighted average calculations assuming 21 capacity factor and 20 year lifecycle Report assumed a
simple percentage of average selling price 15
Quote excluded weed abatement panel washing and inverter replacement reserve which were supplemented from the WP estimate
Calculations assumed 21 capacity factor
42
industry maturity and stability
reliable OEM support from product consistency and commercial stability
improved codes and standards for PV equipment system design installation
commissioning and OampM and
experience
trained and experienced personnel in the installation and maintenance of PV plants
In line with this trend owners system designers installers and OEMs are now including
OampM considerations in their finances designs services and products Even though there
have been and will continue to be cost reductions in OampM due to the industry maturation
stabilization and competition those cost reductions are balanced with the necessary
increases in OampM investment to meet the maintenance needs of existing and planned PV
plants resulting in a level OampM cost estimate for the next five years
Photon (2013) follows this assumption of consistent OampM costs for the next ten years as well
as WorleyParsons discussions with OampM service providers Therefore the assumption that
PV OampM costs will remain somewhat constant over the next five years before reducing again
appears to follow the projections in the industry
452 Conclusions - PV
The key findings from the AETA 2012 review and update of the PV OampM costs are as
follows
The 2013 WorleyParsons PV OampM costs update resulted in values of
$25kWyear for FT systems
$30kWyear for SAT
$39kWyear for SAT in 2012 USD
Fixed tilt configurations have not seen significant changes in OampM costs compared to
the 2012 AETA estimates while SAT and DAT configurations cost estimates have
reduced approximately 20-30 per cent based on a better understanding of the associated
OampM costs
Values obtained in the 2013 WorleyParsons update are more conservative but are
aligned with values provided by recognised international institutions even though few
detailed OampM breakdowns are available and
OampM costs for PV are expected to remain constant over the next five years before
reducing as the industry matures in both experience and long-term planning
capabilities
43
46 Concentrating Solar Power (CSP)
461 Introduction
This Section of the report focuses on the OampM costs for the following Concentrating Solar
Power (CSP) technologies
Parabolic Trough (PT)
Solar Tower (ST) and
Linear Fresnel (LF)
CSP OampM costs were analysed in terms of
Fixed Operating and Maintenance Costs (FOM)
Variable Operating and Maintenance Costs (VOM) and
Total Operating Expenditures (OPEX)
In order to arrive at comparable results between technologies BREE and WorleyParsons
estimated the OampM costs based on
Reference Plants with similar Solar Plant characteristics localisation net capacity
capacity factor hours of Thermal Energy Storage (TES) and type of cooling system(s)
and
Cost estimate amounts that were updated to 2012 USD
When information was not available necessary estimates were made using WorleyParsonsrsquo
in-house data and based on global market trends observed in various publications
462 Review of the evidence
The following international organisations were consulted to provide the AETA 2013 OampM
costs update for the selected CSP technologies
International Renewable Energy Agency (IRENA) (wwwirenaorg)
International Energy Agency (IEA) (wwwieaorg)
European Solar Thermal Electricity Association (ESTELA) (wwwestelarde)
The World Bank (WB) (wwwworldbankorg)
National Renewable Energy Laboratory (NREL) (wwwnrelgov)
Protermosolar (wwwprotermosolares)
Institute for Energy Diversification and Saving (IDEA) (wwwideaes)
Renovetec (wwwrenoveteces) and
CSP Today (wwwcsptodaycom)
The approach in reviewing OampM costs for the 2013 update for CSP technology was only to
use new sources of information published since the AETA 2012 report was written This was
44
maintained for all but the learning rates estimation which is due to the lack of any new
updated information published since 2012 in relation to this
Upon review of the available public domain information it was found that IEA ESTELA
WB Protermosolar Renovetec and IDEA do not have any new relevant public information
related to CSP OampM costs However IRENA 2013b IRENA 2013c and NREL 2012 are
new references from IRENA and NREL that are considered relevant and which were used in
this report
The information contained in these references did not provide updated costs for all of the
CSP technologies being considered in this Report and the values offered were not provided
in terms of FOM and VOM costs as preferred
Due to the lack of new relevant information in the public domain the AETA 2013 Model
Update process obtained reports from CSP Today a private international organisation
focused on news events reports updates and information for the CSP industry in markets
such as India South Africa Spain USA Chile and MENA regions The Update acquired the
last edition of PT and ST reports CSP Today 2012a and CSP Today 2012b for which OPEX
costs were analysed
463 AETA 2012 OampM CSP costs report comparison
Operating and Maintenance expenses were provided in terms of fixed and variable costs in
the AETA 2012 report and this Model Update has modified these for 2013 for PT ST and LF
technologies based on the references cited above and further consideration of learning rates
for the CSP industry
Most CSP projects with commercial operational experience are parabolic trough technology
as it is the most mature technology and currently more is reported and known about actual
costs than other CSP technologies Nevada Solar One as an example is a 64MWe parabolic
trough plant based in California which was commissioned in 2007 and it is the first plant
built after the SEGS development during the 1980-90s also in California
Andasol 1 the 50 MWe parabolic trough plant based in Spain is also the first CSP plant
worldwide to implement a commercial thermal energy storage system with a capacity of 75
hours of full load storage It commenced operation at the end of 2008 and other similar and
larger trough projects are now operating or being constructed
As the most mature CSP technology trough plant should be further down the operational and
design operability maturity path and hence have a lower opportunity for OampM cost
reductions through learning By contrast Solar Tower and Linear Fresnel systems are only
beginning to be deployed at larger scale and hence there is expected to be more potential to
reduce their capital and operating costs and improve performance
Learning rates have been argued by stakeholders as being very significant for CSP plant with
comments of the AETA 2012 report centring on this issue Disappointingly there is no new
published evidence or actual plant report data that could be found by the AETA stakeholders
and WorleyParsons to add to that used for the 2012 report There is however new evidence
on the reduction in LCOE for CSP technologies and WorleyParsons linked OPEX
contribution to these LCOE predictions so that a sense of future reductions could be made
This is outlined further in the following Sections
45
4631 ASSUMPTIONS AND CONSIDERATIONS
FOM and VOM Breakdown
The following costs are included in proceeding FOM cost estimates for CSP technologies as
an annual cost per MW capacity
Insurance
Labour costs and
Fixed service maintenance contracts
Similarly the following costs are included in the VOM cost estimates as a cost rate per MWh
of sent out energy
Material and maintenance costs spare parts equipment maintenance and unscheduled
inspections and
Utilities costs water auxiliary fuel and auxiliary power when applicable
Some items such as spare parts for scheduled maintenance could be considered FOM costs
However to simplify the comparison and to homogenise all of the analyses across
technologies all concepts related to plant material and maintenance were included in the
VOM costs
4632 AETA 2012 OampM CSP COSTS COMPARISON REPORT
The technical characteristics of the reference CSP Plants used in the AETA 2012 report have
been extracted from the AETA Model Version 1_0 (BREE 2012) and are summarised in
Table 12
Table 12 AETA 2012 Reference Plant Technical Characteristics
Plant
Characteristics
Units Parabolic
Trough
without
Storage
Parabolic
Trough
with
Storage
Solar
Tower
without
Storage
Solar
Tower
with
Storage
Linear
Fresnel
without
Storage
Linear
Fresnel
with
Storage
Plant Net Capacity MW 138 135 122 18 230 225
Location NA Unknown Unknown Unknown Unknown Unknown Unknown
Isolation kWhm2year Unknown Unknown Unknown Unknown Unknown Unknown
Hours of TES h - 7 - 6 - 6
Capacity Factor per cent 23 42 31 42 23 42
Type of Cooling NA Unknown Unknown Unknown Unknown Unknown Unknown
FOM $MWyear 60000 65000 70000 60000 65000 65000
VOM $MWh sent out 15 20 15 15 15 20
Based on the information above this Model Update estimated the following parameters for
the CSP technologies evaluated in this study
46
Total net energy production in terms of MWh delivered per year
FOM and VOM in terms of USD per year and
Total OPEX costs in terms of USD per year and USD per total net energy production
per year
The results are listed in Table 13 below Table 13 AETA 2012 OampM Opex costs on a per kWh basis
Plant
Characteristics
Units Parabolic
Trough
without
Storage
Parabolic
Trough
with
Storage
Solar
Tower
without
Storage
Solar
Tower
with
Storage
Linear
Fresnel
without
Storage
Linear
Fresnel
with
Storage
Plant Net Capacity MW 138 135 122 18 230 225
Net Energy sent out MWhyear 2780424 496692 3313032 662256 463404 827820
FOM $year 8280000 8775000 8540000 1080000 14950000 14625000
VOM $year 4170636 9933840 4969548 993384 6951060 16556400
OPEX $year 12450636 18708840 13509548 2073384 21901060 31181400
OPEX $kWh 00448 00377 00408 00313 00473 00377
FOM per cent 6650 4690 6321 5209 6826 4690
VOM per cent 3350 5310 3679 4791 3174 5310
The percentages of FOM and VOM costs as part of the total OPEX costs are presented in
Figure 5
Figure 5 AETA 2012 FOM and VOM Percentages of Total OPEX Costs
47
In Figure 5 FOM costs are in general terms significantly higher than VOM costs because
they include the higher cost items such as insurance labour costs and fixed service contracts
However as shown in the Figure VOM costs are higher or approximately equal to FOM
costs for technologies with energy storage given the criteria selected for the breakdown
between FOM costs and VOM costs FOM costs will remain relatively consistent from year-
to-year while VOM costs should be broken down even further since the costs of water
natural gas (if required) and electricity vary between locations and from one year to another
Total OPEX costs are expressed in terms of USD per total net energy production per year and
are between 00313 and 00473 USDkWh as listed in Table 13 These values are aligned
with the values provided by international institutions cited although they appear to be
somewhat inflated in comparison with those values that are closer to 0025 and 0035
USDkWh as published by others (eg IRENA)
4633 AETA 2013 OampM COSTS UPDATE
Similar Plant characteristics to AETA 2012 were considered for the appropriate comparison
of OampM costs for this update Plant characteristics include location net capacity capacity
factor hours of TES and type of cooling For this Report the characteristics of the reference
plants used are described in Table 14
Table 14 PT and ST Reference Plant Characteristics
Plant
characteristics
Units Parabolic
Trough without
Storage
Parabolic
Trough with
Storage
Solar Tower
without
Storage
Solar Tower
with Storage
Plant Net Capacity MW 100 100 100 100
Location NA MENA region MENA region MENA region MENA region
Isolation kWhm2year 2400 2400 2400 2400
Hours of TES h 0 6 0 6
Capacity Factor per cent 26 46 275 476
Type of Cooling NA Dry Dry Dry Dry
Source NA WorleyParsons CSP Today 2012a WorleyParsons CSP Today 2012b
The 2013 OampM costs were estimated using as a basis the information provided in the CSP
2012 reports (CSP 2012a and 2012 b) The following considerations were taken into account
the CSP Today reports only consider PT and ST plants with thermal storage
WorleyParsons made the following estimates based on experience with solar and
conventional power plants based on PT and ST technologies without TES
estimated the capacity factor based on plant capacity location and type of cooling
adjusted the insurance material and maintenance and labour costs based on the
solar field reduction factor when applicable
adjusted the steam turbine maintenance based on the potential hours of operation
48
adjusted the plant electricity and water consumption based on the total net
production
assumed similar auxiliary fuel consumption for the plant with and without TES This
assumption is due to the reference plants being based in the same location thus
requiring similar auxiliary fuel consumption for start-up Minimal differences in
auxiliary fuel consumption for freeze protection due to increased time offline for a
plant without TES system compared to a plant with TES are expected but not
considered in this Report as the impact would be minor
the capacity factor provided by CSP Today for PT with thermal storage is considered
high Based on the plant location and capacity WorleyParsons would anticipate the
capacity factor to be closer to 42 per cent instead of 46 per cent as indicated in Table
14 above This difference in capacity factor directly impacts the estimated VOM cost
which is correlated with plant production For comparison purposes the value provided
by CSP Today has maintained and
with respect to Linear Fresnel technology updated information has not been published
since the AETA 2012 report release by the references listed in Section 462 which
WorleyParsons consulted For the purpose of updating the estimates to 2013 it was
assumed that the evolution of the OampM costs would be similar to that of parabolic
trough plants and the same escalation factors were applied
The resulting 2013 and 2012 OampM costs are listed in Table 15 below for comparison
Table 15 2013 CSP OampM Costs Compared to 2012 OampM Costs
CSP Technology OampM Costs AETA 2012 WorleyParsons 2013 update
Parabolic Trough
without Storage
FOM $MWyear 60000 59176
VOM $MWh sent out 1500 1519
OPEX $kWh 00448 00412
Parabolic Trough with
Storage
FOM $MWyear 65000 72381
VOM $MWh sent out 2000 1139
OPEX $kWh 00377 00293
Solar Tower without
Storage
FOM $MWyear 70000 58285
VOM $MWh sent out 1500 707
OPEX $kWh 00408 00313
Solar Tower with
Storage
FOM $MWyear 60000 71372
VOM $MWh sent out 1500 565
OPEX $kWh 00313 00228
Linear Fresnel without
Storage
FOM $MWyear 65000 64107
VOM $MWh sent out 1500 1519
OPEX $kWh 00473 00434
49
CSP Technology OampM Costs AETA 2012 WorleyParsons 2013 update
Linear Fresnel with
Storage
FOM $MWyear 65000 72381
VOM $MWh sent out 2000 1139
OPEX $kWh 00377 00293
The total OPEX costs per year from the AETA 2012 report and the WorleyParsonsrsquo estimates
that were updated for 2013 are compared in Figure 6 below
Figure 6 Comparison of OPEX Costs per Total Annual Plant Production per Year AETA 2012
Report and 2013 Update
Reductions of approximately 20 - 27 per cent in OampM costs would be realised by CSP with
TES according to the updated 2013 WorleyParsons estimates compared to the same costs
reported in the AETA 2012 report However reductions for PT and LF without TES were
found to be lower at approximately 8 per cent
The IRENA reports (IRENA 2013b IRENA 2013c) provide values for OPEX between 0025
and 0035 USDkWh for PT and ST technologies with and without TES Values updated to
2013 by WorleyParsons are between 0023 and 00412 USDkWh for PT and ST
technologies which align with the IRENA values However IRENA does not differentiate
between the utilisation of TES Solar technologies without TES have fewer hours of
production and although OPEX costs are lower in terms of USDMW compared with solar
technologies with TES OPEX costs in terms of costs per total annual plant production per
year will typically be higher for technologies that do not use TES
4634 OampM CSP LEARNING RATES
Cost reductions on CSP technologies are expected to come from the following main actions
economies of scale in the plant size and manufacturing industry
learning impacts on design construction and operation phases
50
advances in RampD of the following factors
Components Solar receivers mirrors HTF storage media supporting structures
trackers and auxiliary systems
Systems Direct steam generation storage systems or hybrid cooling systems
Configurations Hybridisation or duel electricity water plants
a more competitive supply chain
improvements in the performance of the solar field solar-to-electric efficiency and
thermal energy storage systems
increases in the life of plants and
reduced financial costs
Based on the parameters listed above the LCOE from Solar Thermal technologies is likely to
be continuously decreasing and this is born out in the literature that has been reviewed Based
on the IRENA 2013b report the evolution of the LCOE from trough and power tower CSP
technologies shows how the LCOE is decreasing as technology development increases in
Table 16 below Estimates for LCOE for the hypothetical trough and tower CSP plants in
2014 are also included
51
Table 16 Estimated LCOE form Existing and Hypothetical Trough and Solar Tower CSP Technologies
CSP
Technology
Year Capacity
(MW)
Plant Name Location DNI
(kWhm2year)
LCOE 2012
$kWh Installed
Trough
1981 05 PSA Spain 2000 064
1983 138 SEGS I California 2700 039
1989 30 SEGS II ndash VIII California 2700 026
1992 80 SEGS VIII amp IX California 2700 020
2008 - 2009 50 Andasol 1 2 Spain 2000 035
2010 50 Solnova 1 amp 3 Spain 2000 034
2010 - 2011 50 Extresol 1 amp 2 Spain 2000 035
2014 250 Unspecified (wet
cooling no storage)
Not provided Not provided 020
Tower
1987 10 Solar One California 2700 058
2007 11 PS10 Spain 2000 034
2009 20 PS20 Spain 2000 036
2011 199 Gemasolar (wet
cooling 15hr
storage)
Spain 2000 033
2014 120 Unspecified
(dry cooling
storage)
Not Provided Not provided 015
International Institutions such as IRENA ESTELA or the World Bank agree that the LCOE
and capital cost reductions of 28 per cent to 60 per cent are envisioned by 2020 ndash 2025 for
such plant Estimates of possible LCOE reductions for CSP technology from 2012 to 2025
are provided in Figure 7 taken from Kearny (2010)
52
Figure 7 Expected LCOE Reductions for CSP Technology from 2012 to 2025
Source (Kearny 2010)
The OampM maintenance costs of modern CSP Plants are lower than those for Californian
SEGS Plants built in the 1980s and 1990s which has a total combined capacity of 354 MW
and estimated OampM costs of USD 004kWh (IRENA 2013b) However CSP experienced no
growth from early 1990s until the mid-2000s as can be seen in Table 16 above
As stated at the beginning of Section 462 Andasol 1 was the first 50 MWe parabolic trough
plant built after SEGS which included a thermal energy storage system It commenced
operation at the end of 2008 Podewils (2008) estimated Andasol 1 OampM costs of EUR
0072kWh or USD 0095kWh (considering 2012 medium rate exchange EURUSD of
07553) This value is high compared to OPEX estimations for PT with TES provided by
both this 2013 update and the AETA 2012 report (00293 and 00377 USDkWh
respectively) Therefore according to the information detailed above considerable learning
improvements to OampM costs have been already achieved from the commencement of
operation of Andasol 1 to the time of this Report
`WorleyParsonsrsquo estimations on the LCOE of parabolic trough plants is in the range of
USD 020kWh to USD 035kWh and that of solar towers between USD 017kWh and
USD 029kWh However in areas with excellent solar resources the range could be as low
as USD 014kWh to USD 018kWh
The following considerations have been taken into account for OampM cost learning rates
forecast
WorleyParsons LCOE estimations as set out above
Potential average envisaged LCOE reductions of 475 per cent by 2025 based on Figure
7 above
OPEX contribution on LCOE of 20 per cent and
53
assuming that all components involved in the LCOE (CAPEX OPEX and financial
expenses) reduce at the same rate so percentage contributions remain constant
According to these considerations WorleyParsons estimates that OPEX values by 2025 could
reach from 0021 to 0037 USDkWh for PT technology and from 0018 to 0031 USDkWh
for ST technology
Technological improvements have reduced the requirement of replacing mirrors and
receivers Automation has reduced the cost of other OampM procedures by as much 30 per
cent As a result of OampM procedure improvements (both cost and plant performance) the
total OampM costs of CSP plants in the long-term are likely to be below USD 0025kWh
(IRENA 2013b)
Parabolic trough system in the United States would have OampM costs of around USD 002 to
USD 003kWh meanwhile the OampM costs of parabolic trough and solar tower power plants
currently under construction in South Africa have estimated OampM costs of between USD
0029 and USD 0036kWh (also IRENA 2013b)
WorleyParsons estimations are in alignment with IRENA estimations in terms of current and
envisaged CSP OPEX costs
4635 CONCLUSIONS ndash CSP
The following main conclusions were made based on this study in relation to CSP
technologies
the 2013 WorleyParsons CSP OampM costs update resulted in values between 0023 and
0043 USDkWh based on 2012 USD
reductions in CSP OampM costs between 8 per cent and 27 per cent were obtained in
comparison to values provide in AETA 2012 report
the total OampM costs of CSP Plants in the long-term are likely to be below USD
0025kWh
the updated values for 2013 by WorleyParsons are in alignment with the values
provided by recognised international institutions and
at the time of this report the only CSP technology with substantial operation capacity
was PT Only three utility-scale ST plants were in operation at the time of this report
(PS-10 PS-20 and Gemasolar) of which only one (Gemasolar) uses TES Though
several process steam and small-scale LFR Plants are currently in operation only one
utility-scale LFR (Puerto Erradio 2) was in operation at the time of this report
47 AETA 2013 OampM Learning Rate recommendation
The learning rate used in AETA 2012 for OampM is applied to all technologies assessed and
includes fossil fuel technologies and emerging technologies The learning rate is set at an
improvement of 02 per cent per annum
In addition to the improvement rate OampM is escalated at a rate of 150 per cent of CPI per
year based on experience with increases in parts and labour costs
The CPI rate set in the model is 25 per cent per annum
54
OampM cost information in the public domain in both quantum and quality is poor for
contemporary data Information supporting OampM learning rates is equally poor There are
indications that emerging technologies do have the potential for increased OampM learning
rates relative to mature technologies
For the renewable energy technologies studied in this report onshore wind is considered
mature and it is recommended that the AETA 2012 report value of 02 per cent is maintained
For all other renewable energy technologies studied in this report a more aggressive learning
rate of 25 per cent is recommended This will effectively cancel out the CPI escalation
adjustment and provide a ldquoflat linerdquo OampM rate for future years This will provide a value in
line with the learning rate conclusions for PV
The learning rate for CSP is considered to have greater potential for reduction but due to the
high level of analysis in this report (and therefore uncertainty) it is proposed that a maximum
of two learning rates is appropriate for the AETA model
Table 17 AETA Learning Rate Comparison
AETA 2012 Learning Rate AETA 2013 update Learning Rate
Onshore Wind 02 per cent 02 per cent
Offshore Wind
PV ndash all technologies
CSP ndash all technologies
02 per cent 25 per cent
55
5 CHANGES TO THE LCOE
Changes to the model parameters described in the earlier sections have resulted in changes to
the LCOE estimates for a number of technologies The LCOE estimate values for all
technologies and associated range of uncertainty are shown in the Figures 8 to 13 below
Note that the values listed are for a base value carbon price modifier of zero per cent which
places no value on carbon emissions
For selected technologies where there are significant cost differences Figure 14 provides a
comparison of mid-range LCOE values for the AETA 2013 and AETA 2012 Models Key
features of the Figures 8 to 14 are as follows
both in AETA 2012 and 2013 Model update LCOE costs are provided for the years
2012 2020 2025 2030 2040 and 2050
cost ranges are provided for each technology that accounts for differences in fuel prices
and state-based variations
LCOE costs vary substantially across the technologies from $89MWh (combined cycle
gas turbine) to $351MWh (solar thermal linear fresnel) in 2012 and $73MWh (PV
non-tracking) to $247MWh (IGCC black coal CCS) in 2050
the inter-technology LCOE comparisons figures (Figures 8 to 13) reveal changes in
relative costs of technologies over time Key results include renewable technologies
have higher LCOEs than the lowest cost non-renewable technologies and the relative
LCOE rankings significantly change post 2030 The LCOE of solar PV become lower
than the non-renewables from mid 2030 onwards and
large changes in LCOE results between AETA 2013 Update and AETA 2012 are
depicted in Figures14 below Figure 14 compares LCOEs at 2050 between the AETA
2013 Update and AETA 2012 for a selected number of technologies that have changed
significantly for NSW (AETA developed LCOEs by each Australian state) Differences
in technology LCOEs are explained by a multiplicity of factors including the technical
developments OampM costs and learning rate changes
56
Figure 8 Updated LCOEs for AETA 2013 Model technologies values for 2012 (NSW) with carbon price set to zero
0
50
100
150
200
250
300
350
400
450
500
LCO
E ($
MW
h)
LCOE FOR 2012 TECHNOLOGIES (NSW) Note Default region is NSW except bown coal
technologies (VIC) and SWIS scale (as specified)
LCOE includes where relevant allowance for- Carbon Price- CO2 transport and sequestration cost- Plant capital cost (EPC basis) within battery limits- Owners costs excluding interest during construction- Fixed and variable operating costs- Fuel costs- Economic escalation factors
57
Figure 9 Updated LCOEs for AETA 2013 Model technologies values for 2020 (NSW) with carbon price set to zero
0
50
100
150
200
250
300
350
400
450
LCO
E ($
MW
h)
LCOE FOR 2020 TECHNOLOGIES (NSW) Note Default region is NSW except bown coal
technologies (VIC) and SWIS scale (as specified)
LCOE includes where relevant allowance for- Carbon Price- CO2 transport and sequestration cost- Plant capital cost (EPC basis) within battery limits- Owners costs excluding interest during construction- Fixed and variable operating costs- Fuel costs- Economic escalation factors
58
Figure 10 Updated LCOEs for AETA 2013 Model technologies values for 2025 (NSW) with carbon price set to zero
0
50
100
150
200
250
300
350
400
LCO
E ($
MW
h)
LCOE FOR 2025 TECHNOLOGIES (NSW) Note Default region is NSW except bown coal
technologies (VIC) and SWIS scale (as specified)
LCOE includes where relevant allowance for- Carbon Price- CO2 transport and sequestration cost- Plant capital cost (EPC basis) within battery limits- Owners costs excluding interest during construction- Fixed and variable operating costs- Fuel costs- Economic escalation factors
59
Figure 11 Updated LCOEs for AETA 2013 Model technologies values for 2030 (NSW) with carbon price set to zero
0
50
100
150
200
250
300
350
400
LCO
E ($
MW
h)
LCOE FOR 2030 TECHNOLOGIES (NSW) Note Default region is NSW except bown coal
technologies (VIC) and SWIS scale (as specified)
LCOE includes where relevant allowance for- Carbon Price- CO2 transport and sequestration cost- Plant capital cost (EPC basis) within battery limits- Owners costs excluding interest during construction- Fixed and variable operating costs- Fuel costs- Economic escalation factors
60
Figure 12 Updated LCOEs for AETA 2013 Model technologies values for 2040 (NSW) with carbon price set to zero
0
50
100
150
200
250
300
350
400
LCO
E ($
MW
h)
LCOE FOR 2040 TECHNOLOGIES (NSW) Note Default region is NSW except bown coal
technologies (VIC) and SWIS scale (as specified)
LCOE includes where relevant allowance for- Carbon Price- CO2 transport and sequestration cost- Plant capital cost (EPC basis) within battery limits- Owners costs excluding interest during construction- Fixed and variable operating costs- Fuel costs- Economic escalation factors
61
Figure 13 Updated LCOEs for AETA 2013 Model technologies values for 2050 (NSW) with carbon price set to zero
0
50
100
150
200
250
300
350
400
LCO
E ($
MW
h)
LCOE FOR 2050 TECHNOLOGIES (NSW)
LCOE includes where relevant allowance for- Carbon Price- CO2 transport and sequestration cost- Plant capital cost (EPC basis) within battery limits- Owners costs excluding interest during construction- Fixed and variable operating costs- Fuel costs- Economic escalation factors
Note Default region is NSW except bown coal
technologies (VIC) and SWIS scale (as specified)
62
Figure 14 Comparison of AETA 2013 Model and AETA 2012 Model LCOE estimates selected technologies 2050
0
50
100
150
200
250
AETA 2012
AETA 2013
63
51 Conclusions
The Australian Energy Technology Assessment (AETA 2012) provided the best available and most up-to-
date cost estimates for 40 electricity generation technologies under Australian conditions To ensure that
the cost estimates for the various technologies are consistent all common input costs (eg labour
materials components carbon price) were itemised To ensure that the AETA costings remain up to date
AETA costs are reviewed in this AETA 2013 Model Update report
The AETA 2013 refresh was developed in close consultation with a stakeholder reference group drawn
from industry and researchacademic organisations with interests and expertise in a diverse range of
electricity generation technologies
The AETA 2013 Model results reflect the change to exclude the value of a carbon price in the Levelised
Cost of Energy (LCOE) All technologies have experienced a minor reduction in LCOE relative to 2012
(offset in some cases by other factors) due to the change to an amortisation period of 30 years plus the
construction period
Comparing the 2012 AETA results without a carbon price to the 2013 results without a carbon price there
are significant reductions in the LCOE of solar technologies and onshore wind This is as a consequence of
changes to the fixed and variable Operations and Maintenance (OampM) costs for these technologies For the
solar technologies the adjustment of the capital learning rate to 25 per cent has also contributed to the
LCOE reduction Offshore wind also has an increased learning rate but this has been offset to a large extent
by increased variable OampM costs
Nuclear LCOE has increased significantly due to higher estimates for capital costs
Efficiency for coal fired plants with CCS retrofits has been revised downwards to better reflect the expected
efficiency of these plants and has the effect of increasing the LCOE
64
REFERENCES
Albers A 2009 OampM Cost Modeling Technical Losses and Associated Uncertainties Proceedings of the
2009 European Wind Energy Conference Marseilles France March
AWEA (American Wind Energy Association) 2013 AWEA US Wind Industry Annual Report ndash Year
Ending 2012 USA
BNEF (Bloomberg New Energy Finance) 2013 Operations and Maintenance (OampM) Price Index Issue II
Wind Research Note April
BREE (Bureau of Resources and Energy Economics) 2012 AETA Report and Model Version 1_0 2012
Australian httpwwwbreegovau
CEC (Clean Energy Council) 2013 Australian Energy Technology Assessment 2013 Review Letter to
BREE of 20 May 2013 from the Clean Energy Council (Mr Russel Marsh signatory for the CEC)
CEC (Clean Energy Council) 2013 Clean Energy Council Renewable Energy Map Australia June (data
noted as current as of 21 August 2012)
httpwwwcleanenergycouncilorgauresourcecentreplantregistermaphtml
Crown Estate 2012 Offshore Wind Cost Reduction Pathways Study United Kingdom May
CSP 2012a CSP Parabolic Trough Report Cost Performance and Key Trends CSP Today
CSP 2012b CSP Solar Tower Report Cost Performance and Key Trends CSP Today
Deloitte amp Touche 2012 European Wind Services Study Find Out Which Way the Wind Blows Deloitte amp
Touche GmbH Wirtschaftspruumlfungsgesellschaft August
Deloitte 2011 Economics of wind development in New Zealand Deloitte for the for the New Zealand Wind
Energy Association
Ebert P amp Ware J 2013 The Role of Independents in the Wind Farm Operations amp Maintenance
Proceedings of the 2013 New Zealand Wind Energy Conference and Exhibition March
EPRI (Electric Power Research Institute) 2010 Engineering and Economic Evaluation of Central-Station
Solar Photovoltaic Power Plants USA March
GlobalData 2012 Wind Operations amp Maintenance (OampM) Market ndash Global Market Size Share by
Component Competitive Landscape and Key Country Analysis to 2020 GlobalData reference code
GDAE1054MAR January
Hand M 2013 Wind Plant Cost of Energy Proceedings of the 2nd NREL Wind Energy System
Engineering Workshop January
Hassan G 2011 Review of the Australian Wind Energy Industry Clean Energy Council Australia 2011
Houston C 2013 The Real Truth About Wind Farm OampM Costs North American WindPower March
IEA (International Energy Agency) 2008 Technology Roadmap Solar photovoltaic energy France
httpwwwieaorgpublicationsfreepublicationspublicationpv_roadmappdf
IRENA (International Renewable Energy Agency) 2013a Solar Photovoltaics Technology Brief Germany
January httpwwwirenaorgDocumentDownloadsPublicationsIRENA-ETSAPper
cent20Techper cent 20Briefper cent20E11per cent20Solarper cent20PVpdf
65
IRENA (International Renewable Energy Agency) 2013b Concentrating Solar Power Technology Brief
Germany January
IRENA (International Renewable Energy Agency) 2013c Renewable Power Generation Costs in 2012 An
Overview Germany
IT Power 2013 Analysis of the AETA 2012 cost estimates of CSP technologies Clean Energy Council
submission to the Bureau of Resources and Energy Economics May
Kann S 2012 US Solar Market Insight Report Q3 California USA
Kearny A 2010 Solar Thermal Electricity 2025 ndash clean electricity on demand attractive STE costs
stabilize energy production ATKearny consultants Dusseldorf Germany
Muirhead J 2013 SEGS experience suggests that CSP will age gracefully CSP Today South Africa
httpsocialcsptodaycommarketssegs-experience-suggests-csp-will-age-
gracefullysthash6VkxFaD0dpuf
NREL (National Renewable Energy Laboratories) 2011 IEA Wind Task 26 ndash Multi-national Case Study of
the Financial Cost of Wind Energy Technical Report NRELTP-6A2-48-48155 March
NREL (National Renewable Energy Laboratories) 2012 Cost and Performance Data for Power Generation
Technologies USA February
NREL (National Renewable Energy Laboratories) 2013 Breakeven Prices for Photovoltaics on
Supermarkets in the United States March httpwwwnrelgovdocsfy13osti57276pdf
NREL (National Renewable Energy Laboratories) 2013 Breakeven Prices for Photovoltaics on
Supermarkets in the United States USA March httpwwwnrelgovdocsfy13osti57276pdf
Photon 2012 The True Cost of Solar Power 2012 Temple of Doom Solar Power in Focus Series Photon
Consulting
Photon 2013 Solar Annual 2013 Build Your Empire Photon Consulting
Podewils C 2008 Photovoltaic vs Solar Thermal where PV has the upper hand and where solar thermal
strikes back Photon International Germany November
Poore R and Walford C 2008 Development of an Operations and Maintenance Cost Model to Identify
Cost of Energy Savings for Low Wind Speed Turbines Report NRELSR-500-40581 National
Renewable Energy Laboratory January
RolandBerger 2013 Offshore Wind Towards 2020 On the Pathway to Cost Competitiveness RolandBerger
Consultants Germany April
See wwwcsptodaycom
See wwwepiaorg
See wwwestelasolarde
See wwwidaees
See wwwieaorg
See wwwirenaorg
See wwwnrelgov
See wwwprotermosolares
66
See wwwrenoveteces
See wwwseiaorgau
See wwwsolarelectricpowerorg
See wwwworldbankorg
UK Crown Estate 2012 Offshore Wind Cost reduction Study May
US DoE (Department of Energy) 2013 Award Number DE-EE0005360 USA February
Wiser R Lantz E Bolinger M amp Hand M 2012 Recent Developments in the Levelized Cost of Energy
from US Wind Power Projects Contract No DE-AC02-05CH11231 National Renewable Energy
Laboratories February
67
Appendix A
Electricity Generation Technologies in AETA 2012 Report and Model
The 40 AETA electricity generation technologies are
1 Integrated Gasification and Combined Cycle (IGCC) plant based on brown coal
2 IGCC plant with Carbon Capture and Sequestration (CCS) based on brown coal
3 IGCC plant based on bituminous coal
4 IGCC plant with CCS based on bituminous coal
5 Direct injection coal engine (clean lignite eg brown coal technology)
6 Pulverised coal supercritical plant based on brown coal
7 Pulverised coal supercritical plant with post combustion CCS based on brown coal
8 Pulverised coal subcritical plant with post combustion CCS based on brown coal (retrofit)
9 Pulverised coal supercritical plant based on bituminous coal
10 Pulverised coal supercritical plant based on bituminous coal - SWIS relevant scale
11 Pulverised coal supercritical plant with CCS based on bituminous coal
12 Pulverised coal subcritical plant with post combustion CCS based on bituminous coal (retrofit)
13 Adding CCS to existing Combined Cycle Gas Turbine (CCGT) power plants (retrofitting)
14 Oxy combustion pulverised coal supercritical plant based on bituminous coal
15 Oxy combustion pulverised coal supercritical plant with CCS based on bituminous coal
16 Combined cycle plant burning natural gas
17 Combined cycle plant burning natural gas - SWIS relevant scale
18 Combined cycle plant with post combustion CCS
19 Open cycle plant burning natural gas
20 Solar thermal plant using compact linear fresnal reflector technology wo storage
21 Solar thermal plant using parabolic trough technology wo storage
22 Solar thermal plant using parabolic trough technology with storage
23 Solar thermal plant using compact linear fresnal reflector technology with storage
24 Solar thermal plant using central receiver technology wo storage
25 Solar thermal plant using central receiver technology with storage
26 Solar photovoltaic (PV) - non-tracking
27 Solar photovoltaic (PV) - single axis tracking
28 Solar photovoltaic (PV) - dual axis tracking
29 Wind (on-shore)
30 Wind (off-shore)
31 WaveOcean
68
32 Geothermal - hot sedimentary aquifer (HSA)
33 Geothermal - enhances geothermal system (EGS)
34 Landfill gas power plant
35 Sugar cane waste power plant
36 Other biomass waste power plant (eg wood)
37 Nuclear Gen 3+
38 Nuclear Small Modular Reactors (SMR)
39 Solarcoal hybrid
40 Integrated solar combined cycle (ISCS) ndash parabolic trough with combined cycle gas
69
Appendix B
Consultations with Stakeholders
This study has been undertaken in close consultation with a Stakeholder Reference Group drawn from
Australian industry and domestic as well as overseas researchacademic organisations with interests and
expertise in a diverse range of electricity generation technologies These stakeholders were invited to
provide evidence of the latest estimates for the costs and performance of various technologies
In addition the AETA project also had a Project Steering Committee comprising staff from BREE
AEMO CSIRO and other independent experts to provide technical advice and support The following
agencies participated in the stakeholder reference group meetings or were forwarded the documents
presented at the meetings
AETA Stakeholder Reference Group
Australian Coal Association
Australian Energy Market Operator
Australian Geothermal Energy Association
Australian National Low Emissions Coal RampD
Australian National University
Australian Renewable Energy Agency
Australian Solar Thermal Energy Association
Australian Sugar Milling Council
Australian Treasury
Bureau of Resources and Energy Economics
Clean Energy Council
CSIRO
Department of Industry
Economic Research Institute for ASEAN and East Asia
Energy Retailers Association of Australia
Energy Users Association of Australia
Evans and Peck
Ferrostaal
Global CCS Institute
Grid Australia
Intergen
International Energy Agency France
International Power Suez
IRENA Innovation and Technology Centre Germany
70
National Generators Forum
Oceanlinx Limited
Origin Energy
Private Generators Group
The Institute of Energy Economics Japan
The Energy Research Institute New Delhi
University of Melbourne Energy Institute
University of Queensland Energy Initiative
UQ Energy Economics amp Management Group
Wyldgroup
WorleyParsons
Two AETA Stakeholders Reference Group meetings took place on 30 April 2013 and 17 July 2013 In
addition the AETA Project Steering Committee met on 24 June 2013
71
BREE contacts Executive Director BREE Bruce Wilson brucewilsonretgovau
(02) 6243 7901
Deputy Executive Director Wayne Calder waynecalderbreegovau
(02) 6243 7718
Modelling amp Policy Integration Arif Syed arifsyedbreegovau
Program Leader (02) 6243 7504
Data Statistics Geoff Armitage geoffarmitagebreegovau
Program Leader (02) 6243 7510
Energy and Quantitative Analysis Allison Ball allisonballbreegovau
Program Leader (02) 6243 7539
Resources ndash Program Leader John Barber johnbarberbreegovau
(02) 6243 7988
72

12
1 INTRODUCTION
The Australian Energy Technology Assessment (AETA) 2012 report published in July 2012
by the Bureau of Resources and Energy Economics (BREE 2012) undertook costing of 40
electricity generation technologies This report made a provision that due to the fast changing
technology cost environment cost and performance parameters assessed in the AETA 2012
model may be updated every year In addition a full report and lsquobottom uprsquo study will be
undertaken biennially with the next report to be released in 2014
The next fully updated AETA report is scheduled for completion in 2014 To ensure that cost
estimates for electricity generation technologies are current and take into consideration the latest
developments parameter estimates for the 40 technologies will be updated where appropriate
every six months in a manner consistent with the methods outlined in this report and in consultation
with the stakeholder reference group (BREE 2012 p 24)
The purpose of this AETA 2013 Model Update report is to present findings arising from a
review of specific technologies by BREE This review was assisted by comments made by
the AETA Project Steering Committee (PSC) members and AETA Stakeholders Reference
Group (SRG) WorleyParsons was commissioned to review cost parameters for the
technologies considered in the AETA 2012 model Given the fast changing nature of solar
and wind technology operating costs especial emphasis was placed on reviewing OampM costs
for wind and solar technologies Changes to the model for the 2013 update are discussed in
the following sections
11 Background to the AETA 2012 report
BREE engaged WorleyParsons in 2011-12 to develop cost estimates for 40 electricity
generation technologies under Australian conditions for AETA 2012 The AETA cost
estimates were developed with the active collaboration of the Australian Energy Market
Operator (AEMO) which utilised the AETA cost estimates for its National Transmission
Network Development Plan (NTNDP) In addition the Commonwealth Scientific and
Industrial Research Organisation (CSIRO) provided technical advice as part of the AETA
project steering committee The AETA 2012 provided technology costs for the years 2012
2020 2025 2030 2040 and 2050 These technologies encompass a diverse range of
energy sources including renewable energy (such as wind solar geothermal biomass and
wave power) fossil fuels (such as coal and gas) and nuclear power (Appendix A) Since its
publication in July 2012 more than 1000 requests have been made from BREE for the
AETA 2012 cost estimates (model) by domestic and international sources
12 Methods and Assumptions of the AETA 2012 Report and Model
121 Macro assumptions
Key macroeconomic assumptions are consistent with those detailed by the Australian
Energy Market Operator in its National Transmission Network Development Plan and by
the Australian Treasury (see BREE 2012 for a full set of assumptions)
13
122 Technical assumptions
all technologies were costed on a consistent and transparent basis with itemisation of
component costs
capital costs included direct (eg engineering procurement and construction) and
indirect (eg owners) costs but exclude transmission and decommissioning costs
future cost estimates included assumptions about the exchange rate productivity
variation commodity variation and technology improvements
fuel cost estimates were based on ACIL Tasman projections and
projected growth rates for future operating and maintenance costs were provided
123 Levelised cost of energy (LCOE)
LCOE can be interpreted as the long-run marginal cost of electricity generation Key
factors used to calculate LCOE by technology include amortisation period discount rate
capacity factor CO2 emissions factor CO2 capture rate emissions price CO2 storage cost
fuel cost variable and fixed OampM cost and the capital cost
LCOE is a key comparative cost indicator across technologies that is expressed in real
Australian dollars per Megawatt hour of electricity generation ($MWh) The LCOE is the
price at which electricity must be generated from a specific plant to break even taking into
account the costs incurred over the life of the plant (capital cost cost of capitalfinancing
operations and maintenance costs cost of fuel emissions price if applicable and CO2
sequestration) While LCOE is an invaluable tool for comparing technology costs power
generation companies andor investors who wish to choose a technology to deploy would
also need to consider other criteria such as site-specific costs technology performance
characteristics and experience with the technology prior to any final investment decision
AETA cost estimates are developed to provide design basis and plant characteristics
performance parameters capital cost estimates fuel cost estimates OampM cost estimates
and LCOE estimates
Regional impacts on capital and operating costs have been incorporated in the analysis
These regions include Victoria New South Wales (including ACT) South Queensland
(incorporating the South East Queensland and Central Queensland AEMO regions) North
Queensland (incorporating the North Queensland AEMO region) Northern Territory
North WA (Pilbara region) South WA (the South West Interconnected System region)
South Australia and Tasmania
13 Methodology of the AETA 2013 Model Update
As part of the AETA 2013 Model Update BREE invited submissions from the AETA
Steering Committee and the Stakeholder Reference Group to provide commentary and
recommendations on the AETA 2012 Report and Model Eight written submissions were
received in this regard Changes were only recommended where specific substantiated
changes were received The AETA 2013 model has been updated in accordance with the
above consultations and under the same macro economic and technical assumptions as in
AETA 2012 The AETA 2013 model is freely available on request from BREE
(infobreegovau)
Within this context this report provides updated costs based on
14
relevant Australian and international reports on generation technologies that have been
published since AETA 2012 or have been newly discovered
new public domain information
new information from private sources that could be obtained
in-house experience of WorleyParsons and
input on OampM costs and learning rates from a number of industry stakeholders
This AETA 2013 Model Update report provides supporting explanations and references and
justifies amendments to the cost parameters of technologies especially the OampM costs for
wind and solar technologies that were covered in AETA 2012 model
131 Caveats on the use of LCOE
LCOE provides a generalised cost estimate and does not account for site specific factors
that would be encountered when constructing an actual power plant As a result the costs
associated with integrating a particular technology in a specific location to a specific
electricity network are not considered
Projected LCOE does not necessarily provide a reliable indicator of the relative market
value of generation technologies because of differences in the role of technologies in a
wholesale electricity market For example projected LCOE does not provide a direct
indicator of electricity demand or generation in isolation with other emissions abatement
policies Similarly many technologies involve integration costs in addition to the LCOE to
be able to reliably supply to the system The value of variable (or intermittent) power plants
(such as wind and solar) will depend upon the extent to which such plants generate
electricity during peak periods and the impact these plants have on the reliability of the
electricity system Unlike dispatchable power plants (such as coal natural gas biomass
and hydroelectric) ndash which are reliant on some form of stored energy (eg fuels water
storage or battery storage) ndash wind and photovoltaic power plants do not typically include
energy storage Dispatchable plants such as coal or gas fired plants may involve negative
externalities (environment fuel disposal or insurance costs etc) which are not always
reflected in their LCOEs
The AETA LCOEs are restricted to only utility-scale or large scale technologies
Consequently small-scale technologies (eg small roof-top photovoltaics fuel cells co-
generation and trigeneration) that may be relevant to distributed generation were not
included in the AETA 2012 analysis LCOE cost estimates associated with distributed
photovoltaics are likely to differ substantially from utility-scale photovoltaic systems as a
result of differences in component costs (eg capital costs operating and maintenance
costs) and performance characteristics (eg capacity factor)
132 Organisation of the report
This report is organised in five sections After a brief introduction and purpose of the report
in this section section 2 discusses the changes made to the AETA 2013 Model parameters as
a result of the discussions with Stakeholders and Steering Committee members on the
individual issues and technologies Section 3 presents the issues that were considered but did
not result in the AETA Model parameter changes Section 4 presents in detail the OampM cost
15
changes for wind and solar technologies covered in AETA 2012 Updated LCOE graphs as
well as a comparison of the resultant AETA 2013 Model and AETA 2012 Model LCOEs are
presented in section 5 which also presents concluding comments
16
2 AETA MODEL PARAMETER CHANGES
21 Stakeholder Initiated Changes
Consultations for the AETA 2013 Model update identified the following issues for
consideration
nuclear technology capital costs and lsquofirst year available for constructionrsquo
CCS retrofit thermal efficiency
amortisation period for all technologies and
OampM costs
The OampM issue is discussed in section 4 whereas rest of the issues are discussed below
211 Nuclear Capital Costs
The AETA 2012 report and model presents costs for first of a kind (FOAK) and Nth of a kind
(NOAK) nuclear technologies There could have been some confusion from the original
wording of Section 310 of AETA 2012 report It starts by discussing Gen III plants currently
sold (presumably NOAK) however further in the document Gen III plants are referred to as
FOAK The AETA 2012 report states that the capital costs are based on nuclear power plants
in the US The NOAK value is what is represented in Table 3101 in the AETA 2012 report
and model
Although there are cost adjusting factors used for other technologies studied in the AETA
2012 report there is no adjustment of the US cost base for Australian labour costs and for
adjustment of Australian equipment costs Submissions indicated that an adjustment to costs
should also be used for nuclear to ensure there is commonality in the comparison
This suggestion was considered appropriate and adjustment to the costs for nuclear
technologies was made Based on the factors to convert US rates to Australian rates used in
the fossil fuel technologies ie the factors from the Thermoflow software the new nuclear
capital costs were calculated The multiplier from Thermoflow for labour costs is 205 and
the factor for equipment costs is 13 both US to Australia
Additionally it was submitted that the first year available for construction of nuclear
technologies be extended In support of this the submission argued that nuclear technologies
are examples of generation technology where legislation regulation and public policy
planning is highly region-dependent and must therefore precede deployment by several years
This was considered an appropriate submission and therefore the first year available for
construction in the model has been changed from 2012 to 2020 These changes are shown in
Table 1
17
Table 1 Model Changes Nuclear Technologies
AETA 2012 report reference AETA 2012 model value AETA 2013 update
Technology 37 Nuclear (GW Scale LWR)
Change first year available for Construction
2012
2020
Technology 37 Nuclear (GW Scale LWR)
Convert FOAK Capital Cost to Australian productivity
and commodity costs
4210
6392
Technology 37 Nuclear (GW Scale LWR)
Convert NOAK Capital Cost to Australian productivity
and commodity costs
3470
5268
Technology 38 Nuclear (SMR)
Convert FOAK Capital Cost to Australian productivity
and commodity costs
7908
11778
Technology 38 Nuclear (SMR)
Convert NOAK Capital Cost to Australian productivity
and commodity costs
4778
7116
The overall impact of these parameters on individual technology LCOE changes is given in
the AETA 2013 Model and in Section 5
212 Carbon Capture and Storage (CCS) Retrofit Thermal Efficiency
Subcritical coal technologies with CCS retrofit were reported to have only slightly lower
thermal efficiency values compared with new build supercritical technologies with CCS in
the AETA 2012 Model This was an oversight in the AETA 2012 Model
The AETA 2012 report identified the thermal efficiency to retrofit subcritical brown and
black coal plants as 216 per cent and 301 per cent respectively (Table 312) In the same
table the efficiency for new build supercritical brown and black coal plants is reported to be
208 per cent and 314 per cent respectively
The thermal efficiencies were revised down based on actual operating efficiencies of existing
coal facilities in Victoria and NSW and factored based on the thermal efficiency ratio of new
coal facilities with and without CCS
A reduction in thermal efficiency is to be expected when applying a retrofit CCS to the plant
The CCS factor in the following representation refers the efficiency reduction factors for
adding CCS to a coal fired power station The useful output will reduce from the new
parasitic loads to run the CCS equipment
Thermal efficiency of existing brown coal plant in Victoria is 265 per cent and the CCS
factor is 064 Similarly the thermal efficiency of existing bituminous coal plant in NSW is
355 per cent and the CCS factor is 075
Table 311 and 312 of the AETA 2012 report show a reduction is present when comparing
the supercritical with no CCS compared to supercritical with CCS However the retrofit case
was only provided for the subcritical technology only and no case was included in the AETA
2012 for a subcritical plant with any CCS
A review of the values in Table 312 through comparison to the existing efficiency of
installed black and brown coal fleet in Australia was undertaken For brown coal the current
18
sent out thermal efficiency is 265 per cent for a 500 MW subcritical unit For supercritical
brown coal without CCS the sent out efficiency is 323 per cent Applying the same reduction
factor the thermal efficiency with CCS retrofitted should be 17 per cent in lieu of 216 per
cent as published in AETA 2012 report
For black coal the current sent out thermal efficiency is 355 per cent for a 660 MW
subcritical unit For supercritical black coal without CCS the sent out efficiency is 419 per
cent Applying the same reduction factor the thermal efficiency with CCS retrofitted should
be 266 per cent in lieu of 301 per cent as published AETA 2012 report (Table 2)
Table 2 Model Changes CCS Retrofit Thermal Technologies
AETA 2012 report reference AETA 2012 model value AETA 2013 update
Technology 8 Pulverised coal subcritical plant
with post combustion CCS based on brown coal
(retrofit)
Thermal Efficiency
216
170
Technology 12 Pulverised coal subcritical plant
with post combustion CCS based on bituminous
coal (retrofit)
Thermal Efficiency
301
266
19
213 Amortisation period
There was stakeholder consensus that the operating period for all technologies needs to be set
to thirty years and that the construction time is in addition to the operating time The financial
amortisation period is common for all technologies and is set at 30 years In the AETA 2012
model section 24 (a) nominates that the amortisation period of 30 years is from the
commencement of construction The amortisation period has now been changed (Table 3)
Examples of the change are
Nuclear LWR ndash GW scale In AETA 2012 report amortisation period was 30 years inclusive
of construction and operation The amortisation period has now changed to 36 years (30
operating and 6 years construction)
Solar parabolic trough In AETA 2012 report amortisation period was 30 years inclusive of
construction and operation The amortisation period has now changed to 33 years (30
operating and 3 years construction)
Table 3 Model Changes amortisation period
AETA 2012 report reference AETA 2012 model value AETA 2013 update
Common Amortisation period
for construction and operation
Amortisation period for
operation includes
construction for all
technologies
Amortisation period for
operation to exclude
construction for all
technologies
22 No Carbon Pricing
For the 2013 AETA update the carbon price modifier has been set to zero per cent as the
base value for the results presented in this report with the effect of applying a zero carbon
price to all technologies throughout the study period to 2050 The AETA 2013 Model
however has the option of changing this parameter by the user
20
3 CONSIDERATION OF OTHER ISSUES
This section summarises the issues that were discussed during the AETA 2013 Model Update
with AETA stakeholders but have not led to a change in the model However these issues do
not cover the OampM costs considerations that are detailed in section 4
31 Representation of Uncertainty
The recognition of uncertainty within the model was discussed including both the level of
representation and potential uncertainties with respect to First-of-a-Kind and lsquoEarly Moverrsquo
Technologies
A number of factors were identified that lead to uncertainty in estimates ndash particularly for
emerging technologies For conventional coal and gas technologies even though the
technology is mature the addition of carbon capture introduces cost and performance
uncertainty Cost estimates have inherent uncertainty due to the market uncertainties and
unforeseeable technological developments and due to
- Volatility in equipment pricing
- Volatility in economic conditions (during post Global Financial Crisis) and
- Volatility in labour pricing due to ldquootherrdquo heavy construction projects in specific areas
For technologies where the costs are well understood it was considered that the error bars
should be reduced compared to immediate and emerging technologies and that the error bars
should be lower for technology costs in 2012 compared to later years
There is strong agreement from two key stakeholder submissions with all the factors causing
uncertainty that have been identified in AETA 2012 In particular the labour cost has varied
(increased) significantly due to large construction projects which have increased costs due to
a shortage of labour and a lower productivity due to less experienced personnel The
uncertainties provided in the AETA model are available on a per technology and a per
selected years basis BREE will consider whether or not to include more detail on
uncertainty by technology in the 2014 review of the model
32 Application of Learning Curves
It was raised during the consultation process that the AETA model revision could allow for
learning curve cost reduction assumptions to be altered by the end user This has not been
incorporated in the 2013 update as it is a structural change to the AETA Model
Stakeholders also raised the question as to whether it is possible within the application of
learning curves to distinguish between the potential for cost reductions on manufactured
components like PV panels versus the Balance of Project (BoP) costs which may involve
routine assembly and erection activities which are not subject to significant learning by
doing
However there are opportunities for cost reductions particularly where many repetitive tasks
are involved such as solar field construction modular construction techniques
rationalization of components in the BoP design or reduction in assembly or placement time
21
This is supported in the US Solar Market Insight Report 2012 (Kann 2012) which identified
continued savings in inverter and racking costs as follows
ldquohellip falling equipment costs and fine-tuning of installation practices have made large-
scale solar less expensive QQrdquo
ldquohellip with the continuing maturation of the industry we expect continued focus on
reducing PV balance-of-systems costs (BOS) and that the increased worry over high
penetration PV will drive adoption of 1000Vdc and advanced inverters
respectivelyrdquo and
ldquoMounting structure manufacturers noted that the past year has seen tremendous
pricing pressure accounting for price declines of anywhere between 10 per cent and
30 per cent over the past yearrdquo
Given that the balance of plant costs can also be subject to cost reductions it is not
considered necessary to distinguish learning curves for discrete project costs in the model
33 General Costs Considerations
331 Fuel Costs
The outlook for fuel costs for gas coal and carbon was claimed to have materially shifted
since the AETA 2012 model While there was no evidence provided to support this
consideration will be given to this issue in the 2014 model update
332 CCS Costs
A submission cited the ZeroGen Case Study and sought to clarify the differences in CCS
cost between ZeroGen and lower values estimated for AETA 2012 This is a valid
comparison however BREE notes the following issues which contribute to explaining the
differences The international cost component is as follows AETA 52 per cent ZeroGen 34
per cent With the USD exchange rate AETA 1 ZeroGen at 08 adjusting the AETA value
for exchange rate variation would add A$952kWnet to the AETA value There is a
difference in plant size with AETA at 557 MW net and Zerogen 400 MW net A bigger plant
size would typically provide a lower cost kW installed
Additionally section 112 of Chapter One of the ZeroGen report advises escalation based on
project delivery from 2011 to 2017 AETA costs are for 2012 basis and do not include
escalation beyond this time A portion of the Zerogen costs will be inflated over the
comparable AETA cost Also section 113 of Chapter One of the ZeroGen report identifies
significant enabling works This is likely to be more inclusive than considered in the AETA
2012 report as identified in section 23 (a)
Overall it is considered likely that a number of estimate basis items in the ZeroGen study are
different and once equalised will show a smaller difference between the AETA and
ZeroGen values Therefore there is no immediate action but the basis and assumptions of the
model may be reviewed during 2014 AETA update
With regard to CCS efficiency one submission proposed that the AETA estimates were
overly optimistic However no references were cited to support this view and no change has
been made to the model
22
333 Opportunity Costs
A submission was made that footnotes be included regarding retrofit costs to indicate that
make-up power costs are not included This was not adopted because AETA parameters for
each technology are calculated for that technology alone and do not consider the impact of
reduced output of a retrofit project where additional output needs to be generated from
alternate higher cost generation Opportunity costs are specifically related to business cases
for specific projects and are not considered for any cases presented in the AETA report
Moreover retrofitting does not make electricity generation uncertain or intermittent It only
lowers the flow of generation at a constant rate (due to lower thermal efficiency) relative to
the non-retrofit case
34 Capital and Construction Costs
A submission was made to update the AETA values for the mid-point capital cost for several
technologies based on a study provided in support of the submission The technologies
asserted were
IGCC (Integrated Gasification and Combined Cycle) with 90 per cent capture fuelled
with Victorian brown coal
IGCC with no capture fuelled with black coal
IGCC with 90 per cent capture fuelled with black coal
Pulverised Fuel power plant with 90 per cent capture fuelled with Victorian brown
coal
Pulverised Fuel power plant with 90 per cent capture fuelled with black coal and
OCGT with no capture fuelled with natural gas
There is a key difference in the magnitude of the labour component in Australia compared
with the labour costs associated with the supporting material (from the USA) While no
changes have been made to the model in this update the ldquoshort termrdquo impact of labour
pricing on technology costs may be considered in further updates
Similarly it was submitted that the capital cost values for combined Cycle Gas Turbine
(CCGT) (with and without capture) could be revised As no documentary evidence was
provided to support this no change was made
For Direct Injection Coal Emulsion (DICE) power plant with no capture fuelled with
Victorian brown coal it is also suggested that the values be reviewed with a number of
papers provided for reference However these papers do not address capital cost in any depth
and it is unclear if the balance of project costs included are comparable with AETA DICE
technology is not mature and is probably best described as in the demonstration to
deployment phase of development which brings uncertainty into the cost analysis Therefore
data is needed to substantiate this submission As this was not available at the time of
preparing this report consideration of this issue is deferred to a later time when the necessary
data is available
An increase in the capital costs for Solar thermal trough (6 hrs storage) and Solar thermal
central receiver (6 hours storage) were proposed based on a supporting study by the Electric
Power Research institute (EPRI) The proposed values are substantially larger than the AETA
23
2012 but it is not clear what basis is used to generate these revised values A separate
submission received from another AETA stakeholder has supported the AETA values
Additionally the cited reference for solar thermal trough the Energy Power Research
Institute (EPRI) plant configuration is based on air cooling ndash while for AETA the plant
configuration assumes water cooling The difference in plant configuration will account for a
small part of the difference The AETA value is based on a reference report as issued in 2012
by the US National Renewable Energy Laboratory (NREL 2012)
The AETA value for the central receiver technology is based on a small (20MW) plant
(Gemasolar) with factors for adjustment to field size for thermal storage capacity and post
FOAK learning These factors will align with increased uncertainty in the AETA value It is
likely that additional cost information may now be available for the Brightsource Ivanpah
plant (no storage) and other tower plants being considered under construction
Further investigation of these issues has been sought with stakeholders but is as yet
unavailable
Another suggestion was made to consider capital costs on a component basis The capital
costs used in AETA 2012 for existing technologies were based on actual costs that could be
sourced on published documents (locally andor internationally) or from WorleyParsons
internal data For developing technologies costs were not considered on a component level
For this reason in technologies that are not commercialised a number of assumptions would
need to be made which may limit lsquorealrsquo costs being available No change to the model arose
from this submission
A reassessment of the construction expenditure profile for concentrating solar power (CSP)
technology options was sought in another stakeholder submission and supported by a
referenced report (IT Power 2012) However the plant sizes considered in the AETA report
are larger capacity (100 MW+) than those discussed in the cited report and consequently
have a longer duration construction period As three years is considered to be an appropriate
time period to spread the construction expenditure profile no change to the model was made
35 Costs Associated with Solar Technologies
A change to the model was sought with regard to the significant downward trends in the cost
of solar PV The stakeholder submission cited pricing data from the Australian Photovoltaic
Institute (APVI) Consultation with the APVI identified that evidence based information for
utility scale PV costs in Australia is limited because Australia has no PV systems 100 MW or
larger It is acknowledged however that there is significant and continued volatility in the
solar PV market including volatility due to competition oversupply in the PV module
market as well as continued price reductions for balance of system and installation costs
A$338 Wnet was a reasonable valuation for 2012 AETA The AETA 2012 value will be
maintained but may be reviewed in the 2014 model update
It was also suggested that solar thermal costs could be better represented in the model by
allowing for different periods of storage rather than a standard 6 hours The AETA 2012
scope was based on fixed plant designs which included fixed thermal storage sizing where
thermal storage was included With thermal storage there are a number of variables that can
be considered including differing field sizes (solar multiple) as well as actual thermal storage
capacities This is likely to add significant complexity to the report and to the model the
benefit of which at this stage does not warrant the changes
24
36 Costs Associated with Nuclear Technologies
It was submitted that consideration be given to including the impact on LCOE for nuclear
technology of the relatively high insurance costs for nuclear technologies This issue will be
considered in the 2014 review of the AETA model However insurance costs or plant
decommissioning costs are not considered for any of the 40 AETA technologies
Also the OampM improvement rate for Nuclear was not reconsidered as there is no OampM
improvement rate for Nuclear in the model
37 Further Technologies
A proposal was received which recommended that further technologies (DICE power plant
based on black coal with and without capture and DICE brown coal with capture and
medium speed DICE technologies) be incorporated into the AETA Model However as
mentioned earlier this update of the AETA 2012 Model only considered the technologies
included in that model This update of the model is not intended to broaden the technologies
38 Auxiliary Loads
Another example used for the purposes of drawing comparisons with the AETA model was
the SaskPower Post Combustion Retrofit It is difficult to distil the SaskPower project data
into a direct comparison with the AETA study and consequently there is insufficient data
certainty to warrant changes to the AETA 2012 values The SaskPower Post Combustion
Retrofit was also cited as to its conservative auxiliary loads for brown and black coal
However upon further investigation this was not substantiated within the SaskPower
example
25
4 WIND PV AND CSP OPERATIONS AND MAINTENANCE (OampM) COST UPDATE
41 Operation and Maintenance Costs
OPERATING AND MAINTENANCE COST DEFINITIONS
In considering the costing of OampM there is no absolutely clear definition of which costs
should be considered as fixed and which variable with the breakdown varying based on a
range of issues including technology location and resource type For this reason in the future
AETA reports OampM costs may be compared in terms of annual total operating expenditure
(OPEX) per MW of generation This method is widely used by most international institutions
to analyse OampM costs and to avoid subjective considerations
For this report fixed and variable costs are reported to provide direct comparison with AETA
2012 In this regard in general fixed costs are independent of the electrical generation of the
plant and are expressed as annual cost per MW capacity Fixed costs include items such as
fixed labour
equipment and
vehicles
Variable costs are proportional to the electrical generation of the Plant and are expressed as
cost rate per kWh energy output Variable costs include items such as
variable labour
consumables and
spare parts
As both public and private domain material vary in the way they approach and report on
fixed and variable maintenance within the following text where an interpretation has been
used for comparison purposes this is described
A submission was made to remove the operations and maintenance (OampM) cost escalation
factors This was not taken up as there is an increase in the OampM costs over CPI which is
borne out historically A review of the basis for this escalation determined that the
underlying assumptions were appropriate The review also considered adopting a generic
learning curve approach for OampM improvement rates as was suggested in one submission
This was not adopted as the model has an OampM improvement rate (set at 02 per cent per
annum) which can be varied by the user for wind and solar technologies This value accounts
for more efficient practices balancing the increase in labour and material costs over and
above CPI However changes to OampM improvement rates for selected technologies were
made as mentioned earlier OampM improvement rate values may be further considered for
emerging technologies in 2014 AETA study
A number of submissions referred to the improvement rate of OampM costs with evidence for
existing technologies to support these rising at 150 per cent CPI It was suggested that for
26
developing technologies it could reasonably be assumed that there would be reductions in
OampM between the first commercial installation and subsequent installations
While it is generally acknowledged that the LCOE of delivered energy from wind is falling
within the literature there is conflicting evidence around trends in OampM costs with recent
reports indicating both significant decreases and increases in OampM (see section 432)
Solar thermal plants consist of technology components that can be considered mature (eg
steam turbine) and components that are undergoing further development such as the solar
field and thermal storage Solar thermal plants require manning for operation as opposed to
wind turbines that do not require the same level of manning
A recent article (Muirhead 2013) advised for the Solar Energy Generating Systems (SEGS)
plants in California that have been operating since the early 1990rsquos ldquoMy understanding is
that the performance of the SEGS plants has significantly improved over time This is due
primarily to replacement of first generation receivers with newer receivers that are much
more efficient OampM practices at the plants have also improved over time based on the now
long history of operating these plants resulting in increased output in addition to reduced
OampM costs
In the AEMO report 100 Per Cent Renewables Study - Draft Modelling Outcomes Scenario 1
assumes that rapid technology transformation will drive real reductions in OampM costs
outweighing any increases projected in the AETA 2012 so OampM costs reduce by 125 per
cent by 2030 and 25 per cent by 2050 Scenario 2 uses the AETA 2012 assumption that
OampM costs escalate at around 150 per cent of Consumer Price Index (CPI) which leads to
cost increases of 27 per cent by 2030 and 46 per cent by 2050 It should be noted that the
Scenario 1 reductions are assumptions without further analysis of what will bring the
assumptions to fruition
In AETA 2012 the common OampM improvement rate for most technologies is set at 02 per
cent and can be varied as a user input The OampM improvement rate for emerging
technologies solar thermal and photovoltaic technology options and offshore wind is set to
25 per cent and can also be varied as a user input The improvement rate is now compounds
on the previous yearrsquos value
The OampM improvement rate values may be further considered for emerging technologies in
2014 AETA study
42 Operating and Maintenance (OampM) Changes in summary
As part of the Model Update special emphasis was placed in this report on the Operational
and Maintenance (OampM) costs and OampM improvement rates for all wind solar thermal and
solar PV renewable technologies covered in AETA 2012 As mentioned earlier this took into
account relevant Australian and international reports public domain information private
sources as well BREE and WorleyParsonsrsquo in-house experience The updated OampM values
are shown in Table 4 Reductions in CSP OampM costs of between 8 per cent and 27 per cent
were obtained in comparison to values provide in AETA 2012 report
The review included a detailed review of a report by IT Power cited as part of one of the
stakeholder submissions In that report reference is made to a case where $18MWh of OampM
costs comes from 64MW trough plant however it does not specify the relevant location hour
27
of thermal energy storage (TES) capacity factor type of cooling and back-up fuel and
therefore cannot be fully analysed nor used towards this AETA update
OampM costs for solar thermal plants are significantly affected by the costs of manpower To
demonstrate this with an example $18MWh for a 100MW plant with a 23 per cent capacity
factor (the IT Power report consideration) would result in an annual OampM cost of
approximately $36 million A 100MW plant will need at least 28 full time employees to be
properly manned 7 daysweek as there needs to be multiple shifts With this amount of
labour there are insufficient funds for site services utilities and materialsmaintenance If the
value is based on another location such as the Far or the Middle East region where labour
costs are significantly lower then a lower OampM cost may be feasible however for Australia
this does not appear to be feasible
The changes to OampM values for the 2013 AETA model refresh are summarised below
Table 4 Model Changes OampM costs
AETA 2012 report reference AETA 2012 model value AETA 2013 update
Section 23 Technical Assumptions
Operating and Maintenance Cost
Estimates
OampM improvement rate 02per
cent all technologies
OampM improvement rate maintained at
02per cent for
Coal based technology options
Gas based technology options
Solar thermal hybrid options
Onshore wind
Biomass technology options
Wave technology options
Geothermal technology options
Nuclear technology options
OampM improvement rate changed to 25per
cent for
Solar thermal technology options
Photovoltaic technology options
Offshore wind
The OampM improvement rate is compounded
from the previous yearsrsquo value
Section 33 Solar thermal
technologies
Solar thermal - Parabolic Trough wo
storage
Fixed OampM (AUS$MWyear)
Variable OampM (AUS$MWh)
60000
15
59176
1519
Solar thermal - Parabolic Trough with
storage
Fixed OampM (AUS$MWyear)
Variable OampM (AUS$MWh)
65000
20
72381
1139
Solar thermal - central receiver
technology wo storage
28
AETA 2012 report reference AETA 2012 model value AETA 2013 update
Fixed OampM (AUS$MWyear)
Variable OampM (AUS$MWh)
70000
15
58285
707
Solar thermal - central receiver
technology with storage
Fixed OampM (AUS$MWyear)
Variable OampM (AUS$MWh)
60000
15
71312
565
Solar thermal - Linear Fresnel wo
storage
Fixed OampM (AUS$MWyear)
Variable OampM (AUS$MWh)
60000
1500
64105
1519
Solar thermal - Linear Fresnel with
storage
Fixed OampM (AUS$MWyear)
Variable OampM (AUS$MWh)
65000
20
72381
1139
Section 35 Photovoltaic
technologies
PV ndash non tracking
Fixed OampM (AUS$MWyear)
25000
25000 (no change)
PV - Single Axis Tracking
Fixed OampM (AUS$MWyear)
38000
30000
PV - Dual Axis Tracking
Fixed OampM (AUS$MWyear)
47000
39000
Section 36 Wind Technologies
Wind Onshore
Fixed OampM (AUS$MWyear)
Variable OampM (AUS$MWh)
40000
12
32500
10
Wind Offshore
Fixed OampM (AUS$MWyear)
Variable OampM (AUS$MWh)
80000
12
77600
30
43 Wind
431 Introduction
This Section reviews onshore and offshore wind operations and maintenance (OampM) costs
used in AETA 2012 The values scrutinised are the fixed and variable OampM given in Table
361 of that report summarised in Table 5 below
29
Table 5 Wind OampM costs used in the AETA 2012 report
Option Fixed OampM (AUS$MW) Variable OampM (AUS$MWh)
Onshore 40000 12
Offshore 80000 12
OampM covers all of the services required to keep the wind farm operating as contracted to
supply energy and renewable energy certificates for its lifetime inclusive of
turbines and all balance of plant (roads buildings electrical equipment SCADA
control equipment) up to the high voltage connection point on the wind farm
substation
labour (both trades and professional)
facilities (workshops stores offices)
equipment (tools jigs vehicles rigging safety equipment craneage)
spare parts and
consumables (such as oil grease and office consumables)
Windfarm size was not specified in AETA 2012 however it was noted that wind farms
greater than 100MW are becoming more common Since then within Australia wind farms
of larger and smaller sizes have been constructed for example the 420 MW Macarthur Wind
Farm in Victoria and the 55 MW Mumbida Wind Farm in Western Australia with both larger
and smaller wind farms under proposal For this review a nominal size of 100-150 MW is
used as representative of current and future facilities
432 Review of Evidence
As mentioned earlier the review of public literature by BREE and WorleyParsons the
procurement of private studies consultations with owneroperators in the wind farm OampM
sector in Australia AETA Stakeholders and project Steering Committee members were used
to assist the current Model Update process Where possible these sources are noted in the
text however some of these sources have asked to remain anonymous and where so the
term ldquoprivate sourcerdquo has been used
As noted by one reviewer in NREL 2011 OampM cost information in the public domain in
both quantum and quality is poor and the situation appears no better in 2013 particularly in
the discrimination of fixed and variable costs One reason for this is the commercial and
increasingly competitive nature of the sector with wind farm OampM now a significant
business worldwide with subsequent confidentiality around actual costs
What constitutes wind farm OampM is also changing This is driven in part by technological
change as the wind fleet ages as new turbines become larger and more sophisticated
particularly offshore Competition in the provision of OampM services is also changing with
maturing of the wind energy product As an example the following industry trends are now
evident
30
a growing role of independents in the wind OampM market ndash around 25 per cent of the
wind fleet in the US is expected to be operated and maintained by independents by
2025 (Ebert and Ware 2013) as opposed to original equipment manufacturers (OEMs) -
wind is largely a commodity market and easier for new participants to enter something
not necessarily seen with other generation technologies
tighter supply markets ndash general economic volatility is tightening the supply and
project development chain for wind moving interest into the OampM sector bringing
price volatility and more competition
a more sophisticated asset management model ndash where OampM providers are linking
operational data with long term condition monitoring output forecasting and work
order scheduling to deliver what is termed ldquolifecycle optimisationrdquo squeezing more
energy out of the asset
older turbines exceeding planned maintenance budgets ndash with the chief issue being
keeping the variable OampM from unforeseen breakdowns
a push for larger turbines particularly offshore (5-10 MW) and in deeper waters and
linking OampM to turbine contracts ndash there is evidence (including in Australia private
source) that wind farm OampM is becoming an even more significant bargaining
component of turbine supply contracts where lower supply costs are balanced by
longer OampM contracts
Costs of wind OampM are difficult to summarise as they are dependent on many issues As just
one example in the NREL 2011 study cited earlier a wide variability in wind farm OampM
costs was found across a range of countries (Figure 1) This reference demonstrates this
variability from the average reference case in terms of Levelised Cost of Energy (LCOE)
31
Figure 1 Effect of country variables on LCOE of wind plant
Source NREL (2011)
Other issues which affect the contracted cost of OampM for wind include
regional variations in labour and transport costs
wind farm environment particularly wind regime and proximity to the ocean
(corrosion)
the maturity and availability of wind turbine technicians
the spread of facilities geographically and the wind farm asset sizes in a portfolio
the turbine type and brand particularly the support establishment within a Region
the age of the asset OampM history and existence of Type (or systematic) failures of
major components
the ability of the OampM provider under the contract to source third party spares andor
try varied maintenance practices and
the nature of the OampM contract ndash for example does it include risk reward elements or
have a link to the wind turbine supply contract or is it a ldquoproduction availabilityrdquo
contract type
While it is generally acknowledged that the LCOE of delivered energy is falling for wind
technology (Hand 2013) within the literature there is conflicting evidence around trends in
OampM costs with recent reports indicating both significant decreases (BNEF 2013) and
increases (Ebert and Ware 2013) It is generally acknowledged that increased competition in
the OampM market is delivering lower cost service provision but this may in part be offset by
an ageing fleet requiring more variable maintenance and a more sophisticated and costly
32
response Several studies have demonstrated that the costs of maintaining wind turbines
generally increase with time following a trend similar in shape to that in Figure 2 (Hand
2013) with estimates in Albers (2009) indicating a doubling in turbine OampM costs by mid
plant life The term COD in Figure 2 refers to commercial operations date
Figure 2 Typical cost increasing trends in wind farm OampM costs with commercial operations
date
Source Adapted by WorleyParsons from Houston (2013)
In Australia this trend is also evident in post 10-year aged machines (private source)
particularly in relation to variable maintenance The nature of any similar increase with more
modern turbines is unpredictable although turbine availability is improving and there is
evidence that OampM costs with each generation of turbine are lowering see Wiser et al
(2012)
The OampM costs for offshore wind farms are particularly difficult to estimate as the industry
is still at the early stages of development including the progression of much larger turbines
into deeper water and the more complex nature of the task Such progression is indicated in
Figure 3 taken from RolandBerger (2013) which indicates an expected decrease in OampM
costs These costs are of the same order of that published in other recent publications UK
Crown Estate (2012) and US DoE (2013)
33
Figure 3 Trends in offshore wind farms and estimated impact on LCOE
Source RolandBerger (2013)
433 Updated OampM Figures for Australia
It is not a simple matter to transfer international costs to Australia as despite trends there are
significant differences between regions including
size of market ndash despite growth the Australian wind market is small with respect to
other world regions For example the total wind fleet is 4 GW (CEC 2013) for
Australia versus 60 GW for the US (AWEA 2013)
labour and material rates in certain parts of Australia are high by world standards
the logistics of getting to and within Australia generally involve longer distances than
other areas of the world particularly due to the remoteness from major equipment
suppliers
volatility of the Australian dollar particularly against the US and
the size of Australian wind farms tends to be larger
These differences can be seen in Figure 4 supplied by a turbine equipment supplier (private
source) and showing the relative OampM costs (per MW) and technician numbers (per 100
MW) across various world regions in 2012 for wind turbine maintenance only and excluding
balance of plant Numbers and scales between the two indices have been removed to protect
the confidentiality of this supplier with data believed to cover the entire global portfolio
under management This shows a significant difference between regions for onshore in both
indices for example almost a 45 per cent difference in costs between Europe and America
Australia would sit within ldquoAsiaPacificrdquo and while the Figure indicates generally lower
OampM costs and higher technician numbers for this region this presumably covers a very
diverse area (including South East Asia New Zealand and Oceania) which may skew results
34
Unlike many larger global markets the wind OampM sector in Australia is dominated by
turbine equipment suppliers with original equipment manufacturer (OEM) contracts
estimated to cover more than 95 per cent of the fleet The evidence for this is mostly
anecdotal although a number of smaller independent suppliers are now known to be
undertaking full service OampM for older plant (gt10+ years) with many of the drivers for this
covered in Ebert et al (2013) There is also evidence (private source) that wind turbine
suppliers in Australia are seeking OampM contracts with much longer terms and tying these to
reductions in turbine supply prices This may indicate a lack of competitive pressure on
OampM pricing in the near to mid-term and as the size of the overall market is small it is
unknown whether independents will grow market share as has been the case in many larger
global markets see for example Deloitte amp Touche (2012)
The most recent contemporary literature comments on onshore wind farm OampM pricing in
Australia and surrounds that could be found in the public domain and not used for the AETA
2012 work are from Hassan (2011) and Deloitte (2011) These are summarised with other
new international references cited in Table 6 with assumptions on any conversions noted
below the table As no offshore wind farm projects have been progressed in Australia the
table includes values from new sources for offshore projects from the international public
domain literature - the significant difference to onshore costs is evident in the values
Figure 4 OampM Costs (per MW) and Technician Numbers (per 100MW) for total wind turbine
OampM (Opex)
Source Private - values and scales removed to protect confidentiality
From Table 6 and considering the differences in markets it appears that for onshore wind the
AETA 2012 estimates may be slightly high with an updated AETA 2013 recommendation
given in Table 7 This value has been arrived at by considering
the size of the Australian wind market and lack of competitive pressure from
independent OampM service providers
35
supply side pressures on OEMs driving them to protect their OampM businesses and
lowering costs
the likely increase in fleet installations to comply with RET legislation skewing the
fleet age to more a modern generation of turbines although it is noted that there is some
uncertainty around long term OampM cost trends particularly variable maintenance ndash an
asset age of around 5 years is assumed here
uncertainties in what is included in referenced values and differences in markets and
advice from actual asset owners and OampM providers (private sources) on current actual
costs
Table 6 Comparison of AETA 2012 wind OampM estimates with new references for 2013
Source Region
Fixed OampM
(AUS$MW)
Variable OampM
(AUS$MWh)
Total OPEX
(AUS$MW)
On
sh
ore
AETA 2012 Australia 40000 12 799451
Houston 2013 US - - 35-380002
BNEF 2013 Global - - 25000
3
Private Source (2013) (gt 10 yr old
plant) Australia - - 70000
Private Source (2013)
(lt 2 yr old out of warranty plant) Australia - - 55000
Hassan 2011 Australia - - 83-99000
4
Deloitte 2011 New Zealand - - 450005
Off
sh
ore
AETA 2012 Australia 80000 12 1262526
Crown Estate 2012 UK - - 275000
7
Hassan (2013) UK - - 2391567
RolandBerger 2013 Europe - - 198000
8
US DoE 2013 US - - 144970
9
1 Assumes a 38 capacity factor
2 USAUD = 109 extrapolated from Figure approximately to 2013
3 EUROAUD = 142 uncertain if this includes all balance of plant or VOM and only includes OEM providers
4 Assumes a 38 capacity factor
5 Assumes NZAUD = 084 a 38 capacity factor and the mid-range estimate for OampM
6 Assumes a 44 capacity factor
7 Assumes GBPAUD = 167 and taking midpoint of estimates stated
8 Assumes GBPAUD = 167 and taking value for 3MW turbines
9 Assumes USAUD = 109
36
The figures shown for onshore projects in Table 7 represent a 15 per cent decrease in the
expected OampM costs of wind farms in Australia compared to AETA 2012 This change
reflects the volatility in this market noted in previous sections and in referenced material
internationally plus the appearance of significant downward pressure on wind OampM prices
primarily through increased global competition The values allow for the rising price of
turbine OampM as the turbine ages during its life
For offshore wind it appears that the OampM costs in AETA 2012 are too low and although it
is tempting to align costs with the most recent US figures due to their lower costs and similar
coastal conditions to Australia the European offshore fleet is significantly larger and more
mature Average figures across the 2013 referenced material including Europe is
recommended This is also shown in Table 7 and represents a significant increase in estimate
costs (around 33per cent) which reflects this evolving sector
There is very little contemporary information available on the breakdown of fixed and
variable maintenance on wind plant making judgment around this for the AETA requirements
is difficult However there is some published but copyrighted material eg GlobalData 2012
which combined with others (private sources) indicates that for onshore and offshore wind
plant respectively a 5050 and 4060 FOM VOM split is appropriate This has been used to
adjust the total OPEX figure in Table 7 to the AETA scheduled and variable indices
requirements using a 38 per cent and a 44 per cent capacity factor for onshore and offshore
projects respectively
Table 7 Recommended AETA (2013) values
AETA (2013) update Fixed OampM
(AUS$MW)
Variable OampM
(AUS$MWh)
Total OPEX
(AUS$MW)
Onshore $32500 $10 $65790
Offshore $77600 $30 $194000
44 Solar Photovoltaics (PV)
441 Introduction
This Section of the report focuses on the OampM costs for ground-mount photovoltaic (PV)
technologies broken down by the following mounting system configurations
Fixed Tilt (FT)
Single Axis Tracking (SAT)
Dual Axis Tracking (DAT)
Although different PV panel technology types (eg poly-crystalline mono-crystalline or thin
film CdTe) affect the capacity factor and land use the OampM costs are comparable The
estimates for this Report are based on polycrystalline PV technology which provides an
average cost on a per Watt basis with mono-crystalline OampM costs being slightly lower and
thin film OampM costs being slightly higher
With the aim to provide comparable results between technologies WorleyParsons has
analysed and updated the PV OampM costs in terms of both fixed operation and maintenance
37
costs (FOM) and total operating expenditures (OPEX) based on reference plants of similar
characteristics
Assumptions interpretations and considerations based on their in-house data and global
market trends are described in the following Sections
442 Review of the Evidence
Since the AETA 2012 report release few new public domain reports related to OampM costs
for PV systems have been published To confirm this the following organisations have been
consulted by WorleyParsons to provide the 2013 OampM costs update for the selected PV
configurations
International Renewable Energy Agency (IRENA) (wwwirenaorg)
International Energy Agency (IEA) (wwwieaorg)
The World Bank (WB) (wwwworldbankorg)
The US National Renewable Energy Laboratory (NREL) (wwwnrelgov)
Solar Energy Industries Association (SEIA) (wwwseiaorgau)
European Photovoltaic Industry Association (EPIA) (wwwepiaorg) and
Solar Electric Power Association (SEPA) (wwwsolarelectricpowerorg)
Upon review of the available information when compared to AETA 2012 the listed
organisations do not have any new public information related to large-scale PV OampM costs
If OampM costs are mentioned they are normally referenced as a per cent of the total Capital
Expenditure (CAPEX) for the plant (around 1 per cent) and provide little useful information
about OampM Cost changes
Due to insufficient detailed and recent information in the public domain WorleyParsons
obtained the following market reports from Photon a private organisation focused on market
news political discussions and technology analysis for the PV industry
Photon 2013 ldquoThe True Cost of Solar Power - Temple of Doomrdquo and
Photon 2013 ldquoSolar Annual 2013 - Build your Empirerdquo
These private reports had minimal focus on OampM costs To provide further input in this
area private OampM service providers were contacted for pricing estimates and market trends
443 AETA 2012 OampM PV costs report comparison
Typical power plant OampM costs are expressed as a combination of a variable component
(proportional to generation) and a fixed component (occurs irrespective of generated output)
Since the generation of a PV plant is dependent on solar radiation (not requiring fossil fuel or
water which make up the major components of variable costs for conventional generation) it
is typical to express the OampM costs only as Fixed OampM (FOM) costs proportional to the
plant size due to the simplicity of PV systems The AETA 2012 report follows this practice
and estimates the PV OampM costs as FOM only relative to plant size (kW) expressed on a per
year basis
38
In order to facilitate comparisons of these costs with other electricity technologies the FOM
costs in the AETA 2012 report are also presented as OPEX costs per MW of generating
capacity per year
ASSUMPTIONS AND CONSIDERATIONS
The following costs are included in the FOM estimates as an annual cost per kW capacity
labor and administrative expenses
panel washing (twice per year at $300 kl for water)
weed abatement (seasonal herbicide applications)
inverter replacement reserve (replaced at operational year 10) and
materials and maintenance spare parts civil works preventative and corrective
equipment maintenance
Although the cost of water is variable depending on location and usage it is such a small
portion of the total OampM costs that it is adequate to assume it as a fixed cost using the
assumptions listed above
AETA 2012 PV OampM COSTS COMPARISON REPORT
The technical characteristics of the reference PV plants used in the AETA 2012 report have
been extracted from the AETA 2012 Model (Version 1_0 Rev B BREE 2012) and are
summarised in Table 8
Based on this information the following parameters for the PV technologies are estimated
Total net energy production in terms of MWh sent out per year
Total plant acreage
FOM in terms of USD per year and
Total OPEX costs in terms of USD per year and USD per total net energy production
per year
39
Table 8 AETA 2012 reference plants technical characteristics and OPEX costs
Plant Characteristics Units Fixed Tilt (FT) Single Axis Tracking (SAT)
Dual Axis Tracking (DAT)
Plant Characteristics
Plant Net Capacity MW 100 100 100
Capacity Factor per cent 21 24 26
FOM $kWyear 25 38 47
Net Energy MWhyear 183960 210240 227760
Plant Acreage acres 500 800 900
Total FOM $year 2500000 3800000 4700000
Total OPEX $year 2500000 3800000 4700000
Total OPEX $kWh 00136 00181 00206
Total OPEX costs are between 00136 and 00206 USDkWh as shown in Table 8 above
These values are conservative cost estimates but reasonable for a large-scale PV plant with
comprehensive OampM service As is expected the FOM or OPEX costs increase as the plant
footprint increases and the complexity of the mounting system increases However the
increases to single and double axis tracking technologies are larger than would be expected
The increased complexity of the trackers does add costs to OampM in terms of labor parts and
even physical plant size but these additions are minor in comparison to the larger OampM
budget items such as the inverter replacement reserve and general electrical maintenance
which are irrespective of mounting system
These values although conservative still show the cost reductions from the industry learning
curve and expanded competition over the past few years when compared to past estimates of
OampM costs This can be seen in the following Table 9 of Fixed Tilt (FT) costs which
provides some estimates found in previous publications by IEA (2008) and EPRI (2010) The
tracking estimates are not shown since minimal data is available This corresponds to the
historical market trend of the industry being more willing to install fixed tilt systems rather
than tracking systems due to lower costs and technology risk
Table 9 Comparison of historical estimated PV and OampM costs in the public domain
PV Configuration OampM Costs Units IEA 200810
EPRI 2010 AETA 2012
Fixed Tilt (FT) FOM $kWyear 40 32 to 37 25
values in Italics are derived from reported data
10
Report assumed 1 of capital costs and 23 capacity factor
40
45 AETA 2013 PV OampM Costs Update
Using the same plant characteristic assumptions as the 2012 AETA Model the 2013 OampM
costs were estimated by WorleyParsons based on the references described in review of the
evidence in Section 442 The comparison of the AETA 2013 and 2012 OampM costs are
presented in Table 10 below
Table 10 2013 PV OampM costs compared to 2012 PV OampM costs PV Configuration OampM Costs Units AETA 2012 WorleyParsons
2013 Update
Fixed Tilt (FT) FOM $kWyear 25 25
OPEX $kWh 00136 00134
Single Axis Tracking (SAT) FOM $kWyear 38 30
OPEX $kWh 00181 00141
Dual Axis Tracking (DAT) FOM $kWyear 47 39
OPEX $kWh 00206 00173
Although the OampM costs for FT systems are approximately the same SAT and DAT OampM
costs reduced by around 20-30 per cent in this 2013 update compared to the AETA 2012
report The consistency of the FT costs is reasonable and expected to continue for the next
few years as discussed further in Section 451
Regarding the SAT and DAT costs although there have been improvements in the design of
trackers for PV applications this OampM cost reduction is due to a better understanding of the
costs associated with electrical and tracking system maintenance The cost differences
between tracking systems was corroborated by quotes from private OampM service companies
who indicated that there was only a slight increase in costs from FT to SAT but a larger
increase in costs from SAT to DAT
As compared to the references mentioned in Section 442 the updated cost estimates are
conservative Table 11 compares the estimated 2013 OampM costs with those references
However since these publications focused primarily on the CAPEX with very general OampM
cost assumptions the OampM costs presented therein are not considered representative
baselines for large-scale solar projects Furthermore they attest to the industryrsquos tendency to
focus strictly on installation costs and not lifecycle costs which is discussed further in Section
451
41
Table 11 2013 updated OampM costs compared to new referenced OampM costs (7-2) PV Configuration
OampM Costs
Units WorleyParsons 2013 Update
11
NREL 2013
12
IRENA 2013a
13
Photon 2013
14
Private OampM Service Providers
201315
Fixed Tilt (FT) FOM $kWyear 25 235 17 to 21 18 17 to 23
OPEX $kWh 00134 00216 to
00383
00121 to 00266
00098 00094 to 00127
Single Axis Tracking (SAT)
FOM $kWyear 30 Not provided
Not provided
Not provided
25 to 27
OPEX $kWh 00141 Not provided
Not provided
Not provided
00136 to 00147
Dual Axis Tracking (DAT)
FOM $kWyear 39 Not provided
Not provided
Not provided
32 to 34
OPEX $kWh 00173 Not provided
Not provided
Not provided
00174 to 00185
values in Italics are derived from reported data
451 OampM Learning Rates
In the rapid PV industry growth of the last three years WorleyParsons and anecdotal
experience is that PV was considered generally to require little to no maintenance causing a
general disregard for OampM planning This appears to have resulted in complications as
owners struggle to resolve reliability performance and budget issues as the projects mature
(multiple private sources) Although the maintenance costs are smaller compared to standard
power plants OampM awareness has been increasing in the industry and therefore the OampM
cost estimates have subsequently increased
This is supported through the recent focus of OampM at PV conferences (such as Sandia
National Laboratory and Solar Energy International events) on increasing the investment in
OampM practices in addition to improving the current practices products and services so that
PV plants can be better maintained to achieve higher reliability throughout the plant life
cycle Currently the majority of OampM expenses for PV systems consist of maintaining and
replacing the inverters followed by the Balance of System maintenance In general once the
appropriate level of investment in OampM for PV is reached then OampM costs will begin to
decrease as the following issues develop to maturity
technology improvement
inverter design for reliability and longevity
data monitoring for preventative and corrective maintenance support
system efficiency to increase system output for the same OampM expense
decreased capital costs for major equipment
decreased spare parts costs
11
See assumptions in Section 433 and 443 12
Report assumed 250kW rooftop at 7 to 10 capacity factor 13
Report assumed 1 of CAPEX and 9 to16 capacity factor 14
Values derived from the global weighted average calculations assuming 21 capacity factor and 20 year lifecycle Report assumed a
simple percentage of average selling price 15
Quote excluded weed abatement panel washing and inverter replacement reserve which were supplemented from the WP estimate
Calculations assumed 21 capacity factor
42
industry maturity and stability
reliable OEM support from product consistency and commercial stability
improved codes and standards for PV equipment system design installation
commissioning and OampM and
experience
trained and experienced personnel in the installation and maintenance of PV plants
In line with this trend owners system designers installers and OEMs are now including
OampM considerations in their finances designs services and products Even though there
have been and will continue to be cost reductions in OampM due to the industry maturation
stabilization and competition those cost reductions are balanced with the necessary
increases in OampM investment to meet the maintenance needs of existing and planned PV
plants resulting in a level OampM cost estimate for the next five years
Photon (2013) follows this assumption of consistent OampM costs for the next ten years as well
as WorleyParsons discussions with OampM service providers Therefore the assumption that
PV OampM costs will remain somewhat constant over the next five years before reducing again
appears to follow the projections in the industry
452 Conclusions - PV
The key findings from the AETA 2012 review and update of the PV OampM costs are as
follows
The 2013 WorleyParsons PV OampM costs update resulted in values of
$25kWyear for FT systems
$30kWyear for SAT
$39kWyear for SAT in 2012 USD
Fixed tilt configurations have not seen significant changes in OampM costs compared to
the 2012 AETA estimates while SAT and DAT configurations cost estimates have
reduced approximately 20-30 per cent based on a better understanding of the associated
OampM costs
Values obtained in the 2013 WorleyParsons update are more conservative but are
aligned with values provided by recognised international institutions even though few
detailed OampM breakdowns are available and
OampM costs for PV are expected to remain constant over the next five years before
reducing as the industry matures in both experience and long-term planning
capabilities
43
46 Concentrating Solar Power (CSP)
461 Introduction
This Section of the report focuses on the OampM costs for the following Concentrating Solar
Power (CSP) technologies
Parabolic Trough (PT)
Solar Tower (ST) and
Linear Fresnel (LF)
CSP OampM costs were analysed in terms of
Fixed Operating and Maintenance Costs (FOM)
Variable Operating and Maintenance Costs (VOM) and
Total Operating Expenditures (OPEX)
In order to arrive at comparable results between technologies BREE and WorleyParsons
estimated the OampM costs based on
Reference Plants with similar Solar Plant characteristics localisation net capacity
capacity factor hours of Thermal Energy Storage (TES) and type of cooling system(s)
and
Cost estimate amounts that were updated to 2012 USD
When information was not available necessary estimates were made using WorleyParsonsrsquo
in-house data and based on global market trends observed in various publications
462 Review of the evidence
The following international organisations were consulted to provide the AETA 2013 OampM
costs update for the selected CSP technologies
International Renewable Energy Agency (IRENA) (wwwirenaorg)
International Energy Agency (IEA) (wwwieaorg)
European Solar Thermal Electricity Association (ESTELA) (wwwestelarde)
The World Bank (WB) (wwwworldbankorg)
National Renewable Energy Laboratory (NREL) (wwwnrelgov)
Protermosolar (wwwprotermosolares)
Institute for Energy Diversification and Saving (IDEA) (wwwideaes)
Renovetec (wwwrenoveteces) and
CSP Today (wwwcsptodaycom)
The approach in reviewing OampM costs for the 2013 update for CSP technology was only to
use new sources of information published since the AETA 2012 report was written This was
44
maintained for all but the learning rates estimation which is due to the lack of any new
updated information published since 2012 in relation to this
Upon review of the available public domain information it was found that IEA ESTELA
WB Protermosolar Renovetec and IDEA do not have any new relevant public information
related to CSP OampM costs However IRENA 2013b IRENA 2013c and NREL 2012 are
new references from IRENA and NREL that are considered relevant and which were used in
this report
The information contained in these references did not provide updated costs for all of the
CSP technologies being considered in this Report and the values offered were not provided
in terms of FOM and VOM costs as preferred
Due to the lack of new relevant information in the public domain the AETA 2013 Model
Update process obtained reports from CSP Today a private international organisation
focused on news events reports updates and information for the CSP industry in markets
such as India South Africa Spain USA Chile and MENA regions The Update acquired the
last edition of PT and ST reports CSP Today 2012a and CSP Today 2012b for which OPEX
costs were analysed
463 AETA 2012 OampM CSP costs report comparison
Operating and Maintenance expenses were provided in terms of fixed and variable costs in
the AETA 2012 report and this Model Update has modified these for 2013 for PT ST and LF
technologies based on the references cited above and further consideration of learning rates
for the CSP industry
Most CSP projects with commercial operational experience are parabolic trough technology
as it is the most mature technology and currently more is reported and known about actual
costs than other CSP technologies Nevada Solar One as an example is a 64MWe parabolic
trough plant based in California which was commissioned in 2007 and it is the first plant
built after the SEGS development during the 1980-90s also in California
Andasol 1 the 50 MWe parabolic trough plant based in Spain is also the first CSP plant
worldwide to implement a commercial thermal energy storage system with a capacity of 75
hours of full load storage It commenced operation at the end of 2008 and other similar and
larger trough projects are now operating or being constructed
As the most mature CSP technology trough plant should be further down the operational and
design operability maturity path and hence have a lower opportunity for OampM cost
reductions through learning By contrast Solar Tower and Linear Fresnel systems are only
beginning to be deployed at larger scale and hence there is expected to be more potential to
reduce their capital and operating costs and improve performance
Learning rates have been argued by stakeholders as being very significant for CSP plant with
comments of the AETA 2012 report centring on this issue Disappointingly there is no new
published evidence or actual plant report data that could be found by the AETA stakeholders
and WorleyParsons to add to that used for the 2012 report There is however new evidence
on the reduction in LCOE for CSP technologies and WorleyParsons linked OPEX
contribution to these LCOE predictions so that a sense of future reductions could be made
This is outlined further in the following Sections
45
4631 ASSUMPTIONS AND CONSIDERATIONS
FOM and VOM Breakdown
The following costs are included in proceeding FOM cost estimates for CSP technologies as
an annual cost per MW capacity
Insurance
Labour costs and
Fixed service maintenance contracts
Similarly the following costs are included in the VOM cost estimates as a cost rate per MWh
of sent out energy
Material and maintenance costs spare parts equipment maintenance and unscheduled
inspections and
Utilities costs water auxiliary fuel and auxiliary power when applicable
Some items such as spare parts for scheduled maintenance could be considered FOM costs
However to simplify the comparison and to homogenise all of the analyses across
technologies all concepts related to plant material and maintenance were included in the
VOM costs
4632 AETA 2012 OampM CSP COSTS COMPARISON REPORT
The technical characteristics of the reference CSP Plants used in the AETA 2012 report have
been extracted from the AETA Model Version 1_0 (BREE 2012) and are summarised in
Table 12
Table 12 AETA 2012 Reference Plant Technical Characteristics
Plant
Characteristics
Units Parabolic
Trough
without
Storage
Parabolic
Trough
with
Storage
Solar
Tower
without
Storage
Solar
Tower
with
Storage
Linear
Fresnel
without
Storage
Linear
Fresnel
with
Storage
Plant Net Capacity MW 138 135 122 18 230 225
Location NA Unknown Unknown Unknown Unknown Unknown Unknown
Isolation kWhm2year Unknown Unknown Unknown Unknown Unknown Unknown
Hours of TES h - 7 - 6 - 6
Capacity Factor per cent 23 42 31 42 23 42
Type of Cooling NA Unknown Unknown Unknown Unknown Unknown Unknown
FOM $MWyear 60000 65000 70000 60000 65000 65000
VOM $MWh sent out 15 20 15 15 15 20
Based on the information above this Model Update estimated the following parameters for
the CSP technologies evaluated in this study
46
Total net energy production in terms of MWh delivered per year
FOM and VOM in terms of USD per year and
Total OPEX costs in terms of USD per year and USD per total net energy production
per year
The results are listed in Table 13 below Table 13 AETA 2012 OampM Opex costs on a per kWh basis
Plant
Characteristics
Units Parabolic
Trough
without
Storage
Parabolic
Trough
with
Storage
Solar
Tower
without
Storage
Solar
Tower
with
Storage
Linear
Fresnel
without
Storage
Linear
Fresnel
with
Storage
Plant Net Capacity MW 138 135 122 18 230 225
Net Energy sent out MWhyear 2780424 496692 3313032 662256 463404 827820
FOM $year 8280000 8775000 8540000 1080000 14950000 14625000
VOM $year 4170636 9933840 4969548 993384 6951060 16556400
OPEX $year 12450636 18708840 13509548 2073384 21901060 31181400
OPEX $kWh 00448 00377 00408 00313 00473 00377
FOM per cent 6650 4690 6321 5209 6826 4690
VOM per cent 3350 5310 3679 4791 3174 5310
The percentages of FOM and VOM costs as part of the total OPEX costs are presented in
Figure 5
Figure 5 AETA 2012 FOM and VOM Percentages of Total OPEX Costs
47
In Figure 5 FOM costs are in general terms significantly higher than VOM costs because
they include the higher cost items such as insurance labour costs and fixed service contracts
However as shown in the Figure VOM costs are higher or approximately equal to FOM
costs for technologies with energy storage given the criteria selected for the breakdown
between FOM costs and VOM costs FOM costs will remain relatively consistent from year-
to-year while VOM costs should be broken down even further since the costs of water
natural gas (if required) and electricity vary between locations and from one year to another
Total OPEX costs are expressed in terms of USD per total net energy production per year and
are between 00313 and 00473 USDkWh as listed in Table 13 These values are aligned
with the values provided by international institutions cited although they appear to be
somewhat inflated in comparison with those values that are closer to 0025 and 0035
USDkWh as published by others (eg IRENA)
4633 AETA 2013 OampM COSTS UPDATE
Similar Plant characteristics to AETA 2012 were considered for the appropriate comparison
of OampM costs for this update Plant characteristics include location net capacity capacity
factor hours of TES and type of cooling For this Report the characteristics of the reference
plants used are described in Table 14
Table 14 PT and ST Reference Plant Characteristics
Plant
characteristics
Units Parabolic
Trough without
Storage
Parabolic
Trough with
Storage
Solar Tower
without
Storage
Solar Tower
with Storage
Plant Net Capacity MW 100 100 100 100
Location NA MENA region MENA region MENA region MENA region
Isolation kWhm2year 2400 2400 2400 2400
Hours of TES h 0 6 0 6
Capacity Factor per cent 26 46 275 476
Type of Cooling NA Dry Dry Dry Dry
Source NA WorleyParsons CSP Today 2012a WorleyParsons CSP Today 2012b
The 2013 OampM costs were estimated using as a basis the information provided in the CSP
2012 reports (CSP 2012a and 2012 b) The following considerations were taken into account
the CSP Today reports only consider PT and ST plants with thermal storage
WorleyParsons made the following estimates based on experience with solar and
conventional power plants based on PT and ST technologies without TES
estimated the capacity factor based on plant capacity location and type of cooling
adjusted the insurance material and maintenance and labour costs based on the
solar field reduction factor when applicable
adjusted the steam turbine maintenance based on the potential hours of operation
48
adjusted the plant electricity and water consumption based on the total net
production
assumed similar auxiliary fuel consumption for the plant with and without TES This
assumption is due to the reference plants being based in the same location thus
requiring similar auxiliary fuel consumption for start-up Minimal differences in
auxiliary fuel consumption for freeze protection due to increased time offline for a
plant without TES system compared to a plant with TES are expected but not
considered in this Report as the impact would be minor
the capacity factor provided by CSP Today for PT with thermal storage is considered
high Based on the plant location and capacity WorleyParsons would anticipate the
capacity factor to be closer to 42 per cent instead of 46 per cent as indicated in Table
14 above This difference in capacity factor directly impacts the estimated VOM cost
which is correlated with plant production For comparison purposes the value provided
by CSP Today has maintained and
with respect to Linear Fresnel technology updated information has not been published
since the AETA 2012 report release by the references listed in Section 462 which
WorleyParsons consulted For the purpose of updating the estimates to 2013 it was
assumed that the evolution of the OampM costs would be similar to that of parabolic
trough plants and the same escalation factors were applied
The resulting 2013 and 2012 OampM costs are listed in Table 15 below for comparison
Table 15 2013 CSP OampM Costs Compared to 2012 OampM Costs
CSP Technology OampM Costs AETA 2012 WorleyParsons 2013 update
Parabolic Trough
without Storage
FOM $MWyear 60000 59176
VOM $MWh sent out 1500 1519
OPEX $kWh 00448 00412
Parabolic Trough with
Storage
FOM $MWyear 65000 72381
VOM $MWh sent out 2000 1139
OPEX $kWh 00377 00293
Solar Tower without
Storage
FOM $MWyear 70000 58285
VOM $MWh sent out 1500 707
OPEX $kWh 00408 00313
Solar Tower with
Storage
FOM $MWyear 60000 71372
VOM $MWh sent out 1500 565
OPEX $kWh 00313 00228
Linear Fresnel without
Storage
FOM $MWyear 65000 64107
VOM $MWh sent out 1500 1519
OPEX $kWh 00473 00434
49
CSP Technology OampM Costs AETA 2012 WorleyParsons 2013 update
Linear Fresnel with
Storage
FOM $MWyear 65000 72381
VOM $MWh sent out 2000 1139
OPEX $kWh 00377 00293
The total OPEX costs per year from the AETA 2012 report and the WorleyParsonsrsquo estimates
that were updated for 2013 are compared in Figure 6 below
Figure 6 Comparison of OPEX Costs per Total Annual Plant Production per Year AETA 2012
Report and 2013 Update
Reductions of approximately 20 - 27 per cent in OampM costs would be realised by CSP with
TES according to the updated 2013 WorleyParsons estimates compared to the same costs
reported in the AETA 2012 report However reductions for PT and LF without TES were
found to be lower at approximately 8 per cent
The IRENA reports (IRENA 2013b IRENA 2013c) provide values for OPEX between 0025
and 0035 USDkWh for PT and ST technologies with and without TES Values updated to
2013 by WorleyParsons are between 0023 and 00412 USDkWh for PT and ST
technologies which align with the IRENA values However IRENA does not differentiate
between the utilisation of TES Solar technologies without TES have fewer hours of
production and although OPEX costs are lower in terms of USDMW compared with solar
technologies with TES OPEX costs in terms of costs per total annual plant production per
year will typically be higher for technologies that do not use TES
4634 OampM CSP LEARNING RATES
Cost reductions on CSP technologies are expected to come from the following main actions
economies of scale in the plant size and manufacturing industry
learning impacts on design construction and operation phases
50
advances in RampD of the following factors
Components Solar receivers mirrors HTF storage media supporting structures
trackers and auxiliary systems
Systems Direct steam generation storage systems or hybrid cooling systems
Configurations Hybridisation or duel electricity water plants
a more competitive supply chain
improvements in the performance of the solar field solar-to-electric efficiency and
thermal energy storage systems
increases in the life of plants and
reduced financial costs
Based on the parameters listed above the LCOE from Solar Thermal technologies is likely to
be continuously decreasing and this is born out in the literature that has been reviewed Based
on the IRENA 2013b report the evolution of the LCOE from trough and power tower CSP
technologies shows how the LCOE is decreasing as technology development increases in
Table 16 below Estimates for LCOE for the hypothetical trough and tower CSP plants in
2014 are also included
51
Table 16 Estimated LCOE form Existing and Hypothetical Trough and Solar Tower CSP Technologies
CSP
Technology
Year Capacity
(MW)
Plant Name Location DNI
(kWhm2year)
LCOE 2012
$kWh Installed
Trough
1981 05 PSA Spain 2000 064
1983 138 SEGS I California 2700 039
1989 30 SEGS II ndash VIII California 2700 026
1992 80 SEGS VIII amp IX California 2700 020
2008 - 2009 50 Andasol 1 2 Spain 2000 035
2010 50 Solnova 1 amp 3 Spain 2000 034
2010 - 2011 50 Extresol 1 amp 2 Spain 2000 035
2014 250 Unspecified (wet
cooling no storage)
Not provided Not provided 020
Tower
1987 10 Solar One California 2700 058
2007 11 PS10 Spain 2000 034
2009 20 PS20 Spain 2000 036
2011 199 Gemasolar (wet
cooling 15hr
storage)
Spain 2000 033
2014 120 Unspecified
(dry cooling
storage)
Not Provided Not provided 015
International Institutions such as IRENA ESTELA or the World Bank agree that the LCOE
and capital cost reductions of 28 per cent to 60 per cent are envisioned by 2020 ndash 2025 for
such plant Estimates of possible LCOE reductions for CSP technology from 2012 to 2025
are provided in Figure 7 taken from Kearny (2010)
52
Figure 7 Expected LCOE Reductions for CSP Technology from 2012 to 2025
Source (Kearny 2010)
The OampM maintenance costs of modern CSP Plants are lower than those for Californian
SEGS Plants built in the 1980s and 1990s which has a total combined capacity of 354 MW
and estimated OampM costs of USD 004kWh (IRENA 2013b) However CSP experienced no
growth from early 1990s until the mid-2000s as can be seen in Table 16 above
As stated at the beginning of Section 462 Andasol 1 was the first 50 MWe parabolic trough
plant built after SEGS which included a thermal energy storage system It commenced
operation at the end of 2008 Podewils (2008) estimated Andasol 1 OampM costs of EUR
0072kWh or USD 0095kWh (considering 2012 medium rate exchange EURUSD of
07553) This value is high compared to OPEX estimations for PT with TES provided by
both this 2013 update and the AETA 2012 report (00293 and 00377 USDkWh
respectively) Therefore according to the information detailed above considerable learning
improvements to OampM costs have been already achieved from the commencement of
operation of Andasol 1 to the time of this Report
`WorleyParsonsrsquo estimations on the LCOE of parabolic trough plants is in the range of
USD 020kWh to USD 035kWh and that of solar towers between USD 017kWh and
USD 029kWh However in areas with excellent solar resources the range could be as low
as USD 014kWh to USD 018kWh
The following considerations have been taken into account for OampM cost learning rates
forecast
WorleyParsons LCOE estimations as set out above
Potential average envisaged LCOE reductions of 475 per cent by 2025 based on Figure
7 above
OPEX contribution on LCOE of 20 per cent and
53
assuming that all components involved in the LCOE (CAPEX OPEX and financial
expenses) reduce at the same rate so percentage contributions remain constant
According to these considerations WorleyParsons estimates that OPEX values by 2025 could
reach from 0021 to 0037 USDkWh for PT technology and from 0018 to 0031 USDkWh
for ST technology
Technological improvements have reduced the requirement of replacing mirrors and
receivers Automation has reduced the cost of other OampM procedures by as much 30 per
cent As a result of OampM procedure improvements (both cost and plant performance) the
total OampM costs of CSP plants in the long-term are likely to be below USD 0025kWh
(IRENA 2013b)
Parabolic trough system in the United States would have OampM costs of around USD 002 to
USD 003kWh meanwhile the OampM costs of parabolic trough and solar tower power plants
currently under construction in South Africa have estimated OampM costs of between USD
0029 and USD 0036kWh (also IRENA 2013b)
WorleyParsons estimations are in alignment with IRENA estimations in terms of current and
envisaged CSP OPEX costs
4635 CONCLUSIONS ndash CSP
The following main conclusions were made based on this study in relation to CSP
technologies
the 2013 WorleyParsons CSP OampM costs update resulted in values between 0023 and
0043 USDkWh based on 2012 USD
reductions in CSP OampM costs between 8 per cent and 27 per cent were obtained in
comparison to values provide in AETA 2012 report
the total OampM costs of CSP Plants in the long-term are likely to be below USD
0025kWh
the updated values for 2013 by WorleyParsons are in alignment with the values
provided by recognised international institutions and
at the time of this report the only CSP technology with substantial operation capacity
was PT Only three utility-scale ST plants were in operation at the time of this report
(PS-10 PS-20 and Gemasolar) of which only one (Gemasolar) uses TES Though
several process steam and small-scale LFR Plants are currently in operation only one
utility-scale LFR (Puerto Erradio 2) was in operation at the time of this report
47 AETA 2013 OampM Learning Rate recommendation
The learning rate used in AETA 2012 for OampM is applied to all technologies assessed and
includes fossil fuel technologies and emerging technologies The learning rate is set at an
improvement of 02 per cent per annum
In addition to the improvement rate OampM is escalated at a rate of 150 per cent of CPI per
year based on experience with increases in parts and labour costs
The CPI rate set in the model is 25 per cent per annum
54
OampM cost information in the public domain in both quantum and quality is poor for
contemporary data Information supporting OampM learning rates is equally poor There are
indications that emerging technologies do have the potential for increased OampM learning
rates relative to mature technologies
For the renewable energy technologies studied in this report onshore wind is considered
mature and it is recommended that the AETA 2012 report value of 02 per cent is maintained
For all other renewable energy technologies studied in this report a more aggressive learning
rate of 25 per cent is recommended This will effectively cancel out the CPI escalation
adjustment and provide a ldquoflat linerdquo OampM rate for future years This will provide a value in
line with the learning rate conclusions for PV
The learning rate for CSP is considered to have greater potential for reduction but due to the
high level of analysis in this report (and therefore uncertainty) it is proposed that a maximum
of two learning rates is appropriate for the AETA model
Table 17 AETA Learning Rate Comparison
AETA 2012 Learning Rate AETA 2013 update Learning Rate
Onshore Wind 02 per cent 02 per cent
Offshore Wind
PV ndash all technologies
CSP ndash all technologies
02 per cent 25 per cent
55
5 CHANGES TO THE LCOE
Changes to the model parameters described in the earlier sections have resulted in changes to
the LCOE estimates for a number of technologies The LCOE estimate values for all
technologies and associated range of uncertainty are shown in the Figures 8 to 13 below
Note that the values listed are for a base value carbon price modifier of zero per cent which
places no value on carbon emissions
For selected technologies where there are significant cost differences Figure 14 provides a
comparison of mid-range LCOE values for the AETA 2013 and AETA 2012 Models Key
features of the Figures 8 to 14 are as follows
both in AETA 2012 and 2013 Model update LCOE costs are provided for the years
2012 2020 2025 2030 2040 and 2050
cost ranges are provided for each technology that accounts for differences in fuel prices
and state-based variations
LCOE costs vary substantially across the technologies from $89MWh (combined cycle
gas turbine) to $351MWh (solar thermal linear fresnel) in 2012 and $73MWh (PV
non-tracking) to $247MWh (IGCC black coal CCS) in 2050
the inter-technology LCOE comparisons figures (Figures 8 to 13) reveal changes in
relative costs of technologies over time Key results include renewable technologies
have higher LCOEs than the lowest cost non-renewable technologies and the relative
LCOE rankings significantly change post 2030 The LCOE of solar PV become lower
than the non-renewables from mid 2030 onwards and
large changes in LCOE results between AETA 2013 Update and AETA 2012 are
depicted in Figures14 below Figure 14 compares LCOEs at 2050 between the AETA
2013 Update and AETA 2012 for a selected number of technologies that have changed
significantly for NSW (AETA developed LCOEs by each Australian state) Differences
in technology LCOEs are explained by a multiplicity of factors including the technical
developments OampM costs and learning rate changes
56
Figure 8 Updated LCOEs for AETA 2013 Model technologies values for 2012 (NSW) with carbon price set to zero
0
50
100
150
200
250
300
350
400
450
500
LCO
E ($
MW
h)
LCOE FOR 2012 TECHNOLOGIES (NSW) Note Default region is NSW except bown coal
technologies (VIC) and SWIS scale (as specified)
LCOE includes where relevant allowance for- Carbon Price- CO2 transport and sequestration cost- Plant capital cost (EPC basis) within battery limits- Owners costs excluding interest during construction- Fixed and variable operating costs- Fuel costs- Economic escalation factors
57
Figure 9 Updated LCOEs for AETA 2013 Model technologies values for 2020 (NSW) with carbon price set to zero
0
50
100
150
200
250
300
350
400
450
LCO
E ($
MW
h)
LCOE FOR 2020 TECHNOLOGIES (NSW) Note Default region is NSW except bown coal
technologies (VIC) and SWIS scale (as specified)
LCOE includes where relevant allowance for- Carbon Price- CO2 transport and sequestration cost- Plant capital cost (EPC basis) within battery limits- Owners costs excluding interest during construction- Fixed and variable operating costs- Fuel costs- Economic escalation factors
58
Figure 10 Updated LCOEs for AETA 2013 Model technologies values for 2025 (NSW) with carbon price set to zero
0
50
100
150
200
250
300
350
400
LCO
E ($
MW
h)
LCOE FOR 2025 TECHNOLOGIES (NSW) Note Default region is NSW except bown coal
technologies (VIC) and SWIS scale (as specified)
LCOE includes where relevant allowance for- Carbon Price- CO2 transport and sequestration cost- Plant capital cost (EPC basis) within battery limits- Owners costs excluding interest during construction- Fixed and variable operating costs- Fuel costs- Economic escalation factors
59
Figure 11 Updated LCOEs for AETA 2013 Model technologies values for 2030 (NSW) with carbon price set to zero
0
50
100
150
200
250
300
350
400
LCO
E ($
MW
h)
LCOE FOR 2030 TECHNOLOGIES (NSW) Note Default region is NSW except bown coal
technologies (VIC) and SWIS scale (as specified)
LCOE includes where relevant allowance for- Carbon Price- CO2 transport and sequestration cost- Plant capital cost (EPC basis) within battery limits- Owners costs excluding interest during construction- Fixed and variable operating costs- Fuel costs- Economic escalation factors
60
Figure 12 Updated LCOEs for AETA 2013 Model technologies values for 2040 (NSW) with carbon price set to zero
0
50
100
150
200
250
300
350
400
LCO
E ($
MW
h)
LCOE FOR 2040 TECHNOLOGIES (NSW) Note Default region is NSW except bown coal
technologies (VIC) and SWIS scale (as specified)
LCOE includes where relevant allowance for- Carbon Price- CO2 transport and sequestration cost- Plant capital cost (EPC basis) within battery limits- Owners costs excluding interest during construction- Fixed and variable operating costs- Fuel costs- Economic escalation factors
61
Figure 13 Updated LCOEs for AETA 2013 Model technologies values for 2050 (NSW) with carbon price set to zero
0
50
100
150
200
250
300
350
400
LCO
E ($
MW
h)
LCOE FOR 2050 TECHNOLOGIES (NSW)
LCOE includes where relevant allowance for- Carbon Price- CO2 transport and sequestration cost- Plant capital cost (EPC basis) within battery limits- Owners costs excluding interest during construction- Fixed and variable operating costs- Fuel costs- Economic escalation factors
Note Default region is NSW except bown coal
technologies (VIC) and SWIS scale (as specified)
62
Figure 14 Comparison of AETA 2013 Model and AETA 2012 Model LCOE estimates selected technologies 2050
0
50
100
150
200
250
AETA 2012
AETA 2013
63
51 Conclusions
The Australian Energy Technology Assessment (AETA 2012) provided the best available and most up-to-
date cost estimates for 40 electricity generation technologies under Australian conditions To ensure that
the cost estimates for the various technologies are consistent all common input costs (eg labour
materials components carbon price) were itemised To ensure that the AETA costings remain up to date
AETA costs are reviewed in this AETA 2013 Model Update report
The AETA 2013 refresh was developed in close consultation with a stakeholder reference group drawn
from industry and researchacademic organisations with interests and expertise in a diverse range of
electricity generation technologies
The AETA 2013 Model results reflect the change to exclude the value of a carbon price in the Levelised
Cost of Energy (LCOE) All technologies have experienced a minor reduction in LCOE relative to 2012
(offset in some cases by other factors) due to the change to an amortisation period of 30 years plus the
construction period
Comparing the 2012 AETA results without a carbon price to the 2013 results without a carbon price there
are significant reductions in the LCOE of solar technologies and onshore wind This is as a consequence of
changes to the fixed and variable Operations and Maintenance (OampM) costs for these technologies For the
solar technologies the adjustment of the capital learning rate to 25 per cent has also contributed to the
LCOE reduction Offshore wind also has an increased learning rate but this has been offset to a large extent
by increased variable OampM costs
Nuclear LCOE has increased significantly due to higher estimates for capital costs
Efficiency for coal fired plants with CCS retrofits has been revised downwards to better reflect the expected
efficiency of these plants and has the effect of increasing the LCOE
64
REFERENCES
Albers A 2009 OampM Cost Modeling Technical Losses and Associated Uncertainties Proceedings of the
2009 European Wind Energy Conference Marseilles France March
AWEA (American Wind Energy Association) 2013 AWEA US Wind Industry Annual Report ndash Year
Ending 2012 USA
BNEF (Bloomberg New Energy Finance) 2013 Operations and Maintenance (OampM) Price Index Issue II
Wind Research Note April
BREE (Bureau of Resources and Energy Economics) 2012 AETA Report and Model Version 1_0 2012
Australian httpwwwbreegovau
CEC (Clean Energy Council) 2013 Australian Energy Technology Assessment 2013 Review Letter to
BREE of 20 May 2013 from the Clean Energy Council (Mr Russel Marsh signatory for the CEC)
CEC (Clean Energy Council) 2013 Clean Energy Council Renewable Energy Map Australia June (data
noted as current as of 21 August 2012)
httpwwwcleanenergycouncilorgauresourcecentreplantregistermaphtml
Crown Estate 2012 Offshore Wind Cost Reduction Pathways Study United Kingdom May
CSP 2012a CSP Parabolic Trough Report Cost Performance and Key Trends CSP Today
CSP 2012b CSP Solar Tower Report Cost Performance and Key Trends CSP Today
Deloitte amp Touche 2012 European Wind Services Study Find Out Which Way the Wind Blows Deloitte amp
Touche GmbH Wirtschaftspruumlfungsgesellschaft August
Deloitte 2011 Economics of wind development in New Zealand Deloitte for the for the New Zealand Wind
Energy Association
Ebert P amp Ware J 2013 The Role of Independents in the Wind Farm Operations amp Maintenance
Proceedings of the 2013 New Zealand Wind Energy Conference and Exhibition March
EPRI (Electric Power Research Institute) 2010 Engineering and Economic Evaluation of Central-Station
Solar Photovoltaic Power Plants USA March
GlobalData 2012 Wind Operations amp Maintenance (OampM) Market ndash Global Market Size Share by
Component Competitive Landscape and Key Country Analysis to 2020 GlobalData reference code
GDAE1054MAR January
Hand M 2013 Wind Plant Cost of Energy Proceedings of the 2nd NREL Wind Energy System
Engineering Workshop January
Hassan G 2011 Review of the Australian Wind Energy Industry Clean Energy Council Australia 2011
Houston C 2013 The Real Truth About Wind Farm OampM Costs North American WindPower March
IEA (International Energy Agency) 2008 Technology Roadmap Solar photovoltaic energy France
httpwwwieaorgpublicationsfreepublicationspublicationpv_roadmappdf
IRENA (International Renewable Energy Agency) 2013a Solar Photovoltaics Technology Brief Germany
January httpwwwirenaorgDocumentDownloadsPublicationsIRENA-ETSAPper
cent20Techper cent 20Briefper cent20E11per cent20Solarper cent20PVpdf
65
IRENA (International Renewable Energy Agency) 2013b Concentrating Solar Power Technology Brief
Germany January
IRENA (International Renewable Energy Agency) 2013c Renewable Power Generation Costs in 2012 An
Overview Germany
IT Power 2013 Analysis of the AETA 2012 cost estimates of CSP technologies Clean Energy Council
submission to the Bureau of Resources and Energy Economics May
Kann S 2012 US Solar Market Insight Report Q3 California USA
Kearny A 2010 Solar Thermal Electricity 2025 ndash clean electricity on demand attractive STE costs
stabilize energy production ATKearny consultants Dusseldorf Germany
Muirhead J 2013 SEGS experience suggests that CSP will age gracefully CSP Today South Africa
httpsocialcsptodaycommarketssegs-experience-suggests-csp-will-age-
gracefullysthash6VkxFaD0dpuf
NREL (National Renewable Energy Laboratories) 2011 IEA Wind Task 26 ndash Multi-national Case Study of
the Financial Cost of Wind Energy Technical Report NRELTP-6A2-48-48155 March
NREL (National Renewable Energy Laboratories) 2012 Cost and Performance Data for Power Generation
Technologies USA February
NREL (National Renewable Energy Laboratories) 2013 Breakeven Prices for Photovoltaics on
Supermarkets in the United States March httpwwwnrelgovdocsfy13osti57276pdf
NREL (National Renewable Energy Laboratories) 2013 Breakeven Prices for Photovoltaics on
Supermarkets in the United States USA March httpwwwnrelgovdocsfy13osti57276pdf
Photon 2012 The True Cost of Solar Power 2012 Temple of Doom Solar Power in Focus Series Photon
Consulting
Photon 2013 Solar Annual 2013 Build Your Empire Photon Consulting
Podewils C 2008 Photovoltaic vs Solar Thermal where PV has the upper hand and where solar thermal
strikes back Photon International Germany November
Poore R and Walford C 2008 Development of an Operations and Maintenance Cost Model to Identify
Cost of Energy Savings for Low Wind Speed Turbines Report NRELSR-500-40581 National
Renewable Energy Laboratory January
RolandBerger 2013 Offshore Wind Towards 2020 On the Pathway to Cost Competitiveness RolandBerger
Consultants Germany April
See wwwcsptodaycom
See wwwepiaorg
See wwwestelasolarde
See wwwidaees
See wwwieaorg
See wwwirenaorg
See wwwnrelgov
See wwwprotermosolares
66
See wwwrenoveteces
See wwwseiaorgau
See wwwsolarelectricpowerorg
See wwwworldbankorg
UK Crown Estate 2012 Offshore Wind Cost reduction Study May
US DoE (Department of Energy) 2013 Award Number DE-EE0005360 USA February
Wiser R Lantz E Bolinger M amp Hand M 2012 Recent Developments in the Levelized Cost of Energy
from US Wind Power Projects Contract No DE-AC02-05CH11231 National Renewable Energy
Laboratories February
67
Appendix A
Electricity Generation Technologies in AETA 2012 Report and Model
The 40 AETA electricity generation technologies are
1 Integrated Gasification and Combined Cycle (IGCC) plant based on brown coal
2 IGCC plant with Carbon Capture and Sequestration (CCS) based on brown coal
3 IGCC plant based on bituminous coal
4 IGCC plant with CCS based on bituminous coal
5 Direct injection coal engine (clean lignite eg brown coal technology)
6 Pulverised coal supercritical plant based on brown coal
7 Pulverised coal supercritical plant with post combustion CCS based on brown coal
8 Pulverised coal subcritical plant with post combustion CCS based on brown coal (retrofit)
9 Pulverised coal supercritical plant based on bituminous coal
10 Pulverised coal supercritical plant based on bituminous coal - SWIS relevant scale
11 Pulverised coal supercritical plant with CCS based on bituminous coal
12 Pulverised coal subcritical plant with post combustion CCS based on bituminous coal (retrofit)
13 Adding CCS to existing Combined Cycle Gas Turbine (CCGT) power plants (retrofitting)
14 Oxy combustion pulverised coal supercritical plant based on bituminous coal
15 Oxy combustion pulverised coal supercritical plant with CCS based on bituminous coal
16 Combined cycle plant burning natural gas
17 Combined cycle plant burning natural gas - SWIS relevant scale
18 Combined cycle plant with post combustion CCS
19 Open cycle plant burning natural gas
20 Solar thermal plant using compact linear fresnal reflector technology wo storage
21 Solar thermal plant using parabolic trough technology wo storage
22 Solar thermal plant using parabolic trough technology with storage
23 Solar thermal plant using compact linear fresnal reflector technology with storage
24 Solar thermal plant using central receiver technology wo storage
25 Solar thermal plant using central receiver technology with storage
26 Solar photovoltaic (PV) - non-tracking
27 Solar photovoltaic (PV) - single axis tracking
28 Solar photovoltaic (PV) - dual axis tracking
29 Wind (on-shore)
30 Wind (off-shore)
31 WaveOcean
68
32 Geothermal - hot sedimentary aquifer (HSA)
33 Geothermal - enhances geothermal system (EGS)
34 Landfill gas power plant
35 Sugar cane waste power plant
36 Other biomass waste power plant (eg wood)
37 Nuclear Gen 3+
38 Nuclear Small Modular Reactors (SMR)
39 Solarcoal hybrid
40 Integrated solar combined cycle (ISCS) ndash parabolic trough with combined cycle gas
69
Appendix B
Consultations with Stakeholders
This study has been undertaken in close consultation with a Stakeholder Reference Group drawn from
Australian industry and domestic as well as overseas researchacademic organisations with interests and
expertise in a diverse range of electricity generation technologies These stakeholders were invited to
provide evidence of the latest estimates for the costs and performance of various technologies
In addition the AETA project also had a Project Steering Committee comprising staff from BREE
AEMO CSIRO and other independent experts to provide technical advice and support The following
agencies participated in the stakeholder reference group meetings or were forwarded the documents
presented at the meetings
AETA Stakeholder Reference Group
Australian Coal Association
Australian Energy Market Operator
Australian Geothermal Energy Association
Australian National Low Emissions Coal RampD
Australian National University
Australian Renewable Energy Agency
Australian Solar Thermal Energy Association
Australian Sugar Milling Council
Australian Treasury
Bureau of Resources and Energy Economics
Clean Energy Council
CSIRO
Department of Industry
Economic Research Institute for ASEAN and East Asia
Energy Retailers Association of Australia
Energy Users Association of Australia
Evans and Peck
Ferrostaal
Global CCS Institute
Grid Australia
Intergen
International Energy Agency France
International Power Suez
IRENA Innovation and Technology Centre Germany
70
National Generators Forum
Oceanlinx Limited
Origin Energy
Private Generators Group
The Institute of Energy Economics Japan
The Energy Research Institute New Delhi
University of Melbourne Energy Institute
University of Queensland Energy Initiative
UQ Energy Economics amp Management Group
Wyldgroup
WorleyParsons
Two AETA Stakeholders Reference Group meetings took place on 30 April 2013 and 17 July 2013 In
addition the AETA Project Steering Committee met on 24 June 2013
71
BREE contacts Executive Director BREE Bruce Wilson brucewilsonretgovau
(02) 6243 7901
Deputy Executive Director Wayne Calder waynecalderbreegovau
(02) 6243 7718
Modelling amp Policy Integration Arif Syed arifsyedbreegovau
Program Leader (02) 6243 7504
Data Statistics Geoff Armitage geoffarmitagebreegovau
Program Leader (02) 6243 7510
Energy and Quantitative Analysis Allison Ball allisonballbreegovau
Program Leader (02) 6243 7539
Resources ndash Program Leader John Barber johnbarberbreegovau
(02) 6243 7988
72

13
122 Technical assumptions
all technologies were costed on a consistent and transparent basis with itemisation of
component costs
capital costs included direct (eg engineering procurement and construction) and
indirect (eg owners) costs but exclude transmission and decommissioning costs
future cost estimates included assumptions about the exchange rate productivity
variation commodity variation and technology improvements
fuel cost estimates were based on ACIL Tasman projections and
projected growth rates for future operating and maintenance costs were provided
123 Levelised cost of energy (LCOE)
LCOE can be interpreted as the long-run marginal cost of electricity generation Key
factors used to calculate LCOE by technology include amortisation period discount rate
capacity factor CO2 emissions factor CO2 capture rate emissions price CO2 storage cost
fuel cost variable and fixed OampM cost and the capital cost
LCOE is a key comparative cost indicator across technologies that is expressed in real
Australian dollars per Megawatt hour of electricity generation ($MWh) The LCOE is the
price at which electricity must be generated from a specific plant to break even taking into
account the costs incurred over the life of the plant (capital cost cost of capitalfinancing
operations and maintenance costs cost of fuel emissions price if applicable and CO2
sequestration) While LCOE is an invaluable tool for comparing technology costs power
generation companies andor investors who wish to choose a technology to deploy would
also need to consider other criteria such as site-specific costs technology performance
characteristics and experience with the technology prior to any final investment decision
AETA cost estimates are developed to provide design basis and plant characteristics
performance parameters capital cost estimates fuel cost estimates OampM cost estimates
and LCOE estimates
Regional impacts on capital and operating costs have been incorporated in the analysis
These regions include Victoria New South Wales (including ACT) South Queensland
(incorporating the South East Queensland and Central Queensland AEMO regions) North
Queensland (incorporating the North Queensland AEMO region) Northern Territory
North WA (Pilbara region) South WA (the South West Interconnected System region)
South Australia and Tasmania
13 Methodology of the AETA 2013 Model Update
As part of the AETA 2013 Model Update BREE invited submissions from the AETA
Steering Committee and the Stakeholder Reference Group to provide commentary and
recommendations on the AETA 2012 Report and Model Eight written submissions were
received in this regard Changes were only recommended where specific substantiated
changes were received The AETA 2013 model has been updated in accordance with the
above consultations and under the same macro economic and technical assumptions as in
AETA 2012 The AETA 2013 model is freely available on request from BREE
(infobreegovau)
Within this context this report provides updated costs based on
14
relevant Australian and international reports on generation technologies that have been
published since AETA 2012 or have been newly discovered
new public domain information
new information from private sources that could be obtained
in-house experience of WorleyParsons and
input on OampM costs and learning rates from a number of industry stakeholders
This AETA 2013 Model Update report provides supporting explanations and references and
justifies amendments to the cost parameters of technologies especially the OampM costs for
wind and solar technologies that were covered in AETA 2012 model
131 Caveats on the use of LCOE
LCOE provides a generalised cost estimate and does not account for site specific factors
that would be encountered when constructing an actual power plant As a result the costs
associated with integrating a particular technology in a specific location to a specific
electricity network are not considered
Projected LCOE does not necessarily provide a reliable indicator of the relative market
value of generation technologies because of differences in the role of technologies in a
wholesale electricity market For example projected LCOE does not provide a direct
indicator of electricity demand or generation in isolation with other emissions abatement
policies Similarly many technologies involve integration costs in addition to the LCOE to
be able to reliably supply to the system The value of variable (or intermittent) power plants
(such as wind and solar) will depend upon the extent to which such plants generate
electricity during peak periods and the impact these plants have on the reliability of the
electricity system Unlike dispatchable power plants (such as coal natural gas biomass
and hydroelectric) ndash which are reliant on some form of stored energy (eg fuels water
storage or battery storage) ndash wind and photovoltaic power plants do not typically include
energy storage Dispatchable plants such as coal or gas fired plants may involve negative
externalities (environment fuel disposal or insurance costs etc) which are not always
reflected in their LCOEs
The AETA LCOEs are restricted to only utility-scale or large scale technologies
Consequently small-scale technologies (eg small roof-top photovoltaics fuel cells co-
generation and trigeneration) that may be relevant to distributed generation were not
included in the AETA 2012 analysis LCOE cost estimates associated with distributed
photovoltaics are likely to differ substantially from utility-scale photovoltaic systems as a
result of differences in component costs (eg capital costs operating and maintenance
costs) and performance characteristics (eg capacity factor)
132 Organisation of the report
This report is organised in five sections After a brief introduction and purpose of the report
in this section section 2 discusses the changes made to the AETA 2013 Model parameters as
a result of the discussions with Stakeholders and Steering Committee members on the
individual issues and technologies Section 3 presents the issues that were considered but did
not result in the AETA Model parameter changes Section 4 presents in detail the OampM cost
15
changes for wind and solar technologies covered in AETA 2012 Updated LCOE graphs as
well as a comparison of the resultant AETA 2013 Model and AETA 2012 Model LCOEs are
presented in section 5 which also presents concluding comments
16
2 AETA MODEL PARAMETER CHANGES
21 Stakeholder Initiated Changes
Consultations for the AETA 2013 Model update identified the following issues for
consideration
nuclear technology capital costs and lsquofirst year available for constructionrsquo
CCS retrofit thermal efficiency
amortisation period for all technologies and
OampM costs
The OampM issue is discussed in section 4 whereas rest of the issues are discussed below
211 Nuclear Capital Costs
The AETA 2012 report and model presents costs for first of a kind (FOAK) and Nth of a kind
(NOAK) nuclear technologies There could have been some confusion from the original
wording of Section 310 of AETA 2012 report It starts by discussing Gen III plants currently
sold (presumably NOAK) however further in the document Gen III plants are referred to as
FOAK The AETA 2012 report states that the capital costs are based on nuclear power plants
in the US The NOAK value is what is represented in Table 3101 in the AETA 2012 report
and model
Although there are cost adjusting factors used for other technologies studied in the AETA
2012 report there is no adjustment of the US cost base for Australian labour costs and for
adjustment of Australian equipment costs Submissions indicated that an adjustment to costs
should also be used for nuclear to ensure there is commonality in the comparison
This suggestion was considered appropriate and adjustment to the costs for nuclear
technologies was made Based on the factors to convert US rates to Australian rates used in
the fossil fuel technologies ie the factors from the Thermoflow software the new nuclear
capital costs were calculated The multiplier from Thermoflow for labour costs is 205 and
the factor for equipment costs is 13 both US to Australia
Additionally it was submitted that the first year available for construction of nuclear
technologies be extended In support of this the submission argued that nuclear technologies
are examples of generation technology where legislation regulation and public policy
planning is highly region-dependent and must therefore precede deployment by several years
This was considered an appropriate submission and therefore the first year available for
construction in the model has been changed from 2012 to 2020 These changes are shown in
Table 1
17
Table 1 Model Changes Nuclear Technologies
AETA 2012 report reference AETA 2012 model value AETA 2013 update
Technology 37 Nuclear (GW Scale LWR)
Change first year available for Construction
2012
2020
Technology 37 Nuclear (GW Scale LWR)
Convert FOAK Capital Cost to Australian productivity
and commodity costs
4210
6392
Technology 37 Nuclear (GW Scale LWR)
Convert NOAK Capital Cost to Australian productivity
and commodity costs
3470
5268
Technology 38 Nuclear (SMR)
Convert FOAK Capital Cost to Australian productivity
and commodity costs
7908
11778
Technology 38 Nuclear (SMR)
Convert NOAK Capital Cost to Australian productivity
and commodity costs
4778
7116
The overall impact of these parameters on individual technology LCOE changes is given in
the AETA 2013 Model and in Section 5
212 Carbon Capture and Storage (CCS) Retrofit Thermal Efficiency
Subcritical coal technologies with CCS retrofit were reported to have only slightly lower
thermal efficiency values compared with new build supercritical technologies with CCS in
the AETA 2012 Model This was an oversight in the AETA 2012 Model
The AETA 2012 report identified the thermal efficiency to retrofit subcritical brown and
black coal plants as 216 per cent and 301 per cent respectively (Table 312) In the same
table the efficiency for new build supercritical brown and black coal plants is reported to be
208 per cent and 314 per cent respectively
The thermal efficiencies were revised down based on actual operating efficiencies of existing
coal facilities in Victoria and NSW and factored based on the thermal efficiency ratio of new
coal facilities with and without CCS
A reduction in thermal efficiency is to be expected when applying a retrofit CCS to the plant
The CCS factor in the following representation refers the efficiency reduction factors for
adding CCS to a coal fired power station The useful output will reduce from the new
parasitic loads to run the CCS equipment
Thermal efficiency of existing brown coal plant in Victoria is 265 per cent and the CCS
factor is 064 Similarly the thermal efficiency of existing bituminous coal plant in NSW is
355 per cent and the CCS factor is 075
Table 311 and 312 of the AETA 2012 report show a reduction is present when comparing
the supercritical with no CCS compared to supercritical with CCS However the retrofit case
was only provided for the subcritical technology only and no case was included in the AETA
2012 for a subcritical plant with any CCS
A review of the values in Table 312 through comparison to the existing efficiency of
installed black and brown coal fleet in Australia was undertaken For brown coal the current
18
sent out thermal efficiency is 265 per cent for a 500 MW subcritical unit For supercritical
brown coal without CCS the sent out efficiency is 323 per cent Applying the same reduction
factor the thermal efficiency with CCS retrofitted should be 17 per cent in lieu of 216 per
cent as published in AETA 2012 report
For black coal the current sent out thermal efficiency is 355 per cent for a 660 MW
subcritical unit For supercritical black coal without CCS the sent out efficiency is 419 per
cent Applying the same reduction factor the thermal efficiency with CCS retrofitted should
be 266 per cent in lieu of 301 per cent as published AETA 2012 report (Table 2)
Table 2 Model Changes CCS Retrofit Thermal Technologies
AETA 2012 report reference AETA 2012 model value AETA 2013 update
Technology 8 Pulverised coal subcritical plant
with post combustion CCS based on brown coal
(retrofit)
Thermal Efficiency
216
170
Technology 12 Pulverised coal subcritical plant
with post combustion CCS based on bituminous
coal (retrofit)
Thermal Efficiency
301
266
19
213 Amortisation period
There was stakeholder consensus that the operating period for all technologies needs to be set
to thirty years and that the construction time is in addition to the operating time The financial
amortisation period is common for all technologies and is set at 30 years In the AETA 2012
model section 24 (a) nominates that the amortisation period of 30 years is from the
commencement of construction The amortisation period has now been changed (Table 3)
Examples of the change are
Nuclear LWR ndash GW scale In AETA 2012 report amortisation period was 30 years inclusive
of construction and operation The amortisation period has now changed to 36 years (30
operating and 6 years construction)
Solar parabolic trough In AETA 2012 report amortisation period was 30 years inclusive of
construction and operation The amortisation period has now changed to 33 years (30
operating and 3 years construction)
Table 3 Model Changes amortisation period
AETA 2012 report reference AETA 2012 model value AETA 2013 update
Common Amortisation period
for construction and operation
Amortisation period for
operation includes
construction for all
technologies
Amortisation period for
operation to exclude
construction for all
technologies
22 No Carbon Pricing
For the 2013 AETA update the carbon price modifier has been set to zero per cent as the
base value for the results presented in this report with the effect of applying a zero carbon
price to all technologies throughout the study period to 2050 The AETA 2013 Model
however has the option of changing this parameter by the user
20
3 CONSIDERATION OF OTHER ISSUES
This section summarises the issues that were discussed during the AETA 2013 Model Update
with AETA stakeholders but have not led to a change in the model However these issues do
not cover the OampM costs considerations that are detailed in section 4
31 Representation of Uncertainty
The recognition of uncertainty within the model was discussed including both the level of
representation and potential uncertainties with respect to First-of-a-Kind and lsquoEarly Moverrsquo
Technologies
A number of factors were identified that lead to uncertainty in estimates ndash particularly for
emerging technologies For conventional coal and gas technologies even though the
technology is mature the addition of carbon capture introduces cost and performance
uncertainty Cost estimates have inherent uncertainty due to the market uncertainties and
unforeseeable technological developments and due to
- Volatility in equipment pricing
- Volatility in economic conditions (during post Global Financial Crisis) and
- Volatility in labour pricing due to ldquootherrdquo heavy construction projects in specific areas
For technologies where the costs are well understood it was considered that the error bars
should be reduced compared to immediate and emerging technologies and that the error bars
should be lower for technology costs in 2012 compared to later years
There is strong agreement from two key stakeholder submissions with all the factors causing
uncertainty that have been identified in AETA 2012 In particular the labour cost has varied
(increased) significantly due to large construction projects which have increased costs due to
a shortage of labour and a lower productivity due to less experienced personnel The
uncertainties provided in the AETA model are available on a per technology and a per
selected years basis BREE will consider whether or not to include more detail on
uncertainty by technology in the 2014 review of the model
32 Application of Learning Curves
It was raised during the consultation process that the AETA model revision could allow for
learning curve cost reduction assumptions to be altered by the end user This has not been
incorporated in the 2013 update as it is a structural change to the AETA Model
Stakeholders also raised the question as to whether it is possible within the application of
learning curves to distinguish between the potential for cost reductions on manufactured
components like PV panels versus the Balance of Project (BoP) costs which may involve
routine assembly and erection activities which are not subject to significant learning by
doing
However there are opportunities for cost reductions particularly where many repetitive tasks
are involved such as solar field construction modular construction techniques
rationalization of components in the BoP design or reduction in assembly or placement time
21
This is supported in the US Solar Market Insight Report 2012 (Kann 2012) which identified
continued savings in inverter and racking costs as follows
ldquohellip falling equipment costs and fine-tuning of installation practices have made large-
scale solar less expensive QQrdquo
ldquohellip with the continuing maturation of the industry we expect continued focus on
reducing PV balance-of-systems costs (BOS) and that the increased worry over high
penetration PV will drive adoption of 1000Vdc and advanced inverters
respectivelyrdquo and
ldquoMounting structure manufacturers noted that the past year has seen tremendous
pricing pressure accounting for price declines of anywhere between 10 per cent and
30 per cent over the past yearrdquo
Given that the balance of plant costs can also be subject to cost reductions it is not
considered necessary to distinguish learning curves for discrete project costs in the model
33 General Costs Considerations
331 Fuel Costs
The outlook for fuel costs for gas coal and carbon was claimed to have materially shifted
since the AETA 2012 model While there was no evidence provided to support this
consideration will be given to this issue in the 2014 model update
332 CCS Costs
A submission cited the ZeroGen Case Study and sought to clarify the differences in CCS
cost between ZeroGen and lower values estimated for AETA 2012 This is a valid
comparison however BREE notes the following issues which contribute to explaining the
differences The international cost component is as follows AETA 52 per cent ZeroGen 34
per cent With the USD exchange rate AETA 1 ZeroGen at 08 adjusting the AETA value
for exchange rate variation would add A$952kWnet to the AETA value There is a
difference in plant size with AETA at 557 MW net and Zerogen 400 MW net A bigger plant
size would typically provide a lower cost kW installed
Additionally section 112 of Chapter One of the ZeroGen report advises escalation based on
project delivery from 2011 to 2017 AETA costs are for 2012 basis and do not include
escalation beyond this time A portion of the Zerogen costs will be inflated over the
comparable AETA cost Also section 113 of Chapter One of the ZeroGen report identifies
significant enabling works This is likely to be more inclusive than considered in the AETA
2012 report as identified in section 23 (a)
Overall it is considered likely that a number of estimate basis items in the ZeroGen study are
different and once equalised will show a smaller difference between the AETA and
ZeroGen values Therefore there is no immediate action but the basis and assumptions of the
model may be reviewed during 2014 AETA update
With regard to CCS efficiency one submission proposed that the AETA estimates were
overly optimistic However no references were cited to support this view and no change has
been made to the model
22
333 Opportunity Costs
A submission was made that footnotes be included regarding retrofit costs to indicate that
make-up power costs are not included This was not adopted because AETA parameters for
each technology are calculated for that technology alone and do not consider the impact of
reduced output of a retrofit project where additional output needs to be generated from
alternate higher cost generation Opportunity costs are specifically related to business cases
for specific projects and are not considered for any cases presented in the AETA report
Moreover retrofitting does not make electricity generation uncertain or intermittent It only
lowers the flow of generation at a constant rate (due to lower thermal efficiency) relative to
the non-retrofit case
34 Capital and Construction Costs
A submission was made to update the AETA values for the mid-point capital cost for several
technologies based on a study provided in support of the submission The technologies
asserted were
IGCC (Integrated Gasification and Combined Cycle) with 90 per cent capture fuelled
with Victorian brown coal
IGCC with no capture fuelled with black coal
IGCC with 90 per cent capture fuelled with black coal
Pulverised Fuel power plant with 90 per cent capture fuelled with Victorian brown
coal
Pulverised Fuel power plant with 90 per cent capture fuelled with black coal and
OCGT with no capture fuelled with natural gas
There is a key difference in the magnitude of the labour component in Australia compared
with the labour costs associated with the supporting material (from the USA) While no
changes have been made to the model in this update the ldquoshort termrdquo impact of labour
pricing on technology costs may be considered in further updates
Similarly it was submitted that the capital cost values for combined Cycle Gas Turbine
(CCGT) (with and without capture) could be revised As no documentary evidence was
provided to support this no change was made
For Direct Injection Coal Emulsion (DICE) power plant with no capture fuelled with
Victorian brown coal it is also suggested that the values be reviewed with a number of
papers provided for reference However these papers do not address capital cost in any depth
and it is unclear if the balance of project costs included are comparable with AETA DICE
technology is not mature and is probably best described as in the demonstration to
deployment phase of development which brings uncertainty into the cost analysis Therefore
data is needed to substantiate this submission As this was not available at the time of
preparing this report consideration of this issue is deferred to a later time when the necessary
data is available
An increase in the capital costs for Solar thermal trough (6 hrs storage) and Solar thermal
central receiver (6 hours storage) were proposed based on a supporting study by the Electric
Power Research institute (EPRI) The proposed values are substantially larger than the AETA
23
2012 but it is not clear what basis is used to generate these revised values A separate
submission received from another AETA stakeholder has supported the AETA values
Additionally the cited reference for solar thermal trough the Energy Power Research
Institute (EPRI) plant configuration is based on air cooling ndash while for AETA the plant
configuration assumes water cooling The difference in plant configuration will account for a
small part of the difference The AETA value is based on a reference report as issued in 2012
by the US National Renewable Energy Laboratory (NREL 2012)
The AETA value for the central receiver technology is based on a small (20MW) plant
(Gemasolar) with factors for adjustment to field size for thermal storage capacity and post
FOAK learning These factors will align with increased uncertainty in the AETA value It is
likely that additional cost information may now be available for the Brightsource Ivanpah
plant (no storage) and other tower plants being considered under construction
Further investigation of these issues has been sought with stakeholders but is as yet
unavailable
Another suggestion was made to consider capital costs on a component basis The capital
costs used in AETA 2012 for existing technologies were based on actual costs that could be
sourced on published documents (locally andor internationally) or from WorleyParsons
internal data For developing technologies costs were not considered on a component level
For this reason in technologies that are not commercialised a number of assumptions would
need to be made which may limit lsquorealrsquo costs being available No change to the model arose
from this submission
A reassessment of the construction expenditure profile for concentrating solar power (CSP)
technology options was sought in another stakeholder submission and supported by a
referenced report (IT Power 2012) However the plant sizes considered in the AETA report
are larger capacity (100 MW+) than those discussed in the cited report and consequently
have a longer duration construction period As three years is considered to be an appropriate
time period to spread the construction expenditure profile no change to the model was made
35 Costs Associated with Solar Technologies
A change to the model was sought with regard to the significant downward trends in the cost
of solar PV The stakeholder submission cited pricing data from the Australian Photovoltaic
Institute (APVI) Consultation with the APVI identified that evidence based information for
utility scale PV costs in Australia is limited because Australia has no PV systems 100 MW or
larger It is acknowledged however that there is significant and continued volatility in the
solar PV market including volatility due to competition oversupply in the PV module
market as well as continued price reductions for balance of system and installation costs
A$338 Wnet was a reasonable valuation for 2012 AETA The AETA 2012 value will be
maintained but may be reviewed in the 2014 model update
It was also suggested that solar thermal costs could be better represented in the model by
allowing for different periods of storage rather than a standard 6 hours The AETA 2012
scope was based on fixed plant designs which included fixed thermal storage sizing where
thermal storage was included With thermal storage there are a number of variables that can
be considered including differing field sizes (solar multiple) as well as actual thermal storage
capacities This is likely to add significant complexity to the report and to the model the
benefit of which at this stage does not warrant the changes
24
36 Costs Associated with Nuclear Technologies
It was submitted that consideration be given to including the impact on LCOE for nuclear
technology of the relatively high insurance costs for nuclear technologies This issue will be
considered in the 2014 review of the AETA model However insurance costs or plant
decommissioning costs are not considered for any of the 40 AETA technologies
Also the OampM improvement rate for Nuclear was not reconsidered as there is no OampM
improvement rate for Nuclear in the model
37 Further Technologies
A proposal was received which recommended that further technologies (DICE power plant
based on black coal with and without capture and DICE brown coal with capture and
medium speed DICE technologies) be incorporated into the AETA Model However as
mentioned earlier this update of the AETA 2012 Model only considered the technologies
included in that model This update of the model is not intended to broaden the technologies
38 Auxiliary Loads
Another example used for the purposes of drawing comparisons with the AETA model was
the SaskPower Post Combustion Retrofit It is difficult to distil the SaskPower project data
into a direct comparison with the AETA study and consequently there is insufficient data
certainty to warrant changes to the AETA 2012 values The SaskPower Post Combustion
Retrofit was also cited as to its conservative auxiliary loads for brown and black coal
However upon further investigation this was not substantiated within the SaskPower
example
25
4 WIND PV AND CSP OPERATIONS AND MAINTENANCE (OampM) COST UPDATE
41 Operation and Maintenance Costs
OPERATING AND MAINTENANCE COST DEFINITIONS
In considering the costing of OampM there is no absolutely clear definition of which costs
should be considered as fixed and which variable with the breakdown varying based on a
range of issues including technology location and resource type For this reason in the future
AETA reports OampM costs may be compared in terms of annual total operating expenditure
(OPEX) per MW of generation This method is widely used by most international institutions
to analyse OampM costs and to avoid subjective considerations
For this report fixed and variable costs are reported to provide direct comparison with AETA
2012 In this regard in general fixed costs are independent of the electrical generation of the
plant and are expressed as annual cost per MW capacity Fixed costs include items such as
fixed labour
equipment and
vehicles
Variable costs are proportional to the electrical generation of the Plant and are expressed as
cost rate per kWh energy output Variable costs include items such as
variable labour
consumables and
spare parts
As both public and private domain material vary in the way they approach and report on
fixed and variable maintenance within the following text where an interpretation has been
used for comparison purposes this is described
A submission was made to remove the operations and maintenance (OampM) cost escalation
factors This was not taken up as there is an increase in the OampM costs over CPI which is
borne out historically A review of the basis for this escalation determined that the
underlying assumptions were appropriate The review also considered adopting a generic
learning curve approach for OampM improvement rates as was suggested in one submission
This was not adopted as the model has an OampM improvement rate (set at 02 per cent per
annum) which can be varied by the user for wind and solar technologies This value accounts
for more efficient practices balancing the increase in labour and material costs over and
above CPI However changes to OampM improvement rates for selected technologies were
made as mentioned earlier OampM improvement rate values may be further considered for
emerging technologies in 2014 AETA study
A number of submissions referred to the improvement rate of OampM costs with evidence for
existing technologies to support these rising at 150 per cent CPI It was suggested that for
26
developing technologies it could reasonably be assumed that there would be reductions in
OampM between the first commercial installation and subsequent installations
While it is generally acknowledged that the LCOE of delivered energy from wind is falling
within the literature there is conflicting evidence around trends in OampM costs with recent
reports indicating both significant decreases and increases in OampM (see section 432)
Solar thermal plants consist of technology components that can be considered mature (eg
steam turbine) and components that are undergoing further development such as the solar
field and thermal storage Solar thermal plants require manning for operation as opposed to
wind turbines that do not require the same level of manning
A recent article (Muirhead 2013) advised for the Solar Energy Generating Systems (SEGS)
plants in California that have been operating since the early 1990rsquos ldquoMy understanding is
that the performance of the SEGS plants has significantly improved over time This is due
primarily to replacement of first generation receivers with newer receivers that are much
more efficient OampM practices at the plants have also improved over time based on the now
long history of operating these plants resulting in increased output in addition to reduced
OampM costs
In the AEMO report 100 Per Cent Renewables Study - Draft Modelling Outcomes Scenario 1
assumes that rapid technology transformation will drive real reductions in OampM costs
outweighing any increases projected in the AETA 2012 so OampM costs reduce by 125 per
cent by 2030 and 25 per cent by 2050 Scenario 2 uses the AETA 2012 assumption that
OampM costs escalate at around 150 per cent of Consumer Price Index (CPI) which leads to
cost increases of 27 per cent by 2030 and 46 per cent by 2050 It should be noted that the
Scenario 1 reductions are assumptions without further analysis of what will bring the
assumptions to fruition
In AETA 2012 the common OampM improvement rate for most technologies is set at 02 per
cent and can be varied as a user input The OampM improvement rate for emerging
technologies solar thermal and photovoltaic technology options and offshore wind is set to
25 per cent and can also be varied as a user input The improvement rate is now compounds
on the previous yearrsquos value
The OampM improvement rate values may be further considered for emerging technologies in
2014 AETA study
42 Operating and Maintenance (OampM) Changes in summary
As part of the Model Update special emphasis was placed in this report on the Operational
and Maintenance (OampM) costs and OampM improvement rates for all wind solar thermal and
solar PV renewable technologies covered in AETA 2012 As mentioned earlier this took into
account relevant Australian and international reports public domain information private
sources as well BREE and WorleyParsonsrsquo in-house experience The updated OampM values
are shown in Table 4 Reductions in CSP OampM costs of between 8 per cent and 27 per cent
were obtained in comparison to values provide in AETA 2012 report
The review included a detailed review of a report by IT Power cited as part of one of the
stakeholder submissions In that report reference is made to a case where $18MWh of OampM
costs comes from 64MW trough plant however it does not specify the relevant location hour
27
of thermal energy storage (TES) capacity factor type of cooling and back-up fuel and
therefore cannot be fully analysed nor used towards this AETA update
OampM costs for solar thermal plants are significantly affected by the costs of manpower To
demonstrate this with an example $18MWh for a 100MW plant with a 23 per cent capacity
factor (the IT Power report consideration) would result in an annual OampM cost of
approximately $36 million A 100MW plant will need at least 28 full time employees to be
properly manned 7 daysweek as there needs to be multiple shifts With this amount of
labour there are insufficient funds for site services utilities and materialsmaintenance If the
value is based on another location such as the Far or the Middle East region where labour
costs are significantly lower then a lower OampM cost may be feasible however for Australia
this does not appear to be feasible
The changes to OampM values for the 2013 AETA model refresh are summarised below
Table 4 Model Changes OampM costs
AETA 2012 report reference AETA 2012 model value AETA 2013 update
Section 23 Technical Assumptions
Operating and Maintenance Cost
Estimates
OampM improvement rate 02per
cent all technologies
OampM improvement rate maintained at
02per cent for
Coal based technology options
Gas based technology options
Solar thermal hybrid options
Onshore wind
Biomass technology options
Wave technology options
Geothermal technology options
Nuclear technology options
OampM improvement rate changed to 25per
cent for
Solar thermal technology options
Photovoltaic technology options
Offshore wind
The OampM improvement rate is compounded
from the previous yearsrsquo value
Section 33 Solar thermal
technologies
Solar thermal - Parabolic Trough wo
storage
Fixed OampM (AUS$MWyear)
Variable OampM (AUS$MWh)
60000
15
59176
1519
Solar thermal - Parabolic Trough with
storage
Fixed OampM (AUS$MWyear)
Variable OampM (AUS$MWh)
65000
20
72381
1139
Solar thermal - central receiver
technology wo storage
28
AETA 2012 report reference AETA 2012 model value AETA 2013 update
Fixed OampM (AUS$MWyear)
Variable OampM (AUS$MWh)
70000
15
58285
707
Solar thermal - central receiver
technology with storage
Fixed OampM (AUS$MWyear)
Variable OampM (AUS$MWh)
60000
15
71312
565
Solar thermal - Linear Fresnel wo
storage
Fixed OampM (AUS$MWyear)
Variable OampM (AUS$MWh)
60000
1500
64105
1519
Solar thermal - Linear Fresnel with
storage
Fixed OampM (AUS$MWyear)
Variable OampM (AUS$MWh)
65000
20
72381
1139
Section 35 Photovoltaic
technologies
PV ndash non tracking
Fixed OampM (AUS$MWyear)
25000
25000 (no change)
PV - Single Axis Tracking
Fixed OampM (AUS$MWyear)
38000
30000
PV - Dual Axis Tracking
Fixed OampM (AUS$MWyear)
47000
39000
Section 36 Wind Technologies
Wind Onshore
Fixed OampM (AUS$MWyear)
Variable OampM (AUS$MWh)
40000
12
32500
10
Wind Offshore
Fixed OampM (AUS$MWyear)
Variable OampM (AUS$MWh)
80000
12
77600
30
43 Wind
431 Introduction
This Section reviews onshore and offshore wind operations and maintenance (OampM) costs
used in AETA 2012 The values scrutinised are the fixed and variable OampM given in Table
361 of that report summarised in Table 5 below
29
Table 5 Wind OampM costs used in the AETA 2012 report
Option Fixed OampM (AUS$MW) Variable OampM (AUS$MWh)
Onshore 40000 12
Offshore 80000 12
OampM covers all of the services required to keep the wind farm operating as contracted to
supply energy and renewable energy certificates for its lifetime inclusive of
turbines and all balance of plant (roads buildings electrical equipment SCADA
control equipment) up to the high voltage connection point on the wind farm
substation
labour (both trades and professional)
facilities (workshops stores offices)
equipment (tools jigs vehicles rigging safety equipment craneage)
spare parts and
consumables (such as oil grease and office consumables)
Windfarm size was not specified in AETA 2012 however it was noted that wind farms
greater than 100MW are becoming more common Since then within Australia wind farms
of larger and smaller sizes have been constructed for example the 420 MW Macarthur Wind
Farm in Victoria and the 55 MW Mumbida Wind Farm in Western Australia with both larger
and smaller wind farms under proposal For this review a nominal size of 100-150 MW is
used as representative of current and future facilities
432 Review of Evidence
As mentioned earlier the review of public literature by BREE and WorleyParsons the
procurement of private studies consultations with owneroperators in the wind farm OampM
sector in Australia AETA Stakeholders and project Steering Committee members were used
to assist the current Model Update process Where possible these sources are noted in the
text however some of these sources have asked to remain anonymous and where so the
term ldquoprivate sourcerdquo has been used
As noted by one reviewer in NREL 2011 OampM cost information in the public domain in
both quantum and quality is poor and the situation appears no better in 2013 particularly in
the discrimination of fixed and variable costs One reason for this is the commercial and
increasingly competitive nature of the sector with wind farm OampM now a significant
business worldwide with subsequent confidentiality around actual costs
What constitutes wind farm OampM is also changing This is driven in part by technological
change as the wind fleet ages as new turbines become larger and more sophisticated
particularly offshore Competition in the provision of OampM services is also changing with
maturing of the wind energy product As an example the following industry trends are now
evident
30
a growing role of independents in the wind OampM market ndash around 25 per cent of the
wind fleet in the US is expected to be operated and maintained by independents by
2025 (Ebert and Ware 2013) as opposed to original equipment manufacturers (OEMs) -
wind is largely a commodity market and easier for new participants to enter something
not necessarily seen with other generation technologies
tighter supply markets ndash general economic volatility is tightening the supply and
project development chain for wind moving interest into the OampM sector bringing
price volatility and more competition
a more sophisticated asset management model ndash where OampM providers are linking
operational data with long term condition monitoring output forecasting and work
order scheduling to deliver what is termed ldquolifecycle optimisationrdquo squeezing more
energy out of the asset
older turbines exceeding planned maintenance budgets ndash with the chief issue being
keeping the variable OampM from unforeseen breakdowns
a push for larger turbines particularly offshore (5-10 MW) and in deeper waters and
linking OampM to turbine contracts ndash there is evidence (including in Australia private
source) that wind farm OampM is becoming an even more significant bargaining
component of turbine supply contracts where lower supply costs are balanced by
longer OampM contracts
Costs of wind OampM are difficult to summarise as they are dependent on many issues As just
one example in the NREL 2011 study cited earlier a wide variability in wind farm OampM
costs was found across a range of countries (Figure 1) This reference demonstrates this
variability from the average reference case in terms of Levelised Cost of Energy (LCOE)
31
Figure 1 Effect of country variables on LCOE of wind plant
Source NREL (2011)
Other issues which affect the contracted cost of OampM for wind include
regional variations in labour and transport costs
wind farm environment particularly wind regime and proximity to the ocean
(corrosion)
the maturity and availability of wind turbine technicians
the spread of facilities geographically and the wind farm asset sizes in a portfolio
the turbine type and brand particularly the support establishment within a Region
the age of the asset OampM history and existence of Type (or systematic) failures of
major components
the ability of the OampM provider under the contract to source third party spares andor
try varied maintenance practices and
the nature of the OampM contract ndash for example does it include risk reward elements or
have a link to the wind turbine supply contract or is it a ldquoproduction availabilityrdquo
contract type
While it is generally acknowledged that the LCOE of delivered energy is falling for wind
technology (Hand 2013) within the literature there is conflicting evidence around trends in
OampM costs with recent reports indicating both significant decreases (BNEF 2013) and
increases (Ebert and Ware 2013) It is generally acknowledged that increased competition in
the OampM market is delivering lower cost service provision but this may in part be offset by
an ageing fleet requiring more variable maintenance and a more sophisticated and costly
32
response Several studies have demonstrated that the costs of maintaining wind turbines
generally increase with time following a trend similar in shape to that in Figure 2 (Hand
2013) with estimates in Albers (2009) indicating a doubling in turbine OampM costs by mid
plant life The term COD in Figure 2 refers to commercial operations date
Figure 2 Typical cost increasing trends in wind farm OampM costs with commercial operations
date
Source Adapted by WorleyParsons from Houston (2013)
In Australia this trend is also evident in post 10-year aged machines (private source)
particularly in relation to variable maintenance The nature of any similar increase with more
modern turbines is unpredictable although turbine availability is improving and there is
evidence that OampM costs with each generation of turbine are lowering see Wiser et al
(2012)
The OampM costs for offshore wind farms are particularly difficult to estimate as the industry
is still at the early stages of development including the progression of much larger turbines
into deeper water and the more complex nature of the task Such progression is indicated in
Figure 3 taken from RolandBerger (2013) which indicates an expected decrease in OampM
costs These costs are of the same order of that published in other recent publications UK
Crown Estate (2012) and US DoE (2013)
33
Figure 3 Trends in offshore wind farms and estimated impact on LCOE
Source RolandBerger (2013)
433 Updated OampM Figures for Australia
It is not a simple matter to transfer international costs to Australia as despite trends there are
significant differences between regions including
size of market ndash despite growth the Australian wind market is small with respect to
other world regions For example the total wind fleet is 4 GW (CEC 2013) for
Australia versus 60 GW for the US (AWEA 2013)
labour and material rates in certain parts of Australia are high by world standards
the logistics of getting to and within Australia generally involve longer distances than
other areas of the world particularly due to the remoteness from major equipment
suppliers
volatility of the Australian dollar particularly against the US and
the size of Australian wind farms tends to be larger
These differences can be seen in Figure 4 supplied by a turbine equipment supplier (private
source) and showing the relative OampM costs (per MW) and technician numbers (per 100
MW) across various world regions in 2012 for wind turbine maintenance only and excluding
balance of plant Numbers and scales between the two indices have been removed to protect
the confidentiality of this supplier with data believed to cover the entire global portfolio
under management This shows a significant difference between regions for onshore in both
indices for example almost a 45 per cent difference in costs between Europe and America
Australia would sit within ldquoAsiaPacificrdquo and while the Figure indicates generally lower
OampM costs and higher technician numbers for this region this presumably covers a very
diverse area (including South East Asia New Zealand and Oceania) which may skew results
34
Unlike many larger global markets the wind OampM sector in Australia is dominated by
turbine equipment suppliers with original equipment manufacturer (OEM) contracts
estimated to cover more than 95 per cent of the fleet The evidence for this is mostly
anecdotal although a number of smaller independent suppliers are now known to be
undertaking full service OampM for older plant (gt10+ years) with many of the drivers for this
covered in Ebert et al (2013) There is also evidence (private source) that wind turbine
suppliers in Australia are seeking OampM contracts with much longer terms and tying these to
reductions in turbine supply prices This may indicate a lack of competitive pressure on
OampM pricing in the near to mid-term and as the size of the overall market is small it is
unknown whether independents will grow market share as has been the case in many larger
global markets see for example Deloitte amp Touche (2012)
The most recent contemporary literature comments on onshore wind farm OampM pricing in
Australia and surrounds that could be found in the public domain and not used for the AETA
2012 work are from Hassan (2011) and Deloitte (2011) These are summarised with other
new international references cited in Table 6 with assumptions on any conversions noted
below the table As no offshore wind farm projects have been progressed in Australia the
table includes values from new sources for offshore projects from the international public
domain literature - the significant difference to onshore costs is evident in the values
Figure 4 OampM Costs (per MW) and Technician Numbers (per 100MW) for total wind turbine
OampM (Opex)
Source Private - values and scales removed to protect confidentiality
From Table 6 and considering the differences in markets it appears that for onshore wind the
AETA 2012 estimates may be slightly high with an updated AETA 2013 recommendation
given in Table 7 This value has been arrived at by considering
the size of the Australian wind market and lack of competitive pressure from
independent OampM service providers
35
supply side pressures on OEMs driving them to protect their OampM businesses and
lowering costs
the likely increase in fleet installations to comply with RET legislation skewing the
fleet age to more a modern generation of turbines although it is noted that there is some
uncertainty around long term OampM cost trends particularly variable maintenance ndash an
asset age of around 5 years is assumed here
uncertainties in what is included in referenced values and differences in markets and
advice from actual asset owners and OampM providers (private sources) on current actual
costs
Table 6 Comparison of AETA 2012 wind OampM estimates with new references for 2013
Source Region
Fixed OampM
(AUS$MW)
Variable OampM
(AUS$MWh)
Total OPEX
(AUS$MW)
On
sh
ore
AETA 2012 Australia 40000 12 799451
Houston 2013 US - - 35-380002
BNEF 2013 Global - - 25000
3
Private Source (2013) (gt 10 yr old
plant) Australia - - 70000
Private Source (2013)
(lt 2 yr old out of warranty plant) Australia - - 55000
Hassan 2011 Australia - - 83-99000
4
Deloitte 2011 New Zealand - - 450005
Off
sh
ore
AETA 2012 Australia 80000 12 1262526
Crown Estate 2012 UK - - 275000
7
Hassan (2013) UK - - 2391567
RolandBerger 2013 Europe - - 198000
8
US DoE 2013 US - - 144970
9
1 Assumes a 38 capacity factor
2 USAUD = 109 extrapolated from Figure approximately to 2013
3 EUROAUD = 142 uncertain if this includes all balance of plant or VOM and only includes OEM providers
4 Assumes a 38 capacity factor
5 Assumes NZAUD = 084 a 38 capacity factor and the mid-range estimate for OampM
6 Assumes a 44 capacity factor
7 Assumes GBPAUD = 167 and taking midpoint of estimates stated
8 Assumes GBPAUD = 167 and taking value for 3MW turbines
9 Assumes USAUD = 109
36
The figures shown for onshore projects in Table 7 represent a 15 per cent decrease in the
expected OampM costs of wind farms in Australia compared to AETA 2012 This change
reflects the volatility in this market noted in previous sections and in referenced material
internationally plus the appearance of significant downward pressure on wind OampM prices
primarily through increased global competition The values allow for the rising price of
turbine OampM as the turbine ages during its life
For offshore wind it appears that the OampM costs in AETA 2012 are too low and although it
is tempting to align costs with the most recent US figures due to their lower costs and similar
coastal conditions to Australia the European offshore fleet is significantly larger and more
mature Average figures across the 2013 referenced material including Europe is
recommended This is also shown in Table 7 and represents a significant increase in estimate
costs (around 33per cent) which reflects this evolving sector
There is very little contemporary information available on the breakdown of fixed and
variable maintenance on wind plant making judgment around this for the AETA requirements
is difficult However there is some published but copyrighted material eg GlobalData 2012
which combined with others (private sources) indicates that for onshore and offshore wind
plant respectively a 5050 and 4060 FOM VOM split is appropriate This has been used to
adjust the total OPEX figure in Table 7 to the AETA scheduled and variable indices
requirements using a 38 per cent and a 44 per cent capacity factor for onshore and offshore
projects respectively
Table 7 Recommended AETA (2013) values
AETA (2013) update Fixed OampM
(AUS$MW)
Variable OampM
(AUS$MWh)
Total OPEX
(AUS$MW)
Onshore $32500 $10 $65790
Offshore $77600 $30 $194000
44 Solar Photovoltaics (PV)
441 Introduction
This Section of the report focuses on the OampM costs for ground-mount photovoltaic (PV)
technologies broken down by the following mounting system configurations
Fixed Tilt (FT)
Single Axis Tracking (SAT)
Dual Axis Tracking (DAT)
Although different PV panel technology types (eg poly-crystalline mono-crystalline or thin
film CdTe) affect the capacity factor and land use the OampM costs are comparable The
estimates for this Report are based on polycrystalline PV technology which provides an
average cost on a per Watt basis with mono-crystalline OampM costs being slightly lower and
thin film OampM costs being slightly higher
With the aim to provide comparable results between technologies WorleyParsons has
analysed and updated the PV OampM costs in terms of both fixed operation and maintenance
37
costs (FOM) and total operating expenditures (OPEX) based on reference plants of similar
characteristics
Assumptions interpretations and considerations based on their in-house data and global
market trends are described in the following Sections
442 Review of the Evidence
Since the AETA 2012 report release few new public domain reports related to OampM costs
for PV systems have been published To confirm this the following organisations have been
consulted by WorleyParsons to provide the 2013 OampM costs update for the selected PV
configurations
International Renewable Energy Agency (IRENA) (wwwirenaorg)
International Energy Agency (IEA) (wwwieaorg)
The World Bank (WB) (wwwworldbankorg)
The US National Renewable Energy Laboratory (NREL) (wwwnrelgov)
Solar Energy Industries Association (SEIA) (wwwseiaorgau)
European Photovoltaic Industry Association (EPIA) (wwwepiaorg) and
Solar Electric Power Association (SEPA) (wwwsolarelectricpowerorg)
Upon review of the available information when compared to AETA 2012 the listed
organisations do not have any new public information related to large-scale PV OampM costs
If OampM costs are mentioned they are normally referenced as a per cent of the total Capital
Expenditure (CAPEX) for the plant (around 1 per cent) and provide little useful information
about OampM Cost changes
Due to insufficient detailed and recent information in the public domain WorleyParsons
obtained the following market reports from Photon a private organisation focused on market
news political discussions and technology analysis for the PV industry
Photon 2013 ldquoThe True Cost of Solar Power - Temple of Doomrdquo and
Photon 2013 ldquoSolar Annual 2013 - Build your Empirerdquo
These private reports had minimal focus on OampM costs To provide further input in this
area private OampM service providers were contacted for pricing estimates and market trends
443 AETA 2012 OampM PV costs report comparison
Typical power plant OampM costs are expressed as a combination of a variable component
(proportional to generation) and a fixed component (occurs irrespective of generated output)
Since the generation of a PV plant is dependent on solar radiation (not requiring fossil fuel or
water which make up the major components of variable costs for conventional generation) it
is typical to express the OampM costs only as Fixed OampM (FOM) costs proportional to the
plant size due to the simplicity of PV systems The AETA 2012 report follows this practice
and estimates the PV OampM costs as FOM only relative to plant size (kW) expressed on a per
year basis
38
In order to facilitate comparisons of these costs with other electricity technologies the FOM
costs in the AETA 2012 report are also presented as OPEX costs per MW of generating
capacity per year
ASSUMPTIONS AND CONSIDERATIONS
The following costs are included in the FOM estimates as an annual cost per kW capacity
labor and administrative expenses
panel washing (twice per year at $300 kl for water)
weed abatement (seasonal herbicide applications)
inverter replacement reserve (replaced at operational year 10) and
materials and maintenance spare parts civil works preventative and corrective
equipment maintenance
Although the cost of water is variable depending on location and usage it is such a small
portion of the total OampM costs that it is adequate to assume it as a fixed cost using the
assumptions listed above
AETA 2012 PV OampM COSTS COMPARISON REPORT
The technical characteristics of the reference PV plants used in the AETA 2012 report have
been extracted from the AETA 2012 Model (Version 1_0 Rev B BREE 2012) and are
summarised in Table 8
Based on this information the following parameters for the PV technologies are estimated
Total net energy production in terms of MWh sent out per year
Total plant acreage
FOM in terms of USD per year and
Total OPEX costs in terms of USD per year and USD per total net energy production
per year
39
Table 8 AETA 2012 reference plants technical characteristics and OPEX costs
Plant Characteristics Units Fixed Tilt (FT) Single Axis Tracking (SAT)
Dual Axis Tracking (DAT)
Plant Characteristics
Plant Net Capacity MW 100 100 100
Capacity Factor per cent 21 24 26
FOM $kWyear 25 38 47
Net Energy MWhyear 183960 210240 227760
Plant Acreage acres 500 800 900
Total FOM $year 2500000 3800000 4700000
Total OPEX $year 2500000 3800000 4700000
Total OPEX $kWh 00136 00181 00206
Total OPEX costs are between 00136 and 00206 USDkWh as shown in Table 8 above
These values are conservative cost estimates but reasonable for a large-scale PV plant with
comprehensive OampM service As is expected the FOM or OPEX costs increase as the plant
footprint increases and the complexity of the mounting system increases However the
increases to single and double axis tracking technologies are larger than would be expected
The increased complexity of the trackers does add costs to OampM in terms of labor parts and
even physical plant size but these additions are minor in comparison to the larger OampM
budget items such as the inverter replacement reserve and general electrical maintenance
which are irrespective of mounting system
These values although conservative still show the cost reductions from the industry learning
curve and expanded competition over the past few years when compared to past estimates of
OampM costs This can be seen in the following Table 9 of Fixed Tilt (FT) costs which
provides some estimates found in previous publications by IEA (2008) and EPRI (2010) The
tracking estimates are not shown since minimal data is available This corresponds to the
historical market trend of the industry being more willing to install fixed tilt systems rather
than tracking systems due to lower costs and technology risk
Table 9 Comparison of historical estimated PV and OampM costs in the public domain
PV Configuration OampM Costs Units IEA 200810
EPRI 2010 AETA 2012
Fixed Tilt (FT) FOM $kWyear 40 32 to 37 25
values in Italics are derived from reported data
10
Report assumed 1 of capital costs and 23 capacity factor
40
45 AETA 2013 PV OampM Costs Update
Using the same plant characteristic assumptions as the 2012 AETA Model the 2013 OampM
costs were estimated by WorleyParsons based on the references described in review of the
evidence in Section 442 The comparison of the AETA 2013 and 2012 OampM costs are
presented in Table 10 below
Table 10 2013 PV OampM costs compared to 2012 PV OampM costs PV Configuration OampM Costs Units AETA 2012 WorleyParsons
2013 Update
Fixed Tilt (FT) FOM $kWyear 25 25
OPEX $kWh 00136 00134
Single Axis Tracking (SAT) FOM $kWyear 38 30
OPEX $kWh 00181 00141
Dual Axis Tracking (DAT) FOM $kWyear 47 39
OPEX $kWh 00206 00173
Although the OampM costs for FT systems are approximately the same SAT and DAT OampM
costs reduced by around 20-30 per cent in this 2013 update compared to the AETA 2012
report The consistency of the FT costs is reasonable and expected to continue for the next
few years as discussed further in Section 451
Regarding the SAT and DAT costs although there have been improvements in the design of
trackers for PV applications this OampM cost reduction is due to a better understanding of the
costs associated with electrical and tracking system maintenance The cost differences
between tracking systems was corroborated by quotes from private OampM service companies
who indicated that there was only a slight increase in costs from FT to SAT but a larger
increase in costs from SAT to DAT
As compared to the references mentioned in Section 442 the updated cost estimates are
conservative Table 11 compares the estimated 2013 OampM costs with those references
However since these publications focused primarily on the CAPEX with very general OampM
cost assumptions the OampM costs presented therein are not considered representative
baselines for large-scale solar projects Furthermore they attest to the industryrsquos tendency to
focus strictly on installation costs and not lifecycle costs which is discussed further in Section
451
41
Table 11 2013 updated OampM costs compared to new referenced OampM costs (7-2) PV Configuration
OampM Costs
Units WorleyParsons 2013 Update
11
NREL 2013
12
IRENA 2013a
13
Photon 2013
14
Private OampM Service Providers
201315
Fixed Tilt (FT) FOM $kWyear 25 235 17 to 21 18 17 to 23
OPEX $kWh 00134 00216 to
00383
00121 to 00266
00098 00094 to 00127
Single Axis Tracking (SAT)
FOM $kWyear 30 Not provided
Not provided
Not provided
25 to 27
OPEX $kWh 00141 Not provided
Not provided
Not provided
00136 to 00147
Dual Axis Tracking (DAT)
FOM $kWyear 39 Not provided
Not provided
Not provided
32 to 34
OPEX $kWh 00173 Not provided
Not provided
Not provided
00174 to 00185
values in Italics are derived from reported data
451 OampM Learning Rates
In the rapid PV industry growth of the last three years WorleyParsons and anecdotal
experience is that PV was considered generally to require little to no maintenance causing a
general disregard for OampM planning This appears to have resulted in complications as
owners struggle to resolve reliability performance and budget issues as the projects mature
(multiple private sources) Although the maintenance costs are smaller compared to standard
power plants OampM awareness has been increasing in the industry and therefore the OampM
cost estimates have subsequently increased
This is supported through the recent focus of OampM at PV conferences (such as Sandia
National Laboratory and Solar Energy International events) on increasing the investment in
OampM practices in addition to improving the current practices products and services so that
PV plants can be better maintained to achieve higher reliability throughout the plant life
cycle Currently the majority of OampM expenses for PV systems consist of maintaining and
replacing the inverters followed by the Balance of System maintenance In general once the
appropriate level of investment in OampM for PV is reached then OampM costs will begin to
decrease as the following issues develop to maturity
technology improvement
inverter design for reliability and longevity
data monitoring for preventative and corrective maintenance support
system efficiency to increase system output for the same OampM expense
decreased capital costs for major equipment
decreased spare parts costs
11
See assumptions in Section 433 and 443 12
Report assumed 250kW rooftop at 7 to 10 capacity factor 13
Report assumed 1 of CAPEX and 9 to16 capacity factor 14
Values derived from the global weighted average calculations assuming 21 capacity factor and 20 year lifecycle Report assumed a
simple percentage of average selling price 15
Quote excluded weed abatement panel washing and inverter replacement reserve which were supplemented from the WP estimate
Calculations assumed 21 capacity factor
42
industry maturity and stability
reliable OEM support from product consistency and commercial stability
improved codes and standards for PV equipment system design installation
commissioning and OampM and
experience
trained and experienced personnel in the installation and maintenance of PV plants
In line with this trend owners system designers installers and OEMs are now including
OampM considerations in their finances designs services and products Even though there
have been and will continue to be cost reductions in OampM due to the industry maturation
stabilization and competition those cost reductions are balanced with the necessary
increases in OampM investment to meet the maintenance needs of existing and planned PV
plants resulting in a level OampM cost estimate for the next five years
Photon (2013) follows this assumption of consistent OampM costs for the next ten years as well
as WorleyParsons discussions with OampM service providers Therefore the assumption that
PV OampM costs will remain somewhat constant over the next five years before reducing again
appears to follow the projections in the industry
452 Conclusions - PV
The key findings from the AETA 2012 review and update of the PV OampM costs are as
follows
The 2013 WorleyParsons PV OampM costs update resulted in values of
$25kWyear for FT systems
$30kWyear for SAT
$39kWyear for SAT in 2012 USD
Fixed tilt configurations have not seen significant changes in OampM costs compared to
the 2012 AETA estimates while SAT and DAT configurations cost estimates have
reduced approximately 20-30 per cent based on a better understanding of the associated
OampM costs
Values obtained in the 2013 WorleyParsons update are more conservative but are
aligned with values provided by recognised international institutions even though few
detailed OampM breakdowns are available and
OampM costs for PV are expected to remain constant over the next five years before
reducing as the industry matures in both experience and long-term planning
capabilities
43
46 Concentrating Solar Power (CSP)
461 Introduction
This Section of the report focuses on the OampM costs for the following Concentrating Solar
Power (CSP) technologies
Parabolic Trough (PT)
Solar Tower (ST) and
Linear Fresnel (LF)
CSP OampM costs were analysed in terms of
Fixed Operating and Maintenance Costs (FOM)
Variable Operating and Maintenance Costs (VOM) and
Total Operating Expenditures (OPEX)
In order to arrive at comparable results between technologies BREE and WorleyParsons
estimated the OampM costs based on
Reference Plants with similar Solar Plant characteristics localisation net capacity
capacity factor hours of Thermal Energy Storage (TES) and type of cooling system(s)
and
Cost estimate amounts that were updated to 2012 USD
When information was not available necessary estimates were made using WorleyParsonsrsquo
in-house data and based on global market trends observed in various publications
462 Review of the evidence
The following international organisations were consulted to provide the AETA 2013 OampM
costs update for the selected CSP technologies
International Renewable Energy Agency (IRENA) (wwwirenaorg)
International Energy Agency (IEA) (wwwieaorg)
European Solar Thermal Electricity Association (ESTELA) (wwwestelarde)
The World Bank (WB) (wwwworldbankorg)
National Renewable Energy Laboratory (NREL) (wwwnrelgov)
Protermosolar (wwwprotermosolares)
Institute for Energy Diversification and Saving (IDEA) (wwwideaes)
Renovetec (wwwrenoveteces) and
CSP Today (wwwcsptodaycom)
The approach in reviewing OampM costs for the 2013 update for CSP technology was only to
use new sources of information published since the AETA 2012 report was written This was
44
maintained for all but the learning rates estimation which is due to the lack of any new
updated information published since 2012 in relation to this
Upon review of the available public domain information it was found that IEA ESTELA
WB Protermosolar Renovetec and IDEA do not have any new relevant public information
related to CSP OampM costs However IRENA 2013b IRENA 2013c and NREL 2012 are
new references from IRENA and NREL that are considered relevant and which were used in
this report
The information contained in these references did not provide updated costs for all of the
CSP technologies being considered in this Report and the values offered were not provided
in terms of FOM and VOM costs as preferred
Due to the lack of new relevant information in the public domain the AETA 2013 Model
Update process obtained reports from CSP Today a private international organisation
focused on news events reports updates and information for the CSP industry in markets
such as India South Africa Spain USA Chile and MENA regions The Update acquired the
last edition of PT and ST reports CSP Today 2012a and CSP Today 2012b for which OPEX
costs were analysed
463 AETA 2012 OampM CSP costs report comparison
Operating and Maintenance expenses were provided in terms of fixed and variable costs in
the AETA 2012 report and this Model Update has modified these for 2013 for PT ST and LF
technologies based on the references cited above and further consideration of learning rates
for the CSP industry
Most CSP projects with commercial operational experience are parabolic trough technology
as it is the most mature technology and currently more is reported and known about actual
costs than other CSP technologies Nevada Solar One as an example is a 64MWe parabolic
trough plant based in California which was commissioned in 2007 and it is the first plant
built after the SEGS development during the 1980-90s also in California
Andasol 1 the 50 MWe parabolic trough plant based in Spain is also the first CSP plant
worldwide to implement a commercial thermal energy storage system with a capacity of 75
hours of full load storage It commenced operation at the end of 2008 and other similar and
larger trough projects are now operating or being constructed
As the most mature CSP technology trough plant should be further down the operational and
design operability maturity path and hence have a lower opportunity for OampM cost
reductions through learning By contrast Solar Tower and Linear Fresnel systems are only
beginning to be deployed at larger scale and hence there is expected to be more potential to
reduce their capital and operating costs and improve performance
Learning rates have been argued by stakeholders as being very significant for CSP plant with
comments of the AETA 2012 report centring on this issue Disappointingly there is no new
published evidence or actual plant report data that could be found by the AETA stakeholders
and WorleyParsons to add to that used for the 2012 report There is however new evidence
on the reduction in LCOE for CSP technologies and WorleyParsons linked OPEX
contribution to these LCOE predictions so that a sense of future reductions could be made
This is outlined further in the following Sections
45
4631 ASSUMPTIONS AND CONSIDERATIONS
FOM and VOM Breakdown
The following costs are included in proceeding FOM cost estimates for CSP technologies as
an annual cost per MW capacity
Insurance
Labour costs and
Fixed service maintenance contracts
Similarly the following costs are included in the VOM cost estimates as a cost rate per MWh
of sent out energy
Material and maintenance costs spare parts equipment maintenance and unscheduled
inspections and
Utilities costs water auxiliary fuel and auxiliary power when applicable
Some items such as spare parts for scheduled maintenance could be considered FOM costs
However to simplify the comparison and to homogenise all of the analyses across
technologies all concepts related to plant material and maintenance were included in the
VOM costs
4632 AETA 2012 OampM CSP COSTS COMPARISON REPORT
The technical characteristics of the reference CSP Plants used in the AETA 2012 report have
been extracted from the AETA Model Version 1_0 (BREE 2012) and are summarised in
Table 12
Table 12 AETA 2012 Reference Plant Technical Characteristics
Plant
Characteristics
Units Parabolic
Trough
without
Storage
Parabolic
Trough
with
Storage
Solar
Tower
without
Storage
Solar
Tower
with
Storage
Linear
Fresnel
without
Storage
Linear
Fresnel
with
Storage
Plant Net Capacity MW 138 135 122 18 230 225
Location NA Unknown Unknown Unknown Unknown Unknown Unknown
Isolation kWhm2year Unknown Unknown Unknown Unknown Unknown Unknown
Hours of TES h - 7 - 6 - 6
Capacity Factor per cent 23 42 31 42 23 42
Type of Cooling NA Unknown Unknown Unknown Unknown Unknown Unknown
FOM $MWyear 60000 65000 70000 60000 65000 65000
VOM $MWh sent out 15 20 15 15 15 20
Based on the information above this Model Update estimated the following parameters for
the CSP technologies evaluated in this study
46
Total net energy production in terms of MWh delivered per year
FOM and VOM in terms of USD per year and
Total OPEX costs in terms of USD per year and USD per total net energy production
per year
The results are listed in Table 13 below Table 13 AETA 2012 OampM Opex costs on a per kWh basis
Plant
Characteristics
Units Parabolic
Trough
without
Storage
Parabolic
Trough
with
Storage
Solar
Tower
without
Storage
Solar
Tower
with
Storage
Linear
Fresnel
without
Storage
Linear
Fresnel
with
Storage
Plant Net Capacity MW 138 135 122 18 230 225
Net Energy sent out MWhyear 2780424 496692 3313032 662256 463404 827820
FOM $year 8280000 8775000 8540000 1080000 14950000 14625000
VOM $year 4170636 9933840 4969548 993384 6951060 16556400
OPEX $year 12450636 18708840 13509548 2073384 21901060 31181400
OPEX $kWh 00448 00377 00408 00313 00473 00377
FOM per cent 6650 4690 6321 5209 6826 4690
VOM per cent 3350 5310 3679 4791 3174 5310
The percentages of FOM and VOM costs as part of the total OPEX costs are presented in
Figure 5
Figure 5 AETA 2012 FOM and VOM Percentages of Total OPEX Costs
47
In Figure 5 FOM costs are in general terms significantly higher than VOM costs because
they include the higher cost items such as insurance labour costs and fixed service contracts
However as shown in the Figure VOM costs are higher or approximately equal to FOM
costs for technologies with energy storage given the criteria selected for the breakdown
between FOM costs and VOM costs FOM costs will remain relatively consistent from year-
to-year while VOM costs should be broken down even further since the costs of water
natural gas (if required) and electricity vary between locations and from one year to another
Total OPEX costs are expressed in terms of USD per total net energy production per year and
are between 00313 and 00473 USDkWh as listed in Table 13 These values are aligned
with the values provided by international institutions cited although they appear to be
somewhat inflated in comparison with those values that are closer to 0025 and 0035
USDkWh as published by others (eg IRENA)
4633 AETA 2013 OampM COSTS UPDATE
Similar Plant characteristics to AETA 2012 were considered for the appropriate comparison
of OampM costs for this update Plant characteristics include location net capacity capacity
factor hours of TES and type of cooling For this Report the characteristics of the reference
plants used are described in Table 14
Table 14 PT and ST Reference Plant Characteristics
Plant
characteristics
Units Parabolic
Trough without
Storage
Parabolic
Trough with
Storage
Solar Tower
without
Storage
Solar Tower
with Storage
Plant Net Capacity MW 100 100 100 100
Location NA MENA region MENA region MENA region MENA region
Isolation kWhm2year 2400 2400 2400 2400
Hours of TES h 0 6 0 6
Capacity Factor per cent 26 46 275 476
Type of Cooling NA Dry Dry Dry Dry
Source NA WorleyParsons CSP Today 2012a WorleyParsons CSP Today 2012b
The 2013 OampM costs were estimated using as a basis the information provided in the CSP
2012 reports (CSP 2012a and 2012 b) The following considerations were taken into account
the CSP Today reports only consider PT and ST plants with thermal storage
WorleyParsons made the following estimates based on experience with solar and
conventional power plants based on PT and ST technologies without TES
estimated the capacity factor based on plant capacity location and type of cooling
adjusted the insurance material and maintenance and labour costs based on the
solar field reduction factor when applicable
adjusted the steam turbine maintenance based on the potential hours of operation
48
adjusted the plant electricity and water consumption based on the total net
production
assumed similar auxiliary fuel consumption for the plant with and without TES This
assumption is due to the reference plants being based in the same location thus
requiring similar auxiliary fuel consumption for start-up Minimal differences in
auxiliary fuel consumption for freeze protection due to increased time offline for a
plant without TES system compared to a plant with TES are expected but not
considered in this Report as the impact would be minor
the capacity factor provided by CSP Today for PT with thermal storage is considered
high Based on the plant location and capacity WorleyParsons would anticipate the
capacity factor to be closer to 42 per cent instead of 46 per cent as indicated in Table
14 above This difference in capacity factor directly impacts the estimated VOM cost
which is correlated with plant production For comparison purposes the value provided
by CSP Today has maintained and
with respect to Linear Fresnel technology updated information has not been published
since the AETA 2012 report release by the references listed in Section 462 which
WorleyParsons consulted For the purpose of updating the estimates to 2013 it was
assumed that the evolution of the OampM costs would be similar to that of parabolic
trough plants and the same escalation factors were applied
The resulting 2013 and 2012 OampM costs are listed in Table 15 below for comparison
Table 15 2013 CSP OampM Costs Compared to 2012 OampM Costs
CSP Technology OampM Costs AETA 2012 WorleyParsons 2013 update
Parabolic Trough
without Storage
FOM $MWyear 60000 59176
VOM $MWh sent out 1500 1519
OPEX $kWh 00448 00412
Parabolic Trough with
Storage
FOM $MWyear 65000 72381
VOM $MWh sent out 2000 1139
OPEX $kWh 00377 00293
Solar Tower without
Storage
FOM $MWyear 70000 58285
VOM $MWh sent out 1500 707
OPEX $kWh 00408 00313
Solar Tower with
Storage
FOM $MWyear 60000 71372
VOM $MWh sent out 1500 565
OPEX $kWh 00313 00228
Linear Fresnel without
Storage
FOM $MWyear 65000 64107
VOM $MWh sent out 1500 1519
OPEX $kWh 00473 00434
49
CSP Technology OampM Costs AETA 2012 WorleyParsons 2013 update
Linear Fresnel with
Storage
FOM $MWyear 65000 72381
VOM $MWh sent out 2000 1139
OPEX $kWh 00377 00293
The total OPEX costs per year from the AETA 2012 report and the WorleyParsonsrsquo estimates
that were updated for 2013 are compared in Figure 6 below
Figure 6 Comparison of OPEX Costs per Total Annual Plant Production per Year AETA 2012
Report and 2013 Update
Reductions of approximately 20 - 27 per cent in OampM costs would be realised by CSP with
TES according to the updated 2013 WorleyParsons estimates compared to the same costs
reported in the AETA 2012 report However reductions for PT and LF without TES were
found to be lower at approximately 8 per cent
The IRENA reports (IRENA 2013b IRENA 2013c) provide values for OPEX between 0025
and 0035 USDkWh for PT and ST technologies with and without TES Values updated to
2013 by WorleyParsons are between 0023 and 00412 USDkWh for PT and ST
technologies which align with the IRENA values However IRENA does not differentiate
between the utilisation of TES Solar technologies without TES have fewer hours of
production and although OPEX costs are lower in terms of USDMW compared with solar
technologies with TES OPEX costs in terms of costs per total annual plant production per
year will typically be higher for technologies that do not use TES
4634 OampM CSP LEARNING RATES
Cost reductions on CSP technologies are expected to come from the following main actions
economies of scale in the plant size and manufacturing industry
learning impacts on design construction and operation phases
50
advances in RampD of the following factors
Components Solar receivers mirrors HTF storage media supporting structures
trackers and auxiliary systems
Systems Direct steam generation storage systems or hybrid cooling systems
Configurations Hybridisation or duel electricity water plants
a more competitive supply chain
improvements in the performance of the solar field solar-to-electric efficiency and
thermal energy storage systems
increases in the life of plants and
reduced financial costs
Based on the parameters listed above the LCOE from Solar Thermal technologies is likely to
be continuously decreasing and this is born out in the literature that has been reviewed Based
on the IRENA 2013b report the evolution of the LCOE from trough and power tower CSP
technologies shows how the LCOE is decreasing as technology development increases in
Table 16 below Estimates for LCOE for the hypothetical trough and tower CSP plants in
2014 are also included
51
Table 16 Estimated LCOE form Existing and Hypothetical Trough and Solar Tower CSP Technologies
CSP
Technology
Year Capacity
(MW)
Plant Name Location DNI
(kWhm2year)
LCOE 2012
$kWh Installed
Trough
1981 05 PSA Spain 2000 064
1983 138 SEGS I California 2700 039
1989 30 SEGS II ndash VIII California 2700 026
1992 80 SEGS VIII amp IX California 2700 020
2008 - 2009 50 Andasol 1 2 Spain 2000 035
2010 50 Solnova 1 amp 3 Spain 2000 034
2010 - 2011 50 Extresol 1 amp 2 Spain 2000 035
2014 250 Unspecified (wet
cooling no storage)
Not provided Not provided 020
Tower
1987 10 Solar One California 2700 058
2007 11 PS10 Spain 2000 034
2009 20 PS20 Spain 2000 036
2011 199 Gemasolar (wet
cooling 15hr
storage)
Spain 2000 033
2014 120 Unspecified
(dry cooling
storage)
Not Provided Not provided 015
International Institutions such as IRENA ESTELA or the World Bank agree that the LCOE
and capital cost reductions of 28 per cent to 60 per cent are envisioned by 2020 ndash 2025 for
such plant Estimates of possible LCOE reductions for CSP technology from 2012 to 2025
are provided in Figure 7 taken from Kearny (2010)
52
Figure 7 Expected LCOE Reductions for CSP Technology from 2012 to 2025
Source (Kearny 2010)
The OampM maintenance costs of modern CSP Plants are lower than those for Californian
SEGS Plants built in the 1980s and 1990s which has a total combined capacity of 354 MW
and estimated OampM costs of USD 004kWh (IRENA 2013b) However CSP experienced no
growth from early 1990s until the mid-2000s as can be seen in Table 16 above
As stated at the beginning of Section 462 Andasol 1 was the first 50 MWe parabolic trough
plant built after SEGS which included a thermal energy storage system It commenced
operation at the end of 2008 Podewils (2008) estimated Andasol 1 OampM costs of EUR
0072kWh or USD 0095kWh (considering 2012 medium rate exchange EURUSD of
07553) This value is high compared to OPEX estimations for PT with TES provided by
both this 2013 update and the AETA 2012 report (00293 and 00377 USDkWh
respectively) Therefore according to the information detailed above considerable learning
improvements to OampM costs have been already achieved from the commencement of
operation of Andasol 1 to the time of this Report
`WorleyParsonsrsquo estimations on the LCOE of parabolic trough plants is in the range of
USD 020kWh to USD 035kWh and that of solar towers between USD 017kWh and
USD 029kWh However in areas with excellent solar resources the range could be as low
as USD 014kWh to USD 018kWh
The following considerations have been taken into account for OampM cost learning rates
forecast
WorleyParsons LCOE estimations as set out above
Potential average envisaged LCOE reductions of 475 per cent by 2025 based on Figure
7 above
OPEX contribution on LCOE of 20 per cent and
53
assuming that all components involved in the LCOE (CAPEX OPEX and financial
expenses) reduce at the same rate so percentage contributions remain constant
According to these considerations WorleyParsons estimates that OPEX values by 2025 could
reach from 0021 to 0037 USDkWh for PT technology and from 0018 to 0031 USDkWh
for ST technology
Technological improvements have reduced the requirement of replacing mirrors and
receivers Automation has reduced the cost of other OampM procedures by as much 30 per
cent As a result of OampM procedure improvements (both cost and plant performance) the
total OampM costs of CSP plants in the long-term are likely to be below USD 0025kWh
(IRENA 2013b)
Parabolic trough system in the United States would have OampM costs of around USD 002 to
USD 003kWh meanwhile the OampM costs of parabolic trough and solar tower power plants
currently under construction in South Africa have estimated OampM costs of between USD
0029 and USD 0036kWh (also IRENA 2013b)
WorleyParsons estimations are in alignment with IRENA estimations in terms of current and
envisaged CSP OPEX costs
4635 CONCLUSIONS ndash CSP
The following main conclusions were made based on this study in relation to CSP
technologies
the 2013 WorleyParsons CSP OampM costs update resulted in values between 0023 and
0043 USDkWh based on 2012 USD
reductions in CSP OampM costs between 8 per cent and 27 per cent were obtained in
comparison to values provide in AETA 2012 report
the total OampM costs of CSP Plants in the long-term are likely to be below USD
0025kWh
the updated values for 2013 by WorleyParsons are in alignment with the values
provided by recognised international institutions and
at the time of this report the only CSP technology with substantial operation capacity
was PT Only three utility-scale ST plants were in operation at the time of this report
(PS-10 PS-20 and Gemasolar) of which only one (Gemasolar) uses TES Though
several process steam and small-scale LFR Plants are currently in operation only one
utility-scale LFR (Puerto Erradio 2) was in operation at the time of this report
47 AETA 2013 OampM Learning Rate recommendation
The learning rate used in AETA 2012 for OampM is applied to all technologies assessed and
includes fossil fuel technologies and emerging technologies The learning rate is set at an
improvement of 02 per cent per annum
In addition to the improvement rate OampM is escalated at a rate of 150 per cent of CPI per
year based on experience with increases in parts and labour costs
The CPI rate set in the model is 25 per cent per annum
54
OampM cost information in the public domain in both quantum and quality is poor for
contemporary data Information supporting OampM learning rates is equally poor There are
indications that emerging technologies do have the potential for increased OampM learning
rates relative to mature technologies
For the renewable energy technologies studied in this report onshore wind is considered
mature and it is recommended that the AETA 2012 report value of 02 per cent is maintained
For all other renewable energy technologies studied in this report a more aggressive learning
rate of 25 per cent is recommended This will effectively cancel out the CPI escalation
adjustment and provide a ldquoflat linerdquo OampM rate for future years This will provide a value in
line with the learning rate conclusions for PV
The learning rate for CSP is considered to have greater potential for reduction but due to the
high level of analysis in this report (and therefore uncertainty) it is proposed that a maximum
of two learning rates is appropriate for the AETA model
Table 17 AETA Learning Rate Comparison
AETA 2012 Learning Rate AETA 2013 update Learning Rate
Onshore Wind 02 per cent 02 per cent
Offshore Wind
PV ndash all technologies
CSP ndash all technologies
02 per cent 25 per cent
55
5 CHANGES TO THE LCOE
Changes to the model parameters described in the earlier sections have resulted in changes to
the LCOE estimates for a number of technologies The LCOE estimate values for all
technologies and associated range of uncertainty are shown in the Figures 8 to 13 below
Note that the values listed are for a base value carbon price modifier of zero per cent which
places no value on carbon emissions
For selected technologies where there are significant cost differences Figure 14 provides a
comparison of mid-range LCOE values for the AETA 2013 and AETA 2012 Models Key
features of the Figures 8 to 14 are as follows
both in AETA 2012 and 2013 Model update LCOE costs are provided for the years
2012 2020 2025 2030 2040 and 2050
cost ranges are provided for each technology that accounts for differences in fuel prices
and state-based variations
LCOE costs vary substantially across the technologies from $89MWh (combined cycle
gas turbine) to $351MWh (solar thermal linear fresnel) in 2012 and $73MWh (PV
non-tracking) to $247MWh (IGCC black coal CCS) in 2050
the inter-technology LCOE comparisons figures (Figures 8 to 13) reveal changes in
relative costs of technologies over time Key results include renewable technologies
have higher LCOEs than the lowest cost non-renewable technologies and the relative
LCOE rankings significantly change post 2030 The LCOE of solar PV become lower
than the non-renewables from mid 2030 onwards and
large changes in LCOE results between AETA 2013 Update and AETA 2012 are
depicted in Figures14 below Figure 14 compares LCOEs at 2050 between the AETA
2013 Update and AETA 2012 for a selected number of technologies that have changed
significantly for NSW (AETA developed LCOEs by each Australian state) Differences
in technology LCOEs are explained by a multiplicity of factors including the technical
developments OampM costs and learning rate changes
56
Figure 8 Updated LCOEs for AETA 2013 Model technologies values for 2012 (NSW) with carbon price set to zero
0
50
100
150
200
250
300
350
400
450
500
LCO
E ($
MW
h)
LCOE FOR 2012 TECHNOLOGIES (NSW) Note Default region is NSW except bown coal
technologies (VIC) and SWIS scale (as specified)
LCOE includes where relevant allowance for- Carbon Price- CO2 transport and sequestration cost- Plant capital cost (EPC basis) within battery limits- Owners costs excluding interest during construction- Fixed and variable operating costs- Fuel costs- Economic escalation factors
57
Figure 9 Updated LCOEs for AETA 2013 Model technologies values for 2020 (NSW) with carbon price set to zero
0
50
100
150
200
250
300
350
400
450
LCO
E ($
MW
h)
LCOE FOR 2020 TECHNOLOGIES (NSW) Note Default region is NSW except bown coal
technologies (VIC) and SWIS scale (as specified)
LCOE includes where relevant allowance for- Carbon Price- CO2 transport and sequestration cost- Plant capital cost (EPC basis) within battery limits- Owners costs excluding interest during construction- Fixed and variable operating costs- Fuel costs- Economic escalation factors
58
Figure 10 Updated LCOEs for AETA 2013 Model technologies values for 2025 (NSW) with carbon price set to zero
0
50
100
150
200
250
300
350
400
LCO
E ($
MW
h)
LCOE FOR 2025 TECHNOLOGIES (NSW) Note Default region is NSW except bown coal
technologies (VIC) and SWIS scale (as specified)
LCOE includes where relevant allowance for- Carbon Price- CO2 transport and sequestration cost- Plant capital cost (EPC basis) within battery limits- Owners costs excluding interest during construction- Fixed and variable operating costs- Fuel costs- Economic escalation factors
59
Figure 11 Updated LCOEs for AETA 2013 Model technologies values for 2030 (NSW) with carbon price set to zero
0
50
100
150
200
250
300
350
400
LCO
E ($
MW
h)
LCOE FOR 2030 TECHNOLOGIES (NSW) Note Default region is NSW except bown coal
technologies (VIC) and SWIS scale (as specified)
LCOE includes where relevant allowance for- Carbon Price- CO2 transport and sequestration cost- Plant capital cost (EPC basis) within battery limits- Owners costs excluding interest during construction- Fixed and variable operating costs- Fuel costs- Economic escalation factors
60
Figure 12 Updated LCOEs for AETA 2013 Model technologies values for 2040 (NSW) with carbon price set to zero
0
50
100
150
200
250
300
350
400
LCO
E ($
MW
h)
LCOE FOR 2040 TECHNOLOGIES (NSW) Note Default region is NSW except bown coal
technologies (VIC) and SWIS scale (as specified)
LCOE includes where relevant allowance for- Carbon Price- CO2 transport and sequestration cost- Plant capital cost (EPC basis) within battery limits- Owners costs excluding interest during construction- Fixed and variable operating costs- Fuel costs- Economic escalation factors
61
Figure 13 Updated LCOEs for AETA 2013 Model technologies values for 2050 (NSW) with carbon price set to zero
0
50
100
150
200
250
300
350
400
LCO
E ($
MW
h)
LCOE FOR 2050 TECHNOLOGIES (NSW)
LCOE includes where relevant allowance for- Carbon Price- CO2 transport and sequestration cost- Plant capital cost (EPC basis) within battery limits- Owners costs excluding interest during construction- Fixed and variable operating costs- Fuel costs- Economic escalation factors
Note Default region is NSW except bown coal
technologies (VIC) and SWIS scale (as specified)
62
Figure 14 Comparison of AETA 2013 Model and AETA 2012 Model LCOE estimates selected technologies 2050
0
50
100
150
200
250
AETA 2012
AETA 2013
63
51 Conclusions
The Australian Energy Technology Assessment (AETA 2012) provided the best available and most up-to-
date cost estimates for 40 electricity generation technologies under Australian conditions To ensure that
the cost estimates for the various technologies are consistent all common input costs (eg labour
materials components carbon price) were itemised To ensure that the AETA costings remain up to date
AETA costs are reviewed in this AETA 2013 Model Update report
The AETA 2013 refresh was developed in close consultation with a stakeholder reference group drawn
from industry and researchacademic organisations with interests and expertise in a diverse range of
electricity generation technologies
The AETA 2013 Model results reflect the change to exclude the value of a carbon price in the Levelised
Cost of Energy (LCOE) All technologies have experienced a minor reduction in LCOE relative to 2012
(offset in some cases by other factors) due to the change to an amortisation period of 30 years plus the
construction period
Comparing the 2012 AETA results without a carbon price to the 2013 results without a carbon price there
are significant reductions in the LCOE of solar technologies and onshore wind This is as a consequence of
changes to the fixed and variable Operations and Maintenance (OampM) costs for these technologies For the
solar technologies the adjustment of the capital learning rate to 25 per cent has also contributed to the
LCOE reduction Offshore wind also has an increased learning rate but this has been offset to a large extent
by increased variable OampM costs
Nuclear LCOE has increased significantly due to higher estimates for capital costs
Efficiency for coal fired plants with CCS retrofits has been revised downwards to better reflect the expected
efficiency of these plants and has the effect of increasing the LCOE
64
REFERENCES
Albers A 2009 OampM Cost Modeling Technical Losses and Associated Uncertainties Proceedings of the
2009 European Wind Energy Conference Marseilles France March
AWEA (American Wind Energy Association) 2013 AWEA US Wind Industry Annual Report ndash Year
Ending 2012 USA
BNEF (Bloomberg New Energy Finance) 2013 Operations and Maintenance (OampM) Price Index Issue II
Wind Research Note April
BREE (Bureau of Resources and Energy Economics) 2012 AETA Report and Model Version 1_0 2012
Australian httpwwwbreegovau
CEC (Clean Energy Council) 2013 Australian Energy Technology Assessment 2013 Review Letter to
BREE of 20 May 2013 from the Clean Energy Council (Mr Russel Marsh signatory for the CEC)
CEC (Clean Energy Council) 2013 Clean Energy Council Renewable Energy Map Australia June (data
noted as current as of 21 August 2012)
httpwwwcleanenergycouncilorgauresourcecentreplantregistermaphtml
Crown Estate 2012 Offshore Wind Cost Reduction Pathways Study United Kingdom May
CSP 2012a CSP Parabolic Trough Report Cost Performance and Key Trends CSP Today
CSP 2012b CSP Solar Tower Report Cost Performance and Key Trends CSP Today
Deloitte amp Touche 2012 European Wind Services Study Find Out Which Way the Wind Blows Deloitte amp
Touche GmbH Wirtschaftspruumlfungsgesellschaft August
Deloitte 2011 Economics of wind development in New Zealand Deloitte for the for the New Zealand Wind
Energy Association
Ebert P amp Ware J 2013 The Role of Independents in the Wind Farm Operations amp Maintenance
Proceedings of the 2013 New Zealand Wind Energy Conference and Exhibition March
EPRI (Electric Power Research Institute) 2010 Engineering and Economic Evaluation of Central-Station
Solar Photovoltaic Power Plants USA March
GlobalData 2012 Wind Operations amp Maintenance (OampM) Market ndash Global Market Size Share by
Component Competitive Landscape and Key Country Analysis to 2020 GlobalData reference code
GDAE1054MAR January
Hand M 2013 Wind Plant Cost of Energy Proceedings of the 2nd NREL Wind Energy System
Engineering Workshop January
Hassan G 2011 Review of the Australian Wind Energy Industry Clean Energy Council Australia 2011
Houston C 2013 The Real Truth About Wind Farm OampM Costs North American WindPower March
IEA (International Energy Agency) 2008 Technology Roadmap Solar photovoltaic energy France
httpwwwieaorgpublicationsfreepublicationspublicationpv_roadmappdf
IRENA (International Renewable Energy Agency) 2013a Solar Photovoltaics Technology Brief Germany
January httpwwwirenaorgDocumentDownloadsPublicationsIRENA-ETSAPper
cent20Techper cent 20Briefper cent20E11per cent20Solarper cent20PVpdf
65
IRENA (International Renewable Energy Agency) 2013b Concentrating Solar Power Technology Brief
Germany January
IRENA (International Renewable Energy Agency) 2013c Renewable Power Generation Costs in 2012 An
Overview Germany
IT Power 2013 Analysis of the AETA 2012 cost estimates of CSP technologies Clean Energy Council
submission to the Bureau of Resources and Energy Economics May
Kann S 2012 US Solar Market Insight Report Q3 California USA
Kearny A 2010 Solar Thermal Electricity 2025 ndash clean electricity on demand attractive STE costs
stabilize energy production ATKearny consultants Dusseldorf Germany
Muirhead J 2013 SEGS experience suggests that CSP will age gracefully CSP Today South Africa
httpsocialcsptodaycommarketssegs-experience-suggests-csp-will-age-
gracefullysthash6VkxFaD0dpuf
NREL (National Renewable Energy Laboratories) 2011 IEA Wind Task 26 ndash Multi-national Case Study of
the Financial Cost of Wind Energy Technical Report NRELTP-6A2-48-48155 March
NREL (National Renewable Energy Laboratories) 2012 Cost and Performance Data for Power Generation
Technologies USA February
NREL (National Renewable Energy Laboratories) 2013 Breakeven Prices for Photovoltaics on
Supermarkets in the United States March httpwwwnrelgovdocsfy13osti57276pdf
NREL (National Renewable Energy Laboratories) 2013 Breakeven Prices for Photovoltaics on
Supermarkets in the United States USA March httpwwwnrelgovdocsfy13osti57276pdf
Photon 2012 The True Cost of Solar Power 2012 Temple of Doom Solar Power in Focus Series Photon
Consulting
Photon 2013 Solar Annual 2013 Build Your Empire Photon Consulting
Podewils C 2008 Photovoltaic vs Solar Thermal where PV has the upper hand and where solar thermal
strikes back Photon International Germany November
Poore R and Walford C 2008 Development of an Operations and Maintenance Cost Model to Identify
Cost of Energy Savings for Low Wind Speed Turbines Report NRELSR-500-40581 National
Renewable Energy Laboratory January
RolandBerger 2013 Offshore Wind Towards 2020 On the Pathway to Cost Competitiveness RolandBerger
Consultants Germany April
See wwwcsptodaycom
See wwwepiaorg
See wwwestelasolarde
See wwwidaees
See wwwieaorg
See wwwirenaorg
See wwwnrelgov
See wwwprotermosolares
66
See wwwrenoveteces
See wwwseiaorgau
See wwwsolarelectricpowerorg
See wwwworldbankorg
UK Crown Estate 2012 Offshore Wind Cost reduction Study May
US DoE (Department of Energy) 2013 Award Number DE-EE0005360 USA February
Wiser R Lantz E Bolinger M amp Hand M 2012 Recent Developments in the Levelized Cost of Energy
from US Wind Power Projects Contract No DE-AC02-05CH11231 National Renewable Energy
Laboratories February
67
Appendix A
Electricity Generation Technologies in AETA 2012 Report and Model
The 40 AETA electricity generation technologies are
1 Integrated Gasification and Combined Cycle (IGCC) plant based on brown coal
2 IGCC plant with Carbon Capture and Sequestration (CCS) based on brown coal
3 IGCC plant based on bituminous coal
4 IGCC plant with CCS based on bituminous coal
5 Direct injection coal engine (clean lignite eg brown coal technology)
6 Pulverised coal supercritical plant based on brown coal
7 Pulverised coal supercritical plant with post combustion CCS based on brown coal
8 Pulverised coal subcritical plant with post combustion CCS based on brown coal (retrofit)
9 Pulverised coal supercritical plant based on bituminous coal
10 Pulverised coal supercritical plant based on bituminous coal - SWIS relevant scale
11 Pulverised coal supercritical plant with CCS based on bituminous coal
12 Pulverised coal subcritical plant with post combustion CCS based on bituminous coal (retrofit)
13 Adding CCS to existing Combined Cycle Gas Turbine (CCGT) power plants (retrofitting)
14 Oxy combustion pulverised coal supercritical plant based on bituminous coal
15 Oxy combustion pulverised coal supercritical plant with CCS based on bituminous coal
16 Combined cycle plant burning natural gas
17 Combined cycle plant burning natural gas - SWIS relevant scale
18 Combined cycle plant with post combustion CCS
19 Open cycle plant burning natural gas
20 Solar thermal plant using compact linear fresnal reflector technology wo storage
21 Solar thermal plant using parabolic trough technology wo storage
22 Solar thermal plant using parabolic trough technology with storage
23 Solar thermal plant using compact linear fresnal reflector technology with storage
24 Solar thermal plant using central receiver technology wo storage
25 Solar thermal plant using central receiver technology with storage
26 Solar photovoltaic (PV) - non-tracking
27 Solar photovoltaic (PV) - single axis tracking
28 Solar photovoltaic (PV) - dual axis tracking
29 Wind (on-shore)
30 Wind (off-shore)
31 WaveOcean
68
32 Geothermal - hot sedimentary aquifer (HSA)
33 Geothermal - enhances geothermal system (EGS)
34 Landfill gas power plant
35 Sugar cane waste power plant
36 Other biomass waste power plant (eg wood)
37 Nuclear Gen 3+
38 Nuclear Small Modular Reactors (SMR)
39 Solarcoal hybrid
40 Integrated solar combined cycle (ISCS) ndash parabolic trough with combined cycle gas
69
Appendix B
Consultations with Stakeholders
This study has been undertaken in close consultation with a Stakeholder Reference Group drawn from
Australian industry and domestic as well as overseas researchacademic organisations with interests and
expertise in a diverse range of electricity generation technologies These stakeholders were invited to
provide evidence of the latest estimates for the costs and performance of various technologies
In addition the AETA project also had a Project Steering Committee comprising staff from BREE
AEMO CSIRO and other independent experts to provide technical advice and support The following
agencies participated in the stakeholder reference group meetings or were forwarded the documents
presented at the meetings
AETA Stakeholder Reference Group
Australian Coal Association
Australian Energy Market Operator
Australian Geothermal Energy Association
Australian National Low Emissions Coal RampD
Australian National University
Australian Renewable Energy Agency
Australian Solar Thermal Energy Association
Australian Sugar Milling Council
Australian Treasury
Bureau of Resources and Energy Economics
Clean Energy Council
CSIRO
Department of Industry
Economic Research Institute for ASEAN and East Asia
Energy Retailers Association of Australia
Energy Users Association of Australia
Evans and Peck
Ferrostaal
Global CCS Institute
Grid Australia
Intergen
International Energy Agency France
International Power Suez
IRENA Innovation and Technology Centre Germany
70
National Generators Forum
Oceanlinx Limited
Origin Energy
Private Generators Group
The Institute of Energy Economics Japan
The Energy Research Institute New Delhi
University of Melbourne Energy Institute
University of Queensland Energy Initiative
UQ Energy Economics amp Management Group
Wyldgroup
WorleyParsons
Two AETA Stakeholders Reference Group meetings took place on 30 April 2013 and 17 July 2013 In
addition the AETA Project Steering Committee met on 24 June 2013
71
BREE contacts Executive Director BREE Bruce Wilson brucewilsonretgovau
(02) 6243 7901
Deputy Executive Director Wayne Calder waynecalderbreegovau
(02) 6243 7718
Modelling amp Policy Integration Arif Syed arifsyedbreegovau
Program Leader (02) 6243 7504
Data Statistics Geoff Armitage geoffarmitagebreegovau
Program Leader (02) 6243 7510
Energy and Quantitative Analysis Allison Ball allisonballbreegovau
Program Leader (02) 6243 7539
Resources ndash Program Leader John Barber johnbarberbreegovau
(02) 6243 7988
72

14
relevant Australian and international reports on generation technologies that have been
published since AETA 2012 or have been newly discovered
new public domain information
new information from private sources that could be obtained
in-house experience of WorleyParsons and
input on OampM costs and learning rates from a number of industry stakeholders
This AETA 2013 Model Update report provides supporting explanations and references and
justifies amendments to the cost parameters of technologies especially the OampM costs for
wind and solar technologies that were covered in AETA 2012 model
131 Caveats on the use of LCOE
LCOE provides a generalised cost estimate and does not account for site specific factors
that would be encountered when constructing an actual power plant As a result the costs
associated with integrating a particular technology in a specific location to a specific
electricity network are not considered
Projected LCOE does not necessarily provide a reliable indicator of the relative market
value of generation technologies because of differences in the role of technologies in a
wholesale electricity market For example projected LCOE does not provide a direct
indicator of electricity demand or generation in isolation with other emissions abatement
policies Similarly many technologies involve integration costs in addition to the LCOE to
be able to reliably supply to the system The value of variable (or intermittent) power plants
(such as wind and solar) will depend upon the extent to which such plants generate
electricity during peak periods and the impact these plants have on the reliability of the
electricity system Unlike dispatchable power plants (such as coal natural gas biomass
and hydroelectric) ndash which are reliant on some form of stored energy (eg fuels water
storage or battery storage) ndash wind and photovoltaic power plants do not typically include
energy storage Dispatchable plants such as coal or gas fired plants may involve negative
externalities (environment fuel disposal or insurance costs etc) which are not always
reflected in their LCOEs
The AETA LCOEs are restricted to only utility-scale or large scale technologies
Consequently small-scale technologies (eg small roof-top photovoltaics fuel cells co-
generation and trigeneration) that may be relevant to distributed generation were not
included in the AETA 2012 analysis LCOE cost estimates associated with distributed
photovoltaics are likely to differ substantially from utility-scale photovoltaic systems as a
result of differences in component costs (eg capital costs operating and maintenance
costs) and performance characteristics (eg capacity factor)
132 Organisation of the report
This report is organised in five sections After a brief introduction and purpose of the report
in this section section 2 discusses the changes made to the AETA 2013 Model parameters as
a result of the discussions with Stakeholders and Steering Committee members on the
individual issues and technologies Section 3 presents the issues that were considered but did
not result in the AETA Model parameter changes Section 4 presents in detail the OampM cost
15
changes for wind and solar technologies covered in AETA 2012 Updated LCOE graphs as
well as a comparison of the resultant AETA 2013 Model and AETA 2012 Model LCOEs are
presented in section 5 which also presents concluding comments
16
2 AETA MODEL PARAMETER CHANGES
21 Stakeholder Initiated Changes
Consultations for the AETA 2013 Model update identified the following issues for
consideration
nuclear technology capital costs and lsquofirst year available for constructionrsquo
CCS retrofit thermal efficiency
amortisation period for all technologies and
OampM costs
The OampM issue is discussed in section 4 whereas rest of the issues are discussed below
211 Nuclear Capital Costs
The AETA 2012 report and model presents costs for first of a kind (FOAK) and Nth of a kind
(NOAK) nuclear technologies There could have been some confusion from the original
wording of Section 310 of AETA 2012 report It starts by discussing Gen III plants currently
sold (presumably NOAK) however further in the document Gen III plants are referred to as
FOAK The AETA 2012 report states that the capital costs are based on nuclear power plants
in the US The NOAK value is what is represented in Table 3101 in the AETA 2012 report
and model
Although there are cost adjusting factors used for other technologies studied in the AETA
2012 report there is no adjustment of the US cost base for Australian labour costs and for
adjustment of Australian equipment costs Submissions indicated that an adjustment to costs
should also be used for nuclear to ensure there is commonality in the comparison
This suggestion was considered appropriate and adjustment to the costs for nuclear
technologies was made Based on the factors to convert US rates to Australian rates used in
the fossil fuel technologies ie the factors from the Thermoflow software the new nuclear
capital costs were calculated The multiplier from Thermoflow for labour costs is 205 and
the factor for equipment costs is 13 both US to Australia
Additionally it was submitted that the first year available for construction of nuclear
technologies be extended In support of this the submission argued that nuclear technologies
are examples of generation technology where legislation regulation and public policy
planning is highly region-dependent and must therefore precede deployment by several years
This was considered an appropriate submission and therefore the first year available for
construction in the model has been changed from 2012 to 2020 These changes are shown in
Table 1
17
Table 1 Model Changes Nuclear Technologies
AETA 2012 report reference AETA 2012 model value AETA 2013 update
Technology 37 Nuclear (GW Scale LWR)
Change first year available for Construction
2012
2020
Technology 37 Nuclear (GW Scale LWR)
Convert FOAK Capital Cost to Australian productivity
and commodity costs
4210
6392
Technology 37 Nuclear (GW Scale LWR)
Convert NOAK Capital Cost to Australian productivity
and commodity costs
3470
5268
Technology 38 Nuclear (SMR)
Convert FOAK Capital Cost to Australian productivity
and commodity costs
7908
11778
Technology 38 Nuclear (SMR)
Convert NOAK Capital Cost to Australian productivity
and commodity costs
4778
7116
The overall impact of these parameters on individual technology LCOE changes is given in
the AETA 2013 Model and in Section 5
212 Carbon Capture and Storage (CCS) Retrofit Thermal Efficiency
Subcritical coal technologies with CCS retrofit were reported to have only slightly lower
thermal efficiency values compared with new build supercritical technologies with CCS in
the AETA 2012 Model This was an oversight in the AETA 2012 Model
The AETA 2012 report identified the thermal efficiency to retrofit subcritical brown and
black coal plants as 216 per cent and 301 per cent respectively (Table 312) In the same
table the efficiency for new build supercritical brown and black coal plants is reported to be
208 per cent and 314 per cent respectively
The thermal efficiencies were revised down based on actual operating efficiencies of existing
coal facilities in Victoria and NSW and factored based on the thermal efficiency ratio of new
coal facilities with and without CCS
A reduction in thermal efficiency is to be expected when applying a retrofit CCS to the plant
The CCS factor in the following representation refers the efficiency reduction factors for
adding CCS to a coal fired power station The useful output will reduce from the new
parasitic loads to run the CCS equipment
Thermal efficiency of existing brown coal plant in Victoria is 265 per cent and the CCS
factor is 064 Similarly the thermal efficiency of existing bituminous coal plant in NSW is
355 per cent and the CCS factor is 075
Table 311 and 312 of the AETA 2012 report show a reduction is present when comparing
the supercritical with no CCS compared to supercritical with CCS However the retrofit case
was only provided for the subcritical technology only and no case was included in the AETA
2012 for a subcritical plant with any CCS
A review of the values in Table 312 through comparison to the existing efficiency of
installed black and brown coal fleet in Australia was undertaken For brown coal the current
18
sent out thermal efficiency is 265 per cent for a 500 MW subcritical unit For supercritical
brown coal without CCS the sent out efficiency is 323 per cent Applying the same reduction
factor the thermal efficiency with CCS retrofitted should be 17 per cent in lieu of 216 per
cent as published in AETA 2012 report
For black coal the current sent out thermal efficiency is 355 per cent for a 660 MW
subcritical unit For supercritical black coal without CCS the sent out efficiency is 419 per
cent Applying the same reduction factor the thermal efficiency with CCS retrofitted should
be 266 per cent in lieu of 301 per cent as published AETA 2012 report (Table 2)
Table 2 Model Changes CCS Retrofit Thermal Technologies
AETA 2012 report reference AETA 2012 model value AETA 2013 update
Technology 8 Pulverised coal subcritical plant
with post combustion CCS based on brown coal
(retrofit)
Thermal Efficiency
216
170
Technology 12 Pulverised coal subcritical plant
with post combustion CCS based on bituminous
coal (retrofit)
Thermal Efficiency
301
266
19
213 Amortisation period
There was stakeholder consensus that the operating period for all technologies needs to be set
to thirty years and that the construction time is in addition to the operating time The financial
amortisation period is common for all technologies and is set at 30 years In the AETA 2012
model section 24 (a) nominates that the amortisation period of 30 years is from the
commencement of construction The amortisation period has now been changed (Table 3)
Examples of the change are
Nuclear LWR ndash GW scale In AETA 2012 report amortisation period was 30 years inclusive
of construction and operation The amortisation period has now changed to 36 years (30
operating and 6 years construction)
Solar parabolic trough In AETA 2012 report amortisation period was 30 years inclusive of
construction and operation The amortisation period has now changed to 33 years (30
operating and 3 years construction)
Table 3 Model Changes amortisation period
AETA 2012 report reference AETA 2012 model value AETA 2013 update
Common Amortisation period
for construction and operation
Amortisation period for
operation includes
construction for all
technologies
Amortisation period for
operation to exclude
construction for all
technologies
22 No Carbon Pricing
For the 2013 AETA update the carbon price modifier has been set to zero per cent as the
base value for the results presented in this report with the effect of applying a zero carbon
price to all technologies throughout the study period to 2050 The AETA 2013 Model
however has the option of changing this parameter by the user
20
3 CONSIDERATION OF OTHER ISSUES
This section summarises the issues that were discussed during the AETA 2013 Model Update
with AETA stakeholders but have not led to a change in the model However these issues do
not cover the OampM costs considerations that are detailed in section 4
31 Representation of Uncertainty
The recognition of uncertainty within the model was discussed including both the level of
representation and potential uncertainties with respect to First-of-a-Kind and lsquoEarly Moverrsquo
Technologies
A number of factors were identified that lead to uncertainty in estimates ndash particularly for
emerging technologies For conventional coal and gas technologies even though the
technology is mature the addition of carbon capture introduces cost and performance
uncertainty Cost estimates have inherent uncertainty due to the market uncertainties and
unforeseeable technological developments and due to
- Volatility in equipment pricing
- Volatility in economic conditions (during post Global Financial Crisis) and
- Volatility in labour pricing due to ldquootherrdquo heavy construction projects in specific areas
For technologies where the costs are well understood it was considered that the error bars
should be reduced compared to immediate and emerging technologies and that the error bars
should be lower for technology costs in 2012 compared to later years
There is strong agreement from two key stakeholder submissions with all the factors causing
uncertainty that have been identified in AETA 2012 In particular the labour cost has varied
(increased) significantly due to large construction projects which have increased costs due to
a shortage of labour and a lower productivity due to less experienced personnel The
uncertainties provided in the AETA model are available on a per technology and a per
selected years basis BREE will consider whether or not to include more detail on
uncertainty by technology in the 2014 review of the model
32 Application of Learning Curves
It was raised during the consultation process that the AETA model revision could allow for
learning curve cost reduction assumptions to be altered by the end user This has not been
incorporated in the 2013 update as it is a structural change to the AETA Model
Stakeholders also raised the question as to whether it is possible within the application of
learning curves to distinguish between the potential for cost reductions on manufactured
components like PV panels versus the Balance of Project (BoP) costs which may involve
routine assembly and erection activities which are not subject to significant learning by
doing
However there are opportunities for cost reductions particularly where many repetitive tasks
are involved such as solar field construction modular construction techniques
rationalization of components in the BoP design or reduction in assembly or placement time
21
This is supported in the US Solar Market Insight Report 2012 (Kann 2012) which identified
continued savings in inverter and racking costs as follows
ldquohellip falling equipment costs and fine-tuning of installation practices have made large-
scale solar less expensive QQrdquo
ldquohellip with the continuing maturation of the industry we expect continued focus on
reducing PV balance-of-systems costs (BOS) and that the increased worry over high
penetration PV will drive adoption of 1000Vdc and advanced inverters
respectivelyrdquo and
ldquoMounting structure manufacturers noted that the past year has seen tremendous
pricing pressure accounting for price declines of anywhere between 10 per cent and
30 per cent over the past yearrdquo
Given that the balance of plant costs can also be subject to cost reductions it is not
considered necessary to distinguish learning curves for discrete project costs in the model
33 General Costs Considerations
331 Fuel Costs
The outlook for fuel costs for gas coal and carbon was claimed to have materially shifted
since the AETA 2012 model While there was no evidence provided to support this
consideration will be given to this issue in the 2014 model update
332 CCS Costs
A submission cited the ZeroGen Case Study and sought to clarify the differences in CCS
cost between ZeroGen and lower values estimated for AETA 2012 This is a valid
comparison however BREE notes the following issues which contribute to explaining the
differences The international cost component is as follows AETA 52 per cent ZeroGen 34
per cent With the USD exchange rate AETA 1 ZeroGen at 08 adjusting the AETA value
for exchange rate variation would add A$952kWnet to the AETA value There is a
difference in plant size with AETA at 557 MW net and Zerogen 400 MW net A bigger plant
size would typically provide a lower cost kW installed
Additionally section 112 of Chapter One of the ZeroGen report advises escalation based on
project delivery from 2011 to 2017 AETA costs are for 2012 basis and do not include
escalation beyond this time A portion of the Zerogen costs will be inflated over the
comparable AETA cost Also section 113 of Chapter One of the ZeroGen report identifies
significant enabling works This is likely to be more inclusive than considered in the AETA
2012 report as identified in section 23 (a)
Overall it is considered likely that a number of estimate basis items in the ZeroGen study are
different and once equalised will show a smaller difference between the AETA and
ZeroGen values Therefore there is no immediate action but the basis and assumptions of the
model may be reviewed during 2014 AETA update
With regard to CCS efficiency one submission proposed that the AETA estimates were
overly optimistic However no references were cited to support this view and no change has
been made to the model
22
333 Opportunity Costs
A submission was made that footnotes be included regarding retrofit costs to indicate that
make-up power costs are not included This was not adopted because AETA parameters for
each technology are calculated for that technology alone and do not consider the impact of
reduced output of a retrofit project where additional output needs to be generated from
alternate higher cost generation Opportunity costs are specifically related to business cases
for specific projects and are not considered for any cases presented in the AETA report
Moreover retrofitting does not make electricity generation uncertain or intermittent It only
lowers the flow of generation at a constant rate (due to lower thermal efficiency) relative to
the non-retrofit case
34 Capital and Construction Costs
A submission was made to update the AETA values for the mid-point capital cost for several
technologies based on a study provided in support of the submission The technologies
asserted were
IGCC (Integrated Gasification and Combined Cycle) with 90 per cent capture fuelled
with Victorian brown coal
IGCC with no capture fuelled with black coal
IGCC with 90 per cent capture fuelled with black coal
Pulverised Fuel power plant with 90 per cent capture fuelled with Victorian brown
coal
Pulverised Fuel power plant with 90 per cent capture fuelled with black coal and
OCGT with no capture fuelled with natural gas
There is a key difference in the magnitude of the labour component in Australia compared
with the labour costs associated with the supporting material (from the USA) While no
changes have been made to the model in this update the ldquoshort termrdquo impact of labour
pricing on technology costs may be considered in further updates
Similarly it was submitted that the capital cost values for combined Cycle Gas Turbine
(CCGT) (with and without capture) could be revised As no documentary evidence was
provided to support this no change was made
For Direct Injection Coal Emulsion (DICE) power plant with no capture fuelled with
Victorian brown coal it is also suggested that the values be reviewed with a number of
papers provided for reference However these papers do not address capital cost in any depth
and it is unclear if the balance of project costs included are comparable with AETA DICE
technology is not mature and is probably best described as in the demonstration to
deployment phase of development which brings uncertainty into the cost analysis Therefore
data is needed to substantiate this submission As this was not available at the time of
preparing this report consideration of this issue is deferred to a later time when the necessary
data is available
An increase in the capital costs for Solar thermal trough (6 hrs storage) and Solar thermal
central receiver (6 hours storage) were proposed based on a supporting study by the Electric
Power Research institute (EPRI) The proposed values are substantially larger than the AETA
23
2012 but it is not clear what basis is used to generate these revised values A separate
submission received from another AETA stakeholder has supported the AETA values
Additionally the cited reference for solar thermal trough the Energy Power Research
Institute (EPRI) plant configuration is based on air cooling ndash while for AETA the plant
configuration assumes water cooling The difference in plant configuration will account for a
small part of the difference The AETA value is based on a reference report as issued in 2012
by the US National Renewable Energy Laboratory (NREL 2012)
The AETA value for the central receiver technology is based on a small (20MW) plant
(Gemasolar) with factors for adjustment to field size for thermal storage capacity and post
FOAK learning These factors will align with increased uncertainty in the AETA value It is
likely that additional cost information may now be available for the Brightsource Ivanpah
plant (no storage) and other tower plants being considered under construction
Further investigation of these issues has been sought with stakeholders but is as yet
unavailable
Another suggestion was made to consider capital costs on a component basis The capital
costs used in AETA 2012 for existing technologies were based on actual costs that could be
sourced on published documents (locally andor internationally) or from WorleyParsons
internal data For developing technologies costs were not considered on a component level
For this reason in technologies that are not commercialised a number of assumptions would
need to be made which may limit lsquorealrsquo costs being available No change to the model arose
from this submission
A reassessment of the construction expenditure profile for concentrating solar power (CSP)
technology options was sought in another stakeholder submission and supported by a
referenced report (IT Power 2012) However the plant sizes considered in the AETA report
are larger capacity (100 MW+) than those discussed in the cited report and consequently
have a longer duration construction period As three years is considered to be an appropriate
time period to spread the construction expenditure profile no change to the model was made
35 Costs Associated with Solar Technologies
A change to the model was sought with regard to the significant downward trends in the cost
of solar PV The stakeholder submission cited pricing data from the Australian Photovoltaic
Institute (APVI) Consultation with the APVI identified that evidence based information for
utility scale PV costs in Australia is limited because Australia has no PV systems 100 MW or
larger It is acknowledged however that there is significant and continued volatility in the
solar PV market including volatility due to competition oversupply in the PV module
market as well as continued price reductions for balance of system and installation costs
A$338 Wnet was a reasonable valuation for 2012 AETA The AETA 2012 value will be
maintained but may be reviewed in the 2014 model update
It was also suggested that solar thermal costs could be better represented in the model by
allowing for different periods of storage rather than a standard 6 hours The AETA 2012
scope was based on fixed plant designs which included fixed thermal storage sizing where
thermal storage was included With thermal storage there are a number of variables that can
be considered including differing field sizes (solar multiple) as well as actual thermal storage
capacities This is likely to add significant complexity to the report and to the model the
benefit of which at this stage does not warrant the changes
24
36 Costs Associated with Nuclear Technologies
It was submitted that consideration be given to including the impact on LCOE for nuclear
technology of the relatively high insurance costs for nuclear technologies This issue will be
considered in the 2014 review of the AETA model However insurance costs or plant
decommissioning costs are not considered for any of the 40 AETA technologies
Also the OampM improvement rate for Nuclear was not reconsidered as there is no OampM
improvement rate for Nuclear in the model
37 Further Technologies
A proposal was received which recommended that further technologies (DICE power plant
based on black coal with and without capture and DICE brown coal with capture and
medium speed DICE technologies) be incorporated into the AETA Model However as
mentioned earlier this update of the AETA 2012 Model only considered the technologies
included in that model This update of the model is not intended to broaden the technologies
38 Auxiliary Loads
Another example used for the purposes of drawing comparisons with the AETA model was
the SaskPower Post Combustion Retrofit It is difficult to distil the SaskPower project data
into a direct comparison with the AETA study and consequently there is insufficient data
certainty to warrant changes to the AETA 2012 values The SaskPower Post Combustion
Retrofit was also cited as to its conservative auxiliary loads for brown and black coal
However upon further investigation this was not substantiated within the SaskPower
example
25
4 WIND PV AND CSP OPERATIONS AND MAINTENANCE (OampM) COST UPDATE
41 Operation and Maintenance Costs
OPERATING AND MAINTENANCE COST DEFINITIONS
In considering the costing of OampM there is no absolutely clear definition of which costs
should be considered as fixed and which variable with the breakdown varying based on a
range of issues including technology location and resource type For this reason in the future
AETA reports OampM costs may be compared in terms of annual total operating expenditure
(OPEX) per MW of generation This method is widely used by most international institutions
to analyse OampM costs and to avoid subjective considerations
For this report fixed and variable costs are reported to provide direct comparison with AETA
2012 In this regard in general fixed costs are independent of the electrical generation of the
plant and are expressed as annual cost per MW capacity Fixed costs include items such as
fixed labour
equipment and
vehicles
Variable costs are proportional to the electrical generation of the Plant and are expressed as
cost rate per kWh energy output Variable costs include items such as
variable labour
consumables and
spare parts
As both public and private domain material vary in the way they approach and report on
fixed and variable maintenance within the following text where an interpretation has been
used for comparison purposes this is described
A submission was made to remove the operations and maintenance (OampM) cost escalation
factors This was not taken up as there is an increase in the OampM costs over CPI which is
borne out historically A review of the basis for this escalation determined that the
underlying assumptions were appropriate The review also considered adopting a generic
learning curve approach for OampM improvement rates as was suggested in one submission
This was not adopted as the model has an OampM improvement rate (set at 02 per cent per
annum) which can be varied by the user for wind and solar technologies This value accounts
for more efficient practices balancing the increase in labour and material costs over and
above CPI However changes to OampM improvement rates for selected technologies were
made as mentioned earlier OampM improvement rate values may be further considered for
emerging technologies in 2014 AETA study
A number of submissions referred to the improvement rate of OampM costs with evidence for
existing technologies to support these rising at 150 per cent CPI It was suggested that for
26
developing technologies it could reasonably be assumed that there would be reductions in
OampM between the first commercial installation and subsequent installations
While it is generally acknowledged that the LCOE of delivered energy from wind is falling
within the literature there is conflicting evidence around trends in OampM costs with recent
reports indicating both significant decreases and increases in OampM (see section 432)
Solar thermal plants consist of technology components that can be considered mature (eg
steam turbine) and components that are undergoing further development such as the solar
field and thermal storage Solar thermal plants require manning for operation as opposed to
wind turbines that do not require the same level of manning
A recent article (Muirhead 2013) advised for the Solar Energy Generating Systems (SEGS)
plants in California that have been operating since the early 1990rsquos ldquoMy understanding is
that the performance of the SEGS plants has significantly improved over time This is due
primarily to replacement of first generation receivers with newer receivers that are much
more efficient OampM practices at the plants have also improved over time based on the now
long history of operating these plants resulting in increased output in addition to reduced
OampM costs
In the AEMO report 100 Per Cent Renewables Study - Draft Modelling Outcomes Scenario 1
assumes that rapid technology transformation will drive real reductions in OampM costs
outweighing any increases projected in the AETA 2012 so OampM costs reduce by 125 per
cent by 2030 and 25 per cent by 2050 Scenario 2 uses the AETA 2012 assumption that
OampM costs escalate at around 150 per cent of Consumer Price Index (CPI) which leads to
cost increases of 27 per cent by 2030 and 46 per cent by 2050 It should be noted that the
Scenario 1 reductions are assumptions without further analysis of what will bring the
assumptions to fruition
In AETA 2012 the common OampM improvement rate for most technologies is set at 02 per
cent and can be varied as a user input The OampM improvement rate for emerging
technologies solar thermal and photovoltaic technology options and offshore wind is set to
25 per cent and can also be varied as a user input The improvement rate is now compounds
on the previous yearrsquos value
The OampM improvement rate values may be further considered for emerging technologies in
2014 AETA study
42 Operating and Maintenance (OampM) Changes in summary
As part of the Model Update special emphasis was placed in this report on the Operational
and Maintenance (OampM) costs and OampM improvement rates for all wind solar thermal and
solar PV renewable technologies covered in AETA 2012 As mentioned earlier this took into
account relevant Australian and international reports public domain information private
sources as well BREE and WorleyParsonsrsquo in-house experience The updated OampM values
are shown in Table 4 Reductions in CSP OampM costs of between 8 per cent and 27 per cent
were obtained in comparison to values provide in AETA 2012 report
The review included a detailed review of a report by IT Power cited as part of one of the
stakeholder submissions In that report reference is made to a case where $18MWh of OampM
costs comes from 64MW trough plant however it does not specify the relevant location hour
27
of thermal energy storage (TES) capacity factor type of cooling and back-up fuel and
therefore cannot be fully analysed nor used towards this AETA update
OampM costs for solar thermal plants are significantly affected by the costs of manpower To
demonstrate this with an example $18MWh for a 100MW plant with a 23 per cent capacity
factor (the IT Power report consideration) would result in an annual OampM cost of
approximately $36 million A 100MW plant will need at least 28 full time employees to be
properly manned 7 daysweek as there needs to be multiple shifts With this amount of
labour there are insufficient funds for site services utilities and materialsmaintenance If the
value is based on another location such as the Far or the Middle East region where labour
costs are significantly lower then a lower OampM cost may be feasible however for Australia
this does not appear to be feasible
The changes to OampM values for the 2013 AETA model refresh are summarised below
Table 4 Model Changes OampM costs
AETA 2012 report reference AETA 2012 model value AETA 2013 update
Section 23 Technical Assumptions
Operating and Maintenance Cost
Estimates
OampM improvement rate 02per
cent all technologies
OampM improvement rate maintained at
02per cent for
Coal based technology options
Gas based technology options
Solar thermal hybrid options
Onshore wind
Biomass technology options
Wave technology options
Geothermal technology options
Nuclear technology options
OampM improvement rate changed to 25per
cent for
Solar thermal technology options
Photovoltaic technology options
Offshore wind
The OampM improvement rate is compounded
from the previous yearsrsquo value
Section 33 Solar thermal
technologies
Solar thermal - Parabolic Trough wo
storage
Fixed OampM (AUS$MWyear)
Variable OampM (AUS$MWh)
60000
15
59176
1519
Solar thermal - Parabolic Trough with
storage
Fixed OampM (AUS$MWyear)
Variable OampM (AUS$MWh)
65000
20
72381
1139
Solar thermal - central receiver
technology wo storage
28
AETA 2012 report reference AETA 2012 model value AETA 2013 update
Fixed OampM (AUS$MWyear)
Variable OampM (AUS$MWh)
70000
15
58285
707
Solar thermal - central receiver
technology with storage
Fixed OampM (AUS$MWyear)
Variable OampM (AUS$MWh)
60000
15
71312
565
Solar thermal - Linear Fresnel wo
storage
Fixed OampM (AUS$MWyear)
Variable OampM (AUS$MWh)
60000
1500
64105
1519
Solar thermal - Linear Fresnel with
storage
Fixed OampM (AUS$MWyear)
Variable OampM (AUS$MWh)
65000
20
72381
1139
Section 35 Photovoltaic
technologies
PV ndash non tracking
Fixed OampM (AUS$MWyear)
25000
25000 (no change)
PV - Single Axis Tracking
Fixed OampM (AUS$MWyear)
38000
30000
PV - Dual Axis Tracking
Fixed OampM (AUS$MWyear)
47000
39000
Section 36 Wind Technologies
Wind Onshore
Fixed OampM (AUS$MWyear)
Variable OampM (AUS$MWh)
40000
12
32500
10
Wind Offshore
Fixed OampM (AUS$MWyear)
Variable OampM (AUS$MWh)
80000
12
77600
30
43 Wind
431 Introduction
This Section reviews onshore and offshore wind operations and maintenance (OampM) costs
used in AETA 2012 The values scrutinised are the fixed and variable OampM given in Table
361 of that report summarised in Table 5 below
29
Table 5 Wind OampM costs used in the AETA 2012 report
Option Fixed OampM (AUS$MW) Variable OampM (AUS$MWh)
Onshore 40000 12
Offshore 80000 12
OampM covers all of the services required to keep the wind farm operating as contracted to
supply energy and renewable energy certificates for its lifetime inclusive of
turbines and all balance of plant (roads buildings electrical equipment SCADA
control equipment) up to the high voltage connection point on the wind farm
substation
labour (both trades and professional)
facilities (workshops stores offices)
equipment (tools jigs vehicles rigging safety equipment craneage)
spare parts and
consumables (such as oil grease and office consumables)
Windfarm size was not specified in AETA 2012 however it was noted that wind farms
greater than 100MW are becoming more common Since then within Australia wind farms
of larger and smaller sizes have been constructed for example the 420 MW Macarthur Wind
Farm in Victoria and the 55 MW Mumbida Wind Farm in Western Australia with both larger
and smaller wind farms under proposal For this review a nominal size of 100-150 MW is
used as representative of current and future facilities
432 Review of Evidence
As mentioned earlier the review of public literature by BREE and WorleyParsons the
procurement of private studies consultations with owneroperators in the wind farm OampM
sector in Australia AETA Stakeholders and project Steering Committee members were used
to assist the current Model Update process Where possible these sources are noted in the
text however some of these sources have asked to remain anonymous and where so the
term ldquoprivate sourcerdquo has been used
As noted by one reviewer in NREL 2011 OampM cost information in the public domain in
both quantum and quality is poor and the situation appears no better in 2013 particularly in
the discrimination of fixed and variable costs One reason for this is the commercial and
increasingly competitive nature of the sector with wind farm OampM now a significant
business worldwide with subsequent confidentiality around actual costs
What constitutes wind farm OampM is also changing This is driven in part by technological
change as the wind fleet ages as new turbines become larger and more sophisticated
particularly offshore Competition in the provision of OampM services is also changing with
maturing of the wind energy product As an example the following industry trends are now
evident
30
a growing role of independents in the wind OampM market ndash around 25 per cent of the
wind fleet in the US is expected to be operated and maintained by independents by
2025 (Ebert and Ware 2013) as opposed to original equipment manufacturers (OEMs) -
wind is largely a commodity market and easier for new participants to enter something
not necessarily seen with other generation technologies
tighter supply markets ndash general economic volatility is tightening the supply and
project development chain for wind moving interest into the OampM sector bringing
price volatility and more competition
a more sophisticated asset management model ndash where OampM providers are linking
operational data with long term condition monitoring output forecasting and work
order scheduling to deliver what is termed ldquolifecycle optimisationrdquo squeezing more
energy out of the asset
older turbines exceeding planned maintenance budgets ndash with the chief issue being
keeping the variable OampM from unforeseen breakdowns
a push for larger turbines particularly offshore (5-10 MW) and in deeper waters and
linking OampM to turbine contracts ndash there is evidence (including in Australia private
source) that wind farm OampM is becoming an even more significant bargaining
component of turbine supply contracts where lower supply costs are balanced by
longer OampM contracts
Costs of wind OampM are difficult to summarise as they are dependent on many issues As just
one example in the NREL 2011 study cited earlier a wide variability in wind farm OampM
costs was found across a range of countries (Figure 1) This reference demonstrates this
variability from the average reference case in terms of Levelised Cost of Energy (LCOE)
31
Figure 1 Effect of country variables on LCOE of wind plant
Source NREL (2011)
Other issues which affect the contracted cost of OampM for wind include
regional variations in labour and transport costs
wind farm environment particularly wind regime and proximity to the ocean
(corrosion)
the maturity and availability of wind turbine technicians
the spread of facilities geographically and the wind farm asset sizes in a portfolio
the turbine type and brand particularly the support establishment within a Region
the age of the asset OampM history and existence of Type (or systematic) failures of
major components
the ability of the OampM provider under the contract to source third party spares andor
try varied maintenance practices and
the nature of the OampM contract ndash for example does it include risk reward elements or
have a link to the wind turbine supply contract or is it a ldquoproduction availabilityrdquo
contract type
While it is generally acknowledged that the LCOE of delivered energy is falling for wind
technology (Hand 2013) within the literature there is conflicting evidence around trends in
OampM costs with recent reports indicating both significant decreases (BNEF 2013) and
increases (Ebert and Ware 2013) It is generally acknowledged that increased competition in
the OampM market is delivering lower cost service provision but this may in part be offset by
an ageing fleet requiring more variable maintenance and a more sophisticated and costly
32
response Several studies have demonstrated that the costs of maintaining wind turbines
generally increase with time following a trend similar in shape to that in Figure 2 (Hand
2013) with estimates in Albers (2009) indicating a doubling in turbine OampM costs by mid
plant life The term COD in Figure 2 refers to commercial operations date
Figure 2 Typical cost increasing trends in wind farm OampM costs with commercial operations
date
Source Adapted by WorleyParsons from Houston (2013)
In Australia this trend is also evident in post 10-year aged machines (private source)
particularly in relation to variable maintenance The nature of any similar increase with more
modern turbines is unpredictable although turbine availability is improving and there is
evidence that OampM costs with each generation of turbine are lowering see Wiser et al
(2012)
The OampM costs for offshore wind farms are particularly difficult to estimate as the industry
is still at the early stages of development including the progression of much larger turbines
into deeper water and the more complex nature of the task Such progression is indicated in
Figure 3 taken from RolandBerger (2013) which indicates an expected decrease in OampM
costs These costs are of the same order of that published in other recent publications UK
Crown Estate (2012) and US DoE (2013)
33
Figure 3 Trends in offshore wind farms and estimated impact on LCOE
Source RolandBerger (2013)
433 Updated OampM Figures for Australia
It is not a simple matter to transfer international costs to Australia as despite trends there are
significant differences between regions including
size of market ndash despite growth the Australian wind market is small with respect to
other world regions For example the total wind fleet is 4 GW (CEC 2013) for
Australia versus 60 GW for the US (AWEA 2013)
labour and material rates in certain parts of Australia are high by world standards
the logistics of getting to and within Australia generally involve longer distances than
other areas of the world particularly due to the remoteness from major equipment
suppliers
volatility of the Australian dollar particularly against the US and
the size of Australian wind farms tends to be larger
These differences can be seen in Figure 4 supplied by a turbine equipment supplier (private
source) and showing the relative OampM costs (per MW) and technician numbers (per 100
MW) across various world regions in 2012 for wind turbine maintenance only and excluding
balance of plant Numbers and scales between the two indices have been removed to protect
the confidentiality of this supplier with data believed to cover the entire global portfolio
under management This shows a significant difference between regions for onshore in both
indices for example almost a 45 per cent difference in costs between Europe and America
Australia would sit within ldquoAsiaPacificrdquo and while the Figure indicates generally lower
OampM costs and higher technician numbers for this region this presumably covers a very
diverse area (including South East Asia New Zealand and Oceania) which may skew results
34
Unlike many larger global markets the wind OampM sector in Australia is dominated by
turbine equipment suppliers with original equipment manufacturer (OEM) contracts
estimated to cover more than 95 per cent of the fleet The evidence for this is mostly
anecdotal although a number of smaller independent suppliers are now known to be
undertaking full service OampM for older plant (gt10+ years) with many of the drivers for this
covered in Ebert et al (2013) There is also evidence (private source) that wind turbine
suppliers in Australia are seeking OampM contracts with much longer terms and tying these to
reductions in turbine supply prices This may indicate a lack of competitive pressure on
OampM pricing in the near to mid-term and as the size of the overall market is small it is
unknown whether independents will grow market share as has been the case in many larger
global markets see for example Deloitte amp Touche (2012)
The most recent contemporary literature comments on onshore wind farm OampM pricing in
Australia and surrounds that could be found in the public domain and not used for the AETA
2012 work are from Hassan (2011) and Deloitte (2011) These are summarised with other
new international references cited in Table 6 with assumptions on any conversions noted
below the table As no offshore wind farm projects have been progressed in Australia the
table includes values from new sources for offshore projects from the international public
domain literature - the significant difference to onshore costs is evident in the values
Figure 4 OampM Costs (per MW) and Technician Numbers (per 100MW) for total wind turbine
OampM (Opex)
Source Private - values and scales removed to protect confidentiality
From Table 6 and considering the differences in markets it appears that for onshore wind the
AETA 2012 estimates may be slightly high with an updated AETA 2013 recommendation
given in Table 7 This value has been arrived at by considering
the size of the Australian wind market and lack of competitive pressure from
independent OampM service providers
35
supply side pressures on OEMs driving them to protect their OampM businesses and
lowering costs
the likely increase in fleet installations to comply with RET legislation skewing the
fleet age to more a modern generation of turbines although it is noted that there is some
uncertainty around long term OampM cost trends particularly variable maintenance ndash an
asset age of around 5 years is assumed here
uncertainties in what is included in referenced values and differences in markets and
advice from actual asset owners and OampM providers (private sources) on current actual
costs
Table 6 Comparison of AETA 2012 wind OampM estimates with new references for 2013
Source Region
Fixed OampM
(AUS$MW)
Variable OampM
(AUS$MWh)
Total OPEX
(AUS$MW)
On
sh
ore
AETA 2012 Australia 40000 12 799451
Houston 2013 US - - 35-380002
BNEF 2013 Global - - 25000
3
Private Source (2013) (gt 10 yr old
plant) Australia - - 70000
Private Source (2013)
(lt 2 yr old out of warranty plant) Australia - - 55000
Hassan 2011 Australia - - 83-99000
4
Deloitte 2011 New Zealand - - 450005
Off
sh
ore
AETA 2012 Australia 80000 12 1262526
Crown Estate 2012 UK - - 275000
7
Hassan (2013) UK - - 2391567
RolandBerger 2013 Europe - - 198000
8
US DoE 2013 US - - 144970
9
1 Assumes a 38 capacity factor
2 USAUD = 109 extrapolated from Figure approximately to 2013
3 EUROAUD = 142 uncertain if this includes all balance of plant or VOM and only includes OEM providers
4 Assumes a 38 capacity factor
5 Assumes NZAUD = 084 a 38 capacity factor and the mid-range estimate for OampM
6 Assumes a 44 capacity factor
7 Assumes GBPAUD = 167 and taking midpoint of estimates stated
8 Assumes GBPAUD = 167 and taking value for 3MW turbines
9 Assumes USAUD = 109
36
The figures shown for onshore projects in Table 7 represent a 15 per cent decrease in the
expected OampM costs of wind farms in Australia compared to AETA 2012 This change
reflects the volatility in this market noted in previous sections and in referenced material
internationally plus the appearance of significant downward pressure on wind OampM prices
primarily through increased global competition The values allow for the rising price of
turbine OampM as the turbine ages during its life
For offshore wind it appears that the OampM costs in AETA 2012 are too low and although it
is tempting to align costs with the most recent US figures due to their lower costs and similar
coastal conditions to Australia the European offshore fleet is significantly larger and more
mature Average figures across the 2013 referenced material including Europe is
recommended This is also shown in Table 7 and represents a significant increase in estimate
costs (around 33per cent) which reflects this evolving sector
There is very little contemporary information available on the breakdown of fixed and
variable maintenance on wind plant making judgment around this for the AETA requirements
is difficult However there is some published but copyrighted material eg GlobalData 2012
which combined with others (private sources) indicates that for onshore and offshore wind
plant respectively a 5050 and 4060 FOM VOM split is appropriate This has been used to
adjust the total OPEX figure in Table 7 to the AETA scheduled and variable indices
requirements using a 38 per cent and a 44 per cent capacity factor for onshore and offshore
projects respectively
Table 7 Recommended AETA (2013) values
AETA (2013) update Fixed OampM
(AUS$MW)
Variable OampM
(AUS$MWh)
Total OPEX
(AUS$MW)
Onshore $32500 $10 $65790
Offshore $77600 $30 $194000
44 Solar Photovoltaics (PV)
441 Introduction
This Section of the report focuses on the OampM costs for ground-mount photovoltaic (PV)
technologies broken down by the following mounting system configurations
Fixed Tilt (FT)
Single Axis Tracking (SAT)
Dual Axis Tracking (DAT)
Although different PV panel technology types (eg poly-crystalline mono-crystalline or thin
film CdTe) affect the capacity factor and land use the OampM costs are comparable The
estimates for this Report are based on polycrystalline PV technology which provides an
average cost on a per Watt basis with mono-crystalline OampM costs being slightly lower and
thin film OampM costs being slightly higher
With the aim to provide comparable results between technologies WorleyParsons has
analysed and updated the PV OampM costs in terms of both fixed operation and maintenance
37
costs (FOM) and total operating expenditures (OPEX) based on reference plants of similar
characteristics
Assumptions interpretations and considerations based on their in-house data and global
market trends are described in the following Sections
442 Review of the Evidence
Since the AETA 2012 report release few new public domain reports related to OampM costs
for PV systems have been published To confirm this the following organisations have been
consulted by WorleyParsons to provide the 2013 OampM costs update for the selected PV
configurations
International Renewable Energy Agency (IRENA) (wwwirenaorg)
International Energy Agency (IEA) (wwwieaorg)
The World Bank (WB) (wwwworldbankorg)
The US National Renewable Energy Laboratory (NREL) (wwwnrelgov)
Solar Energy Industries Association (SEIA) (wwwseiaorgau)
European Photovoltaic Industry Association (EPIA) (wwwepiaorg) and
Solar Electric Power Association (SEPA) (wwwsolarelectricpowerorg)
Upon review of the available information when compared to AETA 2012 the listed
organisations do not have any new public information related to large-scale PV OampM costs
If OampM costs are mentioned they are normally referenced as a per cent of the total Capital
Expenditure (CAPEX) for the plant (around 1 per cent) and provide little useful information
about OampM Cost changes
Due to insufficient detailed and recent information in the public domain WorleyParsons
obtained the following market reports from Photon a private organisation focused on market
news political discussions and technology analysis for the PV industry
Photon 2013 ldquoThe True Cost of Solar Power - Temple of Doomrdquo and
Photon 2013 ldquoSolar Annual 2013 - Build your Empirerdquo
These private reports had minimal focus on OampM costs To provide further input in this
area private OampM service providers were contacted for pricing estimates and market trends
443 AETA 2012 OampM PV costs report comparison
Typical power plant OampM costs are expressed as a combination of a variable component
(proportional to generation) and a fixed component (occurs irrespective of generated output)
Since the generation of a PV plant is dependent on solar radiation (not requiring fossil fuel or
water which make up the major components of variable costs for conventional generation) it
is typical to express the OampM costs only as Fixed OampM (FOM) costs proportional to the
plant size due to the simplicity of PV systems The AETA 2012 report follows this practice
and estimates the PV OampM costs as FOM only relative to plant size (kW) expressed on a per
year basis
38
In order to facilitate comparisons of these costs with other electricity technologies the FOM
costs in the AETA 2012 report are also presented as OPEX costs per MW of generating
capacity per year
ASSUMPTIONS AND CONSIDERATIONS
The following costs are included in the FOM estimates as an annual cost per kW capacity
labor and administrative expenses
panel washing (twice per year at $300 kl for water)
weed abatement (seasonal herbicide applications)
inverter replacement reserve (replaced at operational year 10) and
materials and maintenance spare parts civil works preventative and corrective
equipment maintenance
Although the cost of water is variable depending on location and usage it is such a small
portion of the total OampM costs that it is adequate to assume it as a fixed cost using the
assumptions listed above
AETA 2012 PV OampM COSTS COMPARISON REPORT
The technical characteristics of the reference PV plants used in the AETA 2012 report have
been extracted from the AETA 2012 Model (Version 1_0 Rev B BREE 2012) and are
summarised in Table 8
Based on this information the following parameters for the PV technologies are estimated
Total net energy production in terms of MWh sent out per year
Total plant acreage
FOM in terms of USD per year and
Total OPEX costs in terms of USD per year and USD per total net energy production
per year
39
Table 8 AETA 2012 reference plants technical characteristics and OPEX costs
Plant Characteristics Units Fixed Tilt (FT) Single Axis Tracking (SAT)
Dual Axis Tracking (DAT)
Plant Characteristics
Plant Net Capacity MW 100 100 100
Capacity Factor per cent 21 24 26
FOM $kWyear 25 38 47
Net Energy MWhyear 183960 210240 227760
Plant Acreage acres 500 800 900
Total FOM $year 2500000 3800000 4700000
Total OPEX $year 2500000 3800000 4700000
Total OPEX $kWh 00136 00181 00206
Total OPEX costs are between 00136 and 00206 USDkWh as shown in Table 8 above
These values are conservative cost estimates but reasonable for a large-scale PV plant with
comprehensive OampM service As is expected the FOM or OPEX costs increase as the plant
footprint increases and the complexity of the mounting system increases However the
increases to single and double axis tracking technologies are larger than would be expected
The increased complexity of the trackers does add costs to OampM in terms of labor parts and
even physical plant size but these additions are minor in comparison to the larger OampM
budget items such as the inverter replacement reserve and general electrical maintenance
which are irrespective of mounting system
These values although conservative still show the cost reductions from the industry learning
curve and expanded competition over the past few years when compared to past estimates of
OampM costs This can be seen in the following Table 9 of Fixed Tilt (FT) costs which
provides some estimates found in previous publications by IEA (2008) and EPRI (2010) The
tracking estimates are not shown since minimal data is available This corresponds to the
historical market trend of the industry being more willing to install fixed tilt systems rather
than tracking systems due to lower costs and technology risk
Table 9 Comparison of historical estimated PV and OampM costs in the public domain
PV Configuration OampM Costs Units IEA 200810
EPRI 2010 AETA 2012
Fixed Tilt (FT) FOM $kWyear 40 32 to 37 25
values in Italics are derived from reported data
10
Report assumed 1 of capital costs and 23 capacity factor
40
45 AETA 2013 PV OampM Costs Update
Using the same plant characteristic assumptions as the 2012 AETA Model the 2013 OampM
costs were estimated by WorleyParsons based on the references described in review of the
evidence in Section 442 The comparison of the AETA 2013 and 2012 OampM costs are
presented in Table 10 below
Table 10 2013 PV OampM costs compared to 2012 PV OampM costs PV Configuration OampM Costs Units AETA 2012 WorleyParsons
2013 Update
Fixed Tilt (FT) FOM $kWyear 25 25
OPEX $kWh 00136 00134
Single Axis Tracking (SAT) FOM $kWyear 38 30
OPEX $kWh 00181 00141
Dual Axis Tracking (DAT) FOM $kWyear 47 39
OPEX $kWh 00206 00173
Although the OampM costs for FT systems are approximately the same SAT and DAT OampM
costs reduced by around 20-30 per cent in this 2013 update compared to the AETA 2012
report The consistency of the FT costs is reasonable and expected to continue for the next
few years as discussed further in Section 451
Regarding the SAT and DAT costs although there have been improvements in the design of
trackers for PV applications this OampM cost reduction is due to a better understanding of the
costs associated with electrical and tracking system maintenance The cost differences
between tracking systems was corroborated by quotes from private OampM service companies
who indicated that there was only a slight increase in costs from FT to SAT but a larger
increase in costs from SAT to DAT
As compared to the references mentioned in Section 442 the updated cost estimates are
conservative Table 11 compares the estimated 2013 OampM costs with those references
However since these publications focused primarily on the CAPEX with very general OampM
cost assumptions the OampM costs presented therein are not considered representative
baselines for large-scale solar projects Furthermore they attest to the industryrsquos tendency to
focus strictly on installation costs and not lifecycle costs which is discussed further in Section
451
41
Table 11 2013 updated OampM costs compared to new referenced OampM costs (7-2) PV Configuration
OampM Costs
Units WorleyParsons 2013 Update
11
NREL 2013
12
IRENA 2013a
13
Photon 2013
14
Private OampM Service Providers
201315
Fixed Tilt (FT) FOM $kWyear 25 235 17 to 21 18 17 to 23
OPEX $kWh 00134 00216 to
00383
00121 to 00266
00098 00094 to 00127
Single Axis Tracking (SAT)
FOM $kWyear 30 Not provided
Not provided
Not provided
25 to 27
OPEX $kWh 00141 Not provided
Not provided
Not provided
00136 to 00147
Dual Axis Tracking (DAT)
FOM $kWyear 39 Not provided
Not provided
Not provided
32 to 34
OPEX $kWh 00173 Not provided
Not provided
Not provided
00174 to 00185
values in Italics are derived from reported data
451 OampM Learning Rates
In the rapid PV industry growth of the last three years WorleyParsons and anecdotal
experience is that PV was considered generally to require little to no maintenance causing a
general disregard for OampM planning This appears to have resulted in complications as
owners struggle to resolve reliability performance and budget issues as the projects mature
(multiple private sources) Although the maintenance costs are smaller compared to standard
power plants OampM awareness has been increasing in the industry and therefore the OampM
cost estimates have subsequently increased
This is supported through the recent focus of OampM at PV conferences (such as Sandia
National Laboratory and Solar Energy International events) on increasing the investment in
OampM practices in addition to improving the current practices products and services so that
PV plants can be better maintained to achieve higher reliability throughout the plant life
cycle Currently the majority of OampM expenses for PV systems consist of maintaining and
replacing the inverters followed by the Balance of System maintenance In general once the
appropriate level of investment in OampM for PV is reached then OampM costs will begin to
decrease as the following issues develop to maturity
technology improvement
inverter design for reliability and longevity
data monitoring for preventative and corrective maintenance support
system efficiency to increase system output for the same OampM expense
decreased capital costs for major equipment
decreased spare parts costs
11
See assumptions in Section 433 and 443 12
Report assumed 250kW rooftop at 7 to 10 capacity factor 13
Report assumed 1 of CAPEX and 9 to16 capacity factor 14
Values derived from the global weighted average calculations assuming 21 capacity factor and 20 year lifecycle Report assumed a
simple percentage of average selling price 15
Quote excluded weed abatement panel washing and inverter replacement reserve which were supplemented from the WP estimate
Calculations assumed 21 capacity factor
42
industry maturity and stability
reliable OEM support from product consistency and commercial stability
improved codes and standards for PV equipment system design installation
commissioning and OampM and
experience
trained and experienced personnel in the installation and maintenance of PV plants
In line with this trend owners system designers installers and OEMs are now including
OampM considerations in their finances designs services and products Even though there
have been and will continue to be cost reductions in OampM due to the industry maturation
stabilization and competition those cost reductions are balanced with the necessary
increases in OampM investment to meet the maintenance needs of existing and planned PV
plants resulting in a level OampM cost estimate for the next five years
Photon (2013) follows this assumption of consistent OampM costs for the next ten years as well
as WorleyParsons discussions with OampM service providers Therefore the assumption that
PV OampM costs will remain somewhat constant over the next five years before reducing again
appears to follow the projections in the industry
452 Conclusions - PV
The key findings from the AETA 2012 review and update of the PV OampM costs are as
follows
The 2013 WorleyParsons PV OampM costs update resulted in values of
$25kWyear for FT systems
$30kWyear for SAT
$39kWyear for SAT in 2012 USD
Fixed tilt configurations have not seen significant changes in OampM costs compared to
the 2012 AETA estimates while SAT and DAT configurations cost estimates have
reduced approximately 20-30 per cent based on a better understanding of the associated
OampM costs
Values obtained in the 2013 WorleyParsons update are more conservative but are
aligned with values provided by recognised international institutions even though few
detailed OampM breakdowns are available and
OampM costs for PV are expected to remain constant over the next five years before
reducing as the industry matures in both experience and long-term planning
capabilities
43
46 Concentrating Solar Power (CSP)
461 Introduction
This Section of the report focuses on the OampM costs for the following Concentrating Solar
Power (CSP) technologies
Parabolic Trough (PT)
Solar Tower (ST) and
Linear Fresnel (LF)
CSP OampM costs were analysed in terms of
Fixed Operating and Maintenance Costs (FOM)
Variable Operating and Maintenance Costs (VOM) and
Total Operating Expenditures (OPEX)
In order to arrive at comparable results between technologies BREE and WorleyParsons
estimated the OampM costs based on
Reference Plants with similar Solar Plant characteristics localisation net capacity
capacity factor hours of Thermal Energy Storage (TES) and type of cooling system(s)
and
Cost estimate amounts that were updated to 2012 USD
When information was not available necessary estimates were made using WorleyParsonsrsquo
in-house data and based on global market trends observed in various publications
462 Review of the evidence
The following international organisations were consulted to provide the AETA 2013 OampM
costs update for the selected CSP technologies
International Renewable Energy Agency (IRENA) (wwwirenaorg)
International Energy Agency (IEA) (wwwieaorg)
European Solar Thermal Electricity Association (ESTELA) (wwwestelarde)
The World Bank (WB) (wwwworldbankorg)
National Renewable Energy Laboratory (NREL) (wwwnrelgov)
Protermosolar (wwwprotermosolares)
Institute for Energy Diversification and Saving (IDEA) (wwwideaes)
Renovetec (wwwrenoveteces) and
CSP Today (wwwcsptodaycom)
The approach in reviewing OampM costs for the 2013 update for CSP technology was only to
use new sources of information published since the AETA 2012 report was written This was
44
maintained for all but the learning rates estimation which is due to the lack of any new
updated information published since 2012 in relation to this
Upon review of the available public domain information it was found that IEA ESTELA
WB Protermosolar Renovetec and IDEA do not have any new relevant public information
related to CSP OampM costs However IRENA 2013b IRENA 2013c and NREL 2012 are
new references from IRENA and NREL that are considered relevant and which were used in
this report
The information contained in these references did not provide updated costs for all of the
CSP technologies being considered in this Report and the values offered were not provided
in terms of FOM and VOM costs as preferred
Due to the lack of new relevant information in the public domain the AETA 2013 Model
Update process obtained reports from CSP Today a private international organisation
focused on news events reports updates and information for the CSP industry in markets
such as India South Africa Spain USA Chile and MENA regions The Update acquired the
last edition of PT and ST reports CSP Today 2012a and CSP Today 2012b for which OPEX
costs were analysed
463 AETA 2012 OampM CSP costs report comparison
Operating and Maintenance expenses were provided in terms of fixed and variable costs in
the AETA 2012 report and this Model Update has modified these for 2013 for PT ST and LF
technologies based on the references cited above and further consideration of learning rates
for the CSP industry
Most CSP projects with commercial operational experience are parabolic trough technology
as it is the most mature technology and currently more is reported and known about actual
costs than other CSP technologies Nevada Solar One as an example is a 64MWe parabolic
trough plant based in California which was commissioned in 2007 and it is the first plant
built after the SEGS development during the 1980-90s also in California
Andasol 1 the 50 MWe parabolic trough plant based in Spain is also the first CSP plant
worldwide to implement a commercial thermal energy storage system with a capacity of 75
hours of full load storage It commenced operation at the end of 2008 and other similar and
larger trough projects are now operating or being constructed
As the most mature CSP technology trough plant should be further down the operational and
design operability maturity path and hence have a lower opportunity for OampM cost
reductions through learning By contrast Solar Tower and Linear Fresnel systems are only
beginning to be deployed at larger scale and hence there is expected to be more potential to
reduce their capital and operating costs and improve performance
Learning rates have been argued by stakeholders as being very significant for CSP plant with
comments of the AETA 2012 report centring on this issue Disappointingly there is no new
published evidence or actual plant report data that could be found by the AETA stakeholders
and WorleyParsons to add to that used for the 2012 report There is however new evidence
on the reduction in LCOE for CSP technologies and WorleyParsons linked OPEX
contribution to these LCOE predictions so that a sense of future reductions could be made
This is outlined further in the following Sections
45
4631 ASSUMPTIONS AND CONSIDERATIONS
FOM and VOM Breakdown
The following costs are included in proceeding FOM cost estimates for CSP technologies as
an annual cost per MW capacity
Insurance
Labour costs and
Fixed service maintenance contracts
Similarly the following costs are included in the VOM cost estimates as a cost rate per MWh
of sent out energy
Material and maintenance costs spare parts equipment maintenance and unscheduled
inspections and
Utilities costs water auxiliary fuel and auxiliary power when applicable
Some items such as spare parts for scheduled maintenance could be considered FOM costs
However to simplify the comparison and to homogenise all of the analyses across
technologies all concepts related to plant material and maintenance were included in the
VOM costs
4632 AETA 2012 OampM CSP COSTS COMPARISON REPORT
The technical characteristics of the reference CSP Plants used in the AETA 2012 report have
been extracted from the AETA Model Version 1_0 (BREE 2012) and are summarised in
Table 12
Table 12 AETA 2012 Reference Plant Technical Characteristics
Plant
Characteristics
Units Parabolic
Trough
without
Storage
Parabolic
Trough
with
Storage
Solar
Tower
without
Storage
Solar
Tower
with
Storage
Linear
Fresnel
without
Storage
Linear
Fresnel
with
Storage
Plant Net Capacity MW 138 135 122 18 230 225
Location NA Unknown Unknown Unknown Unknown Unknown Unknown
Isolation kWhm2year Unknown Unknown Unknown Unknown Unknown Unknown
Hours of TES h - 7 - 6 - 6
Capacity Factor per cent 23 42 31 42 23 42
Type of Cooling NA Unknown Unknown Unknown Unknown Unknown Unknown
FOM $MWyear 60000 65000 70000 60000 65000 65000
VOM $MWh sent out 15 20 15 15 15 20
Based on the information above this Model Update estimated the following parameters for
the CSP technologies evaluated in this study
46
Total net energy production in terms of MWh delivered per year
FOM and VOM in terms of USD per year and
Total OPEX costs in terms of USD per year and USD per total net energy production
per year
The results are listed in Table 13 below Table 13 AETA 2012 OampM Opex costs on a per kWh basis
Plant
Characteristics
Units Parabolic
Trough
without
Storage
Parabolic
Trough
with
Storage
Solar
Tower
without
Storage
Solar
Tower
with
Storage
Linear
Fresnel
without
Storage
Linear
Fresnel
with
Storage
Plant Net Capacity MW 138 135 122 18 230 225
Net Energy sent out MWhyear 2780424 496692 3313032 662256 463404 827820
FOM $year 8280000 8775000 8540000 1080000 14950000 14625000
VOM $year 4170636 9933840 4969548 993384 6951060 16556400
OPEX $year 12450636 18708840 13509548 2073384 21901060 31181400
OPEX $kWh 00448 00377 00408 00313 00473 00377
FOM per cent 6650 4690 6321 5209 6826 4690
VOM per cent 3350 5310 3679 4791 3174 5310
The percentages of FOM and VOM costs as part of the total OPEX costs are presented in
Figure 5
Figure 5 AETA 2012 FOM and VOM Percentages of Total OPEX Costs
47
In Figure 5 FOM costs are in general terms significantly higher than VOM costs because
they include the higher cost items such as insurance labour costs and fixed service contracts
However as shown in the Figure VOM costs are higher or approximately equal to FOM
costs for technologies with energy storage given the criteria selected for the breakdown
between FOM costs and VOM costs FOM costs will remain relatively consistent from year-
to-year while VOM costs should be broken down even further since the costs of water
natural gas (if required) and electricity vary between locations and from one year to another
Total OPEX costs are expressed in terms of USD per total net energy production per year and
are between 00313 and 00473 USDkWh as listed in Table 13 These values are aligned
with the values provided by international institutions cited although they appear to be
somewhat inflated in comparison with those values that are closer to 0025 and 0035
USDkWh as published by others (eg IRENA)
4633 AETA 2013 OampM COSTS UPDATE
Similar Plant characteristics to AETA 2012 were considered for the appropriate comparison
of OampM costs for this update Plant characteristics include location net capacity capacity
factor hours of TES and type of cooling For this Report the characteristics of the reference
plants used are described in Table 14
Table 14 PT and ST Reference Plant Characteristics
Plant
characteristics
Units Parabolic
Trough without
Storage
Parabolic
Trough with
Storage
Solar Tower
without
Storage
Solar Tower
with Storage
Plant Net Capacity MW 100 100 100 100
Location NA MENA region MENA region MENA region MENA region
Isolation kWhm2year 2400 2400 2400 2400
Hours of TES h 0 6 0 6
Capacity Factor per cent 26 46 275 476
Type of Cooling NA Dry Dry Dry Dry
Source NA WorleyParsons CSP Today 2012a WorleyParsons CSP Today 2012b
The 2013 OampM costs were estimated using as a basis the information provided in the CSP
2012 reports (CSP 2012a and 2012 b) The following considerations were taken into account
the CSP Today reports only consider PT and ST plants with thermal storage
WorleyParsons made the following estimates based on experience with solar and
conventional power plants based on PT and ST technologies without TES
estimated the capacity factor based on plant capacity location and type of cooling
adjusted the insurance material and maintenance and labour costs based on the
solar field reduction factor when applicable
adjusted the steam turbine maintenance based on the potential hours of operation
48
adjusted the plant electricity and water consumption based on the total net
production
assumed similar auxiliary fuel consumption for the plant with and without TES This
assumption is due to the reference plants being based in the same location thus
requiring similar auxiliary fuel consumption for start-up Minimal differences in
auxiliary fuel consumption for freeze protection due to increased time offline for a
plant without TES system compared to a plant with TES are expected but not
considered in this Report as the impact would be minor
the capacity factor provided by CSP Today for PT with thermal storage is considered
high Based on the plant location and capacity WorleyParsons would anticipate the
capacity factor to be closer to 42 per cent instead of 46 per cent as indicated in Table
14 above This difference in capacity factor directly impacts the estimated VOM cost
which is correlated with plant production For comparison purposes the value provided
by CSP Today has maintained and
with respect to Linear Fresnel technology updated information has not been published
since the AETA 2012 report release by the references listed in Section 462 which
WorleyParsons consulted For the purpose of updating the estimates to 2013 it was
assumed that the evolution of the OampM costs would be similar to that of parabolic
trough plants and the same escalation factors were applied
The resulting 2013 and 2012 OampM costs are listed in Table 15 below for comparison
Table 15 2013 CSP OampM Costs Compared to 2012 OampM Costs
CSP Technology OampM Costs AETA 2012 WorleyParsons 2013 update
Parabolic Trough
without Storage
FOM $MWyear 60000 59176
VOM $MWh sent out 1500 1519
OPEX $kWh 00448 00412
Parabolic Trough with
Storage
FOM $MWyear 65000 72381
VOM $MWh sent out 2000 1139
OPEX $kWh 00377 00293
Solar Tower without
Storage
FOM $MWyear 70000 58285
VOM $MWh sent out 1500 707
OPEX $kWh 00408 00313
Solar Tower with
Storage
FOM $MWyear 60000 71372
VOM $MWh sent out 1500 565
OPEX $kWh 00313 00228
Linear Fresnel without
Storage
FOM $MWyear 65000 64107
VOM $MWh sent out 1500 1519
OPEX $kWh 00473 00434
49
CSP Technology OampM Costs AETA 2012 WorleyParsons 2013 update
Linear Fresnel with
Storage
FOM $MWyear 65000 72381
VOM $MWh sent out 2000 1139
OPEX $kWh 00377 00293
The total OPEX costs per year from the AETA 2012 report and the WorleyParsonsrsquo estimates
that were updated for 2013 are compared in Figure 6 below
Figure 6 Comparison of OPEX Costs per Total Annual Plant Production per Year AETA 2012
Report and 2013 Update
Reductions of approximately 20 - 27 per cent in OampM costs would be realised by CSP with
TES according to the updated 2013 WorleyParsons estimates compared to the same costs
reported in the AETA 2012 report However reductions for PT and LF without TES were
found to be lower at approximately 8 per cent
The IRENA reports (IRENA 2013b IRENA 2013c) provide values for OPEX between 0025
and 0035 USDkWh for PT and ST technologies with and without TES Values updated to
2013 by WorleyParsons are between 0023 and 00412 USDkWh for PT and ST
technologies which align with the IRENA values However IRENA does not differentiate
between the utilisation of TES Solar technologies without TES have fewer hours of
production and although OPEX costs are lower in terms of USDMW compared with solar
technologies with TES OPEX costs in terms of costs per total annual plant production per
year will typically be higher for technologies that do not use TES
4634 OampM CSP LEARNING RATES
Cost reductions on CSP technologies are expected to come from the following main actions
economies of scale in the plant size and manufacturing industry
learning impacts on design construction and operation phases
50
advances in RampD of the following factors
Components Solar receivers mirrors HTF storage media supporting structures
trackers and auxiliary systems
Systems Direct steam generation storage systems or hybrid cooling systems
Configurations Hybridisation or duel electricity water plants
a more competitive supply chain
improvements in the performance of the solar field solar-to-electric efficiency and
thermal energy storage systems
increases in the life of plants and
reduced financial costs
Based on the parameters listed above the LCOE from Solar Thermal technologies is likely to
be continuously decreasing and this is born out in the literature that has been reviewed Based
on the IRENA 2013b report the evolution of the LCOE from trough and power tower CSP
technologies shows how the LCOE is decreasing as technology development increases in
Table 16 below Estimates for LCOE for the hypothetical trough and tower CSP plants in
2014 are also included
51
Table 16 Estimated LCOE form Existing and Hypothetical Trough and Solar Tower CSP Technologies
CSP
Technology
Year Capacity
(MW)
Plant Name Location DNI
(kWhm2year)
LCOE 2012
$kWh Installed
Trough
1981 05 PSA Spain 2000 064
1983 138 SEGS I California 2700 039
1989 30 SEGS II ndash VIII California 2700 026
1992 80 SEGS VIII amp IX California 2700 020
2008 - 2009 50 Andasol 1 2 Spain 2000 035
2010 50 Solnova 1 amp 3 Spain 2000 034
2010 - 2011 50 Extresol 1 amp 2 Spain 2000 035
2014 250 Unspecified (wet
cooling no storage)
Not provided Not provided 020
Tower
1987 10 Solar One California 2700 058
2007 11 PS10 Spain 2000 034
2009 20 PS20 Spain 2000 036
2011 199 Gemasolar (wet
cooling 15hr
storage)
Spain 2000 033
2014 120 Unspecified
(dry cooling
storage)
Not Provided Not provided 015
International Institutions such as IRENA ESTELA or the World Bank agree that the LCOE
and capital cost reductions of 28 per cent to 60 per cent are envisioned by 2020 ndash 2025 for
such plant Estimates of possible LCOE reductions for CSP technology from 2012 to 2025
are provided in Figure 7 taken from Kearny (2010)
52
Figure 7 Expected LCOE Reductions for CSP Technology from 2012 to 2025
Source (Kearny 2010)
The OampM maintenance costs of modern CSP Plants are lower than those for Californian
SEGS Plants built in the 1980s and 1990s which has a total combined capacity of 354 MW
and estimated OampM costs of USD 004kWh (IRENA 2013b) However CSP experienced no
growth from early 1990s until the mid-2000s as can be seen in Table 16 above
As stated at the beginning of Section 462 Andasol 1 was the first 50 MWe parabolic trough
plant built after SEGS which included a thermal energy storage system It commenced
operation at the end of 2008 Podewils (2008) estimated Andasol 1 OampM costs of EUR
0072kWh or USD 0095kWh (considering 2012 medium rate exchange EURUSD of
07553) This value is high compared to OPEX estimations for PT with TES provided by
both this 2013 update and the AETA 2012 report (00293 and 00377 USDkWh
respectively) Therefore according to the information detailed above considerable learning
improvements to OampM costs have been already achieved from the commencement of
operation of Andasol 1 to the time of this Report
`WorleyParsonsrsquo estimations on the LCOE of parabolic trough plants is in the range of
USD 020kWh to USD 035kWh and that of solar towers between USD 017kWh and
USD 029kWh However in areas with excellent solar resources the range could be as low
as USD 014kWh to USD 018kWh
The following considerations have been taken into account for OampM cost learning rates
forecast
WorleyParsons LCOE estimations as set out above
Potential average envisaged LCOE reductions of 475 per cent by 2025 based on Figure
7 above
OPEX contribution on LCOE of 20 per cent and
53
assuming that all components involved in the LCOE (CAPEX OPEX and financial
expenses) reduce at the same rate so percentage contributions remain constant
According to these considerations WorleyParsons estimates that OPEX values by 2025 could
reach from 0021 to 0037 USDkWh for PT technology and from 0018 to 0031 USDkWh
for ST technology
Technological improvements have reduced the requirement of replacing mirrors and
receivers Automation has reduced the cost of other OampM procedures by as much 30 per
cent As a result of OampM procedure improvements (both cost and plant performance) the
total OampM costs of CSP plants in the long-term are likely to be below USD 0025kWh
(IRENA 2013b)
Parabolic trough system in the United States would have OampM costs of around USD 002 to
USD 003kWh meanwhile the OampM costs of parabolic trough and solar tower power plants
currently under construction in South Africa have estimated OampM costs of between USD
0029 and USD 0036kWh (also IRENA 2013b)
WorleyParsons estimations are in alignment with IRENA estimations in terms of current and
envisaged CSP OPEX costs
4635 CONCLUSIONS ndash CSP
The following main conclusions were made based on this study in relation to CSP
technologies
the 2013 WorleyParsons CSP OampM costs update resulted in values between 0023 and
0043 USDkWh based on 2012 USD
reductions in CSP OampM costs between 8 per cent and 27 per cent were obtained in
comparison to values provide in AETA 2012 report
the total OampM costs of CSP Plants in the long-term are likely to be below USD
0025kWh
the updated values for 2013 by WorleyParsons are in alignment with the values
provided by recognised international institutions and
at the time of this report the only CSP technology with substantial operation capacity
was PT Only three utility-scale ST plants were in operation at the time of this report
(PS-10 PS-20 and Gemasolar) of which only one (Gemasolar) uses TES Though
several process steam and small-scale LFR Plants are currently in operation only one
utility-scale LFR (Puerto Erradio 2) was in operation at the time of this report
47 AETA 2013 OampM Learning Rate recommendation
The learning rate used in AETA 2012 for OampM is applied to all technologies assessed and
includes fossil fuel technologies and emerging technologies The learning rate is set at an
improvement of 02 per cent per annum
In addition to the improvement rate OampM is escalated at a rate of 150 per cent of CPI per
year based on experience with increases in parts and labour costs
The CPI rate set in the model is 25 per cent per annum
54
OampM cost information in the public domain in both quantum and quality is poor for
contemporary data Information supporting OampM learning rates is equally poor There are
indications that emerging technologies do have the potential for increased OampM learning
rates relative to mature technologies
For the renewable energy technologies studied in this report onshore wind is considered
mature and it is recommended that the AETA 2012 report value of 02 per cent is maintained
For all other renewable energy technologies studied in this report a more aggressive learning
rate of 25 per cent is recommended This will effectively cancel out the CPI escalation
adjustment and provide a ldquoflat linerdquo OampM rate for future years This will provide a value in
line with the learning rate conclusions for PV
The learning rate for CSP is considered to have greater potential for reduction but due to the
high level of analysis in this report (and therefore uncertainty) it is proposed that a maximum
of two learning rates is appropriate for the AETA model
Table 17 AETA Learning Rate Comparison
AETA 2012 Learning Rate AETA 2013 update Learning Rate
Onshore Wind 02 per cent 02 per cent
Offshore Wind
PV ndash all technologies
CSP ndash all technologies
02 per cent 25 per cent
55
5 CHANGES TO THE LCOE
Changes to the model parameters described in the earlier sections have resulted in changes to
the LCOE estimates for a number of technologies The LCOE estimate values for all
technologies and associated range of uncertainty are shown in the Figures 8 to 13 below
Note that the values listed are for a base value carbon price modifier of zero per cent which
places no value on carbon emissions
For selected technologies where there are significant cost differences Figure 14 provides a
comparison of mid-range LCOE values for the AETA 2013 and AETA 2012 Models Key
features of the Figures 8 to 14 are as follows
both in AETA 2012 and 2013 Model update LCOE costs are provided for the years
2012 2020 2025 2030 2040 and 2050
cost ranges are provided for each technology that accounts for differences in fuel prices
and state-based variations
LCOE costs vary substantially across the technologies from $89MWh (combined cycle
gas turbine) to $351MWh (solar thermal linear fresnel) in 2012 and $73MWh (PV
non-tracking) to $247MWh (IGCC black coal CCS) in 2050
the inter-technology LCOE comparisons figures (Figures 8 to 13) reveal changes in
relative costs of technologies over time Key results include renewable technologies
have higher LCOEs than the lowest cost non-renewable technologies and the relative
LCOE rankings significantly change post 2030 The LCOE of solar PV become lower
than the non-renewables from mid 2030 onwards and
large changes in LCOE results between AETA 2013 Update and AETA 2012 are
depicted in Figures14 below Figure 14 compares LCOEs at 2050 between the AETA
2013 Update and AETA 2012 for a selected number of technologies that have changed
significantly for NSW (AETA developed LCOEs by each Australian state) Differences
in technology LCOEs are explained by a multiplicity of factors including the technical
developments OampM costs and learning rate changes
56
Figure 8 Updated LCOEs for AETA 2013 Model technologies values for 2012 (NSW) with carbon price set to zero
0
50
100
150
200
250
300
350
400
450
500
LCO
E ($
MW
h)
LCOE FOR 2012 TECHNOLOGIES (NSW) Note Default region is NSW except bown coal
technologies (VIC) and SWIS scale (as specified)
LCOE includes where relevant allowance for- Carbon Price- CO2 transport and sequestration cost- Plant capital cost (EPC basis) within battery limits- Owners costs excluding interest during construction- Fixed and variable operating costs- Fuel costs- Economic escalation factors
57
Figure 9 Updated LCOEs for AETA 2013 Model technologies values for 2020 (NSW) with carbon price set to zero
0
50
100
150
200
250
300
350
400
450
LCO
E ($
MW
h)
LCOE FOR 2020 TECHNOLOGIES (NSW) Note Default region is NSW except bown coal
technologies (VIC) and SWIS scale (as specified)
LCOE includes where relevant allowance for- Carbon Price- CO2 transport and sequestration cost- Plant capital cost (EPC basis) within battery limits- Owners costs excluding interest during construction- Fixed and variable operating costs- Fuel costs- Economic escalation factors
58
Figure 10 Updated LCOEs for AETA 2013 Model technologies values for 2025 (NSW) with carbon price set to zero
0
50
100
150
200
250
300
350
400
LCO
E ($
MW
h)
LCOE FOR 2025 TECHNOLOGIES (NSW) Note Default region is NSW except bown coal
technologies (VIC) and SWIS scale (as specified)
LCOE includes where relevant allowance for- Carbon Price- CO2 transport and sequestration cost- Plant capital cost (EPC basis) within battery limits- Owners costs excluding interest during construction- Fixed and variable operating costs- Fuel costs- Economic escalation factors
59
Figure 11 Updated LCOEs for AETA 2013 Model technologies values for 2030 (NSW) with carbon price set to zero
0
50
100
150
200
250
300
350
400
LCO
E ($
MW
h)
LCOE FOR 2030 TECHNOLOGIES (NSW) Note Default region is NSW except bown coal
technologies (VIC) and SWIS scale (as specified)
LCOE includes where relevant allowance for- Carbon Price- CO2 transport and sequestration cost- Plant capital cost (EPC basis) within battery limits- Owners costs excluding interest during construction- Fixed and variable operating costs- Fuel costs- Economic escalation factors
60
Figure 12 Updated LCOEs for AETA 2013 Model technologies values for 2040 (NSW) with carbon price set to zero
0
50
100
150
200
250
300
350
400
LCO
E ($
MW
h)
LCOE FOR 2040 TECHNOLOGIES (NSW) Note Default region is NSW except bown coal
technologies (VIC) and SWIS scale (as specified)
LCOE includes where relevant allowance for- Carbon Price- CO2 transport and sequestration cost- Plant capital cost (EPC basis) within battery limits- Owners costs excluding interest during construction- Fixed and variable operating costs- Fuel costs- Economic escalation factors
61
Figure 13 Updated LCOEs for AETA 2013 Model technologies values for 2050 (NSW) with carbon price set to zero
0
50
100
150
200
250
300
350
400
LCO
E ($
MW
h)
LCOE FOR 2050 TECHNOLOGIES (NSW)
LCOE includes where relevant allowance for- Carbon Price- CO2 transport and sequestration cost- Plant capital cost (EPC basis) within battery limits- Owners costs excluding interest during construction- Fixed and variable operating costs- Fuel costs- Economic escalation factors
Note Default region is NSW except bown coal
technologies (VIC) and SWIS scale (as specified)
62
Figure 14 Comparison of AETA 2013 Model and AETA 2012 Model LCOE estimates selected technologies 2050
0
50
100
150
200
250
AETA 2012
AETA 2013
63
51 Conclusions
The Australian Energy Technology Assessment (AETA 2012) provided the best available and most up-to-
date cost estimates for 40 electricity generation technologies under Australian conditions To ensure that
the cost estimates for the various technologies are consistent all common input costs (eg labour
materials components carbon price) were itemised To ensure that the AETA costings remain up to date
AETA costs are reviewed in this AETA 2013 Model Update report
The AETA 2013 refresh was developed in close consultation with a stakeholder reference group drawn
from industry and researchacademic organisations with interests and expertise in a diverse range of
electricity generation technologies
The AETA 2013 Model results reflect the change to exclude the value of a carbon price in the Levelised
Cost of Energy (LCOE) All technologies have experienced a minor reduction in LCOE relative to 2012
(offset in some cases by other factors) due to the change to an amortisation period of 30 years plus the
construction period
Comparing the 2012 AETA results without a carbon price to the 2013 results without a carbon price there
are significant reductions in the LCOE of solar technologies and onshore wind This is as a consequence of
changes to the fixed and variable Operations and Maintenance (OampM) costs for these technologies For the
solar technologies the adjustment of the capital learning rate to 25 per cent has also contributed to the
LCOE reduction Offshore wind also has an increased learning rate but this has been offset to a large extent
by increased variable OampM costs
Nuclear LCOE has increased significantly due to higher estimates for capital costs
Efficiency for coal fired plants with CCS retrofits has been revised downwards to better reflect the expected
efficiency of these plants and has the effect of increasing the LCOE
64
REFERENCES
Albers A 2009 OampM Cost Modeling Technical Losses and Associated Uncertainties Proceedings of the
2009 European Wind Energy Conference Marseilles France March
AWEA (American Wind Energy Association) 2013 AWEA US Wind Industry Annual Report ndash Year
Ending 2012 USA
BNEF (Bloomberg New Energy Finance) 2013 Operations and Maintenance (OampM) Price Index Issue II
Wind Research Note April
BREE (Bureau of Resources and Energy Economics) 2012 AETA Report and Model Version 1_0 2012
Australian httpwwwbreegovau
CEC (Clean Energy Council) 2013 Australian Energy Technology Assessment 2013 Review Letter to
BREE of 20 May 2013 from the Clean Energy Council (Mr Russel Marsh signatory for the CEC)
CEC (Clean Energy Council) 2013 Clean Energy Council Renewable Energy Map Australia June (data
noted as current as of 21 August 2012)
httpwwwcleanenergycouncilorgauresourcecentreplantregistermaphtml
Crown Estate 2012 Offshore Wind Cost Reduction Pathways Study United Kingdom May
CSP 2012a CSP Parabolic Trough Report Cost Performance and Key Trends CSP Today
CSP 2012b CSP Solar Tower Report Cost Performance and Key Trends CSP Today
Deloitte amp Touche 2012 European Wind Services Study Find Out Which Way the Wind Blows Deloitte amp
Touche GmbH Wirtschaftspruumlfungsgesellschaft August
Deloitte 2011 Economics of wind development in New Zealand Deloitte for the for the New Zealand Wind
Energy Association
Ebert P amp Ware J 2013 The Role of Independents in the Wind Farm Operations amp Maintenance
Proceedings of the 2013 New Zealand Wind Energy Conference and Exhibition March
EPRI (Electric Power Research Institute) 2010 Engineering and Economic Evaluation of Central-Station
Solar Photovoltaic Power Plants USA March
GlobalData 2012 Wind Operations amp Maintenance (OampM) Market ndash Global Market Size Share by
Component Competitive Landscape and Key Country Analysis to 2020 GlobalData reference code
GDAE1054MAR January
Hand M 2013 Wind Plant Cost of Energy Proceedings of the 2nd NREL Wind Energy System
Engineering Workshop January
Hassan G 2011 Review of the Australian Wind Energy Industry Clean Energy Council Australia 2011
Houston C 2013 The Real Truth About Wind Farm OampM Costs North American WindPower March
IEA (International Energy Agency) 2008 Technology Roadmap Solar photovoltaic energy France
httpwwwieaorgpublicationsfreepublicationspublicationpv_roadmappdf
IRENA (International Renewable Energy Agency) 2013a Solar Photovoltaics Technology Brief Germany
January httpwwwirenaorgDocumentDownloadsPublicationsIRENA-ETSAPper
cent20Techper cent 20Briefper cent20E11per cent20Solarper cent20PVpdf
65
IRENA (International Renewable Energy Agency) 2013b Concentrating Solar Power Technology Brief
Germany January
IRENA (International Renewable Energy Agency) 2013c Renewable Power Generation Costs in 2012 An
Overview Germany
IT Power 2013 Analysis of the AETA 2012 cost estimates of CSP technologies Clean Energy Council
submission to the Bureau of Resources and Energy Economics May
Kann S 2012 US Solar Market Insight Report Q3 California USA
Kearny A 2010 Solar Thermal Electricity 2025 ndash clean electricity on demand attractive STE costs
stabilize energy production ATKearny consultants Dusseldorf Germany
Muirhead J 2013 SEGS experience suggests that CSP will age gracefully CSP Today South Africa
httpsocialcsptodaycommarketssegs-experience-suggests-csp-will-age-
gracefullysthash6VkxFaD0dpuf
NREL (National Renewable Energy Laboratories) 2011 IEA Wind Task 26 ndash Multi-national Case Study of
the Financial Cost of Wind Energy Technical Report NRELTP-6A2-48-48155 March
NREL (National Renewable Energy Laboratories) 2012 Cost and Performance Data for Power Generation
Technologies USA February
NREL (National Renewable Energy Laboratories) 2013 Breakeven Prices for Photovoltaics on
Supermarkets in the United States March httpwwwnrelgovdocsfy13osti57276pdf
NREL (National Renewable Energy Laboratories) 2013 Breakeven Prices for Photovoltaics on
Supermarkets in the United States USA March httpwwwnrelgovdocsfy13osti57276pdf
Photon 2012 The True Cost of Solar Power 2012 Temple of Doom Solar Power in Focus Series Photon
Consulting
Photon 2013 Solar Annual 2013 Build Your Empire Photon Consulting
Podewils C 2008 Photovoltaic vs Solar Thermal where PV has the upper hand and where solar thermal
strikes back Photon International Germany November
Poore R and Walford C 2008 Development of an Operations and Maintenance Cost Model to Identify
Cost of Energy Savings for Low Wind Speed Turbines Report NRELSR-500-40581 National
Renewable Energy Laboratory January
RolandBerger 2013 Offshore Wind Towards 2020 On the Pathway to Cost Competitiveness RolandBerger
Consultants Germany April
See wwwcsptodaycom
See wwwepiaorg
See wwwestelasolarde
See wwwidaees
See wwwieaorg
See wwwirenaorg
See wwwnrelgov
See wwwprotermosolares
66
See wwwrenoveteces
See wwwseiaorgau
See wwwsolarelectricpowerorg
See wwwworldbankorg
UK Crown Estate 2012 Offshore Wind Cost reduction Study May
US DoE (Department of Energy) 2013 Award Number DE-EE0005360 USA February
Wiser R Lantz E Bolinger M amp Hand M 2012 Recent Developments in the Levelized Cost of Energy
from US Wind Power Projects Contract No DE-AC02-05CH11231 National Renewable Energy
Laboratories February
67
Appendix A
Electricity Generation Technologies in AETA 2012 Report and Model
The 40 AETA electricity generation technologies are
1 Integrated Gasification and Combined Cycle (IGCC) plant based on brown coal
2 IGCC plant with Carbon Capture and Sequestration (CCS) based on brown coal
3 IGCC plant based on bituminous coal
4 IGCC plant with CCS based on bituminous coal
5 Direct injection coal engine (clean lignite eg brown coal technology)
6 Pulverised coal supercritical plant based on brown coal
7 Pulverised coal supercritical plant with post combustion CCS based on brown coal
8 Pulverised coal subcritical plant with post combustion CCS based on brown coal (retrofit)
9 Pulverised coal supercritical plant based on bituminous coal
10 Pulverised coal supercritical plant based on bituminous coal - SWIS relevant scale
11 Pulverised coal supercritical plant with CCS based on bituminous coal
12 Pulverised coal subcritical plant with post combustion CCS based on bituminous coal (retrofit)
13 Adding CCS to existing Combined Cycle Gas Turbine (CCGT) power plants (retrofitting)
14 Oxy combustion pulverised coal supercritical plant based on bituminous coal
15 Oxy combustion pulverised coal supercritical plant with CCS based on bituminous coal
16 Combined cycle plant burning natural gas
17 Combined cycle plant burning natural gas - SWIS relevant scale
18 Combined cycle plant with post combustion CCS
19 Open cycle plant burning natural gas
20 Solar thermal plant using compact linear fresnal reflector technology wo storage
21 Solar thermal plant using parabolic trough technology wo storage
22 Solar thermal plant using parabolic trough technology with storage
23 Solar thermal plant using compact linear fresnal reflector technology with storage
24 Solar thermal plant using central receiver technology wo storage
25 Solar thermal plant using central receiver technology with storage
26 Solar photovoltaic (PV) - non-tracking
27 Solar photovoltaic (PV) - single axis tracking
28 Solar photovoltaic (PV) - dual axis tracking
29 Wind (on-shore)
30 Wind (off-shore)
31 WaveOcean
68
32 Geothermal - hot sedimentary aquifer (HSA)
33 Geothermal - enhances geothermal system (EGS)
34 Landfill gas power plant
35 Sugar cane waste power plant
36 Other biomass waste power plant (eg wood)
37 Nuclear Gen 3+
38 Nuclear Small Modular Reactors (SMR)
39 Solarcoal hybrid
40 Integrated solar combined cycle (ISCS) ndash parabolic trough with combined cycle gas
69
Appendix B
Consultations with Stakeholders
This study has been undertaken in close consultation with a Stakeholder Reference Group drawn from
Australian industry and domestic as well as overseas researchacademic organisations with interests and
expertise in a diverse range of electricity generation technologies These stakeholders were invited to
provide evidence of the latest estimates for the costs and performance of various technologies
In addition the AETA project also had a Project Steering Committee comprising staff from BREE
AEMO CSIRO and other independent experts to provide technical advice and support The following
agencies participated in the stakeholder reference group meetings or were forwarded the documents
presented at the meetings
AETA Stakeholder Reference Group
Australian Coal Association
Australian Energy Market Operator
Australian Geothermal Energy Association
Australian National Low Emissions Coal RampD
Australian National University
Australian Renewable Energy Agency
Australian Solar Thermal Energy Association
Australian Sugar Milling Council
Australian Treasury
Bureau of Resources and Energy Economics
Clean Energy Council
CSIRO
Department of Industry
Economic Research Institute for ASEAN and East Asia
Energy Retailers Association of Australia
Energy Users Association of Australia
Evans and Peck
Ferrostaal
Global CCS Institute
Grid Australia
Intergen
International Energy Agency France
International Power Suez
IRENA Innovation and Technology Centre Germany
70
National Generators Forum
Oceanlinx Limited
Origin Energy
Private Generators Group
The Institute of Energy Economics Japan
The Energy Research Institute New Delhi
University of Melbourne Energy Institute
University of Queensland Energy Initiative
UQ Energy Economics amp Management Group
Wyldgroup
WorleyParsons
Two AETA Stakeholders Reference Group meetings took place on 30 April 2013 and 17 July 2013 In
addition the AETA Project Steering Committee met on 24 June 2013
71
BREE contacts Executive Director BREE Bruce Wilson brucewilsonretgovau
(02) 6243 7901
Deputy Executive Director Wayne Calder waynecalderbreegovau
(02) 6243 7718
Modelling amp Policy Integration Arif Syed arifsyedbreegovau
Program Leader (02) 6243 7504
Data Statistics Geoff Armitage geoffarmitagebreegovau
Program Leader (02) 6243 7510
Energy and Quantitative Analysis Allison Ball allisonballbreegovau
Program Leader (02) 6243 7539
Resources ndash Program Leader John Barber johnbarberbreegovau
(02) 6243 7988
72

15
changes for wind and solar technologies covered in AETA 2012 Updated LCOE graphs as
well as a comparison of the resultant AETA 2013 Model and AETA 2012 Model LCOEs are
presented in section 5 which also presents concluding comments
16
2 AETA MODEL PARAMETER CHANGES
21 Stakeholder Initiated Changes
Consultations for the AETA 2013 Model update identified the following issues for
consideration
nuclear technology capital costs and lsquofirst year available for constructionrsquo
CCS retrofit thermal efficiency
amortisation period for all technologies and
OampM costs
The OampM issue is discussed in section 4 whereas rest of the issues are discussed below
211 Nuclear Capital Costs
The AETA 2012 report and model presents costs for first of a kind (FOAK) and Nth of a kind
(NOAK) nuclear technologies There could have been some confusion from the original
wording of Section 310 of AETA 2012 report It starts by discussing Gen III plants currently
sold (presumably NOAK) however further in the document Gen III plants are referred to as
FOAK The AETA 2012 report states that the capital costs are based on nuclear power plants
in the US The NOAK value is what is represented in Table 3101 in the AETA 2012 report
and model
Although there are cost adjusting factors used for other technologies studied in the AETA
2012 report there is no adjustment of the US cost base for Australian labour costs and for
adjustment of Australian equipment costs Submissions indicated that an adjustment to costs
should also be used for nuclear to ensure there is commonality in the comparison
This suggestion was considered appropriate and adjustment to the costs for nuclear
technologies was made Based on the factors to convert US rates to Australian rates used in
the fossil fuel technologies ie the factors from the Thermoflow software the new nuclear
capital costs were calculated The multiplier from Thermoflow for labour costs is 205 and
the factor for equipment costs is 13 both US to Australia
Additionally it was submitted that the first year available for construction of nuclear
technologies be extended In support of this the submission argued that nuclear technologies
are examples of generation technology where legislation regulation and public policy
planning is highly region-dependent and must therefore precede deployment by several years
This was considered an appropriate submission and therefore the first year available for
construction in the model has been changed from 2012 to 2020 These changes are shown in
Table 1
17
Table 1 Model Changes Nuclear Technologies
AETA 2012 report reference AETA 2012 model value AETA 2013 update
Technology 37 Nuclear (GW Scale LWR)
Change first year available for Construction
2012
2020
Technology 37 Nuclear (GW Scale LWR)
Convert FOAK Capital Cost to Australian productivity
and commodity costs
4210
6392
Technology 37 Nuclear (GW Scale LWR)
Convert NOAK Capital Cost to Australian productivity
and commodity costs
3470
5268
Technology 38 Nuclear (SMR)
Convert FOAK Capital Cost to Australian productivity
and commodity costs
7908
11778
Technology 38 Nuclear (SMR)
Convert NOAK Capital Cost to Australian productivity
and commodity costs
4778
7116
The overall impact of these parameters on individual technology LCOE changes is given in
the AETA 2013 Model and in Section 5
212 Carbon Capture and Storage (CCS) Retrofit Thermal Efficiency
Subcritical coal technologies with CCS retrofit were reported to have only slightly lower
thermal efficiency values compared with new build supercritical technologies with CCS in
the AETA 2012 Model This was an oversight in the AETA 2012 Model
The AETA 2012 report identified the thermal efficiency to retrofit subcritical brown and
black coal plants as 216 per cent and 301 per cent respectively (Table 312) In the same
table the efficiency for new build supercritical brown and black coal plants is reported to be
208 per cent and 314 per cent respectively
The thermal efficiencies were revised down based on actual operating efficiencies of existing
coal facilities in Victoria and NSW and factored based on the thermal efficiency ratio of new
coal facilities with and without CCS
A reduction in thermal efficiency is to be expected when applying a retrofit CCS to the plant
The CCS factor in the following representation refers the efficiency reduction factors for
adding CCS to a coal fired power station The useful output will reduce from the new
parasitic loads to run the CCS equipment
Thermal efficiency of existing brown coal plant in Victoria is 265 per cent and the CCS
factor is 064 Similarly the thermal efficiency of existing bituminous coal plant in NSW is
355 per cent and the CCS factor is 075
Table 311 and 312 of the AETA 2012 report show a reduction is present when comparing
the supercritical with no CCS compared to supercritical with CCS However the retrofit case
was only provided for the subcritical technology only and no case was included in the AETA
2012 for a subcritical plant with any CCS
A review of the values in Table 312 through comparison to the existing efficiency of
installed black and brown coal fleet in Australia was undertaken For brown coal the current
18
sent out thermal efficiency is 265 per cent for a 500 MW subcritical unit For supercritical
brown coal without CCS the sent out efficiency is 323 per cent Applying the same reduction
factor the thermal efficiency with CCS retrofitted should be 17 per cent in lieu of 216 per
cent as published in AETA 2012 report
For black coal the current sent out thermal efficiency is 355 per cent for a 660 MW
subcritical unit For supercritical black coal without CCS the sent out efficiency is 419 per
cent Applying the same reduction factor the thermal efficiency with CCS retrofitted should
be 266 per cent in lieu of 301 per cent as published AETA 2012 report (Table 2)
Table 2 Model Changes CCS Retrofit Thermal Technologies
AETA 2012 report reference AETA 2012 model value AETA 2013 update
Technology 8 Pulverised coal subcritical plant
with post combustion CCS based on brown coal
(retrofit)
Thermal Efficiency
216
170
Technology 12 Pulverised coal subcritical plant
with post combustion CCS based on bituminous
coal (retrofit)
Thermal Efficiency
301
266
19
213 Amortisation period
There was stakeholder consensus that the operating period for all technologies needs to be set
to thirty years and that the construction time is in addition to the operating time The financial
amortisation period is common for all technologies and is set at 30 years In the AETA 2012
model section 24 (a) nominates that the amortisation period of 30 years is from the
commencement of construction The amortisation period has now been changed (Table 3)
Examples of the change are
Nuclear LWR ndash GW scale In AETA 2012 report amortisation period was 30 years inclusive
of construction and operation The amortisation period has now changed to 36 years (30
operating and 6 years construction)
Solar parabolic trough In AETA 2012 report amortisation period was 30 years inclusive of
construction and operation The amortisation period has now changed to 33 years (30
operating and 3 years construction)
Table 3 Model Changes amortisation period
AETA 2012 report reference AETA 2012 model value AETA 2013 update
Common Amortisation period
for construction and operation
Amortisation period for
operation includes
construction for all
technologies
Amortisation period for
operation to exclude
construction for all
technologies
22 No Carbon Pricing
For the 2013 AETA update the carbon price modifier has been set to zero per cent as the
base value for the results presented in this report with the effect of applying a zero carbon
price to all technologies throughout the study period to 2050 The AETA 2013 Model
however has the option of changing this parameter by the user
20
3 CONSIDERATION OF OTHER ISSUES
This section summarises the issues that were discussed during the AETA 2013 Model Update
with AETA stakeholders but have not led to a change in the model However these issues do
not cover the OampM costs considerations that are detailed in section 4
31 Representation of Uncertainty
The recognition of uncertainty within the model was discussed including both the level of
representation and potential uncertainties with respect to First-of-a-Kind and lsquoEarly Moverrsquo
Technologies
A number of factors were identified that lead to uncertainty in estimates ndash particularly for
emerging technologies For conventional coal and gas technologies even though the
technology is mature the addition of carbon capture introduces cost and performance
uncertainty Cost estimates have inherent uncertainty due to the market uncertainties and
unforeseeable technological developments and due to
- Volatility in equipment pricing
- Volatility in economic conditions (during post Global Financial Crisis) and
- Volatility in labour pricing due to ldquootherrdquo heavy construction projects in specific areas
For technologies where the costs are well understood it was considered that the error bars
should be reduced compared to immediate and emerging technologies and that the error bars
should be lower for technology costs in 2012 compared to later years
There is strong agreement from two key stakeholder submissions with all the factors causing
uncertainty that have been identified in AETA 2012 In particular the labour cost has varied
(increased) significantly due to large construction projects which have increased costs due to
a shortage of labour and a lower productivity due to less experienced personnel The
uncertainties provided in the AETA model are available on a per technology and a per
selected years basis BREE will consider whether or not to include more detail on
uncertainty by technology in the 2014 review of the model
32 Application of Learning Curves
It was raised during the consultation process that the AETA model revision could allow for
learning curve cost reduction assumptions to be altered by the end user This has not been
incorporated in the 2013 update as it is a structural change to the AETA Model
Stakeholders also raised the question as to whether it is possible within the application of
learning curves to distinguish between the potential for cost reductions on manufactured
components like PV panels versus the Balance of Project (BoP) costs which may involve
routine assembly and erection activities which are not subject to significant learning by
doing
However there are opportunities for cost reductions particularly where many repetitive tasks
are involved such as solar field construction modular construction techniques
rationalization of components in the BoP design or reduction in assembly or placement time
21
This is supported in the US Solar Market Insight Report 2012 (Kann 2012) which identified
continued savings in inverter and racking costs as follows
ldquohellip falling equipment costs and fine-tuning of installation practices have made large-
scale solar less expensive QQrdquo
ldquohellip with the continuing maturation of the industry we expect continued focus on
reducing PV balance-of-systems costs (BOS) and that the increased worry over high
penetration PV will drive adoption of 1000Vdc and advanced inverters
respectivelyrdquo and
ldquoMounting structure manufacturers noted that the past year has seen tremendous
pricing pressure accounting for price declines of anywhere between 10 per cent and
30 per cent over the past yearrdquo
Given that the balance of plant costs can also be subject to cost reductions it is not
considered necessary to distinguish learning curves for discrete project costs in the model
33 General Costs Considerations
331 Fuel Costs
The outlook for fuel costs for gas coal and carbon was claimed to have materially shifted
since the AETA 2012 model While there was no evidence provided to support this
consideration will be given to this issue in the 2014 model update
332 CCS Costs
A submission cited the ZeroGen Case Study and sought to clarify the differences in CCS
cost between ZeroGen and lower values estimated for AETA 2012 This is a valid
comparison however BREE notes the following issues which contribute to explaining the
differences The international cost component is as follows AETA 52 per cent ZeroGen 34
per cent With the USD exchange rate AETA 1 ZeroGen at 08 adjusting the AETA value
for exchange rate variation would add A$952kWnet to the AETA value There is a
difference in plant size with AETA at 557 MW net and Zerogen 400 MW net A bigger plant
size would typically provide a lower cost kW installed
Additionally section 112 of Chapter One of the ZeroGen report advises escalation based on
project delivery from 2011 to 2017 AETA costs are for 2012 basis and do not include
escalation beyond this time A portion of the Zerogen costs will be inflated over the
comparable AETA cost Also section 113 of Chapter One of the ZeroGen report identifies
significant enabling works This is likely to be more inclusive than considered in the AETA
2012 report as identified in section 23 (a)
Overall it is considered likely that a number of estimate basis items in the ZeroGen study are
different and once equalised will show a smaller difference between the AETA and
ZeroGen values Therefore there is no immediate action but the basis and assumptions of the
model may be reviewed during 2014 AETA update
With regard to CCS efficiency one submission proposed that the AETA estimates were
overly optimistic However no references were cited to support this view and no change has
been made to the model
22
333 Opportunity Costs
A submission was made that footnotes be included regarding retrofit costs to indicate that
make-up power costs are not included This was not adopted because AETA parameters for
each technology are calculated for that technology alone and do not consider the impact of
reduced output of a retrofit project where additional output needs to be generated from
alternate higher cost generation Opportunity costs are specifically related to business cases
for specific projects and are not considered for any cases presented in the AETA report
Moreover retrofitting does not make electricity generation uncertain or intermittent It only
lowers the flow of generation at a constant rate (due to lower thermal efficiency) relative to
the non-retrofit case
34 Capital and Construction Costs
A submission was made to update the AETA values for the mid-point capital cost for several
technologies based on a study provided in support of the submission The technologies
asserted were
IGCC (Integrated Gasification and Combined Cycle) with 90 per cent capture fuelled
with Victorian brown coal
IGCC with no capture fuelled with black coal
IGCC with 90 per cent capture fuelled with black coal
Pulverised Fuel power plant with 90 per cent capture fuelled with Victorian brown
coal
Pulverised Fuel power plant with 90 per cent capture fuelled with black coal and
OCGT with no capture fuelled with natural gas
There is a key difference in the magnitude of the labour component in Australia compared
with the labour costs associated with the supporting material (from the USA) While no
changes have been made to the model in this update the ldquoshort termrdquo impact of labour
pricing on technology costs may be considered in further updates
Similarly it was submitted that the capital cost values for combined Cycle Gas Turbine
(CCGT) (with and without capture) could be revised As no documentary evidence was
provided to support this no change was made
For Direct Injection Coal Emulsion (DICE) power plant with no capture fuelled with
Victorian brown coal it is also suggested that the values be reviewed with a number of
papers provided for reference However these papers do not address capital cost in any depth
and it is unclear if the balance of project costs included are comparable with AETA DICE
technology is not mature and is probably best described as in the demonstration to
deployment phase of development which brings uncertainty into the cost analysis Therefore
data is needed to substantiate this submission As this was not available at the time of
preparing this report consideration of this issue is deferred to a later time when the necessary
data is available
An increase in the capital costs for Solar thermal trough (6 hrs storage) and Solar thermal
central receiver (6 hours storage) were proposed based on a supporting study by the Electric
Power Research institute (EPRI) The proposed values are substantially larger than the AETA
23
2012 but it is not clear what basis is used to generate these revised values A separate
submission received from another AETA stakeholder has supported the AETA values
Additionally the cited reference for solar thermal trough the Energy Power Research
Institute (EPRI) plant configuration is based on air cooling ndash while for AETA the plant
configuration assumes water cooling The difference in plant configuration will account for a
small part of the difference The AETA value is based on a reference report as issued in 2012
by the US National Renewable Energy Laboratory (NREL 2012)
The AETA value for the central receiver technology is based on a small (20MW) plant
(Gemasolar) with factors for adjustment to field size for thermal storage capacity and post
FOAK learning These factors will align with increased uncertainty in the AETA value It is
likely that additional cost information may now be available for the Brightsource Ivanpah
plant (no storage) and other tower plants being considered under construction
Further investigation of these issues has been sought with stakeholders but is as yet
unavailable
Another suggestion was made to consider capital costs on a component basis The capital
costs used in AETA 2012 for existing technologies were based on actual costs that could be
sourced on published documents (locally andor internationally) or from WorleyParsons
internal data For developing technologies costs were not considered on a component level
For this reason in technologies that are not commercialised a number of assumptions would
need to be made which may limit lsquorealrsquo costs being available No change to the model arose
from this submission
A reassessment of the construction expenditure profile for concentrating solar power (CSP)
technology options was sought in another stakeholder submission and supported by a
referenced report (IT Power 2012) However the plant sizes considered in the AETA report
are larger capacity (100 MW+) than those discussed in the cited report and consequently
have a longer duration construction period As three years is considered to be an appropriate
time period to spread the construction expenditure profile no change to the model was made
35 Costs Associated with Solar Technologies
A change to the model was sought with regard to the significant downward trends in the cost
of solar PV The stakeholder submission cited pricing data from the Australian Photovoltaic
Institute (APVI) Consultation with the APVI identified that evidence based information for
utility scale PV costs in Australia is limited because Australia has no PV systems 100 MW or
larger It is acknowledged however that there is significant and continued volatility in the
solar PV market including volatility due to competition oversupply in the PV module
market as well as continued price reductions for balance of system and installation costs
A$338 Wnet was a reasonable valuation for 2012 AETA The AETA 2012 value will be
maintained but may be reviewed in the 2014 model update
It was also suggested that solar thermal costs could be better represented in the model by
allowing for different periods of storage rather than a standard 6 hours The AETA 2012
scope was based on fixed plant designs which included fixed thermal storage sizing where
thermal storage was included With thermal storage there are a number of variables that can
be considered including differing field sizes (solar multiple) as well as actual thermal storage
capacities This is likely to add significant complexity to the report and to the model the
benefit of which at this stage does not warrant the changes
24
36 Costs Associated with Nuclear Technologies
It was submitted that consideration be given to including the impact on LCOE for nuclear
technology of the relatively high insurance costs for nuclear technologies This issue will be
considered in the 2014 review of the AETA model However insurance costs or plant
decommissioning costs are not considered for any of the 40 AETA technologies
Also the OampM improvement rate for Nuclear was not reconsidered as there is no OampM
improvement rate for Nuclear in the model
37 Further Technologies
A proposal was received which recommended that further technologies (DICE power plant
based on black coal with and without capture and DICE brown coal with capture and
medium speed DICE technologies) be incorporated into the AETA Model However as
mentioned earlier this update of the AETA 2012 Model only considered the technologies
included in that model This update of the model is not intended to broaden the technologies
38 Auxiliary Loads
Another example used for the purposes of drawing comparisons with the AETA model was
the SaskPower Post Combustion Retrofit It is difficult to distil the SaskPower project data
into a direct comparison with the AETA study and consequently there is insufficient data
certainty to warrant changes to the AETA 2012 values The SaskPower Post Combustion
Retrofit was also cited as to its conservative auxiliary loads for brown and black coal
However upon further investigation this was not substantiated within the SaskPower
example
25
4 WIND PV AND CSP OPERATIONS AND MAINTENANCE (OampM) COST UPDATE
41 Operation and Maintenance Costs
OPERATING AND MAINTENANCE COST DEFINITIONS
In considering the costing of OampM there is no absolutely clear definition of which costs
should be considered as fixed and which variable with the breakdown varying based on a
range of issues including technology location and resource type For this reason in the future
AETA reports OampM costs may be compared in terms of annual total operating expenditure
(OPEX) per MW of generation This method is widely used by most international institutions
to analyse OampM costs and to avoid subjective considerations
For this report fixed and variable costs are reported to provide direct comparison with AETA
2012 In this regard in general fixed costs are independent of the electrical generation of the
plant and are expressed as annual cost per MW capacity Fixed costs include items such as
fixed labour
equipment and
vehicles
Variable costs are proportional to the electrical generation of the Plant and are expressed as
cost rate per kWh energy output Variable costs include items such as
variable labour
consumables and
spare parts
As both public and private domain material vary in the way they approach and report on
fixed and variable maintenance within the following text where an interpretation has been
used for comparison purposes this is described
A submission was made to remove the operations and maintenance (OampM) cost escalation
factors This was not taken up as there is an increase in the OampM costs over CPI which is
borne out historically A review of the basis for this escalation determined that the
underlying assumptions were appropriate The review also considered adopting a generic
learning curve approach for OampM improvement rates as was suggested in one submission
This was not adopted as the model has an OampM improvement rate (set at 02 per cent per
annum) which can be varied by the user for wind and solar technologies This value accounts
for more efficient practices balancing the increase in labour and material costs over and
above CPI However changes to OampM improvement rates for selected technologies were
made as mentioned earlier OampM improvement rate values may be further considered for
emerging technologies in 2014 AETA study
A number of submissions referred to the improvement rate of OampM costs with evidence for
existing technologies to support these rising at 150 per cent CPI It was suggested that for
26
developing technologies it could reasonably be assumed that there would be reductions in
OampM between the first commercial installation and subsequent installations
While it is generally acknowledged that the LCOE of delivered energy from wind is falling
within the literature there is conflicting evidence around trends in OampM costs with recent
reports indicating both significant decreases and increases in OampM (see section 432)
Solar thermal plants consist of technology components that can be considered mature (eg
steam turbine) and components that are undergoing further development such as the solar
field and thermal storage Solar thermal plants require manning for operation as opposed to
wind turbines that do not require the same level of manning
A recent article (Muirhead 2013) advised for the Solar Energy Generating Systems (SEGS)
plants in California that have been operating since the early 1990rsquos ldquoMy understanding is
that the performance of the SEGS plants has significantly improved over time This is due
primarily to replacement of first generation receivers with newer receivers that are much
more efficient OampM practices at the plants have also improved over time based on the now
long history of operating these plants resulting in increased output in addition to reduced
OampM costs
In the AEMO report 100 Per Cent Renewables Study - Draft Modelling Outcomes Scenario 1
assumes that rapid technology transformation will drive real reductions in OampM costs
outweighing any increases projected in the AETA 2012 so OampM costs reduce by 125 per
cent by 2030 and 25 per cent by 2050 Scenario 2 uses the AETA 2012 assumption that
OampM costs escalate at around 150 per cent of Consumer Price Index (CPI) which leads to
cost increases of 27 per cent by 2030 and 46 per cent by 2050 It should be noted that the
Scenario 1 reductions are assumptions without further analysis of what will bring the
assumptions to fruition
In AETA 2012 the common OampM improvement rate for most technologies is set at 02 per
cent and can be varied as a user input The OampM improvement rate for emerging
technologies solar thermal and photovoltaic technology options and offshore wind is set to
25 per cent and can also be varied as a user input The improvement rate is now compounds
on the previous yearrsquos value
The OampM improvement rate values may be further considered for emerging technologies in
2014 AETA study
42 Operating and Maintenance (OampM) Changes in summary
As part of the Model Update special emphasis was placed in this report on the Operational
and Maintenance (OampM) costs and OampM improvement rates for all wind solar thermal and
solar PV renewable technologies covered in AETA 2012 As mentioned earlier this took into
account relevant Australian and international reports public domain information private
sources as well BREE and WorleyParsonsrsquo in-house experience The updated OampM values
are shown in Table 4 Reductions in CSP OampM costs of between 8 per cent and 27 per cent
were obtained in comparison to values provide in AETA 2012 report
The review included a detailed review of a report by IT Power cited as part of one of the
stakeholder submissions In that report reference is made to a case where $18MWh of OampM
costs comes from 64MW trough plant however it does not specify the relevant location hour
27
of thermal energy storage (TES) capacity factor type of cooling and back-up fuel and
therefore cannot be fully analysed nor used towards this AETA update
OampM costs for solar thermal plants are significantly affected by the costs of manpower To
demonstrate this with an example $18MWh for a 100MW plant with a 23 per cent capacity
factor (the IT Power report consideration) would result in an annual OampM cost of
approximately $36 million A 100MW plant will need at least 28 full time employees to be
properly manned 7 daysweek as there needs to be multiple shifts With this amount of
labour there are insufficient funds for site services utilities and materialsmaintenance If the
value is based on another location such as the Far or the Middle East region where labour
costs are significantly lower then a lower OampM cost may be feasible however for Australia
this does not appear to be feasible
The changes to OampM values for the 2013 AETA model refresh are summarised below
Table 4 Model Changes OampM costs
AETA 2012 report reference AETA 2012 model value AETA 2013 update
Section 23 Technical Assumptions
Operating and Maintenance Cost
Estimates
OampM improvement rate 02per
cent all technologies
OampM improvement rate maintained at
02per cent for
Coal based technology options
Gas based technology options
Solar thermal hybrid options
Onshore wind
Biomass technology options
Wave technology options
Geothermal technology options
Nuclear technology options
OampM improvement rate changed to 25per
cent for
Solar thermal technology options
Photovoltaic technology options
Offshore wind
The OampM improvement rate is compounded
from the previous yearsrsquo value
Section 33 Solar thermal
technologies
Solar thermal - Parabolic Trough wo
storage
Fixed OampM (AUS$MWyear)
Variable OampM (AUS$MWh)
60000
15
59176
1519
Solar thermal - Parabolic Trough with
storage
Fixed OampM (AUS$MWyear)
Variable OampM (AUS$MWh)
65000
20
72381
1139
Solar thermal - central receiver
technology wo storage
28
AETA 2012 report reference AETA 2012 model value AETA 2013 update
Fixed OampM (AUS$MWyear)
Variable OampM (AUS$MWh)
70000
15
58285
707
Solar thermal - central receiver
technology with storage
Fixed OampM (AUS$MWyear)
Variable OampM (AUS$MWh)
60000
15
71312
565
Solar thermal - Linear Fresnel wo
storage
Fixed OampM (AUS$MWyear)
Variable OampM (AUS$MWh)
60000
1500
64105
1519
Solar thermal - Linear Fresnel with
storage
Fixed OampM (AUS$MWyear)
Variable OampM (AUS$MWh)
65000
20
72381
1139
Section 35 Photovoltaic
technologies
PV ndash non tracking
Fixed OampM (AUS$MWyear)
25000
25000 (no change)
PV - Single Axis Tracking
Fixed OampM (AUS$MWyear)
38000
30000
PV - Dual Axis Tracking
Fixed OampM (AUS$MWyear)
47000
39000
Section 36 Wind Technologies
Wind Onshore
Fixed OampM (AUS$MWyear)
Variable OampM (AUS$MWh)
40000
12
32500
10
Wind Offshore
Fixed OampM (AUS$MWyear)
Variable OampM (AUS$MWh)
80000
12
77600
30
43 Wind
431 Introduction
This Section reviews onshore and offshore wind operations and maintenance (OampM) costs
used in AETA 2012 The values scrutinised are the fixed and variable OampM given in Table
361 of that report summarised in Table 5 below
29
Table 5 Wind OampM costs used in the AETA 2012 report
Option Fixed OampM (AUS$MW) Variable OampM (AUS$MWh)
Onshore 40000 12
Offshore 80000 12
OampM covers all of the services required to keep the wind farm operating as contracted to
supply energy and renewable energy certificates for its lifetime inclusive of
turbines and all balance of plant (roads buildings electrical equipment SCADA
control equipment) up to the high voltage connection point on the wind farm
substation
labour (both trades and professional)
facilities (workshops stores offices)
equipment (tools jigs vehicles rigging safety equipment craneage)
spare parts and
consumables (such as oil grease and office consumables)
Windfarm size was not specified in AETA 2012 however it was noted that wind farms
greater than 100MW are becoming more common Since then within Australia wind farms
of larger and smaller sizes have been constructed for example the 420 MW Macarthur Wind
Farm in Victoria and the 55 MW Mumbida Wind Farm in Western Australia with both larger
and smaller wind farms under proposal For this review a nominal size of 100-150 MW is
used as representative of current and future facilities
432 Review of Evidence
As mentioned earlier the review of public literature by BREE and WorleyParsons the
procurement of private studies consultations with owneroperators in the wind farm OampM
sector in Australia AETA Stakeholders and project Steering Committee members were used
to assist the current Model Update process Where possible these sources are noted in the
text however some of these sources have asked to remain anonymous and where so the
term ldquoprivate sourcerdquo has been used
As noted by one reviewer in NREL 2011 OampM cost information in the public domain in
both quantum and quality is poor and the situation appears no better in 2013 particularly in
the discrimination of fixed and variable costs One reason for this is the commercial and
increasingly competitive nature of the sector with wind farm OampM now a significant
business worldwide with subsequent confidentiality around actual costs
What constitutes wind farm OampM is also changing This is driven in part by technological
change as the wind fleet ages as new turbines become larger and more sophisticated
particularly offshore Competition in the provision of OampM services is also changing with
maturing of the wind energy product As an example the following industry trends are now
evident
30
a growing role of independents in the wind OampM market ndash around 25 per cent of the
wind fleet in the US is expected to be operated and maintained by independents by
2025 (Ebert and Ware 2013) as opposed to original equipment manufacturers (OEMs) -
wind is largely a commodity market and easier for new participants to enter something
not necessarily seen with other generation technologies
tighter supply markets ndash general economic volatility is tightening the supply and
project development chain for wind moving interest into the OampM sector bringing
price volatility and more competition
a more sophisticated asset management model ndash where OampM providers are linking
operational data with long term condition monitoring output forecasting and work
order scheduling to deliver what is termed ldquolifecycle optimisationrdquo squeezing more
energy out of the asset
older turbines exceeding planned maintenance budgets ndash with the chief issue being
keeping the variable OampM from unforeseen breakdowns
a push for larger turbines particularly offshore (5-10 MW) and in deeper waters and
linking OampM to turbine contracts ndash there is evidence (including in Australia private
source) that wind farm OampM is becoming an even more significant bargaining
component of turbine supply contracts where lower supply costs are balanced by
longer OampM contracts
Costs of wind OampM are difficult to summarise as they are dependent on many issues As just
one example in the NREL 2011 study cited earlier a wide variability in wind farm OampM
costs was found across a range of countries (Figure 1) This reference demonstrates this
variability from the average reference case in terms of Levelised Cost of Energy (LCOE)
31
Figure 1 Effect of country variables on LCOE of wind plant
Source NREL (2011)
Other issues which affect the contracted cost of OampM for wind include
regional variations in labour and transport costs
wind farm environment particularly wind regime and proximity to the ocean
(corrosion)
the maturity and availability of wind turbine technicians
the spread of facilities geographically and the wind farm asset sizes in a portfolio
the turbine type and brand particularly the support establishment within a Region
the age of the asset OampM history and existence of Type (or systematic) failures of
major components
the ability of the OampM provider under the contract to source third party spares andor
try varied maintenance practices and
the nature of the OampM contract ndash for example does it include risk reward elements or
have a link to the wind turbine supply contract or is it a ldquoproduction availabilityrdquo
contract type
While it is generally acknowledged that the LCOE of delivered energy is falling for wind
technology (Hand 2013) within the literature there is conflicting evidence around trends in
OampM costs with recent reports indicating both significant decreases (BNEF 2013) and
increases (Ebert and Ware 2013) It is generally acknowledged that increased competition in
the OampM market is delivering lower cost service provision but this may in part be offset by
an ageing fleet requiring more variable maintenance and a more sophisticated and costly
32
response Several studies have demonstrated that the costs of maintaining wind turbines
generally increase with time following a trend similar in shape to that in Figure 2 (Hand
2013) with estimates in Albers (2009) indicating a doubling in turbine OampM costs by mid
plant life The term COD in Figure 2 refers to commercial operations date
Figure 2 Typical cost increasing trends in wind farm OampM costs with commercial operations
date
Source Adapted by WorleyParsons from Houston (2013)
In Australia this trend is also evident in post 10-year aged machines (private source)
particularly in relation to variable maintenance The nature of any similar increase with more
modern turbines is unpredictable although turbine availability is improving and there is
evidence that OampM costs with each generation of turbine are lowering see Wiser et al
(2012)
The OampM costs for offshore wind farms are particularly difficult to estimate as the industry
is still at the early stages of development including the progression of much larger turbines
into deeper water and the more complex nature of the task Such progression is indicated in
Figure 3 taken from RolandBerger (2013) which indicates an expected decrease in OampM
costs These costs are of the same order of that published in other recent publications UK
Crown Estate (2012) and US DoE (2013)
33
Figure 3 Trends in offshore wind farms and estimated impact on LCOE
Source RolandBerger (2013)
433 Updated OampM Figures for Australia
It is not a simple matter to transfer international costs to Australia as despite trends there are
significant differences between regions including
size of market ndash despite growth the Australian wind market is small with respect to
other world regions For example the total wind fleet is 4 GW (CEC 2013) for
Australia versus 60 GW for the US (AWEA 2013)
labour and material rates in certain parts of Australia are high by world standards
the logistics of getting to and within Australia generally involve longer distances than
other areas of the world particularly due to the remoteness from major equipment
suppliers
volatility of the Australian dollar particularly against the US and
the size of Australian wind farms tends to be larger
These differences can be seen in Figure 4 supplied by a turbine equipment supplier (private
source) and showing the relative OampM costs (per MW) and technician numbers (per 100
MW) across various world regions in 2012 for wind turbine maintenance only and excluding
balance of plant Numbers and scales between the two indices have been removed to protect
the confidentiality of this supplier with data believed to cover the entire global portfolio
under management This shows a significant difference between regions for onshore in both
indices for example almost a 45 per cent difference in costs between Europe and America
Australia would sit within ldquoAsiaPacificrdquo and while the Figure indicates generally lower
OampM costs and higher technician numbers for this region this presumably covers a very
diverse area (including South East Asia New Zealand and Oceania) which may skew results
34
Unlike many larger global markets the wind OampM sector in Australia is dominated by
turbine equipment suppliers with original equipment manufacturer (OEM) contracts
estimated to cover more than 95 per cent of the fleet The evidence for this is mostly
anecdotal although a number of smaller independent suppliers are now known to be
undertaking full service OampM for older plant (gt10+ years) with many of the drivers for this
covered in Ebert et al (2013) There is also evidence (private source) that wind turbine
suppliers in Australia are seeking OampM contracts with much longer terms and tying these to
reductions in turbine supply prices This may indicate a lack of competitive pressure on
OampM pricing in the near to mid-term and as the size of the overall market is small it is
unknown whether independents will grow market share as has been the case in many larger
global markets see for example Deloitte amp Touche (2012)
The most recent contemporary literature comments on onshore wind farm OampM pricing in
Australia and surrounds that could be found in the public domain and not used for the AETA
2012 work are from Hassan (2011) and Deloitte (2011) These are summarised with other
new international references cited in Table 6 with assumptions on any conversions noted
below the table As no offshore wind farm projects have been progressed in Australia the
table includes values from new sources for offshore projects from the international public
domain literature - the significant difference to onshore costs is evident in the values
Figure 4 OampM Costs (per MW) and Technician Numbers (per 100MW) for total wind turbine
OampM (Opex)
Source Private - values and scales removed to protect confidentiality
From Table 6 and considering the differences in markets it appears that for onshore wind the
AETA 2012 estimates may be slightly high with an updated AETA 2013 recommendation
given in Table 7 This value has been arrived at by considering
the size of the Australian wind market and lack of competitive pressure from
independent OampM service providers
35
supply side pressures on OEMs driving them to protect their OampM businesses and
lowering costs
the likely increase in fleet installations to comply with RET legislation skewing the
fleet age to more a modern generation of turbines although it is noted that there is some
uncertainty around long term OampM cost trends particularly variable maintenance ndash an
asset age of around 5 years is assumed here
uncertainties in what is included in referenced values and differences in markets and
advice from actual asset owners and OampM providers (private sources) on current actual
costs
Table 6 Comparison of AETA 2012 wind OampM estimates with new references for 2013
Source Region
Fixed OampM
(AUS$MW)
Variable OampM
(AUS$MWh)
Total OPEX
(AUS$MW)
On
sh
ore
AETA 2012 Australia 40000 12 799451
Houston 2013 US - - 35-380002
BNEF 2013 Global - - 25000
3
Private Source (2013) (gt 10 yr old
plant) Australia - - 70000
Private Source (2013)
(lt 2 yr old out of warranty plant) Australia - - 55000
Hassan 2011 Australia - - 83-99000
4
Deloitte 2011 New Zealand - - 450005
Off
sh
ore
AETA 2012 Australia 80000 12 1262526
Crown Estate 2012 UK - - 275000
7
Hassan (2013) UK - - 2391567
RolandBerger 2013 Europe - - 198000
8
US DoE 2013 US - - 144970
9
1 Assumes a 38 capacity factor
2 USAUD = 109 extrapolated from Figure approximately to 2013
3 EUROAUD = 142 uncertain if this includes all balance of plant or VOM and only includes OEM providers
4 Assumes a 38 capacity factor
5 Assumes NZAUD = 084 a 38 capacity factor and the mid-range estimate for OampM
6 Assumes a 44 capacity factor
7 Assumes GBPAUD = 167 and taking midpoint of estimates stated
8 Assumes GBPAUD = 167 and taking value for 3MW turbines
9 Assumes USAUD = 109
36
The figures shown for onshore projects in Table 7 represent a 15 per cent decrease in the
expected OampM costs of wind farms in Australia compared to AETA 2012 This change
reflects the volatility in this market noted in previous sections and in referenced material
internationally plus the appearance of significant downward pressure on wind OampM prices
primarily through increased global competition The values allow for the rising price of
turbine OampM as the turbine ages during its life
For offshore wind it appears that the OampM costs in AETA 2012 are too low and although it
is tempting to align costs with the most recent US figures due to their lower costs and similar
coastal conditions to Australia the European offshore fleet is significantly larger and more
mature Average figures across the 2013 referenced material including Europe is
recommended This is also shown in Table 7 and represents a significant increase in estimate
costs (around 33per cent) which reflects this evolving sector
There is very little contemporary information available on the breakdown of fixed and
variable maintenance on wind plant making judgment around this for the AETA requirements
is difficult However there is some published but copyrighted material eg GlobalData 2012
which combined with others (private sources) indicates that for onshore and offshore wind
plant respectively a 5050 and 4060 FOM VOM split is appropriate This has been used to
adjust the total OPEX figure in Table 7 to the AETA scheduled and variable indices
requirements using a 38 per cent and a 44 per cent capacity factor for onshore and offshore
projects respectively
Table 7 Recommended AETA (2013) values
AETA (2013) update Fixed OampM
(AUS$MW)
Variable OampM
(AUS$MWh)
Total OPEX
(AUS$MW)
Onshore $32500 $10 $65790
Offshore $77600 $30 $194000
44 Solar Photovoltaics (PV)
441 Introduction
This Section of the report focuses on the OampM costs for ground-mount photovoltaic (PV)
technologies broken down by the following mounting system configurations
Fixed Tilt (FT)
Single Axis Tracking (SAT)
Dual Axis Tracking (DAT)
Although different PV panel technology types (eg poly-crystalline mono-crystalline or thin
film CdTe) affect the capacity factor and land use the OampM costs are comparable The
estimates for this Report are based on polycrystalline PV technology which provides an
average cost on a per Watt basis with mono-crystalline OampM costs being slightly lower and
thin film OampM costs being slightly higher
With the aim to provide comparable results between technologies WorleyParsons has
analysed and updated the PV OampM costs in terms of both fixed operation and maintenance
37
costs (FOM) and total operating expenditures (OPEX) based on reference plants of similar
characteristics
Assumptions interpretations and considerations based on their in-house data and global
market trends are described in the following Sections
442 Review of the Evidence
Since the AETA 2012 report release few new public domain reports related to OampM costs
for PV systems have been published To confirm this the following organisations have been
consulted by WorleyParsons to provide the 2013 OampM costs update for the selected PV
configurations
International Renewable Energy Agency (IRENA) (wwwirenaorg)
International Energy Agency (IEA) (wwwieaorg)
The World Bank (WB) (wwwworldbankorg)
The US National Renewable Energy Laboratory (NREL) (wwwnrelgov)
Solar Energy Industries Association (SEIA) (wwwseiaorgau)
European Photovoltaic Industry Association (EPIA) (wwwepiaorg) and
Solar Electric Power Association (SEPA) (wwwsolarelectricpowerorg)
Upon review of the available information when compared to AETA 2012 the listed
organisations do not have any new public information related to large-scale PV OampM costs
If OampM costs are mentioned they are normally referenced as a per cent of the total Capital
Expenditure (CAPEX) for the plant (around 1 per cent) and provide little useful information
about OampM Cost changes
Due to insufficient detailed and recent information in the public domain WorleyParsons
obtained the following market reports from Photon a private organisation focused on market
news political discussions and technology analysis for the PV industry
Photon 2013 ldquoThe True Cost of Solar Power - Temple of Doomrdquo and
Photon 2013 ldquoSolar Annual 2013 - Build your Empirerdquo
These private reports had minimal focus on OampM costs To provide further input in this
area private OampM service providers were contacted for pricing estimates and market trends
443 AETA 2012 OampM PV costs report comparison
Typical power plant OampM costs are expressed as a combination of a variable component
(proportional to generation) and a fixed component (occurs irrespective of generated output)
Since the generation of a PV plant is dependent on solar radiation (not requiring fossil fuel or
water which make up the major components of variable costs for conventional generation) it
is typical to express the OampM costs only as Fixed OampM (FOM) costs proportional to the
plant size due to the simplicity of PV systems The AETA 2012 report follows this practice
and estimates the PV OampM costs as FOM only relative to plant size (kW) expressed on a per
year basis
38
In order to facilitate comparisons of these costs with other electricity technologies the FOM
costs in the AETA 2012 report are also presented as OPEX costs per MW of generating
capacity per year
ASSUMPTIONS AND CONSIDERATIONS
The following costs are included in the FOM estimates as an annual cost per kW capacity
labor and administrative expenses
panel washing (twice per year at $300 kl for water)
weed abatement (seasonal herbicide applications)
inverter replacement reserve (replaced at operational year 10) and
materials and maintenance spare parts civil works preventative and corrective
equipment maintenance
Although the cost of water is variable depending on location and usage it is such a small
portion of the total OampM costs that it is adequate to assume it as a fixed cost using the
assumptions listed above
AETA 2012 PV OampM COSTS COMPARISON REPORT
The technical characteristics of the reference PV plants used in the AETA 2012 report have
been extracted from the AETA 2012 Model (Version 1_0 Rev B BREE 2012) and are
summarised in Table 8
Based on this information the following parameters for the PV technologies are estimated
Total net energy production in terms of MWh sent out per year
Total plant acreage
FOM in terms of USD per year and
Total OPEX costs in terms of USD per year and USD per total net energy production
per year
39
Table 8 AETA 2012 reference plants technical characteristics and OPEX costs
Plant Characteristics Units Fixed Tilt (FT) Single Axis Tracking (SAT)
Dual Axis Tracking (DAT)
Plant Characteristics
Plant Net Capacity MW 100 100 100
Capacity Factor per cent 21 24 26
FOM $kWyear 25 38 47
Net Energy MWhyear 183960 210240 227760
Plant Acreage acres 500 800 900
Total FOM $year 2500000 3800000 4700000
Total OPEX $year 2500000 3800000 4700000
Total OPEX $kWh 00136 00181 00206
Total OPEX costs are between 00136 and 00206 USDkWh as shown in Table 8 above
These values are conservative cost estimates but reasonable for a large-scale PV plant with
comprehensive OampM service As is expected the FOM or OPEX costs increase as the plant
footprint increases and the complexity of the mounting system increases However the
increases to single and double axis tracking technologies are larger than would be expected
The increased complexity of the trackers does add costs to OampM in terms of labor parts and
even physical plant size but these additions are minor in comparison to the larger OampM
budget items such as the inverter replacement reserve and general electrical maintenance
which are irrespective of mounting system
These values although conservative still show the cost reductions from the industry learning
curve and expanded competition over the past few years when compared to past estimates of
OampM costs This can be seen in the following Table 9 of Fixed Tilt (FT) costs which
provides some estimates found in previous publications by IEA (2008) and EPRI (2010) The
tracking estimates are not shown since minimal data is available This corresponds to the
historical market trend of the industry being more willing to install fixed tilt systems rather
than tracking systems due to lower costs and technology risk
Table 9 Comparison of historical estimated PV and OampM costs in the public domain
PV Configuration OampM Costs Units IEA 200810
EPRI 2010 AETA 2012
Fixed Tilt (FT) FOM $kWyear 40 32 to 37 25
values in Italics are derived from reported data
10
Report assumed 1 of capital costs and 23 capacity factor
40
45 AETA 2013 PV OampM Costs Update
Using the same plant characteristic assumptions as the 2012 AETA Model the 2013 OampM
costs were estimated by WorleyParsons based on the references described in review of the
evidence in Section 442 The comparison of the AETA 2013 and 2012 OampM costs are
presented in Table 10 below
Table 10 2013 PV OampM costs compared to 2012 PV OampM costs PV Configuration OampM Costs Units AETA 2012 WorleyParsons
2013 Update
Fixed Tilt (FT) FOM $kWyear 25 25
OPEX $kWh 00136 00134
Single Axis Tracking (SAT) FOM $kWyear 38 30
OPEX $kWh 00181 00141
Dual Axis Tracking (DAT) FOM $kWyear 47 39
OPEX $kWh 00206 00173
Although the OampM costs for FT systems are approximately the same SAT and DAT OampM
costs reduced by around 20-30 per cent in this 2013 update compared to the AETA 2012
report The consistency of the FT costs is reasonable and expected to continue for the next
few years as discussed further in Section 451
Regarding the SAT and DAT costs although there have been improvements in the design of
trackers for PV applications this OampM cost reduction is due to a better understanding of the
costs associated with electrical and tracking system maintenance The cost differences
between tracking systems was corroborated by quotes from private OampM service companies
who indicated that there was only a slight increase in costs from FT to SAT but a larger
increase in costs from SAT to DAT
As compared to the references mentioned in Section 442 the updated cost estimates are
conservative Table 11 compares the estimated 2013 OampM costs with those references
However since these publications focused primarily on the CAPEX with very general OampM
cost assumptions the OampM costs presented therein are not considered representative
baselines for large-scale solar projects Furthermore they attest to the industryrsquos tendency to
focus strictly on installation costs and not lifecycle costs which is discussed further in Section
451
41
Table 11 2013 updated OampM costs compared to new referenced OampM costs (7-2) PV Configuration
OampM Costs
Units WorleyParsons 2013 Update
11
NREL 2013
12
IRENA 2013a
13
Photon 2013
14
Private OampM Service Providers
201315
Fixed Tilt (FT) FOM $kWyear 25 235 17 to 21 18 17 to 23
OPEX $kWh 00134 00216 to
00383
00121 to 00266
00098 00094 to 00127
Single Axis Tracking (SAT)
FOM $kWyear 30 Not provided
Not provided
Not provided
25 to 27
OPEX $kWh 00141 Not provided
Not provided
Not provided
00136 to 00147
Dual Axis Tracking (DAT)
FOM $kWyear 39 Not provided
Not provided
Not provided
32 to 34
OPEX $kWh 00173 Not provided
Not provided
Not provided
00174 to 00185
values in Italics are derived from reported data
451 OampM Learning Rates
In the rapid PV industry growth of the last three years WorleyParsons and anecdotal
experience is that PV was considered generally to require little to no maintenance causing a
general disregard for OampM planning This appears to have resulted in complications as
owners struggle to resolve reliability performance and budget issues as the projects mature
(multiple private sources) Although the maintenance costs are smaller compared to standard
power plants OampM awareness has been increasing in the industry and therefore the OampM
cost estimates have subsequently increased
This is supported through the recent focus of OampM at PV conferences (such as Sandia
National Laboratory and Solar Energy International events) on increasing the investment in
OampM practices in addition to improving the current practices products and services so that
PV plants can be better maintained to achieve higher reliability throughout the plant life
cycle Currently the majority of OampM expenses for PV systems consist of maintaining and
replacing the inverters followed by the Balance of System maintenance In general once the
appropriate level of investment in OampM for PV is reached then OampM costs will begin to
decrease as the following issues develop to maturity
technology improvement
inverter design for reliability and longevity
data monitoring for preventative and corrective maintenance support
system efficiency to increase system output for the same OampM expense
decreased capital costs for major equipment
decreased spare parts costs
11
See assumptions in Section 433 and 443 12
Report assumed 250kW rooftop at 7 to 10 capacity factor 13
Report assumed 1 of CAPEX and 9 to16 capacity factor 14
Values derived from the global weighted average calculations assuming 21 capacity factor and 20 year lifecycle Report assumed a
simple percentage of average selling price 15
Quote excluded weed abatement panel washing and inverter replacement reserve which were supplemented from the WP estimate
Calculations assumed 21 capacity factor
42
industry maturity and stability
reliable OEM support from product consistency and commercial stability
improved codes and standards for PV equipment system design installation
commissioning and OampM and
experience
trained and experienced personnel in the installation and maintenance of PV plants
In line with this trend owners system designers installers and OEMs are now including
OampM considerations in their finances designs services and products Even though there
have been and will continue to be cost reductions in OampM due to the industry maturation
stabilization and competition those cost reductions are balanced with the necessary
increases in OampM investment to meet the maintenance needs of existing and planned PV
plants resulting in a level OampM cost estimate for the next five years
Photon (2013) follows this assumption of consistent OampM costs for the next ten years as well
as WorleyParsons discussions with OampM service providers Therefore the assumption that
PV OampM costs will remain somewhat constant over the next five years before reducing again
appears to follow the projections in the industry
452 Conclusions - PV
The key findings from the AETA 2012 review and update of the PV OampM costs are as
follows
The 2013 WorleyParsons PV OampM costs update resulted in values of
$25kWyear for FT systems
$30kWyear for SAT
$39kWyear for SAT in 2012 USD
Fixed tilt configurations have not seen significant changes in OampM costs compared to
the 2012 AETA estimates while SAT and DAT configurations cost estimates have
reduced approximately 20-30 per cent based on a better understanding of the associated
OampM costs
Values obtained in the 2013 WorleyParsons update are more conservative but are
aligned with values provided by recognised international institutions even though few
detailed OampM breakdowns are available and
OampM costs for PV are expected to remain constant over the next five years before
reducing as the industry matures in both experience and long-term planning
capabilities
43
46 Concentrating Solar Power (CSP)
461 Introduction
This Section of the report focuses on the OampM costs for the following Concentrating Solar
Power (CSP) technologies
Parabolic Trough (PT)
Solar Tower (ST) and
Linear Fresnel (LF)
CSP OampM costs were analysed in terms of
Fixed Operating and Maintenance Costs (FOM)
Variable Operating and Maintenance Costs (VOM) and
Total Operating Expenditures (OPEX)
In order to arrive at comparable results between technologies BREE and WorleyParsons
estimated the OampM costs based on
Reference Plants with similar Solar Plant characteristics localisation net capacity
capacity factor hours of Thermal Energy Storage (TES) and type of cooling system(s)
and
Cost estimate amounts that were updated to 2012 USD
When information was not available necessary estimates were made using WorleyParsonsrsquo
in-house data and based on global market trends observed in various publications
462 Review of the evidence
The following international organisations were consulted to provide the AETA 2013 OampM
costs update for the selected CSP technologies
International Renewable Energy Agency (IRENA) (wwwirenaorg)
International Energy Agency (IEA) (wwwieaorg)
European Solar Thermal Electricity Association (ESTELA) (wwwestelarde)
The World Bank (WB) (wwwworldbankorg)
National Renewable Energy Laboratory (NREL) (wwwnrelgov)
Protermosolar (wwwprotermosolares)
Institute for Energy Diversification and Saving (IDEA) (wwwideaes)
Renovetec (wwwrenoveteces) and
CSP Today (wwwcsptodaycom)
The approach in reviewing OampM costs for the 2013 update for CSP technology was only to
use new sources of information published since the AETA 2012 report was written This was
44
maintained for all but the learning rates estimation which is due to the lack of any new
updated information published since 2012 in relation to this
Upon review of the available public domain information it was found that IEA ESTELA
WB Protermosolar Renovetec and IDEA do not have any new relevant public information
related to CSP OampM costs However IRENA 2013b IRENA 2013c and NREL 2012 are
new references from IRENA and NREL that are considered relevant and which were used in
this report
The information contained in these references did not provide updated costs for all of the
CSP technologies being considered in this Report and the values offered were not provided
in terms of FOM and VOM costs as preferred
Due to the lack of new relevant information in the public domain the AETA 2013 Model
Update process obtained reports from CSP Today a private international organisation
focused on news events reports updates and information for the CSP industry in markets
such as India South Africa Spain USA Chile and MENA regions The Update acquired the
last edition of PT and ST reports CSP Today 2012a and CSP Today 2012b for which OPEX
costs were analysed
463 AETA 2012 OampM CSP costs report comparison
Operating and Maintenance expenses were provided in terms of fixed and variable costs in
the AETA 2012 report and this Model Update has modified these for 2013 for PT ST and LF
technologies based on the references cited above and further consideration of learning rates
for the CSP industry
Most CSP projects with commercial operational experience are parabolic trough technology
as it is the most mature technology and currently more is reported and known about actual
costs than other CSP technologies Nevada Solar One as an example is a 64MWe parabolic
trough plant based in California which was commissioned in 2007 and it is the first plant
built after the SEGS development during the 1980-90s also in California
Andasol 1 the 50 MWe parabolic trough plant based in Spain is also the first CSP plant
worldwide to implement a commercial thermal energy storage system with a capacity of 75
hours of full load storage It commenced operation at the end of 2008 and other similar and
larger trough projects are now operating or being constructed
As the most mature CSP technology trough plant should be further down the operational and
design operability maturity path and hence have a lower opportunity for OampM cost
reductions through learning By contrast Solar Tower and Linear Fresnel systems are only
beginning to be deployed at larger scale and hence there is expected to be more potential to
reduce their capital and operating costs and improve performance
Learning rates have been argued by stakeholders as being very significant for CSP plant with
comments of the AETA 2012 report centring on this issue Disappointingly there is no new
published evidence or actual plant report data that could be found by the AETA stakeholders
and WorleyParsons to add to that used for the 2012 report There is however new evidence
on the reduction in LCOE for CSP technologies and WorleyParsons linked OPEX
contribution to these LCOE predictions so that a sense of future reductions could be made
This is outlined further in the following Sections
45
4631 ASSUMPTIONS AND CONSIDERATIONS
FOM and VOM Breakdown
The following costs are included in proceeding FOM cost estimates for CSP technologies as
an annual cost per MW capacity
Insurance
Labour costs and
Fixed service maintenance contracts
Similarly the following costs are included in the VOM cost estimates as a cost rate per MWh
of sent out energy
Material and maintenance costs spare parts equipment maintenance and unscheduled
inspections and
Utilities costs water auxiliary fuel and auxiliary power when applicable
Some items such as spare parts for scheduled maintenance could be considered FOM costs
However to simplify the comparison and to homogenise all of the analyses across
technologies all concepts related to plant material and maintenance were included in the
VOM costs
4632 AETA 2012 OampM CSP COSTS COMPARISON REPORT
The technical characteristics of the reference CSP Plants used in the AETA 2012 report have
been extracted from the AETA Model Version 1_0 (BREE 2012) and are summarised in
Table 12
Table 12 AETA 2012 Reference Plant Technical Characteristics
Plant
Characteristics
Units Parabolic
Trough
without
Storage
Parabolic
Trough
with
Storage
Solar
Tower
without
Storage
Solar
Tower
with
Storage
Linear
Fresnel
without
Storage
Linear
Fresnel
with
Storage
Plant Net Capacity MW 138 135 122 18 230 225
Location NA Unknown Unknown Unknown Unknown Unknown Unknown
Isolation kWhm2year Unknown Unknown Unknown Unknown Unknown Unknown
Hours of TES h - 7 - 6 - 6
Capacity Factor per cent 23 42 31 42 23 42
Type of Cooling NA Unknown Unknown Unknown Unknown Unknown Unknown
FOM $MWyear 60000 65000 70000 60000 65000 65000
VOM $MWh sent out 15 20 15 15 15 20
Based on the information above this Model Update estimated the following parameters for
the CSP technologies evaluated in this study
46
Total net energy production in terms of MWh delivered per year
FOM and VOM in terms of USD per year and
Total OPEX costs in terms of USD per year and USD per total net energy production
per year
The results are listed in Table 13 below Table 13 AETA 2012 OampM Opex costs on a per kWh basis
Plant
Characteristics
Units Parabolic
Trough
without
Storage
Parabolic
Trough
with
Storage
Solar
Tower
without
Storage
Solar
Tower
with
Storage
Linear
Fresnel
without
Storage
Linear
Fresnel
with
Storage
Plant Net Capacity MW 138 135 122 18 230 225
Net Energy sent out MWhyear 2780424 496692 3313032 662256 463404 827820
FOM $year 8280000 8775000 8540000 1080000 14950000 14625000
VOM $year 4170636 9933840 4969548 993384 6951060 16556400
OPEX $year 12450636 18708840 13509548 2073384 21901060 31181400
OPEX $kWh 00448 00377 00408 00313 00473 00377
FOM per cent 6650 4690 6321 5209 6826 4690
VOM per cent 3350 5310 3679 4791 3174 5310
The percentages of FOM and VOM costs as part of the total OPEX costs are presented in
Figure 5
Figure 5 AETA 2012 FOM and VOM Percentages of Total OPEX Costs
47
In Figure 5 FOM costs are in general terms significantly higher than VOM costs because
they include the higher cost items such as insurance labour costs and fixed service contracts
However as shown in the Figure VOM costs are higher or approximately equal to FOM
costs for technologies with energy storage given the criteria selected for the breakdown
between FOM costs and VOM costs FOM costs will remain relatively consistent from year-
to-year while VOM costs should be broken down even further since the costs of water
natural gas (if required) and electricity vary between locations and from one year to another
Total OPEX costs are expressed in terms of USD per total net energy production per year and
are between 00313 and 00473 USDkWh as listed in Table 13 These values are aligned
with the values provided by international institutions cited although they appear to be
somewhat inflated in comparison with those values that are closer to 0025 and 0035
USDkWh as published by others (eg IRENA)
4633 AETA 2013 OampM COSTS UPDATE
Similar Plant characteristics to AETA 2012 were considered for the appropriate comparison
of OampM costs for this update Plant characteristics include location net capacity capacity
factor hours of TES and type of cooling For this Report the characteristics of the reference
plants used are described in Table 14
Table 14 PT and ST Reference Plant Characteristics
Plant
characteristics
Units Parabolic
Trough without
Storage
Parabolic
Trough with
Storage
Solar Tower
without
Storage
Solar Tower
with Storage
Plant Net Capacity MW 100 100 100 100
Location NA MENA region MENA region MENA region MENA region
Isolation kWhm2year 2400 2400 2400 2400
Hours of TES h 0 6 0 6
Capacity Factor per cent 26 46 275 476
Type of Cooling NA Dry Dry Dry Dry
Source NA WorleyParsons CSP Today 2012a WorleyParsons CSP Today 2012b
The 2013 OampM costs were estimated using as a basis the information provided in the CSP
2012 reports (CSP 2012a and 2012 b) The following considerations were taken into account
the CSP Today reports only consider PT and ST plants with thermal storage
WorleyParsons made the following estimates based on experience with solar and
conventional power plants based on PT and ST technologies without TES
estimated the capacity factor based on plant capacity location and type of cooling
adjusted the insurance material and maintenance and labour costs based on the
solar field reduction factor when applicable
adjusted the steam turbine maintenance based on the potential hours of operation
48
adjusted the plant electricity and water consumption based on the total net
production
assumed similar auxiliary fuel consumption for the plant with and without TES This
assumption is due to the reference plants being based in the same location thus
requiring similar auxiliary fuel consumption for start-up Minimal differences in
auxiliary fuel consumption for freeze protection due to increased time offline for a
plant without TES system compared to a plant with TES are expected but not
considered in this Report as the impact would be minor
the capacity factor provided by CSP Today for PT with thermal storage is considered
high Based on the plant location and capacity WorleyParsons would anticipate the
capacity factor to be closer to 42 per cent instead of 46 per cent as indicated in Table
14 above This difference in capacity factor directly impacts the estimated VOM cost
which is correlated with plant production For comparison purposes the value provided
by CSP Today has maintained and
with respect to Linear Fresnel technology updated information has not been published
since the AETA 2012 report release by the references listed in Section 462 which
WorleyParsons consulted For the purpose of updating the estimates to 2013 it was
assumed that the evolution of the OampM costs would be similar to that of parabolic
trough plants and the same escalation factors were applied
The resulting 2013 and 2012 OampM costs are listed in Table 15 below for comparison
Table 15 2013 CSP OampM Costs Compared to 2012 OampM Costs
CSP Technology OampM Costs AETA 2012 WorleyParsons 2013 update
Parabolic Trough
without Storage
FOM $MWyear 60000 59176
VOM $MWh sent out 1500 1519
OPEX $kWh 00448 00412
Parabolic Trough with
Storage
FOM $MWyear 65000 72381
VOM $MWh sent out 2000 1139
OPEX $kWh 00377 00293
Solar Tower without
Storage
FOM $MWyear 70000 58285
VOM $MWh sent out 1500 707
OPEX $kWh 00408 00313
Solar Tower with
Storage
FOM $MWyear 60000 71372
VOM $MWh sent out 1500 565
OPEX $kWh 00313 00228
Linear Fresnel without
Storage
FOM $MWyear 65000 64107
VOM $MWh sent out 1500 1519
OPEX $kWh 00473 00434
49
CSP Technology OampM Costs AETA 2012 WorleyParsons 2013 update
Linear Fresnel with
Storage
FOM $MWyear 65000 72381
VOM $MWh sent out 2000 1139
OPEX $kWh 00377 00293
The total OPEX costs per year from the AETA 2012 report and the WorleyParsonsrsquo estimates
that were updated for 2013 are compared in Figure 6 below
Figure 6 Comparison of OPEX Costs per Total Annual Plant Production per Year AETA 2012
Report and 2013 Update
Reductions of approximately 20 - 27 per cent in OampM costs would be realised by CSP with
TES according to the updated 2013 WorleyParsons estimates compared to the same costs
reported in the AETA 2012 report However reductions for PT and LF without TES were
found to be lower at approximately 8 per cent
The IRENA reports (IRENA 2013b IRENA 2013c) provide values for OPEX between 0025
and 0035 USDkWh for PT and ST technologies with and without TES Values updated to
2013 by WorleyParsons are between 0023 and 00412 USDkWh for PT and ST
technologies which align with the IRENA values However IRENA does not differentiate
between the utilisation of TES Solar technologies without TES have fewer hours of
production and although OPEX costs are lower in terms of USDMW compared with solar
technologies with TES OPEX costs in terms of costs per total annual plant production per
year will typically be higher for technologies that do not use TES
4634 OampM CSP LEARNING RATES
Cost reductions on CSP technologies are expected to come from the following main actions
economies of scale in the plant size and manufacturing industry
learning impacts on design construction and operation phases
50
advances in RampD of the following factors
Components Solar receivers mirrors HTF storage media supporting structures
trackers and auxiliary systems
Systems Direct steam generation storage systems or hybrid cooling systems
Configurations Hybridisation or duel electricity water plants
a more competitive supply chain
improvements in the performance of the solar field solar-to-electric efficiency and
thermal energy storage systems
increases in the life of plants and
reduced financial costs
Based on the parameters listed above the LCOE from Solar Thermal technologies is likely to
be continuously decreasing and this is born out in the literature that has been reviewed Based
on the IRENA 2013b report the evolution of the LCOE from trough and power tower CSP
technologies shows how the LCOE is decreasing as technology development increases in
Table 16 below Estimates for LCOE for the hypothetical trough and tower CSP plants in
2014 are also included
51
Table 16 Estimated LCOE form Existing and Hypothetical Trough and Solar Tower CSP Technologies
CSP
Technology
Year Capacity
(MW)
Plant Name Location DNI
(kWhm2year)
LCOE 2012
$kWh Installed
Trough
1981 05 PSA Spain 2000 064
1983 138 SEGS I California 2700 039
1989 30 SEGS II ndash VIII California 2700 026
1992 80 SEGS VIII amp IX California 2700 020
2008 - 2009 50 Andasol 1 2 Spain 2000 035
2010 50 Solnova 1 amp 3 Spain 2000 034
2010 - 2011 50 Extresol 1 amp 2 Spain 2000 035
2014 250 Unspecified (wet
cooling no storage)
Not provided Not provided 020
Tower
1987 10 Solar One California 2700 058
2007 11 PS10 Spain 2000 034
2009 20 PS20 Spain 2000 036
2011 199 Gemasolar (wet
cooling 15hr
storage)
Spain 2000 033
2014 120 Unspecified
(dry cooling
storage)
Not Provided Not provided 015
International Institutions such as IRENA ESTELA or the World Bank agree that the LCOE
and capital cost reductions of 28 per cent to 60 per cent are envisioned by 2020 ndash 2025 for
such plant Estimates of possible LCOE reductions for CSP technology from 2012 to 2025
are provided in Figure 7 taken from Kearny (2010)
52
Figure 7 Expected LCOE Reductions for CSP Technology from 2012 to 2025
Source (Kearny 2010)
The OampM maintenance costs of modern CSP Plants are lower than those for Californian
SEGS Plants built in the 1980s and 1990s which has a total combined capacity of 354 MW
and estimated OampM costs of USD 004kWh (IRENA 2013b) However CSP experienced no
growth from early 1990s until the mid-2000s as can be seen in Table 16 above
As stated at the beginning of Section 462 Andasol 1 was the first 50 MWe parabolic trough
plant built after SEGS which included a thermal energy storage system It commenced
operation at the end of 2008 Podewils (2008) estimated Andasol 1 OampM costs of EUR
0072kWh or USD 0095kWh (considering 2012 medium rate exchange EURUSD of
07553) This value is high compared to OPEX estimations for PT with TES provided by
both this 2013 update and the AETA 2012 report (00293 and 00377 USDkWh
respectively) Therefore according to the information detailed above considerable learning
improvements to OampM costs have been already achieved from the commencement of
operation of Andasol 1 to the time of this Report
`WorleyParsonsrsquo estimations on the LCOE of parabolic trough plants is in the range of
USD 020kWh to USD 035kWh and that of solar towers between USD 017kWh and
USD 029kWh However in areas with excellent solar resources the range could be as low
as USD 014kWh to USD 018kWh
The following considerations have been taken into account for OampM cost learning rates
forecast
WorleyParsons LCOE estimations as set out above
Potential average envisaged LCOE reductions of 475 per cent by 2025 based on Figure
7 above
OPEX contribution on LCOE of 20 per cent and
53
assuming that all components involved in the LCOE (CAPEX OPEX and financial
expenses) reduce at the same rate so percentage contributions remain constant
According to these considerations WorleyParsons estimates that OPEX values by 2025 could
reach from 0021 to 0037 USDkWh for PT technology and from 0018 to 0031 USDkWh
for ST technology
Technological improvements have reduced the requirement of replacing mirrors and
receivers Automation has reduced the cost of other OampM procedures by as much 30 per
cent As a result of OampM procedure improvements (both cost and plant performance) the
total OampM costs of CSP plants in the long-term are likely to be below USD 0025kWh
(IRENA 2013b)
Parabolic trough system in the United States would have OampM costs of around USD 002 to
USD 003kWh meanwhile the OampM costs of parabolic trough and solar tower power plants
currently under construction in South Africa have estimated OampM costs of between USD
0029 and USD 0036kWh (also IRENA 2013b)
WorleyParsons estimations are in alignment with IRENA estimations in terms of current and
envisaged CSP OPEX costs
4635 CONCLUSIONS ndash CSP
The following main conclusions were made based on this study in relation to CSP
technologies
the 2013 WorleyParsons CSP OampM costs update resulted in values between 0023 and
0043 USDkWh based on 2012 USD
reductions in CSP OampM costs between 8 per cent and 27 per cent were obtained in
comparison to values provide in AETA 2012 report
the total OampM costs of CSP Plants in the long-term are likely to be below USD
0025kWh
the updated values for 2013 by WorleyParsons are in alignment with the values
provided by recognised international institutions and
at the time of this report the only CSP technology with substantial operation capacity
was PT Only three utility-scale ST plants were in operation at the time of this report
(PS-10 PS-20 and Gemasolar) of which only one (Gemasolar) uses TES Though
several process steam and small-scale LFR Plants are currently in operation only one
utility-scale LFR (Puerto Erradio 2) was in operation at the time of this report
47 AETA 2013 OampM Learning Rate recommendation
The learning rate used in AETA 2012 for OampM is applied to all technologies assessed and
includes fossil fuel technologies and emerging technologies The learning rate is set at an
improvement of 02 per cent per annum
In addition to the improvement rate OampM is escalated at a rate of 150 per cent of CPI per
year based on experience with increases in parts and labour costs
The CPI rate set in the model is 25 per cent per annum
54
OampM cost information in the public domain in both quantum and quality is poor for
contemporary data Information supporting OampM learning rates is equally poor There are
indications that emerging technologies do have the potential for increased OampM learning
rates relative to mature technologies
For the renewable energy technologies studied in this report onshore wind is considered
mature and it is recommended that the AETA 2012 report value of 02 per cent is maintained
For all other renewable energy technologies studied in this report a more aggressive learning
rate of 25 per cent is recommended This will effectively cancel out the CPI escalation
adjustment and provide a ldquoflat linerdquo OampM rate for future years This will provide a value in
line with the learning rate conclusions for PV
The learning rate for CSP is considered to have greater potential for reduction but due to the
high level of analysis in this report (and therefore uncertainty) it is proposed that a maximum
of two learning rates is appropriate for the AETA model
Table 17 AETA Learning Rate Comparison
AETA 2012 Learning Rate AETA 2013 update Learning Rate
Onshore Wind 02 per cent 02 per cent
Offshore Wind
PV ndash all technologies
CSP ndash all technologies
02 per cent 25 per cent
55
5 CHANGES TO THE LCOE
Changes to the model parameters described in the earlier sections have resulted in changes to
the LCOE estimates for a number of technologies The LCOE estimate values for all
technologies and associated range of uncertainty are shown in the Figures 8 to 13 below
Note that the values listed are for a base value carbon price modifier of zero per cent which
places no value on carbon emissions
For selected technologies where there are significant cost differences Figure 14 provides a
comparison of mid-range LCOE values for the AETA 2013 and AETA 2012 Models Key
features of the Figures 8 to 14 are as follows
both in AETA 2012 and 2013 Model update LCOE costs are provided for the years
2012 2020 2025 2030 2040 and 2050
cost ranges are provided for each technology that accounts for differences in fuel prices
and state-based variations
LCOE costs vary substantially across the technologies from $89MWh (combined cycle
gas turbine) to $351MWh (solar thermal linear fresnel) in 2012 and $73MWh (PV
non-tracking) to $247MWh (IGCC black coal CCS) in 2050
the inter-technology LCOE comparisons figures (Figures 8 to 13) reveal changes in
relative costs of technologies over time Key results include renewable technologies
have higher LCOEs than the lowest cost non-renewable technologies and the relative
LCOE rankings significantly change post 2030 The LCOE of solar PV become lower
than the non-renewables from mid 2030 onwards and
large changes in LCOE results between AETA 2013 Update and AETA 2012 are
depicted in Figures14 below Figure 14 compares LCOEs at 2050 between the AETA
2013 Update and AETA 2012 for a selected number of technologies that have changed
significantly for NSW (AETA developed LCOEs by each Australian state) Differences
in technology LCOEs are explained by a multiplicity of factors including the technical
developments OampM costs and learning rate changes
56
Figure 8 Updated LCOEs for AETA 2013 Model technologies values for 2012 (NSW) with carbon price set to zero
0
50
100
150
200
250
300
350
400
450
500
LCO
E ($
MW
h)
LCOE FOR 2012 TECHNOLOGIES (NSW) Note Default region is NSW except bown coal
technologies (VIC) and SWIS scale (as specified)
LCOE includes where relevant allowance for- Carbon Price- CO2 transport and sequestration cost- Plant capital cost (EPC basis) within battery limits- Owners costs excluding interest during construction- Fixed and variable operating costs- Fuel costs- Economic escalation factors
57
Figure 9 Updated LCOEs for AETA 2013 Model technologies values for 2020 (NSW) with carbon price set to zero
0
50
100
150
200
250
300
350
400
450
LCO
E ($
MW
h)
LCOE FOR 2020 TECHNOLOGIES (NSW) Note Default region is NSW except bown coal
technologies (VIC) and SWIS scale (as specified)
LCOE includes where relevant allowance for- Carbon Price- CO2 transport and sequestration cost- Plant capital cost (EPC basis) within battery limits- Owners costs excluding interest during construction- Fixed and variable operating costs- Fuel costs- Economic escalation factors
58
Figure 10 Updated LCOEs for AETA 2013 Model technologies values for 2025 (NSW) with carbon price set to zero
0
50
100
150
200
250
300
350
400
LCO
E ($
MW
h)
LCOE FOR 2025 TECHNOLOGIES (NSW) Note Default region is NSW except bown coal
technologies (VIC) and SWIS scale (as specified)
LCOE includes where relevant allowance for- Carbon Price- CO2 transport and sequestration cost- Plant capital cost (EPC basis) within battery limits- Owners costs excluding interest during construction- Fixed and variable operating costs- Fuel costs- Economic escalation factors
59
Figure 11 Updated LCOEs for AETA 2013 Model technologies values for 2030 (NSW) with carbon price set to zero
0
50
100
150
200
250
300
350
400
LCO
E ($
MW
h)
LCOE FOR 2030 TECHNOLOGIES (NSW) Note Default region is NSW except bown coal
technologies (VIC) and SWIS scale (as specified)
LCOE includes where relevant allowance for- Carbon Price- CO2 transport and sequestration cost- Plant capital cost (EPC basis) within battery limits- Owners costs excluding interest during construction- Fixed and variable operating costs- Fuel costs- Economic escalation factors
60
Figure 12 Updated LCOEs for AETA 2013 Model technologies values for 2040 (NSW) with carbon price set to zero
0
50
100
150
200
250
300
350
400
LCO
E ($
MW
h)
LCOE FOR 2040 TECHNOLOGIES (NSW) Note Default region is NSW except bown coal
technologies (VIC) and SWIS scale (as specified)
LCOE includes where relevant allowance for- Carbon Price- CO2 transport and sequestration cost- Plant capital cost (EPC basis) within battery limits- Owners costs excluding interest during construction- Fixed and variable operating costs- Fuel costs- Economic escalation factors
61
Figure 13 Updated LCOEs for AETA 2013 Model technologies values for 2050 (NSW) with carbon price set to zero
0
50
100
150
200
250
300
350
400
LCO
E ($
MW
h)
LCOE FOR 2050 TECHNOLOGIES (NSW)
LCOE includes where relevant allowance for- Carbon Price- CO2 transport and sequestration cost- Plant capital cost (EPC basis) within battery limits- Owners costs excluding interest during construction- Fixed and variable operating costs- Fuel costs- Economic escalation factors
Note Default region is NSW except bown coal
technologies (VIC) and SWIS scale (as specified)
62
Figure 14 Comparison of AETA 2013 Model and AETA 2012 Model LCOE estimates selected technologies 2050
0
50
100
150
200
250
AETA 2012
AETA 2013
63
51 Conclusions
The Australian Energy Technology Assessment (AETA 2012) provided the best available and most up-to-
date cost estimates for 40 electricity generation technologies under Australian conditions To ensure that
the cost estimates for the various technologies are consistent all common input costs (eg labour
materials components carbon price) were itemised To ensure that the AETA costings remain up to date
AETA costs are reviewed in this AETA 2013 Model Update report
The AETA 2013 refresh was developed in close consultation with a stakeholder reference group drawn
from industry and researchacademic organisations with interests and expertise in a diverse range of
electricity generation technologies
The AETA 2013 Model results reflect the change to exclude the value of a carbon price in the Levelised
Cost of Energy (LCOE) All technologies have experienced a minor reduction in LCOE relative to 2012
(offset in some cases by other factors) due to the change to an amortisation period of 30 years plus the
construction period
Comparing the 2012 AETA results without a carbon price to the 2013 results without a carbon price there
are significant reductions in the LCOE of solar technologies and onshore wind This is as a consequence of
changes to the fixed and variable Operations and Maintenance (OampM) costs for these technologies For the
solar technologies the adjustment of the capital learning rate to 25 per cent has also contributed to the
LCOE reduction Offshore wind also has an increased learning rate but this has been offset to a large extent
by increased variable OampM costs
Nuclear LCOE has increased significantly due to higher estimates for capital costs
Efficiency for coal fired plants with CCS retrofits has been revised downwards to better reflect the expected
efficiency of these plants and has the effect of increasing the LCOE
64
REFERENCES
Albers A 2009 OampM Cost Modeling Technical Losses and Associated Uncertainties Proceedings of the
2009 European Wind Energy Conference Marseilles France March
AWEA (American Wind Energy Association) 2013 AWEA US Wind Industry Annual Report ndash Year
Ending 2012 USA
BNEF (Bloomberg New Energy Finance) 2013 Operations and Maintenance (OampM) Price Index Issue II
Wind Research Note April
BREE (Bureau of Resources and Energy Economics) 2012 AETA Report and Model Version 1_0 2012
Australian httpwwwbreegovau
CEC (Clean Energy Council) 2013 Australian Energy Technology Assessment 2013 Review Letter to
BREE of 20 May 2013 from the Clean Energy Council (Mr Russel Marsh signatory for the CEC)
CEC (Clean Energy Council) 2013 Clean Energy Council Renewable Energy Map Australia June (data
noted as current as of 21 August 2012)
httpwwwcleanenergycouncilorgauresourcecentreplantregistermaphtml
Crown Estate 2012 Offshore Wind Cost Reduction Pathways Study United Kingdom May
CSP 2012a CSP Parabolic Trough Report Cost Performance and Key Trends CSP Today
CSP 2012b CSP Solar Tower Report Cost Performance and Key Trends CSP Today
Deloitte amp Touche 2012 European Wind Services Study Find Out Which Way the Wind Blows Deloitte amp
Touche GmbH Wirtschaftspruumlfungsgesellschaft August
Deloitte 2011 Economics of wind development in New Zealand Deloitte for the for the New Zealand Wind
Energy Association
Ebert P amp Ware J 2013 The Role of Independents in the Wind Farm Operations amp Maintenance
Proceedings of the 2013 New Zealand Wind Energy Conference and Exhibition March
EPRI (Electric Power Research Institute) 2010 Engineering and Economic Evaluation of Central-Station
Solar Photovoltaic Power Plants USA March
GlobalData 2012 Wind Operations amp Maintenance (OampM) Market ndash Global Market Size Share by
Component Competitive Landscape and Key Country Analysis to 2020 GlobalData reference code
GDAE1054MAR January
Hand M 2013 Wind Plant Cost of Energy Proceedings of the 2nd NREL Wind Energy System
Engineering Workshop January
Hassan G 2011 Review of the Australian Wind Energy Industry Clean Energy Council Australia 2011
Houston C 2013 The Real Truth About Wind Farm OampM Costs North American WindPower March
IEA (International Energy Agency) 2008 Technology Roadmap Solar photovoltaic energy France
httpwwwieaorgpublicationsfreepublicationspublicationpv_roadmappdf
IRENA (International Renewable Energy Agency) 2013a Solar Photovoltaics Technology Brief Germany
January httpwwwirenaorgDocumentDownloadsPublicationsIRENA-ETSAPper
cent20Techper cent 20Briefper cent20E11per cent20Solarper cent20PVpdf
65
IRENA (International Renewable Energy Agency) 2013b Concentrating Solar Power Technology Brief
Germany January
IRENA (International Renewable Energy Agency) 2013c Renewable Power Generation Costs in 2012 An
Overview Germany
IT Power 2013 Analysis of the AETA 2012 cost estimates of CSP technologies Clean Energy Council
submission to the Bureau of Resources and Energy Economics May
Kann S 2012 US Solar Market Insight Report Q3 California USA
Kearny A 2010 Solar Thermal Electricity 2025 ndash clean electricity on demand attractive STE costs
stabilize energy production ATKearny consultants Dusseldorf Germany
Muirhead J 2013 SEGS experience suggests that CSP will age gracefully CSP Today South Africa
httpsocialcsptodaycommarketssegs-experience-suggests-csp-will-age-
gracefullysthash6VkxFaD0dpuf
NREL (National Renewable Energy Laboratories) 2011 IEA Wind Task 26 ndash Multi-national Case Study of
the Financial Cost of Wind Energy Technical Report NRELTP-6A2-48-48155 March
NREL (National Renewable Energy Laboratories) 2012 Cost and Performance Data for Power Generation
Technologies USA February
NREL (National Renewable Energy Laboratories) 2013 Breakeven Prices for Photovoltaics on
Supermarkets in the United States March httpwwwnrelgovdocsfy13osti57276pdf
NREL (National Renewable Energy Laboratories) 2013 Breakeven Prices for Photovoltaics on
Supermarkets in the United States USA March httpwwwnrelgovdocsfy13osti57276pdf
Photon 2012 The True Cost of Solar Power 2012 Temple of Doom Solar Power in Focus Series Photon
Consulting
Photon 2013 Solar Annual 2013 Build Your Empire Photon Consulting
Podewils C 2008 Photovoltaic vs Solar Thermal where PV has the upper hand and where solar thermal
strikes back Photon International Germany November
Poore R and Walford C 2008 Development of an Operations and Maintenance Cost Model to Identify
Cost of Energy Savings for Low Wind Speed Turbines Report NRELSR-500-40581 National
Renewable Energy Laboratory January
RolandBerger 2013 Offshore Wind Towards 2020 On the Pathway to Cost Competitiveness RolandBerger
Consultants Germany April
See wwwcsptodaycom
See wwwepiaorg
See wwwestelasolarde
See wwwidaees
See wwwieaorg
See wwwirenaorg
See wwwnrelgov
See wwwprotermosolares
66
See wwwrenoveteces
See wwwseiaorgau
See wwwsolarelectricpowerorg
See wwwworldbankorg
UK Crown Estate 2012 Offshore Wind Cost reduction Study May
US DoE (Department of Energy) 2013 Award Number DE-EE0005360 USA February
Wiser R Lantz E Bolinger M amp Hand M 2012 Recent Developments in the Levelized Cost of Energy
from US Wind Power Projects Contract No DE-AC02-05CH11231 National Renewable Energy
Laboratories February
67
Appendix A
Electricity Generation Technologies in AETA 2012 Report and Model
The 40 AETA electricity generation technologies are
1 Integrated Gasification and Combined Cycle (IGCC) plant based on brown coal
2 IGCC plant with Carbon Capture and Sequestration (CCS) based on brown coal
3 IGCC plant based on bituminous coal
4 IGCC plant with CCS based on bituminous coal
5 Direct injection coal engine (clean lignite eg brown coal technology)
6 Pulverised coal supercritical plant based on brown coal
7 Pulverised coal supercritical plant with post combustion CCS based on brown coal
8 Pulverised coal subcritical plant with post combustion CCS based on brown coal (retrofit)
9 Pulverised coal supercritical plant based on bituminous coal
10 Pulverised coal supercritical plant based on bituminous coal - SWIS relevant scale
11 Pulverised coal supercritical plant with CCS based on bituminous coal
12 Pulverised coal subcritical plant with post combustion CCS based on bituminous coal (retrofit)
13 Adding CCS to existing Combined Cycle Gas Turbine (CCGT) power plants (retrofitting)
14 Oxy combustion pulverised coal supercritical plant based on bituminous coal
15 Oxy combustion pulverised coal supercritical plant with CCS based on bituminous coal
16 Combined cycle plant burning natural gas
17 Combined cycle plant burning natural gas - SWIS relevant scale
18 Combined cycle plant with post combustion CCS
19 Open cycle plant burning natural gas
20 Solar thermal plant using compact linear fresnal reflector technology wo storage
21 Solar thermal plant using parabolic trough technology wo storage
22 Solar thermal plant using parabolic trough technology with storage
23 Solar thermal plant using compact linear fresnal reflector technology with storage
24 Solar thermal plant using central receiver technology wo storage
25 Solar thermal plant using central receiver technology with storage
26 Solar photovoltaic (PV) - non-tracking
27 Solar photovoltaic (PV) - single axis tracking
28 Solar photovoltaic (PV) - dual axis tracking
29 Wind (on-shore)
30 Wind (off-shore)
31 WaveOcean
68
32 Geothermal - hot sedimentary aquifer (HSA)
33 Geothermal - enhances geothermal system (EGS)
34 Landfill gas power plant
35 Sugar cane waste power plant
36 Other biomass waste power plant (eg wood)
37 Nuclear Gen 3+
38 Nuclear Small Modular Reactors (SMR)
39 Solarcoal hybrid
40 Integrated solar combined cycle (ISCS) ndash parabolic trough with combined cycle gas
69
Appendix B
Consultations with Stakeholders
This study has been undertaken in close consultation with a Stakeholder Reference Group drawn from
Australian industry and domestic as well as overseas researchacademic organisations with interests and
expertise in a diverse range of electricity generation technologies These stakeholders were invited to
provide evidence of the latest estimates for the costs and performance of various technologies
In addition the AETA project also had a Project Steering Committee comprising staff from BREE
AEMO CSIRO and other independent experts to provide technical advice and support The following
agencies participated in the stakeholder reference group meetings or were forwarded the documents
presented at the meetings
AETA Stakeholder Reference Group
Australian Coal Association
Australian Energy Market Operator
Australian Geothermal Energy Association
Australian National Low Emissions Coal RampD
Australian National University
Australian Renewable Energy Agency
Australian Solar Thermal Energy Association
Australian Sugar Milling Council
Australian Treasury
Bureau of Resources and Energy Economics
Clean Energy Council
CSIRO
Department of Industry
Economic Research Institute for ASEAN and East Asia
Energy Retailers Association of Australia
Energy Users Association of Australia
Evans and Peck
Ferrostaal
Global CCS Institute
Grid Australia
Intergen
International Energy Agency France
International Power Suez
IRENA Innovation and Technology Centre Germany
70
National Generators Forum
Oceanlinx Limited
Origin Energy
Private Generators Group
The Institute of Energy Economics Japan
The Energy Research Institute New Delhi
University of Melbourne Energy Institute
University of Queensland Energy Initiative
UQ Energy Economics amp Management Group
Wyldgroup
WorleyParsons
Two AETA Stakeholders Reference Group meetings took place on 30 April 2013 and 17 July 2013 In
addition the AETA Project Steering Committee met on 24 June 2013
71
BREE contacts Executive Director BREE Bruce Wilson brucewilsonretgovau
(02) 6243 7901
Deputy Executive Director Wayne Calder waynecalderbreegovau
(02) 6243 7718
Modelling amp Policy Integration Arif Syed arifsyedbreegovau
Program Leader (02) 6243 7504
Data Statistics Geoff Armitage geoffarmitagebreegovau
Program Leader (02) 6243 7510
Energy and Quantitative Analysis Allison Ball allisonballbreegovau
Program Leader (02) 6243 7539
Resources ndash Program Leader John Barber johnbarberbreegovau
(02) 6243 7988
72
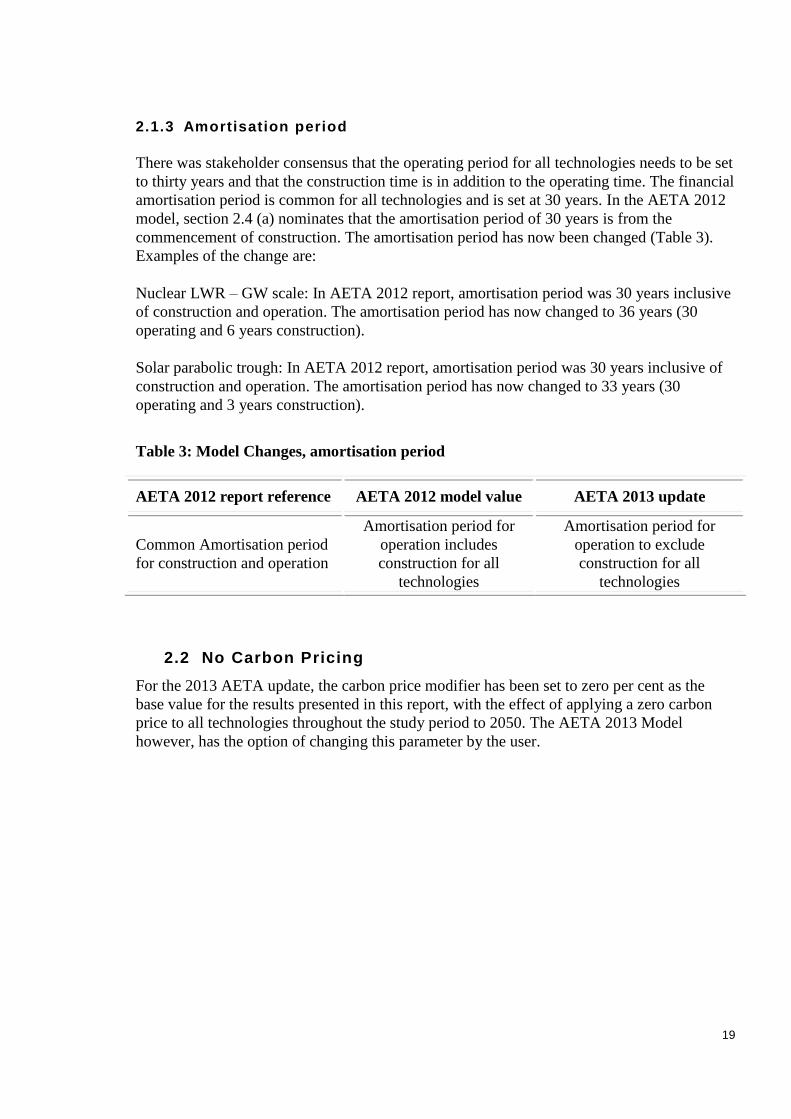

20
3 CONSIDERATION OF OTHER ISSUES
This section summarises the issues that were discussed during the AETA 2013 Model Update
with AETA stakeholders but have not led to a change in the model However these issues do
not cover the OampM costs considerations that are detailed in section 4
31 Representation of Uncertainty
The recognition of uncertainty within the model was discussed including both the level of
representation and potential uncertainties with respect to First-of-a-Kind and lsquoEarly Moverrsquo
Technologies
A number of factors were identified that lead to uncertainty in estimates ndash particularly for
emerging technologies For conventional coal and gas technologies even though the
technology is mature the addition of carbon capture introduces cost and performance
uncertainty Cost estimates have inherent uncertainty due to the market uncertainties and
unforeseeable technological developments and due to
- Volatility in equipment pricing
- Volatility in economic conditions (during post Global Financial Crisis) and
- Volatility in labour pricing due to ldquootherrdquo heavy construction projects in specific areas
For technologies where the costs are well understood it was considered that the error bars
should be reduced compared to immediate and emerging technologies and that the error bars
should be lower for technology costs in 2012 compared to later years
There is strong agreement from two key stakeholder submissions with all the factors causing
uncertainty that have been identified in AETA 2012 In particular the labour cost has varied
(increased) significantly due to large construction projects which have increased costs due to
a shortage of labour and a lower productivity due to less experienced personnel The
uncertainties provided in the AETA model are available on a per technology and a per
selected years basis BREE will consider whether or not to include more detail on
uncertainty by technology in the 2014 review of the model
32 Application of Learning Curves
It was raised during the consultation process that the AETA model revision could allow for
learning curve cost reduction assumptions to be altered by the end user This has not been
incorporated in the 2013 update as it is a structural change to the AETA Model
Stakeholders also raised the question as to whether it is possible within the application of
learning curves to distinguish between the potential for cost reductions on manufactured
components like PV panels versus the Balance of Project (BoP) costs which may involve
routine assembly and erection activities which are not subject to significant learning by
doing
However there are opportunities for cost reductions particularly where many repetitive tasks
are involved such as solar field construction modular construction techniques
rationalization of components in the BoP design or reduction in assembly or placement time
21
This is supported in the US Solar Market Insight Report 2012 (Kann 2012) which identified
continued savings in inverter and racking costs as follows
ldquohellip falling equipment costs and fine-tuning of installation practices have made large-
scale solar less expensive QQrdquo
ldquohellip with the continuing maturation of the industry we expect continued focus on
reducing PV balance-of-systems costs (BOS) and that the increased worry over high
penetration PV will drive adoption of 1000Vdc and advanced inverters
respectivelyrdquo and
ldquoMounting structure manufacturers noted that the past year has seen tremendous
pricing pressure accounting for price declines of anywhere between 10 per cent and
30 per cent over the past yearrdquo
Given that the balance of plant costs can also be subject to cost reductions it is not
considered necessary to distinguish learning curves for discrete project costs in the model
33 General Costs Considerations
331 Fuel Costs
The outlook for fuel costs for gas coal and carbon was claimed to have materially shifted
since the AETA 2012 model While there was no evidence provided to support this
consideration will be given to this issue in the 2014 model update
332 CCS Costs
A submission cited the ZeroGen Case Study and sought to clarify the differences in CCS
cost between ZeroGen and lower values estimated for AETA 2012 This is a valid
comparison however BREE notes the following issues which contribute to explaining the
differences The international cost component is as follows AETA 52 per cent ZeroGen 34
per cent With the USD exchange rate AETA 1 ZeroGen at 08 adjusting the AETA value
for exchange rate variation would add A$952kWnet to the AETA value There is a
difference in plant size with AETA at 557 MW net and Zerogen 400 MW net A bigger plant
size would typically provide a lower cost kW installed
Additionally section 112 of Chapter One of the ZeroGen report advises escalation based on
project delivery from 2011 to 2017 AETA costs are for 2012 basis and do not include
escalation beyond this time A portion of the Zerogen costs will be inflated over the
comparable AETA cost Also section 113 of Chapter One of the ZeroGen report identifies
significant enabling works This is likely to be more inclusive than considered in the AETA
2012 report as identified in section 23 (a)
Overall it is considered likely that a number of estimate basis items in the ZeroGen study are
different and once equalised will show a smaller difference between the AETA and
ZeroGen values Therefore there is no immediate action but the basis and assumptions of the
model may be reviewed during 2014 AETA update
With regard to CCS efficiency one submission proposed that the AETA estimates were
overly optimistic However no references were cited to support this view and no change has
been made to the model
22
333 Opportunity Costs
A submission was made that footnotes be included regarding retrofit costs to indicate that
make-up power costs are not included This was not adopted because AETA parameters for
each technology are calculated for that technology alone and do not consider the impact of
reduced output of a retrofit project where additional output needs to be generated from
alternate higher cost generation Opportunity costs are specifically related to business cases
for specific projects and are not considered for any cases presented in the AETA report
Moreover retrofitting does not make electricity generation uncertain or intermittent It only
lowers the flow of generation at a constant rate (due to lower thermal efficiency) relative to
the non-retrofit case
34 Capital and Construction Costs
A submission was made to update the AETA values for the mid-point capital cost for several
technologies based on a study provided in support of the submission The technologies
asserted were
IGCC (Integrated Gasification and Combined Cycle) with 90 per cent capture fuelled
with Victorian brown coal
IGCC with no capture fuelled with black coal
IGCC with 90 per cent capture fuelled with black coal
Pulverised Fuel power plant with 90 per cent capture fuelled with Victorian brown
coal
Pulverised Fuel power plant with 90 per cent capture fuelled with black coal and
OCGT with no capture fuelled with natural gas
There is a key difference in the magnitude of the labour component in Australia compared
with the labour costs associated with the supporting material (from the USA) While no
changes have been made to the model in this update the ldquoshort termrdquo impact of labour
pricing on technology costs may be considered in further updates
Similarly it was submitted that the capital cost values for combined Cycle Gas Turbine
(CCGT) (with and without capture) could be revised As no documentary evidence was
provided to support this no change was made
For Direct Injection Coal Emulsion (DICE) power plant with no capture fuelled with
Victorian brown coal it is also suggested that the values be reviewed with a number of
papers provided for reference However these papers do not address capital cost in any depth
and it is unclear if the balance of project costs included are comparable with AETA DICE
technology is not mature and is probably best described as in the demonstration to
deployment phase of development which brings uncertainty into the cost analysis Therefore
data is needed to substantiate this submission As this was not available at the time of
preparing this report consideration of this issue is deferred to a later time when the necessary
data is available
An increase in the capital costs for Solar thermal trough (6 hrs storage) and Solar thermal
central receiver (6 hours storage) were proposed based on a supporting study by the Electric
Power Research institute (EPRI) The proposed values are substantially larger than the AETA
23
2012 but it is not clear what basis is used to generate these revised values A separate
submission received from another AETA stakeholder has supported the AETA values
Additionally the cited reference for solar thermal trough the Energy Power Research
Institute (EPRI) plant configuration is based on air cooling ndash while for AETA the plant
configuration assumes water cooling The difference in plant configuration will account for a
small part of the difference The AETA value is based on a reference report as issued in 2012
by the US National Renewable Energy Laboratory (NREL 2012)
The AETA value for the central receiver technology is based on a small (20MW) plant
(Gemasolar) with factors for adjustment to field size for thermal storage capacity and post
FOAK learning These factors will align with increased uncertainty in the AETA value It is
likely that additional cost information may now be available for the Brightsource Ivanpah
plant (no storage) and other tower plants being considered under construction
Further investigation of these issues has been sought with stakeholders but is as yet
unavailable
Another suggestion was made to consider capital costs on a component basis The capital
costs used in AETA 2012 for existing technologies were based on actual costs that could be
sourced on published documents (locally andor internationally) or from WorleyParsons
internal data For developing technologies costs were not considered on a component level
For this reason in technologies that are not commercialised a number of assumptions would
need to be made which may limit lsquorealrsquo costs being available No change to the model arose
from this submission
A reassessment of the construction expenditure profile for concentrating solar power (CSP)
technology options was sought in another stakeholder submission and supported by a
referenced report (IT Power 2012) However the plant sizes considered in the AETA report
are larger capacity (100 MW+) than those discussed in the cited report and consequently
have a longer duration construction period As three years is considered to be an appropriate
time period to spread the construction expenditure profile no change to the model was made
35 Costs Associated with Solar Technologies
A change to the model was sought with regard to the significant downward trends in the cost
of solar PV The stakeholder submission cited pricing data from the Australian Photovoltaic
Institute (APVI) Consultation with the APVI identified that evidence based information for
utility scale PV costs in Australia is limited because Australia has no PV systems 100 MW or
larger It is acknowledged however that there is significant and continued volatility in the
solar PV market including volatility due to competition oversupply in the PV module
market as well as continued price reductions for balance of system and installation costs
A$338 Wnet was a reasonable valuation for 2012 AETA The AETA 2012 value will be
maintained but may be reviewed in the 2014 model update
It was also suggested that solar thermal costs could be better represented in the model by
allowing for different periods of storage rather than a standard 6 hours The AETA 2012
scope was based on fixed plant designs which included fixed thermal storage sizing where
thermal storage was included With thermal storage there are a number of variables that can
be considered including differing field sizes (solar multiple) as well as actual thermal storage
capacities This is likely to add significant complexity to the report and to the model the
benefit of which at this stage does not warrant the changes
24
36 Costs Associated with Nuclear Technologies
It was submitted that consideration be given to including the impact on LCOE for nuclear
technology of the relatively high insurance costs for nuclear technologies This issue will be
considered in the 2014 review of the AETA model However insurance costs or plant
decommissioning costs are not considered for any of the 40 AETA technologies
Also the OampM improvement rate for Nuclear was not reconsidered as there is no OampM
improvement rate for Nuclear in the model
37 Further Technologies
A proposal was received which recommended that further technologies (DICE power plant
based on black coal with and without capture and DICE brown coal with capture and
medium speed DICE technologies) be incorporated into the AETA Model However as
mentioned earlier this update of the AETA 2012 Model only considered the technologies
included in that model This update of the model is not intended to broaden the technologies
38 Auxiliary Loads
Another example used for the purposes of drawing comparisons with the AETA model was
the SaskPower Post Combustion Retrofit It is difficult to distil the SaskPower project data
into a direct comparison with the AETA study and consequently there is insufficient data
certainty to warrant changes to the AETA 2012 values The SaskPower Post Combustion
Retrofit was also cited as to its conservative auxiliary loads for brown and black coal
However upon further investigation this was not substantiated within the SaskPower
example
25
4 WIND PV AND CSP OPERATIONS AND MAINTENANCE (OampM) COST UPDATE
41 Operation and Maintenance Costs
OPERATING AND MAINTENANCE COST DEFINITIONS
In considering the costing of OampM there is no absolutely clear definition of which costs
should be considered as fixed and which variable with the breakdown varying based on a
range of issues including technology location and resource type For this reason in the future
AETA reports OampM costs may be compared in terms of annual total operating expenditure
(OPEX) per MW of generation This method is widely used by most international institutions
to analyse OampM costs and to avoid subjective considerations
For this report fixed and variable costs are reported to provide direct comparison with AETA
2012 In this regard in general fixed costs are independent of the electrical generation of the
plant and are expressed as annual cost per MW capacity Fixed costs include items such as
fixed labour
equipment and
vehicles
Variable costs are proportional to the electrical generation of the Plant and are expressed as
cost rate per kWh energy output Variable costs include items such as
variable labour
consumables and
spare parts
As both public and private domain material vary in the way they approach and report on
fixed and variable maintenance within the following text where an interpretation has been
used for comparison purposes this is described
A submission was made to remove the operations and maintenance (OampM) cost escalation
factors This was not taken up as there is an increase in the OampM costs over CPI which is
borne out historically A review of the basis for this escalation determined that the
underlying assumptions were appropriate The review also considered adopting a generic
learning curve approach for OampM improvement rates as was suggested in one submission
This was not adopted as the model has an OampM improvement rate (set at 02 per cent per
annum) which can be varied by the user for wind and solar technologies This value accounts
for more efficient practices balancing the increase in labour and material costs over and
above CPI However changes to OampM improvement rates for selected technologies were
made as mentioned earlier OampM improvement rate values may be further considered for
emerging technologies in 2014 AETA study
A number of submissions referred to the improvement rate of OampM costs with evidence for
existing technologies to support these rising at 150 per cent CPI It was suggested that for
26
developing technologies it could reasonably be assumed that there would be reductions in
OampM between the first commercial installation and subsequent installations
While it is generally acknowledged that the LCOE of delivered energy from wind is falling
within the literature there is conflicting evidence around trends in OampM costs with recent
reports indicating both significant decreases and increases in OampM (see section 432)
Solar thermal plants consist of technology components that can be considered mature (eg
steam turbine) and components that are undergoing further development such as the solar
field and thermal storage Solar thermal plants require manning for operation as opposed to
wind turbines that do not require the same level of manning
A recent article (Muirhead 2013) advised for the Solar Energy Generating Systems (SEGS)
plants in California that have been operating since the early 1990rsquos ldquoMy understanding is
that the performance of the SEGS plants has significantly improved over time This is due
primarily to replacement of first generation receivers with newer receivers that are much
more efficient OampM practices at the plants have also improved over time based on the now
long history of operating these plants resulting in increased output in addition to reduced
OampM costs
In the AEMO report 100 Per Cent Renewables Study - Draft Modelling Outcomes Scenario 1
assumes that rapid technology transformation will drive real reductions in OampM costs
outweighing any increases projected in the AETA 2012 so OampM costs reduce by 125 per
cent by 2030 and 25 per cent by 2050 Scenario 2 uses the AETA 2012 assumption that
OampM costs escalate at around 150 per cent of Consumer Price Index (CPI) which leads to
cost increases of 27 per cent by 2030 and 46 per cent by 2050 It should be noted that the
Scenario 1 reductions are assumptions without further analysis of what will bring the
assumptions to fruition
In AETA 2012 the common OampM improvement rate for most technologies is set at 02 per
cent and can be varied as a user input The OampM improvement rate for emerging
technologies solar thermal and photovoltaic technology options and offshore wind is set to
25 per cent and can also be varied as a user input The improvement rate is now compounds
on the previous yearrsquos value
The OampM improvement rate values may be further considered for emerging technologies in
2014 AETA study
42 Operating and Maintenance (OampM) Changes in summary
As part of the Model Update special emphasis was placed in this report on the Operational
and Maintenance (OampM) costs and OampM improvement rates for all wind solar thermal and
solar PV renewable technologies covered in AETA 2012 As mentioned earlier this took into
account relevant Australian and international reports public domain information private
sources as well BREE and WorleyParsonsrsquo in-house experience The updated OampM values
are shown in Table 4 Reductions in CSP OampM costs of between 8 per cent and 27 per cent
were obtained in comparison to values provide in AETA 2012 report
The review included a detailed review of a report by IT Power cited as part of one of the
stakeholder submissions In that report reference is made to a case where $18MWh of OampM
costs comes from 64MW trough plant however it does not specify the relevant location hour
27
of thermal energy storage (TES) capacity factor type of cooling and back-up fuel and
therefore cannot be fully analysed nor used towards this AETA update
OampM costs for solar thermal plants are significantly affected by the costs of manpower To
demonstrate this with an example $18MWh for a 100MW plant with a 23 per cent capacity
factor (the IT Power report consideration) would result in an annual OampM cost of
approximately $36 million A 100MW plant will need at least 28 full time employees to be
properly manned 7 daysweek as there needs to be multiple shifts With this amount of
labour there are insufficient funds for site services utilities and materialsmaintenance If the
value is based on another location such as the Far or the Middle East region where labour
costs are significantly lower then a lower OampM cost may be feasible however for Australia
this does not appear to be feasible
The changes to OampM values for the 2013 AETA model refresh are summarised below
Table 4 Model Changes OampM costs
AETA 2012 report reference AETA 2012 model value AETA 2013 update
Section 23 Technical Assumptions
Operating and Maintenance Cost
Estimates
OampM improvement rate 02per
cent all technologies
OampM improvement rate maintained at
02per cent for
Coal based technology options
Gas based technology options
Solar thermal hybrid options
Onshore wind
Biomass technology options
Wave technology options
Geothermal technology options
Nuclear technology options
OampM improvement rate changed to 25per
cent for
Solar thermal technology options
Photovoltaic technology options
Offshore wind
The OampM improvement rate is compounded
from the previous yearsrsquo value
Section 33 Solar thermal
technologies
Solar thermal - Parabolic Trough wo
storage
Fixed OampM (AUS$MWyear)
Variable OampM (AUS$MWh)
60000
15
59176
1519
Solar thermal - Parabolic Trough with
storage
Fixed OampM (AUS$MWyear)
Variable OampM (AUS$MWh)
65000
20
72381
1139
Solar thermal - central receiver
technology wo storage
28
AETA 2012 report reference AETA 2012 model value AETA 2013 update
Fixed OampM (AUS$MWyear)
Variable OampM (AUS$MWh)
70000
15
58285
707
Solar thermal - central receiver
technology with storage
Fixed OampM (AUS$MWyear)
Variable OampM (AUS$MWh)
60000
15
71312
565
Solar thermal - Linear Fresnel wo
storage
Fixed OampM (AUS$MWyear)
Variable OampM (AUS$MWh)
60000
1500
64105
1519
Solar thermal - Linear Fresnel with
storage
Fixed OampM (AUS$MWyear)
Variable OampM (AUS$MWh)
65000
20
72381
1139
Section 35 Photovoltaic
technologies
PV ndash non tracking
Fixed OampM (AUS$MWyear)
25000
25000 (no change)
PV - Single Axis Tracking
Fixed OampM (AUS$MWyear)
38000
30000
PV - Dual Axis Tracking
Fixed OampM (AUS$MWyear)
47000
39000
Section 36 Wind Technologies
Wind Onshore
Fixed OampM (AUS$MWyear)
Variable OampM (AUS$MWh)
40000
12
32500
10
Wind Offshore
Fixed OampM (AUS$MWyear)
Variable OampM (AUS$MWh)
80000
12
77600
30
43 Wind
431 Introduction
This Section reviews onshore and offshore wind operations and maintenance (OampM) costs
used in AETA 2012 The values scrutinised are the fixed and variable OampM given in Table
361 of that report summarised in Table 5 below
29
Table 5 Wind OampM costs used in the AETA 2012 report
Option Fixed OampM (AUS$MW) Variable OampM (AUS$MWh)
Onshore 40000 12
Offshore 80000 12
OampM covers all of the services required to keep the wind farm operating as contracted to
supply energy and renewable energy certificates for its lifetime inclusive of
turbines and all balance of plant (roads buildings electrical equipment SCADA
control equipment) up to the high voltage connection point on the wind farm
substation
labour (both trades and professional)
facilities (workshops stores offices)
equipment (tools jigs vehicles rigging safety equipment craneage)
spare parts and
consumables (such as oil grease and office consumables)
Windfarm size was not specified in AETA 2012 however it was noted that wind farms
greater than 100MW are becoming more common Since then within Australia wind farms
of larger and smaller sizes have been constructed for example the 420 MW Macarthur Wind
Farm in Victoria and the 55 MW Mumbida Wind Farm in Western Australia with both larger
and smaller wind farms under proposal For this review a nominal size of 100-150 MW is
used as representative of current and future facilities
432 Review of Evidence
As mentioned earlier the review of public literature by BREE and WorleyParsons the
procurement of private studies consultations with owneroperators in the wind farm OampM
sector in Australia AETA Stakeholders and project Steering Committee members were used
to assist the current Model Update process Where possible these sources are noted in the
text however some of these sources have asked to remain anonymous and where so the
term ldquoprivate sourcerdquo has been used
As noted by one reviewer in NREL 2011 OampM cost information in the public domain in
both quantum and quality is poor and the situation appears no better in 2013 particularly in
the discrimination of fixed and variable costs One reason for this is the commercial and
increasingly competitive nature of the sector with wind farm OampM now a significant
business worldwide with subsequent confidentiality around actual costs
What constitutes wind farm OampM is also changing This is driven in part by technological
change as the wind fleet ages as new turbines become larger and more sophisticated
particularly offshore Competition in the provision of OampM services is also changing with
maturing of the wind energy product As an example the following industry trends are now
evident
30
a growing role of independents in the wind OampM market ndash around 25 per cent of the
wind fleet in the US is expected to be operated and maintained by independents by
2025 (Ebert and Ware 2013) as opposed to original equipment manufacturers (OEMs) -
wind is largely a commodity market and easier for new participants to enter something
not necessarily seen with other generation technologies
tighter supply markets ndash general economic volatility is tightening the supply and
project development chain for wind moving interest into the OampM sector bringing
price volatility and more competition
a more sophisticated asset management model ndash where OampM providers are linking
operational data with long term condition monitoring output forecasting and work
order scheduling to deliver what is termed ldquolifecycle optimisationrdquo squeezing more
energy out of the asset
older turbines exceeding planned maintenance budgets ndash with the chief issue being
keeping the variable OampM from unforeseen breakdowns
a push for larger turbines particularly offshore (5-10 MW) and in deeper waters and
linking OampM to turbine contracts ndash there is evidence (including in Australia private
source) that wind farm OampM is becoming an even more significant bargaining
component of turbine supply contracts where lower supply costs are balanced by
longer OampM contracts
Costs of wind OampM are difficult to summarise as they are dependent on many issues As just
one example in the NREL 2011 study cited earlier a wide variability in wind farm OampM
costs was found across a range of countries (Figure 1) This reference demonstrates this
variability from the average reference case in terms of Levelised Cost of Energy (LCOE)
31
Figure 1 Effect of country variables on LCOE of wind plant
Source NREL (2011)
Other issues which affect the contracted cost of OampM for wind include
regional variations in labour and transport costs
wind farm environment particularly wind regime and proximity to the ocean
(corrosion)
the maturity and availability of wind turbine technicians
the spread of facilities geographically and the wind farm asset sizes in a portfolio
the turbine type and brand particularly the support establishment within a Region
the age of the asset OampM history and existence of Type (or systematic) failures of
major components
the ability of the OampM provider under the contract to source third party spares andor
try varied maintenance practices and
the nature of the OampM contract ndash for example does it include risk reward elements or
have a link to the wind turbine supply contract or is it a ldquoproduction availabilityrdquo
contract type
While it is generally acknowledged that the LCOE of delivered energy is falling for wind
technology (Hand 2013) within the literature there is conflicting evidence around trends in
OampM costs with recent reports indicating both significant decreases (BNEF 2013) and
increases (Ebert and Ware 2013) It is generally acknowledged that increased competition in
the OampM market is delivering lower cost service provision but this may in part be offset by
an ageing fleet requiring more variable maintenance and a more sophisticated and costly
32
response Several studies have demonstrated that the costs of maintaining wind turbines
generally increase with time following a trend similar in shape to that in Figure 2 (Hand
2013) with estimates in Albers (2009) indicating a doubling in turbine OampM costs by mid
plant life The term COD in Figure 2 refers to commercial operations date
Figure 2 Typical cost increasing trends in wind farm OampM costs with commercial operations
date
Source Adapted by WorleyParsons from Houston (2013)
In Australia this trend is also evident in post 10-year aged machines (private source)
particularly in relation to variable maintenance The nature of any similar increase with more
modern turbines is unpredictable although turbine availability is improving and there is
evidence that OampM costs with each generation of turbine are lowering see Wiser et al
(2012)
The OampM costs for offshore wind farms are particularly difficult to estimate as the industry
is still at the early stages of development including the progression of much larger turbines
into deeper water and the more complex nature of the task Such progression is indicated in
Figure 3 taken from RolandBerger (2013) which indicates an expected decrease in OampM
costs These costs are of the same order of that published in other recent publications UK
Crown Estate (2012) and US DoE (2013)
33
Figure 3 Trends in offshore wind farms and estimated impact on LCOE
Source RolandBerger (2013)
433 Updated OampM Figures for Australia
It is not a simple matter to transfer international costs to Australia as despite trends there are
significant differences between regions including
size of market ndash despite growth the Australian wind market is small with respect to
other world regions For example the total wind fleet is 4 GW (CEC 2013) for
Australia versus 60 GW for the US (AWEA 2013)
labour and material rates in certain parts of Australia are high by world standards
the logistics of getting to and within Australia generally involve longer distances than
other areas of the world particularly due to the remoteness from major equipment
suppliers
volatility of the Australian dollar particularly against the US and
the size of Australian wind farms tends to be larger
These differences can be seen in Figure 4 supplied by a turbine equipment supplier (private
source) and showing the relative OampM costs (per MW) and technician numbers (per 100
MW) across various world regions in 2012 for wind turbine maintenance only and excluding
balance of plant Numbers and scales between the two indices have been removed to protect
the confidentiality of this supplier with data believed to cover the entire global portfolio
under management This shows a significant difference between regions for onshore in both
indices for example almost a 45 per cent difference in costs between Europe and America
Australia would sit within ldquoAsiaPacificrdquo and while the Figure indicates generally lower
OampM costs and higher technician numbers for this region this presumably covers a very
diverse area (including South East Asia New Zealand and Oceania) which may skew results
34
Unlike many larger global markets the wind OampM sector in Australia is dominated by
turbine equipment suppliers with original equipment manufacturer (OEM) contracts
estimated to cover more than 95 per cent of the fleet The evidence for this is mostly
anecdotal although a number of smaller independent suppliers are now known to be
undertaking full service OampM for older plant (gt10+ years) with many of the drivers for this
covered in Ebert et al (2013) There is also evidence (private source) that wind turbine
suppliers in Australia are seeking OampM contracts with much longer terms and tying these to
reductions in turbine supply prices This may indicate a lack of competitive pressure on
OampM pricing in the near to mid-term and as the size of the overall market is small it is
unknown whether independents will grow market share as has been the case in many larger
global markets see for example Deloitte amp Touche (2012)
The most recent contemporary literature comments on onshore wind farm OampM pricing in
Australia and surrounds that could be found in the public domain and not used for the AETA
2012 work are from Hassan (2011) and Deloitte (2011) These are summarised with other
new international references cited in Table 6 with assumptions on any conversions noted
below the table As no offshore wind farm projects have been progressed in Australia the
table includes values from new sources for offshore projects from the international public
domain literature - the significant difference to onshore costs is evident in the values
Figure 4 OampM Costs (per MW) and Technician Numbers (per 100MW) for total wind turbine
OampM (Opex)
Source Private - values and scales removed to protect confidentiality
From Table 6 and considering the differences in markets it appears that for onshore wind the
AETA 2012 estimates may be slightly high with an updated AETA 2013 recommendation
given in Table 7 This value has been arrived at by considering
the size of the Australian wind market and lack of competitive pressure from
independent OampM service providers
35
supply side pressures on OEMs driving them to protect their OampM businesses and
lowering costs
the likely increase in fleet installations to comply with RET legislation skewing the
fleet age to more a modern generation of turbines although it is noted that there is some
uncertainty around long term OampM cost trends particularly variable maintenance ndash an
asset age of around 5 years is assumed here
uncertainties in what is included in referenced values and differences in markets and
advice from actual asset owners and OampM providers (private sources) on current actual
costs
Table 6 Comparison of AETA 2012 wind OampM estimates with new references for 2013
Source Region
Fixed OampM
(AUS$MW)
Variable OampM
(AUS$MWh)
Total OPEX
(AUS$MW)
On
sh
ore
AETA 2012 Australia 40000 12 799451
Houston 2013 US - - 35-380002
BNEF 2013 Global - - 25000
3
Private Source (2013) (gt 10 yr old
plant) Australia - - 70000
Private Source (2013)
(lt 2 yr old out of warranty plant) Australia - - 55000
Hassan 2011 Australia - - 83-99000
4
Deloitte 2011 New Zealand - - 450005
Off
sh
ore
AETA 2012 Australia 80000 12 1262526
Crown Estate 2012 UK - - 275000
7
Hassan (2013) UK - - 2391567
RolandBerger 2013 Europe - - 198000
8
US DoE 2013 US - - 144970
9
1 Assumes a 38 capacity factor
2 USAUD = 109 extrapolated from Figure approximately to 2013
3 EUROAUD = 142 uncertain if this includes all balance of plant or VOM and only includes OEM providers
4 Assumes a 38 capacity factor
5 Assumes NZAUD = 084 a 38 capacity factor and the mid-range estimate for OampM
6 Assumes a 44 capacity factor
7 Assumes GBPAUD = 167 and taking midpoint of estimates stated
8 Assumes GBPAUD = 167 and taking value for 3MW turbines
9 Assumes USAUD = 109
36
The figures shown for onshore projects in Table 7 represent a 15 per cent decrease in the
expected OampM costs of wind farms in Australia compared to AETA 2012 This change
reflects the volatility in this market noted in previous sections and in referenced material
internationally plus the appearance of significant downward pressure on wind OampM prices
primarily through increased global competition The values allow for the rising price of
turbine OampM as the turbine ages during its life
For offshore wind it appears that the OampM costs in AETA 2012 are too low and although it
is tempting to align costs with the most recent US figures due to their lower costs and similar
coastal conditions to Australia the European offshore fleet is significantly larger and more
mature Average figures across the 2013 referenced material including Europe is
recommended This is also shown in Table 7 and represents a significant increase in estimate
costs (around 33per cent) which reflects this evolving sector
There is very little contemporary information available on the breakdown of fixed and
variable maintenance on wind plant making judgment around this for the AETA requirements
is difficult However there is some published but copyrighted material eg GlobalData 2012
which combined with others (private sources) indicates that for onshore and offshore wind
plant respectively a 5050 and 4060 FOM VOM split is appropriate This has been used to
adjust the total OPEX figure in Table 7 to the AETA scheduled and variable indices
requirements using a 38 per cent and a 44 per cent capacity factor for onshore and offshore
projects respectively
Table 7 Recommended AETA (2013) values
AETA (2013) update Fixed OampM
(AUS$MW)
Variable OampM
(AUS$MWh)
Total OPEX
(AUS$MW)
Onshore $32500 $10 $65790
Offshore $77600 $30 $194000
44 Solar Photovoltaics (PV)
441 Introduction
This Section of the report focuses on the OampM costs for ground-mount photovoltaic (PV)
technologies broken down by the following mounting system configurations
Fixed Tilt (FT)
Single Axis Tracking (SAT)
Dual Axis Tracking (DAT)
Although different PV panel technology types (eg poly-crystalline mono-crystalline or thin
film CdTe) affect the capacity factor and land use the OampM costs are comparable The
estimates for this Report are based on polycrystalline PV technology which provides an
average cost on a per Watt basis with mono-crystalline OampM costs being slightly lower and
thin film OampM costs being slightly higher
With the aim to provide comparable results between technologies WorleyParsons has
analysed and updated the PV OampM costs in terms of both fixed operation and maintenance
37
costs (FOM) and total operating expenditures (OPEX) based on reference plants of similar
characteristics
Assumptions interpretations and considerations based on their in-house data and global
market trends are described in the following Sections
442 Review of the Evidence
Since the AETA 2012 report release few new public domain reports related to OampM costs
for PV systems have been published To confirm this the following organisations have been
consulted by WorleyParsons to provide the 2013 OampM costs update for the selected PV
configurations
International Renewable Energy Agency (IRENA) (wwwirenaorg)
International Energy Agency (IEA) (wwwieaorg)
The World Bank (WB) (wwwworldbankorg)
The US National Renewable Energy Laboratory (NREL) (wwwnrelgov)
Solar Energy Industries Association (SEIA) (wwwseiaorgau)
European Photovoltaic Industry Association (EPIA) (wwwepiaorg) and
Solar Electric Power Association (SEPA) (wwwsolarelectricpowerorg)
Upon review of the available information when compared to AETA 2012 the listed
organisations do not have any new public information related to large-scale PV OampM costs
If OampM costs are mentioned they are normally referenced as a per cent of the total Capital
Expenditure (CAPEX) for the plant (around 1 per cent) and provide little useful information
about OampM Cost changes
Due to insufficient detailed and recent information in the public domain WorleyParsons
obtained the following market reports from Photon a private organisation focused on market
news political discussions and technology analysis for the PV industry
Photon 2013 ldquoThe True Cost of Solar Power - Temple of Doomrdquo and
Photon 2013 ldquoSolar Annual 2013 - Build your Empirerdquo
These private reports had minimal focus on OampM costs To provide further input in this
area private OampM service providers were contacted for pricing estimates and market trends
443 AETA 2012 OampM PV costs report comparison
Typical power plant OampM costs are expressed as a combination of a variable component
(proportional to generation) and a fixed component (occurs irrespective of generated output)
Since the generation of a PV plant is dependent on solar radiation (not requiring fossil fuel or
water which make up the major components of variable costs for conventional generation) it
is typical to express the OampM costs only as Fixed OampM (FOM) costs proportional to the
plant size due to the simplicity of PV systems The AETA 2012 report follows this practice
and estimates the PV OampM costs as FOM only relative to plant size (kW) expressed on a per
year basis
38
In order to facilitate comparisons of these costs with other electricity technologies the FOM
costs in the AETA 2012 report are also presented as OPEX costs per MW of generating
capacity per year
ASSUMPTIONS AND CONSIDERATIONS
The following costs are included in the FOM estimates as an annual cost per kW capacity
labor and administrative expenses
panel washing (twice per year at $300 kl for water)
weed abatement (seasonal herbicide applications)
inverter replacement reserve (replaced at operational year 10) and
materials and maintenance spare parts civil works preventative and corrective
equipment maintenance
Although the cost of water is variable depending on location and usage it is such a small
portion of the total OampM costs that it is adequate to assume it as a fixed cost using the
assumptions listed above
AETA 2012 PV OampM COSTS COMPARISON REPORT
The technical characteristics of the reference PV plants used in the AETA 2012 report have
been extracted from the AETA 2012 Model (Version 1_0 Rev B BREE 2012) and are
summarised in Table 8
Based on this information the following parameters for the PV technologies are estimated
Total net energy production in terms of MWh sent out per year
Total plant acreage
FOM in terms of USD per year and
Total OPEX costs in terms of USD per year and USD per total net energy production
per year
39
Table 8 AETA 2012 reference plants technical characteristics and OPEX costs
Plant Characteristics Units Fixed Tilt (FT) Single Axis Tracking (SAT)
Dual Axis Tracking (DAT)
Plant Characteristics
Plant Net Capacity MW 100 100 100
Capacity Factor per cent 21 24 26
FOM $kWyear 25 38 47
Net Energy MWhyear 183960 210240 227760
Plant Acreage acres 500 800 900
Total FOM $year 2500000 3800000 4700000
Total OPEX $year 2500000 3800000 4700000
Total OPEX $kWh 00136 00181 00206
Total OPEX costs are between 00136 and 00206 USDkWh as shown in Table 8 above
These values are conservative cost estimates but reasonable for a large-scale PV plant with
comprehensive OampM service As is expected the FOM or OPEX costs increase as the plant
footprint increases and the complexity of the mounting system increases However the
increases to single and double axis tracking technologies are larger than would be expected
The increased complexity of the trackers does add costs to OampM in terms of labor parts and
even physical plant size but these additions are minor in comparison to the larger OampM
budget items such as the inverter replacement reserve and general electrical maintenance
which are irrespective of mounting system
These values although conservative still show the cost reductions from the industry learning
curve and expanded competition over the past few years when compared to past estimates of
OampM costs This can be seen in the following Table 9 of Fixed Tilt (FT) costs which
provides some estimates found in previous publications by IEA (2008) and EPRI (2010) The
tracking estimates are not shown since minimal data is available This corresponds to the
historical market trend of the industry being more willing to install fixed tilt systems rather
than tracking systems due to lower costs and technology risk
Table 9 Comparison of historical estimated PV and OampM costs in the public domain
PV Configuration OampM Costs Units IEA 200810
EPRI 2010 AETA 2012
Fixed Tilt (FT) FOM $kWyear 40 32 to 37 25
values in Italics are derived from reported data
10
Report assumed 1 of capital costs and 23 capacity factor
40
45 AETA 2013 PV OampM Costs Update
Using the same plant characteristic assumptions as the 2012 AETA Model the 2013 OampM
costs were estimated by WorleyParsons based on the references described in review of the
evidence in Section 442 The comparison of the AETA 2013 and 2012 OampM costs are
presented in Table 10 below
Table 10 2013 PV OampM costs compared to 2012 PV OampM costs PV Configuration OampM Costs Units AETA 2012 WorleyParsons
2013 Update
Fixed Tilt (FT) FOM $kWyear 25 25
OPEX $kWh 00136 00134
Single Axis Tracking (SAT) FOM $kWyear 38 30
OPEX $kWh 00181 00141
Dual Axis Tracking (DAT) FOM $kWyear 47 39
OPEX $kWh 00206 00173
Although the OampM costs for FT systems are approximately the same SAT and DAT OampM
costs reduced by around 20-30 per cent in this 2013 update compared to the AETA 2012
report The consistency of the FT costs is reasonable and expected to continue for the next
few years as discussed further in Section 451
Regarding the SAT and DAT costs although there have been improvements in the design of
trackers for PV applications this OampM cost reduction is due to a better understanding of the
costs associated with electrical and tracking system maintenance The cost differences
between tracking systems was corroborated by quotes from private OampM service companies
who indicated that there was only a slight increase in costs from FT to SAT but a larger
increase in costs from SAT to DAT
As compared to the references mentioned in Section 442 the updated cost estimates are
conservative Table 11 compares the estimated 2013 OampM costs with those references
However since these publications focused primarily on the CAPEX with very general OampM
cost assumptions the OampM costs presented therein are not considered representative
baselines for large-scale solar projects Furthermore they attest to the industryrsquos tendency to
focus strictly on installation costs and not lifecycle costs which is discussed further in Section
451
41
Table 11 2013 updated OampM costs compared to new referenced OampM costs (7-2) PV Configuration
OampM Costs
Units WorleyParsons 2013 Update
11
NREL 2013
12
IRENA 2013a
13
Photon 2013
14
Private OampM Service Providers
201315
Fixed Tilt (FT) FOM $kWyear 25 235 17 to 21 18 17 to 23
OPEX $kWh 00134 00216 to
00383
00121 to 00266
00098 00094 to 00127
Single Axis Tracking (SAT)
FOM $kWyear 30 Not provided
Not provided
Not provided
25 to 27
OPEX $kWh 00141 Not provided
Not provided
Not provided
00136 to 00147
Dual Axis Tracking (DAT)
FOM $kWyear 39 Not provided
Not provided
Not provided
32 to 34
OPEX $kWh 00173 Not provided
Not provided
Not provided
00174 to 00185
values in Italics are derived from reported data
451 OampM Learning Rates
In the rapid PV industry growth of the last three years WorleyParsons and anecdotal
experience is that PV was considered generally to require little to no maintenance causing a
general disregard for OampM planning This appears to have resulted in complications as
owners struggle to resolve reliability performance and budget issues as the projects mature
(multiple private sources) Although the maintenance costs are smaller compared to standard
power plants OampM awareness has been increasing in the industry and therefore the OampM
cost estimates have subsequently increased
This is supported through the recent focus of OampM at PV conferences (such as Sandia
National Laboratory and Solar Energy International events) on increasing the investment in
OampM practices in addition to improving the current practices products and services so that
PV plants can be better maintained to achieve higher reliability throughout the plant life
cycle Currently the majority of OampM expenses for PV systems consist of maintaining and
replacing the inverters followed by the Balance of System maintenance In general once the
appropriate level of investment in OampM for PV is reached then OampM costs will begin to
decrease as the following issues develop to maturity
technology improvement
inverter design for reliability and longevity
data monitoring for preventative and corrective maintenance support
system efficiency to increase system output for the same OampM expense
decreased capital costs for major equipment
decreased spare parts costs
11
See assumptions in Section 433 and 443 12
Report assumed 250kW rooftop at 7 to 10 capacity factor 13
Report assumed 1 of CAPEX and 9 to16 capacity factor 14
Values derived from the global weighted average calculations assuming 21 capacity factor and 20 year lifecycle Report assumed a
simple percentage of average selling price 15
Quote excluded weed abatement panel washing and inverter replacement reserve which were supplemented from the WP estimate
Calculations assumed 21 capacity factor
42
industry maturity and stability
reliable OEM support from product consistency and commercial stability
improved codes and standards for PV equipment system design installation
commissioning and OampM and
experience
trained and experienced personnel in the installation and maintenance of PV plants
In line with this trend owners system designers installers and OEMs are now including
OampM considerations in their finances designs services and products Even though there
have been and will continue to be cost reductions in OampM due to the industry maturation
stabilization and competition those cost reductions are balanced with the necessary
increases in OampM investment to meet the maintenance needs of existing and planned PV
plants resulting in a level OampM cost estimate for the next five years
Photon (2013) follows this assumption of consistent OampM costs for the next ten years as well
as WorleyParsons discussions with OampM service providers Therefore the assumption that
PV OampM costs will remain somewhat constant over the next five years before reducing again
appears to follow the projections in the industry
452 Conclusions - PV
The key findings from the AETA 2012 review and update of the PV OampM costs are as
follows
The 2013 WorleyParsons PV OampM costs update resulted in values of
$25kWyear for FT systems
$30kWyear for SAT
$39kWyear for SAT in 2012 USD
Fixed tilt configurations have not seen significant changes in OampM costs compared to
the 2012 AETA estimates while SAT and DAT configurations cost estimates have
reduced approximately 20-30 per cent based on a better understanding of the associated
OampM costs
Values obtained in the 2013 WorleyParsons update are more conservative but are
aligned with values provided by recognised international institutions even though few
detailed OampM breakdowns are available and
OampM costs for PV are expected to remain constant over the next five years before
reducing as the industry matures in both experience and long-term planning
capabilities
43
46 Concentrating Solar Power (CSP)
461 Introduction
This Section of the report focuses on the OampM costs for the following Concentrating Solar
Power (CSP) technologies
Parabolic Trough (PT)
Solar Tower (ST) and
Linear Fresnel (LF)
CSP OampM costs were analysed in terms of
Fixed Operating and Maintenance Costs (FOM)
Variable Operating and Maintenance Costs (VOM) and
Total Operating Expenditures (OPEX)
In order to arrive at comparable results between technologies BREE and WorleyParsons
estimated the OampM costs based on
Reference Plants with similar Solar Plant characteristics localisation net capacity
capacity factor hours of Thermal Energy Storage (TES) and type of cooling system(s)
and
Cost estimate amounts that were updated to 2012 USD
When information was not available necessary estimates were made using WorleyParsonsrsquo
in-house data and based on global market trends observed in various publications
462 Review of the evidence
The following international organisations were consulted to provide the AETA 2013 OampM
costs update for the selected CSP technologies
International Renewable Energy Agency (IRENA) (wwwirenaorg)
International Energy Agency (IEA) (wwwieaorg)
European Solar Thermal Electricity Association (ESTELA) (wwwestelarde)
The World Bank (WB) (wwwworldbankorg)
National Renewable Energy Laboratory (NREL) (wwwnrelgov)
Protermosolar (wwwprotermosolares)
Institute for Energy Diversification and Saving (IDEA) (wwwideaes)
Renovetec (wwwrenoveteces) and
CSP Today (wwwcsptodaycom)
The approach in reviewing OampM costs for the 2013 update for CSP technology was only to
use new sources of information published since the AETA 2012 report was written This was
44
maintained for all but the learning rates estimation which is due to the lack of any new
updated information published since 2012 in relation to this
Upon review of the available public domain information it was found that IEA ESTELA
WB Protermosolar Renovetec and IDEA do not have any new relevant public information
related to CSP OampM costs However IRENA 2013b IRENA 2013c and NREL 2012 are
new references from IRENA and NREL that are considered relevant and which were used in
this report
The information contained in these references did not provide updated costs for all of the
CSP technologies being considered in this Report and the values offered were not provided
in terms of FOM and VOM costs as preferred
Due to the lack of new relevant information in the public domain the AETA 2013 Model
Update process obtained reports from CSP Today a private international organisation
focused on news events reports updates and information for the CSP industry in markets
such as India South Africa Spain USA Chile and MENA regions The Update acquired the
last edition of PT and ST reports CSP Today 2012a and CSP Today 2012b for which OPEX
costs were analysed
463 AETA 2012 OampM CSP costs report comparison
Operating and Maintenance expenses were provided in terms of fixed and variable costs in
the AETA 2012 report and this Model Update has modified these for 2013 for PT ST and LF
technologies based on the references cited above and further consideration of learning rates
for the CSP industry
Most CSP projects with commercial operational experience are parabolic trough technology
as it is the most mature technology and currently more is reported and known about actual
costs than other CSP technologies Nevada Solar One as an example is a 64MWe parabolic
trough plant based in California which was commissioned in 2007 and it is the first plant
built after the SEGS development during the 1980-90s also in California
Andasol 1 the 50 MWe parabolic trough plant based in Spain is also the first CSP plant
worldwide to implement a commercial thermal energy storage system with a capacity of 75
hours of full load storage It commenced operation at the end of 2008 and other similar and
larger trough projects are now operating or being constructed
As the most mature CSP technology trough plant should be further down the operational and
design operability maturity path and hence have a lower opportunity for OampM cost
reductions through learning By contrast Solar Tower and Linear Fresnel systems are only
beginning to be deployed at larger scale and hence there is expected to be more potential to
reduce their capital and operating costs and improve performance
Learning rates have been argued by stakeholders as being very significant for CSP plant with
comments of the AETA 2012 report centring on this issue Disappointingly there is no new
published evidence or actual plant report data that could be found by the AETA stakeholders
and WorleyParsons to add to that used for the 2012 report There is however new evidence
on the reduction in LCOE for CSP technologies and WorleyParsons linked OPEX
contribution to these LCOE predictions so that a sense of future reductions could be made
This is outlined further in the following Sections
45
4631 ASSUMPTIONS AND CONSIDERATIONS
FOM and VOM Breakdown
The following costs are included in proceeding FOM cost estimates for CSP technologies as
an annual cost per MW capacity
Insurance
Labour costs and
Fixed service maintenance contracts
Similarly the following costs are included in the VOM cost estimates as a cost rate per MWh
of sent out energy
Material and maintenance costs spare parts equipment maintenance and unscheduled
inspections and
Utilities costs water auxiliary fuel and auxiliary power when applicable
Some items such as spare parts for scheduled maintenance could be considered FOM costs
However to simplify the comparison and to homogenise all of the analyses across
technologies all concepts related to plant material and maintenance were included in the
VOM costs
4632 AETA 2012 OampM CSP COSTS COMPARISON REPORT
The technical characteristics of the reference CSP Plants used in the AETA 2012 report have
been extracted from the AETA Model Version 1_0 (BREE 2012) and are summarised in
Table 12
Table 12 AETA 2012 Reference Plant Technical Characteristics
Plant
Characteristics
Units Parabolic
Trough
without
Storage
Parabolic
Trough
with
Storage
Solar
Tower
without
Storage
Solar
Tower
with
Storage
Linear
Fresnel
without
Storage
Linear
Fresnel
with
Storage
Plant Net Capacity MW 138 135 122 18 230 225
Location NA Unknown Unknown Unknown Unknown Unknown Unknown
Isolation kWhm2year Unknown Unknown Unknown Unknown Unknown Unknown
Hours of TES h - 7 - 6 - 6
Capacity Factor per cent 23 42 31 42 23 42
Type of Cooling NA Unknown Unknown Unknown Unknown Unknown Unknown
FOM $MWyear 60000 65000 70000 60000 65000 65000
VOM $MWh sent out 15 20 15 15 15 20
Based on the information above this Model Update estimated the following parameters for
the CSP technologies evaluated in this study
46
Total net energy production in terms of MWh delivered per year
FOM and VOM in terms of USD per year and
Total OPEX costs in terms of USD per year and USD per total net energy production
per year
The results are listed in Table 13 below Table 13 AETA 2012 OampM Opex costs on a per kWh basis
Plant
Characteristics
Units Parabolic
Trough
without
Storage
Parabolic
Trough
with
Storage
Solar
Tower
without
Storage
Solar
Tower
with
Storage
Linear
Fresnel
without
Storage
Linear
Fresnel
with
Storage
Plant Net Capacity MW 138 135 122 18 230 225
Net Energy sent out MWhyear 2780424 496692 3313032 662256 463404 827820
FOM $year 8280000 8775000 8540000 1080000 14950000 14625000
VOM $year 4170636 9933840 4969548 993384 6951060 16556400
OPEX $year 12450636 18708840 13509548 2073384 21901060 31181400
OPEX $kWh 00448 00377 00408 00313 00473 00377
FOM per cent 6650 4690 6321 5209 6826 4690
VOM per cent 3350 5310 3679 4791 3174 5310
The percentages of FOM and VOM costs as part of the total OPEX costs are presented in
Figure 5
Figure 5 AETA 2012 FOM and VOM Percentages of Total OPEX Costs
47
In Figure 5 FOM costs are in general terms significantly higher than VOM costs because
they include the higher cost items such as insurance labour costs and fixed service contracts
However as shown in the Figure VOM costs are higher or approximately equal to FOM
costs for technologies with energy storage given the criteria selected for the breakdown
between FOM costs and VOM costs FOM costs will remain relatively consistent from year-
to-year while VOM costs should be broken down even further since the costs of water
natural gas (if required) and electricity vary between locations and from one year to another
Total OPEX costs are expressed in terms of USD per total net energy production per year and
are between 00313 and 00473 USDkWh as listed in Table 13 These values are aligned
with the values provided by international institutions cited although they appear to be
somewhat inflated in comparison with those values that are closer to 0025 and 0035
USDkWh as published by others (eg IRENA)
4633 AETA 2013 OampM COSTS UPDATE
Similar Plant characteristics to AETA 2012 were considered for the appropriate comparison
of OampM costs for this update Plant characteristics include location net capacity capacity
factor hours of TES and type of cooling For this Report the characteristics of the reference
plants used are described in Table 14
Table 14 PT and ST Reference Plant Characteristics
Plant
characteristics
Units Parabolic
Trough without
Storage
Parabolic
Trough with
Storage
Solar Tower
without
Storage
Solar Tower
with Storage
Plant Net Capacity MW 100 100 100 100
Location NA MENA region MENA region MENA region MENA region
Isolation kWhm2year 2400 2400 2400 2400
Hours of TES h 0 6 0 6
Capacity Factor per cent 26 46 275 476
Type of Cooling NA Dry Dry Dry Dry
Source NA WorleyParsons CSP Today 2012a WorleyParsons CSP Today 2012b
The 2013 OampM costs were estimated using as a basis the information provided in the CSP
2012 reports (CSP 2012a and 2012 b) The following considerations were taken into account
the CSP Today reports only consider PT and ST plants with thermal storage
WorleyParsons made the following estimates based on experience with solar and
conventional power plants based on PT and ST technologies without TES
estimated the capacity factor based on plant capacity location and type of cooling
adjusted the insurance material and maintenance and labour costs based on the
solar field reduction factor when applicable
adjusted the steam turbine maintenance based on the potential hours of operation
48
adjusted the plant electricity and water consumption based on the total net
production
assumed similar auxiliary fuel consumption for the plant with and without TES This
assumption is due to the reference plants being based in the same location thus
requiring similar auxiliary fuel consumption for start-up Minimal differences in
auxiliary fuel consumption for freeze protection due to increased time offline for a
plant without TES system compared to a plant with TES are expected but not
considered in this Report as the impact would be minor
the capacity factor provided by CSP Today for PT with thermal storage is considered
high Based on the plant location and capacity WorleyParsons would anticipate the
capacity factor to be closer to 42 per cent instead of 46 per cent as indicated in Table
14 above This difference in capacity factor directly impacts the estimated VOM cost
which is correlated with plant production For comparison purposes the value provided
by CSP Today has maintained and
with respect to Linear Fresnel technology updated information has not been published
since the AETA 2012 report release by the references listed in Section 462 which
WorleyParsons consulted For the purpose of updating the estimates to 2013 it was
assumed that the evolution of the OampM costs would be similar to that of parabolic
trough plants and the same escalation factors were applied
The resulting 2013 and 2012 OampM costs are listed in Table 15 below for comparison
Table 15 2013 CSP OampM Costs Compared to 2012 OampM Costs
CSP Technology OampM Costs AETA 2012 WorleyParsons 2013 update
Parabolic Trough
without Storage
FOM $MWyear 60000 59176
VOM $MWh sent out 1500 1519
OPEX $kWh 00448 00412
Parabolic Trough with
Storage
FOM $MWyear 65000 72381
VOM $MWh sent out 2000 1139
OPEX $kWh 00377 00293
Solar Tower without
Storage
FOM $MWyear 70000 58285
VOM $MWh sent out 1500 707
OPEX $kWh 00408 00313
Solar Tower with
Storage
FOM $MWyear 60000 71372
VOM $MWh sent out 1500 565
OPEX $kWh 00313 00228
Linear Fresnel without
Storage
FOM $MWyear 65000 64107
VOM $MWh sent out 1500 1519
OPEX $kWh 00473 00434
49
CSP Technology OampM Costs AETA 2012 WorleyParsons 2013 update
Linear Fresnel with
Storage
FOM $MWyear 65000 72381
VOM $MWh sent out 2000 1139
OPEX $kWh 00377 00293
The total OPEX costs per year from the AETA 2012 report and the WorleyParsonsrsquo estimates
that were updated for 2013 are compared in Figure 6 below
Figure 6 Comparison of OPEX Costs per Total Annual Plant Production per Year AETA 2012
Report and 2013 Update
Reductions of approximately 20 - 27 per cent in OampM costs would be realised by CSP with
TES according to the updated 2013 WorleyParsons estimates compared to the same costs
reported in the AETA 2012 report However reductions for PT and LF without TES were
found to be lower at approximately 8 per cent
The IRENA reports (IRENA 2013b IRENA 2013c) provide values for OPEX between 0025
and 0035 USDkWh for PT and ST technologies with and without TES Values updated to
2013 by WorleyParsons are between 0023 and 00412 USDkWh for PT and ST
technologies which align with the IRENA values However IRENA does not differentiate
between the utilisation of TES Solar technologies without TES have fewer hours of
production and although OPEX costs are lower in terms of USDMW compared with solar
technologies with TES OPEX costs in terms of costs per total annual plant production per
year will typically be higher for technologies that do not use TES
4634 OampM CSP LEARNING RATES
Cost reductions on CSP technologies are expected to come from the following main actions
economies of scale in the plant size and manufacturing industry
learning impacts on design construction and operation phases
50
advances in RampD of the following factors
Components Solar receivers mirrors HTF storage media supporting structures
trackers and auxiliary systems
Systems Direct steam generation storage systems or hybrid cooling systems
Configurations Hybridisation or duel electricity water plants
a more competitive supply chain
improvements in the performance of the solar field solar-to-electric efficiency and
thermal energy storage systems
increases in the life of plants and
reduced financial costs
Based on the parameters listed above the LCOE from Solar Thermal technologies is likely to
be continuously decreasing and this is born out in the literature that has been reviewed Based
on the IRENA 2013b report the evolution of the LCOE from trough and power tower CSP
technologies shows how the LCOE is decreasing as technology development increases in
Table 16 below Estimates for LCOE for the hypothetical trough and tower CSP plants in
2014 are also included
51
Table 16 Estimated LCOE form Existing and Hypothetical Trough and Solar Tower CSP Technologies
CSP
Technology
Year Capacity
(MW)
Plant Name Location DNI
(kWhm2year)
LCOE 2012
$kWh Installed
Trough
1981 05 PSA Spain 2000 064
1983 138 SEGS I California 2700 039
1989 30 SEGS II ndash VIII California 2700 026
1992 80 SEGS VIII amp IX California 2700 020
2008 - 2009 50 Andasol 1 2 Spain 2000 035
2010 50 Solnova 1 amp 3 Spain 2000 034
2010 - 2011 50 Extresol 1 amp 2 Spain 2000 035
2014 250 Unspecified (wet
cooling no storage)
Not provided Not provided 020
Tower
1987 10 Solar One California 2700 058
2007 11 PS10 Spain 2000 034
2009 20 PS20 Spain 2000 036
2011 199 Gemasolar (wet
cooling 15hr
storage)
Spain 2000 033
2014 120 Unspecified
(dry cooling
storage)
Not Provided Not provided 015
International Institutions such as IRENA ESTELA or the World Bank agree that the LCOE
and capital cost reductions of 28 per cent to 60 per cent are envisioned by 2020 ndash 2025 for
such plant Estimates of possible LCOE reductions for CSP technology from 2012 to 2025
are provided in Figure 7 taken from Kearny (2010)
52
Figure 7 Expected LCOE Reductions for CSP Technology from 2012 to 2025
Source (Kearny 2010)
The OampM maintenance costs of modern CSP Plants are lower than those for Californian
SEGS Plants built in the 1980s and 1990s which has a total combined capacity of 354 MW
and estimated OampM costs of USD 004kWh (IRENA 2013b) However CSP experienced no
growth from early 1990s until the mid-2000s as can be seen in Table 16 above
As stated at the beginning of Section 462 Andasol 1 was the first 50 MWe parabolic trough
plant built after SEGS which included a thermal energy storage system It commenced
operation at the end of 2008 Podewils (2008) estimated Andasol 1 OampM costs of EUR
0072kWh or USD 0095kWh (considering 2012 medium rate exchange EURUSD of
07553) This value is high compared to OPEX estimations for PT with TES provided by
both this 2013 update and the AETA 2012 report (00293 and 00377 USDkWh
respectively) Therefore according to the information detailed above considerable learning
improvements to OampM costs have been already achieved from the commencement of
operation of Andasol 1 to the time of this Report
`WorleyParsonsrsquo estimations on the LCOE of parabolic trough plants is in the range of
USD 020kWh to USD 035kWh and that of solar towers between USD 017kWh and
USD 029kWh However in areas with excellent solar resources the range could be as low
as USD 014kWh to USD 018kWh
The following considerations have been taken into account for OampM cost learning rates
forecast
WorleyParsons LCOE estimations as set out above
Potential average envisaged LCOE reductions of 475 per cent by 2025 based on Figure
7 above
OPEX contribution on LCOE of 20 per cent and
53
assuming that all components involved in the LCOE (CAPEX OPEX and financial
expenses) reduce at the same rate so percentage contributions remain constant
According to these considerations WorleyParsons estimates that OPEX values by 2025 could
reach from 0021 to 0037 USDkWh for PT technology and from 0018 to 0031 USDkWh
for ST technology
Technological improvements have reduced the requirement of replacing mirrors and
receivers Automation has reduced the cost of other OampM procedures by as much 30 per
cent As a result of OampM procedure improvements (both cost and plant performance) the
total OampM costs of CSP plants in the long-term are likely to be below USD 0025kWh
(IRENA 2013b)
Parabolic trough system in the United States would have OampM costs of around USD 002 to
USD 003kWh meanwhile the OampM costs of parabolic trough and solar tower power plants
currently under construction in South Africa have estimated OampM costs of between USD
0029 and USD 0036kWh (also IRENA 2013b)
WorleyParsons estimations are in alignment with IRENA estimations in terms of current and
envisaged CSP OPEX costs
4635 CONCLUSIONS ndash CSP
The following main conclusions were made based on this study in relation to CSP
technologies
the 2013 WorleyParsons CSP OampM costs update resulted in values between 0023 and
0043 USDkWh based on 2012 USD
reductions in CSP OampM costs between 8 per cent and 27 per cent were obtained in
comparison to values provide in AETA 2012 report
the total OampM costs of CSP Plants in the long-term are likely to be below USD
0025kWh
the updated values for 2013 by WorleyParsons are in alignment with the values
provided by recognised international institutions and
at the time of this report the only CSP technology with substantial operation capacity
was PT Only three utility-scale ST plants were in operation at the time of this report
(PS-10 PS-20 and Gemasolar) of which only one (Gemasolar) uses TES Though
several process steam and small-scale LFR Plants are currently in operation only one
utility-scale LFR (Puerto Erradio 2) was in operation at the time of this report
47 AETA 2013 OampM Learning Rate recommendation
The learning rate used in AETA 2012 for OampM is applied to all technologies assessed and
includes fossil fuel technologies and emerging technologies The learning rate is set at an
improvement of 02 per cent per annum
In addition to the improvement rate OampM is escalated at a rate of 150 per cent of CPI per
year based on experience with increases in parts and labour costs
The CPI rate set in the model is 25 per cent per annum
54
OampM cost information in the public domain in both quantum and quality is poor for
contemporary data Information supporting OampM learning rates is equally poor There are
indications that emerging technologies do have the potential for increased OampM learning
rates relative to mature technologies
For the renewable energy technologies studied in this report onshore wind is considered
mature and it is recommended that the AETA 2012 report value of 02 per cent is maintained
For all other renewable energy technologies studied in this report a more aggressive learning
rate of 25 per cent is recommended This will effectively cancel out the CPI escalation
adjustment and provide a ldquoflat linerdquo OampM rate for future years This will provide a value in
line with the learning rate conclusions for PV
The learning rate for CSP is considered to have greater potential for reduction but due to the
high level of analysis in this report (and therefore uncertainty) it is proposed that a maximum
of two learning rates is appropriate for the AETA model
Table 17 AETA Learning Rate Comparison
AETA 2012 Learning Rate AETA 2013 update Learning Rate
Onshore Wind 02 per cent 02 per cent
Offshore Wind
PV ndash all technologies
CSP ndash all technologies
02 per cent 25 per cent
55
5 CHANGES TO THE LCOE
Changes to the model parameters described in the earlier sections have resulted in changes to
the LCOE estimates for a number of technologies The LCOE estimate values for all
technologies and associated range of uncertainty are shown in the Figures 8 to 13 below
Note that the values listed are for a base value carbon price modifier of zero per cent which
places no value on carbon emissions
For selected technologies where there are significant cost differences Figure 14 provides a
comparison of mid-range LCOE values for the AETA 2013 and AETA 2012 Models Key
features of the Figures 8 to 14 are as follows
both in AETA 2012 and 2013 Model update LCOE costs are provided for the years
2012 2020 2025 2030 2040 and 2050
cost ranges are provided for each technology that accounts for differences in fuel prices
and state-based variations
LCOE costs vary substantially across the technologies from $89MWh (combined cycle
gas turbine) to $351MWh (solar thermal linear fresnel) in 2012 and $73MWh (PV
non-tracking) to $247MWh (IGCC black coal CCS) in 2050
the inter-technology LCOE comparisons figures (Figures 8 to 13) reveal changes in
relative costs of technologies over time Key results include renewable technologies
have higher LCOEs than the lowest cost non-renewable technologies and the relative
LCOE rankings significantly change post 2030 The LCOE of solar PV become lower
than the non-renewables from mid 2030 onwards and
large changes in LCOE results between AETA 2013 Update and AETA 2012 are
depicted in Figures14 below Figure 14 compares LCOEs at 2050 between the AETA
2013 Update and AETA 2012 for a selected number of technologies that have changed
significantly for NSW (AETA developed LCOEs by each Australian state) Differences
in technology LCOEs are explained by a multiplicity of factors including the technical
developments OampM costs and learning rate changes
56
Figure 8 Updated LCOEs for AETA 2013 Model technologies values for 2012 (NSW) with carbon price set to zero
0
50
100
150
200
250
300
350
400
450
500
LCO
E ($
MW
h)
LCOE FOR 2012 TECHNOLOGIES (NSW) Note Default region is NSW except bown coal
technologies (VIC) and SWIS scale (as specified)
LCOE includes where relevant allowance for- Carbon Price- CO2 transport and sequestration cost- Plant capital cost (EPC basis) within battery limits- Owners costs excluding interest during construction- Fixed and variable operating costs- Fuel costs- Economic escalation factors
57
Figure 9 Updated LCOEs for AETA 2013 Model technologies values for 2020 (NSW) with carbon price set to zero
0
50
100
150
200
250
300
350
400
450
LCO
E ($
MW
h)
LCOE FOR 2020 TECHNOLOGIES (NSW) Note Default region is NSW except bown coal
technologies (VIC) and SWIS scale (as specified)
LCOE includes where relevant allowance for- Carbon Price- CO2 transport and sequestration cost- Plant capital cost (EPC basis) within battery limits- Owners costs excluding interest during construction- Fixed and variable operating costs- Fuel costs- Economic escalation factors
58
Figure 10 Updated LCOEs for AETA 2013 Model technologies values for 2025 (NSW) with carbon price set to zero
0
50
100
150
200
250
300
350
400
LCO
E ($
MW
h)
LCOE FOR 2025 TECHNOLOGIES (NSW) Note Default region is NSW except bown coal
technologies (VIC) and SWIS scale (as specified)
LCOE includes where relevant allowance for- Carbon Price- CO2 transport and sequestration cost- Plant capital cost (EPC basis) within battery limits- Owners costs excluding interest during construction- Fixed and variable operating costs- Fuel costs- Economic escalation factors
59
Figure 11 Updated LCOEs for AETA 2013 Model technologies values for 2030 (NSW) with carbon price set to zero
0
50
100
150
200
250
300
350
400
LCO
E ($
MW
h)
LCOE FOR 2030 TECHNOLOGIES (NSW) Note Default region is NSW except bown coal
technologies (VIC) and SWIS scale (as specified)
LCOE includes where relevant allowance for- Carbon Price- CO2 transport and sequestration cost- Plant capital cost (EPC basis) within battery limits- Owners costs excluding interest during construction- Fixed and variable operating costs- Fuel costs- Economic escalation factors
60
Figure 12 Updated LCOEs for AETA 2013 Model technologies values for 2040 (NSW) with carbon price set to zero
0
50
100
150
200
250
300
350
400
LCO
E ($
MW
h)
LCOE FOR 2040 TECHNOLOGIES (NSW) Note Default region is NSW except bown coal
technologies (VIC) and SWIS scale (as specified)
LCOE includes where relevant allowance for- Carbon Price- CO2 transport and sequestration cost- Plant capital cost (EPC basis) within battery limits- Owners costs excluding interest during construction- Fixed and variable operating costs- Fuel costs- Economic escalation factors
61
Figure 13 Updated LCOEs for AETA 2013 Model technologies values for 2050 (NSW) with carbon price set to zero
0
50
100
150
200
250
300
350
400
LCO
E ($
MW
h)
LCOE FOR 2050 TECHNOLOGIES (NSW)
LCOE includes where relevant allowance for- Carbon Price- CO2 transport and sequestration cost- Plant capital cost (EPC basis) within battery limits- Owners costs excluding interest during construction- Fixed and variable operating costs- Fuel costs- Economic escalation factors
Note Default region is NSW except bown coal
technologies (VIC) and SWIS scale (as specified)
62
Figure 14 Comparison of AETA 2013 Model and AETA 2012 Model LCOE estimates selected technologies 2050
0
50
100
150
200
250
AETA 2012
AETA 2013
63
51 Conclusions
The Australian Energy Technology Assessment (AETA 2012) provided the best available and most up-to-
date cost estimates for 40 electricity generation technologies under Australian conditions To ensure that
the cost estimates for the various technologies are consistent all common input costs (eg labour
materials components carbon price) were itemised To ensure that the AETA costings remain up to date
AETA costs are reviewed in this AETA 2013 Model Update report
The AETA 2013 refresh was developed in close consultation with a stakeholder reference group drawn
from industry and researchacademic organisations with interests and expertise in a diverse range of
electricity generation technologies
The AETA 2013 Model results reflect the change to exclude the value of a carbon price in the Levelised
Cost of Energy (LCOE) All technologies have experienced a minor reduction in LCOE relative to 2012
(offset in some cases by other factors) due to the change to an amortisation period of 30 years plus the
construction period
Comparing the 2012 AETA results without a carbon price to the 2013 results without a carbon price there
are significant reductions in the LCOE of solar technologies and onshore wind This is as a consequence of
changes to the fixed and variable Operations and Maintenance (OampM) costs for these technologies For the
solar technologies the adjustment of the capital learning rate to 25 per cent has also contributed to the
LCOE reduction Offshore wind also has an increased learning rate but this has been offset to a large extent
by increased variable OampM costs
Nuclear LCOE has increased significantly due to higher estimates for capital costs
Efficiency for coal fired plants with CCS retrofits has been revised downwards to better reflect the expected
efficiency of these plants and has the effect of increasing the LCOE
64
REFERENCES
Albers A 2009 OampM Cost Modeling Technical Losses and Associated Uncertainties Proceedings of the
2009 European Wind Energy Conference Marseilles France March
AWEA (American Wind Energy Association) 2013 AWEA US Wind Industry Annual Report ndash Year
Ending 2012 USA
BNEF (Bloomberg New Energy Finance) 2013 Operations and Maintenance (OampM) Price Index Issue II
Wind Research Note April
BREE (Bureau of Resources and Energy Economics) 2012 AETA Report and Model Version 1_0 2012
Australian httpwwwbreegovau
CEC (Clean Energy Council) 2013 Australian Energy Technology Assessment 2013 Review Letter to
BREE of 20 May 2013 from the Clean Energy Council (Mr Russel Marsh signatory for the CEC)
CEC (Clean Energy Council) 2013 Clean Energy Council Renewable Energy Map Australia June (data
noted as current as of 21 August 2012)
httpwwwcleanenergycouncilorgauresourcecentreplantregistermaphtml
Crown Estate 2012 Offshore Wind Cost Reduction Pathways Study United Kingdom May
CSP 2012a CSP Parabolic Trough Report Cost Performance and Key Trends CSP Today
CSP 2012b CSP Solar Tower Report Cost Performance and Key Trends CSP Today
Deloitte amp Touche 2012 European Wind Services Study Find Out Which Way the Wind Blows Deloitte amp
Touche GmbH Wirtschaftspruumlfungsgesellschaft August
Deloitte 2011 Economics of wind development in New Zealand Deloitte for the for the New Zealand Wind
Energy Association
Ebert P amp Ware J 2013 The Role of Independents in the Wind Farm Operations amp Maintenance
Proceedings of the 2013 New Zealand Wind Energy Conference and Exhibition March
EPRI (Electric Power Research Institute) 2010 Engineering and Economic Evaluation of Central-Station
Solar Photovoltaic Power Plants USA March
GlobalData 2012 Wind Operations amp Maintenance (OampM) Market ndash Global Market Size Share by
Component Competitive Landscape and Key Country Analysis to 2020 GlobalData reference code
GDAE1054MAR January
Hand M 2013 Wind Plant Cost of Energy Proceedings of the 2nd NREL Wind Energy System
Engineering Workshop January
Hassan G 2011 Review of the Australian Wind Energy Industry Clean Energy Council Australia 2011
Houston C 2013 The Real Truth About Wind Farm OampM Costs North American WindPower March
IEA (International Energy Agency) 2008 Technology Roadmap Solar photovoltaic energy France
httpwwwieaorgpublicationsfreepublicationspublicationpv_roadmappdf
IRENA (International Renewable Energy Agency) 2013a Solar Photovoltaics Technology Brief Germany
January httpwwwirenaorgDocumentDownloadsPublicationsIRENA-ETSAPper
cent20Techper cent 20Briefper cent20E11per cent20Solarper cent20PVpdf
65
IRENA (International Renewable Energy Agency) 2013b Concentrating Solar Power Technology Brief
Germany January
IRENA (International Renewable Energy Agency) 2013c Renewable Power Generation Costs in 2012 An
Overview Germany
IT Power 2013 Analysis of the AETA 2012 cost estimates of CSP technologies Clean Energy Council
submission to the Bureau of Resources and Energy Economics May
Kann S 2012 US Solar Market Insight Report Q3 California USA
Kearny A 2010 Solar Thermal Electricity 2025 ndash clean electricity on demand attractive STE costs
stabilize energy production ATKearny consultants Dusseldorf Germany
Muirhead J 2013 SEGS experience suggests that CSP will age gracefully CSP Today South Africa
httpsocialcsptodaycommarketssegs-experience-suggests-csp-will-age-
gracefullysthash6VkxFaD0dpuf
NREL (National Renewable Energy Laboratories) 2011 IEA Wind Task 26 ndash Multi-national Case Study of
the Financial Cost of Wind Energy Technical Report NRELTP-6A2-48-48155 March
NREL (National Renewable Energy Laboratories) 2012 Cost and Performance Data for Power Generation
Technologies USA February
NREL (National Renewable Energy Laboratories) 2013 Breakeven Prices for Photovoltaics on
Supermarkets in the United States March httpwwwnrelgovdocsfy13osti57276pdf
NREL (National Renewable Energy Laboratories) 2013 Breakeven Prices for Photovoltaics on
Supermarkets in the United States USA March httpwwwnrelgovdocsfy13osti57276pdf
Photon 2012 The True Cost of Solar Power 2012 Temple of Doom Solar Power in Focus Series Photon
Consulting
Photon 2013 Solar Annual 2013 Build Your Empire Photon Consulting
Podewils C 2008 Photovoltaic vs Solar Thermal where PV has the upper hand and where solar thermal
strikes back Photon International Germany November
Poore R and Walford C 2008 Development of an Operations and Maintenance Cost Model to Identify
Cost of Energy Savings for Low Wind Speed Turbines Report NRELSR-500-40581 National
Renewable Energy Laboratory January
RolandBerger 2013 Offshore Wind Towards 2020 On the Pathway to Cost Competitiveness RolandBerger
Consultants Germany April
See wwwcsptodaycom
See wwwepiaorg
See wwwestelasolarde
See wwwidaees
See wwwieaorg
See wwwirenaorg
See wwwnrelgov
See wwwprotermosolares
66
See wwwrenoveteces
See wwwseiaorgau
See wwwsolarelectricpowerorg
See wwwworldbankorg
UK Crown Estate 2012 Offshore Wind Cost reduction Study May
US DoE (Department of Energy) 2013 Award Number DE-EE0005360 USA February
Wiser R Lantz E Bolinger M amp Hand M 2012 Recent Developments in the Levelized Cost of Energy
from US Wind Power Projects Contract No DE-AC02-05CH11231 National Renewable Energy
Laboratories February
67
Appendix A
Electricity Generation Technologies in AETA 2012 Report and Model
The 40 AETA electricity generation technologies are
1 Integrated Gasification and Combined Cycle (IGCC) plant based on brown coal
2 IGCC plant with Carbon Capture and Sequestration (CCS) based on brown coal
3 IGCC plant based on bituminous coal
4 IGCC plant with CCS based on bituminous coal
5 Direct injection coal engine (clean lignite eg brown coal technology)
6 Pulverised coal supercritical plant based on brown coal
7 Pulverised coal supercritical plant with post combustion CCS based on brown coal
8 Pulverised coal subcritical plant with post combustion CCS based on brown coal (retrofit)
9 Pulverised coal supercritical plant based on bituminous coal
10 Pulverised coal supercritical plant based on bituminous coal - SWIS relevant scale
11 Pulverised coal supercritical plant with CCS based on bituminous coal
12 Pulverised coal subcritical plant with post combustion CCS based on bituminous coal (retrofit)
13 Adding CCS to existing Combined Cycle Gas Turbine (CCGT) power plants (retrofitting)
14 Oxy combustion pulverised coal supercritical plant based on bituminous coal
15 Oxy combustion pulverised coal supercritical plant with CCS based on bituminous coal
16 Combined cycle plant burning natural gas
17 Combined cycle plant burning natural gas - SWIS relevant scale
18 Combined cycle plant with post combustion CCS
19 Open cycle plant burning natural gas
20 Solar thermal plant using compact linear fresnal reflector technology wo storage
21 Solar thermal plant using parabolic trough technology wo storage
22 Solar thermal plant using parabolic trough technology with storage
23 Solar thermal plant using compact linear fresnal reflector technology with storage
24 Solar thermal plant using central receiver technology wo storage
25 Solar thermal plant using central receiver technology with storage
26 Solar photovoltaic (PV) - non-tracking
27 Solar photovoltaic (PV) - single axis tracking
28 Solar photovoltaic (PV) - dual axis tracking
29 Wind (on-shore)
30 Wind (off-shore)
31 WaveOcean
68
32 Geothermal - hot sedimentary aquifer (HSA)
33 Geothermal - enhances geothermal system (EGS)
34 Landfill gas power plant
35 Sugar cane waste power plant
36 Other biomass waste power plant (eg wood)
37 Nuclear Gen 3+
38 Nuclear Small Modular Reactors (SMR)
39 Solarcoal hybrid
40 Integrated solar combined cycle (ISCS) ndash parabolic trough with combined cycle gas
69
Appendix B
Consultations with Stakeholders
This study has been undertaken in close consultation with a Stakeholder Reference Group drawn from
Australian industry and domestic as well as overseas researchacademic organisations with interests and
expertise in a diverse range of electricity generation technologies These stakeholders were invited to
provide evidence of the latest estimates for the costs and performance of various technologies
In addition the AETA project also had a Project Steering Committee comprising staff from BREE
AEMO CSIRO and other independent experts to provide technical advice and support The following
agencies participated in the stakeholder reference group meetings or were forwarded the documents
presented at the meetings
AETA Stakeholder Reference Group
Australian Coal Association
Australian Energy Market Operator
Australian Geothermal Energy Association
Australian National Low Emissions Coal RampD
Australian National University
Australian Renewable Energy Agency
Australian Solar Thermal Energy Association
Australian Sugar Milling Council
Australian Treasury
Bureau of Resources and Energy Economics
Clean Energy Council
CSIRO
Department of Industry
Economic Research Institute for ASEAN and East Asia
Energy Retailers Association of Australia
Energy Users Association of Australia
Evans and Peck
Ferrostaal
Global CCS Institute
Grid Australia
Intergen
International Energy Agency France
International Power Suez
IRENA Innovation and Technology Centre Germany
70
National Generators Forum
Oceanlinx Limited
Origin Energy
Private Generators Group
The Institute of Energy Economics Japan
The Energy Research Institute New Delhi
University of Melbourne Energy Institute
University of Queensland Energy Initiative
UQ Energy Economics amp Management Group
Wyldgroup
WorleyParsons
Two AETA Stakeholders Reference Group meetings took place on 30 April 2013 and 17 July 2013 In
addition the AETA Project Steering Committee met on 24 June 2013
71
BREE contacts Executive Director BREE Bruce Wilson brucewilsonretgovau
(02) 6243 7901
Deputy Executive Director Wayne Calder waynecalderbreegovau
(02) 6243 7718
Modelling amp Policy Integration Arif Syed arifsyedbreegovau
Program Leader (02) 6243 7504
Data Statistics Geoff Armitage geoffarmitagebreegovau
Program Leader (02) 6243 7510
Energy and Quantitative Analysis Allison Ball allisonballbreegovau
Program Leader (02) 6243 7539
Resources ndash Program Leader John Barber johnbarberbreegovau
(02) 6243 7988
72
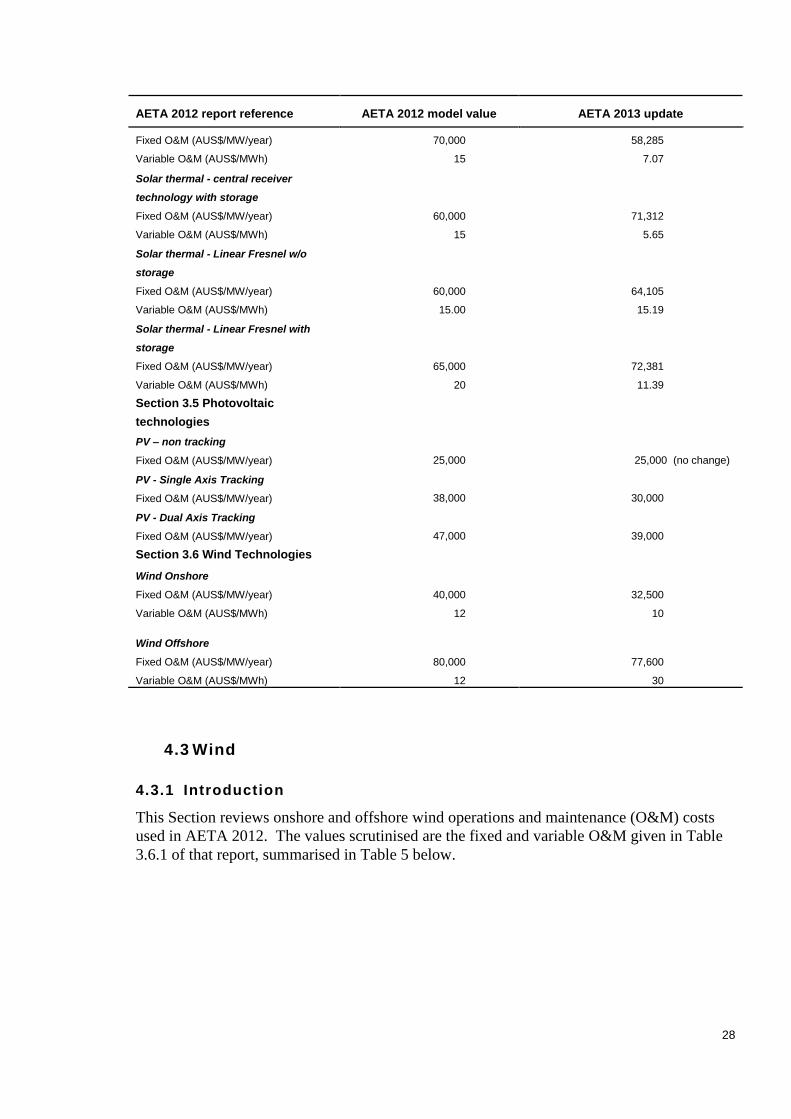
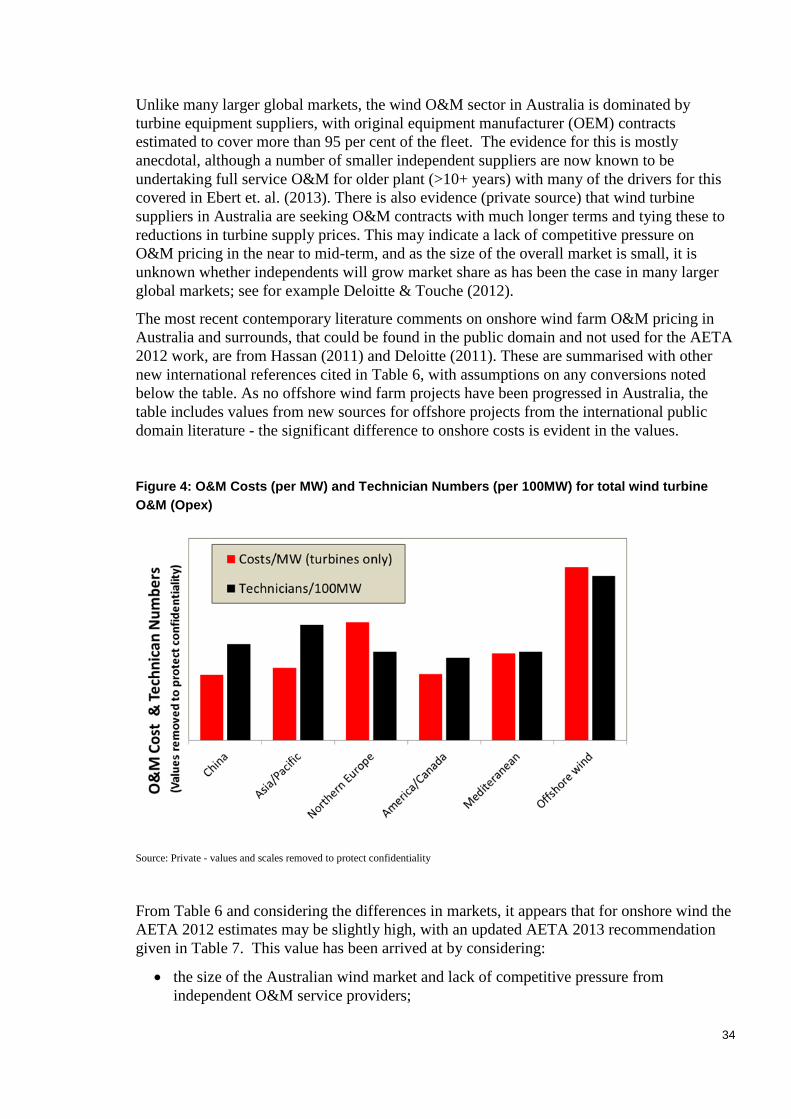
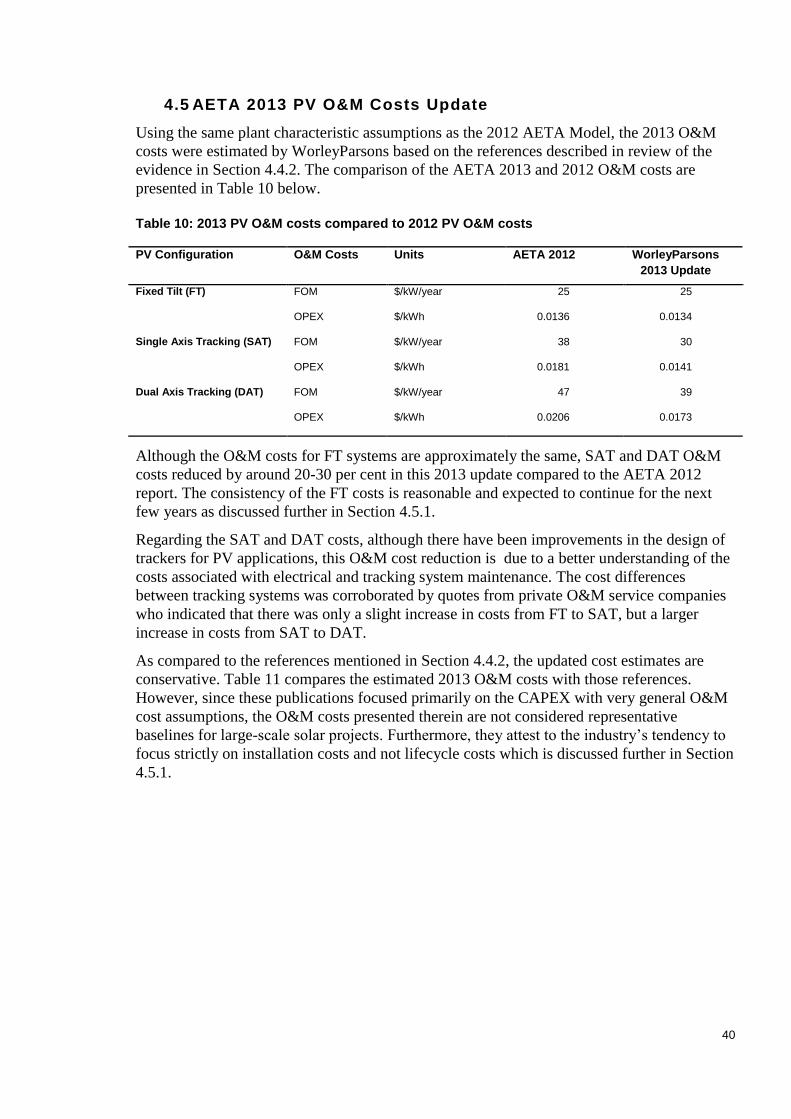
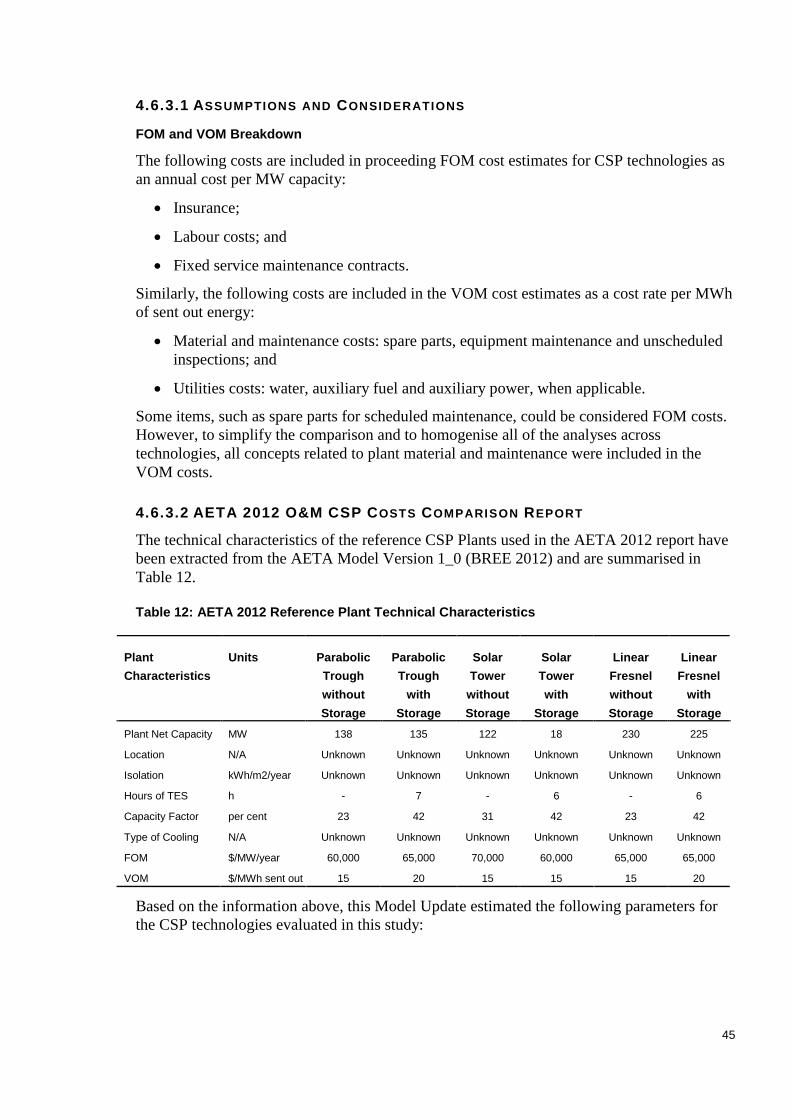
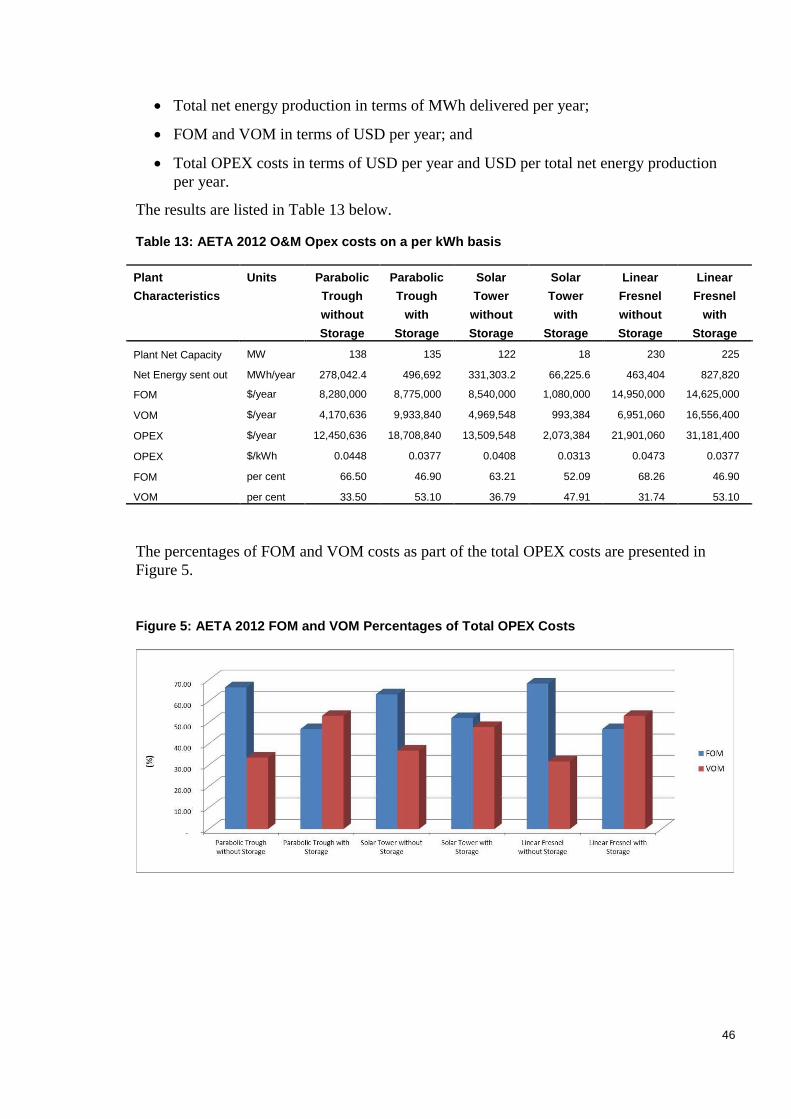

50
advances in RampD of the following factors
Components Solar receivers mirrors HTF storage media supporting structures
trackers and auxiliary systems
Systems Direct steam generation storage systems or hybrid cooling systems
Configurations Hybridisation or duel electricity water plants
a more competitive supply chain
improvements in the performance of the solar field solar-to-electric efficiency and
thermal energy storage systems
increases in the life of plants and
reduced financial costs
Based on the parameters listed above the LCOE from Solar Thermal technologies is likely to
be continuously decreasing and this is born out in the literature that has been reviewed Based
on the IRENA 2013b report the evolution of the LCOE from trough and power tower CSP
technologies shows how the LCOE is decreasing as technology development increases in
Table 16 below Estimates for LCOE for the hypothetical trough and tower CSP plants in
2014 are also included
51
Table 16 Estimated LCOE form Existing and Hypothetical Trough and Solar Tower CSP Technologies
CSP
Technology
Year Capacity
(MW)
Plant Name Location DNI
(kWhm2year)
LCOE 2012
$kWh Installed
Trough
1981 05 PSA Spain 2000 064
1983 138 SEGS I California 2700 039
1989 30 SEGS II ndash VIII California 2700 026
1992 80 SEGS VIII amp IX California 2700 020
2008 - 2009 50 Andasol 1 2 Spain 2000 035
2010 50 Solnova 1 amp 3 Spain 2000 034
2010 - 2011 50 Extresol 1 amp 2 Spain 2000 035
2014 250 Unspecified (wet
cooling no storage)
Not provided Not provided 020
Tower
1987 10 Solar One California 2700 058
2007 11 PS10 Spain 2000 034
2009 20 PS20 Spain 2000 036
2011 199 Gemasolar (wet
cooling 15hr
storage)
Spain 2000 033
2014 120 Unspecified
(dry cooling
storage)
Not Provided Not provided 015
International Institutions such as IRENA ESTELA or the World Bank agree that the LCOE
and capital cost reductions of 28 per cent to 60 per cent are envisioned by 2020 ndash 2025 for
such plant Estimates of possible LCOE reductions for CSP technology from 2012 to 2025
are provided in Figure 7 taken from Kearny (2010)
52
Figure 7 Expected LCOE Reductions for CSP Technology from 2012 to 2025
Source (Kearny 2010)
The OampM maintenance costs of modern CSP Plants are lower than those for Californian
SEGS Plants built in the 1980s and 1990s which has a total combined capacity of 354 MW
and estimated OampM costs of USD 004kWh (IRENA 2013b) However CSP experienced no
growth from early 1990s until the mid-2000s as can be seen in Table 16 above
As stated at the beginning of Section 462 Andasol 1 was the first 50 MWe parabolic trough
plant built after SEGS which included a thermal energy storage system It commenced
operation at the end of 2008 Podewils (2008) estimated Andasol 1 OampM costs of EUR
0072kWh or USD 0095kWh (considering 2012 medium rate exchange EURUSD of
07553) This value is high compared to OPEX estimations for PT with TES provided by
both this 2013 update and the AETA 2012 report (00293 and 00377 USDkWh
respectively) Therefore according to the information detailed above considerable learning
improvements to OampM costs have been already achieved from the commencement of
operation of Andasol 1 to the time of this Report
`WorleyParsonsrsquo estimations on the LCOE of parabolic trough plants is in the range of
USD 020kWh to USD 035kWh and that of solar towers between USD 017kWh and
USD 029kWh However in areas with excellent solar resources the range could be as low
as USD 014kWh to USD 018kWh
The following considerations have been taken into account for OampM cost learning rates
forecast
WorleyParsons LCOE estimations as set out above
Potential average envisaged LCOE reductions of 475 per cent by 2025 based on Figure
7 above
OPEX contribution on LCOE of 20 per cent and
53
assuming that all components involved in the LCOE (CAPEX OPEX and financial
expenses) reduce at the same rate so percentage contributions remain constant
According to these considerations WorleyParsons estimates that OPEX values by 2025 could
reach from 0021 to 0037 USDkWh for PT technology and from 0018 to 0031 USDkWh
for ST technology
Technological improvements have reduced the requirement of replacing mirrors and
receivers Automation has reduced the cost of other OampM procedures by as much 30 per
cent As a result of OampM procedure improvements (both cost and plant performance) the
total OampM costs of CSP plants in the long-term are likely to be below USD 0025kWh
(IRENA 2013b)
Parabolic trough system in the United States would have OampM costs of around USD 002 to
USD 003kWh meanwhile the OampM costs of parabolic trough and solar tower power plants
currently under construction in South Africa have estimated OampM costs of between USD
0029 and USD 0036kWh (also IRENA 2013b)
WorleyParsons estimations are in alignment with IRENA estimations in terms of current and
envisaged CSP OPEX costs
4635 CONCLUSIONS ndash CSP
The following main conclusions were made based on this study in relation to CSP
technologies
the 2013 WorleyParsons CSP OampM costs update resulted in values between 0023 and
0043 USDkWh based on 2012 USD
reductions in CSP OampM costs between 8 per cent and 27 per cent were obtained in
comparison to values provide in AETA 2012 report
the total OampM costs of CSP Plants in the long-term are likely to be below USD
0025kWh
the updated values for 2013 by WorleyParsons are in alignment with the values
provided by recognised international institutions and
at the time of this report the only CSP technology with substantial operation capacity
was PT Only three utility-scale ST plants were in operation at the time of this report
(PS-10 PS-20 and Gemasolar) of which only one (Gemasolar) uses TES Though
several process steam and small-scale LFR Plants are currently in operation only one
utility-scale LFR (Puerto Erradio 2) was in operation at the time of this report
47 AETA 2013 OampM Learning Rate recommendation
The learning rate used in AETA 2012 for OampM is applied to all technologies assessed and
includes fossil fuel technologies and emerging technologies The learning rate is set at an
improvement of 02 per cent per annum
In addition to the improvement rate OampM is escalated at a rate of 150 per cent of CPI per
year based on experience with increases in parts and labour costs
The CPI rate set in the model is 25 per cent per annum
54
OampM cost information in the public domain in both quantum and quality is poor for
contemporary data Information supporting OampM learning rates is equally poor There are
indications that emerging technologies do have the potential for increased OampM learning
rates relative to mature technologies
For the renewable energy technologies studied in this report onshore wind is considered
mature and it is recommended that the AETA 2012 report value of 02 per cent is maintained
For all other renewable energy technologies studied in this report a more aggressive learning
rate of 25 per cent is recommended This will effectively cancel out the CPI escalation
adjustment and provide a ldquoflat linerdquo OampM rate for future years This will provide a value in
line with the learning rate conclusions for PV
The learning rate for CSP is considered to have greater potential for reduction but due to the
high level of analysis in this report (and therefore uncertainty) it is proposed that a maximum
of two learning rates is appropriate for the AETA model
Table 17 AETA Learning Rate Comparison
AETA 2012 Learning Rate AETA 2013 update Learning Rate
Onshore Wind 02 per cent 02 per cent
Offshore Wind
PV ndash all technologies
CSP ndash all technologies
02 per cent 25 per cent
55
5 CHANGES TO THE LCOE
Changes to the model parameters described in the earlier sections have resulted in changes to
the LCOE estimates for a number of technologies The LCOE estimate values for all
technologies and associated range of uncertainty are shown in the Figures 8 to 13 below
Note that the values listed are for a base value carbon price modifier of zero per cent which
places no value on carbon emissions
For selected technologies where there are significant cost differences Figure 14 provides a
comparison of mid-range LCOE values for the AETA 2013 and AETA 2012 Models Key
features of the Figures 8 to 14 are as follows
both in AETA 2012 and 2013 Model update LCOE costs are provided for the years
2012 2020 2025 2030 2040 and 2050
cost ranges are provided for each technology that accounts for differences in fuel prices
and state-based variations
LCOE costs vary substantially across the technologies from $89MWh (combined cycle
gas turbine) to $351MWh (solar thermal linear fresnel) in 2012 and $73MWh (PV
non-tracking) to $247MWh (IGCC black coal CCS) in 2050
the inter-technology LCOE comparisons figures (Figures 8 to 13) reveal changes in
relative costs of technologies over time Key results include renewable technologies
have higher LCOEs than the lowest cost non-renewable technologies and the relative
LCOE rankings significantly change post 2030 The LCOE of solar PV become lower
than the non-renewables from mid 2030 onwards and
large changes in LCOE results between AETA 2013 Update and AETA 2012 are
depicted in Figures14 below Figure 14 compares LCOEs at 2050 between the AETA
2013 Update and AETA 2012 for a selected number of technologies that have changed
significantly for NSW (AETA developed LCOEs by each Australian state) Differences
in technology LCOEs are explained by a multiplicity of factors including the technical
developments OampM costs and learning rate changes
56
Figure 8 Updated LCOEs for AETA 2013 Model technologies values for 2012 (NSW) with carbon price set to zero
0
50
100
150
200
250
300
350
400
450
500
LCO
E ($
MW
h)
LCOE FOR 2012 TECHNOLOGIES (NSW) Note Default region is NSW except bown coal
technologies (VIC) and SWIS scale (as specified)
LCOE includes where relevant allowance for- Carbon Price- CO2 transport and sequestration cost- Plant capital cost (EPC basis) within battery limits- Owners costs excluding interest during construction- Fixed and variable operating costs- Fuel costs- Economic escalation factors
57
Figure 9 Updated LCOEs for AETA 2013 Model technologies values for 2020 (NSW) with carbon price set to zero
0
50
100
150
200
250
300
350
400
450
LCO
E ($
MW
h)
LCOE FOR 2020 TECHNOLOGIES (NSW) Note Default region is NSW except bown coal
technologies (VIC) and SWIS scale (as specified)
LCOE includes where relevant allowance for- Carbon Price- CO2 transport and sequestration cost- Plant capital cost (EPC basis) within battery limits- Owners costs excluding interest during construction- Fixed and variable operating costs- Fuel costs- Economic escalation factors
58
Figure 10 Updated LCOEs for AETA 2013 Model technologies values for 2025 (NSW) with carbon price set to zero
0
50
100
150
200
250
300
350
400
LCO
E ($
MW
h)
LCOE FOR 2025 TECHNOLOGIES (NSW) Note Default region is NSW except bown coal
technologies (VIC) and SWIS scale (as specified)
LCOE includes where relevant allowance for- Carbon Price- CO2 transport and sequestration cost- Plant capital cost (EPC basis) within battery limits- Owners costs excluding interest during construction- Fixed and variable operating costs- Fuel costs- Economic escalation factors
59
Figure 11 Updated LCOEs for AETA 2013 Model technologies values for 2030 (NSW) with carbon price set to zero
0
50
100
150
200
250
300
350
400
LCO
E ($
MW
h)
LCOE FOR 2030 TECHNOLOGIES (NSW) Note Default region is NSW except bown coal
technologies (VIC) and SWIS scale (as specified)
LCOE includes where relevant allowance for- Carbon Price- CO2 transport and sequestration cost- Plant capital cost (EPC basis) within battery limits- Owners costs excluding interest during construction- Fixed and variable operating costs- Fuel costs- Economic escalation factors
60
Figure 12 Updated LCOEs for AETA 2013 Model technologies values for 2040 (NSW) with carbon price set to zero
0
50
100
150
200
250
300
350
400
LCO
E ($
MW
h)
LCOE FOR 2040 TECHNOLOGIES (NSW) Note Default region is NSW except bown coal
technologies (VIC) and SWIS scale (as specified)
LCOE includes where relevant allowance for- Carbon Price- CO2 transport and sequestration cost- Plant capital cost (EPC basis) within battery limits- Owners costs excluding interest during construction- Fixed and variable operating costs- Fuel costs- Economic escalation factors
61
Figure 13 Updated LCOEs for AETA 2013 Model technologies values for 2050 (NSW) with carbon price set to zero
0
50
100
150
200
250
300
350
400
LCO
E ($
MW
h)
LCOE FOR 2050 TECHNOLOGIES (NSW)
LCOE includes where relevant allowance for- Carbon Price- CO2 transport and sequestration cost- Plant capital cost (EPC basis) within battery limits- Owners costs excluding interest during construction- Fixed and variable operating costs- Fuel costs- Economic escalation factors
Note Default region is NSW except bown coal
technologies (VIC) and SWIS scale (as specified)
62
Figure 14 Comparison of AETA 2013 Model and AETA 2012 Model LCOE estimates selected technologies 2050
0
50
100
150
200
250
AETA 2012
AETA 2013
63
51 Conclusions
The Australian Energy Technology Assessment (AETA 2012) provided the best available and most up-to-
date cost estimates for 40 electricity generation technologies under Australian conditions To ensure that
the cost estimates for the various technologies are consistent all common input costs (eg labour
materials components carbon price) were itemised To ensure that the AETA costings remain up to date
AETA costs are reviewed in this AETA 2013 Model Update report
The AETA 2013 refresh was developed in close consultation with a stakeholder reference group drawn
from industry and researchacademic organisations with interests and expertise in a diverse range of
electricity generation technologies
The AETA 2013 Model results reflect the change to exclude the value of a carbon price in the Levelised
Cost of Energy (LCOE) All technologies have experienced a minor reduction in LCOE relative to 2012
(offset in some cases by other factors) due to the change to an amortisation period of 30 years plus the
construction period
Comparing the 2012 AETA results without a carbon price to the 2013 results without a carbon price there
are significant reductions in the LCOE of solar technologies and onshore wind This is as a consequence of
changes to the fixed and variable Operations and Maintenance (OampM) costs for these technologies For the
solar technologies the adjustment of the capital learning rate to 25 per cent has also contributed to the
LCOE reduction Offshore wind also has an increased learning rate but this has been offset to a large extent
by increased variable OampM costs
Nuclear LCOE has increased significantly due to higher estimates for capital costs
Efficiency for coal fired plants with CCS retrofits has been revised downwards to better reflect the expected
efficiency of these plants and has the effect of increasing the LCOE
64
REFERENCES
Albers A 2009 OampM Cost Modeling Technical Losses and Associated Uncertainties Proceedings of the
2009 European Wind Energy Conference Marseilles France March
AWEA (American Wind Energy Association) 2013 AWEA US Wind Industry Annual Report ndash Year
Ending 2012 USA
BNEF (Bloomberg New Energy Finance) 2013 Operations and Maintenance (OampM) Price Index Issue II
Wind Research Note April
BREE (Bureau of Resources and Energy Economics) 2012 AETA Report and Model Version 1_0 2012
Australian httpwwwbreegovau
CEC (Clean Energy Council) 2013 Australian Energy Technology Assessment 2013 Review Letter to
BREE of 20 May 2013 from the Clean Energy Council (Mr Russel Marsh signatory for the CEC)
CEC (Clean Energy Council) 2013 Clean Energy Council Renewable Energy Map Australia June (data
noted as current as of 21 August 2012)
httpwwwcleanenergycouncilorgauresourcecentreplantregistermaphtml
Crown Estate 2012 Offshore Wind Cost Reduction Pathways Study United Kingdom May
CSP 2012a CSP Parabolic Trough Report Cost Performance and Key Trends CSP Today
CSP 2012b CSP Solar Tower Report Cost Performance and Key Trends CSP Today
Deloitte amp Touche 2012 European Wind Services Study Find Out Which Way the Wind Blows Deloitte amp
Touche GmbH Wirtschaftspruumlfungsgesellschaft August
Deloitte 2011 Economics of wind development in New Zealand Deloitte for the for the New Zealand Wind
Energy Association
Ebert P amp Ware J 2013 The Role of Independents in the Wind Farm Operations amp Maintenance
Proceedings of the 2013 New Zealand Wind Energy Conference and Exhibition March
EPRI (Electric Power Research Institute) 2010 Engineering and Economic Evaluation of Central-Station
Solar Photovoltaic Power Plants USA March
GlobalData 2012 Wind Operations amp Maintenance (OampM) Market ndash Global Market Size Share by
Component Competitive Landscape and Key Country Analysis to 2020 GlobalData reference code
GDAE1054MAR January
Hand M 2013 Wind Plant Cost of Energy Proceedings of the 2nd NREL Wind Energy System
Engineering Workshop January
Hassan G 2011 Review of the Australian Wind Energy Industry Clean Energy Council Australia 2011
Houston C 2013 The Real Truth About Wind Farm OampM Costs North American WindPower March
IEA (International Energy Agency) 2008 Technology Roadmap Solar photovoltaic energy France
httpwwwieaorgpublicationsfreepublicationspublicationpv_roadmappdf
IRENA (International Renewable Energy Agency) 2013a Solar Photovoltaics Technology Brief Germany
January httpwwwirenaorgDocumentDownloadsPublicationsIRENA-ETSAPper
cent20Techper cent 20Briefper cent20E11per cent20Solarper cent20PVpdf
65
IRENA (International Renewable Energy Agency) 2013b Concentrating Solar Power Technology Brief
Germany January
IRENA (International Renewable Energy Agency) 2013c Renewable Power Generation Costs in 2012 An
Overview Germany
IT Power 2013 Analysis of the AETA 2012 cost estimates of CSP technologies Clean Energy Council
submission to the Bureau of Resources and Energy Economics May
Kann S 2012 US Solar Market Insight Report Q3 California USA
Kearny A 2010 Solar Thermal Electricity 2025 ndash clean electricity on demand attractive STE costs
stabilize energy production ATKearny consultants Dusseldorf Germany
Muirhead J 2013 SEGS experience suggests that CSP will age gracefully CSP Today South Africa
httpsocialcsptodaycommarketssegs-experience-suggests-csp-will-age-
gracefullysthash6VkxFaD0dpuf
NREL (National Renewable Energy Laboratories) 2011 IEA Wind Task 26 ndash Multi-national Case Study of
the Financial Cost of Wind Energy Technical Report NRELTP-6A2-48-48155 March
NREL (National Renewable Energy Laboratories) 2012 Cost and Performance Data for Power Generation
Technologies USA February
NREL (National Renewable Energy Laboratories) 2013 Breakeven Prices for Photovoltaics on
Supermarkets in the United States March httpwwwnrelgovdocsfy13osti57276pdf
NREL (National Renewable Energy Laboratories) 2013 Breakeven Prices for Photovoltaics on
Supermarkets in the United States USA March httpwwwnrelgovdocsfy13osti57276pdf
Photon 2012 The True Cost of Solar Power 2012 Temple of Doom Solar Power in Focus Series Photon
Consulting
Photon 2013 Solar Annual 2013 Build Your Empire Photon Consulting
Podewils C 2008 Photovoltaic vs Solar Thermal where PV has the upper hand and where solar thermal
strikes back Photon International Germany November
Poore R and Walford C 2008 Development of an Operations and Maintenance Cost Model to Identify
Cost of Energy Savings for Low Wind Speed Turbines Report NRELSR-500-40581 National
Renewable Energy Laboratory January
RolandBerger 2013 Offshore Wind Towards 2020 On the Pathway to Cost Competitiveness RolandBerger
Consultants Germany April
See wwwcsptodaycom
See wwwepiaorg
See wwwestelasolarde
See wwwidaees
See wwwieaorg
See wwwirenaorg
See wwwnrelgov
See wwwprotermosolares
66
See wwwrenoveteces
See wwwseiaorgau
See wwwsolarelectricpowerorg
See wwwworldbankorg
UK Crown Estate 2012 Offshore Wind Cost reduction Study May
US DoE (Department of Energy) 2013 Award Number DE-EE0005360 USA February
Wiser R Lantz E Bolinger M amp Hand M 2012 Recent Developments in the Levelized Cost of Energy
from US Wind Power Projects Contract No DE-AC02-05CH11231 National Renewable Energy
Laboratories February
67
Appendix A
Electricity Generation Technologies in AETA 2012 Report and Model
The 40 AETA electricity generation technologies are
1 Integrated Gasification and Combined Cycle (IGCC) plant based on brown coal
2 IGCC plant with Carbon Capture and Sequestration (CCS) based on brown coal
3 IGCC plant based on bituminous coal
4 IGCC plant with CCS based on bituminous coal
5 Direct injection coal engine (clean lignite eg brown coal technology)
6 Pulverised coal supercritical plant based on brown coal
7 Pulverised coal supercritical plant with post combustion CCS based on brown coal
8 Pulverised coal subcritical plant with post combustion CCS based on brown coal (retrofit)
9 Pulverised coal supercritical plant based on bituminous coal
10 Pulverised coal supercritical plant based on bituminous coal - SWIS relevant scale
11 Pulverised coal supercritical plant with CCS based on bituminous coal
12 Pulverised coal subcritical plant with post combustion CCS based on bituminous coal (retrofit)
13 Adding CCS to existing Combined Cycle Gas Turbine (CCGT) power plants (retrofitting)
14 Oxy combustion pulverised coal supercritical plant based on bituminous coal
15 Oxy combustion pulverised coal supercritical plant with CCS based on bituminous coal
16 Combined cycle plant burning natural gas
17 Combined cycle plant burning natural gas - SWIS relevant scale
18 Combined cycle plant with post combustion CCS
19 Open cycle plant burning natural gas
20 Solar thermal plant using compact linear fresnal reflector technology wo storage
21 Solar thermal plant using parabolic trough technology wo storage
22 Solar thermal plant using parabolic trough technology with storage
23 Solar thermal plant using compact linear fresnal reflector technology with storage
24 Solar thermal plant using central receiver technology wo storage
25 Solar thermal plant using central receiver technology with storage
26 Solar photovoltaic (PV) - non-tracking
27 Solar photovoltaic (PV) - single axis tracking
28 Solar photovoltaic (PV) - dual axis tracking
29 Wind (on-shore)
30 Wind (off-shore)
31 WaveOcean
68
32 Geothermal - hot sedimentary aquifer (HSA)
33 Geothermal - enhances geothermal system (EGS)
34 Landfill gas power plant
35 Sugar cane waste power plant
36 Other biomass waste power plant (eg wood)
37 Nuclear Gen 3+
38 Nuclear Small Modular Reactors (SMR)
39 Solarcoal hybrid
40 Integrated solar combined cycle (ISCS) ndash parabolic trough with combined cycle gas
69
Appendix B
Consultations with Stakeholders
This study has been undertaken in close consultation with a Stakeholder Reference Group drawn from
Australian industry and domestic as well as overseas researchacademic organisations with interests and
expertise in a diverse range of electricity generation technologies These stakeholders were invited to
provide evidence of the latest estimates for the costs and performance of various technologies
In addition the AETA project also had a Project Steering Committee comprising staff from BREE
AEMO CSIRO and other independent experts to provide technical advice and support The following
agencies participated in the stakeholder reference group meetings or were forwarded the documents
presented at the meetings
AETA Stakeholder Reference Group
Australian Coal Association
Australian Energy Market Operator
Australian Geothermal Energy Association
Australian National Low Emissions Coal RampD
Australian National University
Australian Renewable Energy Agency
Australian Solar Thermal Energy Association
Australian Sugar Milling Council
Australian Treasury
Bureau of Resources and Energy Economics
Clean Energy Council
CSIRO
Department of Industry
Economic Research Institute for ASEAN and East Asia
Energy Retailers Association of Australia
Energy Users Association of Australia
Evans and Peck
Ferrostaal
Global CCS Institute
Grid Australia
Intergen
International Energy Agency France
International Power Suez
IRENA Innovation and Technology Centre Germany
70
National Generators Forum
Oceanlinx Limited
Origin Energy
Private Generators Group
The Institute of Energy Economics Japan
The Energy Research Institute New Delhi
University of Melbourne Energy Institute
University of Queensland Energy Initiative
UQ Energy Economics amp Management Group
Wyldgroup
WorleyParsons
Two AETA Stakeholders Reference Group meetings took place on 30 April 2013 and 17 July 2013 In
addition the AETA Project Steering Committee met on 24 June 2013
71
BREE contacts Executive Director BREE Bruce Wilson brucewilsonretgovau
(02) 6243 7901
Deputy Executive Director Wayne Calder waynecalderbreegovau
(02) 6243 7718
Modelling amp Policy Integration Arif Syed arifsyedbreegovau
Program Leader (02) 6243 7504
Data Statistics Geoff Armitage geoffarmitagebreegovau
Program Leader (02) 6243 7510
Energy and Quantitative Analysis Allison Ball allisonballbreegovau
Program Leader (02) 6243 7539
Resources ndash Program Leader John Barber johnbarberbreegovau
(02) 6243 7988
72
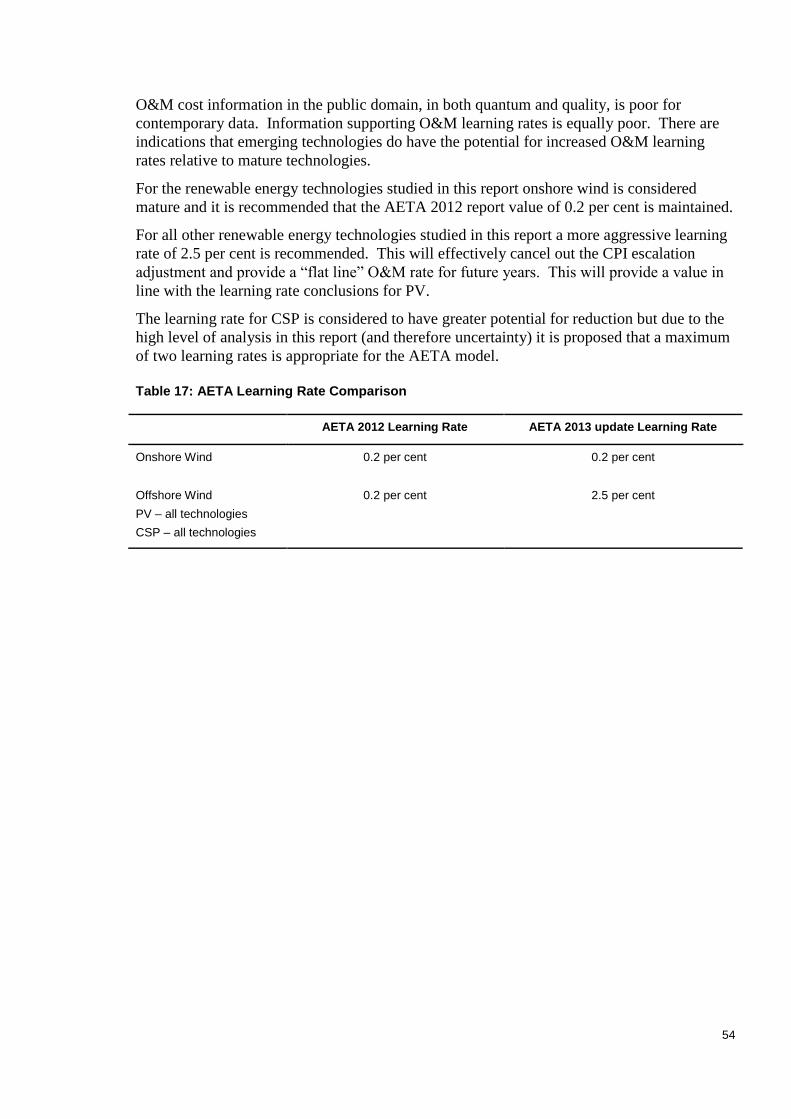
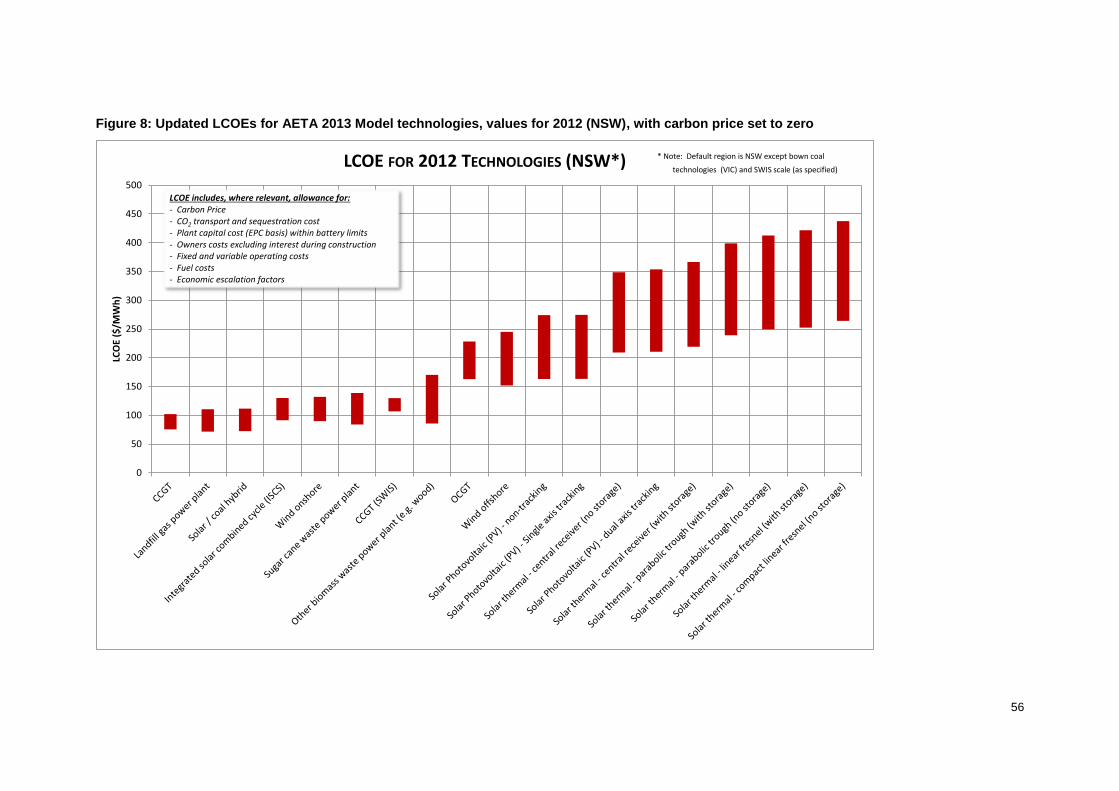

72