australian super hornet annual noise report 2016 · raaf amberley runway orientation . departure...
TRANSCRIPT

Australian Super Hornet Annual Noise Report 2016
Australian Super Hornet
Annual Noise Report
2016
Endorsed Approved
Glen Braz Ken Robinson Group Captain Air Commodore Officer Commanding Senior Australian Defence Force Officer Number 82 Wing RAAF Amberley

Australian Super Hornet Annual Noise Report 2016
Page 2
TABLE OF CONTENTS
EXECUTIVE SUMMARY .......................................................................................................................... 3 BACKGROUND ........................................................................................................................................ 4
Purpose of the report...................................................................................................................... 4 Identification of Super Hornet flight path data and calculation of movements .............................. 4 Limitations in flight data availability ................................................................................................ 5
EVALUATION OF FLIGHT PATHS .......................................................................................................... 7 Amberley runway orientation .......................................................................................................... 7 Departure paths .............................................................................................................................. 7 Arrival paths ................................................................................................................................... 9 Altitude limitations ........................................................................................................................ 10 Number and timing of Super Hornet movements ......................................................................... 11
EVALUATION OF SUPER HORNET NOISE IMPACT .......................................................................... 14 CONCLUSION ........................................................................................................................................ 17
Disclaimer
This report contains a summary of data collected over the specified period and is intended to convey the best information available from the Noise Flight Path and Monitoring System at the time. The system databases are to some extent dependent upon external sources and errors may occur. All care is taken in preparation of the report but its complete accuracy cannot be guaranteed. The Department of Defence and the Noise Flight Path and Monitoring System project contractors do not accept any legal liability for any losses arising from reliance upon data in this report which may be found to be inaccurate. The Noise Flight Path and Monitoring System does not provide “Aircraft noise levels” as defined in AS2021-2000.
Australian Super Hornet Annual Noise Report 2016
Page 3
EXECUTIVE SUMMARY
1. The 2016 Australian Super Hornet Annual Noise Report is the sixth in a series of Annual Noise Reports required by the Australian Super Hornet Noise Monitoring and Complaints Handling Strategy. This report monitors Air Force compliance with the Super Hornet Noise Management Plan, and assesses the noise measured around RAAF Base Amberley against the 2009 Public Environment Report modelling.
2. Assessment of military fast jet movements was made through analysis of data processed by the Noise and Flight Path Monitoring System (NFMPS). In 2016 a total of 5883 Super Hornet movements were identified against a 2009 Public Environment Report forecast of 4648 movements, and the Noise Management Plan version 3.0 forecast of 5261.
3. Assessment of flight path information identified a predominate adherence to planned departure and recovery profiles. A small number of departures to the north were required to conduct turns after takeoff earlier than planned when operating in accordance with promulgated instrument departure profiles during periods of poor weather. These variations are in accordance with the unforeseeable variations as described in the Noise Management Plan. There were no operations on the secondary runway, which last occurred in 2014 due to runway repair works required on the primary runway.
4. Despite the overfly of forecast movements in 2016, the number of N70 and N85 noise event detections at the four Noise Monitoring Terminals in the Amberley area were significantly lower than the forecast in the 2009 Public Environment Report, with the exception of N70 noise events at Yamanto which were within the lower end of the forecast range despite the number of movements exceeding the PER forecast by 27 percent. N85 noise events at all Noise Monitoring Terminal locations were significantly lower than the 2009 forecast.
5. A review of noise event data over the six year period 2011 to 2016 identified that the rate of N70 and N85 per 4648 movements (the 2009 Public Environment Report forecast movement rate) decreased from a peak that occurred in 2012. This reflects continued adherence to robust noise management strategies employed by Number 82 Wing operating the Super Hornet.
Australian Super Hornet Annual Noise Report 2016
Page 4
BACKGROUND
6. The Australian Government announced in March 2007, the acquisition of 24 F/A-18F Super Hornets to replace the F-111 capability at Royal Australian Air Force (RAAF) Base Amberley.
7. In accordance with the Commonwealth Environment Protection and Biodiversity Conservation Act 1999 a Public Environment Report was completed in December 2009. The Public Environment Report addressed potential environmental impacts resulting from Australian Super Hornet flying operations at Royal Australian Air Force (RAAF) Base Amberley.
8. In March 2010 the Minister for Environment Protection, Heritage and the Arts (the Environment Minister) approved Super Hornet flying operations at Amberley subject to ten conditions. Condition 1 required the RAAF to submit an Australian Super Hornet Noise Management Plan for approval by the Environment Minister.
9. Condition 2 required the Air Force to produce a Noise Monitoring and Complaints Handling Strategy which resulted in the installation of a Noise and Flight Path Monitoring System at RAAF Base Amberley. The purpose of the NFPMS at RAAF Base Amberley was to:
a. Identify noise emissions associated with all military aircraft operations at the Base
b. Assist Defence to manage aircraft noise exposure over land in the vicinity of the Base
c. Provide information on aircraft noise emissions to the public in a format that is easy to read and understand.
10. The Noise Monitoring and Complaints Handling Strategy required the drafting of an Annual Super Hornet noise report that compared the NFPMS quarterly reports with the Australian Super Hornet Noise Management Plan. The reason for the report was to evaluate the accuracy of the noise modelling undertaken for the Public Environment Report and monitor compliance with the Australian Super Hornet Noise Management Plan. It was also to provide a tool to assist Defence in managing aircraft noise exposure in the vicinity of RAAF Base Amberley.
11. In December 2015 an updated Noise Management Plan version 3.0 was published and approved by the Department of Environment on 04 April 2016. This plan incorporated Super Hornet noise management lessons identified over the period 2010 to 2015 as reflected in previous annual noise reports. This plan forecast 5261 annual Super Hornet movements and forecast up to 200 additional movements by visiting military fast jets. This 2016 annual report is based on this updated Noise Management Plan version 3.0.
12. In late 2016 updated noise modelling was conducted for RAAF Base Amberley in support of the 2029 Australian Noise Exposure Forecast process. The updated noise modelling outputs have been incorporated into a further revised Super Hornet Noise Management Plan version 4.0 which was promulgated in December 2016. This plan allows for the introduction of the EA-18G Growler to RAAF Base Amberley in addition to the extant fleet of F/A-18F Super Hornets. This plan was submitted to the Department of Environment for approval in January 2017 and will be the focus of the 2017 annual noise report.
Purpose of the report
13. The purpose of the Annual Super Hornet Noise Report is to evaluate the accuracy of noise modelling undertaken for the 2009 Public Environment Report and monitor compliance with the Australian Super Hornet Noise Management Plan. This report provides useful comparisons between the NFPMS measured data in successive years and identifies trends and changes in aircraft operation, flight paths and noise impact.
Identification of Super Hornet flight path data and calculation of movements
14. The Noise and Flight Path Monitoring System (NFPMS) consists of four Noise Monitoring Terminals (NMT) located strategically around RAAF Amberley, with the locations selected after wide
Australian Super Hornet Annual Noise Report 2016
Page 5
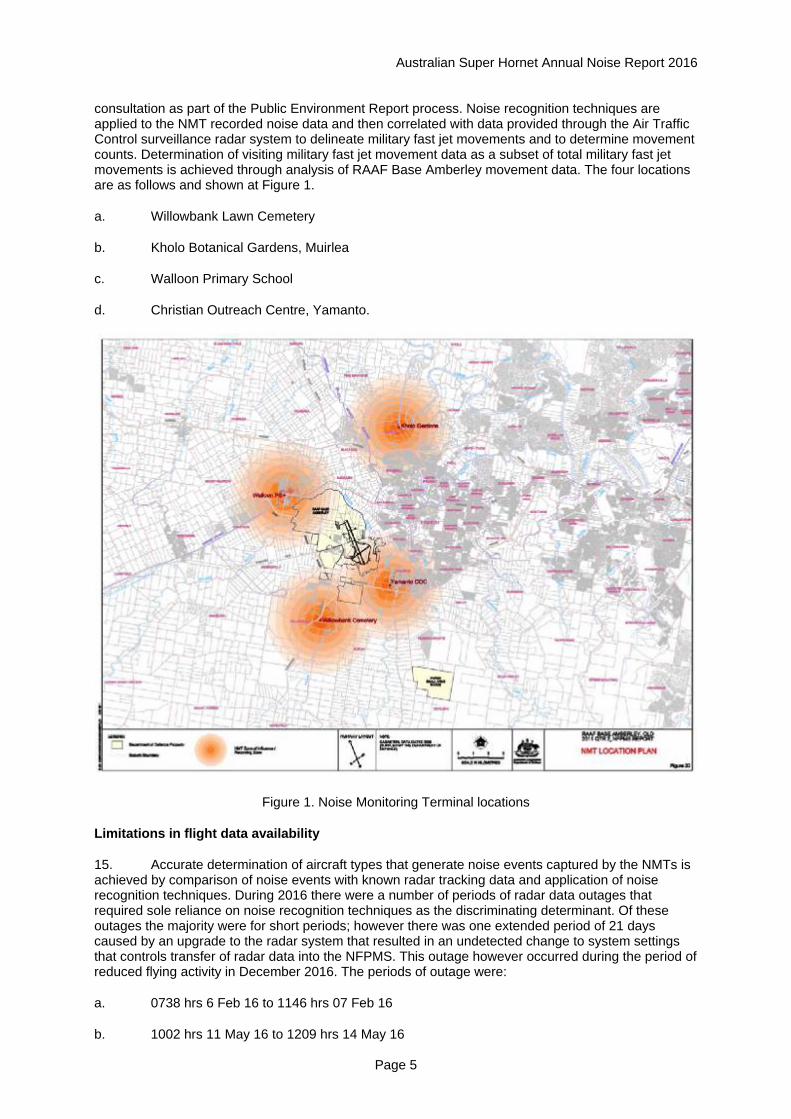
consultation as part of the Public Environment Report process. Noise recognition techniques are applied to the NMT recorded noise data and then correlated with data provided through the Air Traffic Control surveillance radar system to delineate military fast jet movements and to determine movement counts. Determination of visiting military fast jet movement data as a subset of total military fast jet movements is achieved through analysis of RAAF Base Amberley movement data. The four locations are as follows and shown at Figure 1.
a. Willowbank Lawn Cemetery
b. Kholo Botanical Gardens, Muirlea
c. Walloon Primary School
d. Christian Outreach Centre, Yamanto.
Figure 1. Noise Monitoring Terminal locations
Limitations in flight data availability
15. Accurate determination of aircraft types that generate noise events captured by the NMTs is achieved by comparison of noise events with known radar tracking data and application of noise recognition techniques. During 2016 there were a number of periods of radar data outages that required sole reliance on noise recognition techniques as the discriminating determinant. Of these outages the majority were for short periods; however there was one extended period of 21 days caused by an upgrade to the radar system that resulted in an undetected change to system settings that controls transfer of radar data into the NFPMS. This outage however occurred during the period of reduced flying activity in December 2016. The periods of outage were:
a. 0738 hrs 6 Feb 16 to 1146 hrs 07 Feb 16
b. 1002 hrs 11 May 16 to 1209 hrs 14 May 16

Australian Super Hornet Annual Noise Report 2016
Page 6
c. 0826 hrs 22 Jun 16 to 1539 hrs 23 Jun 16
d. 0817 hrs to 1452 hrs 21 Sep 16
e. 1312 hrs 10 Dec 16 to 2359 hrs 31 Dec 16

Australian Super Hornet Annual Noise Report 2016
Page 7
EVALUATION OF FLIGHT PATHS
16. The evaluation of flight paths for the calendar year 2016 was undertaken against the requirements contained in the Australian Super Hornet Noise Management plan Version 3.01. These flight paths are unchanged from the previous version of the noise management plan. The following elements of the plan have been assessed using the NFPMS data:
a. departure paths
b. arrival paths
c. altitude limitations
d. number and timing of Super Hornet movements.
Amberley runway orientation
17. Figure 2 shows the runway orientation at RAAF Amberley.
Figure 2. RAAF Amberley runway orientation
Departure paths
18. Standard Super Hornet departure flight paths flown in 2016 are illustrated in Annex A. Departure paths are predominately flown with turns to the west of the centreline of the runway to minimise noise impact on the western suburbs of Ipswich whilst gaining altitude. Departures from Runway 33, facing to the north-west, are required to maintain runway heading (no turn) until reaching 7.4 kilometres to minimise the noise impact on the Walloon and Thagoona townships. Figure 3 shows the departure tracks from RAAF Amberley in 2016. This demonstrates a robust adherence to the departure routing requirements specified in the Noise Management Plan over the year.
1 Promulgated December 2015 and approved by Department of Environment in April 2016.
N

Australian Super Hornet Annual Noise Report 2016
Page 8
Figure 3. Super Hornet departures plot 2016
19. Turn to the right after takeoff runway 33. The Noise Management Plan requires that departures from runway 33 to training airspace to the west, south and south east of Amberley turn to the west (left turn) to gain altitude before departing to the training airspace. Departures to the training airspace in the north east and east can turn right for departure after reaching the 7.4 kilometre point on runway heading. There were no departures identified in 2016 that did not adhere to this requirement.
20. Early turn after takeoff runway 33. The Noise Management Plan requires departures off runway 33 to maintain runway heading (no turn) until reaching 7.4 kilometres (4 nautical miles). In 2016 a total of 145 military fast jet departures were identified as turning to the west before reaching 7.4 kilometres on runway heading. These early turns are required in periods of bad weather when Air Traffic Control is required to turn aircraft early to manage positive aircraft separation. Early turns from Runway 33 to the west are identified in the Noise Management Plan as unforeseeable variations that can be expected from time to time due to weather and/or Air Traffic Control direction. In 2015 there were 66 Super Hornet departures that turned early after takeoff from runway 33. Early turns after takeoff from runway 33 are shown at Figure 4.
Australian Super Hornet Annual Noise Report 2016
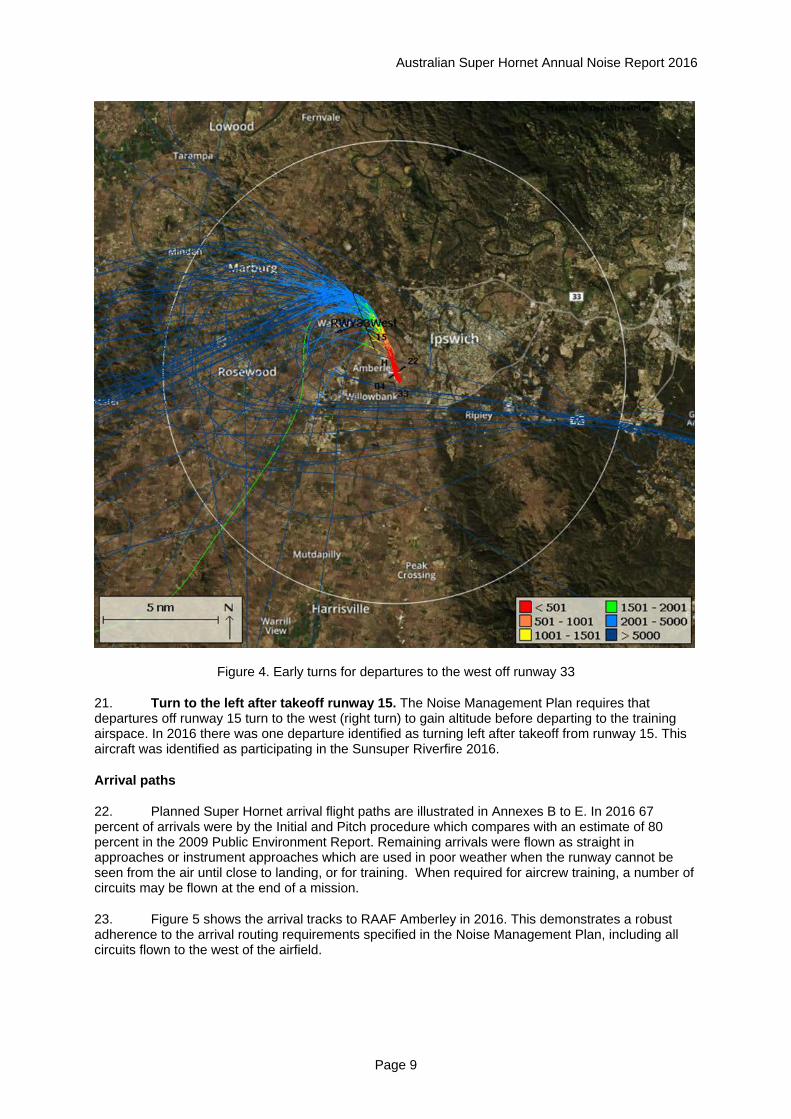
Page 9
Figure 4. Early turns for departures to the west off runway 33
21. Turn to the left after takeoff runway 15. The Noise Management Plan requires that departures off runway 15 turn to the west (right turn) to gain altitude before departing to the training airspace. In 2016 there was one departure identified as turning left after takeoff from runway 15. This aircraft was identified as participating in the Sunsuper Riverfire 2016.
Arrival paths
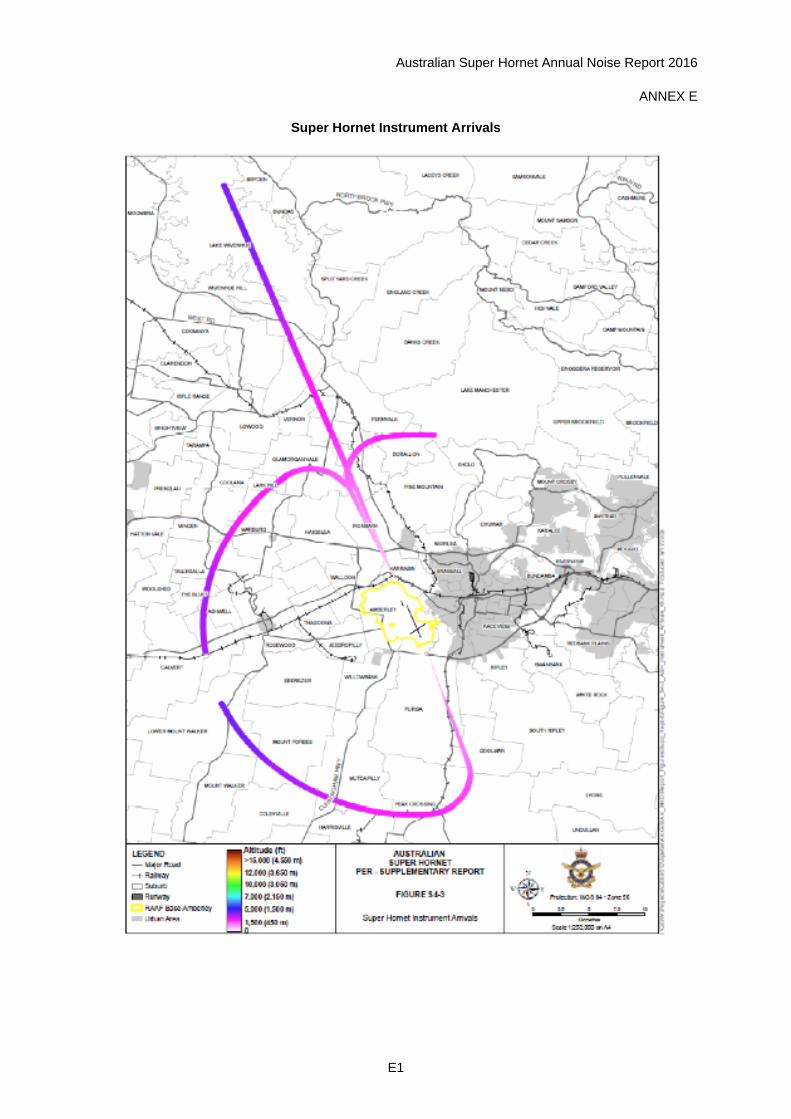
22. Planned Super Hornet arrival flight paths are illustrated in Annexes B to E. In 2016 67 percent of arrivals were by the Initial and Pitch procedure which compares with an estimate of 80 percent in the 2009 Public Environment Report. Remaining arrivals were flown as straight in approaches or instrument approaches which are used in poor weather when the runway cannot be seen from the air until close to landing, or for training. When required for aircrew training, a number of circuits may be flown at the end of a mission.
23. Figure 5 shows the arrival tracks to RAAF Amberley in 2016. This demonstrates a robust adherence to the arrival routing requirements specified in the Noise Management Plan, including all circuits flown to the west of the airfield.

Australian Super Hornet Annual Noise Report 2016
Page 10
Figure 5. Super Hornet departures plot 2016
Altitude limitations
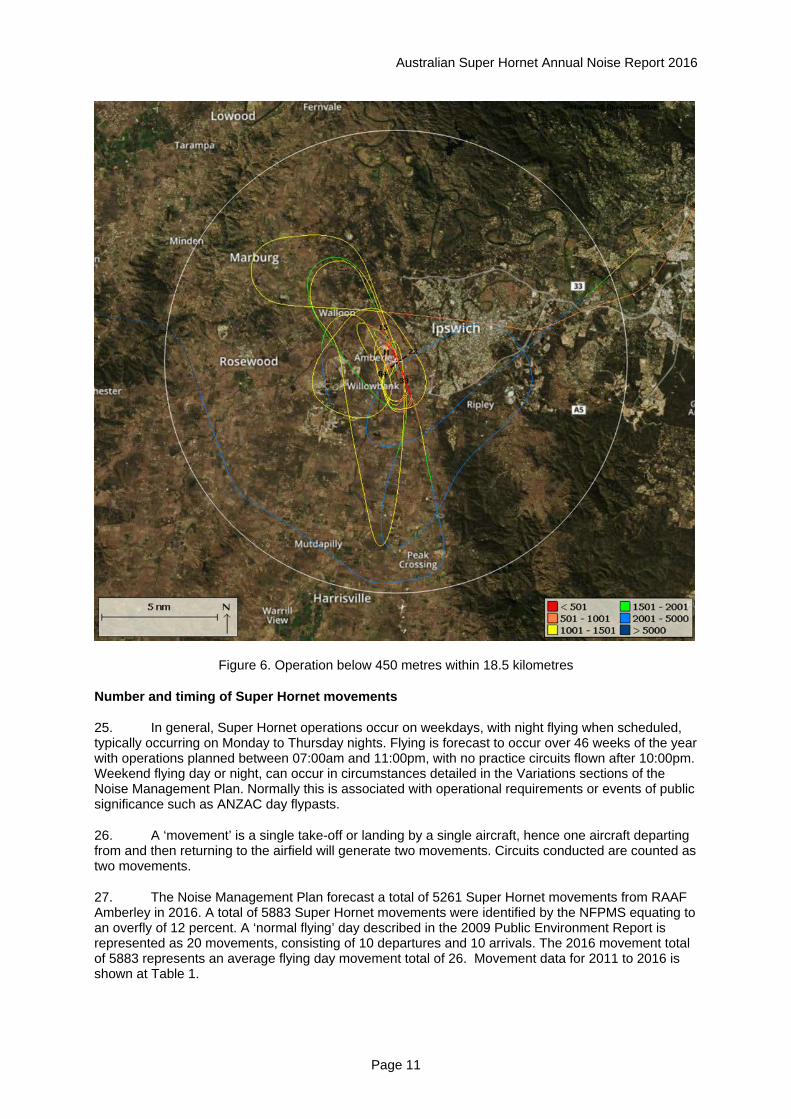
24. The Noise Management Plan limits Super Hornet aircraft to not flying below 450 metres (1,500 feet) within 18.5 kilometres (10 nautical miles) of RAAF Base Amberley, except when landing, taking off or in the circuit. Five operations were detected by the Noise and Flight Path Monitoring system operating below 1500 to the east of Amberley. Investigation determined that these aircraft were operating within the Amberley circuit area and were required to reposition by Air Traffic Control due to traffic separation requirements, prior to departing to the training airspace or landing at RAAF Amberley. Operations of this nature are a nominated unforeseeable variation covered in the Noise Management Plan. These tracks are shown in Figures 6.
Australian Super Hornet Annual Noise Report 2016
Page 11
Figure 6. Operation below 450 metres within 18.5 kilometres
Number and timing of Super Hornet movements
25. In general, Super Hornet operations occur on weekdays, with night flying when scheduled, typically occurring on Monday to Thursday nights. Flying is forecast to occur over 46 weeks of the year with operations planned between 07:00am and 11:00pm, with no practice circuits flown after 10:00pm. Weekend flying day or night, can occur in circumstances detailed in the Variations sections of the Noise Management Plan. Normally this is associated with operational requirements or events of public significance such as ANZAC day flypasts.
26. A ‘movement’ is a single take-off or landing by a single aircraft, hence one aircraft departing from and then returning to the airfield will generate two movements. Circuits conducted are counted as two movements.
27. The Noise Management Plan forecast a total of 5261 Super Hornet movements from RAAF Amberley in 2016. A total of 5883 Super Hornet movements were identified by the NFPMS equating to an overfly of 12 percent. A ‘normal flying’ day described in the 2009 Public Environment Report is represented as 20 movements, consisting of 10 departures and 10 arrivals. The 2016 movement total of 5883 represents an average flying day movement total of 26. Movement data for 2011 to 2016 is shown at Table 1.

Australian Super Hornet Annual Noise Report 2016
Page 12
Table 1. Super Hornet annual movement data
28. Respite from flying operations. The Noise Management Plan forecasts that Super Hornet operations would occur over 46 weeks of the year. Except as allowed by the approved variations specified in the plan, flying was planned to occur on weekdays with no night flying intended on Friday nights. In 2016 there were five weeks identified with no Super Hornet movements, and a further three weeks with less than 6 movements. Figure 7 shows Super Hornet movements by week in 2016.
Figure 7. Super Hornet movements by week
29. The Noise Management Plan forecast that flying operations would occur on weekdays, except as allowed in the Variations section of the plan. In 2016 there were a total of 16 movements identified by the NFMPS on Saturday and Sunday. This result compares favourably with a total of 31 weekend movements in 2015. Movements by day are shown in Figure 8.
2011 2012 2013 2014 2015 2016Noise Management Plan forecast 4648 4648 4648 4648 4648 5261Super Hornet movements 3744 4476 4481 5968 5276 5883Percentage of NMP forecast 81% 96% 96% 128% 114% 112%Average Day movements - 2009 PER 20 20 20 20 20 20Actual Average Day movements 16.3 19.5 19.5 25.9 22.9 25.6Actual Average Day Standard Deviation 8.7 11.9 13.0 10.6 11.9

Australian Super Hornet Annual Noise Report 2016
Page 13
Figure 8. Super Hornet movements by day
30. The Noise Management Plan forecast that all operations would occur between 07:00am and 11:00pm, with no practice circuits flown after 10:00pm. Additionally it was forecast in the 2009 Public Environment Report that 20 percent of movements would occur between 7:00pm and 11:00pm. In 2016, there were zero movements identified operating outside the planned flying period, and movements after 7:00pm were 9% compared to the 20% forecast. There were no circuits flown after 10:00pm in 2016.

Australian Super Hornet Annual Noise Report 2016
Page 14
EVALUATION OF SUPER HORNET NOISE IMPACT
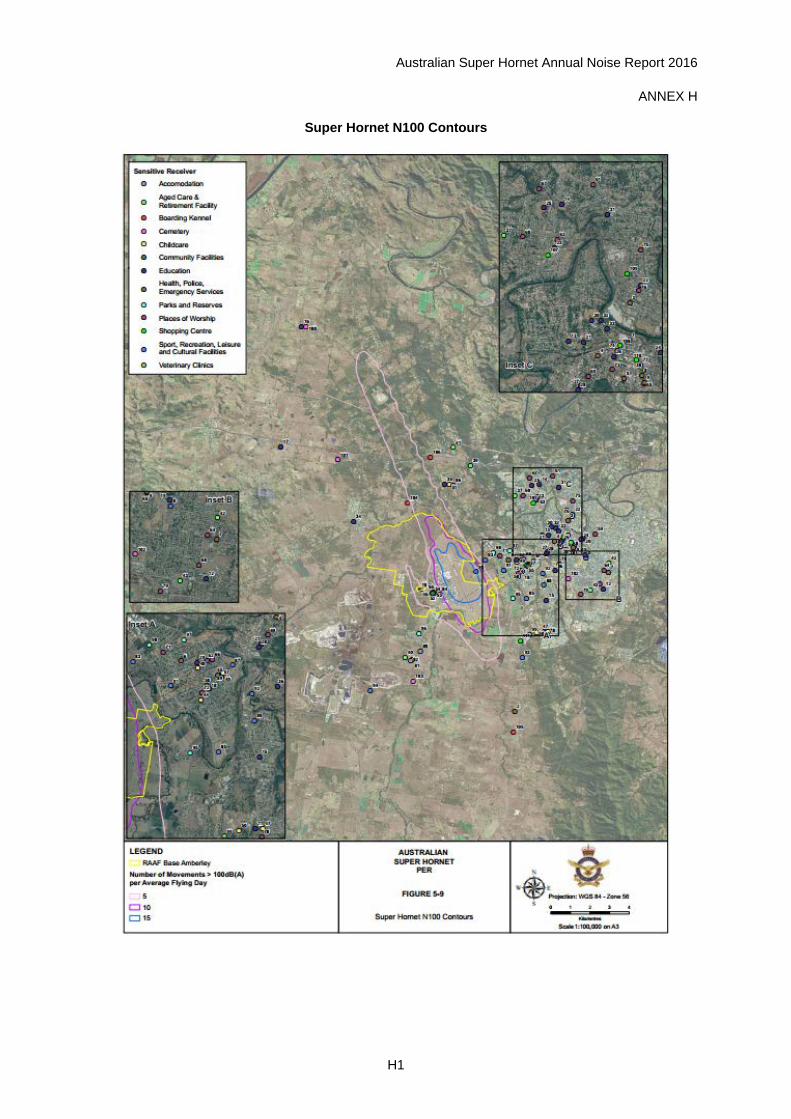
31. Noise Contour Maps were produced in the 2009 Public Environment Report. These contour maps show geographical boundaries for specified numbers of movements per average flying day that are expected to exceed a nominated noise threshold in decibels (dB). The average flying day is defined as 20 movements which is determined by dividing total annual movements in the 2009 PER (4648) by 230 flying days (5 days a week for 46 weeks). Maps for N70, N85 and N100 are shown at Annexes F to H.
32. The N70 contour map represents a noise threshold which can be likened to the noise expected from a busy restaurant or suburban traffic from the footpath. The N85 contour map represents a noise threshold that would require a person to raise their voice when talking to a person 1.2 metres away and can be likened to the noise expected from heavy city traffic. The N100 contour map represents a noise level that can be likened to the noise expected from a chainsaw or jackhammer in close proximity.
33. The Noise Management Plan version 3.0 increased the forecast annual Super Hornet movements from 4648 to 5261 based on the 2011 to 2015 annual noise reports. Analysis determined that the modelling conducted in 2009 was pessimistic in relation to the actual noise impact and therefore facilitated an increase to forecast maximum movement rate whilst remaining within the noise impact footprint modelled in 2009.
34. N70 and N85 noise events. N70 and N85 noise event data per forecast flying day2 for the four noise monitoring terminals from 2011 to 2016 is shown at Table 23. The top row of the table shows the annual movements for each year, with second and third rows showing the percentage of movements compared to the 2009 PER and the applicable NMP for each year.. Annual noise event results below the minimum forecast are shown in green font. The highest noise event value for each location over the six years is highlighted yellow.
Table 2. N70 and N85 noise event data from 2011 to 2016
35. Analysis of Table 2 identifies the following observations:
a. N70 events at Willowbank, Kholo Gardens and Walloon are below the minimum of the forecast range in every year
b. N70 events at Yamanto are within the lower half of the forecast range from 2014 to 2016 despite a peak 28 percent overfly of the 2009 PER forecast movements
2 Total annual noise events divided by 230 flying days (46 weeks at 5 days a week)
3 An event that exceeds 85 dB will also be counted as a 70dB exceedence; i.e N85 exceedences are a subset of N70 exceedences
Annual Movements 3744 4476 4481 5968 5276 5883% of 2009 PER forecast 81% 96% 96% 128% 114% 127%% of NMP forecast 81% 96% 96% 128% 114% 112%
N70 PER estimate 2011 2012 2013 2014 2015 2016Willowbank Cemetery 15 to less than 20 7.8 10.0 8.0 10.8 8.4 10.4Kholo Gardens 5 to less than 10 0.3 0.5 0.2 0.3 0.2 0.5Walloon PS 15 to less than 20 8.7 11.7 8.5 7.8 5.3 3.5Yamanto COC 15 to less than 20 13.2 15.3 12.7 17.3 15.4 16.1N85 PER estimate 2011 2012 2013 2014 2015 2016Willowbank Cemetery less than 5 1.4 1.7 1.3 1.1 0.9 0.9Kholo Gardens less than 5 0.01 0.03 0.00 0.02 0.00 0.00Walloon PS less than 5 0.48 0.6 0.4 0.4 0.4 0.5Yamanto COC 10 to less than 15 4.5 5.6 5.0 6.3 5.6 5.7

Australian Super Hornet Annual Noise Report 2016
Page 15
c. N85 events at Willowbank are more than 60 percent below the forecast maximum in every year
d. N85 events at Kholo Gardens and Walloon are more than 80 percent below than forecast maximum in every year
e. N85 events at Yamanto are more than 30 percent below the minimum of the forecast range despite the overfly of the 2009 PER forecast movements from 2014 to 2016.
36. N100 noise events. The 2009 Public Environment Report forecast zero events at all noise terminals that would exceed 100 dB. Table 3 shows annual total4 N100 noise events for each monitoring terminal location.
Table 3. N100 noise events data from 2011 to 2015
37. Analysis of Table 3 identifies that N100 noise events occurred significantly more often in 2011 and 2012 than from 2013 to 2016. Despite an increase in movements of 31 percent in 2016 compared to 2012, the number of N100 detections decreased by 85 percent at Willowbank, and remained constant at the other three NMT locations. Although the N100 contours in the PER forecast zero events at the terminal locations, review of the L(A) max charts in the PER show that the Yamanto and Willowbank terminals are relatively close to the L(A) max 100 contour, reflecting the terminals proximity to the runway. Accordingly, the small number of L(A)max 100 exceedences at these locations, representing 0.18 percent of total movements, are likely to be generated when weather conditions cause maximum noise impact, such as low overcast cloud layers, combined with strong westerly winds in respect of the Yamanto terminal.
38. Rate of noise events. Table 2 and 3 shows noise event data based on the actual total movements for that year. Table 4 below shows the Table 2 noise event data adjusted to show a rate of noise event occurrences baselined against a common movement total for each year of 4648 movements. This reflects the projected N70, N85 and N100 noise event occurrences contained within the 2009 Public Environment Report. Therefore, this data does not show actual detected noise event data per year at each terminal, but is intended to show how the rate of noise events has changed from year to year. In effect this analysis enables an assessment of the effectiveness of changes in how the Super Hornet is operated from a noise generation perspective.
4 Total events for the calendar year – not average day data events as shown in Table 2
N100 PER est TOTAL 2011 2012 2013 2014 2015 2016Willowbank Cemetery 0 show s 4 / 103.9 14 / 104.9 2 / 102.6 1 / 100.3 0 2 / 103.3Kholo Gardens 0 count/peak dB 0 0 0 0 0 0 / 88.1Walloon PS 0 0 3 / 103.7 0 0 2 / 104.9 1 / 104.9Yamanto COC 0 10 / 103.9 7 / 105.5 3 / 103.3 6 / 101.5 4 / 102.8 8 / 102.8

Australian Super Hornet Annual Noise Report 2016
Page 16
Table 4. Noise events adjusted to 4648 movements per year
39. Analysis of Table 4 identifies the following observations:
a. 2012 was the worst year for rate of N70 and N85 noise events (and N100 from Table 3)
b. Noise events at Kholo Gardens remain insignificant
c. Rate of N70 noise events at Walloon have decreased year on year from 2012
d. Rate of N70 noise events at Yamanto and Willowbank have remained relatively constant (reflecting proximity to the runway environment) and are less than the minimum of the forecast rate since 2012
e. Rate of N85 noise events at Willowbank and Walloon are less than 80 percent of forecast maximum every year
f. Rate of N85 noise events at Yamanto has remained relatively constant and is half the minimum of the forecast rate since 2014.
Annual Movements 4648 4648 4648 4648 4648 4648N70 PER estimate 2011 2012 2013 2014 2015 2016Willowbank Cemetery 15 to less than 20 9.7 10.4 8.3 8.4 7.4 9.7Kholo Gardens 5 to less than 10 0.3 0.5 0.2 0.2 0.2 0.4Walloon PS 15 to less than 20 10.8 12.2 8.8 6.1 4.7 2.7Yamanto COC 15 to less than 20 16.4 15.8 13.2 13.5 13.6 12.8N85 PER estimate 2011 2012 2013 2014 2015 2016Willowbank Cemetery less than 5 1.8 1.7 1.4 0.8 0.8 0.7Kholo Gardens less than 5 0.01 0.03 0.00 0.01 0.00 0.00Walloon PS less than 5 0.59 0.7 0.5 0.3 0.4 0.4Yamanto COC 10 to less than 15 5.6 5.8 5.2 4.9 5.0 4.5

Australian Super Hornet Annual Noise Report 2016
Page 17
CONCLUSION
40. The 2016 Australian Super Hornet Annual Noise Report evaluated the accuracy of the noise exposure modelling undertaken as part of the 2009 Public Environment Report process and monitored compliance with the Noise Management Plan developed for the Super Hornet. Data was drawn from 2016 data produced by the NFPMS installed at RAAF Base Amberley.
41. The report identifies that there was robust adherence to the flight path management procedures specified in the Noise Management Plan, and that planned periods of respite were achieved. Although the annual movement numbers in 2016 exceeded the forecast in the 2009 Public Environment Report, the noise effect of the Super Hornet across the monitoring terminals was significantly less than forecast overall, indicating that the 2009 Public Environment Report modelling was pessimistic5.
5 The pessimistic results in the 2009 Public Environment Report provided the flexibility to
increase the forecast movement rate in V3.0 of the Noise Management Plan without exceeding the forecast noise impacts. It is expected that noise effect modelling in support of the upcoming 2029 Australian Noise Exposure Forecast will provide more accurate outcomes. Lessons identified in operating the Super Hornet have been incorporated into the modelling process.

Australian Super Hornet Annual Noise Report 2016
A1
ANNEX A
Super Hornet Departure Flight Paths

Australian Super Hornet Annual Noise Report 2016
B1
ANNEX B
Super Hornet Visual Arrivals

Australian Super Hornet Annual Noise Report 2016
C1
ANNEX C
Super Hornet Initial and Pitch

Australian Super Hornet Annual Noise Report 2016
D1
ANNEX D
Super Hornet Circuit Pattern
Australian Super Hornet Annual Noise Report 2016
E1
ANNEX E
Super Hornet Instrument Arrivals

Australian Super Hornet Annual Noise Report 2016
F1
ANNEX F
Super Hornet N70 Contours

Australian Super Hornet Annual Noise Report 2016
G1
ANNEX G
Super Hornet N85 Contours
Australian Super Hornet Annual Noise Report 2016
H1
ANNEX H
Super Hornet N100 Contours

Australian Super Hornet Annual Noise Report 2016
I1
ANNEX I
Definitions
Noise Metric Description
dB The Sound Pressure Level (SPL) expressed on a logarithmic scale.
dB(A) The A-weighted dB that is frequency adjusted to replicate the sound detected by the human ear.
LAmax The single event maximum A-weighted sound level reached during an aircraft movement. LAmax low value The lowest LAmax value in a range of LAmax values for particular operations.
LAmax high value The highest LAmax value in a range of LAmax values for particular operations.
LAmax average value
The arithmetical average of a range of LAmax values from the LAmax low value to the LAmax high value for particular operations.
LAeq
The ‘equivalent noise level’ (LAeq) is the energy equivalent noise level measured in A-weighted decibels (dB(A)). It is a time- averaged sound level; a single-number value that expresses the time-varying sound level for the specified period as though it were a constant sound level with the same total sound energy as the time-varying level. Consequently the LAeq is the constant noise level that if continued over the sample period would have the same energy as the actual varying, measured sound level. The time period needs to be specified and can be one hour, 24 hours or the operational hours of the base.
Number Above (NA)
The NA contour for an airport represents the number of noise events occurring greater than a particular dB(A) level over a specified time period. As example, the N70 contour depicts the number of aircraft noise events above 70 dB(A) for an average day.