australia’s role in a global green steel transition
TRANSCRIPT

Australia’s role in a global green steel transition
Public Hearing for the for the Tahmoor South Coal Project, SSD-8445.NSW Independent Planning Commission, 15 Feb 2021
John Pye, PhD BE BSc
Associate Professor, ANU School of EngineeringANU Energy Change Institute

2
Outline
● Steel, iron ore and Australia’s role● Conventional steel vs green steel● Local advantage, sense of scale● Scenarios and outlook

3
Context
“Energy and process efficiency by themselves are insufficient” to limit warming to 1.5°C (C.2.3).
Scenarios resulting in 1.5°C of warming require at least 59% reduction in the use of coal for primary energy by 2030
Paris Agreement &IPCC Special Report SR15
IPCC 2019 http://ipcc.ch/sr15
Major pledges in 2020:● Japan● Korea● China (*2060)...all aiming for net-zero CO ₂emissions by 2050.
Also:● NSW Net Zero Plan● US rejoined Paris Agreement● EU making targets legally binding
Science https://is.gd/XRe6rWNikkei Asia https://is.gd/ldrp3qGuardian https://is.gd/soe4Y5

4
Steelmaking: a big emission source
Industry32%
Buildings26%
Transport18%
Agriculture21%
Waste3%
Bajželj, Allwood & Cullen, 2013 doi:10.1021/es400399h; cited by IPCC AR5
Emissions by sector
(2010 data)
Total 51 GtCO2e/y
19%
19%
17%6%
4%6%2%
27%
Steel
Chemicals
Cement
Non-ferrous
Food proc.
Paper
Textiles
Other
Steel
Industryemissions
(2010)
This ‘sector-based’ analysis includes both direct and indirect emissions.

5
Crude steel production
1940
1950
1960
1970
1980
1990
2000
2010
2020
2030
0
500
1000
1500
2000
Glo
ba
l pro
du
ctio
n (
Mt/y
)
2018Global crude steel production is currently 1808 Mt/a, mostly in China, India, Japan. This is up from 850 Mt/y in 2000. World Steel 2019 https://is.gd/fjhNlp
Aust Steel Inst https://is.gd/jnAOk3
Australian production 5.3 Mt/a

6
Major uses of steel
Allwood 2012; World Steel https://is.gd/K7EGVK
Metal products11 % Other
transport 5%
Buildings & infrastructure51 %
Mechanical equipment15 %
Automotive12 %
Domestic applicances 3%
Electrical equipment3%
7
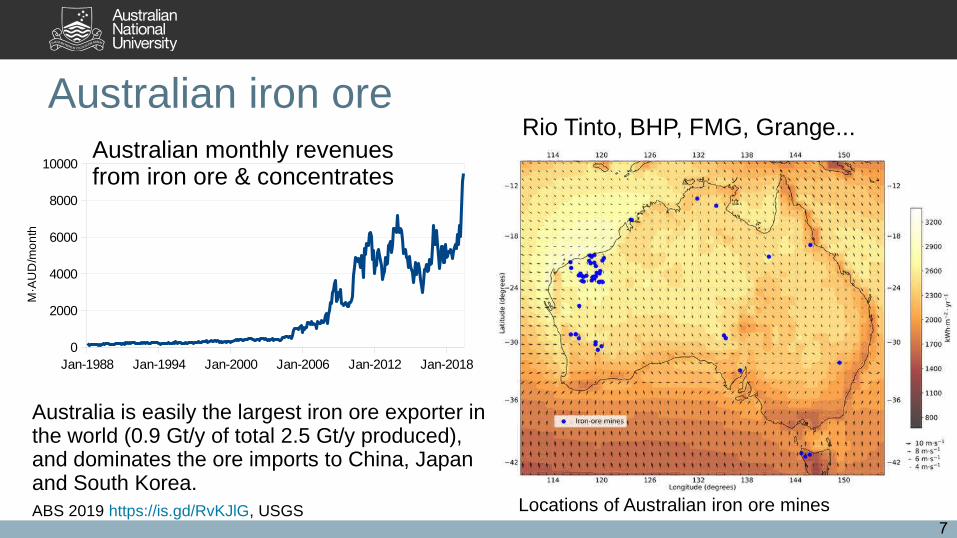
Australian iron ore
Jan-1988 Jan-1994 Jan-2000 Jan-2006 Jan-2012 Jan-20180
2000
4000
6000
8000
10000
M·A
UD
/mo
nth
ABS 2019 https://is.gd/RvKJlG, USGS
Australian monthly revenues from iron ore & concentrates
Australia is easily the largest iron ore exporter in the world (0.9 Gt/y of total 2.5 Gt/y produced), and dominates the ore imports to China, Japan and South Korea.
Locations of Australian iron ore mines
Rio Tinto, BHP, FMG, Grange...

8
Conventional steelmaking
Figure: Rahbari
1.5–2.3 tCO /t₂
0.9–1.7 tCO /t₂
0.6–1.5 tCO /t₂
~96% of production
~6% of prod.
Greenhouse gas emissions per tonne of steel produced.
Fraction of world primary (‘virgin’) steel production.

9
BF-BOF
forming/fabrication
scrap
recycled steel
ironore
line width=mass flow@global demand of 1.04 Gt
Major process stepsEnergy per year
% electricAllwood et al, 2015 (data: 2008)
Coal (coke), iron ore and flux (limestone) are piled in from the top.
Air/oxygen are pumped in near the bottom.
Molten iron and ‘slag’ flow out the bottom.

10
DRI
Direct reduced iron (DRI) is produced typically from natural gas in countries like India, Iran, Russia and Mexico.
The Midrex process is ~70% of current DRI (~5% of total crude steel), but there have been numerous related processes developed and trialled, including FINMET in Australia, Circored, HYL I and HYL III.
Typically ~40% H is used (from NG). ₂Up to 90% H has been trialled, but ₂only in isolated demo plants.
Montague/MIDREX 2012 https://is.gd/uhbKD4 Sah/Dutta doi:10.1081/E-EISA-120050996
CO + H ₂
Reformer
Natural gas
Iron ore(lump/pellets)
HBI

11
H -DRI₂
Vogl et al, JCP 2018 doi:10.1016/j.jclepro.2018.08.279
42 USD/MWhe≈35 EUR
ore, lime, scrap (0% here), alloys
O&M, labour, electrodes
electrolysisenergy
HYBRIT, SwedenSSAB, LKAB and Vattenfall
25 kgCO2e/t
Aug 2020 ‘starting the test operation’ https://is.gd/fpRGQr. 1 Mt/a demo planned 2023.

12
Other efforts
Primetals ‘HYFOR’ fluidised bed H DRI₂(~100% CO reduction)₂https://is.gd/0NOrZI
thyssenkrupp H injection ₂into BF (≤20% CO ₂reduction)https://is.gd/xHpUmx
ArcelorMittal/Midrex ‘MIDREX-H2’. Initially grey hydrogen, migrating later to green (~100% reduction in CO ). ₂https://is.gd/iBSIjT
Tata Steel EuropeHIsarna coal+CCS/CCU https://is.gd/dDB9M9 (~75% reduction in CO2?)https://is.gd/ukhzAb
Salzgitter ‘SALCOS’H DRI adddition to BF, gradually ₂replace BF/BOF with EAF (~100% CO reduction)₂
Boston MetalDirect electrolytic ironmaking (early days!)https://is.gd/FKrGVS
ArcelorMittal ‘SIDERWIN’ electrowinning process, low temperature (early days!)https://is.gd/nGQR2O

13
A local advantage?
Direct Normal Irradiance (CSP) Global Horizontal Irradiance (PV)
Australia has very good ore and excellent solar resource co-located. Current production, dominantly China, would have to pay for shipping, transmission and higher(?)-cost power to compete with local Australian production

14
Cost of solar energy
AT Kearney 2010 / ESTELA
Eastern China
PilbaraInland China
Relative reduction in LCOE (for CSP) as a function of the solar resource. PV trend is very similar.
Electricity could be as much as 30% cheaper in the Pilbara compared to Eastern China, excluding storage costs.

15
Lev
elis
ed c
ost
of
stee
l
BloombergNEF, Mar 2020 https://is.gd/EccBCN
Cost projectionsBig changes! ~90% reductions in cost of photovoltaic solar power and wind power over the last 10 years.~40% reduction in alkaline electrolysers in Europe the last 5 years; even more in China.Green hydrogen projected to overtake blue from ~2030.

16
Sense of scale
To process all of Australia’s export ore into steel using hydrogen reduction would require 1500 TWh/y, about 7× our current electricity demand on the NEM.
But ensuring that electricity/hydrogen supply could be properly matched to steelmaking demand would require large amounts of energy storage.
Note emerging large projects Asian Renewable Energy Hub (AREH) and Suncable.
ANU https://is.gd/8gPWKo

17
How else could it go?
‘Blue’ hydrogen fron NG + CCS
Nuclear power for H production₂
Offshore wind
Long-range HVDC
H on ships₂
Biomass-fired ironmaking
CO electrolysis₂
More recycling
Material efficiency
Material substitution
Different configurations: ironmaking can be remote from the steelmaking stage, eg via shipping of hot briquetting iron (HBI), as previously in the Boodarie HBI plant (Port Hedland)
Markets for green steel?

18
Economic considerations
● Processing all our exported iron ore in Australia, and selling steel instead of iron ore could contribute $200B or more to our economy.
● If we transition away from coal, this would more than cover the income hole.
Cost breakdown (2015)
Raw Material Energy & reductant
Labour & overheads
Capital charges
Total cost
Australian breakdown 31% 25% 28% 15% 100%
World cost breakdown 40% 27% 21% 12% 100%
However, we do need to evaluate the economic conditions carefully, in contrast to the scenarios in Japan, Korea, China and India.
DIIS, 2016 (Sub. #18, Future of Australia’s Steel Industry) https://is.gd/a2Yl3z

19
Sectoral decarbonisation
Business as usual
DRI-EAF
Scrap-EAF
BF-BOF
DRI-EAF H -DRI₂
EWPE
Scrap-EAF
BF-BOF
Zero-carbon scenario
Question: are breakthrough technologies required before the steelmaking industry can align itself with the Paris Agreement target of 1.5°C of warming?
ANUhttps://is.gd/8gPWKo

20
Sectoral decarbonisation scenarios
Our findings to date are that optimistic deployment of CCS and top gas recycling alone would not be consistent with 1.5°C of warming, and that breakthrough technologies are required.
Only fully decarbonised green steel is consistent with Paris Agreement targets.
(+1.75°C)
(+2°C)
Venkataraman 2019, ANUhttps://is.gd/8gPWKo

21
Key points here:
● From 2030, H ironmaking is forecast to start becoming competitive. ₂Multiple major commercialisation efforts.
● Under these conditions, the urgency for securing a long-term coking coal supply could be questioned.
● Australian iron ore and steel producers should be (and are) looking to benefit from local advantages from our coincidence of natural and renewable energy resources for a local green steel industry.
● Arguably, insisting on the highest environmental standards in our mining approvals will only help to the accelerate the green steel transition, and increase Australia’s eventual competitiveness in this space.

22
I would like to acknowledge the invaluable input fromAlireza RahbariMahesh VenkataramanFrank JotzoEmma AisbettZsuzsanna CsereklyeiKen BaldwinGeoff BrooksRod DryLunar flux mapping at ANU SG4 big dish Photo: Martin Kaufer