authors mithu debnath, giacomo valerio iungo, w. alan
TRANSCRIPT

AuthorsMithu Debnath, Giacomo Valerio Iungo, W. Alan Brewer, Aditya Choukulkar, Ruben Delgado, Scott Gunter,Julie K. Lundquist, John L. Schroeder, James M. Wilczak, and Daniel Wolfe
This article is available at CU Scholar: https://scholar.colorado.edu/atoc_facpapers/25

Atmos. Meas. Tech., 10, 1215–1227, 2017www.atmos-meas-tech.net/10/1215/2017/doi:10.5194/amt-10-1215-2017© Author(s) 2017. CC Attribution 3.0 License.
Assessment of virtual towers performed with scanning windlidars and Ka-band radars during the XPIA experimentMithu Debnath1, Giacomo Valerio Iungo1, W. Alan Brewer2, Aditya Choukulkar2, Ruben Delgado3, Scott Gunter4,Julie K. Lundquist5,6, John L. Schroeder7, James M. Wilczak2, and Daniel Wolfe8
1Wind Fluids and Experiments (WindFluX) Laboratory, Mechanical Engineering Department,The University of Texas at Dallas, Richardson, TX, USA2National Oceanic and Atmospheric Administration, Earth Sciences Research Laboratory, Boulder, CO, USA3Atmospheric Physics Department, University of Maryland Baltimore County, Baltimore, MD, USA4Department of Earth and Space Sciences, Columbus State University, Columbus, GA, USA5National Renewable Energy Laboratory, Golden, CO, USA6Department of Atmospheric and Oceanic Sciences, University of Colorado at Boulder, Boulder, CO, USA7Department of Geosciences, Texas Tech University, Lubbock, TX, USA8Physical Sciences Division, National Oceanic and Atmospheric Administration, Boulder, CO, USA
Correspondence to: Giacomo Valerio Iungo ([email protected])
Received: 1 October 2016 – Discussion started: 14 October 2016Revised: 1 March 2017 – Accepted: 7 March 2017 – Published: 29 March 2017
Abstract. During the eXperimental Planetary boundarylayer Instrumentation Assessment (XPIA) campaign, whichwas carried out at the Boulder Atmospheric Observatory(BAO) in spring 2015, multiple-Doppler scanning strate-gies were carried out with scanning wind lidars and Ka-band radars. Specifically, step–stare measurements were col-lected simultaneously with three scanning Doppler lidars,while two scanning Ka-band radars carried out simulta-neous range height indicator (RHI) scans. The XPIA ex-periment provided the unique opportunity to compare di-rectly virtual-tower measurements performed simultaneouslywith Ka-band radars and Doppler wind lidars. Furthermore,multiple-Doppler measurements were assessed against sonicanemometer data acquired from the meteorological tower(met-tower) present at the BAO site and a lidar wind pro-filer. This survey shows that – despite the different technolo-gies, measurement volumes and sampling periods used forthe lidar and radar measurements – a very good accuracy isachieved for both remote-sensing techniques for probing hor-izontal wind speed and wind direction with the virtual-towerscanning technique.
1 Introduction
The increasing need of monitoring the atmospheric bound-ary layer for a broad range of technological and scientificpursuits – such as for meteorology (Banta et al., 2002; Cal-houn et al., 2006; Emeis et al., 2007; Horanyi et al., 2015;Vanderwende et al., 2015; Bonin et al., 2015), renewableenergy (Thresher et al., 2008; Jones and Bouamane, 2011;Iungo et al., 2013; Aitken et al., 2014; Iungo, 2016) and airtraffic management (George and Yang, 2012; Smalikho andBanakh, 2015) – has led to a rapid development of remote-sensing measurement techniques, such as wind lidars (Court-ney et al., 2008; Cariou, 2015; Simley and Pao, 2012; Iungoand Porté-Agel, 2013, 2014) and radars (Farnet and Stevens,1990; O’Hora and Bech, 2007; Hirth and Schroeder, 2013;Hirth et al., 2015). Compared to classical meteorologicaltowers, remote-sensing instruments allow easier deployment,enhanced capability of varying deployment locations and po-tentially lower costs.
A Doppler-based remote-sensing instrument allows mea-surements of the wind velocity component parallel to the di-rection of the emitted wave source, e.g., a laser beam for alidar or radio waves for a radar. The measured wind veloc-ity, which is referred to as radial or line-of-sight velocity, is
Published by Copernicus Publications on behalf of the European Geosciences Union.
1216 M. Debnath et al.: Assessment of virtual towers performed with wind lidars and Ka-band radars
proportional to the Doppler shift on the backscattered sig-nal generated by the aerosol suspended in the atmosphere(Pena et al., 2013). Measurements of multiple velocity com-ponents with a single lidar or radar have been typically per-formed by sequentially sensing different locations of a mea-surement volume, and assuming flow homogeneity withinthe measurement volume. This constraint entails limitationson the size of the measurement volume and applicability ofthese scanning strategies in the presence of significant flowheterogeneity, such as for measurements over complex ter-rain (Bingöl et al., 2009) and wind turbine wakes (Lundquistet al., 2015).
To overcome limitations connected with multiple-component velocity measurements performed with a singleinstrument, multiple-Doppler scanning strategies have beenexplored, which require the simultaneous availability of mul-tiple instruments (Newsom et al., 2005; Mikkelsen et al.,2008; Mann et al., 2009; Carbajo-Fuertes et al., 2014; Deb-nath et al., 2017; Choukulkar et al., 2017). Multiple-Dopplerscans consist of probing the wind velocity field at a spe-cific location with various non-parallel line-of-sight veloci-ties in order to characterize the 3-D nature of the atmosphericboundary layer wind field, such as in the presence of windshear, veer or wakes produced by upwind obstacles (e.g.,wind turbines, buildings, topography), or stratified wind tur-bulence (Segalini and Arnqvist, 2015). The number of inde-pendent non-parallel line-of-sight velocities should be equalto or larger than the number of required velocity components(Newsom et al., 2008; Hill et al., 2010; Carbajo-Fuertes et al.,2014). For a specific site, at each measurement point it ispossible to optimize azimuthal and elevation angles of thevarious line-of-sight directions in order to minimize the errorin the retrieval of the three Cartesian velocity components(Debnath et al., 2017). It is noteworthy that the accuracy ofthe retrieved velocity components is a function not only ofthe experimental setup but also of the accuracy of the in-dividual instruments. Accuracy in the retrieval of the threewind velocity components is a function of the norm of a ma-trix including trigonometric functions of elevation and az-imuthal angles of the measured line-of-sight velocities (Deb-nath et al., 2017).
The virtual-tower measurements presented in this paperare part of the eXperimental Planetary boundary layer In-strument Assessment (XPIA) field study, which was fundedby the U.S. Department of Energy within the Atmosphereto Electrons (A2e) program to estimate accuracy and capa-bilities of various remote-sensing techniques for the charac-terization of complex atmospheric flows in and near windfarms. The XPIA experiment was carried out at the Na-tional Oceanic and Atmospheric Administration (NOAA),Boulder Atmospheric Observatory (BAO), near Erie, Col-orado, for the period 2 March–31 May 2015. An overviewof the field campaign is provided in Lundquist et al. (2016),while a detailed analysis of several multiple-Doppler scan-ning strategies performed with scanning lidars was provided
in Choukulkar et al. (2017), and vertical profiles of the threewind velocity components performed with triple RHI scanswere presented in Debnath et al. (2017).
The XPIA experiment provided the unique opportunityof having available two Ka-band radars and three scan-ning wind lidars with the capability of performing multiple-Doppler measurements. To the authors’ knowledge, this isthe first time that virtual towers performed with Ka-bandradars and scanning lidars are analyzed through a directintercomparison. Furthermore, validation of the multiple-Doppler measurements was performed against wind veloc-ity data acquired from sonic anemometers, which were in-stalled throughout the height of the meteorological tower(met-tower) present at the BAO site, and a lidar profiler aswell.
The remainder of the paper is organized as follows: a de-scription of the instruments deployed for this experiment isprovided in Sect. 2. The data retrieval and assessment ofthe horizontal wind speed and wind direction from dual-Doppler RHI scans performed with two Ka-band radars aredescribed in Sect. 3, while a similar survey is then performedfor the triple-Doppler step–stare scans carried out with threescanning lidars (Sect. 4). Subsequently, an intercomparisonbetween lidar and radar virtual-tower measurements is de-scribed in Sect. 5. Finally, concluding remarks are reportedin Sect. 6.
2 Experimental setup and measurement procedures
The instrumentation deployed for the XPIA experiment com-prised sonic anemometers installed over the BAO met-tower,profiling lidars, radiosonde launches, microwave radiometersand two scanning Ka-band radars. Moreover, five scanningDoppler wind lidars were deployed to explore novel scanningstrategies for the characterization of atmospheric boundarylayer flows. The multiple-Doppler measurements performedwith three scanning wind lidars and two scanning Ka-bandradars, which is the focus of this paper, represent one task ofa broader test matrix. More details about the XPIA campaigncan be found in Lundquist et al. (2016). Virtual-tower mea-surements over the lidar supersite location (Fig. 1) were per-formed from 19:00 UTC on 24 March 2015 until 23:00 UTCon 31 March 2015. Wind data from one lidar were not avail-able for the period 27–28 March 2015 due to a connectiv-ity technical issue. The data set presented in this paper isthe result of a quality control process, which is a functionof aerosol condition and carrier-to-noise ratio of the mea-sured line-of-site velocities. The presented wind data are par-ticularly valuable for assessment purposes due to the broadvariability that occurred both in wind speed, from 0 up to20 m s−1, and wind direction, which varied through the fullcircle of the wind rose
The BAO met-tower was built in 1977 to investigate theplanetary boundary layer (Kaimal and Gaynor, 1983). This
Atmos. Meas. Tech., 10, 1215–1227, 2017 www.atmos-meas-tech.net/10/1215/2017/
M. Debnath et al.: Assessment of virtual towers performed with wind lidars and Ka-band radars 1217
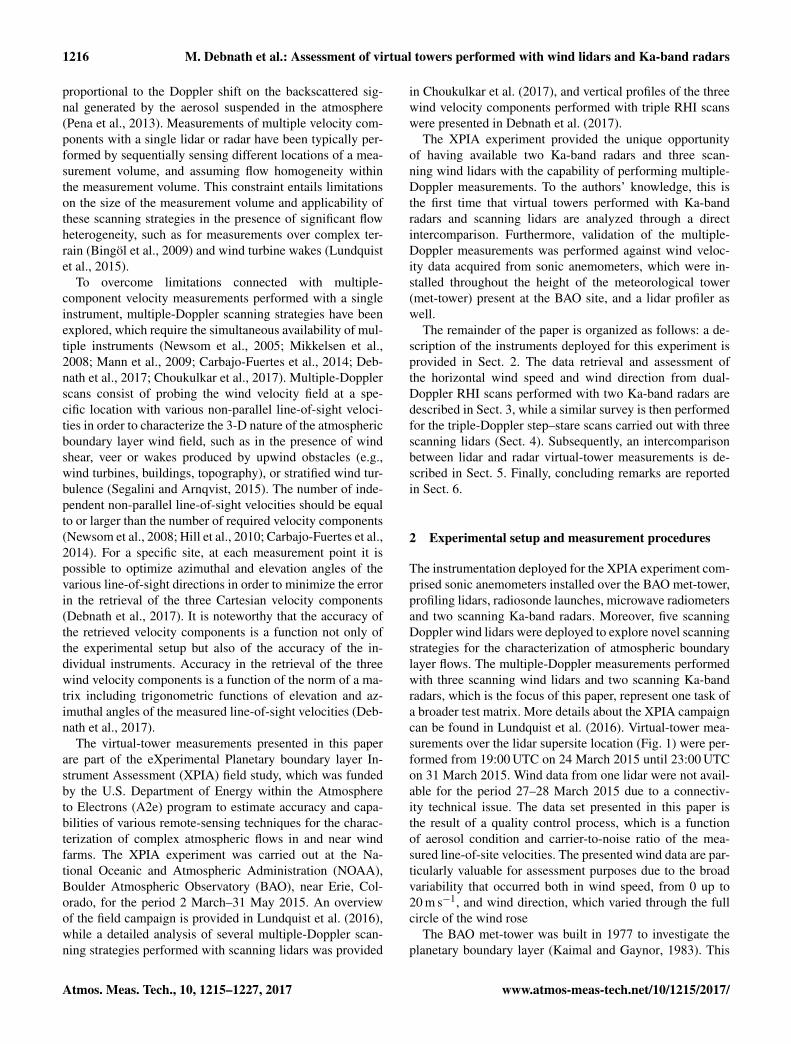
Figure 1. Map of the setup for the virtual-tower measurements per-formed over the lidar supersite location during the XPIA experi-ment.
300 m tall tower has three legs spaced 3 m apart, and it isinstrumented with temperature and relative humidity sen-sors at 10, 100 and 300 m above ground level (a.g.l.), while12 CSAT3 3-D sonic anemometers by Campbell Scientificwere installed at 50, 100, 150, 200, 250 and 300 m a.g.l. Sixanemometers were installed on booms pointing NW (334◦),which are denoted as NW sonic anemometers, while sixother anemometers were installed on SE booms (154◦), de-noted as SE sonic anemometers. Most of the booms were4.3 m long, while at the 250 m level the SE boom was 3.3 mlong. The sonic anemometers collected data with a sam-pling frequency of 20 Hz, which were then tilt-corrected fol-lowing the method proposed in Wilczak et al. (2001). Thesonic anemometers were calibrated for the XPIA experi-ment by Campbell Scientific, with measurement resolution(maximum offset error) of 0.1 cm s−1 (8 cm s−1) for the hor-izontal wind speed and 0.05 cm s−1 (4 cm s−1) for the ver-tical velocity. It is noteworthy that the sonic anemometerscan experience wake effects produced from the met-towerfor specific wind directions, i.e., between 111 and 197◦ forthe NW anemometers, and between 299 and 20◦ for the SEanemometers (see McCaffrey et al. (2017) for a more de-tailed discussion).
Vertical profiles of the three velocity components wereperformed with the WLS-16 Leosphere Windcube Off-shore 8.66 profiling lidar, which is denoted as V2 lidar andhas an absolute mean deviation smaller than 0.1 m s−1 inwind speed and smaller than 2◦ in wind direction. Windvelocity measurements were carried out with the Dopplerbeam-swinging (DBS) technique (Courtney et al., 2008; Raoet al., 2008) with an elevation angle from vertical of 28◦,with a sampling frequency of 1 Hz and with the range gatescentered at 11 vertical heights (40, 50, 60, 80, 100, 120, 140,
150, 160, 180, 200 m). The profiler lidar was deployed at thelocation referred to as the lidar supersite (Fig. 1), whose GPScoordinates are reported in Table 1.
Two Texas Tech University Ka-band (8.6 mm wavelength)mobile Doppler radars (Hirth and Schroeder, 2013; Hirthet al., 2015; Gunter et al., 2015) were deployed during XPIA.These Ka-band radars were designed to operate in a vari-ety of weather conditions, including precipitation and clearair. As for most radars, data quality and maximum range aretypically greatest during periods of precipitation. In such en-vironments, the maximum range of data can often exceed20 km (depending on the employed scanning parameters fora given experiment). Data quality and maximum range tendto be reduced in clear-air conditions, but the magnitude ofthe reduction is highly dependent upon the concentrationof clear-air scatters (e.g., dust, insects). Typical ranges inclear air can vary between 3 and 10 km. Late spring, sum-mer and early fall typically provide the best clear-air envi-ronments, with biological scatterers being limited during theremaining portions of the year. The accuracy of the dual-Doppler virtual towers from radar data has been shown tobe fairly consistent across different atmospheric conditionsabove approximately 50 m a.g.l. (Gunter et al., 2015). Belowthis level, dual-Doppler wind speeds tended to be slightlyoverestimated in heavy precipitation (Gunter et al., 2015).During the XPIA experiment, the Ka-band radars were onsite for 30 days. Atmospheric conditions allowed for qual-ity dual-Doppler data collection on 17 days. Data set lengthswere largely dependent upon data quality and project objec-tives. During this time, the following radar scanning param-eters were employed: pulse repetition frequency of 15 kHz,pulse width of 20 µm s and range resolution of 15 m. Radar 1(radar 2) was deployed 3.192 km (3.9 km) northwest (north)of the BAO tower (Fig. 1). Considering the 0.33◦ half-powerbeam width of the radars, these distances yielded an az-imuthal resolution of 18 m (22.5 m) for radar 1 (radar 2) atthe BAO tower location. Simultaneous RHI scans were per-formed by focusing both radars over the lidar supersite loca-tion by setting the radar azimuthal angles reported in Table 1,sampling rate equal to 5 Hz and sampling period of 3.3 s. Forthe 25 March 2015 data set, virtual-tower data were collectedat the onset of precipitation and persisted for 113 min beforeswitching scanning strategies to accomplish additional ob-jectives. After quality control, analysis of the radar measure-ments, wind data from the two Ka-band radars for the period13:20 to 15:07 UTC on 25 March and for heights rangingfrom 10 to 490 m height with 20 m interval were availablefor this particular study.
Three Leosphere Windcube 200S scanning Doppler windlidars (University of Texas at Dallas (UTD), NOAA Dalek1, NOAA Dalek 2) were deployed for this experiment. Windmeasurements were performed by means of eye-safe laserwith a pulse energy of 0.1 mJ, a wavelength of 1.54 µm and apulse length of 200 ns. Measurements were acquired by usingan accumulation time of 0.5 s and gate length of 50 m. Loca-
www.atmos-meas-tech.net/10/1215/2017/ Atmos. Meas. Tech., 10, 1215–1227, 2017

1218 M. Debnath et al.: Assessment of virtual towers performed with wind lidars and Ka-band radars
Table 1. GPS locations of the three scanning Doppler wind lidars, wind lidar profiler, Ka-band radars and BAO tower.
Longitude Latitude Elevation Distance Azimuth(m) angle (◦)
UTD 105◦00′03.99′′W 40◦03′02.32′′ N 1578 m 322 234.93Dalek 1 105◦00′55.64′′W 40◦02′51.75′′ N 1578 m 985 85.95Dalek 2 105◦00′20.65′′W 40◦02′43.09′′ N 1585 m 422 29.7BAO tower 105◦00′13.82′′W 40◦02′00.13′′ N 1579 m 134 181Ka-band radar 1 105◦02′13.85′′W 40◦03′43.70′′ N 1548 m 3192 118Ka-band radar 2 104◦59′2.98′′W 40◦04′49.51′′ N 1538 m 3900 204Lidar supersite 105◦00′14.36′′W 40◦02′55.72′′ N 1580 m – –
tions of the three scanning Doppler wind lidars are shownin Fig. 1, while their GPS positions, azimuthal angles anddistance with respect to the virtual-tower location are re-ported in Table 1. Accuracy in the radial velocity of eachscanning lidar is always better than 0.3 m s−1 for carrier-to-noise ratio higher than −25 dB for the line-of-sight ve-locity (Choukulkar et al., 2017). Squareness, precision andrepeatability tests indicate an absolute pointing accuracy ofabout 0.15◦. All the scanning lidars performed fixed-pointmeasurements at different heights over the lidar supersite lo-cation (Fig. 1) during the time period 00:00–24:00 UTC on25 March 2015. Lidar measurements were performed at sixdifferent heights from 100 to 200 m with 20 m steps.
For the measurements performed on 25 March 2015, themaximum and minimum range for scanning Doppler lidarsvaried from 300 up to 3000 m, while the carrier-to-noise ra-tio was between −50 and 3 dB. The collected lidar data werefurther post-processed only when the carrier-to-noise ratioof the lidar signal was larger than −25 dB (Carbajo-Fuerteset al., 2014). The post-processing from the three radial ve-locities (Ur) to Cartesian wind velocity components (U , V ,W ) was carried out following the standard triple-Doppler re-trieval (Mikkelsen et al., 2008; Mann et al., 2009; Carbajo-Fuertes et al., 2014; Debnath et al., 2017; Choukulkar et al.,2017; Simley et al., 2016) by means of the following equa-tions:[
UVW
]=
[cos(φUTD) ∗ cos(θUTD) cos(φUTD) ∗ sin(θUTD) sin(φUTD)
cos(φD1) ∗ cos(θD1) cos(φD1) ∗ sin(θD1) sin(φD1)cos(φD2) ∗ cos(θD2) cos(φD2) ∗ sin(θD2) sin(φD2)
]−1
×
UUTDrUD1
rUD2
r
, (1)
where φ and θ represent elevation and azimuthal angles, re-spectively, of the various lidars indicated as a suffix. The ac-curacy in the retrieval of the three velocity components wasestimated for the different heights through theL2 norm of therows of the matrix in Eq. (1), including trigonometric func-tions of φ and θ of the various lidars. Error in the velocityretrieval increases as the L2 norm of the rows of the matrixin Eq. (1) diverges from 1; however, the values obtained withthis criterion do not represent any error quantification andcan only be used for a comparative analysis and selection ofoptimal lidar configurations (Simley et al., 2016). In Table 2,
Table 2. Error analysis on the retrieval of the wind velocity compo-nents from triple-Doppler lidar measurements for different heightsconsequent to azimuthal and elevation angles of the three lidars.Values are dimensionless.
Height (m) U V W
100 0.9984 1.3421 2.6096120 1.0015 1.3541 2.2071140 1.0052 1.3682 1.9242160 1.0094 1.3843 1.7157180 1.0142 1.4023 1.5567200 1.0195 1.4222 1.4323
it is shown that for this setup the accuracy in the retrieval ofthe horizontal wind speed components is roughly unchangedfor the different heights, while accuracy is improved withincreasing heights for the vertical velocity, which is conse-quence of the higher elevation angles of the three lidars.
For each height of the virtual tower and each lidar, theclosest range gate to the considered measurement point isselected for the data retrieval. The maximum horizontal dis-tance of a gate centroid from the respective tower measure-ment point is 19 m, while the vertical one is always smallerthan 10 m. The sampling period at each measurement pointwas 25 s, while the total time required to perform one virtualtower was on average 151.6 s. The lidars used for the XPIAfield campaign are commercial lidars operated with a graph-ical user interface (GUI) provided by the lidar manufacturer.This GUI did not allow the control and synchronization of thelidars through a master computer; thus, at each measurementlocation the overlapping time was generally smaller than theprefixed period of 25 s. A histogram of the overlapping timeis reported in Fig. 2, which shows a mean value of 16.3 s anda standard deviation of 3.6 s.
Bias errors in laser pointing and in the line-of-sightvelocity, which were evaluated through preliminary tests(Lundquist et al., 2016) and reported in Table 3, were con-sidered for the data retrieval. An estimate of the azimuthalbias from the north for each lidar was retrieved through hard-target tests performed by hitting reference towers present onsite with the lidar laser beam, and using their GPS coordi-
Atmos. Meas. Tech., 10, 1215–1227, 2017 www.atmos-meas-tech.net/10/1215/2017/

M. Debnath et al.: Assessment of virtual towers performed with wind lidars and Ka-band radars 1219
Figure 2. Histogram of the overlapping time of the step–stare measurements among the three lidars.
Table 3. Bias errors used for the triple-Doppler data retrieval.
Scanner Azimuth Elevation losheight (◦) (◦) velocity
(m) (m s−1)
UTD 1.37 4.93 −0.89 0.6Dalek 1 1.37 3.45 0.0 0.0Dalek 2 1.37 7.70 0.0 0.0
nates with respect to the lidar location. A bias in the radialvelocity of the UTD lidar was due to improper calibration ofthe frequency chirp in the laser pulse, which was stable andreproducible in several tests, and could simply be subtractedout of the lidar measurements.
We note that the sonic anemometers can experiencewake effects from the tower for specific wind directions,i.e., 111◦≤ θ ≤ 197◦ for the NW anemometers and 299◦≤θ ≤ 20◦ for the SE anemometers (Lundquist et al., 2016; Mc-Caffrey et al., 2017). For this experiment, wind direction var-ied between 360 and 0◦, which indicates that the SE and NWanemometers might be affected by wake effects for certainperiod of time.
3 Assessment of radar virtual-tower measurements
Assessment of the lidar and radar virtual towers is performedagainst the wind velocity components acquired through thesonic anemometers deployed throughout the height of theBAO met-tower and vertical profiles of the 3-D wind veloc-ity sampled with a lidar profiler deployed at the lidar super-site location. These data acquired are shown in Fig. 3 forthe height of 150 m. In this figure, ranges of the wind direc-tion for which the sonic anemometers may experience towerwake effects are reported with shaded areas (Lundquist et al.,2016; McCaffrey et al., 2017). For few time stamps, somedifferences are observed for the wind data obtained from thetwo sonic anemometers, which might be a consequence ofthe statistical steadiness of the acquired wind signals and theduration of the measurement sampling period. A generallygood agreement is observed among the different instruments
Table 4. Linear regression analysis among the V2 lidar, SE sonicanemometer and NW sonic anemometer data for 24 h data reportedin Fig. 3.
Height Uh R2 Wind dir. R2
(m) (slope) (slope)
SE sonic vs. NW sonic
100 0.97 (1.00) 0.97 (1.06)150 0.97 (1.00) 0.97 (1.07)200 0.98 (1.00) 0.96 (1.08)All heights together 0.97 (1.00) 0.97 (1.07)
V2 lidar vs. NW sonic
100 0.92 (0.94) 0.88 (0.96)150 0.91 (0.93) 0.92 (1.00)200 0.86 (0.80) 0.94 (0.96)All heights together 0.90 (0.90) 0.91 (0.97)
V2 lidar vs. SE sonic
100 0.92 (0.93) 0.89 (0.90)150 0.90 (0.93) 0.93 (0.96)200 0.76 (0.77) 0.96 (0.97)All heights together 0.90 (0.91) 0.91 (0.92)
for both horizontal wind speed, Uh, and wind direction forthe entire duration of the experiment.
In order to perform comparison and linear regression anal-ysis between wind data acquired from different instruments,data acquired from instruments with a higher sampling fre-quency are averaged over the corresponding sampling pe-riod of instruments with a lower sampling frequency. Forinstance, sonic anemometer data acquired with a samplingfrequency of 20 Hz are averaged over periods with a dura-tion of 1 s for comparison with V2 lidar data acquired with asampling frequency of 1 Hz.
Linear regression analysis performed between sonicanemometer and the V2 lidar data generally shows a goodcorrelation among the different instruments for the differentheights. In Table 4, the slope and R2 values resulting fromthe linear regression analysis are reported for the differentheights and as overall ensemble statistics. It is noteworthythat Tables 4 and 5 include sonic anemometer data acquired
www.atmos-meas-tech.net/10/1215/2017/ Atmos. Meas. Tech., 10, 1215–1227, 2017

1220 M. Debnath et al.: Assessment of virtual towers performed with wind lidars and Ka-band radars
Figure 3. Wind velocity data acquired from sonic anemometers and lidar profiler at 150 m height: (a) horizontal wind speed Uh (m s−1);(b) wind direction (◦). The date of the observation is 25 March 2015. Two vertical dashed lines represent the availability period of radar data.
Table 5. Linear regression analysis of Ka-band radars against sonicanemometer and V2 lidar data.
Height Uh R2 Wind dir. R2
(m) (slope) (slope)
Dual-Doppler radar vs. V2 lidar
100 0.89 (1.02) 0.90 (0.90)120 0.93 (1.04) 0.92 (0.90)140 0.93 (1.06) 0.91 (0.86)150 0.92 (1.06) 0.92 (0.89)160 0.93 (1.08) 0.92 (0.86)180 0.93 (1.12) 0.91 (0.84)200 0.93 (1.12) 0.90 (0.82)All heights together 0.92 (1.08) 0.91 (0.87)
Dual-Doppler radar vs. NW sonic
100 – (–) – (–)150 0.91 (1.03) 0.93 (0.83)200 0.95 (0.92) 0.96 (0.87)All heights together 0.93 (0.97) 0.94 (0.84)
Dual-Doppler radar vs. SE sonic
100 0.87 (1.10) 0.95 (0.89)150 0.93 (1.07) 0.93 (0.86)200 – (–) – (–)All heights together 0.91 (1.10) 0.95 (0.87)
under wake distortion produced by the met-tower (McCaf-frey et al., 2017). Given the good agreement between thesonic anemometers and the profiling lidars, we felt confidentthat the data sets from these two types of instruments can beused to evaluate the accuracy of virtual-tower measurementswith scanning radars and lidars.
In this section, we present the assessment of the dual-Doppler measurements performed with the two Ka-band
radars against sonic anemometer and lidar profiler wind ve-locity data. For the retrieval of the horizontal wind speed andwind direction through the dual-Doppler technique, the ver-tical velocity is assumed to be negligible, which allows drop-ping the last row in Eq. (1). In Fig. 4, horizontal wind speedand wind direction at 150 m height retrieved from the above-mentioned instruments are compared. The considered winddata were acquired by the various instruments at the sameheight of 150 m; thus no data interpolation was needed forthis analysis. A generally good qualitative agreement can al-ready be perceived.
In order to achieve a more quantitative characterization ofthe accuracy in the dual-Doppler retrieval performed on theradar data, a linear regression analysis was then performedfor both horizontal wind speed and wind direction. In orderto compare radar data with sonic and V2 lidar data over dif-ferent heights, a 1-D linear interpolation was performed foreach time stamp in order to estimate the radar wind value forthe heights probed by the sonic anemometers and the V2 li-dar. The correlation between the radar data and the other ref-erence instruments is generally very high, as shown in Fig. 5,with a correlation always larger than 91 %. Slope and R2 val-ues resulting from the linear regression analysis among dual-Doppler radar data, sonic anemometer and V2 lidar data arethen reported in Table 5 for the various heights and as ensem-ble statistics. Again, a good agreement between radar andreference instrument data is generally achieved throughoutthe height of the virtual tower and without any noticeabletrend in the vertical direction.
Finally, histograms of the difference between the hori-zontal wind speed and wind direction measured through thedual-Doppler radar measurements and the reference instru-ments are reported in Fig. 6. For the horizontal wind speedthe mean difference is −0.47, −0.11 and −0.63 m s−1 com-pared with the V2 lidar, NW sonic and SE sonic, respectively,
Atmos. Meas. Tech., 10, 1215–1227, 2017 www.atmos-meas-tech.net/10/1215/2017/

M. Debnath et al.: Assessment of virtual towers performed with wind lidars and Ka-band radars 1221
Figure 4. Dual-Doppler radar measurements at 150 m height compared with sonic anemometer and V2 lidar data: (a) horizontal wind speedUh (m s−1); (b) wind direction (◦). The date of the observation is 25 March 2015.
Figure 5. Linear regression analysis of the dual-Doppler radar retrieval against sonic anemometer and V2 lidar data for all the tested heights:(a–c) horizontal wind speed Uh (m s−1); (d–f) wind direction (◦).
with standard deviations of 0.68, 0.78 and 0.86 m s−1. A sim-ilar analysis for the wind direction leads to a mean differenceof 2.6, −4.75 and 2.60◦ compared with the V2 lidar, NWsonic and SE sonic, respectively, with standard deviations of6.98, 6.28, 6.98◦.
4 Retrieval and assessment of triple-Doppler lidarmeasurements
In this section, we present an assessment study of the triple-Doppler lidar measurements which were performed withthree scanning Doppler lidars to retrieve the three veloc-ity components. As for the previous section, assessment oftriple-Doppler data is carried out against sonic anemometerand lidar profiler data. In Fig. 7a, the line-of-sight velocitiesare reported for the measurements carried out at 100 m heightduring the entire period of the experiments. The wind data
considered for the triple-Doppler retrieval are first quality-controlled as a function of the carrier-to-noise ratio (min-imum value of −25 dB) and then averaged over the actualsampling period, which is defined as the time for which thethree lidars measured simultaneously over the location of in-terest. Statistics of the actual sampling period, i.e., of theoverlapping time among the three scanning lidars, have beenalready presented in Fig. 2.
The retrieved vertical velocity was assessed only againstthe V2 lidar data, because the horizontal distance of 134 mbetween the BAO tower and the lidar supersite location (seeTable 1) as well as the different averaging volume of each in-strument leads to poorer agreement between sonic anemome-ter and triple-Doppler lidar data, as reported in Table 6. Thelinear regression in the vertical velocity with the V2 lidardata, in contrast, shows a good agreement for the height of200 m with a slope of 0.94 and a correlation of R2
= 0.79.
www.atmos-meas-tech.net/10/1215/2017/ Atmos. Meas. Tech., 10, 1215–1227, 2017

1222 M. Debnath et al.: Assessment of virtual towers performed with wind lidars and Ka-band radars
Figure 6. Difference of dual-Doppler radar retrieval with the reference instruments, i.e., sonic anemometers and V2 lidar, for all the testedheights: (a–c) horizontal wind speed Uh (m s−1); (d–f) wind direction (◦).
Figure 7. Triple-Doppler lidar measurements at 100 m height and assessment against sonic anemometer and lidar profiler data: (a) line-of-sight velocities from the three scanning lidars; (b) horizontal wind speed Uh (m s−1); (c) wind direction (◦); (d) vertical velocity W(m s−1).
As predicted from the error analysis presented in Table 2, thereduced elevation angles of the lidar laser beams for smallerheights lead to a rapid decay in the accuracy for the retrievalof the vertical velocity through the triple-Doppler lidar mea-surements.
The horizontal wind speed and direction retrieved throughthe triple-Doppler lidar measurements are reported in Fig. 7b
and c, respectively. In these figures, the respective velocitydata directly measured at 100 m height highlight that – justas for more traditional instruments, such as sonic anemome-ters and the lidar profiler – the triple-Doppler measurementtechnique allows characterization of a significant daily vari-ability in wind velocity from quiescent conditions up to about20 m s−1. Good performance is also observed for the charac-
Atmos. Meas. Tech., 10, 1215–1227, 2017 www.atmos-meas-tech.net/10/1215/2017/

M. Debnath et al.: Assessment of virtual towers performed with wind lidars and Ka-band radars 1223
Figure 8. Linear regression of triple-Doppler lidar data against reference instruments for all the tested heights: (a–c) horizontal wind speedUh (m s−1); (d–f) wind direction (◦).
Table 6. Linear regression analysis of triple-Doppler lidar dataagainst the reference instruments, namely sonic anemometers andV2 lidar.
Height Uh R2 Wind dir. R2 W R2
(m) (slope) (slope) (slope)
Triple-Doppler lidar vs. V2 lidar
100 0.94 (0.99) 0.92 (0.97) 0.01 (0.13)120 0.97 (0.99) 0.93 (0.95) 0.27 (0.32)140 0.97 (0.97) 0.85 (0.97) 0.57 (0.52)160 0.94 (0.97) 0.88 (0.93) 0.62 (0.63)180 0.95 (1.00) 0.95 (0.92) 0.77 (0.68)200 0.93 (1.07) 0.99 (1.00) 0.79 (0.94)All heights together 0.96 (0.95) 0.90 (0.97) 0.49 (0.42)
Triple-Doppler lidar vs. NW sonic
100 0.92 (0.89) 0.85 (0.90) 0.008 (0.04)200 0.90 (1.12) 0.90 (0.91) 0.13 (0.12)All heights together 0.90 (1.02) 0.87 (0.90) 0.09 (0.1)
Triple-Doppler lidar vs. SE sonic
100 0.89 (1.12) 0.84 (0.91) 0.005 (0.012)200 0.9 (0.94) 0.93 (1.00) 0.092 (0.11))All heights together 0.89 (1.01) 0.87 (0.95) 0.03 (0.08)
terization of the wind direction. Indeed, during the experi-ment, wind direction varied all around the full angle of thewind rose, and the triple-Doppler measurements were able todetect the different angles of the wind direction and followits variability as a function of time.
Accuracy in the triple-Doppler retrieval of horizontalwind speed and direction is then quantitatively characterizedthrough a linear regression analysis, which was performedfor all the heights under examination against sonic anemome-ter and lidar profiler data (Fig. 8). Starting with a comparison
with the V2 lidar profiler data located over the lidar supersitelocation, a very good agreement is estimated between thesemeasurement techniques. For the horizontal wind speed, theslope is 0.96 with a correlation of R2
= 0.95, while for thewind direction the slope is 0.97 and there is a correlation ofR2= 0.9.
Moving to the linear regression of the triple-Doppler lidaragainst sonic anemometer data (Fig. 8), the horizontal dis-tance of 134 m between the BAO tower and the lidar super-site location, where all the scanning lidars are focused, doesnot significantly affect the agreement between measurementsobtained from the various instruments. Indeed, the slope forthe wind velocity varies between 0.9 and 1.02, with correla-tion always larger thanR2
= 0.89. For the wind direction, theslope is 0.9 and 0.95 for the linear regression against NW andSE sonic anemometers, respectively, while the correlation isR2= 0.87.
Results of the linear regression analysis for the measure-ments carried out at different heights are reported in Table 6.Considering the data against the V2 lidar, the slope for thehorizontal wind speed is always very close to 1, with a min-imum value of 0.97 and a maximum value of 1.07, while thecorrelation is always larger than R2
= 0.93. For the wind di-rection, a reduced level of accuracy is estimated with a corre-lation larger thanR2
= 0.88 but with the slope still very closeto 1. As for the error analysis due to to the setup of the threelidars (see Table 2), accuracy in the measurements for bothhorizontal wind speed and wind direction is not noticeablychanged for the locations at different heights.
Finally, histograms of the difference between the horizon-tal wind speed and direction measured through the triple-Doppler lidar measurements and the reference instrumentsare reported in Fig. 9. For the horizontal wind speed, themean differences are −0.38, −0.06 and −0.09 m s−1s, and
www.atmos-meas-tech.net/10/1215/2017/ Atmos. Meas. Tech., 10, 1215–1227, 2017

1224 M. Debnath et al.: Assessment of virtual towers performed with wind lidars and Ka-band radars
Figure 9. Difference of triple-Doppler lidar retrieval with reference instruments for all the tested heights: (a–c) horizontal wind speed Uh(m s−1); (d–f) wind direction (◦).
the standard deviations are 0.83, 1.43 and 1.60 m s−1 withrespect to the V2 lidar, NW sonic and SE sonic, respectively.A similar analysis for the wind direction leads to a mean dif-ference of 3.36, 7.47 and 11.14◦ with standard deviations of25.68, 26.09 and 27.15◦ compared with the V2 lidar, NWsonic and SE sonic, respectively.
5 Comparison between lidar and radar virtual-towermeasurements
After discussing the assessment of the virtual-tower mea-surements against the reference instruments, namely sonicanemometers installed over the BAO met-tower and a lidarprofiler, a direct intercomparison between Ka-band radar andwind lidar data is now presented.
According to the linear regression analysis presented inSects. 3 and 4, a very good level of agreement for both radarand triple-Doppler lidar data was observed with reference in-struments, as detailed in Tables 5 and 6. Generally, the slopeobtained for the correlation analysis was very close to 1 forboth measurement techniques in the estimate of wind veloc-ity (between 0.97 and 1.08 for radar data and between 0.95and 1.02 for lidar data) and wind direction (between 0.84and 0.87 for radar data and between 0.9 and 0.97 for lidardata). Correlation between the virtual-tower measurementsand data obtained from sonic anemometers and the V2 lidaris always larger than R2 > 0.91 for the radar measurementsand R2 > 0.87 for the triple-Doppler lidar data. No system-atic bias errors have been observed for both radar and triple-Doppler lidar measurements for the retrieval of the horizontalwind speed and wind direction (see Figs. 6 and 9).
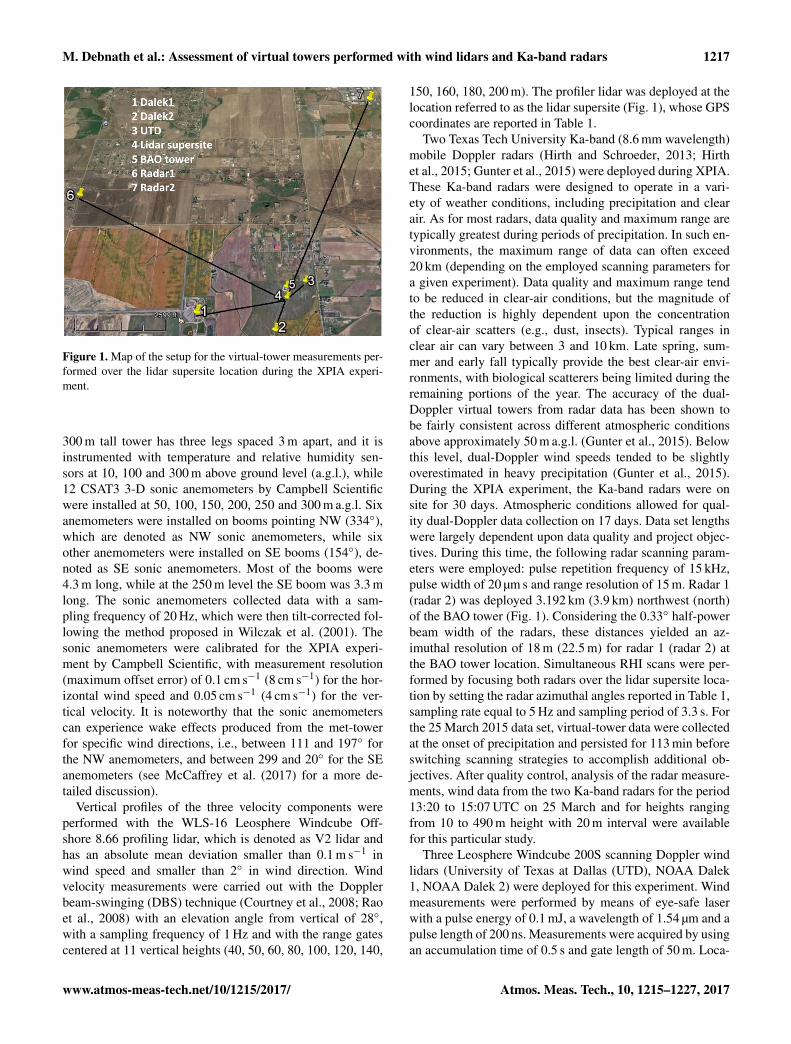
In Fig. 10, a qualitative comparison between the wind dataretrieved through the dual-Doppler radar measurements andthe triple-Doppler lidar data is presented. Radar virtual-tower
measurements were performed continuously over the lidarsupersite location with an average sampling period for eachvirtual tower of 3.3 s. Triple-Doppler lidar measurements, incontrast, were performed every 10 min due to a test scheduleincluding other scans than these presented in this paper. Gen-erally good agreement is observed when virtual towers havebeen performed simultaneously with the two Ka-band radarsand the three scanning wind lidars. A similar variability intime and over the different heights was observed through thetwo different measurement techniques. Differences betweenthe radar and the lidar measurements, for both horizontalwind speed and wind direction, were generally very smallcompared to the variability observed as functions of time andheight.
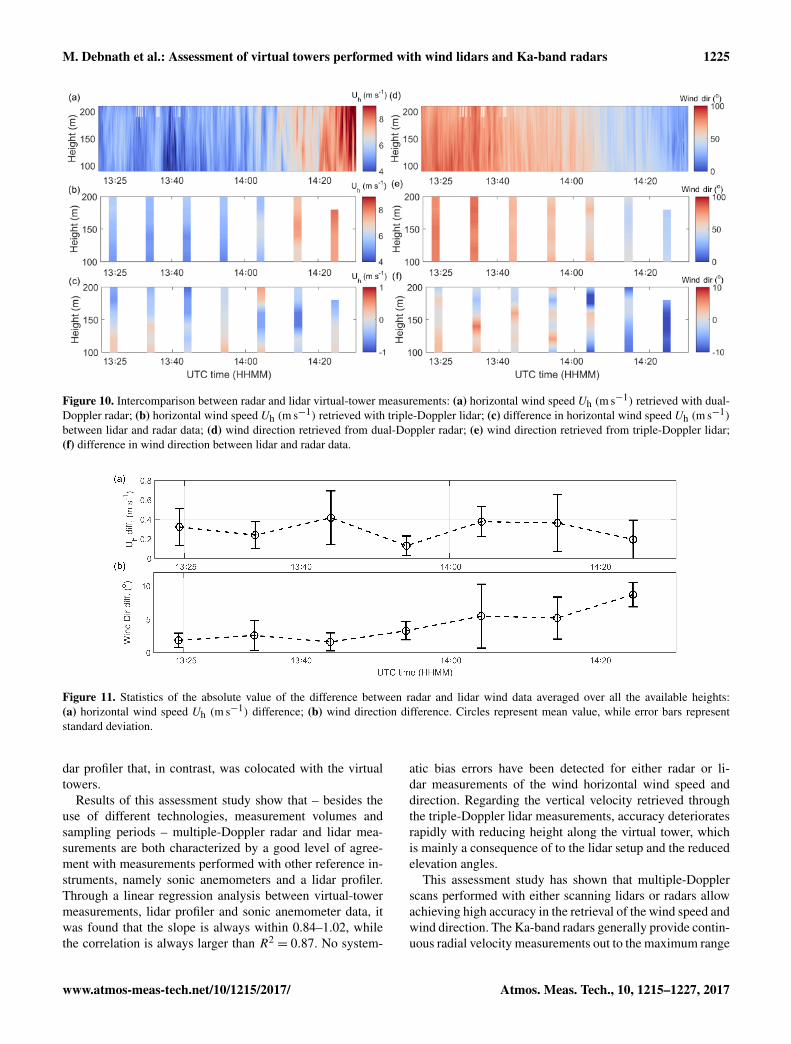
In Fig. 11, statistics of the difference between the radarand lidar measurements are reported for the different virtualtowers performed. For the wind velocity, the difference av-eraged over the height is always smaller than 0.5 m s−1 witha maximum standard deviation of 0.29 m s−1. For the winddirection, the maximum difference averaged over height isalways smaller than 10◦, and the maximum standard devia-tion is 4.79◦.
6 Concluding remarks
During the XPIA experiment, colocated virtual-tower mea-surements were performed with two Ka-band radars andthree scanning Doppler wind lidars. Therefore, these testsprovided the unique opportunity to perform a direct inter-comparison between dual-Doppler radar and triple-Dopplerlidar measurements. Furthermore, wind data obtained fromthe virtual-tower measurements were also assessed againstsonic anemometer data acquired from a met-tower located ata distance of 134 m from the virtual-tower location and a li-
Atmos. Meas. Tech., 10, 1215–1227, 2017 www.atmos-meas-tech.net/10/1215/2017/
M. Debnath et al.: Assessment of virtual towers performed with wind lidars and Ka-band radars 1225
Figure 10. Intercomparison between radar and lidar virtual-tower measurements: (a) horizontal wind speed Uh (m s−1) retrieved with dual-Doppler radar; (b) horizontal wind speed Uh (m s−1) retrieved with triple-Doppler lidar; (c) difference in horizontal wind speed Uh (m s−1)between lidar and radar data; (d) wind direction retrieved from dual-Doppler radar; (e) wind direction retrieved from triple-Doppler lidar;(f) difference in wind direction between lidar and radar data.
Figure 11. Statistics of the absolute value of the difference between radar and lidar wind data averaged over all the available heights:(a) horizontal wind speed Uh (m s−1) difference; (b) wind direction difference. Circles represent mean value, while error bars representstandard deviation.
dar profiler that, in contrast, was colocated with the virtualtowers.
Results of this assessment study show that – besides theuse of different technologies, measurement volumes andsampling periods – multiple-Doppler radar and lidar mea-surements are both characterized by a good level of agree-ment with measurements performed with other reference in-struments, namely sonic anemometers and a lidar profiler.Through a linear regression analysis between virtual-towermeasurements, lidar profiler and sonic anemometer data, itwas found that the slope is always within 0.84–1.02, whilethe correlation is always larger than R2
= 0.87. No system-
atic bias errors have been detected for either radar or li-dar measurements of the wind horizontal wind speed anddirection. Regarding the vertical velocity retrieved throughthe triple-Doppler lidar measurements, accuracy deterioratesrapidly with reducing height along the virtual tower, whichis mainly a consequence of to the lidar setup and the reducedelevation angles.
This assessment study has shown that multiple-Dopplerscans performed with either scanning lidars or radars allowachieving high accuracy in the retrieval of the wind speed andwind direction. The Ka-band radars generally provide contin-uous radial velocity measurements out to the maximum range
www.atmos-meas-tech.net/10/1215/2017/ Atmos. Meas. Tech., 10, 1215–1227, 2017

1226 M. Debnath et al.: Assessment of virtual towers performed with wind lidars and Ka-band radars
when distributed meteorological targets (water droplets, icecrystals etc.) are present. Overall, The Ka-band radar sys-tem is characterized by a higher carrier-to-noise ratio underclear-air conditions (low aerosol concentration) and duringlight precipitations. A limitation of Doppler radars comparedto lidars is the effect of beam spread at large ranges. Indeed,for the radars a divergence angle of 0.498◦ results in a beamspread of 17.1 m at 2 km range and 85.5 m at 10 km range.The scanning lidars, in contrast, have poor signal quality dur-ing precipitations, and the carrier-to-noise ratio strongly de-pends on the concentration of aerosol suspended in the atmo-sphere. However, lidars might have greater data availabilityunder non-precipitation conditions and typical aerosol con-centrations. The divergence angle of the lidars is practicallynegligible, leading to a constant spatial resolution throughoutthe measurement range. Regarding the scanning capabilities,the Ka-band radars have a maximum angular velocity in thescanning of 30◦ s−1, while for the lidars it is only 8◦ s−1.
Given the challenges associated with the collection ofdual-Doppler radar data in non-precipitating environments,future experiments could incorporate both disdrometers andparticulate monitors to better characterize clear air and pre-cipitating environments most conducive to radar data collec-tion. Data availability for all systems might also improvelater in the calendar year when a greater concentration ofscatterers is naturally present in the atmosphere.
Data availability. The data from all the instruments deployed dur-ing the XPIA field campaign are now available at DOE’s DataAccess Portal (DAP) located at https://a2e.pnnl.gov/data. Accessto the general public has been open since 1 April 2016. Inorder to access the data, users need to create an account onthe website given above. For further inquiries please contact ei-ther Julie Lundquist ([email protected]) James Wilczak([email protected]).
Competing interests. The authors declare that they have no conflictof interest.
Acknowledgements. This paper was developed based upon fundingfrom the Alliance for Sustainable Energy, LLC, Managing and Op-erating Contractor for the National Renewable Energy Laboratoryfor the U.S. Department of Energy.
Edited by: W. ShawReviewed by: two anonymous referees
References
Aitken, M. L., Banta, R. M., Pichugina, Y. L., and Lundquist, J. K.:Quantifying wind turbine wake characteristics from scanning re-mote sensor data, J. Atmos. Ocean. Tech., 31, 765–787, 2014.
Banta, R. M., Newsom, R. K., Lundquist, J. K., Pichugina, Y. L.,Coulter, R. L., and Mahrt, L.: Nocturnal low-level jet character-istics over Kansas during cases-99, Bound.-Lay. Meteorol., 105,221–252, 2002.
Bingöl, F., Mann, J., and Foussekis, D.: Conically scanning lidarerror in complex terrain, Meteor. Z., 18, 189–195, 2009.
Bonin, T. A., Blumberg, W. G., Klein, P. M., and Chilson, P. B.:Thermodynamic and turbulence characteristics of the southerngreat plains nocturnal boundary layer under differing turbulentregimes, Bound.-Lay. Meteorol., 157, 401–420, 2015.
Calhoun, R., Heap, R., Princevac, M., Newsom, R., Fernando, H.,and Ligont, D.: Virtual towers using coherent Doppler lidar dur-ing the joint urban 2003 dispersion experiment, J. Appl. Meteo-rol. Clim., 45, 1116–1126, 2006.
Carbajo-Fuertes, F., Iungo, G. V., and Porté-Agel, F.: 3D turbulencemeasurements using three synchronous wind lidars: validationagainst sonic anemometry, J. Atmos. Ocean. Tech., 31, 1549–1556, 2014.
Cariou, J.-P.: Pulsed lidars, in: Remote Sensing for Wind Energy.Risø report Risø-I-3184(EN), Risø National Laboratory for Sus-tainableEnergy, edited by: Peña, A. and Hasager, C. B., Risø Na-tional Laboratory for Sustainable Energy, Technical Universityof Denmark, Roskilde, Denmark, 65–81, 2015.
Choukulkar, A., Brewer, W. A., Sandberg, S. P., Weickmann, A.,Bonin, T. A., Hardesty, R. M., Lundquist, J. K., Delgado, R.,Iungo, G. V., Ashton, R., Debnath, M., Bianco, L., Wilczak, J.M., Oncley, S., and Wolfe, D.: Evaluation of single and mul-tiple Doppler lidar techniques to measure complex flow duringthe XPIA field campaign, Atmos. Meas. Tech., 10, 247–264,doi:10.5194/amt-10-247-2017, 2017.
Courtney, M., Wagner, R., and Lindelöw, P.: Testing and com-parison of lidars for profile and turbulence measurements inwind energy, IOP Conf. Ser., Earth Environ. Sci., 1, 012021,doi:10.1088/1755-1307/1/1/012021, 2008.
Debnath, M., Iungo, G. V., Ashton, R., Brewer, W. A., Choukulkar,A., Delgado, R., Lundquist, J. K., Shaw, W. J., Wilczak, J.M., and Wolfe, D.: Vertical profiles of the 3-D wind ve-locity retrieved from multiple wind lidars performing triplerange-height-indicator scans, Atmos. Meas. Tech., 10, 431–444,doi:10.5194/amt-10-431-2017, 2017.
Emeis, S., Harris, M., and Banta, R. M.: Boundary-layer anemom-etry by optical remote sensing for wind energy applications, Me-teor. Z., 16, 337–347, 2007.
Farnet, E. C. and Stevens, G. H.: Pulse compression radar, RadarHandbook, M. I. Skolnik, McGraw-Hill, 1990.
George, R. and Yang, J.: A survey for methods of detecting aircraftvortices, Chicago, IL, 2012, in: Proc. ASME Int. Design Eng.Tech. Conf. Comp. Infor. Eng., Chicago, IL, USA, 12–15 Au-gust, 41–50, 2012.
Gunter, W. S., Schroeder, J. L., and Hirth, B. D.: Validation ofDual-Doppler Wind Profiles with in situ Anemometry, J. Atmos.Ocean. Tech., 32, 943–960, 2015.
Hill, M., R. Calhoun, Fernando, H. J. S., Wieser, A., Dornbrack, A.,Weissmann, M., Mayr, G., and Newsom, R.: Coplanar Dopplerlidar retrieval of rotors from T-REX, J. Atmos. Sci., 67, 713–729,2010.
Hirth, B. D. and Schroeder, J. L.: Documenting wind speed andpower deficits behind a utility-scale wind turbine, J. Appl. Mete-orol. Clim., 52, 39–46, 2013.
Atmos. Meas. Tech., 10, 1215–1227, 2017 www.atmos-meas-tech.net/10/1215/2017/

M. Debnath et al.: Assessment of virtual towers performed with wind lidars and Ka-band radars 1227
Hirth, B. D., Schroeder, J. L., Gunter, W. S., and Guynes, J. G.:Coupling Doppler radar-derived wind maps with operational tur-bine data to document wind farm complex flows, Wind Energy,18, 529–540, 2015.
Horanyi, A., Cardinali, C., and Rennie, M.: The assimilation of hor-izontal line-of-sight wind information into the ECMWF data as-similation and forecasting system. Part I: the assessment of windimpact, Q. J. Roy. Meteor. Soc., 141, 1223–1232, 2015.
Iungo, G. V.: Experimental characterization of wind turbine wakes:wind tunnel tests and wind LiDAR measurements, J. Wind Eng.Ind. Aerod., 149, 35–39, 2016.
Iungo, G. V. and Porté-Agel, F.: Measurement procedures for char-acterization of wind turbine wakes with scanning Doppler windLiDARs, Adv. Sci. Res., 10, 71–75, doi:10.5194/asr-10-71-2013,2013.
Iungo, G. V. and Porté-Agel, F.: Volumetric lidar scanning of windturbine wakes under convective and neutral atmospheric stabilityregimes, J. Atmos. Ocean. Tech., 31, 2035–2048, 2014.
Iungo, G. V., Wu, Y.-T., and Porté-Agel, F.: Field measurements ofwind turbine wakes with lidars, J. Atmos. Ocean. Tech., 30, 274–287, 2013.
Jones, G. and Bouamane, L.: Historical Trajectories and CorporateCompetences in Wind Energy, Boston, MA, Harvard BusinessSchool Working Paper no. 11-112, 1–82, 2011.
Kaimal, J. C. and Gaynor, J. E.: The Boulder atmospheric observa-tory, J. Clim. Appl. Meteorol., 22, 863–880, 1983.
Lundquist, J. K., Churchfield, M. J., Lee, S., and Clifton, A.: Quan-tifying error of lidar and sodar Doppler beam swinging measure-ments of wind turbine wakes using computational fluid dynam-ics, Atmos. Meas. Tech., 8, 907–920, doi:10.5194/amt-8-907-2015, 2015.
Lundquist, J. K., Wilczak, J. M., Ashton, R., Bianco, L., Brewer,W. A., Choukulkar, A., Clifton, A. J., Debnath, M., Delgado,R., Friedrich, K., Gunter, S., Hamidi, A., Iungo, G. V., Kaushik,A., Kosovic, B., Langan, P., Lass, A., Lavin, E., Lee, J. C.-Y.,McCaffrey, K. L., Newsom, R. K., Noone, D. C., Oncley, S. P.,Quelet, P. T., Sandberg, S. P., Schroeder, J. L., Shaw, W. J., Spar-ling, L., Martin, C. S., Pe, A. S., Strobach, E., Tay, K., Vander-wende, B. J., Weickmann, A., Wolfe, D., and Worsnop, R.: As-sessing state-of-the-art capabilities for probing the atmosphericboundary layer: the XPIA field campaign, B. Am. Meteorol.Soc., 98, 289–314, doi:10.1175/BAMS-D-15-00151.1, 2016.
Mann, J., Cariou, J.-P., Courtney, M. S., Parmantier, R., Mikkelsen,T., Wagner, R., Lindelow, P., Sjoholm, M., and Enevoldsen, K.:Comparison of 3D turbulence measurements using three staringwind lidars and a sonic anemometer, Meteorol. Z., 18, 135–140,2009.
McCaffrey, K., Quelet, P. T., Choukulkar, A., Wilczak, J. M., Wolfe,D. E., Oncley, S. P., Brewer, W. A., Debnath, M., Ashton, R.,Iungo, G. V., and Lundquist, J. K.: Identification of tower-wakedistortions using sonic anemometer and lidar measurements, At-mos. Meas. Tech., 10, 393–407, doi:10.5194/amt-10-393-2017,2017.
Mikkelsen, T., Courtney, M., Antoniou, I., and Mann, J.: Wind scan-ner: a full-scale laser facility for wind and turbulence measure-ments around large wind turbines, in: Europ. Wind Energy Conf.,January 2007, Brussels, Belgium, 1, 012018, 2008.
Newsom, R., Calhoun, R., Ligon, D., and Allwine, J.: Linearly or-ganized turbulence structures observed over a suburban area bydual-Doppler lidar, Bound.-Lay. Meteorol., 127, 111–130, 2008.
Newsom, R. K., Ligon, D., Calhoun, R., Heap, R., Cregan, E., andPrincevac, M.: Retrieval of microscale wind and temperaturefields from single- and dual-Doppler lidar data, J. Appl. Mete-orol., 44, 1324–1345, 2005.
O’Hora, F. and Bech, J.: Improving weather radar observationsusing pulse-compression techniques, Meteorol. Appl., 14, 389–401, 2007.
Pena, A., Hasager, C. B., Lange, J., Anger, J., Badger, M., Bin-gol, F., Bischoff, O., Cariou, J.-P., Dunne, F., Emeis, S., Har-ris, M., Hofsass, M., Karagali, I., Laks, J., Larsen, S., Mann, J.,Mikkelsen, T., Pao, L. Y., Pitter, M., Rettenmeier, A., Sathe, A.,Scanzani, F., Schlipf, D., Simley, E., Slinger, C., Wagner, R., andWurth., I.: Remote sensing for wind energy, DTU Wind Energy-E-Report, 260 pp., ISBN: 978-87-93278-34-9, 2013.
Rao, I. S., Anandan, V. K., and Reddy, P. N.: Evaluation of DBSwind measurement technique in different meam configurationsfor a VHF wind profiler, J. Atmos. Ocean. Tech., 25, 2304–2312,2008.
Segalini, A. and Arnqvist, J.: A spectral model for stably stratifiedturbulence, J. Fluid Mech., 781, 330–352, 2015.
Simley, E. and Pao, L.: LIDAR Wind Speed Measurements ofEvolving Wind Fields, Tech. Rep. NREL/SR-5000-55516, Na-tional Renewable Energy Laboratory, 2012.
Simley, E., Angelou, N., Mikkelsen, T., Sjöholm, M., Mann,J., and Pao, L. Y.: Characterization of wind velocities in theupstream induction zone of a wind turbine using scanningcontinuous-wave lidars, J. Renew. Sustain. Energy, 8, 013301,doi:10.1063/1.4940025, 2016.
Smalikho, I. N. and Banakh, V. A.: Estimation of aircraft wakevortex parameters from data measured with a 1.5-µm coherentDoppler lidar, Opt. Lett., 40, 3408–3411, 2015.
Thresher, R., Robinson, M., and Veers, P.: Wind energy technology:current status and future, Phys. Sustain. Energy Conf., Universityof California at Berkeley 1–2 March, 2008.
Vanderwende, B. J., Lundquist, J. K., Rhodes, M. E., Takle, E. S.,and Irvin, S. L.: Observing and simulating the summertime low-level jet in central Iowa, Mon. Weather Rev., 143, 2319–2336,2015.
Wilczak, J. M., Oncley, S. P., and Stage, S. A.: Sonic anemometertilt correction algorithms, Bound.-Lay. Meteorol., 99, 127–150,2001.
www.atmos-meas-tech.net/10/1215/2017/ Atmos. Meas. Tech., 10, 1215–1227, 2017