author's personal copyapplications.umons.ac.be/docnum/c7b423fd-d183-486c-9cec...metallurgy lab,...
TRANSCRIPT

This article appeared in a journal published by Elsevier. The attachedcopy is furnished to the author for internal non-commercial researchand education use, including for instruction at the authors institution
and sharing with colleagues.
Other uses, including reproduction and distribution, or selling orlicensing copies, or posting to personal, institutional or third party
websites are prohibited.
In most cases authors are permitted to post their version of thearticle (e.g. in Word or Tex form) to their personal website orinstitutional repository. Authors requiring further information
regarding Elsevier’s archiving and manuscript policies areencouraged to visit:
http://www.elsevier.com/authorsrights

Author's personal copy
Corrosion behaviour and biocorrosion of galvanized steel waterdistribution systems
F. Delaunois, F. Tosar, V. Vitry ⁎Metallurgy Lab, UMONS, 20 place du Parc, 7000 Mons, Belgium
a b s t r a c ta r t i c l e i n f o
Article history:Received 11 December 2012Received in revised form 15 January 2014Accepted 15 January 2014Available online 21 January 2014
Keywords:BiocorrosionGalvanized steelElectrochemical impedance spectroscopyOptical microscopy
Galvanized steel tubes are a popular mean for water distribution systems but suffer from corrosion despite theirzinc or zinc alloy coatings.First, the quality of hot-dip galvanized (HDG) coatings was studied. Their microstructure, defects, and commontypes of corrosion were observed. It was shown that many manufactured tubes do not reach European standard(NBN EN 10240), which is the cause of several corrosion problems. The average thickness of zinc layer was foundat 41 μm against 55 μm prescribed by the European standard.However, lack of quality, together with the usual corrosion types known for HDG steel tubes was not sufficient toexplain the high corrosion rate (reaching 20 μm per year versus 10 μm/y for common corrosion types).Electrochemical tests were also performed to understand the corrosion behaviours occurring in galvanized steeltubes. Results have shown that the limiting stepwas oxygen diffusion, favouring the growth of anaerobic bacteriain steel tubes.EDS analysis was carried out on corroded coatings and has shown the presence of sulphur inside deposits,suggesting the likely bacterial activity.Therefore biocorrosion effects have been investigated. Actually sulphate reducing bacteria (SRB) can reducesulphate contained in water to hydrogen sulphide (H2S), causing the formation of metal sulphides. Althoughmicrobial corrosion is well-known in sea water, it is less investigated in supply water. Thus, an experimentalwater main was kept in operation for 6 months. SRB were detected by BART tests in the test water main.
© 2014 Elsevier B.V. All rights reserved.
1. Introduction
Metals used forwater distribution system (cast iron, steel or copper)corrode due to their thermodynamic instability.
To avoid corrosion, steel pipes are covered by a protective layer ofzinc or zinc alloy using Hot-Dip Galvanizing (HDG) [1,2]. This processconsists in the immersion of steels parts in a molten zinc bath to obtaina coating thickness between 20 and 85 μm depending on quality speci-fications (NBN EN 10240). The structure of the zinc coating can bepredicted by the Fe–Zn diagram. The various phases consist of severallayers as shown in Fig. 1 [1–6].
The coating thickness is influenced by various factors, the mainbeing chemical composition of the steel substrate. Actually, soluteadditions in some substrates, such as silicon and phosphorus, affectthe growth rate of the various zinc layers during galvanization, resultingin a thick and brittle coating [1] with a too thick zeta phase (Sandelineffect) [4,5,7]. Bath and annealing temperatures have also major effectson the kinetics of the reactions [1,2].
The zinc coating protects steel against corrosion by the two follow-ing effects: a barrier effect due to the continuity of the coating thatseparates the steel from the corrosive environment and a galvanic pro-tection because zinc acts as a sacrificial anode to protect the underlyingsteel [1,2]. Usually, a thickness of 55 μm (defined by European standardNBN EN 10240 as 396 g/m2, obtained by a gravimetric method) is ad-vised for good protection of steel against generalized corrosion infresh water [8]. However, a coating in which the zeta phase is absentor too thick and presents a columnar morphology [2,4–6] does not pro-tect steel from generalized corrosion. To be efficient, the outer eta layermust represent at least 45% of the thickness of the whole coating [7].
Corrosion can also be accelerated either by high levels of chlorideand sulphate in the water, by elevation of the temperature or by thepH of the water [1,3,5,6,8,9].
Various types of corrosion can be found in sanitary plumbing usinggalvanized steel pipes, due to water composition or temperature, solidparticle deposits, galvanic coupling (with copper, brass or stainlesssteel for examples) or the presence of roaming currents [7,8,10]. Actual-ly, in anaerobic media, the corrosion of zinc proceeds via two partialreactions [11]. The cathodic reaction corresponds to the reduction ofdissolved oxygen and leads to a pH increase, and the anodic reactioninvolves the dissolution of zinc and leads to weight loss.
Bioelectrochemistry 97 (2014) 110–119
⁎ Corresponding author. Tel.: +32 65 37 44 38; fax: +32 65 37 44 36.E-mail addresses: [email protected] (F. Delaunois),
[email protected] (F. Tosar), [email protected] (V. Vitry).
1567-5394/$ – see front matter © 2014 Elsevier B.V. All rights reserved.http://dx.doi.org/10.1016/j.bioelechem.2014.01.003
Contents lists available at ScienceDirect
Bioelectrochemistry
j ourna l homepage: www.e lsev ie r .com/ locate /b ioe lechem

Author's personal copy
Because corrosion rate of galvanized steel is sometimes too impor-tant to be described by common corrosion mechanisms, another typeof corrosion has recently been the subject of investigation [12–14]:biocorrosion by sulphate-reducing bacteria (SRB) in oxygen deficientenvironments, such as plumbing systems, water softeners and waterheaters.
Biocorrosion of carbon or stainless steels is a well-known phenome-non occurring in sea medium or in all activities using freshwatersediments and, generally, where bacteria are present and abundant(sea, mud) [15–18]. In the absence of dissolved oxygen as electron ac-ceptor, anaerobic bacteria (like SRB) may reduce sulphate containedin water to sulphite ions, which can be oxidized to hydrogen sulphideH2S. The electron donor is either H2 or organic compounds (such aslactate or pyruvate). When H2 is the electron donor, it is produced bythe reduction of hydrogen ion by either zinc (sacrificial anode) or ironwhich is oxidized to ferrous sulphides [15,19,20]. The organic com-pounds, on the other hand, are contained and produced by anabolicbacterial cell reactions.
In parallel, the reduction of hydrogen (electron acceptor) is alsopossible producing adsorbed hydrogen which could be used by bacteriaas electron donor. Hydrogen consumption by bacteria still increasescorrosion by iron or zinc consumption (electron donor). Moreover, theproduction of H2S enhances iron oxidation. This phenomenon couldexplain corrosion rate in galvanized steel tubes.
Due to the removal of most bacteria from water for drinking,biocorrosion could usually be considered as marginal. Actually, onlyfew studies describe biocorrosion by SRB in potable water means. Sethand Edyvean [21] have noticed frequent occurrences of SRB in drinkingwater when cast iron pipes are used. They indicated SRB's ability to col-onize a new installation quickly, causing an increase of corrosion rate.Ilhan-Sungur and Cotuk [22] highlighted a corrosion rate of 3 μm/y inan abiotic environment against 12 μm/y in a biotic environment forgalvanized steel [22]. Moreover, they showed that galvanized steelcould be corroded by microorganisms as well as SRB. They assessedthat SRB could survive in the mixed species biofilm with very high Znconcentrations. Likewise, a study outlines an increase of corrosion ratefrom 6 μm per year (μm/y) in abiotic environment to 9.5 μm/y in bioticenvironment for carbon steel [23]. In some cases, the corrosion rate ofgalvanized steel can reach 20 μm/y if conditions are favourable tobacterial growth [24].
The object of this paper is to describemicrostructures and defects ofhot-dip coated galvanized coatings and to present the divergences withoptimum structure, as well as to observe various corrosion types in gal-vanized steel tubes used for sanitary plumbing, and particularlybiocorrosion.
2. Materials and methods
2.1. Samples
Various case studies provided us a lot of specimens: (i) new gal-vanized and new bare steel tubes (16 mm and 22 mm interior diam-eter galvanized tubes and 16 mm interior diameter steel tubes) and
(ii) 16 mm galvanized and bare steel tubes inserted in parallel in an ex-perimental sanitary mean, as shown in Fig. 2, to simulate a potablewater distribution system. Water flow in this simulated sanitary meanwas maintained at 3.6 l/min.
Samples were studied in the as-received conditions and after use inour experimental sanitary system. Specimens in the as-received condi-tions were cut axially with a band saw and some were also cut in crosssection. They were then prepared for metallographic examination. Themechanical polishing was processed with a water-free lubricant toavoid further corrosion of the galvanized coating. Thickness of the Zndeposit was measured by optical microscopy, with image analysissoftware. Etching was carried out with 0.5 vol.% Nital for the Zn coatingandwith 4 vol.% Nital for bare steel tubes to reveal their microstructure.
2.2. Detection and culture of SRB
The presence of SRB was controlled by a BART test (Biological Activ-ity Reaction Test). The BART method evaluates the rate at which bacte-ria metabolize the substrate and generate an observable reaction as aresult of oxidation, reduction, or enzymatic activity. As results of theSRB-BART™ test, the formation of a black precipitate confirms the pres-ence of SRB.
The presence of SRB in our sanitarywater main has been checked bya BART test after 6 months of use in our installation. Tests have beenrealised on the water seeping out of the galvanized steel tube and ofthe bare steel tube.
The culture medium was prepared as follows: solution A: MgSO4
(5 g/l), sodium citrate (12.5 g/l), CaSO4 (2.5 g/l), NH4Cl (2.5 g/l), in400 ml distilled H2O; solution B: K2HPO4 (2.5 g/l) in 200 ml distilledH2O; and solution C: sodium lactate (8.75 g/l), yeast extract (2.5 g/l)in 400 ml distilled H2O. The three solutions were mixed aftersterilisation in an autoclave at 120 °C during 3 h. Before inoculation,the pH was adjusted to 7.5 with 1 M NaOH.
To favour the development of SRB that could already be present incorroded tubes, tubes were immersed in the culture medium. Reactortemperature was maintained at 37 °C during 2 days. BART tests thenwere performed on the culture media.
Simultaneously, a culture medium containing SRB was preparedsimilarly. After sterilisation, a commercial source of SRB (ATCC 7757)was introduced in the culture medium in a reactor under N2 bubbling(to ensure dissolved oxygen removal and observe effects of bacterialcorrosion only) and at 37 °C. Then the tubeswere inserted in the reactor
Fig. 1. Optical micrograph of hot-dip galvanized steel (etched with 0.5 vol.% Nital); composition and expected Vickers hardness (HV).
Fig. 2. Bare and galvanized steel tubes installed parallel in laboratory sanitary mean.
111F. Delaunois et al. / Bioelectrochemistry 97 (2014) 110–119

Author's personal copy
for 10 days (Fig. 3). After this period, tubeswere removed anddried, andthe corrosion products were characterized.
2.3. Characterization methods
Electrochemical tests were carried out using a Parstat 2273potentiostat equipped with a frequency response analyzer and a con-ventional three electrode cell. The cell geometrywas designed to exposean area of the sample to the electrolyte with a surface area A0= 3.5 cm2
for tubes with an interior diameter of 22 mm and of A0 = 3.15 cm2 fortubes with an interior diameter of 16 mm. The experiments were car-ried out in various electrolytes, at room temperature, with a platinumgrid as counter electrode and an Ag/AgCl reference electrode (0.197 Vvs. NHE). The various electrolytes used in this research are thefollowing: (i) drinking (tap) water (K(tapwater) = 682 ± 3 μS/cm),(ii) 0.1MNaCl aqueous solution: chosen because chloride ion is presentin many corrosion situations and in this particular concentration tohave a sufficient conductivity for electrochemical measurements [23]
(K(0.1 M NaCl) = 9.02 ± 0.5 mS/cm) and (iii) synthetic seawater(K(artificial seawater) = 43.4 ± 0.2 mS/cm); artificial seawater wassynthesized with Na+, K+, Mg2+ and Ca2+ ions, chloride and sulphatesolute concentrations equal to that proposed by Millero [26], NaCl con-tent close to 0.5 M. Before each experiment, a settling time of 15 minwas observed to allow stabilization of the open circuit potential (OCP).
Fig. 4. Optical micrographs of welding defects in large galvanized tubes (a), such as blister (b and c) or internal crack (d).
Fig. 5. Optical micrographs of Zn coating defects such as Zn lack (a), overthickness ofZn coating (b); SEM micrograph of Zn coating presenting internal cracks.
Fig. 3. Reactor for SRB11 SRB: sulphate-reducing bacteria. culture.
112 F. Delaunois et al. / Bioelectrochemistry 97 (2014) 110–119

Author's personal copy
The electrochemical polarization or Tafel curves were recorded byscanning the potential from −250 to +250 mV from the open circuitpotential (OCP); sweep rate v = 10 mV/min.
The electrochemical impedance spectroscopy (EIS) measurementswere carried out at open circuit potential with a sinusoidal signal per-turbation of 5 mV, in the frequency range 105 to 10−2 Hz.
Some samples were observed by SEM (scanning electron microsco-py) and EDS (Energy dispersive X-ray spectroscopy) using a Jeol JSM5900 LV scanning electron microscope.
The corrosion products were investigated by X-ray diffraction, witha Philips X-ray apparatus applying Co Kα radiations (1.7902 Ǻ). SEMand EDS analyses were also used to characterize corrosion products.
The water composition (nitrate, sulphate and chloride ions) wereperformed with UV–visible spectrometer HACH, using proprietaryHACH methods.
3. Results
3.1. Optimum galvanized steel coating microstructure
Fig. 1 shows the microstructure expected of a zinc coating to providegood corrosion protection of the steel substrate in water. As said in
Section 1, the protective outer pure zinc eta layermust represent, in thick-ness, at least 45% (25 μm) of thewhole galvanized coating (about 55 μm).
3.2. Defects observed in galvanized coatings on steel
Tubes in the as-received conditions have been observed bystereomicroscopy and optical microscopy. The bare steel tube presentsa classical microstructure with a ferritic matrix and tertiary cementiteat the grain boundaries. The steel of galvanized tubes presents a struc-ture with a majority of proeutectoïd ferrite and a small amount of per-lite. Some defects can be observed on the welding of large galvanizedsteel tubes, such as blisters or cracking (Fig. 4). Important irregularitiesof the coating thickness can also be observed: from nothing to about100 μm, and sometimes more (Fig. 5(a) and (b)). The European stan-dard EN 10240 imposes a minimum of 55 μm of zinc at the interiorside of the galvanized steel tube, and 28 μm on the welding [10]. Mea-surements of galvanized coating thickness along a 10 cm long sectionof tube show that the standard is most of the time not respected(Table 1). Moreover, the average thickness of this sample (41.5 ±8.6 μm) is less than that required by the European standard. A preciseobservation (by SEM) of the galvanized coating also shows the presenceof internal cracks (Fig. 5(c)).
Fig. 6 shows moreover that, even when the minimum thickness of55 μm is respected, the microstructure of the galvanized coating canbe inadequate, with an outer protective pure zinc eta (η) layer toothin to ensure effective protection of the steel substrate against corro-sion (Fig. 6(a)). When the coating is very thin (less than 20 μm)(Fig. 6(b)), its structure is composed of nearly 50% delta (δ) layer–50%zeta (ζ) layer, and the outer protective pure zinc eta (η) layer ismissing.In some cases, irregularities of the galvanized coating lead to a too thinpure zinc eta (η) layer, with a zeta (ζ) layer reaching the surface of thecoating with a lack of delta (δ) layer in some places, impeding protec-tion of the steel substrate against corrosion (Fig. 6(c)).
Fig. 6. Optical micrographs of hot-dip galvanized steel defects (etched with 4 vol.% Nital), such as too thin η-layer (a), missing η-layer (b) and irregularities as ζ-layer reaching thesurface (c).
Table 1Thickness (T/μm) of zinc coatings a 10 cm long section of galvanized tube depending onposition along the tube (Distance D/cm) and angular position from welding (ϕ/°).
D (cm) T (μm)
0 2 4 6 8 10
ϕ (°) 0 50 46 31 39 37 3890 50 56 35 56 47 40
180 25 26 39 47 37 41−90 35 46 42 35 42 56
Numbers in bold are those that follow the europeen standard.
113F. Delaunois et al. / Bioelectrochemistry 97 (2014) 110–119
Author's personal copy
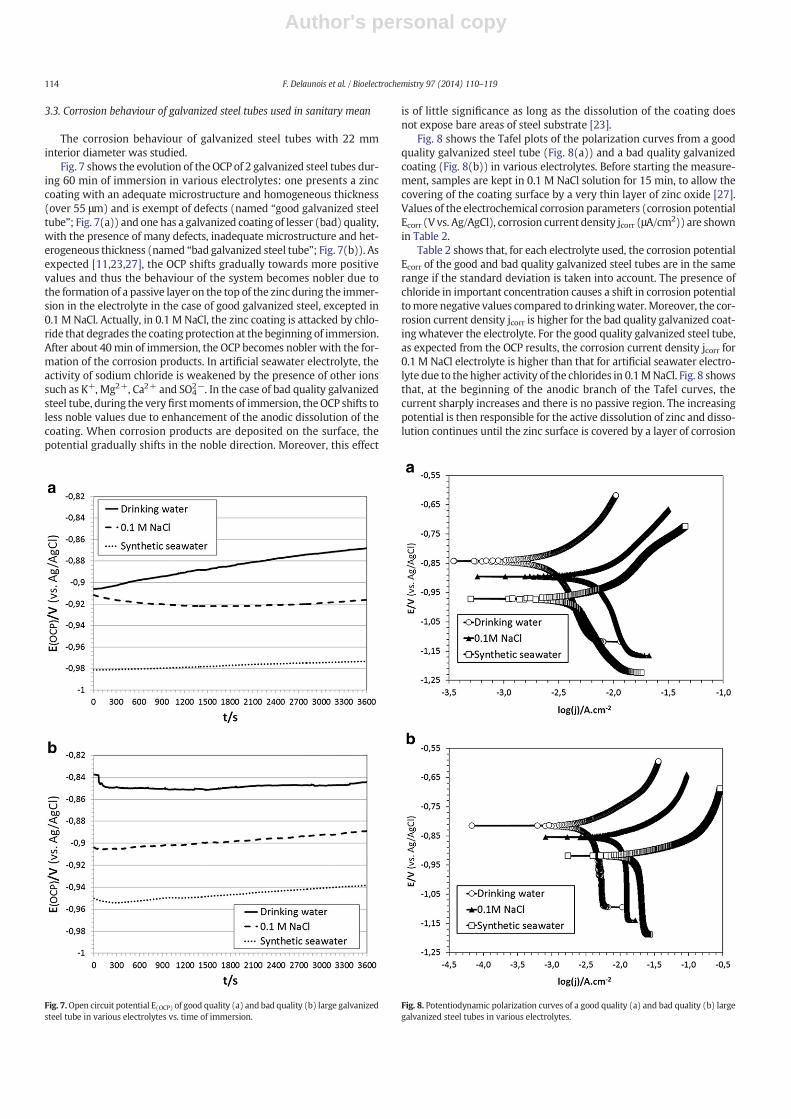
3.3. Corrosion behaviour of galvanized steel tubes used in sanitary mean
The corrosion behaviour of galvanized steel tubes with 22 mminterior diameter was studied.
Fig. 7 shows the evolution of the OCP of 2 galvanized steel tubes dur-ing 60 min of immersion in various electrolytes: one presents a zinccoating with an adequate microstructure and homogeneous thickness(over 55 μm) and is exempt of defects (named “good galvanized steeltube”; Fig. 7(a)) and one has a galvanized coating of lesser (bad) quality,with the presence of many defects, inadequate microstructure and het-erogeneous thickness (named “bad galvanized steel tube”; Fig. 7(b)). Asexpected [11,23,27], the OCP shifts gradually towards more positivevalues and thus the behaviour of the system becomes nobler due tothe formation of a passive layer on the top of the zinc during the immer-sion in the electrolyte in the case of good galvanized steel, excepted in0.1 M NaCl. Actually, in 0.1 M NaCl, the zinc coating is attacked by chlo-ride that degrades the coating protection at the beginning of immersion.After about 40min of immersion, the OCP becomes nobler with the for-mation of the corrosion products. In artificial seawater electrolyte, theactivity of sodium chloride is weakened by the presence of other ionssuch as K+, Mg2+, Ca2+ and SO4
2−. In the case of bad quality galvanizedsteel tube, during the very firstmoments of immersion, theOCP shifts toless noble values due to enhancement of the anodic dissolution of thecoating. When corrosion products are deposited on the surface, thepotential gradually shifts in the noble direction. Moreover, this effect
is of little significance as long as the dissolution of the coating doesnot expose bare areas of steel substrate [23].
Fig. 8 shows the Tafel plots of the polarization curves from a goodquality galvanized steel tube (Fig. 8(a)) and a bad quality galvanizedcoating (Fig. 8(b)) in various electrolytes. Before starting the measure-ment, samples are kept in 0.1 M NaCl solution for 15 min, to allow thecovering of the coating surface by a very thin layer of zinc oxide [27].Values of the electrochemical corrosion parameters (corrosion potentialEcorr (V vs. Ag/AgCl), corrosion current density jcorr (μA/cm2)) are shownin Table 2.
Table 2 shows that, for each electrolyte used, the corrosion potentialEcorr of the good and bad quality galvanized steel tubes are in the samerange if the standard deviation is taken into account. The presence ofchloride in important concentration causes a shift in corrosion potentialtomore negative values compared to drinkingwater.Moreover, the cor-rosion current density jcorr is higher for the bad quality galvanized coat-ing whatever the electrolyte. For the good quality galvanized steel tube,as expected from the OCP results, the corrosion current density jcorr for0.1 M NaCl electrolyte is higher than that for artificial seawater electro-lyte due to the higher activity of the chlorides in 0.1MNaCl. Fig. 8 showsthat, at the beginning of the anodic branch of the Tafel curves, thecurrent sharply increases and there is no passive region. The increasingpotential is then responsible for the active dissolution of zinc and disso-lution continues until the zinc surface is covered by a layer of corrosion
Fig. 7.Open circuit potential E(OCP) of good quality (a) and bad quality (b) large galvanizedsteel tube in various electrolytes vs. time of immersion.
Fig. 8. Potentiodynamic polarization curves of a good quality (a) and bad quality (b) largegalvanized steel tubes in various electrolytes.
114 F. Delaunois et al. / Bioelectrochemistry 97 (2014) 110–119

Author's personal copy
products, that is not a passive layer but only a pseudo-passive layer [11].At the end of the anodic curve, the current density does not drop withthe increase of potential.
The Nyquist impedance diagrams as a function of immersion timefor good galvanized steel tubes, in large size (22mm interior diameter),in various electrolytes are shown in Figs. 9 and 10.
Table 2Corrosion parameters – potential Ecorr (V vs. Ag/AgCl) and current density jcorr (μA/cm2) –determined fromTafel plots for a good and a bad galvanized steel tube in various electrolytes. Theerror is expressed in standard deviation, established from 5 experiments.
Good galvanized steel tube Bad galvanized steel tube
Drinking water 0.1 M NaCl Synthetic seawater Drinking water 0.1 M NaCl Synthetic seawater
Ecorr (V vs. Ag/AgCl) −0.859 ± 0.017 −0.882 ± 0.014 −0.970 ± 0.002 −0.858 ± 0.043 −0.865 ± 0.010 −0.942 ± 0.024jcorr (μA·cm−2) 0.90 ± 0.02 3.84 ± 0. 43 2.22 ± 0.00 3.79 ± 1.76 20.04 ± 7.36 41.34 ± 5.31
Fig. 9. Nyquist plots of Electrical Impedance Spectroscopy data for 1–2 days (a), 7 days(b) and 11–16 days (c) of immersion in 0.1 M NaCl of a large galvanized steel tube(imaginary part vs. real part of complex impedance).
Fig. 10.Nyquist plots of EIS data for 1–2 days (a), 7 days (b) and 14 days (c) of immersionin drinking water of a large galvanized steel tube (imaginary part vs. real part of compleximpedance).
115F. Delaunois et al. / Bioelectrochemistry 97 (2014) 110–119

Author's personal copy
In 0.1 M NaCl solution (Fig. 9), we observed an arc (or depressedsemicircle) at high andmedium frequencies (HF–MF) followed by a sec-ond arc at low frequency (LF) (Fig. 9(a)). As the immersion time in-creases, the LF arc or tail becomes more important and the highfrequency–medium frequency (HF–MF) arc is seriously depressed.Nyquist impedance curves obtained in drinking water (Fig. 10) can beinterpreted similarly. Moreover, the solution resistance is higher indrinking water than that in 0.1 M NaCl solution and the diffusionprocess at LF is more noticeable.
Figs. 11 and 12 show the Bodemodulus (a) and Bode phase (b) plotsof EIS results for good quality galvanized steel tube (22 mm interiordiameter) in various electrolytes as a function of immersion time.
In 0.1 M NaCl solution (Fig. 11), the low frequency impedancemod-ulus value (Fig. 11(a)) that reaches 3.103Ω·cm2 after one day of immer-sion, decreases slowly with immersion time to about 103Ω·cm2, due tochloride attack of the coating and to the dissolution of zinc. This shows anearly resistive behaviour of the coating. At low frequencies, the phaseangle is less than 10° (Fig. 11(b)). During the first days of immersion,two time constants are detected at low and medium frequencies dueto electrochemical activity. The low frequency time constant is attribut-ed to corrosion processes and its shift to lower frequency with immer-sion time is due to the slowdown of the process related to thediffusion through corrosion products. The appearance of a third timeconstant at low frequencies after long periods of immersion points outthe degradation of the coating. The medium frequency time constantgenerally relates to the coating. The increase of the phase angle in thelow frequency range after 2 days of immersion accounts for corrosion
initiation. Moreover, it is difficult to fit the EIS spectra with classicalequivalent circuits because of corrosion products.
In drinking water (Fig. 12), the observed phenomena are different.The low frequency impedance modulus increases with immersiontime from about 104 Ω·cm2 after one day of immersion to reach morethan 105 Ω·cm2 after 14 days (Fig. 12(a)). This is due to the formationof a protective zinc hydroxide layer on the surface of the coating. Inthe Bode phase diagram (Fig. 12(b)), after one day of immersion, weobserve only one time constant at medium frequencies related to thecoating. At low frequencies, the phase angle that is close to zero degreeduring the first days of immersion increases to 15° after 14 days of im-mersion. After 7 days of immersion, two time constants are detectedat low and medium frequencies due to corrosion processes.
3.4. Analyses of corrosion products of galvanized steel tubes in sanitarymean
After 6 months of use in the sanitary system installed in our lab-oratory, samples of the galvanized and of the bare steel tube havebeen isolated and prepared for SEM and EDS analyses. The baresteel tube presents a strong (as expected) internal generalized corro-sion (Fig. 13(a)). The measurement of the tube thickness shows a con-sumption of 10 μm, and thus a corrosion rate of 20 μm/y. The galvanizedsteel tube also presents a corrosion film and the dissolution of the ηphase of the zinc coating (Fig. 13(b)).
EDS analysis of tube surfaces (Table 3) show the oxidation ofiron or zinc, as expected, and different elements coming from water(Ca, Si, P, …). Sulphur and chlorine are also detected in the two tubes,with bigger amounts of both elements in the galvanized one.
Fig. 11.Bodeplot of EIS data for 1–16days of immersion in 0.1MNaCl of a large galvanizedsteel tube (Bode modulus vs. frequency (a) and Bode phase vs. frequency (b)).
Fig. 12. Bode plot of EIS data for 1–14 days of immersion in drinking water of a large gal-vanized steel tube (Bode modulus vs. frequency (a) and Bode phase vs. frequency (b)).
116 F. Delaunois et al. / Bioelectrochemistry 97 (2014) 110–119

Author's personal copy
3.5. Water composition of sanitary mean
After 1 month of use in the sanitary system installed in our laborato-ry, a sample of water was taken from the output of each tube and fromthe input of the installation and analysed for nitrate, sulphate and chlo-ride composition. Results are provided in Table 4.
Those results showa decrease of sulphate and an increase of chlorideion concentrations in the output of sanitarymean. Nitrate concentrationstays constant.
3.6. Biocorrosion
After 6 months of use in the sanitary system installed in our labora-tory, a detection test for SRB was performed on the water seeping outthe tubes and on corrosion products. To increase the detection level ofthe BART test, microbial culture was carried out for 2 days on a sampleof each tube in sterilised culture medium. Then, a BART test was
performed on each culture medium during 10 days. The results illus-trated in Fig. 14 show the positive detection of SRB in the culture medi-um used for the bare tube and the negative detection for the galvanizedsteel tube. These results also prove the presence of SRB in potable waterin the area our lab is situated in. The negative result for the galvanizedsteel tube and sanitary water can be attributed to a lower level of SRB,possibly under the level of detection of a BART test. The negative resultdoes not support the conclusion that SRB is absent of sanitarywater, butthat they are present in too small quantity for BART test.
From the start of laboratory mean use, samples of galvanized andbare tube were collected, after 2, 3 and 6 months of use, for SRB detec-tion (BART test). However BART tests were always negative, perhapsdue to the low SRB concentration. Thus, a sterilised culture mediumwas used to increase SRB population before tests. Time of culture andtime before BART test reaction are shown in Table 5.
The bare steel tube was the first to react with BART test all along thetest time. Bacteria community is thus more important in bare steel tubethan in galvanized steel one. Moreover, if reaction times (at 2 and6 months) are compared for each tube, it is noted that it stronglydecreased although the culture time was also shortened.
3.7. Influence of SRB bacteria on galvanized and on bare steel tubes
In order to highlight SRB influence, a sample of new galvanized andnew bare steel tubes has been inserted in a culture medium inoculatedwith a commercial source of SRB. After 5 days of immersion, the forma-tion of a black precipitate in the reactors and H2S release (high addledsmell) were observed in two samples. The experiment was performedfor 10 days.
SEM observation of the internal surface of the bare steel tube(Fig. 15(a)) shows generalized corrosion with some pitting. The galva-nized steel tube (Fig. 15(b)) presents an important corrosion penetra-tion: 10 μm of the zinc coating is affected and some micro-cracks areobserved. This corrosion differs from the pitting corrosion observed inother works [25].
EDS analyses of the internal surface of galvanized steel tube showsoxidation of the zinc coating. The presence of sulphur and chlorine(Table 3) is also widely detected.
4. Discussion
Standard corrosion phenomena do not suffice to explain all the casesof pipe failures. Therefore, new metallographic investigations on galva-nized steel tubes and on the zinc coating itself were performed. Resultsshowed the frequent occurrence of defects in the welding, such asblisters or cracks, and also in the coating. Cracks have been identified
Fig. 13. SEMmicrographs of bare (a) and galvanized (b) steel tubes after 6 months of usein sanitary system in laboratory.
Table 3EDSa analysis of the corroded surface of galvanized and bare steel tubes after 6 months of use in sanitary system and after 10 days in a medium containing SRB (in atomic %/at.%).
Element (at.%) Fe O Si S Cl Ca Pb Zn P
Bare steel tube After 6 months in use 38.67 60.01 0.33 0.26 0.16 0.35 – – –
Galvanized steel tube After 6 months in use 1.88 52.51 0.81 1.82 1.46 0.22 0.95 39.63 0.72Bare steel tube After 10 days in SRB medium 33.37 60.06 0.73 0.44Galvanized steel tube After 10 days in SRB medium 43.96 52.48 2.11 1.46
The numbers in bold are those that interest us in the study.a EDS: Energy Dispersive X-ray Spectrometry.
Table 4Water composition analyses from output of galvanized and bare steel tubes and frominput (index) of sanitary mean (mg/l). The error is expressed in standard error ofmeasurement.
Nitrate (mg/l) Sulphate (mg/l) Chloride (mg/100 ml)
Index 13.2 ± 0.2 75.0 ± 0.2 4.8 ± 0.4Galvanized steel tubes 13.4 ± 0.2 67.3 ± 0.2 6.6 ± 0.4Bare steel tubes 13.0 ± 0.2 69.5 ± 0.2 6.4 ± 0.4
117F. Delaunois et al. / Bioelectrochemistry 97 (2014) 110–119

Author's personal copy
in the coating, near the substrate, and sometimes even inside thesubstrate (Fig. 4). In Table 1, we have observed important irregularitiesof the coating thickness, with coatings not following the European stan-dard (which imposes a minimum thickness of 55 μm on the inside ofgalvanized steel tubes, and28 μmon thewelding).Moreover, themetal-lographic structure of the zinc coating itself does not correspond toexpectations: the outer protective pure zinc eta (η) layer is sometimestoo thin to offer effective protection against corrosion to the steelsubstrate and can even be absent in some cases (Fig. 5).
All these observations allow us to say that many pipe failures inpotable water distribution system are notably due to the bad qualityof the galvanized coating and to defects in the welding.
Electrochemical studies of corrosion provide information about cor-rosion behaviour of galvanized steel tubes inwater. Firstly, after immer-sion in drinking water and in synthetic seawater, OCP (Fig. 7) of thegood galvanized steel tubes becomes more positive due to the forma-tion of a passive layer of zinc oxides. Bad galvanized steel tubes havemore trouble to form an effective passive layer in all the electrolytesthat were studied. Secondly, Tafel curves (Fig. 8) indicate that the corro-sion process is totally or partially dependent on diffusion through thelayer of corrosion products. Table 2 shows that the rate limiting stepis the mass transfer of corrosion reagents due to the zinc depositacting as a barrier coating, controlling the reaction of dissolved oxygen[11,23,27]. Thus, corrosion by neutral aerated water is not promotedbut this oxygen gradient is favourable for anaerobic bacteria whichfind a friendly environment. Finally, Nyquist plots (Figs. 9 and 10) andEIS analysis (Figs. 11 and 12) confirm this observation. Actually, the LFarc or tail indicates a diffusion process through a finite thickness layer(the corrosion products), relatedmainlywith the reduction of dissolvedoxygen, due to the absorbed species that contribute to the formation ofthe corrosion layer. The HF–MF arc is attributed to faradic charge trans-fer, associated with the effect of ionic double layer capacitance. Thiscomplex mass transport mechanism is due to the system formed bycorrosion medium/corrosion products/metal [11,23]. Diagrams at LFgive information on the barrier effect of the coating. The appearanceof diffusion tails at LF can be linked to the accumulation of corrosion
Fig. 14. BART22 BART: Biological Activity Reaction Test. test for water seeping out the bare (a) and
galvanized (b) steel tubes.
Table 5Time of SRBa culture and time before BARTb test reaction depending on sampling time.
Sampling time Culture time (d) Reaction time (d)
Bare steel tube After 2 months in use 29 41After 3 months in use 39 32After 6 months in use 19 4
Galvanized steel tube After 2 months in use 29 No reactionAfter 3 months in use 39 45After 6 months in use 19 No reaction
a SRB: sulphate-reducing bacteria.b BART: Biological Activity Reaction Test.
Fig. 15. SEMmicrographs of bare (a) and galvanized (b) steel tubes after 10 days in culturemedium.
118 F. Delaunois et al. / Bioelectrochemistry 97 (2014) 110–119

Author's personal copy
products [28]. This latter observation is also important for biocorrosion.Actually, this may be explained by the formation, due to corrosion, of aporous interface favourable for the development of bacteria on baresteel tubes. Further investigations have identified another reason forwater leakage: SRB activity. Fig. 13 provides an estimation of corrosionrate, about 20 μm/y. An explanation of this high corrosion rate is eitheran extremely abiotic aggressive water (extreme pH or presence of Cl−)or biotic water (containing SRB). Indeed, corrosion rate of galvanizedsteel in abiotic freshwater is always less important [22].
EDS analysis of corrosion by-products, provided in Table 3, havehighlighted the presence of chlorine and sulphur in by-products. Thepresence of chlorine can be associated to the chemical composition ofpotable water but sulphur cannot. Actually, elemental sulphur can findits origin in the reduction of the sulphate contained in water by SRB.Moreover, water composition analyses, provided in Table 4, show a de-crease of sulphate, which would justify the sulphur presence in corro-sion products. It may come from sulphate consumption due to SRBgrowth. The chloride ion increase may be assigned to consumption of(bound or free) chlorine by SRB as electron acceptor (instead of sul-phate) [29]. Over the 6 months of use, BART test always showed thepresence of SRB in bare steel tubes and sometimes in galvanized steel(depending on culture time). Results included in Table 5 confirm theSRB ability to colonize quickly a new installation with an increase of cor-rosion rate, and inparticular the bare steel tube,which ismore favourableto corrosion development. Although the galvanized steel tube seemedmore resistant, SRB were also present, leading to a raise of the corrosionrate. This testing campaign shows that culture medium use may be im-portant for SRB detection. Actually, without the culture phase, sanitarywater and galvanized steel tube would be “free” of SRB. With the use ofculture medium, the presence of SRB can be demonstrated and the linkbetween high corrosion rate and SRB is established.
5. Conclusions
A multiple approach study was used to investigate the corrosion ofgalvanized steel tubes in drinking water distribution systems. Specifi-cally, surface, thickness and microstructure analysis, various corrosionphenomena and biocorrosion, as well as electrochemical studies arereported. The following conclusions are drawn:
• The quality of galvanized steel tubes is generally not good, with thepresence of many defects, and the galvanized coating does not reachspecifications of the European standard to be used in plumbing: thick-ness of the coating (expected to be higher than 55 μm) is frequentlytoo low, and coating microstructure is often inadequate.
• Electrochemical and EIS analysis in various electrolytes (drinkingwater, 0.1 M NaCl, synthetic seawater) show the role of the zinc coat-ing in cathodic steel protection: the coating acts as a barrier protectionwith the presence of a diffusion process, related mainly to the reduc-tion of dissolved oxygen. Moreover, the limiting step being oxygendiffusion, an oxygen gradient occurred and anaerobic area appears.
• As a consequence of culture medium use, positive detection of SRB ingalvanized and bare steel tubes from a sanitary mean proves thepresence of SRB activity in potable water.
• Sulphatemetabolism by SRB generates oxidizing agents (such as H2S)which can react stronglywith zinc coating and iron, leading to a quickand important corrosion of the galvanized and the bare steel tubes,underlined by sulphur apparition in corrosion by-products (EDSanalyses).
In future work, the focus will be brought on the behaviour of exper-imental water means after various exposition times, to get more infor-mation about the kinetics of biocorrosion (by SRB) in water means.Reflexions about the needs for better quality of HDG steel tubes willalso be carried out.
Acknowledgments
The authors thank Prof. Olivier and Mrs. Druart from the MaterialsScience Dept at UMONS for their help with the analysis of EIS results,and Dr. Gérard Quoirin, Miss Adeline Sens and Mr. Guillaume Richeuxfor their participation to the study.
References
[1] AWWARF, Internal Corrosion of Water Distribution Systems, AWWARF-DVGW-TZWCooperative Research Report, Denver, CO, 1996. (586 pp.).
[2] A.R. Marder, A review of the metallurgy of zinc coated steel, Prog. Mater. Sci. 45 (3)(2000) 191–271.
[3] C. Volk, E. Dundore, J. Schiermann, M. Lechevallier, Practical evaluation of ironcorrosion control in a drinking water distribution system, Water Res. 34 (6)(2000) 1967–1974.
[4] D. Quantin, Galvanization à chaud: Principes, Techniques de l'Ingénieur, M 1 530,2004. 1–7.
[5] Hot-Dip Galvanizing for Corrosion Protection: A Specifiers Guide, AmericanGalvanizers Association, 2006. 1–21.
[6] P.G. Rahrig, Galvanized steel in water and wastewater infrastructure, Mater.Perform. 42 (7) (2003) 58–60.
[7] F. Delaunois, G. Guerlement, Study of the Corrosion of Galvanized Steel Tubes Usedin Water Distribution Systems, Chimie Nouvelle, 2008. 15–20.
[8] Présence de rouille dans l'eau de distribution, Guide pratique des défauts deconstruction, Installations-plomberie sanitaire et industrielle, CSTC, 1997.190–191.
[9] A. Koukalova, K. Kreislova, P. Strzyz, The evaluation of corrosion damage ofgalvanised tubes for hot water distribution, 2nd International Conference Corrosionand Material Protection, 19–22 April 2010, Prague, Czech Republic, EFC Event No.322, 2010, ISBN 978-80-90393-6-3.
[10] C. Callandt, Corrosion des tuyauteries sanitaires en acier galvanisé, CSTC-Contact, 14,2007, pp. 7–8.
[11] M. Mouanga, P. Berçot, Comparison of corrosion behaviour of zinc in NaCl and inNaOH solutions; part II: electrochemical analyses, Corros. Sci. 52 (12) (2010)3993–4000.
[12] I.S. Pogrebova, I.A. Kozlova, L.M. Purish, S.E. Gerasika, O.H. Tuovinen, Mechanism ofinhibition of corrosion of steel in the presence of sulfate-reducing bacteria, Mater.Sci. 37 (5) (2001) 754–761.
[13] D. Cetin, M.L. Aksu, Corrosion behavior of low-alloy steel in the presence ofDesulfotomaculum sp. Corros. Sci. 51 (8) (2009) 1584–1588.
[14] L.K. Herrera, H.A. Videla, Role of iron-reducing bacteria in corrosion andprotection of carbon steel, Int. J. Biodeterior. Biodegrad. 63 (7) (2009)891–895.
[15] W. Lee, Z. Lewandowski, P.H. Nielsen, et al., Role of sulphate-reducing bacteria incorrosion of mild steel: a review, Biofouling 8 (1995) 165–194.
[16] F. Sarioglu, R. Javaherdashti, N. Aksoz, Corrosion of a drilling pipe steel in anenvironment containing sulphate-reducing bacteriaInternational, J. Press. Vessel.Pip. 73 (2) (1997) 127–131.
[17] R. Javaherdashti, A review of some characteristics of MIC caused bysulfate-reducing bacteria: past, present and future, Anti-Corr. Methods Mater.46 (3) (1999) 173–180.
[18] F.A. Lopes, P. Morin, R. Oliveira, L.F. Melo, Interaction of Desulfovibrio desulfuricansbiofilms with stainless steel surface and its impact on bacterial metabolism,J. Appl. Microbiol. 101 (5) (2006) 1087–1095.
[19] R. Marshal, Involvment of sulfidogenic bacteria in iron corrosion, Oil Gas Sci.Technol. Rev. IFP 54 (5) (1999) 649–659.
[20] O.J. Hao, J.M. Chen, L. Huang, et al., Sulfate-reducing bacteria, Crit. Rev. Environ. Sci.Technol. 26 (1) (1996) 155–187.
[21] A.D. Seth, R.G.J. Edyvean, The function of sulfate-reducing bacteria in corrosion ofpotable water mains, Int. J. Biodeterior. Biodegrad. 58 (2006) 108–111.
[22] E. Ilhan-Sungur, A. Çotuk, Microbial corrosion of galvanized steel in asimulated recirculating cooling tower system, Corros. Sci. 52 (1) (2010)161–171.
[23] L. Carpen, P. Rajala, M. Vepsalainen, M. Bomberg, Corrosion behaviour and biofilmformation on carbon steel and stainless steel in simulated repository environment,Proceeding Eurocorr, 2013, p. 1589.
[24] E. Ilhan-Sungur, N. Cansever, A. Cotuk, Microbial corrosion of galvanized steel by afreshwater strain of sulphate reducing bacteria (Desulfovibrio sp.), Corros. Sci. 49(3) (2007) 1097–1109.
[25] V. Barranco, S. Feliu Jr., S. Feliu, EIS study of the corrosion behaviour of zinc-basedcoatings on steel in quiescent 3% NaCl solution. Part 1: directly exposed coatings,Corros. Sci. 46 (9) (2004) 2203–2220.
[26] F.J. Millero, 6.01 physicochemical controls on seawater, in: Heinrich D. Holland, KarlK. Turekian (Eds.), Treatise on geochemistry, The Oceans and Marine Geochemistry,6, Elsevier Ltd., UK, 2003, pp. 1–21.
[27] A.P. Yadav, A. Nishikata, T. Tsuru, Electrochemical impedance study on galvanizedsteel corrosion under cyclic wet–dry conditions—influence of time of wetness,Corros. Sci. 46 (1) (2004) 169–181.
[28] S.C. Chung, J.R. Cheng, S.D. Chiou, H.C. Shih, EIS behavior of anodized zinc in chlorideenvironments, Corros. Sci. 42 (7) (2000) 1249–1268.
[29] M. Madigan, J. Martinko, Biologie des micro-organismes, Brock, Paris, 2007. 583(668–669).
119F. Delaunois et al. / Bioelectrochemistry 97 (2014) 110–119