autier, philippe and koechlin, alice and boniol, mathieu
TRANSCRIPT

1
The forthcoming inexorable decline of cutaneous melanoma mortality in light-skinned populations
Philippe Autier, MD 1,2 ; Alice Koechlin, MSc 1,2; Mathieu Boniol, PhD 1,2
1 University of Strathclyde Institute of Global Public Health at iPRI, International Prevention Research Institute , 95 Cours Lafayette, 69006 Lyon, France
2 International Prevention Research Institute (iPRI), 95 Cours Lafayette, 69006 Lyon, France
Corresponding author: Dr Philippe Autier, International Prevention Research Institute (iPRI), 95 Cours Lafayette, 69006 Lyon, France
E-mail: [email protected]; website: www.i-pri.org
*Manuscript with amendments highlighted

2
Abstract
Background: Reasons underlying time changes in cutaneous melanoma mortality in light-skinned populations are not well understood. An analysis of long-term time trends in melanoma mortality was carried out after regrouping countries in homogeneous regions.
Methods: Using the WHO mortality database, age-period-cohort models were fitted for seven regions where the majority of population is light-skinned. Cohort effects are denoted as changes in rates occurring at different time in steadily older age groups. Period effects are denoted as changes in rates occurring simultaneously in several age groups.
Findings: Cohort effects better explained changes in melanoma mortality over time than period effects. Lifetime risk to die from melanoma increased in successive generations from 1875 until a peak year. Peak years were for subjects born in 1936-40 in Oceania, 1937-43 in North America, 1941-42 in Northern Europe, 1945-53 in UK and Ireland, 1948 in Western Europe, and 1957 in Central Europe. After peak years, lifetime risk of melanoma death gradually decreased in successive generations and risks of subjects born in 1990-95 were back to risk levels observed for subjects born before 1900-05. In Southern Europe, birth years with highest lifetime risk of melanoma death have not yet been attained. As time passes, melanoma deaths will steadily rarefy in younger age groups and concentrate in older age groups, for ultimately fade away after 20430-540.
Interpretation: Independently from screening or treatment, over next decades, death from melanoma is likely to become an increasingly rare event. The temporary epidemic of fatal melanoma was most probably due to the medically-backed practice of exposing unclothed children to intense natural and artificial sources of ultraviolet radiation that prevailed in 1900-1960. The temporary epidemic of fatal melanoma was most probably due to excessive UV-exposure of children that prevailed in 1900-1960, and recent mortality decreases would be due to progressive reductions in UV-exposure of children over the last decades.
Funding: This work was financed by the International Prevention Research Institute, Lyon, France.
3
Introduction
The cutaneous malignant melanoma (hereafter termed melanoma) is the deadliest form of skin cancer. From 1955 to around 1985, melanoma death rates have more than doubled in all light-skinned populations. After 1985-1990, less steep increases or stabilizations, and even decreases in melanoma mortality rates have been observed in Australia,1 in the USA 2 and in several European countries3-8 after that changes in the age distribution of populations over time had been controlled for in statistical analyses. However, understanding reasons possibly underlying time variations in the death toll due to melanoma is quite challenging when one looks more closely at the age at which these deaths occurred. For instance, in Northern Europe (i.e., Denmark, Finland, Iceland, Norway, Sweden), before 1970, a minority of melanoma deaths occurred in subjects aged 70 or more while after 1995 in men and 1985 in women, melanoma deaths were more numerous in this age group (Figure 1ab). Numbers of melanoma deaths in subjects less than 50 increased until around 1975, then stabilized and slowly decreased. Numbers of deaths in subjects aged 50 to 69 raised steeply until 1985-90, after which increases slowed down in men and death numbers plateaued in women. Comparable epidemiological features have been observed in all light-skinned populations (Figure S1). The contrasting time variations in melanoma death across age groups indicate that the influence of risk factors involved in the occurrence of deadly melanoma had varied over time and is independent from population ageing. Factors independent of ageing that influence disease burden over time are defined as period or cohort effects or a combination of both.9 Period effects are characterized by changes in mortality rates taking place at about the same time in several age groups, for instance after the offering of efficient screening program or treatment to subjects of different ages. Cohort effects are characterized by changes in mortality rates taking place in successive generations, for instance after introduction of prevention policies targeting children whose effect on mortality will be first observed in younger age groups and then progressively extend to older age groups.
In order to better understand reasons underlying divergences in age-specific trends in melanoma mortality, we carried out an analysis of long-term time trends in melanoma mortality in countries where the majority of the population is light-skinned. The objective of our study was to disentangle the respective contributions of age at which melanoma death occurred, of population aging, of cohort effects, and of period effects. To this end, we regrouped countries by homogeneous geographical regions so that sufficient statistical power could be secured.
Methods
Mortality data
Mortality data on melanoma were retrieved from the WHO mortality database (09/07/2012 release). Data were extracted for countries mainly populated with light-skinned subjects. Annual data were obtained for each sex by 5-years age groups (from 0-4 years to 85 and more). Melanoma mortality codes from the international classifications of diseases (ICD) were 190 for ICD7, 172 for ICD8, 172 for ICD9, C43 for ICD10. Data were available from 1955 to 2010 in most countries. France was excluded of the analysis because of misclassification in melanoma/Non Melanoma Skin Cancer codes in the 1960s owing to problems in transition from ICD7 to ICD8 lists. In the USA, melanoma mortality data were not available for the 1968-1978 period and we just estimated missing data by interpolation of data before 1968 and data after 1978.

4
Grouping countries into regions
In order to increase the statistical power of the analysis, countries were grouped into main regions of the world. Within each region, deaths and population by age group and sex were added. Countries were grouped as follows:
Oceania: Australia and New-Zealand
North America: Canada and the United States of America (USA)
Northern Europe: Denmark, Finland, Iceland, Norway, Sweden
United Kingdom and Ireland
Western Europe: Austria, Belgium, Germany (former German Democratic Republic and former Federal Republic of Germany 1980-1989; Reunified Germany since 1990), the Netherlands and Switzerland
Central Europe: Bulgaria, the Czech Republic, Estonia, Hungary, Latvia, Poland, Romania, Slovakia and Slovenia
Southern Europe: Greece, Italy, Portugal and Spain
Statistical analysis
Age standardisation
Mortality rates were age-standardized by the direct method using Segi World standard population10 as reference.
Joinpoint Modelling
Time changes in the age-standardized rates were modeled using joinpoint version 3.5.0 (Joinpoint Regression Program, Version 3.5 - April 2011; Statistical Methodology and Applications Branch and Data Modeling Branch, Surveillance Research Program National Cancer Institute). Joinpoint enables to model several regression lines connected by joinpoints at which significant inflexion could be detected; the program reports the simplest model that the data allow. Log-linear models were used in the analysis of trends and the identification of 0 to 3 joinpoints to either end of the data were allowed. The minimum number of allowed datapoints between joinpoints was 4.
This time-trend modeling approach enables to provide an evaluation of trends that is not user dependent as finding of joinpoints is data driven and identified through a series of permutation tests. Analyses were carried out for each region by sex and by age group (less than 50; 50 to 69 and more than 70).
Age-period-cohort modelling
Age-period-cohort (APC) models were fitted to mortality data using R 3.0.1. More precisely, the function apc.fit from the Epi 1.1.67 package 11 was used. To solve the problem of identifiability in such models,9 a penalty function was applied to period effects which constrained the average period effect to be null with a null slope. The analysis was repeated applying the same penalty function to the cohort effect. The two ways to parameterize data led to similar results (data not shown).
The analysis was repeated applying the same penalty function to the cohort effect. Applying
the penalty function to the period effect or to the cohort effect resulted in similar changes in
deviance (data not shown).
Formatted: Font: 12 pt
Formatted: Font: 12 pt
Formatted: Font color: Red

5
Subjects less than 15 were excluded from analyses. In results, cohorts were identified by their middle-year. Because first and last years of available data on causes of death could vary between countries, or because of missing years, study periods were restricted to 5-year groups for which complete data were available. The reference cohort, noted 1935, corresponds to people born between the 1st of January 1933 and the 31st of December 1937. The year 1935 was selected because in all regions, it was approximately the median birth cohort of subjects who died from melanoma. Results from APC models included age-specific effects, cohorts and period effects reported as relative risk with a reference cohort set to 1935 (RR=1·0).
Results
Detailed results for Northern Europe are presented first after which main results for all regions are provided with complete results displayed in the supplementary materials.
Northern European countries
Mortality rates in Figure 1cd are the numbers of melanoma deaths displayed in Figure 1ab divided by numbers of men or women of each age group in given year, followed by age standardization on the Segi World Standard Population.10 Hence trends in Figures 1cd are independent of population aging. Time trends were derived from join point analyses that quantified percent changes in mortality rates during a specific time period and detected years during which statistically significant changes in trends were noticeable (Table S1). Overall, melanoma mortality was still rising in the 2000s with annual percent changes of 2.47% (95% CI: 0.91; 4.05) in 2002-10 in men and of 1.53% (95% CI: 0.73; 2.34) in 1996-2010 in women. However, Iin men and women less than 50, an abrupt reversal in trends took place in 1970-71, while . Iin men and women 50-69, trends stabilized after 1983-84. , while iIn men and women aged 70 and more, trends have risen without interruption from 1955 to 2010.
A more refined examination of trends specific to each 10-year age group show that the younger the men and women, the earlier the stabilization or start of declines in trends (Figure 1ef). For each increment in 10-year age group, there was a 6 to 8 years shift of the year from which rates started to stabilize. Downward trends in years after the stabilization were observed for men and women less than 50, but not yet for the 50-59 and 60-69 age groups. Above 69 years of age, melanoma mortality rates continued to rise. A subject aged 70 in 2010 was born in 1940. Hence the risk of melanoma death has leveled off in successive generations of subjects born after 1940, which is the hallmark of cohort effects. Because in 2010, subjects born after 1940 have not yet reached 70 years of age, stabilization of mortality rates are not yet visible in subjects aged 70 and more.
Instead of examining trends according to calendar years, one can examine trends according to years of birth (Figure 1gh). Each curve reflects changes in mortality rates specific to 10-year age groups whose subjects were born at different epochs. The vertical dashed line indicates that trends in melanoma mortality stabilized and then declined in successive cohorts of men born after 1940-45. Rates will continue to decline in cohorts of subjects less than 70 born after 1940. It is highly likely that in coming years, rates in subjects aged 70 or more born after 1940-45 will progressively stabilize and then decline.
Formatted: English (U.K.)
Formatted: Font: +Body, 12 pt
Formatted: Font: +Body, 12 pt
Formatted: Font: +Body, 12 pt
Formatted: Font: +Body, 12 pt

6
From age-period-cohort analyses, we could quantify the influence of cohort and period effects on time trends of melanoma death through an examination of the residual deviance of models that is the amount of variation in mortality data not explained by a model. Analysis of deviance comparing the five classical models (Age, age-drift, age-cohort, age-period and age-period-cohort) are reported in Table S2. The residual deviance was smaller for age-cohort models than for age-period models, indicating that changes in melanoma mortality over time were better explained by cohort effects than by period effects. Therefore, the remaining of the text will focus on results from age-period-cohort models with penalty function applied to the period effect.
Birth cohort effects can be summarized as the risk to die from melanoma when born at a certain year relative to a reference year (1935) for which the risk is arbitrarily set to 1·0 (Figure 1ij). Peak years for highest risk of melanoma death were observed in men born around 1942 and in women born around 1941. The relative risk of melanoma death of men born before 1885 was less than 0·25, i.e., less than 25% the risk of melanoma death of men born around 1935. The relative risk of women born before 1885 was 30% the risk of melanoma death of women born around 1935. After 1941-42, risks declined without interruption. The risk of melanoma death of men and women born around 1990 was similar to the risk of men and women born around 1900.
Because of cohort effects, as time passes, melanoma deaths concentrate in older age groups and become steadily rarer in younger age groups (Figure 1kl). Independently from population aging, in 1955-59, 30% of melanoma deaths in men occurred before age 50, 40% of deaths occurred between 50 and 69, and 30% occurred after 69. From 2005 to 2010, 10% of melanoma deaths in men occurred before age 50, 40% of deaths occurred between 50 and 69, and 50% occurred after 69. Comparable changes were observed in women.
Results for other regions
Similarly to Northern Europe, age-adjusted melanoma mortality rates stabilized and then declined in subjects less than 50, raising trends slowed down or stabilized in subjects 50 to 69, and kept increasing in subjects 70 years or more (Figure S2). If from 2000 to 2010 annual percent changes for all age groups still indicated still raising melanoma mortality, principally in Europe (Table S1), this was largely due to the demographic weight of older subjects who experienced unabated raising trends in melanoma mortality. Hence, trends were mainly explained by cohort effects, and with few exceptions, the residual deviance of age-cohort models was smaller than that of age-period models (Table S2).
Figure 2 shows the lifetime risk of melanoma death for each birth year in a region relative to rates in that region observed in the birth cohort centered around 1935. Relative risks are to be interpreted for each region, and not between regions. Contrasts in trends between regions are the consequence of variations in peak birth years associated with highest risk of melanoma death. In all regions, the risk of melanoma death in men was minimal for men born before 1880. Then risks sharply increased, reaching a peak for men born in 1940 in Oceania, 1943 in North America, 1942 in Northern Europe, 1948 in Western Europe. After the peak years, the lifetime risk of dying from melanoma has gradually decreased among successive birth years. In Central Europe, a similar birth cohort pattern was observed, but it was delayed by 10-15 years. Of note, age-specific levels and changes in melanoma mortality rates in Western and in Central Europe are practically superimposable.
7
In general, lifetime risk patterns in women resembled to those seen in men, with closeness between sexes of birth years for which the risk of melanoma death was highest. In the Ireland and United Kingdom region, it took until 1995 before the lifetime risk of melanoma death in men came back to risk levels of men born around 1935. In Southern Europe, in both sexes, the birth years after which the risk to die from melanoma would decrease have not yet been reached, although in women less than 50, first signs of decreases are noticeable in recent years (Figure S3).
As a consequence of cohort effects, in most regions, stabilization and then declines in mortality rates progressively extended from younger to older age groups (Figure S3). This process is most advanced in Oceania and in North America, where first signs of leveling off and declines of rates in subjects more than 69 years of age are perceptible. In these two regions, trend in all ages have stabilized (men in Oceania) or are declining (women in Oceania and men and women in North America). In Western and Central Europe, mortality rates in all age groups have constantly risen but stabilization and declines in subjects less than 60 are discernible. In Southern Europe, stabilization of trends is perceptible over the recent past among subjects less than 50. In Ireland and United Kingdom, declines similar to those observed in women less than 50 were not yet visible in men of same age, which explains the persistence of a high risk of melanoma death in Irish and UK men born after 1953.
In all regions, independently of aging, melanoma deaths are progressively rarer in younger age groups and concentrates in subjects 50 years or more (Figures S4).
Discussion
Our study documented that variations in melanoma mortality rates over time were the result of substantial changes in the risk of melanoma death in successive generations. If after 2000 melanoma mortality was still on the rise in some Regions, particularly in Europe, this was essentially the consequence of sustained rising trends in older age groups because in younger age groups, these trends had stabilized or had started to decline well before 1990. Because data on causes of death are available from 1955 onwards in the WHO mortality database, birth cohort effects could not be explored for subjects born before 1875. However, probably that increasing lifetime risk of melanoma death was already present among subjects born before 1875.12 Peak years of risk were reached for subjects born around 1936-43 in Oceania, North America and Northern Europe, around 1948 in Western Europe, 1945-53 in the United Kingdom and Ireland and around 1957 in Central Europe. After peak years, steady reductions in mortality risks took place in successive generations. Over next decades, generations with gradually lower risk of lifetime melanoma death will replace generations that had higher lifetime risk of melanoma death. We thus expect that over coming decades, melanoma mortality will stop rising, stabilize and then decline in all light skinned populations. First signs of declines should be observed in Oceania and in Northern America, and lastly in Southern Europe.
However, if dying from melanoma is deemed to become a steadily uncommon event in younger and middle-aged adults, population aging will keep numbers of patients diagnosed with potentially fatal melanoma at a high level over the next two decades because the risk of melanoma death in men and women born around 1940 to 1950 is still high. After 2030, numbers of melanoma deaths are likely to progressively vanish when subjects born from

8
1970 onwards who have a low risk of melanoma death will reach their six or seventh decade of life.
A number of studies already indicated long-term declines in melanoma mortality starting in youngest age groups and progressively extending to older age groups.1,12-14 The principal strengths of our study iswere that we compared groups of countries populated with a majority of light-skinned subjects, and data we the used of data were collected over longer periods than in previous studies. Also, assembling data by region increased the statistical power, which contributed to greater accuracy in estimations of statistical parameters related to age, cohort and period effects. Limitations of our study were the absence of usable data for France and gaps in mortality data for some years like in the USA. Also, some countries brought corrections to their data, which might explain inconsistencies in trends like in Central Europe before 1970 (Figure S2f).
SEE THE NEW DISCUSSION IN THE REVISED MS, CLEAN VERSION
Could changes in melanoma mortality trends reflect the effect of treatment and of skin screening (including occasional removal of brown spots to periodical full body skin examination)? The predominance of cohort effects over period effects we found in our study argues against screening and treatment effects. If effective screening or treatment had existed since the 1980s, their impact on melanoma mortality rates would have affected several age groups at about the same time (period effect). Effective treatment exist only since 2010 and are not yet associated with long-lasting disease remission. For screening, first effects should have been observed in women 30 to 50 because this gender and age group is more inclined to attend skin screening. In addition, the purpose of skin screening is to detect melanoma before they have become thick with the possibility of metastases in lymph nodes or in distant organs. If skin screening was effective, downward mortality trends should be preceded by decreases in the incidence of tick melanoma. However, stable or steady increase in the incidence of thick melanoma are observed in virtually all fair-skinned populations (Ambrosini-Spaltro et al., 2014; Bordoni et al., 2013; Downing et al., 2006; Hollestein et al., 2012; Jemal et al., 2001; Lasithiotakis et al., 2006; Lipsker et al., 1999; MacKie et al., 2007; Marrett et al., 2001; Montella et al., 2009; Richardson et al., 2008; Tejera-Vaquerizo et al., 2008; van der Rhee et al., 1999; Whiteman et al., 2014). In subjects less than 50, , trends in thick melanoma are stabilizing or increase at a slower pace than in older subjects, but no data suggest declines in incidence of thick melanoma that would correlate with stabilization or declines in mortality trends in younger age groups (Baade et al., 2012; Jemal et al., 2011; Linos et al., 2009). Moreover, trends in thick melanoma remain stable or continue to increase in the USA and in Queensland (Australia) despite notable increases in the in the prevalence of skin examinations and excisions, and in the incidence of in situ melanoma, a marker of skin screening intensity (Carrière; Coory et al., 2006; Geller et al., 2013; Welch et al., 2005).The predominance of cohort effects points to the epidemiological and experimental evidence that UV exposure during early life would be the most critical period for the occurrence of sun-induced biological events implicated in the genesis of melanoma (IARC, 1992). For instance, migrant studies have documented that the risk of melanoma occurrence or of death is two to three times greater among light-skinned subjects born in Australia than among subjects of European descent who migrated to Australia after 15 years (Khlat et al., 1992; Whiteman et al., 2001). Melanoma occurrence in adult life seems unlikely in the absence of sun exposure during childhood (Autier & Doré, IJC, 1998(Autier et al., 1997)). Animal experiments have shown that susceptibility to UV-
Formatted: Highlight
Field Code Changed
Field Code Changed
Field Code Changed
Field Code Changed

9
induction of melanoma is greatest just after birth (Noonan et al., 2001; Zaidi et al., 2008)(Handoko et al, 2013). According to these data, some parallelism should exist between age-specific changes in melanoma incidence and mortality. Over the last three decades, increases in the incidence of invasive melanoma have been more marked than increases in melanoma mortality. Nonetheless, some evidence has recently emerged for stabilisation or decreasing trends in more recently‐born cohorts in Australia, New Zealand, the U.S.A., Canada and Norway (Erdmann et al., 2013).
Taken altogether, these facts indicate that the ultraviolet radiation would be capable to cause the occurrence of deadly melanoma in adult life when exposure takes place in early life.
We therefore formulate the hypothesis that trends in melanoma mortality would be due to dramatic changes in exposure of small children to ultraviolet radiation, when in the second part of the 19th century, beliefs in the healthiness virtues of the sun and of the ultraviolet radiation expanded among health professionals and large segments of the population (Albert et al., 2002; Albert et al., 2003; Hockberger, 2002; Holman et al., 1980). The popularity of exposing children to natural or artificial sources of UV would have been maximal around 1936 to 1957, depending on regions. The sun spectrum contained large amounts of UVA and UVB radiation and many artificial UV-emitting devices commercialized before 1960 emitted the full UV range, including the UVC, a wavelength present in the sunlight that is completely absorbed by the stratospheric ozone layer. At the time, there was complete ignorance about the deleterious effects of UV radiation. Starting in Oceania in the 1970-80s, sun protection of children has become increasingly common with the recognition that sun exposure and sunburn experience during childhood causes irreversible damages to the skin and are strong risk factors for skin cancer in adult life (MacKie et al., 2009; Marks, 1990). So, most probably that UV-exposure patterns of children associated with occurrence of deadly melanoma in adults have progressively disappeared in successive generations after 1960. However, in Southern Europe, these exposure patterns seem to have appeared more recently.
Long-term data on incidence of advanced melanoma going back to the 1970s and before are not available. However, the contrast between trends in the incidence of advanced melanoma and of melanoma mortality in younger age groups could be the sign of a progressive change in the disease biology, with melanoma being progressively less aggressive as one moves away from the peak birth years associated with highest risk of melanoma death. This hypothesis is supported by studies that examined the influence of year at diagnosis on risk of melanoma death over a fixed duration of follow-up (e.g., 5-year survival) and that took into consideration major predictors of melanoma patient survival.30,37,38 In these studies, the more recent the year of diagnosis, the better the survival. One study has suggested that vaccination against common infectious diseases in early life was associated with greater melanoma survival (Kolmel et al., 2005). One could speculate that increasing vaccination coverage after 1950 has induced immune-editing phenomena that have strengthened the capacity of the immune system to control potentially deadly melanoma.
Field Code Changed
Field Code Changed
Field Code Changed
Field Code Changed
Field Code Changed

10
The role of UV-exposure during adulthood on the risk of melanoma death remains unclear. One clue may proceed from Central European countries, where between 1945 and the 1990s, political and economic circumstances limited possibilities of holidays in sunny climates. However, levels and trends in melanoma mortality in Central and in Western Europe were quite similar, apart from a 10-year difference in the start of declines. These similarities may be an indication that recreational UV exposure during adult life has probably less influence on the risk of melanoma death. Recreational and cosmetic UV exposure in adult life, together with increasing skin screening and variability in the classification of histologically equivocal lesions would contribute for most of the raising incidence of non-life-threatening in situ or in thin invasive melanoma (Autier et al., 2011; Levell et al., 2009)(Norgaard et al, 2011; van der Rhee et al, 2009).
The strong association between aging and the risk of melanoma death suggests an interplay between accumulated sun exposure and the age-related decreasing capability of the immune system to control dormant cancer cells having considerable malignant potential (Shen et al., 2014). Probably that studies in adults should put the emphasis on factors altering the anti-cancer control functions of the immune system. In conclusion, over next decades, deaths due to melanoma in light-skinned populations will progressively concentrate in oldest subjects, and then progressively diminish for becoming an increasingly rare event.
Conflict of interest
None to declare
Formatted: Font color: Auto
Formatted: Font color: Auto
Formatted: Font color: Auto
Field Code Changed
Field Code Changed

11
Autier P, Doré JF. Influence of sun exposures during childhood and during adulthood on melanoma risk. EPIMEL and EORTC Melanoma Cooperative Group. European Organisation for Research and Treatment of Cancer. Int J Cancer. 1998 Aug 12;77(4):533-7. PubMed PMID: 9679754. IARC. International Agency for Research on Cancer (IARC) Monographs on the Evaluation of Carcinogenicity to Humans. Sunlight. IARC, Lyon. 1992
Nørgaard C, Glud M, Gniadecki R. Are all melanomas dangerous? Acta Derm Venereol. 2011 Sep;91(5):499-503. doi: 10.2340/00015555-1177. Review. PubMed PMID: 21874217. Figure captions
Figure 1 – Time trends in cutaneous melanoma mortality in Northern Europe, 1955-2010 (Denmark, Finland, Iceland, Norway, Sweden). Crude numbers of men (1a) and women (1b) who died from melanoma. Age-adjusted rates for men (1c) or women (1d) aged less than 50, 50 to 69, and 70 or more. Age-specific rates for men (1e) or women (1f) by 10-year age group. Thick vertical bars indicate years of rate stabilization. Age-specific melanoma mortality rate according to year of birth of men (1g) and women (1h). Cumulative lifetime risk of melanoma death according to year of birth relative to the risk in men (1i) and women (1j) born around 1935. Age-adjusted proportions of melanoma deaths in men (1k) or in women (1l) less than 50, 50 to 69, and 70 or more.
Figure 2 - Cumulative lifetime risk of melanoma death in regions according to year of birth relative to the risk in men and women born around 1935.
References
Albert MR, & Ostheimer KG. (2002). The evolution of current medical and popular attitudes toward ultraviolet light exposure: Part 1. J Am Acad Dermatol, 47(6), 930-937.
Albert MR, & Ostheimer KG. (2003). The evolution of current medical and popular attitudes toward ultraviolet light exposure: Part 3. J Am Acad Dermatol, 49(6), 1096-1106.
Ambrosini-Spaltro A, Dal Cappello T, Deluca J, Carriere C, Mazzoleni G, & Eisendle K. (2014). Melanoma incidence and breslow tumour thickness development in the central alpine region of south tyrol from 1998 to 2012: A population-based study. J Eur Acad Dermatol Venereol.
Autier P, Dore JF, Eggermont AM, & Coebergh JW. (2011). Epidemiological evidence that uva radiation is involved in the genesis of cutaneous melanoma. Curr Opin Oncol, 23(2), 189-196.
Autier P, Doré JF, Gefeller O, Cesarini JP, Lejeune F, Koelmel KF, Lienard D, Kleeberg UR, & EORTC melanoma co-operative group. (1997). Melanoma risk and residence in sunny areas. Br J Cancer, 76(11), 1521-1524.
Baade P, Meng X, Youlden D, Aitken J, & Youl P. (2012). Time trends and latitudinal differences in melanoma thickness distribution in australia, 1990-2006. Int J Cancer, 130(1), 170-178.
Formatted: Font: Not Bold
Formatted: Space After: 0 pt
Formatted: Left, Line spacing:
single, No bullets or numbering
Formatted: Font: Not Bold
Formatted: Left, Line spacing:
single, No bullets or numbering
Formatted: Font: 12 pt, Bold, Font
color: Auto
Formatted: Space After: 0 pt

12
Bordoni A, Leoni-Parvex S, Peverelli S, Mazzola P, Mazzucchelli L, & Spitale A. (2013). Opportunistic screening strategy for cutaneous melanoma does not change the incidence of nodular and thick lesions nor reduce mortality: A population-based descriptive study in the european region with the highest incidence. Melanoma Res.
Carrière P. Cancer screening in queensland men. Coory M, Baade P, Aitken J, Smithers M, McLeod GR, & Ring I. (2006). Trends for in situ and invasive
melanoma in queensland, australia, 1982-2002. Cancer Causes Control, 17(1), 21-27. Downing A, Newton-Bishop JA, & Forman D. (2006). Recent trends in cutaneous malignant melanoma
in the yorkshire region of england; incidence, mortality and survival in relation to stage of disease, 1993-2003. Br J Cancer, 95(1), 91-95.
Erdmann F, Lortet-Tieulent J, Schuz J, Zeeb H, Greinert R, Breitbart EW, & Bray F. (2013). International trends in the incidence of malignant melanoma 1953-2008--are recent generations at higher or lower risk? Int J Cancer, 132(2), 385-400.
Geller AC, Clapp RW, Sober AJ, Gonsalves L, Mueller L, Christiansen CL, Shaikh W, & Miller DR. (2013). Melanoma epidemic: An analysis of six decades of data from the connecticut tumor registry. J Clin Oncol, 31(33), 4172-4178.
Hockberger PE. (2002). A history of ultraviolet photobiology for humans, animals and microorganisms. Photochem Photobiol, 76(6), 561-579.
Hollestein LM, van den Akker SA, Nijsten T, Karim-Kos HE, Coebergh JW, & de Vries E. (2012). Trends of cutaneous melanoma in the netherlands: Increasing incidence rates among all breslow thickness categories and rising mortality rates since 1989. Ann Oncol, 23(2), 524-530.
Holman CD, James IR, Gattey PH, & Armstrong BK. (1980). An analysis of trends in mortality from malignant melanoma of the skin in australia. Int J Cancer, 26(6), 703-709.
Jemal A, Devesa SS, Hartge P, & Tucker MA. (2001). Recent trends in cutaneous melanoma incidence among whites in the united states. J Natl Cancer Inst, 93(9), 678-683.
Jemal A, Saraiya M, Patel P, Cherala SS, Barnholtz-Sloan J, Kim J, Wiggins CL, & Wingo PA. (2011). Recent trends in cutaneous melanoma incidence and death rates in the united states, 1992-2006. J Am Acad Dermatol, 65(5 Suppl 1), S17-25 e11-13.
Khlat M, Vail A, Parkin M, & Green A. (1992). Mortality from melanoma in migrants to australia: Variation by age at arrival and duration of stay. Am J Epidemiol, 135(10), 1103-1113.
Kolmel KF, Grange JM, Krone B, Mastrangelo G, Rossi CR, Henz BM, Seebacher C, Botev IN, Niin M, Lambert D, Shafir R, Kokoschka EM, Kleeberg UR, Gefeller O, & Pfahlberg A. (2005). Prior immunisation of patients with malignant melanoma with vaccinia or bcg is associated with better survival. An european organization for research and treatment of cancer cohort study on 542 patients. Eur J Cancer, 41(1), 118-125.
Lasithiotakis KG, Leiter U, Gorkievicz R, Eigentler T, Breuninger H, Metzler G, Strobel W, & Garbe C. (2006). The incidence and mortality of cutaneous melanoma in southern germany: Trends by anatomic site and pathologic characteristics, 1976 to 2003. Cancer, 107(6), 1331-1339.
Levell NJ, Beattie CC, Shuster S, & Greenberg DC. (2009). Melanoma epidemic: A midsummer night's dream? Br J Dermatol, 161(3), 630-634.
Linos E, Swetter SM, Cockburn MG, Colditz GA, & Clarke CA. (2009). Increasing burden of melanoma in the united states. J Invest Dermatol, 129(7), 1666-1674.
Lipsker DM, Hedelin G, Heid E, Grosshans EM, & Cribier BJ. (1999). Striking increase of thin melanomas contrasts with stable incidence of thick melanomas. Arch Dermatol, 135(12), 1451-1456.
MacKie RM, Bray C, Vestey J, Doherty V, Evans A, Thomson D, Nicolson M, & Scottish Melanoma G. (2007). Melanoma incidence and mortality in scotland 1979-2003. Br J Cancer, 96(11), 1772-1777.
MacKie RM, Hauschild A, & Eggermont AM. (2009). Epidemiology of invasive cutaneous melanoma. Ann Oncol, 20 Suppl 6, vi1-7.
Marks R. (1990). Skin cancer control in the 1990's, from slip! Slop! Slap! To sun smart. Australas J Dermatol, 31(1), 1-4.

13
Marrett LD, Nguyen HL, & Armstrong BK. (2001). Trends in the incidence of cutaneous malignant melanoma in new south wales, 1983-1996. Int J Cancer, 92(3), 457-462.
Montella A, Gavin A, Middleton R, Autier P, & Boniol M. (2009). Cutaneous melanoma mortality starting to change: A study of trends in northern ireland. Eur J Cancer, 45(13), 2360-2366.
Noonan FP, Recio JA, Takayama H, Duray P, Anver MR, Rush WL, De Fabo EC, & Merlino G. (2001). Neonatal sunburn and melanoma in mice. Nature, 413(6853), 271-272.
Richardson A, Fletcher L, Sneyd M, Cox B, & Reeder AI. (2008). The incidence and thickness of cutaneous malignant melanoma in new zealand 1994-2004. N Z Med J, 121(1279), 18-26.
Shen S, Wolfe R, McLean CA, Haskett M, & Kelly JW. (2014). Characteristics and associations of high-mitotic-rate melanoma. JAMA Dermatol.
Tejera-Vaquerizo A, Mendiola-Fernandez M, Fernandez-Orland A, & Herrera-Ceballos E. (2008). Thick melanoma: The problem continues. J Eur Acad Dermatol Venereol, 22(5), 575-579.
van der Rhee HJ, van der Spek-Keijser LM, van Westering R, & Coebergh JW. (1999). Increase in and stabilization of incidence and mortality of primary cutaneous malignant melanoma in western netherlands, 1980-95. Br J Dermatol, 140(3), 463-467.
Welch HG, Woloshin S, & Schwartz LM. (2005). Skin biopsy rates and incidence of melanoma: Population based ecological study. BMJ, 331(7515), 481.
Whiteman DC, Baade PD, & Olsen CM. (2014). More people die from thin melanomas (1 mm) than from thick melanomas (>4 mm) in queensland, australia. J Invest Dermatol.
Whiteman DC, Whiteman CA, & Green AC. (2001). Childhood sun exposure as a risk factor for melanoma: A systematic review of epidemiologic studies. Cancer Causes Control, 12(1), 69-82.
Zaidi MR, Day CP, & Merlino G. (2008). From uvs to metastases: Modeling melanoma initiation and progression in the mouse. J Invest Dermatol, 128(10), 2381-2391.
Formatted: French (France)

1
Ms. Ref. No.: EJC-D-14-01809, revised version
The forthcoming inexorable decline of cutaneous melanoma
mortality in light-skinned populations
Philippe Autier, MD 1,2 ; Alice Koechlin, MSc 1,2; Mathieu Boniol, PhD 1,2
1 University of Strathclyde Institute of Global Public Health at iPRI, International Prevention
Research Institute , 95 Cours Lafayette, 69006 Lyon, France
2 International Prevention Research Institute (iPRI), 95 Cours Lafayette, 69006 Lyon, France
Corresponding author: Dr Philippe Autier, International Prevention Research Institute (iPRI),
95 Cours Lafayette, 69006 Lyon, France
E-mail: [email protected]; website: www.i-pri.org
Funding: This work was financed by the International Prevention Research Institute, Lyon,
France.
*ManuscriptClick here to view linked References

2
Abstract
Background: Reasons underlying time changes in cutaneous melanoma mortality in light-
skinned populations are not well understood. An analysis of long-term time trends in
melanoma mortality was carried out after regrouping countries in homogeneous regions.
Methods: Using the WHO mortality database, age-period-cohort models were fitted for
seven regions where the majority of population is light-skinned. Cohort effects are denoted
as changes in rates occurring at different time in steadily older age groups. Period effects are
denoted as changes in rates occurring simultaneously in several age groups.
Results: Cohort effects better explained changes in melanoma mortality over time than
period effects. Lifetime risk to die from melanoma increased in successive generations from
1875 until a peak year. Peak years were for subjects born in 1936-40 in Oceania, 1937-43 in
North America, 1941-42 in Northern Europe, 1945-53 in UK and Ireland, 1948 in Western
Europe, and 1957 in Central Europe. After peak years, lifetime risk of melanoma death
gradually decreased in successive generations and risks of subjects born in 1990-95 were
back to risk levels observed for subjects born before 1900-05. In Southern Europe, birth
years with highest lifetime risk of melanoma death have not yet been attained. As time
passes, melanoma deaths will steadily rarefy in younger age groups and concentrate in older
age groups, for ultimately fade away after 2040-50.
Conclusion: Independently from screening or treatment, over next decades, death from
melanoma is likely to become an increasingly rare event. The temporary epidemic of fatal
melanoma was most probably due to excessive UV-exposure of children that prevailed in
1900-1960, and mortality decreases would be due to progressive reductions in UV-exposure
of children over the last decades.

3
Key words: Melanoma, mortality, time trends, age-period-cohort, ultraviolet

4
Introduction
The cutaneous malignant melanoma (hereafter termed melanoma) is the deadliest form of
skin cancer. From 1955 to around 1985, melanoma death rates have more than doubled in
all light-skinned populations. After 1985-1990, less steep increases or stabilizations, and
even decreases in melanoma mortality rates have been observed in Australia,[1] in the USA
[2] and in several European countries [3-8]. However, understanding reasons possibly
underlying time variations in the death toll due to melanoma is quite challenging when one
looks more closely at the age at which these deaths occurred. For instance, in Northern
Europe (i.e., Denmark, Finland, Iceland, Norway, Sweden), before 1970, a minority of
melanoma deaths occurred in subjects aged 70 or more while after 1995 in men and 1985 in
women, melanoma deaths were more numerous in this age group (Figure 1ab). Numbers of
melanoma deaths in subjects less than 50 increased until around 1975, then stabilized and
slowly decreased. Numbers of deaths in subjects aged 50 to 69 raised steeply until 1985-90,
after which rates slowed down in men and plateaued in women. Comparable
epidemiological features have been observed in all light-skinned populations (Figure S1). The
contrasting time variations in melanoma death across age groups indicate that the influence
of risk factors involved in the occurrence of deadly melanoma had varied over time and is
independent from population ageing. Factors independent of ageing that influence disease
burden over time are defined as period or cohort effects or a combination of both.[9] Period
effects are characterized by changes in mortality rates taking place at about the same time
in several age groups, for instance after the offering of efficient screening program or
treatment to subjects of different ages. Cohort effects are characterized by changes in
mortality rates taking place in successive generations, for instance after introduction of

5
prevention policies targeting children whose effect on mortality will be first observed in
younger age groups and then progressively extend to older age groups.
In order to better understand reasons underlying divergences in age-specific trends in
melanoma mortality, we carried out an analysis of long-term time trends in melanoma
mortality in countries where the majority of the population is light-skinned. The objective of
our study was to disentangle the respective contributions of age at which melanoma death
occurred, of population aging, of cohort effects, and of period effects. To this end, we
regrouped countries by homogeneous geographical regions so that sufficient statistical
power could be secured.
Methods
Mortality data
Mortality data on melanoma were retrieved from the WHO mortality database (09/07/2012
release). Data were extracted for countries mainly populated with light-skinned subjects.
Annual data were obtained for each sex by 5-years age groups (from 0-4 years to 85 and
more). Melanoma mortality codes from the international classifications of diseases (ICD)
were 190 for ICD7, 172 for ICD8, 172 for ICD9, C43 for ICD10. Data were available from 1955
to 2010 in most countries. France was excluded of the analysis because of misclassification
in melanoma/Non Melanoma Skin Cancer codes in the 1960s owing to problems in transition
from ICD7 to ICD8 lists. In the USA, melanoma mortality data were not available for the
1968-1978.

6
Grouping countries into regions
In order to increase the statistical power of the analysis, countries were grouped into main
regions of the world. Within each region, deaths and population by age group and sex were
added. Countries were grouped as follows:
Oceania: Australia and New-Zealand
North America: Canada and the United States of America (USA)
Northern Europe: Denmark, Finland, Iceland, Norway, Sweden
United Kingdom and Ireland
Western Europe: Austria, Belgium, Germany (former German Democratic Republic
and former Federal Republic of Germany 1980-1989; Reunified Germany since
1990), the Netherlands and Switzerland
Central Europe: Bulgaria, the Czech Republic, Estonia, Hungary, Latvia, Poland,
Romania, Slovakia and Slovenia
Southern Europe: Greece, Italy, Portugal and Spain
Statistical analysis
Age standardisation
Mortality rates were age-standardized by the direct method using Segi World standard
population [10] as reference.
Joinpoint Modelling
Time changes in the age-standardized rates were modelled using joinpoint version 3.5.0
(Joinpoint Regression Program, Version 3.5 - April 2011; Statistical Methodology and
Applications Branch and Data Modelling Branch, Surveillance Research Program National

7
Cancer Institute). Joinpoint enables to model several regression lines connected by
joinpoints at which significant inflexion could be detected; the program reports the simplest
model that the data allow. Log-linear models were used in the analysis of trends and the
identification of 0 to 3 joinpoints to either end of the data were allowed. The minimum
number of allowed data points between joinpoints was 4.
This time-trend modeling approach enables to provide an evaluation of trends that is not
user dependent as finding of joinpoints is data driven and identified through a series of
permutation tests. Analyses were carried out for each region by sex and by age group (less
than 50; 50 to 69 and more than 70).
Age-period-cohort modelling
Age-period-cohort (APC) models were fitted to mortality data using R 3.0.1. More precisely,
the function apc.fit from the Epi 1.1.67 package [11] was used. To solve the problem of
identifiability in such models[9], a penalty function was applied to period effects which
constrained the average period effect to be null with a null slope.
The analysis was repeated applying the same penalty function to the cohort effect. Applying
the penalty function to the period effect or to the cohort effect resulted in similar changes in
deviance (data not shown).
Subjects less than 15 were excluded from analyses. In results, cohorts were identified by
their middle-year. Because first and last years of available data on causes of death could vary
between countries, or because of missing years, study periods were restricted to 5-year
groups for which complete data were available. The reference cohort, noted 1935,
corresponds to people born between the 1st of January 1933 and the 31st of December 1937.
The year 1935 was selected because in all regions, it was approximately the median birth

8
cohort of subjects who died from melanoma. Results from APC models included age-specific
effects, cohorts and period effects reported as relative risk with a reference cohort set to
1935 (RR=1·0).
Results
Detailed results for Northern Europe are presented first after which main results for all
regions are provided with complete results displayed in the supplementary materials.
Northern European countries
Mortality rates in Figure 1cd are the numbers of melanoma deaths displayed in Figure 1ab
divided by numbers of men or women of each age group in given year, followed by age
standardization on the Segi World Standard Population[10]. Hence trends in Figures 1cd are
independent of population aging. Time trends were derived from joinpoint analyses that
quantified percent changes in mortality rates during a specific time period and detected
years during which statistically significant changes in trends were noticeable (Table S1).
Overall, melanoma mortality was still rising in the 2000s with annual percent changes of
2.47% (95% CI: 0.91; 4.05) in 2002-10 in men and of 1.53% (95% CI: 0.73; 2.34) in 1996-2010
in women. However, in men and women less than 50, an abrupt reversal in trends took place
in 1970-71, while in men and women 50-69, trends stabilized after 1983-84. In men and
women aged 70 and more, trends have risen without interruption from 1955 to 2010.
A more refined examination of trends specific to each 10-year age group show that the
younger the men and women, the earlier the stabilization or start of declines in trends
(Figure 1ef). For each increment in 10-year age group, there was a 6 to 8 years shift of the
year from which rates started to stabilize. Downward trends in years after the stabilization
were observed for men and women less than 50, but not yet for the 50-59 and 60-69 age

9
groups. Above 69 years of age, melanoma mortality rates continued to rise. A subject aged
70 in 2010 was born in 1940. Hence the risk of melanoma death has leveled off in successive
generations of subjects born after 1940, which is the hallmark of cohort effects. Because in
2010, subjects born after 1940 have not yet reached 70 years of age, stabilization of
mortality rates are not yet visible in subjects aged 70 and more.
Instead of examining trends according to calendar years, one can examine trends according
to years of birth (Figure 1gh). Each curve reflects changes in mortality rates specific to 10-
year age groups whose subjects were born at different epochs. The vertical dashed line
indicates that trends in melanoma mortality stabilized and then declined in successive
cohorts of men born after 1940-45. Rates will continue to decline in cohorts of subjects less
than 70 born after 1940. It is highly likely that in coming years, rates in subjects aged 70 or
more born after 1940-45 will progressively stabilize and then decline.
From age-period-cohort analyses, we could quantify the influence of cohort and period
effects on time trends of melanoma death through an examination of the residual deviance
of models that is the amount of variation in mortality data not explained by a model.
Analysis of deviance comparing the five classical models (Age, age-drift, age-cohort, age-
period and age-period-cohort) are reported in Table S2. The residual deviance was smaller
for age-cohort models than for age-period models, indicating that changes in melanoma
mortality over time were better explained by cohort effects than by period effects.
Therefore, the remaining of the text will focus on results from age-period-cohort models
with penalty function applied to the period effect.
Birth cohort effects can be summarized as the risk to die from melanoma when born at a
certain year relative to a reference year (1935) for which the risk is arbitrarily set to 1·0

10
(Figure 1ij). Peak years for highest risk of melanoma death were observed in men born
around 1942 and in women born around 1941. The relative risk of melanoma death of men
born before 1885 was less than 0·25, i.e., less than 25% the risk of melanoma death of men
born around 1935. The relative risk of women born before 1885 was 30% the risk of
melanoma death of women born around 1935. After 1941-42, risks declined without
interruption. The risk of melanoma death of men and women born around 1990 was similar
to the risk of men and women born around 1900.
Because of cohort effects, as time passes, melanoma deaths concentrate in older age groups
and become steadily rarer in younger age groups (Figure 1kl). Independently from
population aging, in 1955-59, 30% of melanoma deaths in men occurred before age 50, 40%
of deaths occurred between 50 and 69, and 30% occurred after 69. From 2005 to 2010, 10%
of melanoma deaths in men occurred before age 50, 40% of deaths occurred between 50
and 69, and 50% occurred after 69. Comparable changes were observed in women.
Results for other regions
Similarly to Northern Europe, age-adjusted melanoma mortality rates stabilized and then
declined in subjects less than 50, slowed down or stabilized in subjects 50 to 69, and kept
rising in subjects 70 years or more (Figure S2). If from 2000 to 2010 annual percent changes
for all age groups indicated still raising melanoma mortality, principally in Europe (Table S1),
this was largely due to the demographic weight of older subjects who experienced unabated
raising trends in melanoma mortality. Hence, trends were mainly explained by cohort
effects, and with few exceptions, the residual deviance of age-cohort models was smaller
than that of age-period models (Table S2).

11
Figure 2 shows the lifetime risk of melanoma death for each birth year in a region relative to
rates in that region observed in the birth cohort centered around 1935. Relative risks are to
be interpreted for each region, and not between regions. Contrasts in trends between
regions are the consequence of variations in peak birth years associated with highest risk of
melanoma death. In all regions, the risk of melanoma death in men was minimal for men
born before 1880. Then risks sharply increased, reaching a peak for men born in 1940 in
Oceania, 1943 in North America, 1942 in Northern Europe, 1948 in Western Europe and
1957 in Central Europe. After peak years, the lifetime risk of dying from melanoma has
gradually decreased among successive birth years. Of note, age-specific levels and changes
in melanoma mortality rates in Western and in Central Europe are practically
superimposable.
In general, lifetime risk patterns in women resembled to those seen in men, with closeness
between sexes of birth years for which the risk of melanoma death was highest. In the
Ireland and United Kingdom region, it took until 1995 before the lifetime risk of melanoma
death in men came back to risk levels of men born around 1935. In Southern Europe, in both
sexes, the birth years after which the risk to die from melanoma would decrease have not
yet been reached, although in women less than 50, first signs of decreases are noticeable in
recent years (Figure S3).
As a consequence of cohort effects, in most regions, stabilization and then declines in
mortality rates progressively extended from younger to older age groups (Figure S3). This
process is most advanced in Oceania and in North America, where first signs of leveling off
and declines of rates in subjects more than 69 years of age are perceptible. In these two
regions, rates have stabilized (men in Oceania) or are declining (women in Oceania and men
12
and women in North America) in all age groups. In Western and Central Europe, stabilization
and declines in subjects less than 60 are discernible. In Southern Europe, stabilization of
rates is perceptible over the recent past among subjects less than 50. In Ireland and United
Kingdom, declines similar to those observed in women less than 50 were not yet visible in
men of same age, which explains the persistence of a high risk of melanoma death in Irish
and UK men born after 1953.
In all regions, independently of aging, melanoma deaths are progressively rarer in younger
age groups and concentrates in subjects 50 years or more (Figures S4).
Discussion
Our study documents that variations in melanoma mortality rates over time were the result
of substantial changes in the risk of melanoma death in successive generations. If after 2000
melanoma mortality was still on the rise in some Regions, particularly in Europe, this was
essentially the consequence of sustained rising trends in older age groups because in
younger age groups, these trends had stabilized or had started to decline before 1990. Data
on causes of death are available from 1955 onwards in the WHO mortality database, and
cohort effects could not be explored for subjects born before 1875. However, probably that
increasing lifetime risk of melanoma death was already present among subjects born before
1875[12]. After years of highest risk of melanoma deaths, steady reductions in mortality risks
took place in successive generations. Over next decades, generations with gradually lower
risk of lifetime melanoma death will replace generations that had higher lifetime risk of
melanoma death. We thus expect that in the near future, melanoma mortality will stabilize
and then decline in all light skinned populations. First signs of declines should be observed in
Oceania and in Northern America, and lastly in Southern Europe.

13
However, if dying from melanoma is deemed to become a steadily uncommon event in
younger and middle-aged adults, population aging will keep numbers of patients diagnosed
with potentially fatal melanoma at a high level over the next two decades because the risk of
melanoma death in men and women born around 1940 to 1950 is still high. After 2030,
numbers of melanoma deaths are likely to progressively vanish when subjects born from
1970 onwards who have a low risk of melanoma death will reach their six or seventh decade
of life.
A number of studies already indicated long-term declines in melanoma mortality starting in
youngest age groups and progressively extending to older age groups. [1, 12-14] The
principal strengths of our study is the use of data collected over longer periods than in
previous studies. Also, assembling data by region increased the statistical power, which
contributed to greater accuracy in estimations of statistical parameters related to age,
cohort and period effects. Limitations of our study were the absence of usable data for
France and gaps in mortality data for some years like in the USA. Also, some countries
brought corrections to their data, which might explain inconsistencies in trends like in
Central Europe before 1970 (Figure S2f).
The predominance of cohort effects over period effects we found in our study argues against
screening and treatment effects. If effective screening or treatment had existed since the
1980s, their impact on melanoma mortality rates would have affected several age groups at
about the same time (period effect). Effective treatment exist only since 2010 and are not
yet associated with long-lasting disease remission [15]. For screening, first effects should
have been observed in women 30 to 50 because this sex and age group is more inclined to
attend skin screening. In addition, the purpose of skin screening is to detect melanoma

14
before they have become thick with the possibility of metastases in lymph nodes or in
distant organs. If skin screening was effective, downward mortality trends should be
preceded by decreases in the incidence of thick melanoma. However, stable or steady
increase in the incidence of thick melanoma are observed in virtually all fair-skinned
populations [3, 7, 16-27]. In subjects less than 50, , trends in thick melanoma are stabilizing
or increase at a slower pace than in older subjects, but no data suggest declines in incidence
of thick melanoma that would correlate with stabilization or declines in mortality trends in
younger age groups [2, 28, 29].
The predominance of cohort effects points to the knowledge that early life would be the
most critical period for the occurrence of UV-induced biological events implicated in the
genesis of melanoma [30]. For instance, migrant studies have documented that the risk of
melanoma occurrence or of death is two to three times greater among light-skinned subjects
born in Australia than among subjects of European descent who migrated to Australia after
15 years [31, 32]. Melanoma risk in adult life seems to be low in the absence of sun exposure
during childhood [33, 34]. Animal experiments have shown that susceptibility to UV-
induction of melanoma is greatest just after birth [35-37]. According to these data, some
parallelism should exist between age-specific changes in melanoma incidence and mortality.
Over the last three decades, increases in the incidence of invasive melanoma have been
more marked than increases in melanoma mortality. Nonetheless, some evidence has
recently emerged for stabilisation or decreasing incidence in more recently‐born cohorts in
Australia, New Zealand, the U.S.A., Canada and Norway [38].
Taken altogether, these facts indicate that the ultraviolet radiation would be capable to
cause the occurrence of deadly melanoma in adult life when exposure takes place in early

15
life. We therefore formulate the hypothesis that trends in melanoma mortality would be due
to dramatic changes in exposure of small children to UV radiation, when in the second part
of the 19th century, beliefs in the healthiness virtues of the sun and of the ultraviolet
radiation expanded among health professionals and large segments of the population [12,
39-41]. The popularity of exposing children to natural or artificial sources of UV would have
been maximal around 1930 to 1960, depending on regions. The sun spectrum contained
large amounts of UVA and UVB radiation and many artificial UV-emitting devices
commercialized before 1960 emitted the full UV range, including the UVC, a highly
carcinogenic wavelength present in the sunlight but that is completely absorbed by the
stratospheric ozone layer. At the time, there was complete ignorance about the carcinogenic
effects of UV radiation. Starting in Oceania in the 1970-80s, sun protection of children has
become increasingly common with the recognition that sun exposure and sunburn
experience during childhood causes irreversible damages to the skin and are strong risk
factors for skin cancer in adult life [42, 43]. So, most probably that UV-exposure patterns of
children associated with occurrence of deadly melanoma in adults have progressively
disappeared in successive generations after 1960. However, in Southern Europe, these
exposure patterns seem to have appeared more recently.
Long-term data on incidence of advanced melanoma going back to the 1970s and before are
not available. However, the contrast between trends in the incidence of advanced
melanoma and of melanoma mortality in younger age groups could be the sign of a gradual
change in the disease biology, with melanoma being progressively less aggressive as one
moves away from the peak birth years associated with highest risk of melanoma death. This
hypothesis is supported by studies that examined the influence of year at diagnosis on risk of
melanoma death over a fixed duration of follow-up (e.g., 5-year survival) and that took into

16
consideration major predictors of melanoma patient survival. [16, 44, 45] In these studies,
the more recent the year of diagnosis, the better the survival. One study has suggested that
vaccination against common infectious diseases in early life was associated with greater
melanoma survival [46]. One could speculate that increasing vaccination coverage of small
children after 1950 could have strengthened the immune surveillance of potentially deadly
melanoma initiated by UV exposures during early life.
How UV exposure during adulthood affects the risk of melanoma death remains unclear.
One clue may proceed from Central European countries, where between 1945 and 1989,
political and economic circumstances have limited possibilities of holidays in sunny climates.
However, levels and trends in melanoma mortality in Central and in Western Europe were
quite similar, apart from a 10-year difference in birth cohorts with highest risk of melanoma
death. These similarities may be an indication that recreational UV exposure during adult life
has probably little influence on the risk of melanoma death. In contrast, recreational and
cosmetic UV exposure in adult life, together with increasing skin screening and variability in
the classification of histologically equivocal lesions would have contributed to most of the
rising incidence of non-life-threatening in situ or thin invasive melanoma [47-50].
The strong association between aging and the risk of melanoma death suggests an interplay
between accumulated sun exposure and the age-related decreasing capability of the
immune system to control dormant cancer cells having considerable malignant potential
[51]. Probably that studies in adults should put the emphasis on factors altering the anti-
cancer control functions of the immune system like for instance the UV-induced
inflammation [52].

17
In conclusion, over next decades, deaths due to melanoma in light-skinned populations will
progressively concentrate in oldest subjects, and then progressively diminish for becoming
an increasingly rare event.
Conflict of interest
None to declare

18
Figure captions
Figure 1 – Time trends in cutaneous melanoma mortality in Northern Europe, 1955-2010
(Denmark, Finland, Iceland, Norway, Sweden). Crude numbers of men (1a) and women (1b)
who died from melanoma. Age-adjusted rates for men (1c) or women (1d) aged less than 50,
50 to 69, and 70 or more. Age-specific rates for men (1e) or women (1f) by 10-year age
group. Thick vertical bars indicate years of rate stabilization. Age-specific melanoma
mortality rate according to year of birth of men (1g) and women (1h). Cumulative lifetime
risk of melanoma death according to year of birth relative to the risk in men (1i) and women
(1j) born around 1935. Age-adjusted proportions of melanoma deaths in men (1k) or in
women (1l) less than 50, 50 to 69, and 70 or more.
Figure 2 - Cumulative lifetime risk of melanoma death in regions according to year of birth
relative to the risk in men and women born around 1935.

19
References
1. Giles GG, Armstrong BK, Burton RC, Staples MP, Thursfield VJ. Has mortality from melanoma stopped rising in Australia? Analysis of trends between 1931 and 1994. Bmj 1996;312(7039):1121-5. 2. Linos E, Swetter SM, Cockburn MG, Colditz GA, Clarke CA. Increasing burden of melanoma in the United States. J Invest Dermatol 2009;129(7):1666-74. 3. Montella A, Gavin A, Middleton R, Autier P, Boniol M. Cutaneous melanoma mortality starting to change: a study of trends in Northern Ireland. Eur J Cancer 2009;45(13):2360-6. 4. Vranova J, Arenbergerova M, Arenberger P, Vrana A, Zivcak J, Kolarova H, et al. Malignant melanoma in the Czech Republic: Incidence and mortality according to sex, age and disease stage. Biomed Pap Med Fac Univ Palacky Olomouc Czech Repub 2012. 5. Cayuela A, Rodriguez-Dominguez S, Vigil E, Conejo-Mir JS. Effect of age, birth cohort and period of death on skin melanoma mortality in Spain, 1975 through 2004. Int J Cancer 2008;122(4):905-8. 6. Comstock GW, Gordon GB, Hsing AW. The relationship of serum dehydroepiandrosterone and its sulfate to subsequent cancer of the prostate. Cancer Epidemiol Biomarkers Prev 1993;2(3):219-21. 7. Lasithiotakis KG, Leiter U, Gorkievicz R, Eigentler T, Breuninger H, Metzler G, et al. The incidence and mortality of cutaneous melanoma in Southern Germany: trends by anatomic site and pathologic characteristics, 1976 to 2003. Cancer 2006;107(6):1331-9. 8. Severi G, Giles GG, Robertson C, Boyle P, Autier P. Mortality from cutaneous melanoma: evidence for contrasting trends between populations. Br J Cancer 2000;82(11):1887-91. 9. Clayton D, Schifflers E. Models for temporal variation in cancer rates. II: Age-period-cohort models. Stat Med 1987;6(4):469-81. 10. Segi M. Cancer mortality for selected sites in 24 countries (1950-57). Sendai, Japan: Department of Public Health, Tohoku University of Medicine; 1960. 11. Carstensen B. Age-period-cohort models for the Lexis diagram. Stat Med 2007;26(15):3018-45. 12. Holman CD, James IR, Gattey PH, Armstrong BK. An analysis of trends in mortality from malignant melanoma of the skin in Australia. Int J Cancer 1980;26(6):703-9. 13. Venzon DJ, Moolgavkar SH. Cohort analysis of malignant melanoma in five countries. Am J Epidemiol 1984;119(1):62-70. 14. Scotto J, Pitcher H, Lee JA. Indications of future decreasing trends in skin-melanoma mortality among whites in the United States. Int J Cancer 1991;49(4):490-7. 15. Eggermont AMM, Spatz A, Robert C. Cutaneous melanoma. The Lancet 2014;383(9919):816-827. 16. MacKie RM, Bray C, Vestey J, Doherty V, Evans A, Thomson D, et al. Melanoma incidence and mortality in Scotland 1979-2003. Br J Cancer 2007;96(11):1772-7. 17. Marrett LD, Nguyen HL, Armstrong BK. Trends in the incidence of cutaneous malignant melanoma in New South Wales, 1983-1996. Int J Cancer 2001;92(3):457-62. 18. Tejera-Vaquerizo A, Mendiola-Fernandez M, Fernandez-Orland A, Herrera-Ceballos E. Thick melanoma: the problem continues. J Eur Acad Dermatol Venereol 2008;22(5):575-9. 19. van der Rhee HJ, van der Spek-Keijser LM, van Westering R, Coebergh JW. Increase in and stabilization of incidence and mortality of primary cutaneous malignant melanoma in Western Netherlands, 1980-95. Br J Dermatol 1999;140(3):463-7. 20. Downing A, Newton-Bishop JA, Forman D. Recent trends in cutaneous malignant melanoma in the Yorkshire region of England; incidence, mortality and survival in relation to stage of disease, 1993-2003. Br J Cancer 2006;95(1):91-5. 21. Jemal A, Devesa SS, Hartge P, Tucker MA. Recent trends in cutaneous melanoma incidence among whites in the United States. J Natl Cancer Inst 2001;93(9):678-83.

20
22. Richardson A, Fletcher L, Sneyd M, Cox B, Reeder AI. The incidence and thickness of cutaneous malignant melanoma in New Zealand 1994-2004. N Z Med J 2008;121(1279):18-26. 23. Ambrosini-Spaltro A, Dal Cappello T, Deluca J, Carriere C, Mazzoleni G, Eisendle K. Melanoma incidence and Breslow tumour thickness development in the central Alpine region of South Tyrol from 1998 to 2012: a population-based study. J Eur Acad Dermatol Venereol 2014. 24. Lipsker DM, Hedelin G, Heid E, Grosshans EM, Cribier BJ. Striking increase of thin melanomas contrasts with stable incidence of thick melanomas. Arch Dermatol 1999;135(12):1451-6. 25. Hollestein LM, van den Akker SA, Nijsten T, Karim-Kos HE, Coebergh JW, de Vries E. Trends of cutaneous melanoma in The Netherlands: increasing incidence rates among all Breslow thickness categories and rising mortality rates since 1989. Ann Oncol 2012;23(2):524-30. 26. Bordoni A, Leoni-Parvex S, Peverelli S, Mazzola P, Mazzucchelli L, Spitale A. Opportunistic screening strategy for cutaneous melanoma does not change the incidence of nodular and thick lesions nor reduce mortality: a population-based descriptive study in the European region with the highest incidence. Melanoma Res 2013. 27. Whiteman DC, Baade PD, Olsen CM. More People Die from Thin Melanomas (1 mm) than from Thick Melanomas (>4 mm) in Queensland, Australia. J Invest Dermatol 2014. 28. Baade P, Meng X, Youlden D, Aitken J, Youl P. Time trends and latitudinal differences in melanoma thickness distribution in Australia, 1990-2006. Int J Cancer 2012;130(1):170-8. 29. Jemal A, Saraiya M, Patel P, Cherala SS, Barnholtz-Sloan J, Kim J, et al. Recent trends in cutaneous melanoma incidence and death rates in the United States, 1992-2006. J Am Acad Dermatol 2011;65(5 Suppl 1):S17-25 e1-3. 30. IARC monographs on the evaluation of carcinogenic risks to humans. Solar and ultraviolet radiation. Lyon, France: International Agency for Research on Cancer; 1992. Report No.: 1017-1606 (Print)
1017-1606. 31. Khlat M, Vail A, Parkin M, Green A. Mortality from melanoma in migrants to Australia: variation by age at arrival and duration of stay. Am J Epidemiol 1992;135(10):1103-13. 32. Whiteman DC, Whiteman CA, Green AC. Childhood sun exposure as a risk factor for melanoma: a systematic review of epidemiologic studies. Cancer Causes Control 2001;12(1):69-82. 33. Autier P, Doré JF, Gefeller O, Cesarini JP, Lejeune F, Koelmel KF, et al. Melanoma risk and residence in sunny areas. Br J Cancer 1997;76(11):1521-4. 34. Autier P, Dore JF. Influence of sun exposures during childhood and during adulthood on melanoma risk. EPIMEL and EORTC Melanoma Cooperative Group. European Organisation for Research and Treatment of Cancer. Int J Cancer 1998;77(4):533-7. 35. Noonan FP, Recio JA, Takayama H, Duray P, Anver MR, Rush WL, et al. Neonatal sunburn and melanoma in mice. Nature 2001;413(6853):271-2. 36. Zaidi MR, Davis S, Noonan FP, Graff-Cherry C, Hawley TS, Walker RL, et al. Interferon-gamma links ultraviolet radiation to melanomagenesis in mice. Nature 2011;469(7331):548-53. 37. Handoko HY, Rodero MP, Boyle GM, Ferguson B, Engwerda C, Hill G, et al. UVB-induced melanocyte proliferation in neonatal mice driven by CCR2-independent recruitment of Ly6c(low)MHCII(hi) macrophages. J Invest Dermatol 2013;133(7):1803-12. 38. Erdmann F, Lortet-Tieulent J, Schuz J, Zeeb H, Greinert R, Breitbart EW, et al. International trends in the incidence of malignant melanoma 1953-2008--are recent generations at higher or lower risk? Int J Cancer 2013;132(2):385-400. 39. Albert MR, Ostheimer KG. The evolution of current medical and popular attitudes toward ultraviolet light exposure: part 1. J Am Acad Dermatol 2002;47(6):930-7. 40. Albert MR, Ostheimer KG. The evolution of current medical and popular attitudes toward ultraviolet light exposure: part 3. Journal of the American Academy of Dermatology 2003;49(6):1096-1106. 41. Hockberger PE. A history of ultraviolet photobiology for humans, animals and microorganisms. Photochem Photobiol 2002;76(6):561-79.
21
42. Marks R. Skin cancer control in the 1990's, from slip! Slop! Slap! To sun smart. Australas J Dermatol 1990;31(1):1-4. 43. MacKie RM, Hauschild A, Eggermont AM. Epidemiology of invasive cutaneous melanoma. Ann Oncol 2009;20 Suppl 6:vi1-7. 44. Buettner PG, Leiter U, Eigentler TK, Garbe C. Development of prognostic factors and survival in cutaneous melanoma over 25 years: An analysis of the Central Malignant Melanoma Registry of the German Dermatological Society. Cancer 2005;103(3):616-24. 45. Lasithiotakis KG, Leiter U, Eigentler T, Breuninger H, Metzler G, Meier F, et al. Improvement of overall survival of patients with cutaneous melanoma in Germany, 1976-2001: which factors contributed? Cancer 2007;109(6):1174-82. 46. Kolmel KF, Grange JM, Krone B, Mastrangelo G, Rossi CR, Henz BM, et al. Prior immunisation of patients with malignant melanoma with vaccinia or BCG is associated with better survival. An European Organization for Research and Treatment of Cancer cohort study on 542 patients. Eur J Cancer 2005;41(1):118-25. 47. Autier P, Dore JF, Eggermont AM, Coebergh JW. Epidemiological evidence that UVA radiation is involved in the genesis of cutaneous melanoma. Curr Opin Oncol 2011;23(2):189-96. 48. Levell NJ, Beattie CC, Shuster S, Greenberg DC. Melanoma epidemic: a midsummer night's dream? Br J Dermatol 2009;161(3):630-4. 49. Norgaard C, Glud M, Gniadecki R. Are all melanomas dangerous? Acta Derm Venereol 2011;91(5):499-503. 50. van der Rhee JI, Mooi WJ, Kukutsch NA, de Snoo FA, Bergman W. Iatrogenic melanoma. Comment on: Melanoma epidemic: a midsummer night's dream? Br J Dermatol 2010;162(2):457-8. 51. Shen S, Wolfe R, McLean CA, Haskett M, Kelly JW. Characteristics and Associations of High-Mitotic-Rate Melanoma. JAMA Dermatol 2014. 52. Bald T, Quast T, Landsberg J, Rogava M, Glodde N, Lopez-Ramos D, et al. Ultraviolet-radiation-induced inflammation promotes angiotropism and metastasis in melanoma. Nature 2014;507(7490):109-13.

a
Num
ber
of d
eath
s
1955 1960 1965 1970 1975 1980 1985 1990 1995 2000 2005 2010
0
100
200
300
< 5050 to 69>= 70
b
Num
ber
of d
eath
s
1955 1960 1965 1970 1975 1980 1985 1990 1995 2000 2005 2010
0
100
200
300
< 5050 to 69>= 70
Figure

c
Mor
talit
y pe
r 10
0,00
0
1955 1960 1965 1970 1975 1980 1985 1990 1995 2000 2005 2010
0.5
1
2
5
10
20
< 5050 to 69>= 70
d
Mor
talit
y pe
r 10
0,00
0
1955 1960 1965 1970 1975 1980 1985 1990 1995 2000 2005 2010
0.5
1
2
5
10
20
< 5050 to 69>= 70

e
Age
−sp
ecifi
c m
orta
lity
rate
s pe
r 10
0,00
0
1955 1960 1965 1970 1975 1980 1985 1990 1995 2000 2005 2010
0.05
0.1
0.2
0.5
1
2
5
10
20
5080+
70−79
60−69
50−59
40−49
30−39
20−29
f
Age
−sp
ecifi
c m
orta
lity
rate
s pe
r 10
0,00
0
1955 1960 1965 1970 1975 1980 1985 1990 1995 2000 2005 2010
0.05
0.1
0.2
0.5
1
2
5
10
20
50
80+
70−79
60−69
50−59
40−49
30−39
20−29

g
Year of birth
Age
−sp
ecifi
c m
orta
lity
rate
s pe
r 10
0,00
0
1870 1880 1890 1900 1910 1920 1930 1940 1950 1960 1970 1980 1990
0.05
0.1
0.2
0.5
1
2
5
10
20
5080+
70−79
60−69
50−59
40−49
30−39
20−29
h
Year of birth
Age
−sp
ecifi
c m
orta
lity
rate
s pe
r 10
0,00
0
1870 1880 1890 1900 1910 1920 1930 1940 1950 1960 1970 1980 1990
0.05
0.1
0.2
0.5
1
2
5
10
20
50
80+
70−79
60−69
50−59
40−49
30−39
20−29

i
Year of birth
Rel
ativ
e ris
k
1875 1885 1895 1905 1915 1925 1935 1945 1955 1965 1975 1985 1995
0.00
0.25
0.50
0.75
1.00
1.25 Peak in 1942
j
Birth cohort
Rel
ativ
e ris
k
1875 1885 1895 1905 1915 1925 1935 1945 1955 1965 1975 1985 1995
0.00
0.25
0.50
0.75
1.00
1.25 Peak in 1941

k
% d
eath
s
1955 1960 1965 1970 1975 1980 1985 1990 1995 2000 2005 2010
0
10
20
30
40
50
60
70
80
90
100 < 5050 to 69>= 70
l
% d
eath
s
1955 1960 1965 1970 1975 1980 1985 1990 1995 2000 2005 2010
0
10
20
30
40
50
60
70
80
90
100 < 5050 to 69>= 70

a
Year of birth
Rel
ativ
e ris
k
1875 1885 1895 1905 1915 1925 1935 1945 1955 1965 1975 1985 1995
0.00
0.25
0.50
0.75
1.00
1.25
1.50
1.75
2.00
2.25
2.50 Oceania (1940)North America (1943)Northern Europe (1942)Ireland and United Kingdom (1953)Western Europe (1948)Central Europe (1957)Southern Europe (not reached)
b
Year of birth
Rel
ativ
e ris
k
1875 1885 1895 1905 1915 1925 1935 1945 1955 1965 1975 1985 1995
0.00
0.25
0.50
0.75
1.00
1.25
1.50
1.75
2.00
2.25
2.50 Oceania (1936)North America (1938)Northern Europe (1941)Ireland and United Kingdom (1946)Western Europe (1948)Central Europe (1957)Southern Europe (not reached)
Figure

Conflict of Interest
Authors declare no conflict of interest
*Conflict of Interest statement
1
Supplementary materials to the article:
The forthcoming inexorable decline of cutaneous
melanoma mortality in light-skinned populations
Philippe Autier, MD 1,2
; Alice Koechlin, MSc 1,2
; Mathieu Boniol, PhD 1,2
1 University of Strathclyde Institute of Global Public Health at iPRI, International Prevention Research Institute ,
95 Cours Lafayette, 69006 Lyon, France
2 International Prevention Research Institute (iPRI), 95 Cours Lafayette, 69006 Lyon, France
Corresponding author: Dr Philippe Autier, International Prevention Research Institute (iPRI), 95 Cours
Lafayette, 69006 Lyon, France
E-mail: [email protected]; website: www.i-pri.org
Contents
Table S1: Joinpoint regression analysis of time trends of melanoma death after adjustment for age (World
standard population).
Table S2: Analysis of deviance for Age-Period-Cohort models
Figure S1: Absolute numbers of melanoma deaths by age (<50; 50 to 69; ≥70) in (a) Oceania, (b) North
America, (c) Northern Europe, (d) Ireland and United Kingdom, (e) Western Europe, (f) Central Europe and (g)
Southern Europe
Figure S2: Melanoma mortality by age (<50; 50 to 69; ≥70) and joinpoint modelling in (a) Oceania, (b) North
America, (c) Northern Europe, (d) Ireland and United Kingdom, (e) Western Europe, (f) Central Europe and (g)
Southern Europe
Figure S3: Age-specific mortality rates by birth cohorts in (a) Oceania, (b) North America, (c) Northern Europe,
(d) Ireland and United Kingdom, (e) Western Europe, (f) Central Europe and (g) Southern Europe
Figure S4: Age-adjusted proportions of melanoma deaths by age (<50; 50 to 69; ≥70) in (a) Oceania, (b) North
America, (c) Northern Europe, (d) Ireland and United Kingdom, (e) Western Europe, (f) Central Europe and (g)
Southern Europe
Supplementary Figure (online publication only)

2
Table S1 Joinpoint regression analysis of time trends of melanoma death after adjustment for age (World standard population).
APC: annual percent change
Region Sex Age Trend 1 Trend 2 (if any) Trend 3 (if any) Trend 4 (if any)
Period APC (95% CI) Period APC (95% CI) Period APC(95% CI) Period APC(95% CI)
Oceania M All 1955-1985 3.07 [2.77; 3.38] 1985-2006 0.24 [-0.10; 0.59]
Oceania M <50 1955-1981 1.51 [0.98; 2.05] 1981-2006 -2.23 [-2.75; -1.72]
Oceania M 50-69 1955-1984 4.03 [3.45; 4.62] 1984-2006 -0.26 [-0.79; 0.27]
Oceania M ≥70 1955-1989 5.39 [4.86; 5.92] 1989-2006 2.70 [2.09; 3.31]
Oceania F All 1955-1984 1.72 [1.34; 2.11] 1984-2006 -0.50 [-0.94; -0.07]
Oceania F <50 1955-1984 0.36 [-0.25; 0.98] 1984-2006 -2.42 [-3.30; -1.53]
Oceania F 50-69 1955-1977 3.53 [2.66; 4.41] 1977-2006 -0.20 [-0.58; 0.18]
Oceania F ≥70 1955-1992 3.35 [2.88; 3.82] 1992-1995 -4.96 [-24.61; 19.83] 1995-2006 3.38 [1.85; 4.94]
North America M All 1960-1979 3.07 [2.06; 4.08] 1979-1991 1.50 [1.09; 1.92] 1991-2009 -0.29 [-0.48; -0.10]
North America M <50 1960-1981 1.76 [1.39; 2.12] 1981-1991 -1.31 [-2.19; -0.42] 1991-2009 -2.90 [-3.27; -2.53]
North America M 50-69 1960-1979 3.87 [2.44; 5.33] 1979-1991 2.02 [1.47; 2.57] 1991-2009 -0.39 [-0.62; -0.15]
North America M ≥70 1960-1994 3.61 [3.39; 3.82] 1994-2009 1.42 [1.06; 1.98]
North America F All 1960-1983 1.66 [1.47; 1.85] 1983-2009 -0.63 [-0.75; -0.50]
North America F <50 1960-1984 0.71 [0.45; 0.97] 1984-2009 -2.38 [-2.62; -2.14]
North America F 50-69 1960-1982 2.28 [1.98; 2.59] 1982-2009 -0.26 [-0.42; -0.10]
North America F ≥70 1960-1994 2.01 [1.81; 2.21] 1994-2009 0.08 [-0.33; 0.49]
Northern Europe M All 1955-1971 4.69 [3.83; 5.55] 1971-1988 1.97 [1.36; 2.59] 1988-2002 -0.03 [-0.77; 0.71] 2002-2010 2.47 [0.91; 4.05]
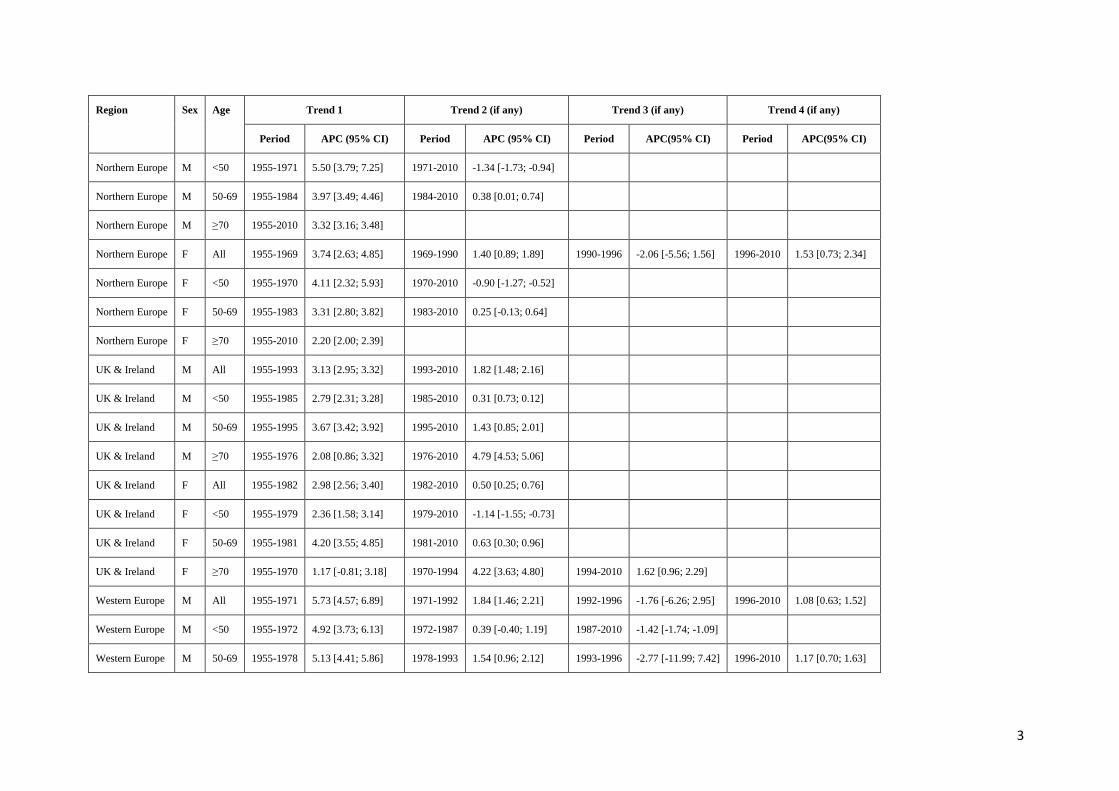
3
Region Sex Age Trend 1 Trend 2 (if any) Trend 3 (if any) Trend 4 (if any)
Period APC (95% CI) Period APC (95% CI) Period APC(95% CI) Period APC(95% CI)
Northern Europe M <50 1955-1971 5.50 [3.79; 7.25] 1971-2010 -1.34 [-1.73; -0.94]
Northern Europe M 50-69 1955-1984 3.97 [3.49; 4.46] 1984-2010 0.38 [0.01; 0.74]
Northern Europe M ≥70 1955-2010 3.32 [3.16; 3.48]
Northern Europe F All 1955-1969 3.74 [2.63; 4.85] 1969-1990 1.40 [0.89; 1.89] 1990-1996 -2.06 [-5.56; 1.56] 1996-2010 1.53 [0.73; 2.34]
Northern Europe F <50 1955-1970 4.11 [2.32; 5.93] 1970-2010 -0.90 [-1.27; -0.52]
Northern Europe F 50-69 1955-1983 3.31 [2.80; 3.82] 1983-2010 0.25 [-0.13; 0.64]
Northern Europe F ≥70 1955-2010 2.20 [2.00; 2.39]
UK & Ireland M All 1955-1993 3.13 [2.95; 3.32] 1993-2010 1.82 [1.48; 2.16]
UK & Ireland M <50 1955-1985 2.79 [2.31; 3.28] 1985-2010 0.31 [0.73; 0.12]
UK & Ireland M 50-69 1955-1995 3.67 [3.42; 3.92] 1995-2010 1.43 [0.85; 2.01]
UK & Ireland M ≥70 1955-1976 2.08 [0.86; 3.32] 1976-2010 4.79 [4.53; 5.06]
UK & Ireland F All 1955-1982 2.98 [2.56; 3.40] 1982-2010 0.50 [0.25; 0.76]
UK & Ireland F <50 1955-1979 2.36 [1.58; 3.14] 1979-2010 -1.14 [-1.55; -0.73]
UK & Ireland F 50-69 1955-1981 4.20 [3.55; 4.85] 1981-2010 0.63 [0.30; 0.96]
UK & Ireland F ≥70 1955-1970 1.17 [-0.81; 3.18] 1970-1994 4.22 [3.63; 4.80] 1994-2010 1.62 [0.96; 2.29]
Western Europe M All 1955-1971 5.73 [4.57; 6.89] 1971-1992 1.84 [1.46; 2.21] 1992-1996 -1.76 [-6.26; 2.95] 1996-2010 1.08 [0.63; 1.52]
Western Europe M <50 1955-1972 4.92 [3.73; 6.13] 1972-1987 0.39 [-0.40; 1.19] 1987-2010 -1.42 [-1.74; -1.09]
Western Europe M 50-69 1955-1978 5.13 [4.41; 5.86] 1978-1993 1.54 [0.96; 2.12] 1993-1996 -2.77 [-11.99; 7.42] 1996-2010 1.17 [0.70; 1.63]

4
Region Sex Age Trend 1 Trend 2 (if any) Trend 3 (if any) Trend 4 (if any)
Period APC (95% CI) Period APC (95% CI) Period APC(95% CI) Period APC(95% CI)
Western Europe M ≥70 1955-1971 6.58 [4.41; 8.79] 1971-1976 -2.73 [-13.33; 9.16] 1976-1991 4.00 [2.98; 5.03] 1991-2010 1.94 [1.57; 2.31]
Western Europe F All 1955-1970 5.43 [4.10; 6.79] 1970-1991 1.35 [0.95; 1.75] 1991-1998 -1.29 [-3.01; 0.46] 1998-2010 0.83 [0.20; 1.47]
Western Europe F <50 1955-1970 5.30 [3.53; 7.10] 1970-1993 0.15 [-0.33; 0.64] 1993-1998 -4.58 [-9.54; 0.64] 1998-2010 0.78 [-0.31; 1.88]
Western Europe F 50-69 1955-1972 5.76 [4.28; 7.26] 1972-1989 1.77 [1.06; 2.48] 1989-1999 -1.01 [-2.17; 0.16] 1999-2010 0.84 [-0.05; 1.73]
Western Europe F ≥70 1955-1993 2.52 [2.14; 2.89] 1993-2010 1.06 [0.59; 1.52]
Central Europe M All 1961-1970 11.44 [8.21; 14.78] 1970-1981 3.19 [1.59; 4.81] 1981-1987 7.39 [5.14; 9.69] 1987-2010 1.32 [1.16; 1.49]
Central Europe M <50 1961-1991 4.17 [3.51; 4.83] 1991-2010 -1.19 [-1.85; -0.54]
Central Europe M 50-69 1961-1970 13.00 [6.62; 19.77] 1970-1989 5.30 [4.24; 6.38] 1989-2010 1.47 [1.19; 1.75]
Central Europe M ≥70 1961-1988 5.35 [4.17; 6.54] 1988-2010 3.00 [2.53; 3.46]
Central Europe F All 1961-1964 32.84 [5.68; 66.99] 1964-1987 4.17 [3.59; 4.75] 1987-1999 1.63 [0.56; 1.72] 1999-2010 -0.44 [-1.17; 0.30]
Central Europe F <50 1961-1994 3.53 [2.85; 4.22] 1994-2010 -2.19 [-3.32; -1.04]
Central Europe F 50-69 1961-1964 39.41 [-1.48; 97.27] 1964-1989 4.29 [3.57; 5.01] 1989-2010 1.07 [0.69; 1.46]
Central Europe F ≥70 1961-1990 4.31 [3.59; 5.02] 1990-2010 1.28 [0.88; 1.69]
Southern Europe M All 1956-1982 6.28 [5.78; 6.79] 1982-1992 3.48 [2.17; 4.81] 1992-2009 0.91 [0.47; 1.35]
Southern Europe M <50 1956-1986 4.83 [4.31; 5.34] 1986-2009 -0.09 [-0.59; 0.40]
Southern Europe M 50-69 1956-1982 6.99 [6.25; 7.74] 1982-1992 3.71 [1.96; 5.49] 1992-2009 0.98 [0.42; 1.53]
Southern Europe M ≥70 1956-1988 6.79 [6.06; 7.52] 1988-2009 2.50 [2.03; 2.96]
Southern Europe F All 1956-1989 5.28 [4.88; 5.69] 1989-2009 0.35 [-0.12; 0.83]

5
Region Sex Age Trend 1 Trend 2 (if any) Trend 3 (if any) Trend 4 (if any)
Period APC (95% CI) Period APC (95% CI) Period APC(95% CI) Period APC(95% CI)
Southern Europe F <50 1956-1959 25.01 [-6.18; 66.56] 1959-1993 3.78 [3.37; 4.20] 1993-2009 -1.17 [-2.05; -0.28]
Southern Europe F 50-69 1956-1975 4.78 [3.41; 6.16] 1975-1981 9.98 [3.97; 16.35] 1981-1992 2.62 [1.09; 4.18] 1992-2009 0.79 [0.18; 1.39]
Southern Europe F ≥70 1956-1989 6.35 [5.62; 7.07] 1989-2009 0.72 [0.15; 1.28]

6
Table S2 Analysis of deviance for Age-Period-Cohort models
Region Sex Model Residual degrees of freedom Residual Deviance
Oceania
Men
Age 724 3808.5
Age-drift 723 2483.0
Age-Cohort 719 892.6
Age-Period-Cohort 715 864.0
Age-Period 719 2296.0
Age-drift 723 2483.0
Women
Age 724 1526.69
Age-drift 723 1338.10
Age-Cohort 719 775.96
Age-Period-Cohort 715 755.60
Age-Period 719 1254.41
Age-drift 723 1338.10
North America
Men
Age 560 11964.8
Age-drift 559 7857.8
Age-Cohort 555 1492.2
Age-Period-Cohort 551 1237.1
Age-Period 555 6567.3
Age-drift 559 7857.8
Women
Age 560 3320.9
Age-drift 559 3032.0
Age-Cohort 555 1128.9
Age-Period-Cohort 551 966.1
Age-Period 555 2511.1
Age-drift 559 3032.0
Northern Europe Men
Age 799 3698.8
Age-drift 798 1992.5
Age-Cohort 794 955.7
Age-Period-Cohort 790 892.4
Age-Period 794 1823.3
Age-drift 798 1992.5

7
Region Sex Model Residual degrees of freedom Residual Deviance
Women
Age 799 1909.03
Age-drift 798 1278.15
Age-Cohort 794 935.74
Age-Period-Cohort 790 887.78
Age-Period 794 1196.94
Age-drift 798 1278.15
Ireland and the United Kingdom
Men
Age 700 6438.4
Age-drift 699 1815.5
Age-Cohort 695 843.1
Age-Period-Cohort 691 831.1
Age-Period 695 1780.8
Age-drift 699 1815.5
Women
Age 700 3781.7
Age-drift 699 1972.0
Age-Cohort 695 964.0
Age-Period-Cohort 691 911.3
Age-Period 695 1780.4
Age-drift 699 1972.0
Western Europe
Men
Age 799 4314.0
Age-drift 798 2410.4
Age-Cohort 794 1248.1
Age-Period-Cohort 790 1082.3
Age-Period 794 1980.8
Age-drift 798 2410.4
Women
Age 799 2433.1
Age-drift 798 1745.5
Age-Cohort 794 1361.2
Age-Period-Cohort 790 1083.1
Age-Period 794 1369.0
Age-drift 798 1745.5
Central Europe Men Age 559 4099.8
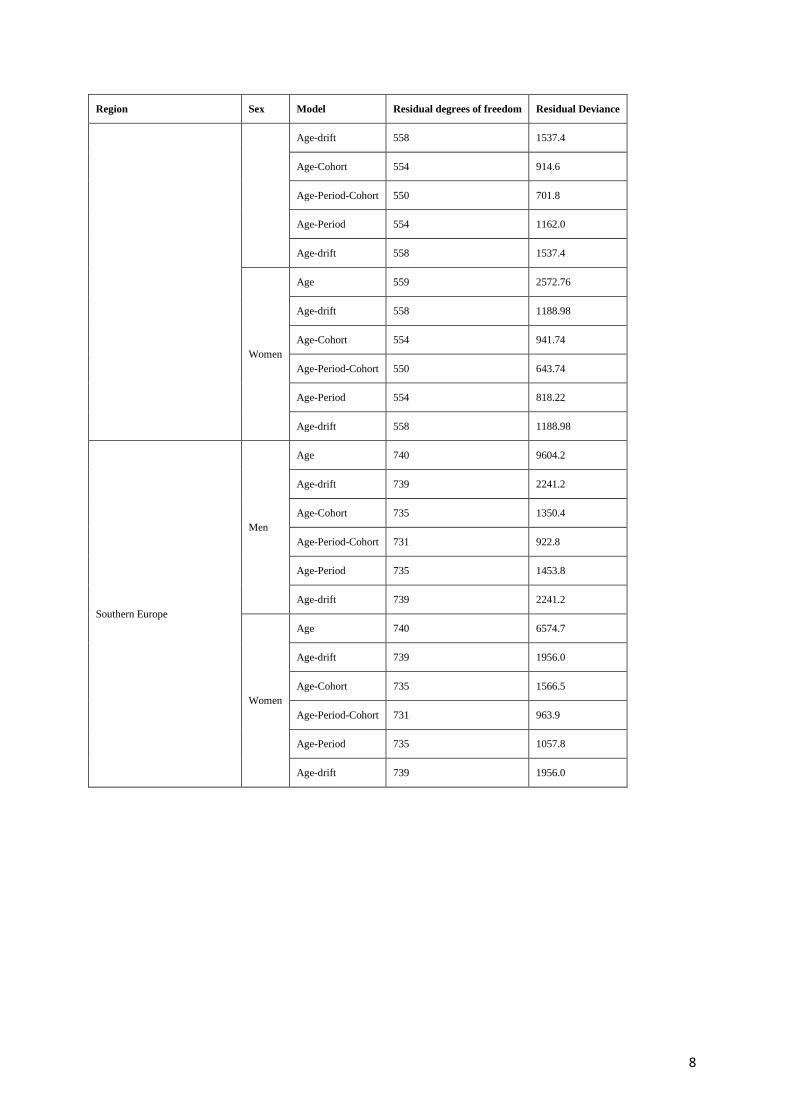
8
Region Sex Model Residual degrees of freedom Residual Deviance
Age-drift 558 1537.4
Age-Cohort 554 914.6
Age-Period-Cohort 550 701.8
Age-Period 554 1162.0
Age-drift 558 1537.4
Women
Age 559 2572.76
Age-drift 558 1188.98
Age-Cohort 554 941.74
Age-Period-Cohort 550 643.74
Age-Period 554 818.22
Age-drift 558 1188.98
Southern Europe
Men
Age 740 9604.2
Age-drift 739 2241.2
Age-Cohort 735 1350.4
Age-Period-Cohort 731 922.8
Age-Period 735 1453.8
Age-drift 739 2241.2
Women
Age 740 6574.7
Age-drift 739 1956.0
Age-Cohort 735 1566.5
Age-Period-Cohort 731 963.9
Age-Period 735 1057.8
Age-drift 739 1956.0

9
Figure S1a: Absolute numbers of melanoma deaths by age (<50; 50 to 69; ≥70) in Oceania

10
Figure S1b: Absolute numbers of melanoma deaths by age (<50; 50 to 69; ≥70) in North America

11
Figure S1c: Absolute numbers of melanoma deaths by age (<50; 50 to 69; ≥70) in Northern Europe

12
Figure S1d: Absolute numbers of melanoma deaths by age (<50; 50 to 69; ≥70) in Ireland and United Kingdom

13
Figure S1e: Absolute numbers of melanoma deaths by age (<50; 50 to 69; ≥70) in Western Europe
Note: the sudden increase of 1980 in Western Europe was due to the introduction of mortality data of the former German Federal Republic (GFR) and the German
Democratic Republic (GDR). Mortality data in the Germany (GDR and GFR) did not exist before 1980.

14
Figure S1f: Absolute numbers of melanoma deaths by age (<50; 50 to 69; ≥70) in Central Europe

15
Figure S1g: Absolute numbers of melanoma deaths by age (<50; 50 to 69; ≥70) in Southern Europe

16
Figure S2a: melanoma mortality by age (<50; 50 to 69; ≥70) and joinpoint modelling in Oceania

17
Figure S2b: melanoma mortality by age (<50; 50 to 69; ≥70) and joinpoint modelling in North America

18
Figure S2c: melanoma mortality by age (<50; 50 to 69; ≥70) and joinpoint modelling in Northern Europe

19
Figure S2d: melanoma mortality by age (<50; 50 to 69; ≥70) and joinpoint modelling in Ireland and United Kingdom

20
Figure S2e: melanoma mortality by age (<50; 50 to 69; ≥70) and joinpoint modelling in Western Europe
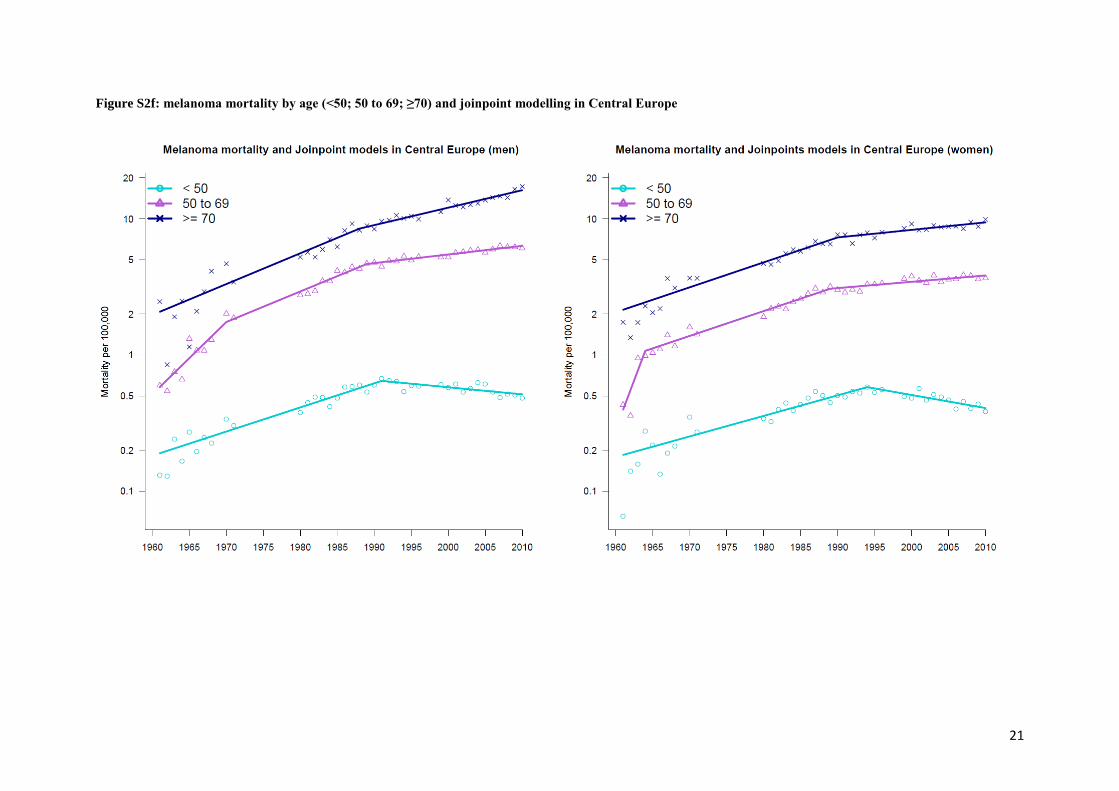
21
Figure S2f: melanoma mortality by age (<50; 50 to 69; ≥70) and joinpoint modelling in Central Europe
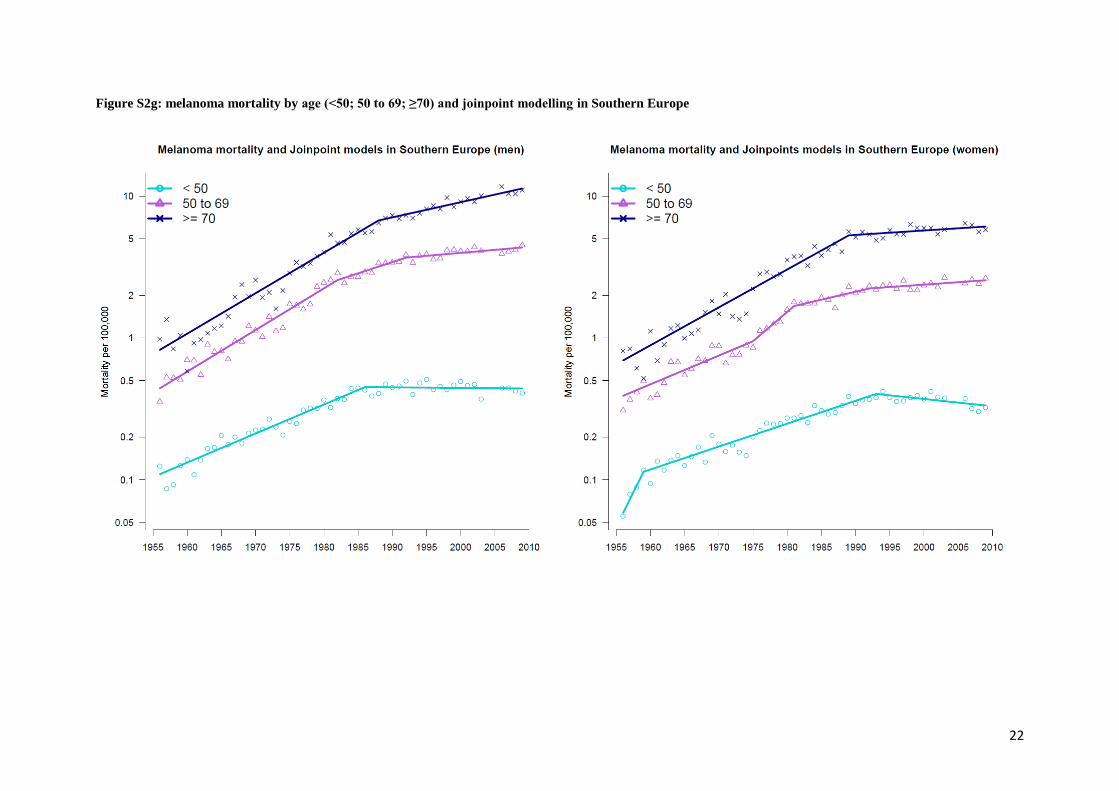
22
Figure S2g: melanoma mortality by age (<50; 50 to 69; ≥70) and joinpoint modelling in Southern Europe

23
Figure S3a: Age-specific mortality rates by birth cohorts in Oceania

24
Figure S3b: Age-specific mortality rates by birth cohorts in North America

25
Figure S3c: Age-specific mortality rates by birth cohorts in Northern Europe

26
Figure S3d: Age-specific mortality rates by birth cohorts in Ireland and United Kingdom

27
Figure S3e: Age-specific mortality rates by birth cohorts in Western Europe

28
Figure S3f: Age-specific mortality rates by birth cohorts in Central Europe

29
Figure S3g: Age-specific mortality rates by birth cohorts in Southern Europe

30
Figure S4a: Age-adjusted proportions of melanoma deaths by age (<50; 50 to 69; ≥70) in Oceania

31
Figure S4b: Age-adjusted proportions of melanoma deaths by age (<50; 50 to 69; ≥70) in North America

32
Figure S4c: Age-adjusted proportions of melanoma deaths by age (<50; 50 to 69; ≥70) in Northern Europe

33
Figure S4d: Age-adjusted proportions of melanoma deaths by age (<50; 50 to 69; ≥70) in Ireland and United Kingdom

34
Figure S4e: Age-adjusted proportions of melanoma deaths by age (<50; 50 to 69; ≥70) in Western Europe

35
Figure S4f: Age-adjusted proportions of melanoma deaths by age (<50; 50 to 69; ≥70) in Central Europe

36
Figure S4g: Age-adjusted proportions of melanoma deaths by age (<50; 50 to 69; ≥70) in Southern Europe