pizot, cécile and boniol, mathieu and mullie, patrick … · pizot, cécile and boniol, mathieu...
TRANSCRIPT

Pizot, Cécile and Boniol, Mathieu and Mullie, Patrick and Koechlin, Alice
and Boniol, Magali and Boyle, Peter and Autier, Philippe (2016) Physical
activity, hormone replacement therapy and breast cancer risk : a meta-
analysis of prospective studies. European Journal of Cancer, 52. pp.
138-154. ISSN 0959-8049 , http://dx.doi.org/10.1016/j.ejca.2015.10.063
This version is available at https://strathprints.strath.ac.uk/55321/
Strathprints is designed to allow users to access the research output of the University of
Strathclyde. Unless otherwise explicitly stated on the manuscript, Copyright © and Moral Rights
for the papers on this site are retained by the individual authors and/or other copyright owners.
Please check the manuscript for details of any other licences that may have been applied. You
may not engage in further distribution of the material for any profitmaking activities or any
commercial gain. You may freely distribute both the url (https://strathprints.strath.ac.uk/) and the
content of this paper for research or private study, educational, or not-for-profit purposes without
prior permission or charge.
Any correspondence concerning this service should be sent to the Strathprints administrator:
The Strathprints institutional repository (https://strathprints.strath.ac.uk) is a digital archive of University of Strathclyde research
outputs. It has been developed to disseminate open access research outputs, expose data about those outputs, and enable the
management and persistent access to Strathclyde's intellectual output.

1
Second revised version
Physical activity, hormone replacement therapy and breast cancer
risk: A meta-analysis of prospective studies
Short title: Physical activity and breast cancer risk
Cécile Pizot 2, Mathieu Boniol
1,2, Patrick Mullie
2,3, Alice Koechlin
1,2, Magali Boniol
2, Peter
Boyle 1,2
and Philippe Autier 1,2
1. University of Strathclyde Institute of Global Public Health at iPRI, Allée Claude
Debussy, Ecully (Lyon), France
2. International Prevention Research Institute, 95 cours Lafayette, 69006 Lyon, France
3. Faculty of Physical Education and Physiotherapy, Pleinstraat 2, 1050 Brussels,
Belgium
Correspondence: Philippe Autier, University of Strathclyde Institute of Global Public Health
at iPRI, Espace Européen, Building G, Allée Claude Debussy, 69130 Lyon Ouest Ecully,
France; Email: [email protected]; Tel: +33 (0)4 72 17 11 99; Fax: +33(0)4 72 17 11
90.
Funding: This work was founded by the International Prevention Research Institute.
*ManuscriptClick here to view linked References

2
Abstract
Background: Lower risk of breast cancer has been reported among physically active women,
but the risk in women using hormone replacement therapy (HRT) appears to be higher. We
quantified the association between physical activity and breast cancer, and we examined the
influence that HRT use and other risk factors had on this association.
Methods: After a systematic literature search, prospective studies were meta-analysed using
random-effect models applied on highest vs. lowest level of physical activity. Dose-response
analyses were conducted with studies reporting physical activity either in hours/week or in
hours of metabolic equivalent per week (MET-h/week).
Results: The literature search identified 38 independent prospective studies published
between 1987 and 2014 that included 116,304 breast cancer cases. Compared to the lowest
level of physical activity, the highest level was associated with a summary relative risk (SRR)
of 0.88 (95% CI (0.85, 0.90)) for all breast cancer, 0.89 (95%CI (0.83, 0.95)) for ER+/PR+
breast cancer and 0.80 (95%CI (0.69, 0.92)) for ER-/PR- breast cancer. Risk reductions were
not influenced by the type of physical activity (occupational or non-occupational), adiposity,
and menopausal status. Risk reductions increased with increasing amounts of physical
activity, without threshold effect. In six studies, the SRR was 0.78 (95% CI (0.70, 0.87)) in
women who never used HRT and 0.97 (95% CI (0.88, 1.07)) in women who ever used HRT,
without heterogeneity in results. Findings indicate that a physically inactive women engaging
in at least 150 minutes per week of vigorous physical activity would reduce their lifetime risk
of breast cancer by 9%, a reduction that might be two times greater in women who never used
HRT. Conclusion: Increasing physical activity is associated with meaningful reductions in
the risk of breast cancer, but in women who ever used HRT, the preventative effect of
physical activity seems to be cancelled out.
Keywords: physical activity; prospective studies; breast cancer; HRT; meta-analysis.

3
4
Introduction
Breast cancer is the commonest incident form of cancer in women worldwide which is
responsible for approximately 1.7 million new cases in 2012 [1]. The ageing of the world’s
population, the notable increase in life expectancy, the sharp tendency towards adoption of a
westernized lifestyle including lower fertility and sedentary, shorter duration of breastfeeding,
and the raising prevalence of obese and diabetic subjects, represent an accumulation of factors
known to be associated with breast cancer that will contribute to the continual increase in the
global burden of this cancer [2]. A public health priority is the identification of environmental
or lifestyle factors whose modification could lead to reductions in breast cancer occurrence.
Adiposity, alcohol consumption, and physical inactivity are modifiable risk factors that would
contribute to 25% of breast cancer cases in France, 33% in USA, 38% in the United Kingdom,
22% in Brazil and 11% in China [3, 4]. The preventive potential of physical activity was
unveiled by a small study on 69 breast cancers that found a 44% (95% CI (0, 77)) reduced rate
of breast cancer among female college athletes [5]. Since then, epidemiological studies have
generally corroborated the inverse association between physical activity and breast cancer [6,
7]. However, the magnitude of the reduction in breast cancer risk associated with physical
activity remains imprecise because of the variability in the way epidemiological studies
measured physical activity, analysed data and reported results.
Higher levels of circulating oestrogen and androgen are related to higher breast cancer risk [8-
10], and studies among postmenopausal women consistently showed that physical activity can
reduce serum levels of these hormones [11, 12]. Use of hormone replacement therapy (HRT)
increases levels of circulating sex-hormones and the risk of breast cancer [13, 14]. A question
is thus whether HRT use could influence the preventative effect of physical activity.

5
In this study, we quantified the association between physical activity and breast cancer risk in
prospective studies, exploring in more depth the influence that exposure assessment and
breast cancer risk factors, especially HRT use, could have on this association. Risk reductions
associated with measurable amounts of physical activity were also evaluated.
Materials and Methods
Literature search and study selection
A systematic literature search and quantitative analysis was conducted following PRISMA
guidelines [15]. This search was restricted to articles published in English language up to
November 2014 and available in the following database: Ovid MEDLINE database, ISI Web
of Science, Science Citation Index Expanded, and PUBMED. A combination of key words
and MesH index terms was used including “breast neoplasm” or “breast cancer”, “physical
activity” or “physical exercise” or “motor activity”, “cohort study” or “prospective study” or
“longitudinal study”. The reference lists of retrieved articles were also hand searched. Eligible
articles for this study had to (i) report data on incident cases of breast cancer; (ii) report
measurement of physical activity, being occupational and/or non-occupational; (iii) have a
prospective design. As case-control studies are more prone to recall and selection biases, and
thus to provide less accurate risk estimates, this systematic review focused only on studies
with prospective design.
Titles and abstracts were screened for eligibility. Full copies of eligible articles were retrieved
and fully read by at least two co-authors. When several articles were published on the same
study, the most recent publication was selected, except for those data that were relevant for
sub-analyses.
Data extraction

6
Extraction of main study characteristics, exposure assessment and relative risks was done by
one co-author in a pre-defined database. The resulting table was checked by another author
and by a statistician. All relative risks (RR) with the corresponding 95% confidence interval
(CI) were extracted for each category of physical activity. As a rule, we selected the most
adjusted RRs associated with the most comprehensive measure of physical activity that was
often labelled as “total physical activity”.
Statistical Methods
Various risk estimates (RR) and their 95% CI were transformed into log (RR) and their
corresponding variances were computed. When no RR was reported, tabular data were used to
calculate the crude estimates and 95% CIs. In the case of a RR reported separately by type of
physical activity (i.e., occupational or non-occupational activity) or by menopausal status, a
fixed-effect modelling was used to combine all the RRs in order to get a global result for the
main analysis (Table S1). From the transformed data, summary relative risks (SRR) were
computed using a random effects model [16] and the confidence intervals were based on the t-
distribution. As physical activity assessment and reporting of results were very heterogeneous
across studies, breast cancer risk associated with the highest level of physical activity was
compared with the lowest level of physical activity.
Heterogeneity across studies was evaluated by the I2
statistic, which represents the percentage
of total variation across studies that is attributable to heterogeneity rather than to chance [17].
Three tests for publication bias were performed, the Begg test [18], the Egger test [19] and the
Macaskill test [20].
Subgroup meta-analyses were conducted according to the study location, the period of study
(before 1989 vs. after 1989; based on the mid-year of each cohort), the type of physical
activity (non-occupational vs. occupational), and the metric used to quantify physical activity
(MET-h/week, hours/week or no quantitative measure). Regarding hormone receptor status,

7
results for ER+ and triple negative (ER-/PR-/HER2-) tumours were used as approximation of
ER+/PR+ and ER-/PR- tumours respectively, in two studies [21, 22]. Stratified meta-analyses
were performed considering risk factors for breast cancer, including menopausal status, HRT
use, and adiposity. For adiposity, RRs for the most extreme BMI categories reported by
articles were used.
A dose-response analysis was conducted with studies reporting physical activity either in
hours/week or in MET-h/week. The great variability in MET-h/weeks reported by studies
precluded the possibility to perform a dose-response analysis as proposed by Greenland and
Longneker [23]. We thus opted for a non-parametric approach in which ranks of physical
activity levels expressed as MET-h/week or as hours/week were re-scaled so that exposure
categories of all studies had the same range of values. Each study was scaled to share the first
(reference) and last category of physical activity, whatever the number of categories defined
by studies. Because there were three, four and five possible categories of MET-h/week, cut-
points were arbitrarily assigned a priori at 0, 1, 1.33, 2, 2.67, 3 and 4. Hence, if in a study,
there were three categories of MET-h/week, category limits were 0 (reference), 2 and 4. The
same method was applied to the hours/week analysis but six categories of physical activity
were used and cut-points were assigned at 0, 1, 1.25, 1.67, 2, 2.5, 3, 3.33, 3.75, 4 and 5. Then,
RRs reported by studies were plotted against re-scaled exposure categories. In order to
estimate a summary slope, a linear regression of the log (RR) according to physical activity
categories, weighted by the inverse variance of log (RR), was conducted for each study. Then,
a meta-analysis of the slopes of each linear model was performed using a random-effect
modelling. All the analyses were carried out in programming language R (version 3.1.2, GNU
General Public License, 2014).

8
Results
Study selection and description
The literature search identified 928 potentially relevant studies, of which 60 met the inclusion
criteria (Figure 1). Among the eligible studies, 22 were further excluded as they were
duplicates of main or most recent articles (Table S2) leaving 38 studies in the final analysis.
However, nine duplicate studies were included in stratified analyses as they provided results
that were not reported in main or most recent articles. Selected and duplicate articles with
relevant data are summarized in Table 1. [21, 22, 24-68]
Studies included a total of 4,124,275 women of which 116,304 (2.8%) were diagnosed with a
breast cancer during the study period. Most of these cancers were invasive but a small number
of in-situ breast cancer were also included in few studies (see Table S3 for the type of cancer
included in each study). Twelve percent of breast cancer cases were pre-menopausal, 45%
were post-menopausal, and menopausal status was unknown for 43%.
The way physical activity was assessed and reported varied across studies (Table 1 and Table
S4). In most studies (24), physical activity related to the month(s) or year(s) preceding
inclusion in the cohort. Three studies evaluated occupational physical activity only, 22 studies
assessed non-occupational physical activity only, seven studies assessed both and reported
results for each type of activity, and six studies assessed total physical activity without
breakdown by type of physical activity.
Eight studies reported physical activity measured in MET-h/week, nine reported duration of
physical activity per day or per week and three reported in both units. Eighteen studies
classified physical activity in discrete categories without use of measurement units to describe
category boundaries. The lowest level of physical activity usually corresponded to being
inactive, including sedentary and sitting.

9
Meta-analysis of all studies
For all 38 studies, the SRR of breast cancer in the highest compared with the lowest category
of physical activity was 0.88 (95% CI (0.85, 0.90)) (Figure 2). The I2 of 29% indicates
moderate heterogeneity in risks between studies, mainly due to the five studies that found an
increased risk. Careful reading of the five studies provided no clue on the reasons possibly
underlying these findings, except Dorgan et al. 1994 [25] that specified that less than 5% of
women reported regular vigorous physical activity.
The SRR was not materially altered when meta-analysis was restricted to the 23 studies that
assessed physical activity in the year(s) preceding inclusion in cohorts, or to the 18 studies
that included invasive cancer only, or after exclusion of the Moradi et al. 1999 [31] study that
included 37% of all breast cancer patients in the meta-analysis (data not shown).
Stratified analysis
The location of studies, the BMI of women or the adjustment for BMI did not influence risk
reductions associated with physical activity (Figure 3). Risk reductions were similar in pre-
and post-menopausal women, but menopausal status was unknown for 43% of women.
A greater reduction of breast cancer risk was observed in studies conducted before 1989 than
after, but all the heterogeneity in results was confined to studies conducted before 1989. The
SRR for studies conducted before 1989 was 0.78 (95%CI (0.69, 0.88)) when the Moradi et al.
1999 [31] study was excluded.
Risk reductions were greater in studies that measured physical activity in hours/week (19%
reduction) than in MET-h/week (13% reduction) or in other units (11% reduction). The
difference in risk reduction was essentially due to vigorous physical activity (e.g., activities
like jogging associated with sweating) being more frequently reported in hours/weeks while

10
reporting in MET-h/week generally encompassed physical activities of any magnitude, from
housekeeping to strenuous activity.
Studies that measured both types of physical activity suggest that risk reductions were slightly
more pronounced with non-occupational than with occupational physical activity.
Regarding hormone receptor status, one study [38] reported risks for ER+/PR+ tumours but
not for other tumours. For this reason, 10 studies were used to compute a SRR for ER+/PR+
tumours and nine studies were used for ER-/PR- tumours. Reduction in breast cancer risk was
more pronounced for ER-/PR- tumours (SRR=0.80) than for ER+/PR+ tumours (SRR=0.89).
HRT use was reported in 19 of the 36 studies conducted in the USA and in Europe. Sixty one
percent of women reported never use of HRT and 39% reported ever use of HRT (i.e., current
or past use). This utilization frequency remains the same in the six studies that examined the
influence of physical activity according to HRT use (Table 2).[35, 42, 50, 55, 56, 66]
Although the SRR for the six studies was 0.88, breast cancer relative risks associated with
highest level of physical activity were always smaller for never users of HRT than for ever
users. Overall, it seemed that the entire preventive effect was confined to women who never
used HRT (SRR=0.78) as no risk reduction was noticeable in women who reported ever use
of HRT (SRR=0.97). The absence of overlapping between the confidence interval around
SRRs for never and ever users of HRT indicates statistically significant effect modification
(confirmed by meta-regression: p<0.05). There was no heterogeneity in results across the six
studies.
Dose-response analysis
Dose-response analyses were performed with the 11 studies that reported physical activity in
MET-h/week and the 11 studies that reported duration of physical activity in hours/week.
Significant dose-response relationships were found (p <0.0001) between amounts of physical
11
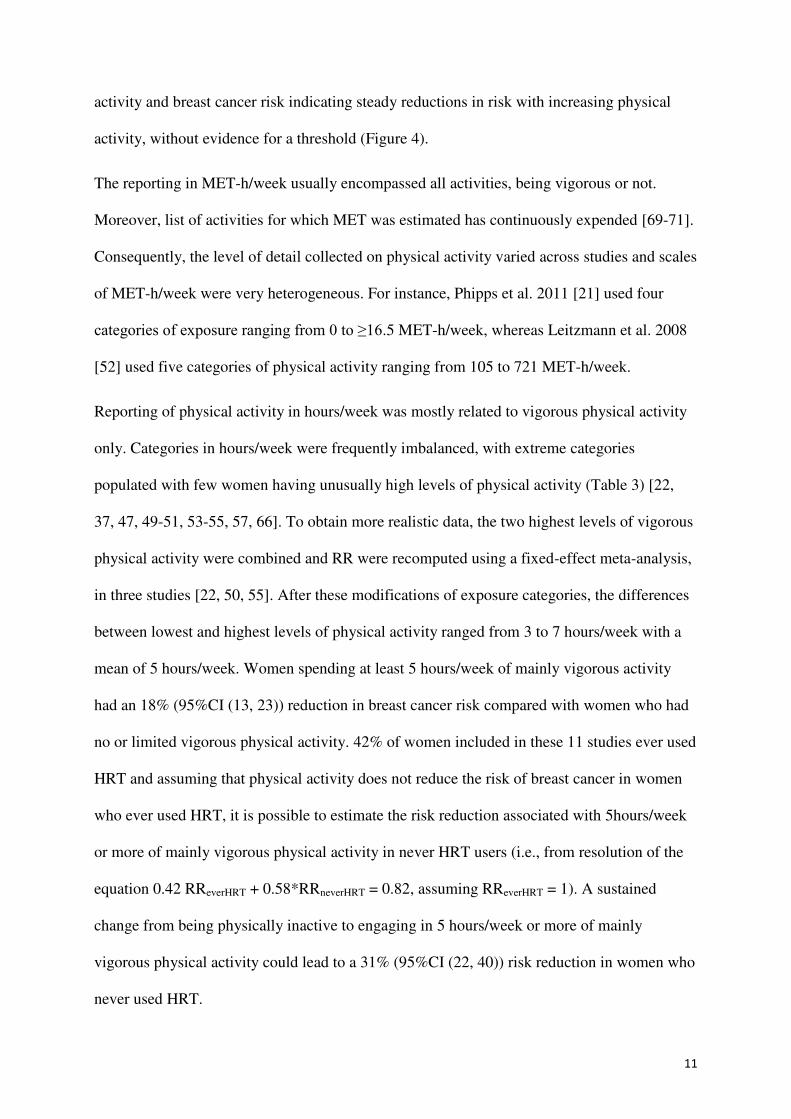
activity and breast cancer risk indicating steady reductions in risk with increasing physical
activity, without evidence for a threshold (Figure 4).
The reporting in MET-h/week usually encompassed all activities, being vigorous or not.
Moreover, list of activities for which MET was estimated has continuously expended [69-71].
Consequently, the level of detail collected on physical activity varied across studies and scales
of MET-h/week were very heterogeneous. For instance, Phipps et al. 2011 [21] used four
categories of exposure ranging from 0 to ≥16.5 MET-h/week, whereas Leitzmann et al. 2008
[52] used five categories of physical activity ranging from 105 to 721 MET-h/week.
Reporting of physical activity in hours/week was mostly related to vigorous physical activity
only. Categories in hours/week were frequently imbalanced, with extreme categories
populated with few women having unusually high levels of physical activity (Table 3) [22,
37, 47, 49-51, 53-55, 57, 66]. To obtain more realistic data, the two highest levels of vigorous
physical activity were combined and RR were recomputed using a fixed-effect meta-analysis,
in three studies [22, 50, 55]. After these modifications of exposure categories, the differences
between lowest and highest levels of physical activity ranged from 3 to 7 hours/week with a
mean of 5 hours/week. Women spending at least 5 hours/week of mainly vigorous activity
had an 18% (95%CI (13, 23)) reduction in breast cancer risk compared with women who had
no or limited vigorous physical activity. 42% of women included in these 11 studies ever used
HRT and assuming that physical activity does not reduce the risk of breast cancer in women
who ever used HRT, it is possible to estimate the risk reduction associated with 5hours/week
or more of mainly vigorous physical activity in never HRT users (i.e., from resolution of the
equation 0.42 RReverHRT + 0.58*RRneverHRT = 0.82, assuming RReverHRT = 1). A sustained
change from being physically inactive to engaging in 5 hours/week or more of mainly
vigorous physical activity could lead to a 31% (95%CI (22, 40)) risk reduction in women who
never used HRT.

12
Discussion
This meta-analysis demonstrates three important findings. First, increased levels of physical
activity lead to reductions in the risk of breast cancer irrespective of the type of physical
activity, place of residence, adiposity, menopausal status, and the hormone receptor status of
tumours. Second, breast cancer risk seems to decline with increasing physical activity,
without a threshold effect. Third, women who ever used HRT had no reduction of breast
cancer risk associated with physical activity. Despite limitations in quantification and
reporting of exposure, heterogeneity in study results was moderate suggesting that most
studies consistently found reduced risks of breast cancer associated with increasing levels of
reported physical activity.
This meta-analysis has several limitations. First, dose-response meta-analysis using all studies
was not performed because quantification and reporting of physical activity was too
heterogeneous across studies. If in most studies the lowest level of physical activity coincided
with sedentary, it was often difficult to figure out the meaning, in term of quantity, of levels
labelled as “moderate” or “high” physical activity. Second, inclusion of in-situ breast cancer
could have weakened the preventive effect of physical activity. Four studies that examined
risk of in-situ breast cancer in relation to physical activity found no or equivocal association
[51, 57, 72, 73]. However, the meta-analysis restricted to studies that included invasive cancer
only showed no difference in SRR. Third, stratified results on menopausal status could be
biased as menopausal status of women was unknown in 43% of women and many studies did
not report results according to menopausal status.
Four, the result related to HRT use could arise from selection bias since only six studies
examined the influence of physical activity according to HRT use. Moreover, it is known that
the HRT-induced risk of breast cancer steadily vanishes in the 5-7 years after HRT use

13
discontinuation but, for past users, data on time since last HRT use were not available in
publications. However, results of the six studies were highly consistent, there was no evidence
of heterogeneity, and the 95% CI around SRRs for ever and for never HRT use did not
overlap. Therefore, our study raises the hypothesis that HRT use could nullify the protection
conferred by physical activity against breast cancer. This hypothesis is supported by
knowledge that a steroid-hormone pathway may play a role in the association between
physical activity and breast cancer risk [8-10] and that physical activity can reduce serum
levels of these hormones in postmenopausal women [11, 12]. Hence, if physically active
women have a reduced risk of breast cancer risk through reductions of circulating oestrogens,
then HRT use would cancel out this effect because of re-establishment of oestrogen blood
concentrations as if women were physically inactive. Moreover, breast cancers induced by
HRT use are more frequently ER+/PR+ than other breast cancers [74-76] which could explain
the smaller risk reduction obtained for ER+/PR+ than for ER-/PR- tumours. HRT use was less
prevalent before 1990 than during the 1990 to 2002 period [77], after which dramatic
reductions in use occurred following the publication of Women’s Health Initiative trial [13]
and the Million Women Study [14] that documented the association between HRT use and
breast cancer. Studies on physical activity in the USA and Northern Europe were, in their
majority, conducted in the 1990’s when large proportions of peri- and post-menopausal
women used HRT over long periods of time. Consequently, massive presence of HRT users in
cohorts might have led to underestimation of risk reductions expected with physical activity.
It may also explain why risk reductions were of 20% in studies conducted before 1989 and of
11% in more recent studies.
Physical inactivity is usually associated with adiposity, and adiposity is a risk factor for both
breast cancer occurrence and mortality [78, 79]. However, the stratified analyses according to
women’s BMI or to adjustment for BMI showed no change in SRRs. A similar independence

14
of risk associated with physical activity was found by the IARC review [6]. These results
indicate that the protective effect of physical activity would be the same at all levels of
overweight and obesity. Nevertheless, independently from adiposity, it is well known that
weight gain is an important risk factor for breast cancer in post-menopausal women,
especially in women not taking HRT [80]. Physical activity could be critical for
preventing weight gain and consequently breast cancer. Unfortunately, most of the
studies did not report on weight changes during the follow-up, therefore our meta-
analysis could not examine the combined effect of physical activity and weight
changes on the risk of breast cancer.
Systemic inflammation is probably a main factor on which physical activity exerts
considerable influence. Low grade systemic inflammation is practically always present in
obesity, diabetes, sedentary, old age, and is associated with aggressive breast cancer
phenotype (e.g., ER-/PR- and triple negative) and poor prognosis [81-83]. Randomized trials
have shown that increasing physical activity reduces systemic inflammation [84-86]. The
influence on systemic inflammation would explain why physical activity seems capable of
reducing the risk of breast cancers whatever the hormone receptor status, the menopausal
status and the adiposity of women.
This study indicates that avoidance of sedentary behaviours and promotion of physical
activity may contribute to control the increase in breast cancer burden taking place in most
populations over the world. However, even in women who never used HRT, substantial
amounts of physical activity are needed for expecting 20% or more reductions in breast
cancer risk. It is not sure that large proportions of women with no or low level of physical
activity would be willing, find the time and have the physical aptitude to engage in at least 5
hours/week of strenuous physical activity on the long term. A more realistic perspective

15
indicated by study findings is that a physically inactive women engaging in at least 150
minutes per week of vigorous physical activity would reduce their lifetime risk of breast
cancer by 9%, a reduction that might be two times greater in women who never used HRT.
Nonetheless, risk reductions were estimated from observational studies which do not
necessarily provide a reliable reflection of actual changes in risk that would be associated
with public health actions on decreasing sedentary and increasing physical activity. The time
is ripe for organizing large population randomized trials that will better inform on the
feasibility of policies encouraging physical activity to prevent breast cancer occurrence. On
the other hand, other lifestyle risk factors such as alcohol drinking that are known to be
associated with an increased risk of breast cancer should also be considered in strategies
aiming at preventing breast cancer.
Conflict of interest statement
None of the authors have any potential conflict of interest to declare in relation to the subject
matter of this manuscript.
Funding
This work was supported internally by iPRI, the International Prevention Research Institute.
There was no external funding for this study.

16
Figure captions
Figure 1. Flow chart of the literature search strategy to identify cohort studies on breast
cancer risk and physical activity.
Figure 2. Forest plot of meta-analysis of breast cancer risk according to physical activity
level in women. Individual studies are represented with their RR and 95% CI (highest versus
lowest category of physical activity). The square size is proportional to the variance of the RR
and the horizontal lines represent the corresponding 95% CI. Heterogeneity between studies
was assessed through Q and I² statistics. Publication bias was evaluated using Begg, Egger
and Macaskill tests.
Figure 3. Results from stratified analyses.
Figure 4. Dose-response relationship between breast cancer risk and physical activity in
studies that measured physical activity in MET-h per week (A) or in hours per week (B).
A. MET-h/week B. Hours/week
Web extra material
Table S1 – Details on computation and data extraction.
Table S2 – Duplicate studies that were excluded from main analysis.
Table S3 – Breast cancer types included in prospective studies.
Table S4 – Assessment of physical activity in prospective studies (duplicate studies from
which some data were used are in light grey)

17
Tables
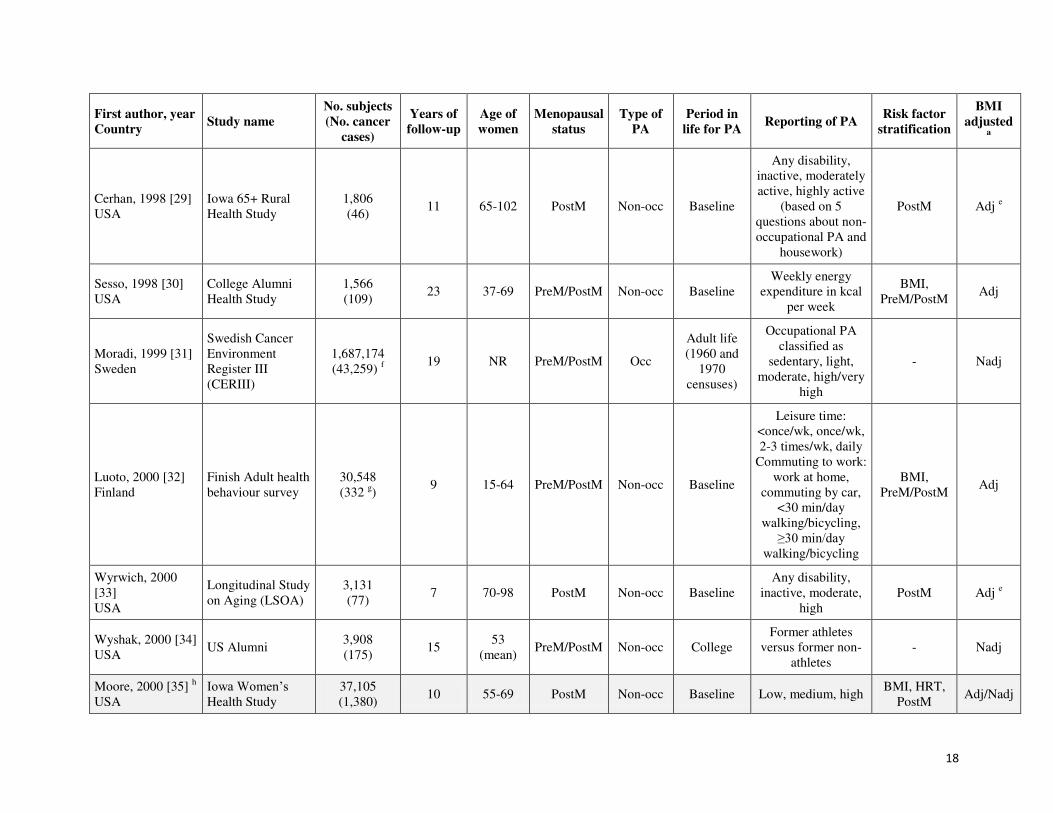
Table 1: Main characteristics of cohort studies included in the meta-analysis, ranked by year of publication. Duplicate articles not used
for the main meta-analysis but from which selected data were used in sub-analyses are highlighted in grey.
First author, year
Country Study name
No. subjects
(No. cancer
cases)
Years of
follow-up
Age of
women
Menopausal
status
Type of
PA
Period in
life for PA Reporting of PA
Risk factor
stratification
BMI
adjusted a
Paffenbarger, 1987
[24]
USA
Alumni from the
University of
Pennsylvania
4,706
(46) 32 NR PreM/PostM Non-occ
Early
college
≥5h/wk vs. <5h/wk of sport
b
- Nadj
Dorgan, 1994 [25]
USA
Framingham Heart
Study (FHS)
2,298
(117) 28 35-68 PreM/PostM
Occ and
non-occ c
Baseline
Index combining
hours per day of
sedentary, moderate
and heavy PA
(during work and
leisure time)
- Nadj
Steenland, 1995
[26] d
USA
National Health
and Nutrition
Examination
Survey I
(NHANES I)
NR
(163) 16 25-74 PreM/PostM Occ Baseline Little, some, a lot PostM Adj
Fraser, 1997 [27]
USA
Adventist Health
Study
20,341
(218) 6 ≥25 PreM/PostM
Occ and
non-occ c
Baseline Low, moderate, high - Adj/Nadj
Thune, 1997 [28]
Norway
National Health
Screening Service
25,624
(351) 14 20-54 PreM/PostM
Occ and
non-occ Baseline
Non-occupational:
sedentary, moderate,
regular exercise;
Occupational:
sedentary, walking,
lifting or heavy
manual labor
BMI,
PreM/PostM Adj/Nadj
18
First author, year
Country Study name
No. subjects
(No. cancer
cases)
Years of
follow-up
Age of
women
Menopausal
status
Type of
PA
Period in
life for PA Reporting of PA
Risk factor
stratification
BMI
adjusted a
Cerhan, 1998 [29]
USA
Iowa 65+ Rural
Health Study
1,806
(46) 11 65-102 PostM Non-occ Baseline
Any disability,
inactive, moderately
active, highly active
(based on 5
questions about non-
occupational PA and
housework)
PostM Adj e
Sesso, 1998 [30]
USA
College Alumni
Health Study
1,566
(109) 23 37-69 PreM/PostM Non-occ Baseline
Weekly energy
expenditure in kcal
per week
BMI,
PreM/PostM Adj
Moradi, 1999 [31]
Sweden
Swedish Cancer
Environment
Register III
(CERIII)
1,687,174
(43,259) f
19 NR PreM/PostM Occ
Adult life
(1960 and
1970
censuses)
Occupational PA
classified as
sedentary, light,
moderate, high/very
high
- Nadj
Luoto, 2000 [32]
Finland
Finish Adult health
behaviour survey
30,548
(332 g)
9 15-64 PreM/PostM Non-occ Baseline
Leisure time:
<once/wk, once/wk,
2-3 times/wk, daily
Commuting to work:
work at home,
commuting by car,
<30 min/day
walking/bicycling,
≥30 min/day walking/bicycling
BMI,
PreM/PostM Adj
Wyrwich, 2000
[33]
USA
Longitudinal Study
on Aging (LSOA)
3,131
(77) 7 70-98 PostM Non-occ Baseline
Any disability,
inactive, moderate,
high
PostM Adj e
Wyshak, 2000 [34]
USA US Alumni
3,908
(175) 15
53
(mean) PreM/PostM Non-occ College
Former athletes
versus former non-
athletes
- Nadj
Moore, 2000 [35] h
USA
Iowa Women’s Health Study
37,105
(1,380) 10 55-69 PostM Non-occ Baseline Low, medium, high
BMI, HRT,
PostM Adj/Nadj

19
First author, year
Country Study name
No. subjects
(No. cancer
cases)
Years of
follow-up
Age of
women
Menopausal
status
Type of
PA
Period in
life for PA Reporting of PA
Risk factor
stratification
BMI
adjusted a
Breslow, 2001 [36]
USA
National Health
Epidemiologic
follow-up study
(NHEFS, arised
from NHANES I)
6,160
(138) 9 24-75 PreM/PostM Non-occ
Long term
PA
(baseline
and 10y
before)
Low, moderate, high BMI,
PreM/PostM Adj
Dirx, 2001 [37]
The Netherlands
Netherlands
Cohort Study
(NLCS)
2,924
(1,208) 7 55-69 PostM
Occ and
non-occ
Lifetime for
occupational
PA and
baseline for
non-
occupational
PA
Minutes per day for
non-occupational
PA and kJ/min for
occupational PA
(energy expenditure)
BMI, PostM Nadj
Lee, 2001 [38]
USA
Women's Health
Study (WHS)
39,322
(411) 4 ≥45 PreM/PostM Non-occ
Baseline
(past year)
4 categories of
energy expended
during PA in
kJ/week
ER/PR i,
PostM Adj/Nadj
Moradi, 2002 [39]
Sweden
Swedish Twin
Registry
9,539
(506) 24 42-70 PreM/PostM
Occ and
non-occ
Adult life
(25-50
years)
Non-occupational:
sedentary, moderate,
regular PA;
Occupational:
Sedentary, active,
Strenuous
BMI,
PreM/PostM Nadj
Rintala, 2002 [40]
Finland Finnish citizen
680,000
(17,986) 24 ≥25 PreM/PostM Occ
Baseline, at
age 20 and
at age 35
Five categories of
occupational PA:
class 1+2, class 3,
class 4, class 5
PreM/PostM Nadj
McTiernan, 2003
[41] j
USA
Women Health
Initiative (WHI)
74,171
(1,780) 5 50-79 PostM Non-occ Baseline
MET-hours per
week BMI, PostM Adj
Patel, 2003 [42] k
USA
American Cancer
Society Cancer
Prevention Study
II Nutrition Cohort
72,608
(1,520) 5 50-74 PostM Non-occ
Baseline
(past year)
MET-hours per
week
BMI, HRT,
PostM
Adj/Nadj e

20
First author, year
Country Study name
No. subjects
(No. cancer
cases)
Years of
follow-up
Age of
women
Menopausal
status
Type of
PA
Period in
life for PA Reporting of PA
Risk factor
stratification
BMI
adjusted a
(CPS-II nutrition
Cohort)
Rintala, 2003 [43]
Finland
Finnish female
physical education
and language
teachers
10,049
(465) 34 >25 PreM/PostM Occ Lifetime
Physical education
teachers (high
lifetime PA) vs.
language teachers
(low lifetime PA)
PreM/PostM Nadj
Margolis, 2005
[44]
Norway, Sweden
Women’s Lifestyle and Health Study
99,504
(1,166) 9 30-49 PreM/PostM Non-occ Baseline
5 levels of PA:
none, low,
moderate, high,
vigorous
PreM/PostM Adj
Schnohr, 2005 [45]
Denmark
Copenhagen
Centre for
Prospective
Population Studies
13,216
(417) 14 20-93 PostM Non-occ
Baseline
(past year)
3 levels of PA: low,
moderate and
vigorous
PostM Adj/Nadj
Bardia, 2006 [46]
USA
Iowa Women’s Health Study
41,836
(2,548) 18 55-69 PostM Non-occ Baseline Low, medium, high
ER/PR,
PostM Adj/Nadj
Chang, 2006 [47]
USA
Prostate, Lung,
Colorectal and
Ovarian Cancer
Screening Trial
(PLCO)
27,541
(764)
9
(median
5)
55-74 PostM Non-occ Baseline Hours per week PostM Adj/Nadj
Mertens, 2006 [48]
USA
Atherosclerosis
risk in
communities
(ARIC)
7,994
(342) 13 45-64 PreM/PostM
Occ and
non-occ Baseline
Quartile of PA
based on Baecke
indices
PostM Nadj
Silvera, 2006 [49]
Canada
Canadian National
Breast Screening
Study (NBSS)
40,318
(1,673) 16 40-59 PreM/PostM Non-occ
Baseline
(past one
month)
Minutes per day BMI,
PreM/PostM Adj/Nadj
Tehard, 2006 [50]
France
E3N cohort of
French teachers
(E3N)
90,509
(3,424) 12 40-65 PreM/PostM Non-occ Baseline
Total PA in MET-
hours per week;
Vigorous
BMI, HRT Adj/Nadj

21
First author, year
Country Study name
No. subjects
(No. cancer
cases)
Years of
follow-up
Age of
women
Menopausal
status
Type of
PA
Period in
life for PA Reporting of PA
Risk factor
stratification
BMI
adjusted a
recreational PA in
hours per week
Dallal, 2007 [51]
USA
California
Teachers Study
110,599
(2,649) 7 20-79 PreM/PostM Non-occ
Lifetime
(between
high school
and current
age)
Hours per week BMI, ER/PR,
PreM/PostM Adj/Nadj
Leitzmann, 2008
[52]
USA
Breast Cancer
Detection
Demonstration
Project Follow-up
Study (BCDDP)
32,269
(1,506) 8 40-93 PostM
Occ and
non-occ c
Baseline
(past year)
MET-hours per
week
BMI, ER/PR,
PostM Adj/Nadj
Maruti, 2008 [53]l
USA
Nurses’ Health Study II (NHS II)
64,777
(550) 6 33-51 PreM Non-occ
Adolescence
and adult
(from age
12 to current
age)
Total PA in MET-
hours per week;
Strenuous activity in
hours per week
BMI, ER/PR,
PreM Nadj
Suzuki, 2008 [54]
Japan
Japan
Collaborative
Cohort Study
(JACC)
30,157
(207) 12 40-69 PreM/PostM
Occ and
non-occ c
Baseline
Minutes per day
(time spent walking)
and hours per week
(time spent
exercising)
BMI,
PreM/PostM Adj/Nadj
Howard, 2009 [55]
USA
U.S. Radiologic
Technologists
cohort (USRT)
45,631
(864) 9 47 PreM/PostM
Occ and
non-occ c
Baseline
(past year)
Total PA in MET-
hours per week;
Strenuous exercise
in hours per week
HRT,
PreM/PostM Adj/Nadj
Peters, 2009 [56] m
USA
National Institutes
of Health-
American
Association of
Retired Persons
Diet and Health
182,862
(5,433) 7 50-71 PostM
Occ and
non-occ c
Baseline
(past year)
Times per week
(Inactive, <1/wk, 1-
2/wk, 3-4/wk,
≥5/wk)
BMI, ER/PR,
HRT, PostM Adj/Nadj

22
First author, year
Country Study name
No. subjects
(No. cancer
cases)
Years of
follow-up
Age of
women
Menopausal
status
Type of
PA
Period in
life for PA Reporting of PA
Risk factor
stratification
BMI
adjusted a
Study
(NIH-AARP)
Peters, 2009 [57] m
USA
National Institutes
of Health-
American
Association of
Retired Persons
Diet and Health
Study
(NIH-AARP)
118,899
(3,522) 7 50-71 PostM Non-occ
Past 10
years Hours per week
ER/PR n,
PostM Nadj
George, 2010 [58]
m
USA
National Institutes
of Health-
American
Association of
Retired Persons
Diet and Health
Study
(NIH-AARP)
97,039
(2,866) 7 50-71 PostM Occ Baseline
5 levels of activity:
sitting all day;
sitting and a little
walking; standing or
walking, no lifting;
lifting or carrying
light loads, or
climbing stairs
often; heavy lifting
or carrying
PostM Adj
Eliassen, 2010 [59]
USA
Nurses’ Health Study (NHS)
95,396
(4,782) 20 40-65 PostM Non-occ
Baseline
(past year)
and update
every 2 or 4
years
MET-hours per
week
ER/PR,
PostM Adj/Nadj
Pronk, 2011 [60]
China
Shanghai Women's
Health Study
(SWHS)
73,049
(717) 9 40-70 PreM/PostM
Occ and
non-occ
Non-occ PA
in past year
and 5 years
before
interview.
Lifetime occ
PA.
Non-occupational:
MET-hours per
week per year;
Occupational:
energy expenditure
in kJ per min per
year
BMI,
PreM/PostM Nadj

23
First author, year
Country Study name
No. subjects
(No. cancer
cases)
Years of
follow-up
Age of
women
Menopausal
status
Type of
PA
Period in
life for PA Reporting of PA
Risk factor
stratification
BMI
adjusted a
Phipps, 2011 [21]
USA
Women Health
Initiative (WHI)
155,723
(2,917) 8 50-79 PostM Non-occ Baseline
MET-hours per
week
ER/PR o,
PostM Adj
Suzuki, 2011 [61]
Japan
Japan Public
Health Center-
based Prospective
Study (JPHC)
53,578
(652) 15 40-69 PreM/PostM
Occ p and
non-occ
Baseline
and updated
5 years
after
MET-hours per day;
no data for
occupational PA
only but for leisure
time only (in days
per month or per
week)
BMI, ER/PR,
PreM/PostM Adj/Nadj
Steindorf, 2013
[62]
Europe
European
Prospective
Investigation into
Cancer and
Nutrition (EPIC)
257,805
(8,034) 12 35-70 PreM/PostM
Occ and
non-occ
Baseline
(past year
for non-occ
PA and
current for
occ PA)
MET-hours per
week for non-
occupational PA;
4 categories for
occupational PA
(sedentary;
Standing; Manual
and heavy manual;
non-worker)
BMI, ER/PR,
PreM/PostM Adj
Hildebrand, 2013
[63]
USA
American Cancer
Society Cancer
Prevention Study
II Nutrition Cohort
(CPS-II nutrition
Cohort)
73,615
(4,760)
17
(median
14)
50-74 PostM Non-occ
Baseline
and updated
3 times
during
follow-up
MET-hours per
week for total non-
occupational PA
PostM Adj e
Hastert, 2013 [64]
USA
Vitamins and
Lifestyle study
cohort (VITAL)
30,797
(899) 7 50-76 PostM Non-occ
Past 10
years
Be physically active
vs. be physically
inactive according to
WCRF/AICR cancer
prevention
recommendations.
PostM Adj/Nadj
Rosenberg, 2014
[22]
USA
Black Women's
Health Study
(BWHS)
44,708
(1,364) 16 ≥30 PreM/PostM Non-occ
Baseline
(past year) Hours per week
b
BMI, ER/PR o,
PreM/PostM
Nadj

24
First author, year
Country Study name
No. subjects
(No. cancer
cases)
Years of
follow-up
Age of
women
Menopausal
status
Type of
PA
Period in
life for PA Reporting of PA
Risk factor
stratification
BMI
adjusted a
Borch, 2014 [65] q
Norway
Norwegian
Women and
Cancer Study
(NOWAC)
80,202
(1,767) 8 34-70 PostM
Occ and
non-occ c
Baseline
5 levels of PA: very
low, low, moderate,
high, very high
ER/PR,
PostM Adj
e
Catsburg, 2014
[66]
Canada
Canadian Study of
Diet, Lifestyle and
Health (CSDLH)
4,393
(1,094) 15
59
(mean) PreM/PostM Non-occ Baseline
Hours per week and
MET-hours per
week
BMI, HRT,
PreM/PostM Adj
Brinton, 2014 [67]
USA
National Institutes
of Health-
American
Association of
Retired Persons
Diet and Health
Study
(NIH-AARP)
190,872
(7,384) 9 50-71 PostM
Occ and
non-occ c
Baseline
(past year)
Times per week
(never/rarely,1-
3/month, 1-2/wk, 3-
4/wk, ≥5/wk)
PostM Adj
Boeke, 2014 [68]
USA
Nurses’ Health Study II (NHS II)
75,669
(2,697) 14 25-42 PreM/PostM Non-occ
Adolescence
and adult
(from age
12 to current
age)
Total PA in MET-
hours per week b
ER/PR n,
PreM/PostM Nadj
PA: physical activity; Occ: occupational PA; Non-occ: non-occupational PA; NR: data not reported; MET: metabolic equivalent of task.
PostM: Post-menopausal women; PreM: Pre-menopausal women.
BMI: Body mass index; HRT: Hormone replacement therapy; ER: Estrogen receptor; PR: Progesterone receptor.
a Reported RR was adjusted for BMI: Adj: adjusted; Nadj: not adjusted; Adj/Nadj: both results were available (adjusted and not adjusted).
b These studies were not used for the dose-response analysis because RRs were reported for dichotomous exposure (Paffenbarger 1987) or only a high vs. low result was
reported in the text (Rosenberg 2014 and Boeke 2014).
c Occupational and non-occupational PA were not distinguished.
d This study was only used for the stratified analysis on the type of PA as it used the same cohort as Breslow 2001 and reported data on occupational PA.
e RRs reported in the article were adjusted for BMI but as we recomputed RRs from cases and PYs we considered them as not adjusted for BMI in our analyses (see table
S3).
25
First author, year
Country Study name
No. subjects
(No. cancer
cases)
Years of
follow-up
Age of
women
Menopausal
status
Type of
PA
Period in
life for PA Reporting of PA
Risk factor
stratification
BMI
adjusted a
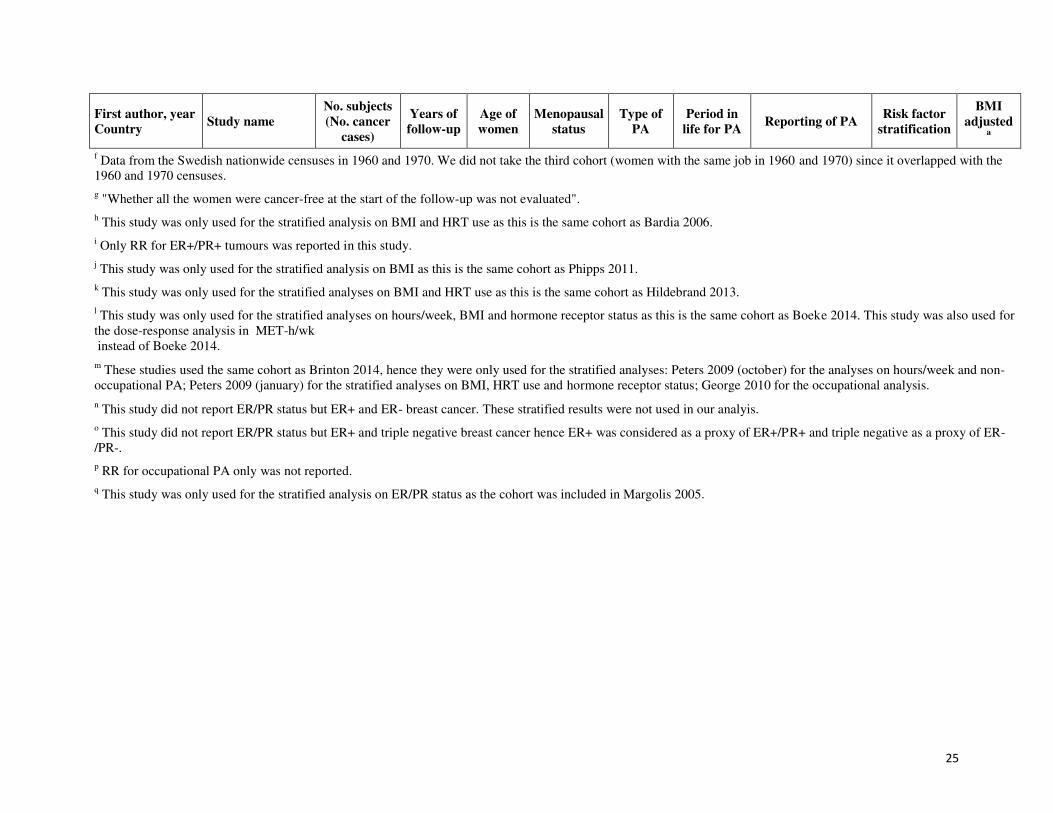
f Data from the Swedish nationwide censuses in 1960 and 1970. We did not take the third cohort (women with the same job in 1960 and 1970) since it overlapped with the
1960 and 1970 censuses.
g "Whether all the women were cancer-free at the start of the follow-up was not evaluated".
h This study was only used for the stratified analysis on BMI and HRT use as this is the same cohort as Bardia 2006.
i Only RR for ER+/PR+ tumours was reported in this study.
j This study was only used for the stratified analysis on BMI as this is the same cohort as Phipps 2011.
k This study was only used for the stratified analyses on BMI and HRT use as this is the same cohort as Hildebrand 2013.
l This study was only used for the stratified analyses on hours/week, BMI and hormone receptor status as this is the same cohort as Boeke 2014. This study was also used for
the dose-response analysis in MET-h/wk
instead of Boeke 2014.
m These studies used the same cohort as Brinton 2014, hence they were only used for the stratified analyses: Peters 2009 (october) for the analyses on hours/week and non-
occupational PA; Peters 2009 (january) for the stratified analyses on BMI, HRT use and hormone receptor status; George 2010 for the occupational analysis.
n This study did not report ER/PR status but ER+ and ER- breast cancer. These stratified results were not used in our analyis.
o This study did not report ER/PR status but ER+ and triple negative breast cancer hence ER+ was considered as a proxy of ER+/PR+ and triple negative as a proxy of ER-
/PR-.
p RR for occupational PA only was not reported.
q This study was only used for the stratified analysis on ER/PR status as the cohort was included in Margolis 2005.

26
Table 2: Physical activity and risk of breast cancer according to HRT use.
Never users Ever users All women
Study Year of
start/end
Years of
follow-up
No. Women
(No. BC) RR [95%CI]
No. Women
(No. BC) RR [95%CI]
No. Women
(No. BC) RR [95%CI]
Moore, 2000 [35] 1986/1995 10 22,429
(-) 0.89 [0.74; 1.06]
13,934
(-) 0.94 [0.76; 1.16] a
37,105
(1,380) 0.95 [0.83; 1.10] b
Patel, 2003 [42] 1992/1997 5 35,013
(705) 0.64 [0.43; 0.95] c
35,247
(771) 0.87 [0.64; 1.19] cd
72,608
(1,520) 0.73 [0.51; 1.04] bc
Tehard, 2006 [50] 1990/2002 12 65,554
(1,189) 0.79 [0.67; 0.94] e
24,955
(1,095) 1.01 [0.85; 1.21]
90,509
(3,424) 0.90 [0.80; 1.02]
Howard, 2009 [55] 1994/2005 9 34,981
(139) 0.71 [0.43; 1.17]
10,650
(285) 1.15 [0.78; 1.70]
45,631
(864) 0.91 [0.74; 1.13]
Peters, 2009 [56] 1995/2003 7 100,757
(2,528) f
0.76 [0.67; 0.86] 82,105
(4,073) f
0.97 [0.88; 1.08] 182,862
(5,433) f
0.86 [0.79; 0.94] b
Catsburg, 2014 [66] 1995/2010 15 3,202
(724) 0.73 [0.55; 0.97]
1,215
(329) 0.83 [0.55; 1.26]
4,393
(1,094) 0.77 [0.61; 0.97]
SRR 261,936
(5,285) 0.78 [0.70; 0.87]
168,106
(6,553) 0.97 [0.88; 1.07]
433,105
(13,715) 0.88 [0.81; 0.95]
HRT: hormone replacement therapy; SRR: summary relative risk.
a RRs corresponding to past and current users were combined using a fixed-effect meta-analysis in order to get an ever users group.
b These results were not used in the main meta-analysis because these studies are duplicate with other studies.
c As the reference category was not the first one reported, the first two categories were merged and RRs were recomputed from cases and PY.
d Data from past and current users were taken into account to compute the RR for ever users.
e As RR for HRT non-users was not reported, it was computed from cases and PY.
f For the analysis on HRT use, both invasive and in-situ breast cancers were considered while for all women only invasive breast cancers were
considered.

27
Table 3: Summary of studies that reported three or more categories of physical activity duration per day or per week.
First author, year of
publication Type of PA
Period of PA
assessment No. categories
% PYs
in lowest
PA
category
% PYs in
highest
PA
category
Lowest
(h/w)
Highest
(h/w)
RR
highest
vs.
lowest
95% CI
Dirx, 2001 [37] Total non-occupational Baseline 4 22% 22% <3.5 >10.5 0.76 0.58; 0.99
Chang, 2006 [47] Vigorous non-
occupational Baseline 6 15% 21% 0 ≥4 0.81 0.63; 1.05
Silvera, 2006 [49] Vigorous non-
occupational
Baseline (past one
month) 4 28% 26% 0 >7 0.93 0.78; 1.10
Tehard, 2006 [50] Vigorous non-
occupational Baseline 5 (3 after merging)
ab 57% 13% 0 (inactive) ≥3 0.79 0.71; 0.89
Dallal, 2007 [51] Vigorous non-
occupational
Lifetime - between
high school and
current age
5 29% 11% <0.5 >5 0.8 0.69; 0.94
Maruti, 2008 [53] Vigorous non-
occupational
Lifetime - adolescence
and adult (from age 12
to current age)
5 21% 21% <1 ≥4 0.9 0.68; 1.18
Suzuki, 2008 [54]
Walking + exercise
(occupational and non-
occupational combined)
Baseline 3 NA NA NA NA 0.76 c 0.58; 1.00
Howard, 2009 [55]
Vigorous activity
(occupational and non-
occupational combined)
Baseline (past year) 5 (4 after merging) a 50% 9% 0 ≥4 0.82 0.63; 1.06
Peters, 2009 [57] Moderate/vigorous non-
occupational Past 10 years 5 14% 24% 0 or rarely >7 0.84 0.75; 0.94
Rosenberg, 2014 [22] Vigorous non-
occupational Baseline (past year) 6 (5 after merging)
a 53% 13% <1 ≥5 0.81 0.68; 0.98
Catsburg, 2014 [66] Total non-occupational Baseline 5 21% d 16%
d <1 >7.5 0.77 0.61; 0.97
Summary relative risk 0.82 0.77;0.87
PA: physical activity; PY: person-year; RR: relative risk; CI: confidence interval; NA: not available/applicable. a Two first categories were merged as the reference category was not the first one reported.
b Two last categories were merged to get a category with at least 10% of subjects.
c RR computed using a fixed effect meta-analysis, see Table S3.
d % BC cases because PYs or No. of women in categories were not reported.

28
References
[1] Ferlay J, Soerjomataram I, Ervik M, Dikshit RP, Eser S, Mathers C, et al. GLOBOCAN 2012 v1.1,
Cancer Incidence and Mortality Worldwide: IARC CancerBase No. 11. Lyon, France: International
Agency for Research on Cancer; 2012.
[2] Veronesi U, Boyle P, Goldhirsch A, Orecchia R, Viale G. Breast cancer. Lancet. 2005;365:1727-41.
[3] World Cancer Research Fund. Cancer preventability statistics. United Kingdom.
[4] Autier P, Boffetta P, Boniol M, Boyle P, Ferlay J, Al E. Attributable causes of cancer in France in the
year 2000: IARC, Lyon; 2007.
[5] Frisch RE, Wyshak G, Albright NL, Albright TE, Schiff I, Jones KP, et al. Lower prevalence of breast
cancer and cancers of the reproductive system among former college athletes compared to non-athletes. Br
J Cancer. 1985;52:885-91.
[6] Vainio H, Bianchini F. IARC Handbooks of Cancer Prevention. Volume 6. Weight Control and
Physical Activity. Lyon, France: IARC press; 2002.
[7] Friedenreich C. Physical activity and breast cancer review of the epidemiologic evidence and biologic
mechanisms. Recent Results Cancer Res. 2011;188:125-39.
[8] Key T, Appleby P, Barnes I, Reeves G. Endogenous sex hormones and breast cancer in
postmenopausal women: reanalysis of nine prospective studies. J Natl Cancer Inst. 2002;94:606-16.
[9] Missmer SA, Eliassen AH, Barbieri RL, Hankinson SE. Endogenous estrogen, androgen, and
progesterone concentrations and breast cancer risk among postmenopausal women. J Natl Cancer Inst.
2004;96:1856-65.
[10] Eliassen AH, Missmer SA, Tworoger SS, Hankinson SE. Endogenous steroid hormone
concentrations and risk of breast cancer: does the association vary by a woman's predicted breast cancer
risk? J Clin Oncol. 2006;24:1823-30.
[11] McTiernan A. Effect of Exercise on Serum Estrogens in Postmenopausal Women: A 12-Month
Randomized Clinical Trial. Cancer Res. 2004;64:2923-8.
[12] McTiernan A, Wu L, Chen C, Chlebowski R, Mossavar-Rahmani Y, Modugno F, et al. Relation of
BMI and physical activity to sex hormones in postmenopausal women. Obesity (Silver Spring).
2006;14:1662-77.
[13] Rossouw JE, Anderson GL, Prentice RL, LaCroix AZ, Kooperberg C, Stefanick ML, et al. Risks and
benefits of estrogen plus progestin in healthy postmenopausal women: principal results From the Women's
Health Initiative randomized controlled trial. JAMA. 2002;288:321-33.
[14] Beral V. Breast cancer and hormone-replacement therapy in the Million Women Study. The Lancet.
2003;362:419-27.
[15] Moher D, Liberati A, Tetzlaff J, Altman DG. Preferred reporting items for systematic reviews and
meta-analyses: the PRISMA statement. BMJ. 2009;339:b2535.

29
[16] van Houwelingen HC, Arends LR, Stijnen T. Advanced methods in meta-analysis: multivariate
approach and meta-regression. Stat Med. 2002;21:589-624.
[17] Higgins JP, Thompson SG. Quantifying heterogeneity in a meta-analysis. Stat Med. 2002;21:1539-
58.
[18] Begg CB, Mazumdar M. Operating characteristics of a rank correlation test for publication bias.
Biometrics. 1994;50:1088-101.
[19] Egger M, Smith GD, Phillips AN. Meta-analysis: principles and procedures. BMJ. 1997;315:1533-7.
[20] Macaskill P, Walter SD, Irwig L. A comparison of methods to detect publication bias in meta-
analysis. Stat Med. 2001;20:641-54.
[21] Phipps AI, Chlebowski RT, Prentice R, McTiernan A, Stefanick ML, Wactawski-Wende J, et al.
Body size, physical activity, and risk of triple-negative and estrogen receptor-positive breast cancer.
Cancer Epidemiol Biomarkers Prev. 2011;20:454-63.
[22] Rosenberg L, Palmer JR, Bethea TN, Ban Y, Kipping-Ruane K, Adams-Campbell LL. A prospective
study of physical activity and breast cancer incidence in african-american women. Cancer Epidemiol
Biomarkers Prev. 2014;23:2522-31.
[23] Greenland S, Longnecker MP. Methods for trend estimation from summarized dose-response data,
with applications to meta-analysis. Am J Epidemiol. 1992;135:1301-9.
[24] Paffenbarger RS, Jr., Hyde RT, Wing AL. Physical activity and incidence of cancer in diverse
populations: a preliminary report. Am J Clin Nutr. 1987;45:312-7.
[25] Dorgan JF, Brown C, Barrett M, Splansky GL, Kreger BE, D'Agostino RB, et al. Physical activity
and risk of breast cancer in the Framingham Heart Study. Am J Epidemiol. 1994;139:662-9.
[26] Steenland K, Nowlin S, Palu S. Cancer incidence in the National Health and Nutrition Survey I.
Follow-up data: diabetes, cholesterol, pulse and physical activity. Cancer Epidemiol Biomarkers Prev.
1995;4:807-11.
[27] Fraser GE, Shavlik D. Risk Factors, Lifetime Risk, and Age at Onset of Breast Cancer. Ann
Epidemiol. 1997;7:375-82.
[28] Thune I, Brenn T, Lund E, Gaard M. Physical activity and the risk of breast cancer. N Engl J Med.
1997;336:1269-75.
[29] Cerhan JR, Chiu BCH, Wallace RB, Lemke JH, Lynch CF, Torner JC, et al. Physical Activity,
Physical Function, and the Risk of Breast Cancer in a Prospective Study Among Elderly Women. J
Gerontol. 1998;53A:M251-6.
[30] Sesso HD, Paffenbarger RS, Jr., Lee IM. Physical activity and breast cancer risk in the College
Alumni Health Study (United States). Cancer Causes Control. 1998;9:433-9.
[31] Moradi T, Adami HO, Bergstrom R, Gridley G, Wolk A, Gerhardsson M, et al. Occupational
physical activity and risk for breast cancer in a nationwide cohort study in Sweden. Cancer Causes
Control. 1999;10:423-30.

30
[32] Luoto R, Latikka P, Pukkala E, Hakulinen T, Vihko V. The effect of physical activity on breast
cancer risk: a cohort study of 30,548 women. Eur J Epidemiol. 2000;16:973-80.
[33] Wyrwich KW, Wolinsky FD. Physical Activity, Disability, and the Risk of Hospitalization for Breast
Cancer Among Older Women. J Gerontol. 2000;55A:M418-21.
[34] Wyshak G, Frisch RE. Breast cancer among former college athletes compared to non-athletes: a 15-
year follow-up. Br J Cancer. 2000;82:726-30.
[35] Moore DB, Folsom AR, Mink PJ, Hong CP, Anderson KE, Kushi LH. Physical activity and
incidence of postmenopausal breast cancer. Epidemiology. 2000;11:292-6.
[36] Breslow RA, Ballard-Barbash R, Munoz K, Graubard BI. Long-term recreational physical activity
and breast cancer in the National Health and Nutrition Examination Survey I epidemiologic follow-up
study. Cancer Epidemiol Biomarkers Prev. 2001;10:805-8.
[37] Dirx MJ, Voorrips LE, Goldbohm RA, van den Brandt PA. Baseline recreational physical activity,
history of sports participation, and postmenopausal breast carcinoma risk in the Netherlands Cohort Study.
Cancer. 2001;92:1638-49.
[38] Lee IM, Rexrode KM, Cook NR, Hennekens CH, Burin JE. Physical activity and breast cancer risk:
the Women's Health Study (United States). Cancer Causes Control. 2001;12:137-45.
[39] Moradi T, Adami HO, Ekbom A, Wedren S, Terry P, Floderus B, et al. Physical activity and risk for
breast cancer a prospective cohort study among Swedish twins. Int J Cancer. 2002;100:76-81.
[40] Rintala P, Pukkala E, Paakkulainen HT, Vihko VJ. Self-experienced physical workload and risk of
breast cancer. Scand J Work Environ Health. 2002;28:158-62.
[41] McTiernan A, Kooperberg C, White E, Wilcox S, Coates R, Adams-Campbell LL, et al. Recreational
physical activity and the risk of breast cancer in postmenopausal women: the Women's Health Initiative
Cohort Study. JAMA. 2003;290:1331-6.
[42] Patel AV, Callel EE, Bernstein L, Wu AH, Thun MJ. Recreational physical activity and risk of
postmenopausal breast cancer in a large cohort of US women. Cancer Causes Control. 2003;14:519-29.
[43] Rintala P, Pukkala E, Laara E, Vihko V. Physical activity and breast cancer risk among female
physical education and language teachers: a 34-year follow-up. Int J Cancer. 2003;107:268-70.
[44] Margolis KL, Mucci L, Braaten T, Kumle M, Trolle Lagerros Y, Adami HO, et al. Physical activity
in different periods of life and the risk of breast cancer: the Norwegian-Swedish Women's Lifestyle and
Health cohort study. Cancer Epidemiol Biomarkers Prev. 2005;14:27-32.
[45] Schnohr P, Gronbaek M, Petersen L, Hein HO, Sorensen TI. Physical activity in leisure-time and risk
of cancer: 14-year follow-up of 28,000 Danish men and women. Scand J Public Health. 2005;33:244-9.
[46] Bardia A, Hartmann LC, Vachon CM, Vierkant RA, Wang AH, Olson JE, et al. Recreational physical
activity and risk of postmenopausal breast cancer based on hormone receptor status. Arch Intern Med.
2006;166:2478-83.

31
[47] Chang SC, Ziegler RG, Dunn B, Stolzenberg-Solomon R, Lacey JV, Jr., Huang WY, et al.
Association of energy intake and energy balance with postmenopausal breast cancer in the prostate, lung,
colorectal, and ovarian cancer screening trial. Cancer Epidemiol Biomarkers Prev. 2006;15:334-41.
[48] Mertens AJ, Sweeney C, Shahar E, Rosamond WD, Folsom AR. Physical activity and breast cancer
incidence in middle-aged women: a prospective cohort study. Breast Cancer Res Treat. 2006;97:209-14.
[49] Silvera SA, Jain M, Howe GR, Miller AB, Rohan TE. Energy balance and breast cancer risk: a
prospective cohort study. Breast Cancer Res Treat. 2006;97:97-106.
[50] Tehard B, Friedenreich CM, Oppert JM, Clavel-Chapelon F. Effect of physical activity on women at
increased risk of breast cancer: results from the E3N cohort study. Cancer Epidemiol Biomarkers Prev.
2006;15:57-64.
[51] Dallal CM, Sullivan-Halley J, Ross RK, Wang Y, Deapen D, Horn-Ross PL, et al. Long-term
recreational physical activity and risk of invasive and in situ breast cancer: the California teachers study.
Arch Intern Med. 2007;167:408-15.
[52] Leitzmann MF, Moore SC, Peters TM, Lacey JV, Jr., Schatzkin A, Schairer C, et al. Prospective
study of physical activity and risk of postmenopausal breast cancer. Breast Cancer Res. 2008;10:R92.
[53] Maruti SS, Willett WC, Feskanich D, Rosner B, Colditz GA. A prospective study of age-specific
physical activity and premenopausal breast cancer. J Natl Cancer Inst. 2008;100:728-37.
[54] Suzuki S, Kojima M, Tokudome S, Mori M, Sakauchi F, Fujino Y, et al. Effect of physical activity
on breast cancer risk: findings of the Japan collaborative cohort study. Cancer Epidemiol Biomarkers
Prev. 2008;17:3396-401.
[55] Howard RA, Leitzmann MF, Linet MS, Freedman DM. Physical activity and breast cancer risk
among pre- and postmenopausal women in the U.S. Radiologic Technologists cohort. Cancer Causes
Control. 2009;20:323-33.
[56] Peters TM, Schatzkin A, Gierach GL, Moore SC, Lacey JV, Jr., Wareham NJ, et al. Physical activity
and postmenopausal breast cancer risk in the NIH-AARP diet and health study. Cancer Epidemiol
Biomarkers Prev. 2009;18:289-96.
[57] Peters TM, Moore SC, Gierach GL, Wareham NJ, Ekelund U, Hollenbeck AR, et al. Intensity and
timing of physical activity in relation to postmenopausal breast cancer risk: the prospective NIH-AARP
diet and health study. BMC Cancer. 2009;9:349.
[58] George SM, Irwin ML, Matthews CE, Mayne ST, Gail MH, Moore SC, et al. Beyond recreational
physical activity: examining occupational and household activity, transportation activity, and sedentary
behavior in relation to postmenopausal breast cancer risk. Am J Public Health. 2010;100:2288-95.
[59] Eliassen AH, Hankinson SE, Rosner B, Holmes MD, Willett W. Physical Activity and Risk of Breast
Cancer Among Postmenopausal Women. Arch Intern Med. 2010;170:1758-64.
[60] Pronk A, Ji BT, Shu XO, Chow WH, Xue S, Yang G, et al. Physical activity and breast cancer risk in
Chinese women. Br J Cancer. 2011;105:1443-50.
32
[61] Suzuki R, Iwasaki M, Yamamoto S, Inoue M, Sasazuki S, Sawada N, et al. Leisure-time physical
activity and breast cancer risk defined by estrogen and progesterone receptor status--the Japan Public
Health Center-based Prospective Study. Prev Med. 2011;52:227-33.
[62] Steindorf K, Ritte R, Eomois PP, Lukanova A, Tjonneland A, Johnsen NF, et al. Physical activity and
risk of breast cancer overall and by hormone receptor status: the European prospective investigation into
cancer and nutrition. Int J Cancer. 2013;132:1667-78.
[63] Hildebrand JS, Gapstur SM, Campbell PT, Gaudet MM, Patel AV. Recreational physical activity and
leisure-time sitting in relation to postmenopausal breast cancer risk. Cancer Epidemiol Biomarkers Prev.
2013;22:1906-12.
[64] Hastert TA, Beresford SA, Patterson RE, Kristal AR, White E. Adherence to WCRF/AICR cancer
prevention recommendations and risk of postmenopausal breast cancer. Cancer Epidemiol Biomarkers
Prev. 2013;22:1498-508.
[65] Borch KB, Lund E, Braaten T, Weiderpass E. Physical activity and the risk of postmenopausal breast
cancer - the Norwegian Women and Cancer Study. J Negat Results Biomed. 2014;13:3.
[66] Catsburg C, Kirsh VA, Soskolne CL, Kreiger N, Bruce E, Ho T, et al. Associations between
anthropometric characteristics, physical activity, and breast cancer risk in a Canadian cohort. Breast
Cancer Res Treat. 2014;145:545-52.
[67] Brinton LA, Smith L, Gierach GL, Pfeiffer RM, Nyante SJ, Sherman ME, et al. Breast cancer risk in
older women: results from the NIH-AARP Diet and Health Study. Cancer Causes Control. 2014;25:843-
57.
[68] Boeke CE, Eliassen AH, Oh H, Spiegelman D, Willett WC, Tamimi RM. Adolescent physical
activity in relation to breast cancer risk. Breast Cancer Res Treat. 2014;145:715-24.
[69] Ainsworth BE, Haskell WL, Leon AS, Jacobs DR, Jr., Montoye HJ, Sallis JF, et al. Compendium of
physical activities: classification of energy costs of human physical activities. Med Sci Sports Exerc.
1993;25:71-80.
[70] Ainsworth BE, Haskell WL, Whitt MC, Irwin ML, Swartz AM, Strath SJ, et al. Compendium of
physical activities: an update of activity codes and MET intensities. Med Sci Sports Exerc. 2000;32:S498-
504.
[71] Ainsworth BE, Haskell WL, Herrmann SD, Meckes N, Bassett DR, Jr., Tudor-Locke C, et al. 2011
Compendium of Physical Activities: a second update of codes and MET values. Med Sci Sports Exerc.
2011;43:1575-81.
[72] Kabat GC, Kim M, Wactawski-Wende J, Lane D, Adams-Campbell LL, Gaudet M, et al.
Recreational physical activity, anthropometric factors, and risk of ductal carcinoma in situ of the breast in
a cohort of postmenopausal women. Cancer Causes Control. 2010;21:2173-81.
[73] Steindorf K, Ritte R, Tjonneland A, Johnsen NF, Overvad K, Ostergaard JN, et al. Prospective study
on physical activity and risk of in situ breast cancer. Cancer Epidemiol Biomarkers Prev. 2012;21:2209-
19.
[74] Holli K, Isola J, Cuzick J. Hormone replacement therapy and biological aggressiveness of breast
cancer. The Lancet. 1997;350:1704-5.

33
[75] Ravdin PM, Cronin KA, Howlader N, Berg CD, Chlebowski RT, Feuer EJ, et al. The decrease in
breast-cancer incidence in 2003 in the United States. N Engl J Med. 2007;356:1670-4.
[76] Li CI, Malone KE, Porter PL, Weiss NS, Tang MT, Cushing-Haugen KL, et al. Relationship between
long durations and different regimens of hormone therapy and risk of breast cancer. JAMA.
2003;289:3254-63.
[77] IARC. IARC Monographs on the Evaluation of Carcinogenic Risks to Humans. Volume 91.
Combined Estrogen − Progestogen Contraceptives and Combined Estrogen − Progestogen Menopausal Therapy. Lyon, France: World Health Organization; 2007.
[78] Calle EE, Rodriguez C, Walker-Thurmond K, Thun MJ. Overweight, obesity, and mortality from
cancer in a prospectively studied cohort of U.S. adults. N Engl J Med. 2003;348:1625-38.
[79] Barnett GC, Shah M, Redman K, Easton DF, Ponder BA, Pharoah PD. Risk factors for the incidence
of breast cancer: do they affect survival from the disease? J Clin Oncol. 2008;26:3310-6.
[80] Keum N, Greenwood DC, Lee DH, Kim R, Aune D, Ju W, et al. Adult weight gain and adiposity-
related cancers: a dose-response meta-analysis of prospective observational studies. J Natl Cancer Inst.
2015;107.
[81] Pradhan AD, Cook NR, Buring JE, Manson JE, Ridker PM. C-reactive protein is independently
associated with fasting insulin in nondiabetic women. Arterioscler Thromb Vasc Biol. 2003;23:650-5.
[82] Allin KH, Nordestgaard BG, Flyger H, Bojesen SE. Elevated pre-treatment levels of plasma C-
reactive protein are associated with poor prognosis after breast cancer: a cohort study. Breast Cancer Res.
2011;13:R55.
[83] Proctor MJ, Morrison DS, Talwar D, Balmer SM, O'Reilly DS, Foulis AK, et al. An inflammation-
based prognostic score (mGPS) predicts cancer survival independent of tumour site: a Glasgow
Inflammation Outcome Study. Br J Cancer. 2011;104:726-34.
[84] Friedenreich CM, Neilson HK, Woolcott CG, Wang Q, Stanczyk FZ, McTiernan A, et al.
Inflammatory marker changes in a yearlong randomized exercise intervention trial among postmenopausal
women. Cancer Prev Res (Phila). 2012;5:98-108.
[85] Campbell PT, Campbell KL, Wener MH, Wood BL, Potter JD, McTiernan A, et al. A yearlong
exercise intervention decreases CRP among obese postmenopausal women. Med Sci Sports Exerc.
2009;41:1533-9.
[86] Fairey AS, Courneya KS, Field CJ, Bell GJ, Jones LW, Martin BS, et al. Effect of exercise training
on C-reactive protein in postmenopausal breast cancer survivors: a randomized controlled trial. Brain
Behav Immun. 2005;19:381-8.

Physical activity, hormone replacement therapy and breast cancer
risk: A meta-analysis of prospective studies
Short title: Physical activity and breast cancer risk
Cécile Pizot 2, Mathieu Boniol
1,2, Patrick Mullie
2,3, Alice Koechlin
1,2, Magali Boniol
2, Peter
Boyle 1,2
and Philippe Autier 1,2
Figure captions
Figure 1. Flow chart of the literature search strategy to identify cohort studies on breast
cancer risk and physical activity.
Figure 2. Forest plot of meta-analysis of breast cancer risk according to physical activity
level in women. Individual studies are represented with their RR and 95% CI (highest versus
lowest category of physical activity). The square size is proportional to the variance of the RR
and the horizontal lines represent the corresponding 95% CI. Heterogeneity between studies
was assessed through Q and I² statistics. Publication bias was evaluated using Begg, Egger
and Macaskill tests.
Figure 3. Results from stratified analyses.
Figure 4. Dose-response relationship between breast cancer risk and physical activity in
studies that measured physical activity in MET-h per week (A) or in hours per week (B).
A. MET-h/week B. Hour/week
Figure Legends

38 studies included in meta-
analysis
Elig
ibil
ity
In
clu
de
d
928 articles identified through
database searching
83 full-text articles assessed
for eligibility
60 articles meeting inclusion
criteria
22 articles excluded for
duplication
23 articles excluded
(not meeting the
inclusion criteria)
Ide
nti
fica
tio
n
Scr
ee
nin
g
845 articles excluded
on titles
Figure 1

0.3 0.6 0.8 1.0 1.3 1.7 2.5
Relative risks
Boeke, 2014Brinton, 2014Catsburg, 2014Rosenberg, 2014Hastert, 2013Hildebrand, 2013Steindorf, 2013Suzuki, 2011Pronk, 2011Phipps, 2011Eliassen, 2010Howard, 2009Suzuki, 2008Leitzmann, 2008Dallal, 2007Tehard, 2006Silvera, 2006Mertens, 2006Chang, 2006Bardia, 2006Schnohr, 2005Margolis, 2005Rintala, 2003Rintala, 2002Moradi, 2002Lee, 2001Dirx, 2001Breslow, 2001Wyshak, 2000Wyrwich, 2000Luoto, 2000Moradi, 1999Sesso, 1998Cerhan, 1998Thune, 1997Fraser, 1997Dorgan, 1994Paffenbarger, 1987
Summary RR 0.88 [0.85 ; 0.90]
I²: 29% [0 ; 53]
Q = 52.19; p = 0.05
Begg test: 0.05 ; p = 0.96
Egger test: −3.50 ; p < 0.01
Macaskill test: 1.30 ; p = 0.20
Figure 2

0.5 0.8 1.0 1.3 1.6
Relative risks
HRT never usersHRT ever usersWomen with ER−/PR− statusWomen with ER+/PR+ status
Mixed menopausal statusPostmenopausal womenPremenopausal women
Women with high BMIWomen with low BMIRR not adjusted for BMIRR adjusted for BMIRR not adjusted for BMIRR adjusted for BMI
Occupational PANon−occupational PAOccupational PANon−occupational PA
PA measured in other unitsPA measured in hours/weekPA measured in MET−h/week
Studies after 1989Studies before 1989
Studies in AsiaStudies in EuropeStudies not in USAStudies in USA
No. Studies
2216123
1424
121223
301166
233015152121
183226
121166
RR 95% CI
0.87 [0.84 ; 0.91]0.88 [0.85 ; 0.92]0.89 [0.84 ; 0.93]0.90 [0.68 ; 1.20]
0.80 [0.72 ; 0.90]0.89 [0.86 ; 0.92]
0.87 [0.83 ; 0.91]0.81 [0.76 ; 0.87]0.89 [0.85 ; 0.92]
0.87 [0.84 ; 0.90]0.88 [0.82 ; 0.95]0.87 [0.80 ; 0.95]0.93 [0.84 ; 1.04]
0.88 [0.85 ; 0.92]0.87 [0.83 ; 0.90]0.88 [0.84 ; 0.93]0.87 [0.83 ; 0.92]0.84 [0.78 ; 0.90]0.87 [0.81 ; 0.93]
0.87 [0.78 ; 0.96]0.88 [0.85 ; 0.91]0.87 [0.83 ; 0.90]
0.89 [0.83 ; 0.95]0.80 [0.69 ; 0.92]0.97 [0.88 ; 1.07]0.78 [0.70 ; 0.87]
I²
30%30%37%14%
57%0%
0%0%
45%
23%29%40%4%
17%35%23%25%39%0%
51%19%36%
0%7%0%0%
Location
Period of study
Quantification of PA
Type of PA
BMI
Menopausal status
Hormonal status
Figure 3
1 Mid-year of each cohort was taken into account
2 Including only studies which reported RRs for occupational PA and non-occupational PA seperately
3 Including only studies which reported both RRs: adjusted for BMI and non-adjusted for BMI
1
2
2
3
3

0 1 2 3 4
0.7
0.8
0.9
1.0
1.1
Physical activity
Bre
ast ca
ncer
risk
l
l
l
l
l
l
l l
l
ll
l
Tehard, 2006
Leitzmann, 2008
Maruti, 2008
Howard, 2009
Eliassen, 2010
Phipps, 2011
Suzuki, 2011
Pronk, 2011
Steindorf, 2013
Hildebrand, 2013
Catsburg, 2014
Figure 4A
p-value < 0.0001

0 1 2 3 4 5
0.7
0.8
0.9
1.0
1.1
Physical activity
Bre
ast ca
ncer
risk
l
l
l
l
l
l
l
l l
l
l
l
l
Dirx, 2001
Chang, 2006
Silvera, 2006
Tehard, 2006
Dallal, 2007
Marutti, 2008
Suzuki, 2008
Peters, 2009
Howard, 2009
Rosenberg, 2014
Catsburg, 2014
Figure 4B
p-value < 0.0001

Physical activity, hormone replacement therapy and breast cancer
risk: A meta-analysis of prospective studies
Short title: Physical activity and breast cancer risk
Cécile Pizot 2, Mathieu Boniol
1,2, Patrick Mullie
2,3, Alice Koechlin
1,2, Magali Boniol
2, Peter
Boyle 1,2
and Philippe Autier 1,2
1. University of Strathclyde Institute of Global Public Health at iPRI, Allée Claude
Debussy, Ecully (Lyon), France
2. International Prevention Research Institute, 95 cours Lafayette, 69006 Lyon, France
3. Faculty of Physical Education and Physiotherapy, Pleinstraat 2, 1050 Brussels,
Belgium
Correspondence: Philippe Autier, University of Strathclyde Institute of Global Public Health
at iPRI, Espace Européen, Building G, Allée Claude Debussy, 69130 Lyon Ouest Ecully,
France; Email: [email protected]; Tel: +33 (0)4 72 17 11 99; Fax: +33(0)4 72 17 11
90.
Conflict of interest statement
None of the authors have any potential conflict of interest to declare in relation to the subject
matter of this manuscript.
*Conflict of Interest statement

1
Online data supplements: Supplementary materials to the article:
Physical activity, hormone replacement therapy and breast cancer risk: A meta-analysis of prospective
studies
Cécile Pizot 2, Mathieu Boniol 1,2, Patrick Mullie 2,3, Alice Koechlin 1,2, Magali Boniol 2, Peter Boyle 1,2 and
Philippe Autier 1,2
1. University of Strathclyde Institute of Global Public Health at iPRI, Allée Claude Debussy, Ecully (Lyon),
France 2. International Prevention Research Institute, 95 cours Lafayette, 69006 Lyon, France 3. Faculty of Physical Education and Physiotherapy, Pleinstraat 2, 1050 Brussels, Belgium
Correspondence: Philippe Autier, University of Strathclyde Institute of Global Public Health at iPRI, Espace
Européen, Building G, Allée Claude Debussy, 69130 Lyon Ouest Ecully, France; Email: philippe.autier@i-
pri.org; Tel: +33 (0)4 72 17 11 99; Fax: +33(0)4 72 17 11 90.
Supplementary Text or Table (online publication only)

2
Table S1 - Details on computation and data extraction
First author, year Statistical computation and choice of data
Paffenbarger, 1987
[1]
RR was taken from table 3 for the main analysis. As there was no 95%CI, it was computed from cases
and PY. This study was not used in the dose-response analysis in hours/week as RRs were reported
for dichotomous exposure (<5h/wk vs. ≥5h/wk). Dorgan, 1994 [2] RR for the main analysis was taken from the full model of table 3.
Steenland, 1995 [3]
This study used the same cohort as Breslow 2001 [4], hence, it was not used for the main analysis but
for the sub analysis on occupational activity as Breslow did not report this result. RR corresponding to
occupational activity was taken from table 5. This RR was inverted since the reference category was a
lot of physical activity instead of little physical activity.
Fraser, 1997 [5] RR for the main analysis was taken from table 2. As the reported RR was for low vs. High physical
activity, the RR was inverted to have a high vs. low result.
Thune, 1997 [6]
Only RRs based on the survey of 1977-1983 were taken in our analysis. For the main analysis, RRs
from table 2 were used: RR corresponding to leisure time was combined with RR corresponding to
work using a fixed-effect meta-analysis in order to get a global measure of physical activity. For the
stratified analysis on menopausal status, RRs from table 3 were used and a combination of leisure
time and work was performed. For the stratified analysis on BMI, RRs corresponding to leisure
activity was taken from table 4 (BMI<22.8 and BMI>25.7).
Cerhan, 1998 [7]
RR for the main analysis was taken from the full model of table 4. As the reference category was not
the first one, we merged the first two categories and re-computed the RR for each category (from
cases and PY).
Sesso, 1998 [8] RR for the main analysis was taken from table 2. For the stratified analysis on menopausal status
(<55y and ≥55y) and BMI (<22 and ≥22), RRs were taken from table 3 and 4 respectively.
Moradi, 1999 [9]
For the main analysis, the most adjusted RR corresponding to the census of 1970 was taken from table
2. As the 95%CI was not really precise (only 2 digits were used), a new variance and 95%CI were
computed from cases and PY reported in table 1 for the census of 1970. Then, the result was inverted
as the reference category was high physical activity instead of low physical activity.
Luoto, 2000 [10]
The most adjusted RRs from table 2 were used for the main analysis: RRs corresponding to physical
activity at leisure and to physical activity when commuting to work were combined using a fixed-
effect meta-analysis in order to get a global non-occupational physical activity exposure. For the sub
analyses on BMI (BMI<21 and BMI>26) and menopausal status (<50y and ≥50y), RRs from table 3
were used and as for the main analysis, RRs for leisure time and commuting to work were combined.
Wyrwich, 2000
[11]
For the main analysis, RR was taken from table 1. As the reference category was not the first one
reported, we merged the first two categories and recomputed RR for the other categories. As the
women were aged between 70-98y at baseline, they were considered as post-menopausal women.
Wyshak, 2000 [12] For the main analysis, the most adjusted RR was taken from table 3.
Moore, 2000 [13]
This study used the same cohort as Bardia 2006 [14], hence, it was not used for the main analysis but
for the sub analyses on BMI and HRT as Bardia did not report these results. RRs for the stratified
analysis on BMI and on HRT use were taken from table 3. For the BMI, RRs corresponding to
quartile 1 and 4 were taken into account. For HRT use, RRs corresponding to past and current users
were combined using a fixed-effect meta-analysis in order to get an ever users group. As only post-
menopausal women were included in the study, estrogen use was considered as HRT use.
Breslow et al. 2001
[4]
RRs for the main analysis and for the stratified analyses on menopausal status were taken from table
1. Menopausal status was defined with an age cutoff of 50y. Stratified analysis on BMI was
performed on data from table 2 (including post-menopausal women only).
Dirx, 2001 [15]
RR for the main analysis was computed from total recreational activity (table 3) and energy
expenditure from longest held job (occupational activity from table 4) using a fixed-effect meta-
analysis in order to get a global measure of physical activity. For the sub analysis on h/week, only
recreational activity result was used as occupational activity was expressed in kJ/min. For the sub
analysis on BMI, data from table 6 and recreational activity were used (BMI<25 vs. BMI>30).
Lee, 2001 [16] The most adjusted RRs from table 2 was taken for the main analysis, the post-menopausal analysis
and ER+/PR+ analysis.

3
First author, year Statistical computation and choice of data
Moradi, 2002 [17]
RRs reported in table 2 were taken for the main analysis: leisure time RR and occupation RR were
combined using a fixed-effect meta-analysis in order to get a global measure of physical activity. For
the stratified analysis on menopausal status, women born in 1901-1917 were considered post-
menopausal and women born in 1918-1925 were considered pre-menopausal. RRs for the latter
analysis were taken from table 2, leisure time RR and occupation RR were also combined. For the
stratified analysis on BMI, RRs corresponding to leisure activity were taken from table 3: RRs for
BMI at baseline (42-70y) in quartile I (BMI<22) and quartile IV (BMI>26.4) were used.
Rintale, 2002 [18]
For the main analysis, the most adjusted RRs were taken from table 2: as the results were stratified by
age group, a fixed-effect meta-analysis was used to combine the three RRs (25-39y, 40-54y and
≥55y). For the pre-menopausal analysis, RRs from the age groups 25-39y and 40-54y were combined.
For the post-menopausal analysis, the RR of the age group ≥55y was considered.
Mc Tiernan, 2003
[19]
This study used the same cohort as Phipps 2011 [20], hence, it was not used for the main analysis but
for the sub analyses on BMI as Phipps did not report this result. RRs corresponding to BMI≤24.13 and BMI>28.44 were taken from table 3.
Patel, 2003 [21]
This study used the same cohort as Hildebrand 2013 [22], hence, it was not used for the main analysis
but for the sub analyses on BMI and HRT as Hildebrand did not report these results. RRs were taken
from table 5. As the reference category was not the first one reported, we merged the first two
categories and recomputed RR for the other categories (from cases and PY). For the BMI analysis,
RRs for BMI<25 and BMI≥30 were used. For the HRT analysis, RRs for current and former users were combined in order to create an ever users group comparable to the never users group.
Rintala, 2003 [23] RR for the main analysis was taken from the abstract. For the stratified analysis on menopausal status,
RRs from table 2 were used (pre-menopause :<50y and post-menopause: ≥50y).
Margolis, 2005
[24]
For the main analysis, the most adjusted RR corresponding to physical activity at enrollment was
extracted from table 2. For the stratified analysis on menopausal status, RR were extracted from the
text.
Schnohr, 2005 [25] The most adjusted RR from table 2 was used for the main analysis.
Bardia, 2006 [14] The most adjusted RR from table 2 was used for the main analysis and for the stratified analysis on
hormone receptor status (ER+/PR+ and ER-/PR-).
Chang, 2006 [26] The most adjusted RR from table 2 was used for the main analysis.
Mertens, 2006 [27]
The most adjusted RRs from table 3 were taken for the main analysis: RRs corresponding to leisure,
work and sport were combined using a fixed-effect meta-analysis in order to get a global physical
activity exposure. For the post-menopausal analysis, RRs were taken from table 4 and a combination
of leisure, work and sport activity was also performed. For the occupational physical activity analysis,
RR corresponding to work activity was taken from table 3. Concerning non-occupational physical
activity, RRs for leisure and sport were taken from table 3 and were combined.
Silvera, 2006 [28]
For the main analysis, the most adjusted RR corresponding to vigorous physical activity (in min/day)
was taken from table 2. RRs for pre-menopausal and post-menopausal women were taken from table
3. For the stratified analysis on BMI, RRs were computed from cases and PY (reported in table 5) for
women with a BMI<25 and women with a BMI≥25.
Tehard, 2006 [29]
For the main analysis, the most adjusted RR corresponding to total physical activity was taken from
table 3. For the stratified analysis on BMI, RR corresponding to BMI≥25 was taken from table 4. As RR for BMI<25 was not reported, it was computed form cases and PY. For the sub analysis on HRT
use, RR for HRT users was taken from table 4. As RR for HRT non-users was not reported, it was
computed from cases and PY. For the sub analysis on h/wk, RR corresponding to vigorous
recreational activity was taken from table 3: the two first categories of PA were combined and RRs
were recomputed using cases and PY as the two first categories of PA correspond to inactivity.
Dallal, 2007 [30]
In our main analysis, we took the most adjusted RR from table 2 corresponding to strenuous physical
activity. For the stratified analysis on menopausal status (defined with a cutoff of 55y) and BMI (<25
vs. ≥25), we used data from table 4 based on lifetime strenuous physical activity. In the stratified
analysis on ER/PR status, we used data from table 5 based on strenuous activity only (ER+/PR+ and
ER-/PR-). For the stratified analysis with studies reporting physical activity in h/week, we only used
the RR corresponding to strenuous lifetime activity from table 2.
Leitzmann, 2008
[31]
The most adjusted RR from table 2 was taken for the main analysis. For the sub analysis on BMI, RR
corresponding to total physical activity was extracted from table 4 (BMI<25 and BMI≥25). For the sub analysis on hormone receptor status, RRs corresponding to ER+/PR+ and ER-/PR- were used. The
latter RRs were based on vigorous physical activity and not total physical activity.

4
First author, year Statistical computation and choice of data
Maruti, 2008 [32]
This study used the same cohort as Boeke 2014 [33], hence, it was not used for the main analysis but
for the sub-analyses on hours/week, BMI, and hormone receptor status. For the hours/week analysis,
RR corresponding to strenuous activity was extracted from table 2. For the sub analysis on BMI, RR
was extracted from table 5 (BMI<25 and BMI≥25). For the sub analysis on hormone receptor status,
results corresponding to ER+/PR+ and ER-/PR- were taken from the text. This study was also used for
the dose-response analysis in MET-h/week instead of Boeke 2014 [33].
Suzuki, 2008 [34]
For the main analysis, the most adjusted RRs were taken from table 2: RR corresponding to time spent
walking and RR corresponding to time spent exercising were combined using a fixed-effect meta-
analysis in order to get a global physical activity exposure. The same RR was used for the sub analysis
on hours/week. For the stratified analyses on menopausal status and BMI (<24 and ≥24), RRs were taken from table 5 (most active women compared to the rest of the women).
Howard, 2009 [35]
The most adjusted RR corresponding to total MET-score (from table 2) was taken for the main
analysis. For the post-menopausal analysis, as the results were stratified on HRT use, RR for HRT
ever users and RR for HRT never users were combined with a fixed-effect meta-analysis. For the sub
analysis on hours/week, the most adjusted RR but without adjustment for other physical activities (to
avoid colinearity) was taken from table 2.
Peters, 2009 [36]
This study used the same cohort as Brinton 2014 [37], hence, it was not used for the main analysis but
for the sub-analyses on BMI, HRT and hormone receptor status. For the stratified analysis on
hormone receptor status, RRs were taken from table 3 (ER+/PR+ vs. ER-/PR-). For the stratified
analysis on HRT use (ever use vs. never use) and BMI (<25 vs ≥25), RRs were taken from table 4.
Peters, 2009 [38]
This study used the same cohort as Brinton 2014 [37], hence, it was not used for the main analysis but
for the sub-analyses on the h/week and non-occupational activity. RR corresponding to the past 10y
and to invasive breast cancers was taken from table 7.
George, 2010 [39]
This study used the same cohort as Brinton 2014 [37], hence, it was not used for the main analysis but
for the sub-analysis on occupational activity. RR corresponding to occupational and household
activity was taken from table 3.
Eliassen, 2010 [40] For the main analysis, RR for baseline total physical activity was taken from table 2. For the stratified
analysis on hormone receptor status, RRs for ER+/PR+ and ER-/PR- tumors were taken from the text.
Pronk, 2011 [41]
RRs for the main analysis came from table 2 (non-occupational activity) and 3 (occupational activity):
the most adjusted RRs corresponding to all non-occupational activity and to cumulative energy
expenditure were combined using a fixed-effect meta-analysis in order to get a global physical activity
exposure. For the stratified analysis on menopausal status, RR for post-menopausal women was
extracted from figure 1 whereas RR for pre-menopausal women was taken from the text (>8MET-
h/wk vs. <8MET-h/wk). For the MET-h/week analysis, only non-occupational physical activity was
taken into account as occupational activity was not reported in this unit. For the stratified analysis on
BMI, RRs were taken from the text (BMI<23.73 vs. BMI≥23.73).
Phipps, 2011 [20]
This study was taken instead of McTiernan 2003 [19] for the main analysis as it was more recent. RRs
from table 4 corresponding to total recreational physical activity were used. As the results were
reported separately for ER+ and triple-negative breast cancers, we combined the both using a fixed-
effect meta-analysis in order to get a global result. For the sub analysis on hormone receptor status, we
used ER+ as a proxy of ER+/PR+ and triple-negative as a proxy of ER-/PR-. McTiernan 2003 [19]
was only used for the sub analysis on BMI.
Suzuki, 2011 [42]
For the main analysis, the stratified analysis on menopausal status and the stratified analysis on
hormone receptor status (ER+/PR+ and ER-/PR-), the most adjusted RRs corresponding to daily total
physical activity were taken from table 3. For the sub analysis on non-occupational activity, the most
adjusted RR corresponding to leisure-time activity was taken from table 2. For the stratified analysis
on BMI, RRs corresponding to leisure-time activity were taken from table 4 (BMI<25 and BMI≥25).
Steindorf, 2013
[43]
For the main analysis, RR corresponding to total physical activity was taken from table 3. For the
stratified analysis on menopausal status, RRs from table 3 were used (pre-menopause:≤50y and post-menopause: >50y). For the sub analysis on occupational activity, RR was taken from table 3. For the
sub analysis on non-occupational activity and MET-h/week, RRs corresponding to combined
recreational and household activities was taken from table 3. For the stratified analysis on hormone
receptor status, RRs corresponding to total physical activity and to ER+/PR+ and ER-/PR- were taken
from table 4. For the stratified analysis on BMI, RRs corresponding to total physical activity were
taken from supplementary table S1 (normal: BMI<25) and S3 (obese: BMI>30).

5
First author, year Statistical computation and choice of data
Hildebrand, 2013
[22]
This study was taken instead of Patel 2003 [21] for the main analysis as it was more recent. The most
adjusted RR from table 2 corresponding to total recreational physical activity was taken for the main
analysis. As the reference category was not the first one reported, we merged the first two categories
and recomputed RR for the other categories. The study of Patel was kept for the sub analyses on BMI
and HRT.
Hastert, 2013 [44] For the main analysis, the most adjusted RR was taken from table 3. As this RR was adjusted for the
body fatness recommendation, it was considered as adjusted for BMI.
Rosenberg, 2014
[45]
For the main analysis and for the stratified analysis on ER+/PR+ (ER+ was used as a proxy of
ER+/PR+), RRs were taken from table 2. For the ER-/PR- sub-analysis, we considered triple negative
breast cancer as a proxy of ER-/PR- and took the RR reported in the text. For the sub-analyses on
BMI (<30 vs. ≥30) and menopausal status, RRs were taken from table 4. In the methods, it was said that all RRs were adjusted for BMI but in the footnotes of tables 2 and 4, RRs were not adjusted for
BMI hence we considered that the RRs were not adjusted for BMI. For the sub-analysis on MET-
h/wk, RR corresponding to vigorous exercise and brisk walking was taken from the text. Nevertheless,
this study was not used in the dose-response analysis in MET-h/wk as only a high vs. low result was
reported in this unit.
Borch, 2014 [46]
This study was based on a Norwegian cohort that was included in the study of Margolis 2005, hence,
it was not used for the main analysis but for the stratified analysis on hormone receptor status
(ER+/PR+ vs. ER-/PR-). RRs corresponding to PA at enrollment were taken from table 4. As the RRs
were reported considering the intermediate category of PA as reference, we recomputed the RR using
a basic cross product and assuming the first category of PA as reference. The variance and 95%CI
were computed from cases and PY.
Catsburg, 2014
[47]
For the main analysis and for the stratified analysis on menopausal status, RRs corresponding to total
hours per week were taken from table 3. For the sub-analyses on BMI (<25 vs. ≥25) and HRT use (never vs. ever), RRs corresponding to total hours per week were taken from supplementary tables 2
and 3 respectively. For the main analysis and all sub-analyses (except MET-h/wk analysis), we took
into account the RRs corresponding to total hours per week as the total MET hours were computed
from the hours/wk and CIs were smaller with hours/wk.
Brinton, 2014 [37] For the main analysis, RR corresponding to physical activity in the past year was taken from table 2.
Boeke, 2014 [33]
For the main analysis, RR corresponding to lifetime physical activity was taken from the text. For the
stratified analyses on menopausal status, RRs were taken from table 2. As the RRs were reported
separately for each adolescent period, we combined all periods with a fixed-effect meta-analysis using
the less adjusted RR (the most adjusted RR was adjusted for adult physical activity hence this result is
prone to colinearity). This study was not used for the dose-response analysis in MET-h/wk as only a
high vs. low result corresponding to lifetime physical activity was reported in the text. We preferably
used Maruti 2008 [32]data for this dose-response analysis.

6
Table S2 - Duplicate studies that were excluded from main analysis
Study Reason for exclusion
Frisch, 1987 [48] Same cohort as Wyshak, 2000 [12].
Albanes, 1989 [49] Same cohort as Breslow 2001 [4].
Vihko, 1992 [50] Same cohort as Rintala, 2003 [23].
Pukkala, 1993 [51] Same cohort as Rintala, 2003 [23].
Steenland, 1995 [3] Same cohort as Breslow, 2001 [4]; Steenland, 1995 [3] was only used for the sub-analysis on
occupational activity.
Byrne, 1996 [52] Same cohort as Breslow, 2001 [4].
Rockhill, 1998 [53] Same cohort as Boeke, 2014 [33].
Rockhill, 1999 [54] Same cohort as Eliassen, 2010 [40].
Moore, 2000 [13] Same cohort as Bardia, 2006 [14]; Moore, 2000 [13] was only used for the stratified analyses on
BMI and HRT use.
McTiernan, 2003 [19] Same cohort as Phipps, 2011 [20]; Mc Tiernan 2003 [19] was only used for the stratified analysis
on BMI.
Colditz, 2003 [55] Same cohort as Boeke, 2014 [33].
Patel, 2003 [21] Same cohort as Hildebrand 2013 [22]; Patel 2003[21] was only used for the stratified analyses on
BMI and HRT use.
Lahmann, 2007 [56] Same cohort as Steindorf 2013 [43].
Ji, 2008 [57] Same cohort as Pronk 2011 [41].
Inoue, 2008 [58] Same cohort as Suzuki 2011 [42].
Maruti, 2008 [32] Same cohort as Boeke 2014 [33]; Maruti 2008 [32] was only used for the stratified analyses on
hours/week, BMI, and hormone receptor status.
Peters, 2009 [38] Same cohort as Brinton 2014 [37]; Peters 2009 [38] was only used for the stratified analyses on
hours/week and non-occupational physical activity.
Peters, 2009 [36] Same cohort as Brinton 2014 [37]; Peters 2009 [36] was only used for the stratified analyses on
BMI, hormone receptor status and HRT use.
George, 2010 [39] Same cohort as Brinton 2014 [37]; Peters 2009 [38] was only used for the stratified analysis on
occupational physical activity.
Fournier, 2014 [59] Same cohort as Tehard 2006 [29]; they used recent physical activity (previous four years) instead of
baseline physical activity which might imply reverse causation.
McKenzie, 2014 [60] Same cohort as Steindorf 2013 [43] but they used a smaller sample size and smaller follow-up.
Moreover, they focused on healthy lifestyle index and not precisely on physical activity.
Borch, 2014 [46] This study was based on a Norwegian cohort that was included in the study of Margolis 2005 [24],
hence, it was only used for the stratified analysis on hormone receptor status.

7
Table S3 - Breast cancer types included in prospective studies
First author, year Type of cancer considered in results Invasive
only a
Paffenbarger, 1987 [1] No information about the type of breast cancer (invasive or in-situ or both). N
Dorgan, 1994 [2] No information about the type of breast cancer (invasive or in-situ or both). N
Steenland, 1995 [3] No information about the type of breast cancer (invasive or in-situ or both). N
Fraser, 1997 [5] RRs reported for invasive breast cancer only. Y
Thune, 1997 [6] RRs reported for invasive breast cancer only. Y
Cerhan, 1998 [7] RR reported for all, localized, and regional/disseminated breast cancers. We only used the result for all cancers. Y
Sesso, 1998 [8] No information about the type of breast cancer (invasive or in-situ or both). N
Moradi, 1999 [9] RRs reported for invasive breast cancer only. Y
Luoto, 2000 [10] No information about the type of breast cancer (invasive or in-situ or both). N
Wyrwich, 2000 [11] RR reported for all, localized, and regional/distant breast cancers. We only used the result for all cancers. Y
Wyshak, 2000 [12] No information about the type of breast cancer (invasive or in-situ or both). N
Moore, 2000 [13] No information about the type of breast cancer (invasive or in-situ or both) but Bardia 2006 [14] used the same cohort and
included both invasive and in-situ breast cancers. N
Breslow, 2001 [4] No information about the type of breast cancer (invasive or in-situ or both). N
Dirx, 2001 [15] Results on invasive breast cancers only as the in-situ breast cancers were excluded from the study. Y
Lee, 2001 [16] 322 invasive and 79 in-situ breast cancers were included in this study. Results were reported for all cancers only. N
Moradi, 2002 [17] No information about the type of breast cancer (invasive or in-situ or both). N
Rintala, 2002 [18] No information about the type of breast cancer (invasive or in-situ or both). N
McTiernan, 2003 [19] This study included 85% of invasive breast cancers and 15% of in-situ breast cancers. Reported RRs were for all cancers
combined. N
Patel, 2003 [21] This study included in-situ, localized and regional/distant breast cancers but for the sub analyses on BMI and HRT only RRs
for all cancers were reported. Y
Rintala, 2003 [23] No information about the type of breast cancer (invasive or in-situ or both). N
Margolis, 2005 [24] RRs reported for invasive breast cancers only. Y
Schnohr, 2005 [25] No information about the type of breast cancer (invasive or in-situ or both). N

8
First author, year Type of cancer considered in results Invasive
only a
Bardia, 2006 [14] Results reported for both invasive and in-situ breast cancers combined. N
Chang, 2006 [26] Results reported on all cases but there were 13% of in-situ breast cancers and 27% of non-confirmed breast cancers. Authors
said that the results with the exclusion of in-situ and non-confirmed cases did not differ from the results for all cases. N
Mertens, 2006 [27] No information about the type of breast cancer (invasive or in-situ or both). N
Silvera, 2006 [28] No information about the type of breast cancer (invasive or in-situ or both). N
Tehard, 2006 [29] RRs reported for invasive breast cancers only as in-situ breast cancers were excluded. Y
Dallal, 2007 [30] 2,649 invasive breast cancers and 593 in-situ breast cancers included in the study but results were reported separately for
invasive and in-situ breast cancers. We only took invasive breast cancer results in our analyses. Y
Leitzmann, 2008 [31] This study included 17% of in-situ breast cancers and reported RRs for all cancers as the results remained the same when in-
situ breast cancers were excluded. N
Maruti, 2008 [32] RRs reported for invasive breast cancers only as in-situ and unconfirmed breast cancers were excluded. Y
Suzuki, 2008 [34] No information about the type of breast cancer (invasive or in-situ or both). N
Howard, 2009 [35] RRs reported for invasive breast cancers only as in-situ breast cancers were excluded. Y
Peters, 2009 [36]
5,433 invasive breast cancers and 1176 in-situ breast cancers included in the study but results were reported separately for
both type of cancers. For the stratification on hormone receptor status only RRs for invasive breast cancers were reported.
Nevertheless, for the sub analyses on BMI and HRT use, RRs were reported for all breast cancers.
N
Peters, 2009 [38] 3,522 invasive breast cancers and 736 in-situ breast cancers included in the analysis but results were reported separately for
both type of cancers. We only considered the results for invasive breast cancers in our analyses. Y
George, 2010 [39] 2,866 invasive breast cancers and 570 in-situ breast cancers but results were reported separately for both type of cancers. Y
Eliassen, 2010 [40] RRs reported for invasive breast cancers only. Y
Pronk, 2011 [41] RRs reported for invasive breast cancers only. Y
Phipps, 2011 [20] RRs reported for invasive breast cancers only as in-situ breast cancers were censored. Y
Suzuki, 2011 [42] No information about the type of breast cancer (invasive or in-situ or both). N
Steindorf, 2013 [43] RRs reported for invasive breast cancers only. Y
Hildebrand, 2013 [22] No information about the type of breast cancer (invasive or in-situ or both) but Patel 2003 [21]used the same cohort and
included invasive breast cancers defined as localized and regional/distant breast cancers. N
Hastert, 2013 [44] RRs reported for invasive breast cancers only as in-situ breast cancers were censored. Y
Rosenberg, 2014 [45] RRs reported for invasive breast cancers only as in-situ breast cancers were censored. Y

9
First author, year Type of cancer considered in results Invasive
only a
Borch, 2014 [46] RRs reported for invasive breast cancers only. Y
Catsburg, 2014 [47] RRs reported for invasive breast cancers only. Y
Brinton, 2014 [37] RRs reported for invasive breast cancers only as in-situ breast cancers were censored. Y
Boeke, 2014 [33] RRs were reported for both types of breast cancer as results were similar for invasive and in situ cases. N
a Y/N: Yes/No

10
Table S4 - Assessment of physical activity in prospective studies (duplicate studies from which some data were used are in light grey)
Study Type of PA Units used Categories Period in life for PA assessment
Occupational/non-
occupational/both
Total/Vigorous
MET-h/
week a
Hours/
week b
KJ/d
(energy
per unit of
time)
Other 3+
categories 2 categories Baseline c During lifetime
During
follow-up
(FU)
Paffenbarger, 1987 [1] Non-occupational y y Early college
Dorgan, 1994 [2] Both PA combined y y y
Steenland, 1995 [3] Occupational y y y
Fraser, 1997 [5] Both PA combined y y y
Thune, 1997 [6] Non-occupational y y y
Thune, 1997 [6] Occupational y y y
Cerhan, 1998 [7] Non-occupational y y y
Sesso, 1998 [8] Non-occupational y y y
Moradi, 1999 [9] Occupational y y
Adult life (1960
and 1970
censuses)
Luoto, 2000 [10] Non-occupational y y y
Wyrwich, 2000 [11] Non-occupational y y y
Wyshak, 2000 [12] Non-occupational y y College
Moore, 2000 [13] Non-occupational y y y
Breslow, 2001 [4] Non-occupational y y
Long term
(baseline + 10y
before)
Dirx, 2001 [15] Non-occupational - total
PA y y y
Dirx, 2001 [15] Occupational y y y
Lee, 2001 [16] Non-occupational y y y
Moradi, 2002 [17] Non-occupational y y Adult (25-50
years)

11
Study Type of PA Units used Categories Period in life for PA assessment
Occupational/non-
occupational/both
Total/Vigorous
MET-h/
week a
Hours/
week b
KJ/d
(energy
per unit of
time)
Other 3+
categories 2 categories Baseline c During lifetime
During
follow-up
(FU)
Moradi, 2002 [17] Occupational y y
Rintala, 2002 [18] Occupational y y Baseline, at age
20 and at age 35
McTiernan, 2003 [19] Non-occupational y y y
Patel, 2003 [21] Non-occupational y y y
Rintala, 2003 [23] Occupational y y y
Margolis, 2005 [24] Non-occupational y y y
Schnohr, 2005 [25] Non-occupational y y y
Bardia, 2006 [14] Non-occupational y y y
Chang, 2006 [26] Non-occupational -
vigorous PA y y y
Mertens, 2006 [27] Non-occupational y y y
Mertens, 2006 [27] Occupational y y y
Silvera, 2006 [28] Non-occupational -
vigorous PA y y y
Tehard, 2006 [29] Non-occupational - total
PA y y y
Tehard, 2006 [29] Non-occupational -
vigorous PA y y y
Dallal, 2007 [30] Non-occupational -
strenuous PA y y
Between high
school and curent
age
Leitzmann, 2008 [31] Both PA combined -
total PA y y y
Maruti, 2008 [32] Non-occupational - total
PA y y
Adolescence and
adult (from age 12
to current age)

12
Study Type of PA Units used Categories Period in life for PA assessment
Occupational/non-
occupational/both
Total/Vigorous
MET-h/
week a
Hours/
week b
KJ/d
(energy
per unit of
time)
Other 3+
categories 2 categories Baseline c During lifetime
During
follow-up
(FU)
Maruti, 2008 [32] Non-occupational -
strenuous PA y y
Adolescence and
adult (from age 12
to current age)
Suzuki, 2008 [34] Both PA combined y y y
Howard, 2009 [35] Both PA combined -
total PA y y y
Howard, 2009 [35] Both PA combined -
strenuous PA y y y
Peters, 2009 [36] Both PA combined y y y
Peters, 2009 [38] Non-occupational -
moderate/vigorous PA y y Past 10y
George, 2010 [39] Occupational y y y
Eliassen, 2010 [40] Non-occupational y y
Baseline (past
year) + updtate
every 2 or 4
years
Pronk, 2011 [41] Non-occupational - total
PA y y
Baseline + 5 years
before interview
Pronk, 2011 [41] Occupational y y y
Phipps, 2011 [20] Non-occupational - total
PA y y y
Suzuki, 2011 [42] Non-occupational y y
Baseline +
update 5 years
after
Suzuki, 2011 [42] Both PA combined -
total PA y y
Steindorf, 2013 [43] Non-occupational y y y
Steindorf, 2013 [43] Occupational y y y
Steindorf, 2013 [43] Both - total PA y y

13
Study Type of PA Units used Categories Period in life for PA assessment
Occupational/non-
occupational/both
Total/Vigorous
MET-h/
week a
Hours/
week b
KJ/d
(energy
per unit of
time)
Other 3+
categories 2 categories Baseline c During lifetime
During
follow-up
(FU)
Hildebrand, 2013 [22] Non-occupational - total
PA y y
Baseline +
updated 3
times during
FU
Hastert, 2013 [44] Non-occupational y y Past 10y
Rosenberg, 2014 [45] Non-occupational -
vigorous PA y y y
Borch, 2014 [46] Both PA combined y y y
Catsburg, 2014 [47] Non-occupational - total
PA y y y y
Brinton, 2014 [37] Both PA combined y y y
Boeke, 2014 [33] Non-occupational - total
PA y y
Adolescence and
adult (from age 12
to current age)
a 14 articles reported MET-h/week but 11 were not duplicate studies.
b 12 articles reported hours/week but 11 classified in 3 categories or more.
c Usually, physical activity during the year preceding cohort inception.
14
References
1. Paffenbarger RS, Jr., Hyde RT, Wing AL. Physical activity and incidence of cancer in diverse
populations: a preliminary report. Am J Clin Nutr 1987;45(1 Suppl):312-7.
2. Dorgan JF, Brown C, Barrett M, Splansky GL, Kreger BE, D'Agostino RB, et al. Physical activity
and risk of breast cancer in the Framingham Heart Study. Am J Epidemiol 1994;139(7):662-9.
3. Steenland K, Nowlin S, Palu S. Cancer incidence in the National Health and Nutrition Survey I.
Follow-up data: diabetes, cholesterol, pulse and physical activity. Cancer Epidemiol Biomarkers Prev
1995;4(8):807-11.
4. Breslow RA, Ballard-Barbash R, Munoz K, Graubard BI. Long-term recreational physical
activity and breast cancer in the National Health and Nutrition Examination Survey I epidemiologic
follow-up study. Cancer Epidemiol Biomarkers Prev 2001;10(7):805-8.
5. Fraser GE, Shavlik D. Risk Factors, Lifetime Risk, and Age at Onset of Breast Cancer. Ann
Epidemiol 1997;7:375-82.
6. Thune I, Brenn T, Lund E, Gaard M. Physical activity and the risk of breast cancer. N Engl J
Med 1997;336(18):1269-75.
7. Cerhan JR, Chiu BCH, Wallace RB, Lemke JH, Lynch CF, Torner JC, et al. Physical Activity,
Physical Function, and the Risk of Breast Cancer in a Prospective Study Among Elderly Women.
Journal of Gerontology 1998;53A(4):M251-6.
8. Sesso HD, Paffenbarger RS, Jr., Lee IM. Physical activity and breast cancer risk in the College
Alumni Health Study (United States). Cancer Causes Control 1998;9(4):433-9.
9. Moradi T, Adami HO, Bergstrom R, Gridley G, Wolk A, Gerhardsson M, et al. Occupational
physical activity and risk for breast cancer in a nationwide cohort study in Sweden. Cancer Causes
Control 1999;10(5):423-30.
10. Luoto R, Latikka P, Pukkala E, Hakulinen T, Vihko V. The effect of physical activity on breast
cancer risk: a cohort study of 30,548 women. Eur J Epidemiol 2000;16(10):973-80.
11. Wyrwich KW, Wolinsky FD. Physical Activity, Disability, and the Risk of Hospitalization for
Breast Cancer Among Older Women. Journal of Gerontology 2000;55A(7):M418-21.
12. Wyshak G, Frisch RE. Breast cancer among former college athletes compared to non-athletes:
a 15-year follow-up. British Journal of Cancer 2000;82(3):726-30.
13. Moore DB, Folsom AR, Mink PJ, Hong CP, Anderson KE, Kushi LH. Physical activity and
incidence of postmenopausal breast cancer. Epidemiology 2000;11(3):292-6.
14. Bardia A, Hartmann LC, Vachon CM, Vierkant RA, Wang AH, Olson JE, et al. Recreational
physical activity and risk of postmenopausal breast cancer based on hormone receptor status. Arch
Intern Med 2006;166(22):2478-83.
15. Dirx MJ, Voorrips LE, Goldbohm RA, van den Brandt PA. Baseline recreational physical
activity, history of sports participation, and postmenopausal breast carcinoma risk in the Netherlands
Cohort Study. Cancer 2001;92(6):1638-49.

15
16. Lee IM, Rexrode KM, Cook NR, Hennekens CH, Burin JE. Physical activity and breast cancer
risk: the Women's Health Study (United States). Cancer Causes Control 2001;12(2):137-45.
17. Moradi T, Adami HO, Ekbom A, Wedren S, Terry P, Floderus B, et al. Physical activity and risk
for breast cancer a prospective cohort study among Swedish twins. Int J Cancer 2002;100(1):76-81.
18. Rintala P, Pukkala E, Paakkulainen HT, Vihko VJ. Self-experienced physical workload and risk
of breast cancer. Scand J Work Environ Health 2002;28(3):158-62.
19. McTiernan A, Kooperberg C, White E, Wilcox S, Coates R, Adams-Campbell LL, et al.
Recreational physical activity and the risk of breast cancer in postmenopausal women: the Women's
Health Initiative Cohort Study. JAMA 2003;290(10):1331-6.
20. Phipps AI, Chlebowski RT, Prentice R, McTiernan A, Stefanick ML, Wactawski-Wende J, et al.
Body size, physical activity, and risk of triple-negative and estrogen receptor-positive breast cancer.
Cancer Epidemiol Biomarkers Prev 2011;20(3):454-63.
21. Patel AV, Callel EE, Bernstein L, Wu AH, Thun MJ. Recreational physical activity and risk of
postmenopausal breast cancer in a large cohort of US women. Cancer Causes Control
2003;14(6):519-29.
22. Hildebrand JS, Gapstur SM, Campbell PT, Gaudet MM, Patel AV. Recreational physical activity
and leisure-time sitting in relation to postmenopausal breast cancer risk. Cancer Epidemiol
Biomarkers Prev 2013;22(10):1906-12.
23. Rintala P, Pukkala E, Laara E, Vihko V. Physical activity and breast cancer risk among female
physical education and language teachers: a 34-year follow-up. Int J Cancer 2003;107(2):268-70.
24. Margolis KL, Mucci L, Braaten T, Kumle M, Trolle Lagerros Y, Adami HO, et al. Physical activity
in different periods of life and the risk of breast cancer: the Norwegian-Swedish Women's Lifestyle
and Health cohort study. Cancer Epidemiol Biomarkers Prev 2005;14(1):27-32.
25. Schnohr P, Gronbaek M, Petersen L, Hein HO, Sorensen TI. Physical activity in leisure-time
and risk of cancer: 14-year follow-up of 28,000 Danish men and women. Scand J Public Health
2005;33(4):244-9.
26. Chang SC, Ziegler RG, Dunn B, Stolzenberg-Solomon R, Lacey JV, Jr., Huang WY, et al.
Association of energy intake and energy balance with postmenopausal breast cancer in the prostate,
lung, colorectal, and ovarian cancer screening trial. Cancer Epidemiol Biomarkers Prev
2006;15(2):334-41.
27. Mertens AJ, Sweeney C, Shahar E, Rosamond WD, Folsom AR. Physical activity and breast
cancer incidence in middle-aged women: a prospective cohort study. Breast Cancer Res Treat
2006;97(2):209-14.
28. Silvera SA, Jain M, Howe GR, Miller AB, Rohan TE. Energy balance and breast cancer risk: a
prospective cohort study. Breast Cancer Res Treat 2006;97(1):97-106.
29. Tehard B, Friedenreich CM, Oppert JM, Clavel-Chapelon F. Effect of physical activity on
women at increased risk of breast cancer: results from the E3N cohort study. Cancer Epidemiol
Biomarkers Prev 2006;15(1):57-64.

16
30. Dallal CM, Sullivan-Halley J, Ross RK, Wang Y, Deapen D, Horn-Ross PL, et al. Long-term
recreational physical activity and risk of invasive and in situ breast cancer: the California teachers
study. Arch Intern Med 2007;167(4):408-15.
31. Leitzmann MF, Moore SC, Peters TM, Lacey JV, Jr., Schatzkin A, Schairer C, et al. Prospective
study of physical activity and risk of postmenopausal breast cancer. Breast Cancer Res
2008;10(5):R92.
32. Maruti SS, Willett WC, Feskanich D, Rosner B, Colditz GA. A prospective study of age-specific
physical activity and premenopausal breast cancer. J Natl Cancer Inst 2008;100(10):728-37.
33. Boeke CE, Eliassen AH, Oh H, Spiegelman D, Willett WC, Tamimi RM. Adolescent physical
activity in relation to breast cancer risk. Breast Cancer Res Treat 2014;145(3):715-24.
34. Suzuki S, Kojima M, Tokudome S, Mori M, Sakauchi F, Fujino Y, et al. Effect of physical activity
on breast cancer risk: findings of the Japan collaborative cohort study. Cancer Epidemiol Biomarkers
Prev 2008;17(12):3396-401.
35. Howard RA, Leitzmann MF, Linet MS, Freedman DM. Physical activity and breast cancer risk
among pre- and postmenopausal women in the U.S. Radiologic Technologists cohort. Cancer Causes
Control 2009;20(3):323-33.
36. Peters TM, Schatzkin A, Gierach GL, Moore SC, Lacey JV, Jr., Wareham NJ, et al. Physical
activity and postmenopausal breast cancer risk in the NIH-AARP diet and health study. Cancer
Epidemiol Biomarkers Prev 2009;18(1):289-96.
37. Brinton LA, Smith L, Gierach GL, Pfeiffer RM, Nyante SJ, Sherman ME, et al. Breast cancer risk
in older women: results from the NIH-AARP Diet and Health Study. Cancer Causes Control
2014;25(7):843-57.
38. Peters TM, Moore SC, Gierach GL, Wareham NJ, Ekelund U, Hollenbeck AR, et al. Intensity
and timing of physical activity in relation to postmenopausal breast cancer risk: the prospective NIH-
AARP diet and health study. BMC Cancer 2009;9:349.
39. George SM, Irwin ML, Matthews CE, Mayne ST, Gail MH, Moore SC, et al. Beyond recreational
physical activity: examining occupational and household activity, transportation activity, and
sedentary behavior in relation to postmenopausal breast cancer risk. Am J Public Health
2010;100(11):2288-95.
40. Eliassen AH, Hankinson SE, Rosner B, Holmes MD, Willett W. Physical Activity and Risk of
Breast Cancer Among Postmenopausal Women. Arch Intern Med 2010;170(19):1758-64.
41. Pronk A, Ji BT, Shu XO, Chow WH, Xue S, Yang G, et al. Physical activity and breast cancer risk
in Chinese women. Br J Cancer 2011;105(9):1443-50.
42. Suzuki R, Iwasaki M, Yamamoto S, Inoue M, Sasazuki S, Sawada N, et al. Leisure-time physical
activity and breast cancer risk defined by estrogen and progesterone receptor status--the Japan
Public Health Center-based Prospective Study. Prev Med 2011;52(3-4):227-33.
43. Steindorf K, Ritte R, Eomois PP, Lukanova A, Tjonneland A, Johnsen NF, et al. Physical activity
and risk of breast cancer overall and by hormone receptor status: the European prospective
investigation into cancer and nutrition. Int J Cancer 2013;132(7):1667-78.

17
44. Hastert TA, Beresford SA, Patterson RE, Kristal AR, White E. Adherence to WCRF/AICR cancer
prevention recommendations and risk of postmenopausal breast cancer. Cancer Epidemiol
Biomarkers Prev 2013;22(9):1498-508.
45. Rosenberg L, Palmer JR, Bethea TN, Ban Y, Kipping-Ruane K, Adams-Campbell LL. A
prospective study of physical activity and breast cancer incidence in african-american women. Cancer
Epidemiol Biomarkers Prev 2014;23(11):2522-31.
46. Borch KB, Lund E, Braaten T, Weiderpass E. Physical activity and the risk of postmenopausal
breast cancer - the Norwegian Women and Cancer Study. J Negat Results Biomed 2014;13:3.
47. Catsburg C, Kirsh VA, Soskolne CL, Kreiger N, Bruce E, Ho T, et al. Associations between
anthropometric characteristics, physical activity, and breast cancer risk in a Canadian cohort. Breast
Cancer Res Treat 2014;145(2):545-52.
48. Frisch RE, Wyshak G, Albright NL, Albright TE, Schiff I, Witschi J, et al. Lower lifetime
occurrence of breast cancer and cancers of the reproductive system among former college athletes.
Am J Clin Nutr 1987;45:328-35.
49. Albanes D, Blair A, Taylor PR. Physical activity and risk of cancer in the NHANES I population.
Am J Public Health 1989;79(6):744-50.
50. Vihko V, Apter D, Pukkala EI, Oinonen MT, Hakulinen TR, Vihko RK. Risk of breast cancer
among female teachers of physical education and languages. Acta Oncologica 1992;31(2):201-4.
51. Pukkala E, Poskiparta M, Apter D, Vihko V. Life-long physical activity and cancer risk among
Finnish female teachers. European Journal of Cancer Prevention 1993;2:369-76.
52. Byrne C, Ursin G, Ziegler RG. A comparison of food habit and food frequency data as
predictors of breast cancer in the NHANES I/NHEFS cohort. J Nutr 1996;126(11):2757-64.
53. Rockhill B, Willett WC, Hunter DJ, Manson JE, Hankinson SE, Spiegelman D, et al. Physical
activity and breast cancer risk in a cohort of young women. J Natl Cancer Inst 1998;90(15):1155-60.
54. Rockhill B, Willett WC, Hunter DJ, Manson JE, Hankinson SE, Colditz GA. A prospective study
of recreational physical activity and breast cancer risk. Arch Intern Med 1999;159(19):2290-6.
55. Colditz GA, Feskanich D, Chen WY, Hunter DJ, Willett WC. Physical activity and risk of breast
cancer in premenopausal women. Br J Cancer 2003;89(5):847-51.
56. Lahmann PH, Friedenreich C, Schuit AJ, Salvini S, Allen NE, Key TJ, et al. Physical activity and
breast cancer risk: the European Prospective Investigation into Cancer and Nutrition. Cancer
Epidemiol Biomarkers Prev 2007;16(1):36-42.
57. Ji BT, Blair A, Shu XO, Chow WH, Hauptmann M, Dosemeci M, et al. Occupation and breast
cancer risk among Shanghai women in a population-based cohort study. Am J Ind Med
2008;51(2):100-10.
58. Inoue M, Yamamoto S, Kurahashi N, Iwasaki M, Sasazuki S, Tsugane S, et al. Daily total
physical activity level and total cancer risk in men and women: results from a large-scale population-
based cohort study in Japan. Am J Epidemiol 2008;168(4):391-403.

18
59. Fournier A, Dos Santos G, Guillas G, Bertsch J, Duclos M, Boutron-Ruault MC, et al. Recent
Recreational Physical Activity and Breast Cancer Risk in Postmenopausal Women in the E3N Cohort.
Cancer Epidemiol Biomarkers Prev 2014.
60. McKenzie F, Ferrari P, Freisling H, Chajès V, Rinaldi S, de Batlle J, et al. Healthy lifestyle and
risk of breast cancer among postmenopausal women in the European Prospective Investigation into
Cancer and Nutrition cohort study. International Journal of Cancer 2014:n/a-n/a.