automated imaging technologies for pavement distress...
TRANSCRIPT
T R A N S P O R T A T I O N R E S E A R C H
Number E-C156 July 2011
Automated Imaging Technologies for
Pavement Distress Surveys

TRANSPORTATION RESEARCH BOARD 2011 EXECUTIVE COMMITTEE OFFICERS Chair: Neil J. Pedersen, Administrator, Maryland State Highway Administration, Baltimore Vice Chair: Sandra Rosenbloom, Professor of Planning, University of Arizona, Tucson Division Chair for NRC Oversight: C. Michael Walton, Ernest H. Cockrell Centennial Chair
in Engineering, University of Texas, Austin Executive Director: Robert E. Skinner, Jr., Transportation Research Board TRANSPORTATION RESEARCH BOARD 2011–2012 TECHNICAL ACTIVITIES COUNCIL Chair: Katherine F. Turnbull, Executive Associate Director, Texas Transportation Institute,
Texas A&M University, College Station Technical Activities Director: Mark R. Norman, Transportation Research Board Jeannie G. Beckett, Principal, Beckett Group, Gig Harbor, Washington, Marine Group Chair Paul Carlson, Research Engineer, Texas Transportation Institute, Texas A&M University,
College Station, Operations and Maintenance Group Chair Thomas J. Kazmierowski, Manager, Materials Engineering and Research Office, Ontario
Ministry of Transportation, Toronto, Canada, Design and Construction Group Chair Ronald R. Knipling, Principal, safetyforthelonghaul.com, Arlington, Virginia, System Users
Group Chair Mark S. Kross, Consultant, Jefferson City, Missouri, Planning and Environment Group Chair Edward V. A. Kussy, Partner, Nossaman, Guthner, Knox, and Elliott, LLP, Washington, D.C.,
Legal Resources Group Chair Peter B. Mandle, Director, LeighFisher, Inc., Burlingame, California, Aviation Group Chair Anthony D. Perl, Professor of Political Science and Urban Studies and Director, Urban Studies
Program, Simon Fraser University, Vancouver, British Columbia, Canada, Rail Group Chair
Steven Silkunas, Director of Business Development, Southeastern Pennsylvania Transportation Authority, Philadelphia, Pennsylvania, Public Transportation Group Chair
Peter F. Swan, Assistant Professor of Logistics and Operations Management, Pennsylvania State, Harrisburg, Middletown, Pennsylvania, Freight Systems Group Chair
Johanna P. Zmud, Director, Transportation, Space, and Technology Program, RAND Corporation, Arlington, Virginia, Policy and Organization Group Chair

TRANSPORTATION RESEARCH CIRCULAR E-C156
Automated Imaging Technologies for Pavement Distress Surveys
Prepared by Kelvin C. P. Wang
and Omar Smadi
for the Pavement Monitoring and Evaluation Committee
July 2011
Transportation Research Board 500 Fifth Street, NW
Washington, DC 20001 www.TRB.org
TRANSPORTATION RESEARCH CIRCULAR E-C156 ISSN 0097-8515 The Transportation Research Board is one of six major divisions of the National Research Council, which serves as an independent adviser to the federal government and others on scientific and technical questions of national importance. The National Research Council is jointly administered by the National Academy of Sciences, the National Academy of Engineering, and the Institute of Medicine. The mission of the Transportation Research Board is to provide leadership in transportation innovation and progress through research and information exchange, conducted within a setting that is objective, interdisciplinary, and multimodal.
The Transportation Research Board is distributing this circular to make the information contained herein available for use by individual practitioners in state and local transportation agencies, researchers in academic institutions, and other members of the transportation research community. The information in this circular was taken directly from the submission of the authors. This document is not a report of the National Research Council or of the National Academy of Sciences.
Design and Construction Group Thomas J. Kazmierowski, Chair
Pavement Management Section
Cheryl Allen Richter, Chair
Pavement Monitoring and Evaluation Committee Omar Smadi, Chair
Amir Omar Abd El Halim Mahmoud Fouad Ahmed
John H. P. Andrews Christopher R. Bennett
Jane E. Berger Rudy Blanco
German J. Claros Zejiao Dong
Lulu Edwards Kieran J. Feighan
Brian Walter Ferne Jonathan L. Groeger
Kurt A. Keifer Hosin David Lee
Kang-Won Wayne Lee Ningyuan Li
Xue Li Michael Nieminen Jason Puccinelli
LaDonna R. Rowden
Peter E. Sebaaly Kevin A. Senn
Mohamed Y. Shahin Raja A. Shekharan
Nadarajah Sivaneswaran Roger E. Smith* Jack H. Springer Helga N. Torres
Kelvin C. P. Wang Angie S. Wolters
* Emeritus Member
Stephen F. Maher, TRB Staff Representative Michael DeCarmine, Senior Program Associate
Transportation Research Board 500 Fifth Street, NW
Washington, DC 20001 www.TRB.org
Glenda J. Beal, Production Editor; Regina Reid, Proofreader and Layout
1
Automated Imaging Technologies for Pavement Distress Surveys
KELVIN C. P. WANG Oklahoma State University
OMAR SMADI
Iowa State University
uring the past 30 years, numerous efforts have been attempted to automate the process of identifying and classifying pavement surface distresses into usable engineering indices. The
primary interest in surface distresses has concentrated on pavement surface cracking, even though other distress types can also significantly contribute to pavement surface condition. The Distress Identification Manual for the Long-Term Pavement Performance Program, published in 1993 and 2003, is regarded as a comprehensive guideline in the inspection of pavement surface distresses, particularly for project level studies. The goal of this circular is to document state-of-the-art techniques and technologies in the acquisition of pavement surface images, and basic requirements needed to automatically identify and classify pavement surface distresses. The primary approach to data acquisition is through taking pavement images in either analog or digital format. The basics of film or magnetic tape–based image acquisition are presented in the circular. Digital acquisition, as the new data format, is being introduced in detail, regarding aspects of digital resolution and its relationship to detectable cracking width, dynamic range, compression methods, storage, and delivery. The circular also reports on the new laser-based imaging system with its high-quality image and low-power usage, as well as the potential for using 3-D laser imaging technology for pavement surveys. INTRODUCTION The current practice for gathering most pavement condition data is examination of pavement surface images, either manually or with assistance from computing devices. Pavement condition surveys normally include collecting data on surface cracking and other surface defects for both flexible and rigid pavements, rutting for flexible pavements, and joint distress for rigid pavements. Detailed information on how to conduct pavement condition surveys can be found in the Distress Identification Manual for the Long-Term Pavement Performance, published in 1993 and 2003. NCHRP published a synthesis in 2004 (1) on automated pavement distress collection techniques, which details current practices in data collection and automation.
Rutting surveys can be automatically conducted either with transverse laser profiler, or with other laser based multipoint acquisition methodology. Challenges remain in automatically producing other types of distress data, such as cracking, even though substantial progress has been made in recent years. In the past two decades, numerous efforts were launched with the goal of automatically identifying and classifying pavement cracks (2).
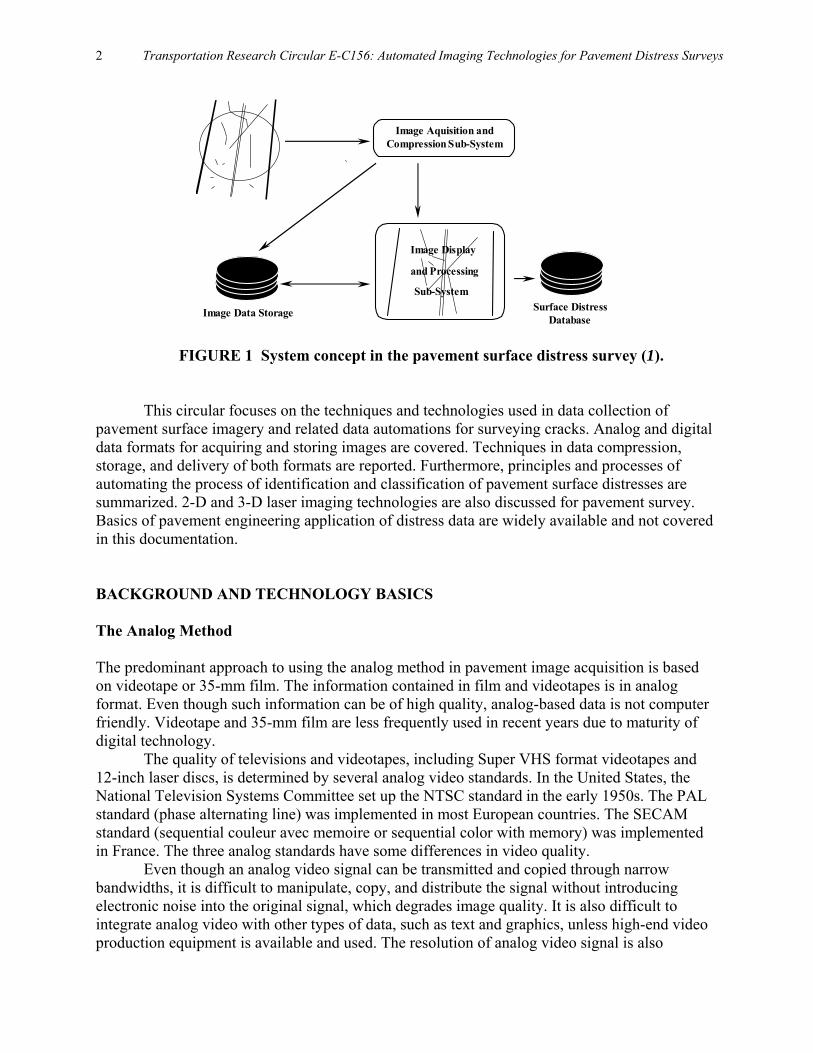
At this time, the predominant methodology is to obtain 2-D imagery of pavement surface and process the images with computer-based algorithms. Figure 1 illustrates the basic system concept of an automated distress survey system, consisting of data acquisition, data storage, and data display and processing subsystems. In addition, a database system is used in Figure 1 for archiving and retrieving the processed data.
D
2 Transportation Research Circular E-C156: Automated Imaging Technologies for Pavement Distress Surveys
Image Aquisition and Compression Sub-System
Surface Distress Database Image Data Storage
Image Display
and Processing
Sub-System
FIGURE 1 System concept in the pavement surface distress survey (1).
This circular focuses on the techniques and technologies used in data collection of pavement surface imagery and related data automations for surveying cracks. Analog and digital data formats for acquiring and storing images are covered. Techniques in data compression, storage, and delivery of both formats are reported. Furthermore, principles and processes of automating the process of identification and classification of pavement surface distresses are summarized. 2-D and 3-D laser imaging technologies are also discussed for pavement survey. Basics of pavement engineering application of distress data are widely available and not covered in this documentation. BACKGROUND AND TECHNOLOGY BASICS The Analog Method The predominant approach to using the analog method in pavement image acquisition is based on videotape or 35-mm film. The information contained in film and videotapes is in analog format. Even though such information can be of high quality, analog-based data is not computer friendly. Videotape and 35-mm film are less frequently used in recent years due to maturity of digital technology.
The quality of televisions and videotapes, including Super VHS format videotapes and 12-inch laser discs, is determined by several analog video standards. In the United States, the National Television Systems Committee set up the NTSC standard in the early 1950s. The PAL standard (phase alternating line) was implemented in most European countries. The SECAM standard (sequential couleur avec memoire or sequential color with memory) was implemented in France. The three analog standards have some differences in video quality.
Even though an analog video signal can be transmitted and copied through narrow bandwidths, it is difficult to manipulate, copy, and distribute the signal without introducing electronic noise into the original signal, which degrades image quality. It is also difficult to integrate analog video with other types of data, such as text and graphics, unless high-end video production equipment is available and used. The resolution of analog video signal is also
Wang and Smadi 3
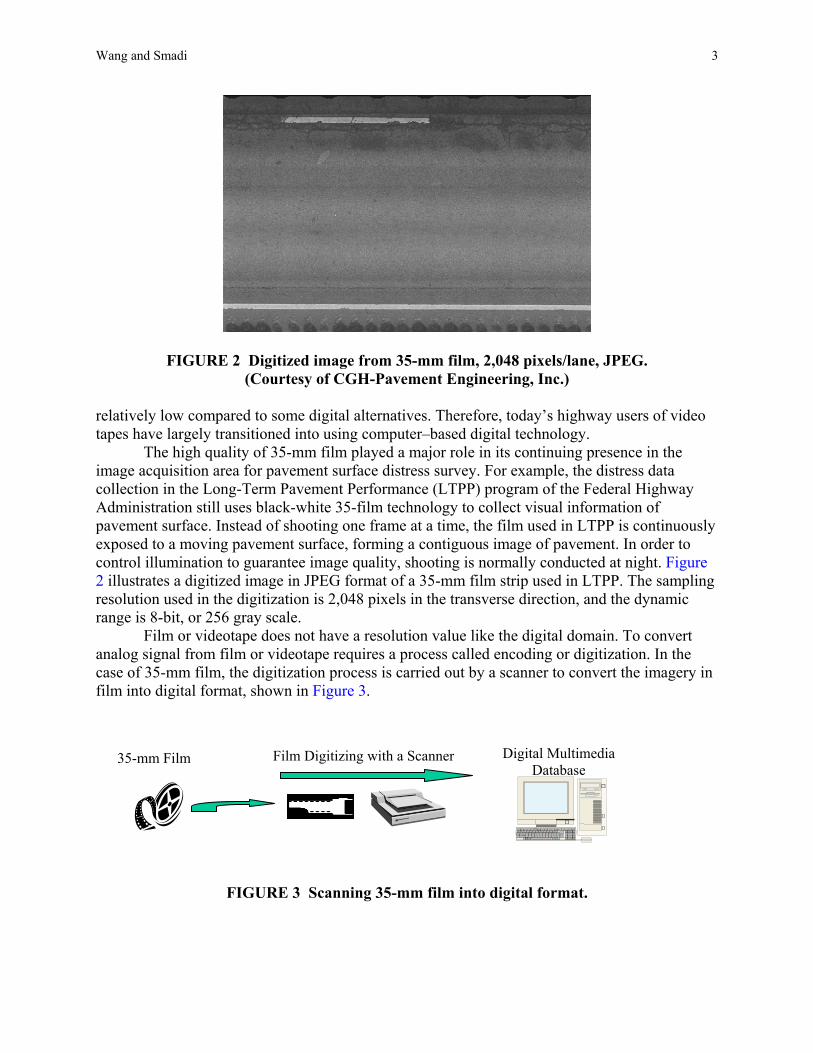
FIGURE 2 Digitized image from 35-mm film, 2,048 pixels/lane, JPEG. (Courtesy of CGH-Pavement Engineering, Inc.)
relatively low compared to some digital alternatives. Therefore, today’s highway users of video tapes have largely transitioned into using computer–based digital technology.
The high quality of 35-mm film played a major role in its continuing presence in the image acquisition area for pavement surface distress survey. For example, the distress data collection in the Long-Term Pavement Performance (LTPP) program of the Federal Highway Administration still uses black-white 35-film technology to collect visual information of pavement surface. Instead of shooting one frame at a time, the film used in LTPP is continuously exposed to a moving pavement surface, forming a contiguous image of pavement. In order to control illumination to guarantee image quality, shooting is normally conducted at night. Figure 2 illustrates a digitized image in JPEG format of a 35-mm film strip used in LTPP. The sampling resolution used in the digitization is 2,048 pixels in the transverse direction, and the dynamic range is 8-bit, or 256 gray scale.
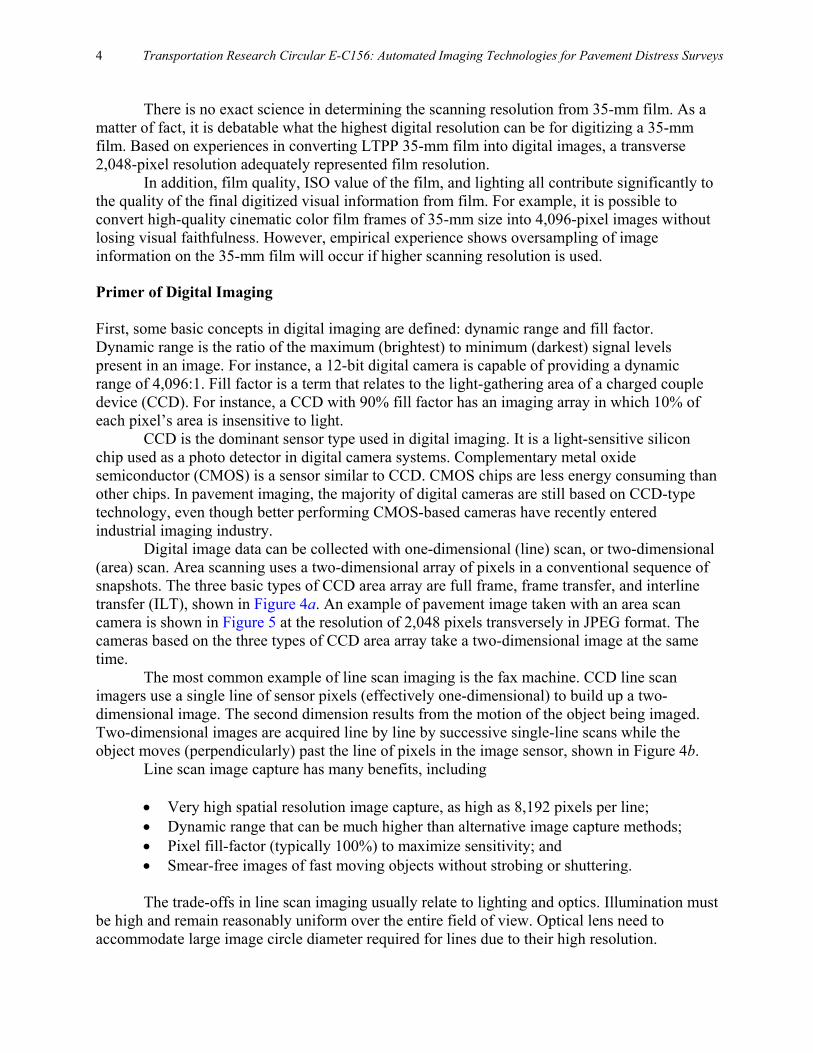
Film or videotape does not have a resolution value like the digital domain. To convert analog signal from film or videotape requires a process called encoding or digitization. In the case of 35-mm film, the digitization process is carried out by a scanner to convert the imagery in film into digital format, shown in Figure 3.
FIGURE 3 Scanning 35-mm film into digital format.
35-mm Film Digital Multimedia Database
Film Digitizing with a Scanner
4 Transportation Research Circular E-C156: Automated Imaging Technologies for Pavement Distress Surveys
There is no exact science in determining the scanning resolution from 35-mm film. As a matter of fact, it is debatable what the highest digital resolution can be for digitizing a 35-mm film. Based on experiences in converting LTPP 35-mm film into digital images, a transverse 2,048-pixel resolution adequately represented film resolution.
In addition, film quality, ISO value of the film, and lighting all contribute significantly to the quality of the final digitized visual information from film. For example, it is possible to convert high-quality cinematic color film frames of 35-mm size into 4,096-pixel images without losing visual faithfulness. However, empirical experience shows oversampling of image information on the 35-mm film will occur if higher scanning resolution is used. Primer of Digital Imaging First, some basic concepts in digital imaging are defined: dynamic range and fill factor. Dynamic range is the ratio of the maximum (brightest) to minimum (darkest) signal levels present in an image. For instance, a 12-bit digital camera is capable of providing a dynamic range of 4,096:1. Fill factor is a term that relates to the light-gathering area of a charged couple device (CCD). For instance, a CCD with 90% fill factor has an imaging array in which 10% of each pixel’s area is insensitive to light.
CCD is the dominant sensor type used in digital imaging. It is a light-sensitive silicon chip used as a photo detector in digital camera systems. Complementary metal oxide semiconductor (CMOS) is a sensor similar to CCD. CMOS chips are less energy consuming than other chips. In pavement imaging, the majority of digital cameras are still based on CCD-type technology, even though better performing CMOS-based cameras have recently entered industrial imaging industry.
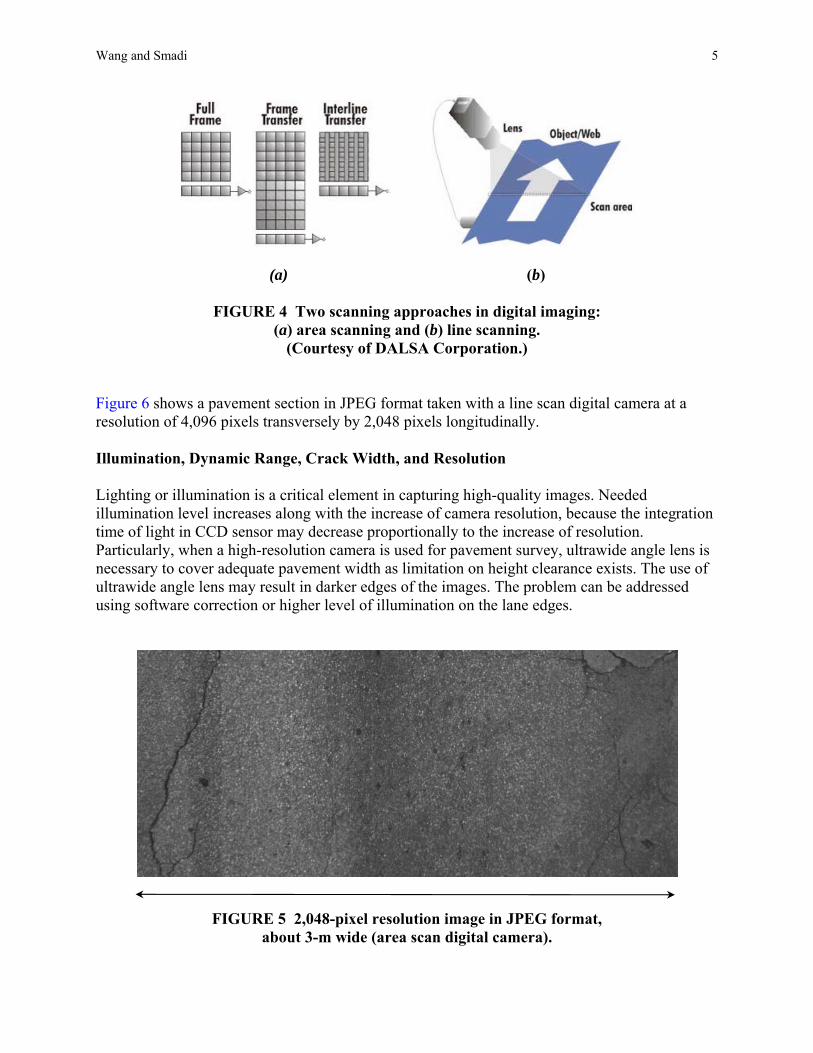
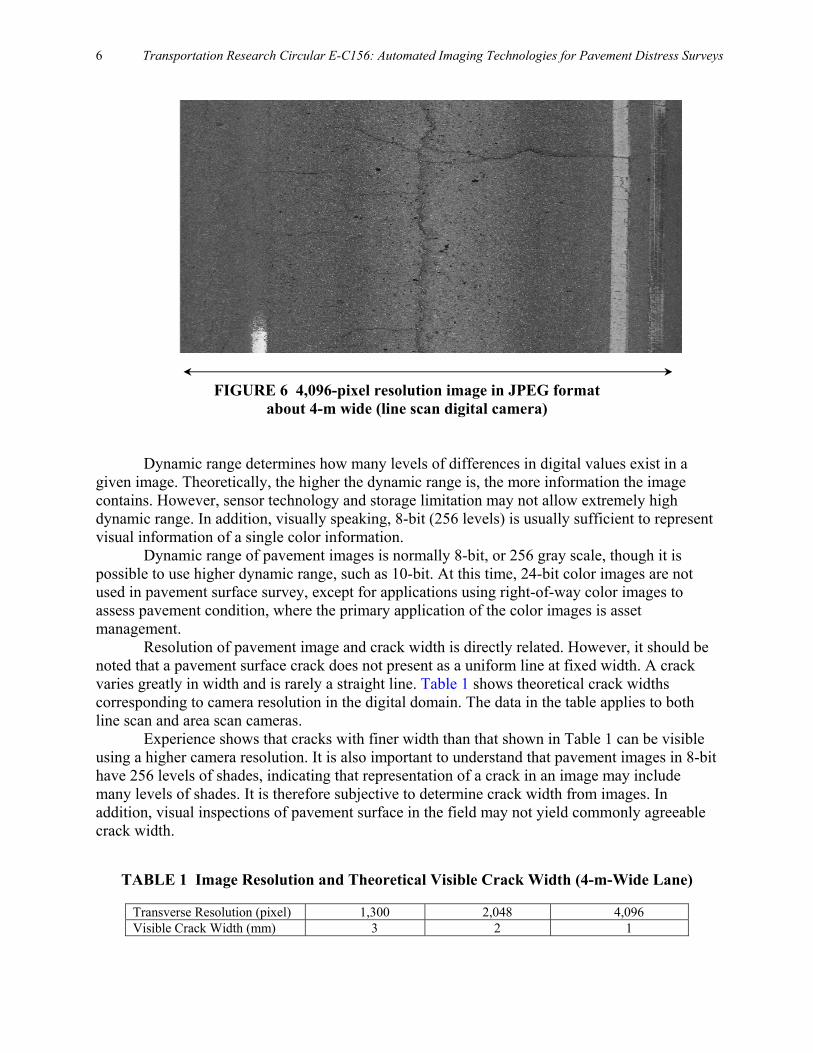
Digital image data can be collected with one-dimensional (line) scan, or two-dimensional (area) scan. Area scanning uses a two-dimensional array of pixels in a conventional sequence of snapshots. The three basic types of CCD area array are full frame, frame transfer, and interline transfer (ILT), shown in Figure 4a. An example of pavement image taken with an area scan camera is shown in Figure 5 at the resolution of 2,048 pixels transversely in JPEG format. The cameras based on the three types of CCD area array take a two-dimensional image at the same time.
The most common example of line scan imaging is the fax machine. CCD line scan imagers use a single line of sensor pixels (effectively one-dimensional) to build up a two-dimensional image. The second dimension results from the motion of the object being imaged. Two-dimensional images are acquired line by line by successive single-line scans while the object moves (perpendicularly) past the line of pixels in the image sensor, shown in Figure 4b.
Line scan image capture has many benefits, including
Very high spatial resolution image capture, as high as 8,192 pixels per line; Dynamic range that can be much higher than alternative image capture methods; Pixel fill-factor (typically 100%) to maximize sensitivity; and Smear-free images of fast moving objects without strobing or shuttering.
The trade-offs in line scan imaging usually relate to lighting and optics. Illumination must
be high and remain reasonably uniform over the entire field of view. Optical lens need to accommodate large image circle diameter required for lines due to their high resolution.
Wang and Smadi 5
(a) (b)
FIGURE 4 Two scanning approaches in digital imaging: (a) area scanning and (b) line scanning.
(Courtesy of DALSA Corporation.) Figure 6 shows a pavement section in JPEG format taken with a line scan digital camera at a resolution of 4,096 pixels transversely by 2,048 pixels longitudinally. Illumination, Dynamic Range, Crack Width, and Resolution Lighting or illumination is a critical element in capturing high-quality images. Needed illumination level increases along with the increase of camera resolution, because the integration time of light in CCD sensor may decrease proportionally to the increase of resolution. Particularly, when a high-resolution camera is used for pavement survey, ultrawide angle lens is necessary to cover adequate pavement width as limitation on height clearance exists. The use of ultrawide angle lens may result in darker edges of the images. The problem can be addressed using software correction or higher level of illumination on the lane edges.
FIGURE 5 2,048-pixel resolution image in JPEG format, about 3-m wide (area scan digital camera).
6 Transportation Research Circular E-C156: Automated Imaging Technologies for Pavement Distress Surveys
FIGURE 6 4,096-pixel resolution image in JPEG format
about 4-m wide (line scan digital camera)
Dynamic range determines how many levels of differences in digital values exist in a given image. Theoretically, the higher the dynamic range is, the more information the image contains. However, sensor technology and storage limitation may not allow extremely high dynamic range. In addition, visually speaking, 8-bit (256 levels) is usually sufficient to represent visual information of a single color information.
Dynamic range of pavement images is normally 8-bit, or 256 gray scale, though it is possible to use higher dynamic range, such as 10-bit. At this time, 24-bit color images are not used in pavement surface survey, except for applications using right-of-way color images to assess pavement condition, where the primary application of the color images is asset management.
Resolution of pavement image and crack width is directly related. However, it should be noted that a pavement surface crack does not present as a uniform line at fixed width. A crack varies greatly in width and is rarely a straight line. Table 1 shows theoretical crack widths corresponding to camera resolution in the digital domain. The data in the table applies to both line scan and area scan cameras.
Experience shows that cracks with finer width than that shown in Table 1 can be visible using a higher camera resolution. It is also important to understand that pavement images in 8-bit have 256 levels of shades, indicating that representation of a crack in an image may include many levels of shades. It is therefore subjective to determine crack width from images. In addition, visual inspections of pavement surface in the field may not yield commonly agreeable crack width.
TABLE 1 Image Resolution and Theoretical Visible Crack Width (4-m-Wide Lane)
Transverse Resolution (pixel) 1,300 2,048 4,096 Visible Crack Width (mm) 3 2 1

Wang and Smadi 7
Storage and Compression Without compression, the storage need for 1-km pavement coverage at a 4-m width is about 1.024 GB at the dynamic range of 8-bit for 2,048 pixels per lane, and 4.1 GB for 4,096 pixels per lane. Network level survey normally covers tens of thousands of kilometers for a state highway agency. Therefore, compression is widely used for image archive and data management. The predominant compression method used today is JPEG, standing for Joint Picture Expert Group, an industry standard-setting body.
Normally, the JPEG algorithm used in pavement imaging is lossy, meaning some information is lost during the compression process and the original raw image cannot be restored from the compressed image. The JPEG standard also has an option to compress images into lossless format. However, due to low compression ratio, this lossless JPEG compression is mainly used in medical and legal professions. The primary reason to use lossy algorithm is to obtain greater level of compression. For example, the size of a visually faithful JPEG image of pavement surface is about one-fifth to one-eighth of the size of the original raw image, translating to 5:1 to 8:1 compression ratios. If a lossless compression is used, the compression ratios normally do not exceed 3:1 for images with detailed textures, such as pavement surfaces. Images in Figures 2, 5, and 6 were all compressed with JPEG lossy algorithm. For example, the size of the JPEG image in Figure 6 is about 1.4 MB, achieving the compression ratio of about 6:1.
The new compression standard, JPEG 2000, uses a different compression algorithm, mathematically based on the wavelet technique. The advantage of JPEG 2000 over traditional JPEG is that JPEG 2000 achieves much higher compression at the similar quality level with traditional JPEG. As a matter of fact, upon close examination through zooming in, the blocking effect with images compressed with JPEG 2000 is less severe compared to that of images compressed with traditional JPEG. However, it should be pointed out that encoding and decoding JPEG 2000 images require substantially more computing power than for traditional JPEG images.
Data management with compressed images can be conducted through database management software, such as Microsoft Access. As all data, including images and location information obtained during field operation of the data vehicle, are contained in digital files or records, the data archiving and retrieving are straightforward. Custom software can be made for easy and rapid access to the images through computer networks. AUTOMATED DATA INTERPRETATION Data collection of pavement surface images is sometimes referred to as automated pavement condition survey. In strict definition, automated pavement conduction survey includes automation of both data collection and interpretation. This part of the circular reviews technologies in automation of both processes. It should be noted that the conceptual approaches to automated data interpretation for identifying and classifying pavement surface cracks are generally similar among commercial systems. However, the mathematical algorithms for the implementations are proprietary and may be substantially different from each other. This circular only addresses publicly available information.
8 Transportation Research Circular E-C156: Automated Imaging Technologies for Pavement Distress Surveys
Brief History In the late 1980s, the Japanese consortium Komatsu built an automated-pavement-distress-survey system (3), comprising a survey vehicle and data-processing system on board to simultaneously measure cracking, rutting, and longitudinal profile. Maximum resolution of 2,048 x 2,048 is obtained at the speed of 10 kmh. The Komatsu system worked only at night to control lighting conditions and represented an implementation of the most sophisticated hardware technologies at that time. However, the system did not output the types of cracking.
From late 1980s to early 1990s, Earth Technology Corporation created a research unit called Pavement Condition Evaluation Services (PCES). The automated system created by PCES was the first to use line scan cameras at 512-pixel resolution to collect pavement data. The necessary technologies associated with the image capturing and processing were not mature enough at that time. PCES designed and produced their own hardware and made their own system-level software.
In the early 1990s, NCHRP also funded research called Video Image Processing for Evaluating Pavement Surface Distress, Project 1-27 (4). The research approach in that project used traditional imaging algorithms with 2-D images of pavements. The research was experimental and the final report was not formally published.
In the 1980s and 1990s, the Swedish PAVUE acquisition equipment includes four video cameras, a proprietary lighting system, and four S-VHS videocassette recorders. The image collection subsystem is integrated into a van. The off-line workstation is based on a set of custom designed processor boards in a cabinet to analyze continuous pavement data from the recorded video images. Surface images are stored on S-VHS tapes in analog format. This system is no longer actively used in North America.
Dr. Max Monti of the Swiss Federal Institute of Technology completed his PhD in developing a new pavement imaging system (5), Crack Recognition Holographic System. The pavement surface is scanned with a focused laser beam along a straight line in the lateral direction, while the longitudinal scan is conducted with the movement of the vehicle. The hardware system was dismantled due to performance limitations.
From 1995, the FHWA’s LTPP awarded two continuing contracts to LORAL Defense Systems in Arizona, now a unit of Lockheed Martin, to provide an automated distress analysis for pavement, based on techniques used for military purposes. The data source used was digitized images from 35-mm film. The delivered system after completion of the two projects was not used. A few years ago, Arizona DOT provided limited funding for Lockheed Martin to continue the research. Market Status Since the mid 1990s, RoadWare Corporation has been actively using WiseCrax for automated survey of pavement surface. The data collection uses two cameras synchronized with a strobe illumination system, with each camera covering about half-width of a pavement lane. The image processing is done off-line using the host CPUs to conduct image processing with some operator assistance.
A few years ago, SDS America of Samsung was marketing a technology licensed from the University of Utah to collect and interpret pavement images. The uniANALYZE software was an interactive pavement distress analysis system. The data collection used one digital camera

Wang and Smadi 9
at a resolution of 758 x 580 pixels. The analysis was conducted off-line. Samsung discontinued its effort after a couple of years.
There are two notable efforts for developing automated pavement condition survey devices in the United Kingdom and Australia. The Highways Agency Road Research Information System of the United Kingdom was made by the Transport Research Lab in the 1990s. RoadCrack System was developed by the Roads and Traffic Authority of News South Wales and Australia’s Commonwealth Scientific and Industrial Research Organization (CSIRO). Both systems are based on the line scan approach and have been used in the respective countries.
WDM Limited, a pavement data collection company in Britain, has been using its automated cracking survey system for network-level survey for sometime in the United Kingdom. Their road assessment vehicles can operate at highway speed and process images for cracks in real time.
WayLink Systems Co. has been marketing its automated distress analyzer for data collection and interpretation for several years. The data interpretation is designed to operate real time. The data collection system is currently at 4,096 pixels per lane.
Table 2 shows basic features of several commercial systems. Vendors with image acquisition only, without automated data interpretation, are not included in the table. Because of recent improvements of acquisition technology, particularly the introduction of laser-based imaging technology, some vendors in the list are in the process of introducing newer platforms for image acquisition. EXAMPLE OF AN AUTOMATED DIGITAL SYSTEM This circular can only provide a general guideline in determining basic technical specifications of an automated system. Detailed information on equipment classification and data interpretation standard can be found in the literature from ASTM, AASHTO, and the Permanent International Association of Road Congresses—World Road Association. The World Bank has also worked on vendor information and technical specification for third world countries. The recommendation contains image capturing and data interpretation. Image Capturing After several decades’ struggle in acquiring high-quality pavement images without the influence of sunlight and shadows, a laser-illumination-based technology became available in late 2005. At the time of this writing, INO of Quebec, Canada, is the sole supplier of the technology that vendors use to capture data. Based on information provided by INO, the following is the description of the technology, laser road imaging systems (LRIS).
Figure 7 demonstrates the working principles of the laser imaging system, LRIS, which allows image acquisition without the influence of sun light and shadows. It can work during the day or at night, as long as the pavement surface is dry. In addition, the resolution of the acquired pavement surface images is about 1 mm in both transverse and longitudinal directions. The implemented data collection speed is from slow moving to over 100 kilometers per hour (kmh).

10 Transportation Research Circular E-C156: Automated Imaging Technologies for Pavement Distress Surveys
TABLE 2 Basic Features of Automated Systems for Distress Survey (partial listing)
Vendor Digital Camera Type
Resolution (pixel)
Speed (capture)
Interpretation Distress Type
RoadWare Yes Area 2,048 Highway Automated Cracking WayLink Yes Line 4,096 Highway Automated Cracking CSIRO Yes Line 2,048 Highway Automated Cracking WDM Yes Line 2,048 Highway Automated Cracking
LRIS is based on two illuminating lasers and two digital line cameras. LRIS only consumes about 200 watts of power, versus thousands of watts of traditional lighting systems.
LRIS represents an image acquisition platform that has been sought after, but was not available at reasonable cost in the industry. Based on feedback from several vendors that have integrated LRIS into their product lines, the image quality met expectations, and is not affected by sunlight or darkness. Figure 8 shows one integrated LRIS in a highway data vehicle.
INO provides the hardware and software library for integrators or vendors. The vendors have the responsibility to write software to acquire line images from the two cameras triggered by vendor-specific electronics based on a signal from the vehicle’s speed encoder. As LRIS uses two cameras, the acquired pair images must be aligned and merged to form an integrated single image.
Other technologies to capture images exist, but because they are proprietary, this circular does not discuss those systems.
FIGURE 7 Operating principle of LRIS (courtesy of INO).

Wang and Smadi 11
FIGURE 8 Implementation of LRIS into a highway data vehicle. For the portability of data, INO recommends that a JPEG or JPEG 2000 standard be used for data compression. The storage requirements in both raw image format and compressed format are shown in Table 3. One-mm resolution images with complete coverage of a pavement lane of 4-m width at the speed of 100 kmh will require an incoming raw data flow of about 120 MB per second before compression. Data Interpretation There are two components in automated data interpretation: software algorithms to process images and generate crack maps that identify cracks on pavement surface, and methodology to statistically summarize the information contained in the crack maps and produce engineering indices to be used in the pavement management process.
Software algorithms work in the following manner. A processing system reads 8-bit gray scale images into computer system memory. The image or images are filtered with customized algorithms so that a large portion of noncracking image data is filtered out and the remaining visual information is presented in black-white or binary format. Noises in the binary images are then removed, and disconnected cracks are linked together. TABLE 3 Storage Requirements for Images at 4,096-Pixel Resolution per 4-m-Wide Lane
Image Format 1,000-ft Length of a
Single Lane 1- mi Length of a Single
Lane 1- km Length of a Single
Lane Raw Image
(uncompressed TIFF) 1,248 MB (1.25 GB) 6,590 MB (6.59 GB), 4,096 MB (4 GB),
Compressed with JPEG 200 MB 900 MB 600 MB Compressed with
JPEG 2000 65 MB 330 MB 205 MB

12 Transportation Research Circular E-C156: Automated Imaging Technologies for Pavement Distress Surveys
If the processing is successful at this stage, a large percentage of cracking information is retained in the binary image. A vectoring analysis can be conducted in the remaining information in the image. Geometry data on any specific crack is identified, including length, width, orientation and location of crack, all of which can be saved into a relational database. Detailed algorithm descriptions of commercial systems are not made public. There are various research papers on this subject that are available through the web or libraries.
Despite the fact that there are many systems of software algorithms to automatically process images for cracks, only a handful of commercial systems are available. Among the commercial systems, some may require postprocessing and some claim to be capable of real-time processing. Efforts are underway to develop procedures to classify the capabilities of vendors’ equipment into various classes through organizations such as ASTM and PIARC.
For the second component in data interpretation, there are two major efforts. One was the Standard Practice for Quantifying Cracks in Asphalt Pavement Surface (6), or commonly referred to as the AASHTO interim protocol. The other is the United Kingdom’s Surface Condition Assessment of the National Network of Roads (SCANNER). The AASHTO interim protocol represented a standardization effort in North America to use a simple but user-expandable methodology for pavement cracking indexing. It is anticipated that AASHTO is planning to release an updated protocol in the near future to replace the current interim protocol. There is an indication that a number of countries in Europe may decide to adopt the SCANNER approach. NEW 3-D LASER IMAGING FOR PAVEMENT CONDITION SURVEY After many decades of research and development, the industry and developers as a whole have been frustrated with the slow pace of progress in fully automated systems for pavement condition survey. Even though the 2-D laser imaging introduced in 2006 provides shadow-free 1-mm images, the difficulty in providing pavement engineers fully automated results still remains. In the recent months, there have been rapid developments at several agencies in North America on the application of laser imaging technology for capturing pavement 3-D surface with the purpose of automatically obtaining pavement condition data. The 3-D laser imaging technology has been in use on factory floors and conveyer belts for a number of years for parts inspection. The successful implementation of the 3-D data acquisition system for pavement survey raises hopes among researchers that a better solution for automated processing of pavement surface defects may be near.
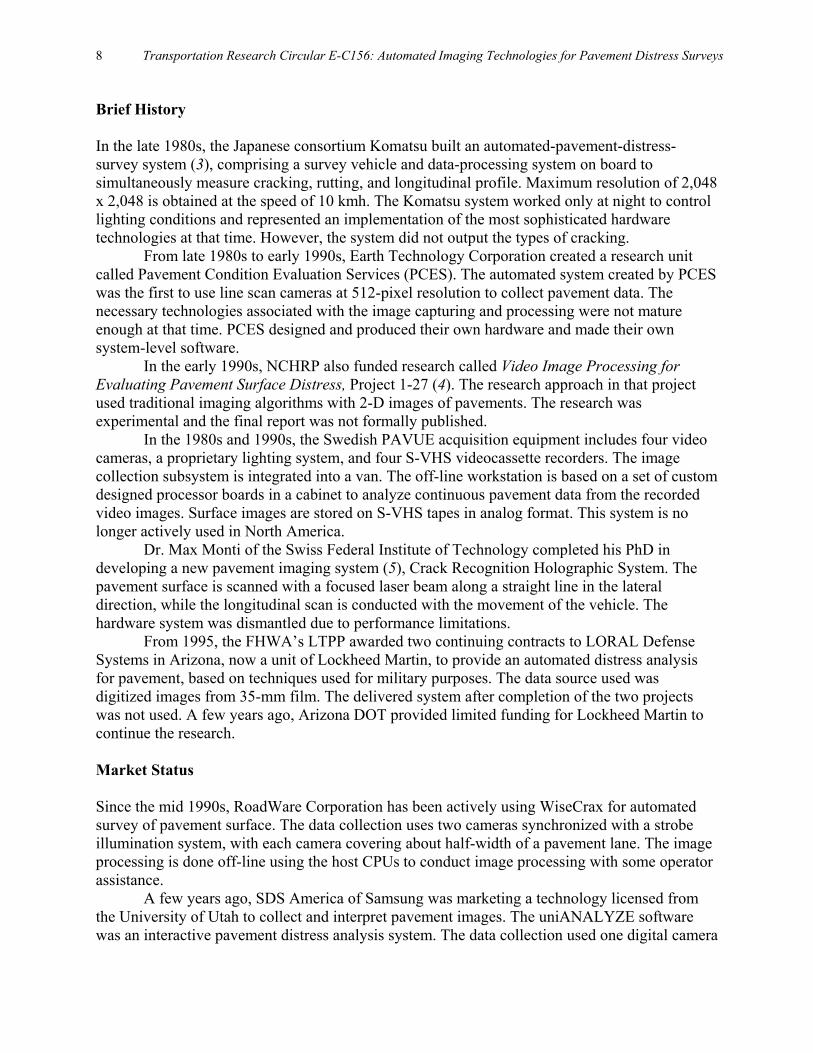
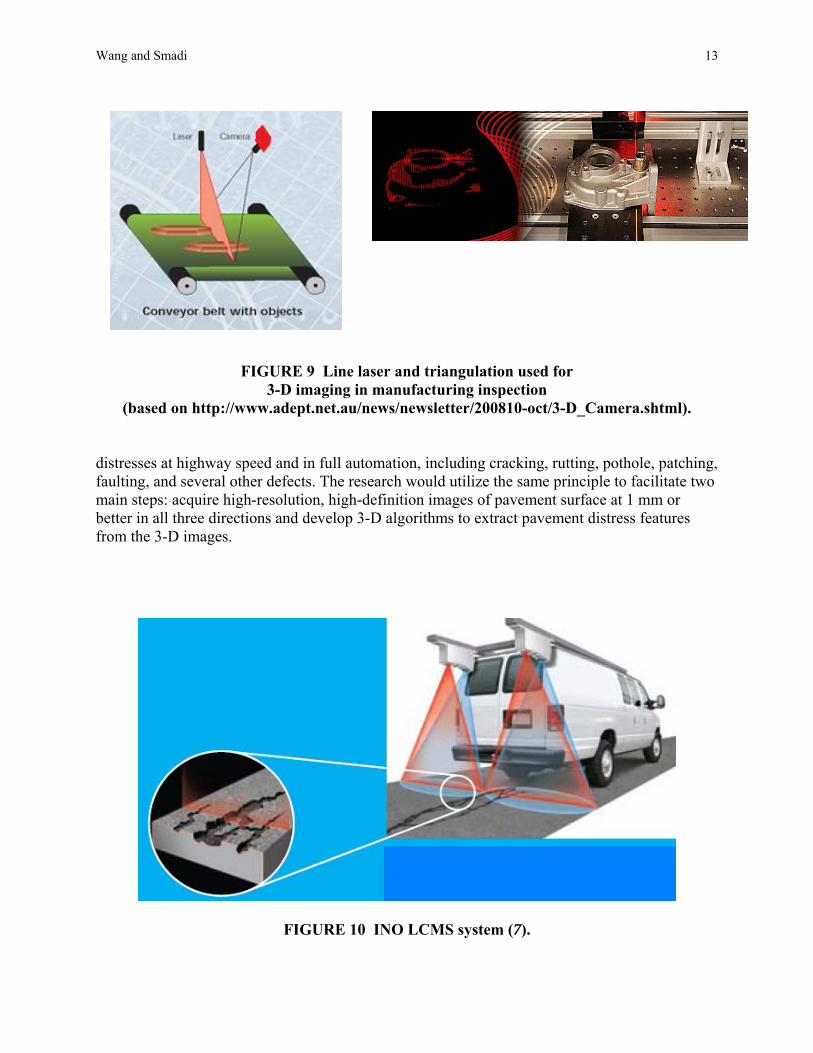
Most pavement surface defects all have unique 3-D characteristics of various scales in both the x and y dimension (surface), and the z dimension (depth). In recent years 3-D laser imaging technology has been widely applied for inspection of manufactured products. Figure 9 illustrates the general principles of using 3-D laser imaging techniques to capture surface characteristics on the conveyer belt. Conceptually, such 3-D data-gathering techniques can be applied to pavement surface imaging and has been demonstrated as such (Figure 10).
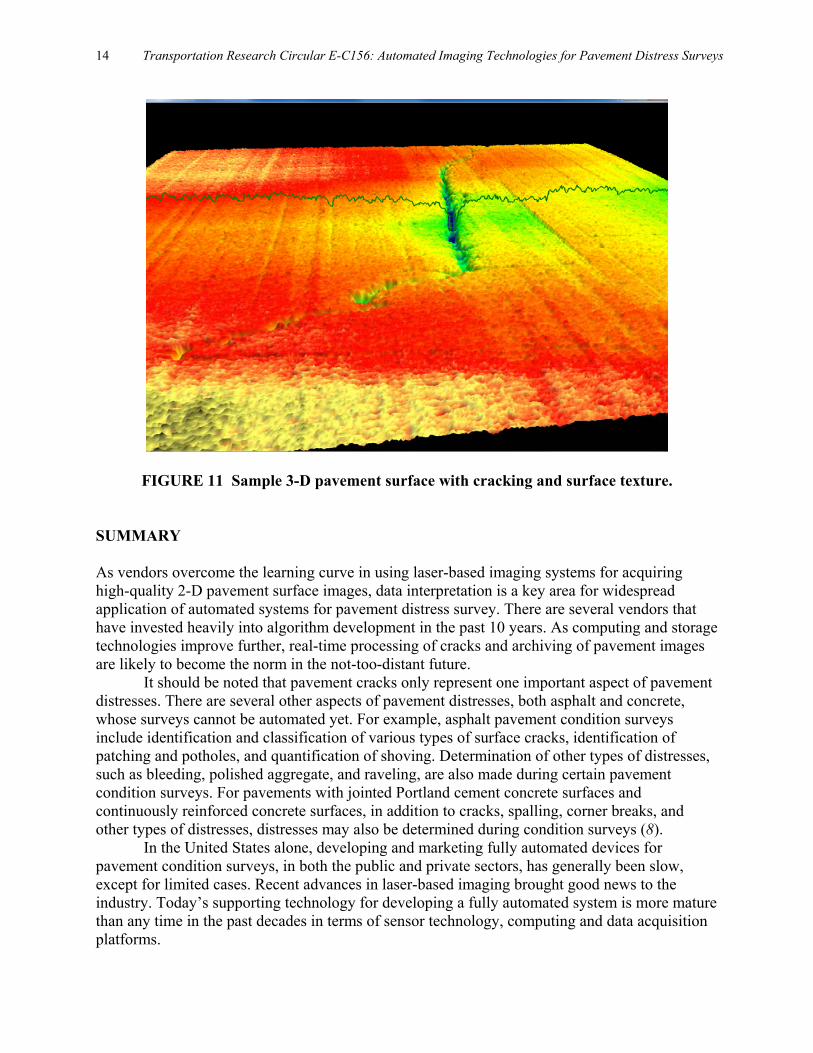
At this time, the major element of pavement surface distresses is surface cracking. The detection and classification of cracks are still not fully automated in the field with satisfactory results. A substantial amount of postprocessing and manual intervention is still required. Figure 11 shows a sample 3-D pavement surface. The new research has the potential to pave the way to establish a new technological platform that would produce several key pavement surface
Wang and Smadi 13
FIGURE 9 Line laser and triangulation used for
3-D imaging in manufacturing inspection (based on http://www.adept.net.au/news/newsletter/200810-oct/3-D_Camera.shtml).
distresses at highway speed and in full automation, including cracking, rutting, pothole, patching, faulting, and several other defects. The research would utilize the same principle to facilitate two main steps: acquire high-resolution, high-definition images of pavement surface at 1 mm or better in all three directions and develop 3-D algorithms to extract pavement distress features from the 3-D images.
FIGURE 10 INO LCMS system (7).
14 Transportation Research Circular E-C156: Automated Imaging Technologies for Pavement Distress Surveys
FIGURE 11 Sample 3-D pavement surface with cracking and surface texture. SUMMARY As vendors overcome the learning curve in using laser-based imaging systems for acquiring high-quality 2-D pavement surface images, data interpretation is a key area for widespread application of automated systems for pavement distress survey. There are several vendors that have invested heavily into algorithm development in the past 10 years. As computing and storage technologies improve further, real-time processing of cracks and archiving of pavement images are likely to become the norm in the not-too-distant future.
It should be noted that pavement cracks only represent one important aspect of pavement distresses. There are several other aspects of pavement distresses, both asphalt and concrete, whose surveys cannot be automated yet. For example, asphalt pavement condition surveys include identification and classification of various types of surface cracks, identification of patching and potholes, and quantification of shoving. Determination of other types of distresses, such as bleeding, polished aggregate, and raveling, are also made during certain pavement condition surveys. For pavements with jointed Portland cement concrete surfaces and continuously reinforced concrete surfaces, in addition to cracks, spalling, corner breaks, and other types of distresses, distresses may also be determined during condition surveys (8).
In the United States alone, developing and marketing fully automated devices for pavement condition surveys, in both the public and private sectors, has generally been slow, except for limited cases. Recent advances in laser-based imaging brought good news to the industry. Today’s supporting technology for developing a fully automated system is more mature than any time in the past decades in terms of sensor technology, computing and data acquisition platforms.

Wang and Smadi 15
Another new technology for pavement distress surveys that is on the horizon is using 3-D laser sensing techniques. It is likely that such new technology may be used to develop fully automated systems for comprehensive surveys of surface distresses. The critical challenge remains in providing real solutions to pavement engineers who can rely on the results in terms of consistency, repeatability, accuracy, and precision. Funded and coordinated research in this area is needed. The recent 3-D imaging technique certainly has shown promise for comprehensive and fully automated survey of pavement condition.
A particularly important area of research is the application of distress protocols (the second component in data interpretation) and the precision and bias analysis associated with the protocols. As data acquisition technology is getting more mature and standardized, data interpretation and related quality assurance and quality control (QA/QC) become an essential task in implementing automated systems for various pavement engineering purposes. REFERENCES 1. McGhee, K. H. NCHRP Synthesis of Highway Practice 334: Automated Pavement Distress
Collection Techniques. Transportation Research Board of the National Academies, Washington, D.C., 2004.
2. Wang, K. C. P. Design and Implementation of Automated Systems for Pavement Surface Distress Survey. In ASCE Journal of Infrastructure Systems, Vol. 6, No. 1, March 2000, pp. 24–32.
3. Fukuhara, T., et al. Automatic Pavement-Distress-Survey System. In ASCE Journal of Transportation Engineering, Vol. 116, No. 3, 1990, pp. 280–286.
4. Fundakowski, R. A., et al. NCHRP Research Results Digest 181: Video Image Processing for Evaluating Pavement Surface Distress, TRB, National Research Council, Washington, D.C., 1991.
5. Monti, M. Large-Area Laser Scanner with Holographic Detector Optics for Real-Time Recognition of Cracks in Road Surfaces. In Optical Engineering, Vol. 34, No. 7, 1995, pp. 2017–2023.
6. Standard Practice for Quantifying Cracks in Asphalt Pavement Surface. AASHTO Designation: PP44-00, 2001.
7. INO. LCMS Product Brochure, Quebec, Canada, 2009. 8. SHRP Report 338: Distress Identification Manual for the Long-Term Pavement Performance Project.
TRB, National Research Council, Washington, D.C., 2003, 4th edition revised.


The National Academy of Sciences is a private, nonprofit, self-perpetuating society of distinguished schol-ars engaged in scientific and engineering research, dedicated to the furtherance of science and technology and to their use for the general welfare. On the authority of the charter granted to it by the Congress in 1863, the Academy has a mandate that requires it to advise the federal government on scientific and techni-cal matters. Dr. Ralph J. Cicerone is president of the National Academy of Sciences.
The National Academy of Engineering was established in 1964, under the charter of the National Acad-emy of Sciences, as a parallel organization of outstanding engineers. It is autonomous in its administrationand in the selection of its members, sharing with the National Academy of Sciences the responsibility for advising the federal government. The National Academy of Engineering also sponsors engineering programsaimed at meeting national needs, encourages education and research, and recognizes the superior achieve-ments of engineers. Dr. Charles M. Vest is president of the National Academy of Engineering.
The Institute of Medicine was established in 1970 by the National Academy of Sciences to secure theservices of eminent members of appropriate professions in the examination of policy matters pertainingto the health of the public. The Institute acts under the responsibility given to the National Academy ofSciences by its congressional charter to be an adviser to the federal government and, on its own initiative,to identify issues of medical care, research, and education. Dr. Harvey V. Fineberg is president of theInstitute of Medicine.
The National Research Council was organized by the National Academy of Sciences in 1916 to associatethe broad community of science and technology with the Academy’s purposes of furthering knowledge andadvising the federal government. Functioning in accordance with general policies determined by the Acad-emy, the Council has become the principal operating agency of both the National Academy of Sciencesand the National Academy of Engineering in providing services to the government, the public, and thescientific and engineering communities. The Council is administered jointly by both Academies and theInstitute of Medicine. Dr. Ralph J. Cicerone and Dr. Charles M. Vest are chair and vice chair, respectively,of the National Research Council.
The Transportation Research Board is one of six major divisions of the National Research Council. Themission of the Transportation Research Board is to provide leadership in transportation innovation andprogress through research and information exchange, conducted within a setting that is objective, interdisci-plinary, and multimodal. The Board’s varied activities annually engage about 7,000 engineers, scientists,and other transportation researchers and practitioners from the public and private sectors and academia, all of whom contribute their expertise in the public interest. The program is supported by state transportation departments, federal agencies including the component administrations of the U.S. Department ofTransportation, and other organizations and individuals interested in the development of transportation.www.TRB.org
www.national-academies.org

TRANSPORTATION RESEARCH BOARD500 Fifth Street, NWWashington, DC 20001