automatic summarization and readability
TRANSCRIPT
COGNITIVE SCIENCE
MASTER THESIS
Automatic summarizationand
Readability
LIU-IDA/KOGVET-A–11/004–SE
Author:Christian [email protected]
Supervisor:Arne JONSSON
List of Figures
2.1 A simplified graph where sentences are linked and weighted ac-cording to the cosine values between them. . . . . . . . . . . . . 10
3.1 Evaluation of summaries on different dimensionalities. The X-axisdenotes different dimensionalities, the Y-axis plots the mean valuefrom evaluations on several seeds on each dimensionality. . . . . . 18
3.2 The iterations of PageRank. The figure depicts the ranks of thesentences plotted on the Y-axis and the iterations on the X-axis.Each series represents a sentence. . . . . . . . . . . . . . . . . . 19
3.3 The iterations of PageRank in different dimensionalities of the RI-space. The figure depicts 4 different graphs, each representing thetrial of a specific setting of the dimensionality. From the left thedimensionalities of 10, 100, 300 and 1000 were used. The ranksof the sentences is plotted on the Y-axis and the iterations on theX-axis. Each series represents a sentence. . . . . . . . . . . . . . 20
3.4 Figures of sentence ranks on different damping factors in PageRank 213.5 Effect of randomness, same text and settings on ten different ran-
dom seeds. The final ranks of the sentences is plotted on the Y,with the different seeds on X. The graph depicts 9 trials at follow-ing dimensionalities, from left: 10, 20, 50, 100, 300, 500, 1000,2000, 10000. . . . . . . . . . . . . . . . . . . . . . . . . . . . . 22
3.6 Values sometimes don’t converge on smaller texts. The left graphdepicts the text in d=100 and the right graph d=20. . . . . . . . . 23
3.7 Figures of stop word usage . . . . . . . . . . . . . . . . . . . . . 243.8 Three different trials on different context window sizes; 1x1 to the
left, 3x3 to the right and 2x2 in the middle . . . . . . . . . . . . . 26
1
List of Tables
2.1 Co-occurrence matrix for the sentence A red car is a vehicle too. . 62.2 LIX-values for different genres. . . . . . . . . . . . . . . . . . . 13
4.1 Results on LIX, OVIX and NR on three different texts at differentsummarization lengths. Significant differences with the values ofthe full texts are in bold. . . . . . . . . . . . . . . . . . . . . . . 33
4.2 Results on Avarage Word Length (AWL), Avarage Sentence Length(ASL), amount of Extra Long Words (XLW) and the number ofnames (PN). Significant differences with the full text are in bold. . 34
2
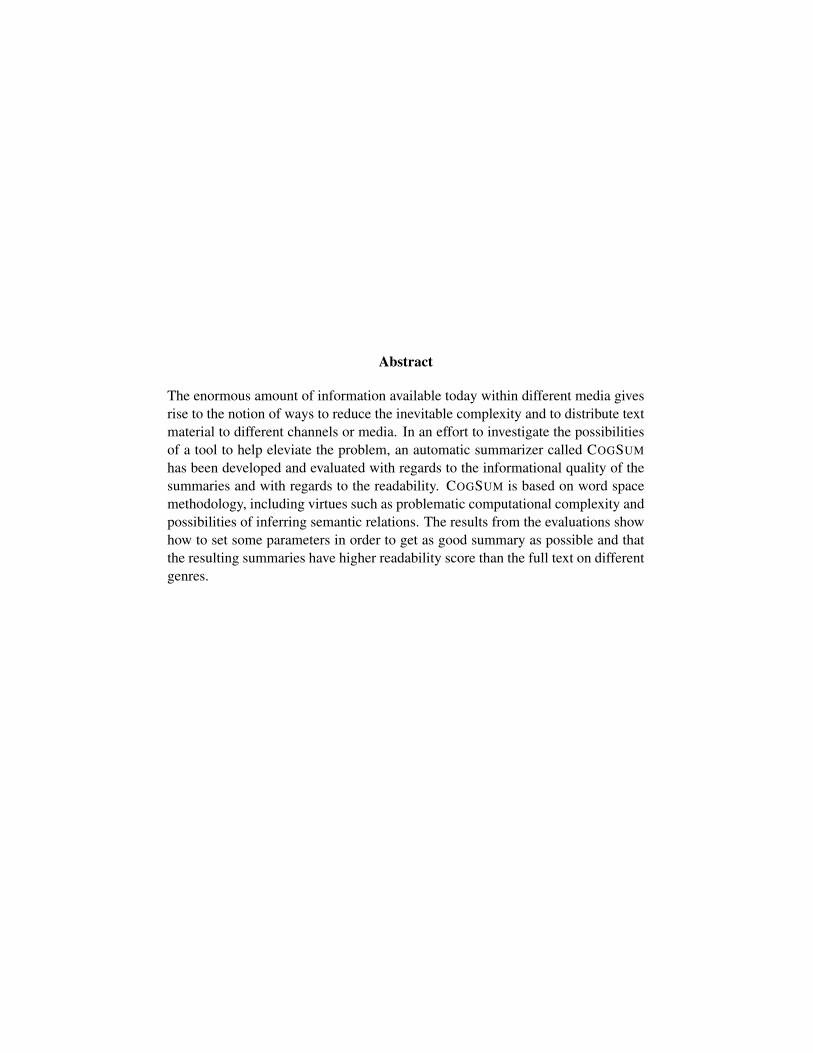
Abstract
The enormous amount of information available today within different media givesrise to the notion of ways to reduce the inevitable complexity and to distribute textmaterial to different channels or media. In an effort to investigate the possibilitiesof a tool to help eleviate the problem, an automatic summarizer called COGSUM
has been developed and evaluated with regards to the informational quality of thesummaries and with regards to the readability. COGSUM is based on word spacemethodology, including virtues such as problematic computational complexity andpossibilities of inferring semantic relations. The results from the evaluations showhow to set some parameters in order to get as good summary as possible and thatthe resulting summaries have higher readability score than the full text on differentgenres.
Contents
1 Introduction 3
2 Background 52.1 The word space model . . . . . . . . . . . . . . . . . . . . . . . 5
2.1.1 Random Indexing . . . . . . . . . . . . . . . . . . . . . . 72.1.2 Dimensionality . . . . . . . . . . . . . . . . . . . . . . . 82.1.3 Stop words . . . . . . . . . . . . . . . . . . . . . . . . . 92.1.4 Focus window . . . . . . . . . . . . . . . . . . . . . . . 9
2.2 Graph-based ranking . . . . . . . . . . . . . . . . . . . . . . . . 102.3 Readability . . . . . . . . . . . . . . . . . . . . . . . . . . . . . 11
2.3.1 What is readability? . . . . . . . . . . . . . . . . . . . . 122.3.2 Formulas . . . . . . . . . . . . . . . . . . . . . . . . . . 122.3.3 A broader view . . . . . . . . . . . . . . . . . . . . . . . 14
3 The summarizer 163.1 Background . . . . . . . . . . . . . . . . . . . . . . . . . . . . . 163.2 Evaluation . . . . . . . . . . . . . . . . . . . . . . . . . . . . . . 17
3.2.1 Dimensionality . . . . . . . . . . . . . . . . . . . . . . . 173.2.2 Randomness . . . . . . . . . . . . . . . . . . . . . . . . 203.2.3 A text that is too small . . . . . . . . . . . . . . . . . . . 223.2.4 Stop words . . . . . . . . . . . . . . . . . . . . . . . . . 243.2.5 Context window . . . . . . . . . . . . . . . . . . . . . . 25
3.3 Discussion . . . . . . . . . . . . . . . . . . . . . . . . . . . . . . 25
4 Readability experiments 294.1 Readability of summaries . . . . . . . . . . . . . . . . . . . . . . 294.2 Results . . . . . . . . . . . . . . . . . . . . . . . . . . . . . . . . 30
1
5 Discussion 355.1 Readability discussion . . . . . . . . . . . . . . . . . . . . . . . 355.2 Conclusions . . . . . . . . . . . . . . . . . . . . . . . . . . . . . 365.3 Future work . . . . . . . . . . . . . . . . . . . . . . . . . . . . . 36
References 38
2
Chapter 1
Introduction
In todays’ society, information is of essence and means of easily acquiring saidinformation is an important area of research. The information should further beaccessible to all humans regardless of handicaps or difficulties with language. Fur-ther, the web makes the information available everywhere at any time by anyoneand published documents get visible instantly. The sheer amount of informationgives rise to the notion of ways to reduce the inevitable complexity and togetherwith the possibility of distributing text material to different channels or even media,some way of tailoring text encounters is desired.
To analyze the impact of a text on a reader, some analysis of the texts withregards to the perceived work load required by the reader is required. The notionof readability comes to mind, with research dating back to the 1920’s. Researchhave through the years focused on investigating how readability can be measured,preferably automatically and how that correlates with the subjective experiencewithin the reader. Properties within the text are often the focus, but the individualprerequisites should not be neglected.
The fact is, groups of readers are largely heterogeneous and individual adap-tations might be required in order for text material be more easy to read. Further,types of texts might need to be treated differently as there is a difference in howtexts are structured, the lengths of the texts, the media it is supposed to be readupon, etc.
One way of reducing the complexity of texts regardless of type or length issimply to reduce the amount of text to be read, thereby hopefull reducing the effortrequired by the reader. Due to the enormous amount of information available andthe fact that it is an extremely time consuming task to do by hand, some way ofautomatically shortening the text without loosing too much information would bedesired.
3
Automatic summarization is a challenging task however, especially if the pro-cess need to be quick, portable, independent of text type and genre and preferablylanguage independent. If the summaries further can be tailored for different groupsof people, big steps can be taken with regards to the accessability of information.Hopefully, by shorten texts automatically, it is possible to make texts easier to readas well as distributable to different medias, which is a start (or continuation) of amore accessible information society.
The work described in this thesis covers an automatic summarizer called COG-SUM and some experiments regarding the readability of the resulting summarieson different lengths and text types, as well as some investigations on how the sum-marizer performs under different settings.
The purpose of the thesis is to review the word space technique behind thepreviously developed automatic summarizer called COGSUM(Jonsson et al., 2008)and to optimize its’ performance, as well as to evaluate the readability of the re-sulting summaries. This is done through some experiments investigating the read-ability of Swedish texts of different genres, by using several automatic readabilitymeasures.
The thesis is laid out as follows. First, a theoretical background on the tech-niques used by the summarizer followed by a more detailed description of the de-veloped summarizer. An overview of readability and automatic measures thereof isprovided, with focus on the Swedish language. The summarizer is then explainedin more detail, together with some evaluation of its’ performance. The remain-der contains various experiments on readability of the summaries created by thesummarizer and their results.
4
Chapter 2
Background
In this chapter an overview of word spaces is presented, followed by some ex-amples of implementations, with focus on Random Indexing which is one of thetechniques used by COGSUM. Also, different parameter settings of word spacesthat may have an impact on the quality of the summaries are reviewed. A briefoverview of graph-based ranking is also provided. Background on readability ispresented lastly.
2.1 The word space model
The word space model, or vector space model (Elden, 2007), uses a spatial metaphorof a word’s meaning (Sahlgren, 2006). The core idea is that semantic similar-ity can be measured by proximity in an n-dimensional space, where n can reachmillions. More specifically, word spaces acts under the distributional hypothesisand the proximity hypothesis. In the distributional hypothesis, words with similardistributional characteristics, or words that occur in similar contexts have similarmeanings. In essence, a word is the sum of it’s contexts and the context is the sumof its’ words. The context can be defined as some surrounding words or even an en-tire document or even corpus. The proximity hypothesis states that words close toeach other in the word space have similar meaning while those far from each otherhave dissimilar meaning. Word spaces thus relies on distributional characteristicsof words according to their contexts.
Practically, every word in a given context occupies a specific point in the spaceand has a vector associated to it that defines its meaning. One way of creating sucha vector is to look at the co-occurence information of the words and plot it in amatrix. Each element in such a matrix tells of the co-occurance of the word onthe specific row, the value will be 0 if the word doesn’t occur with the word in the
5
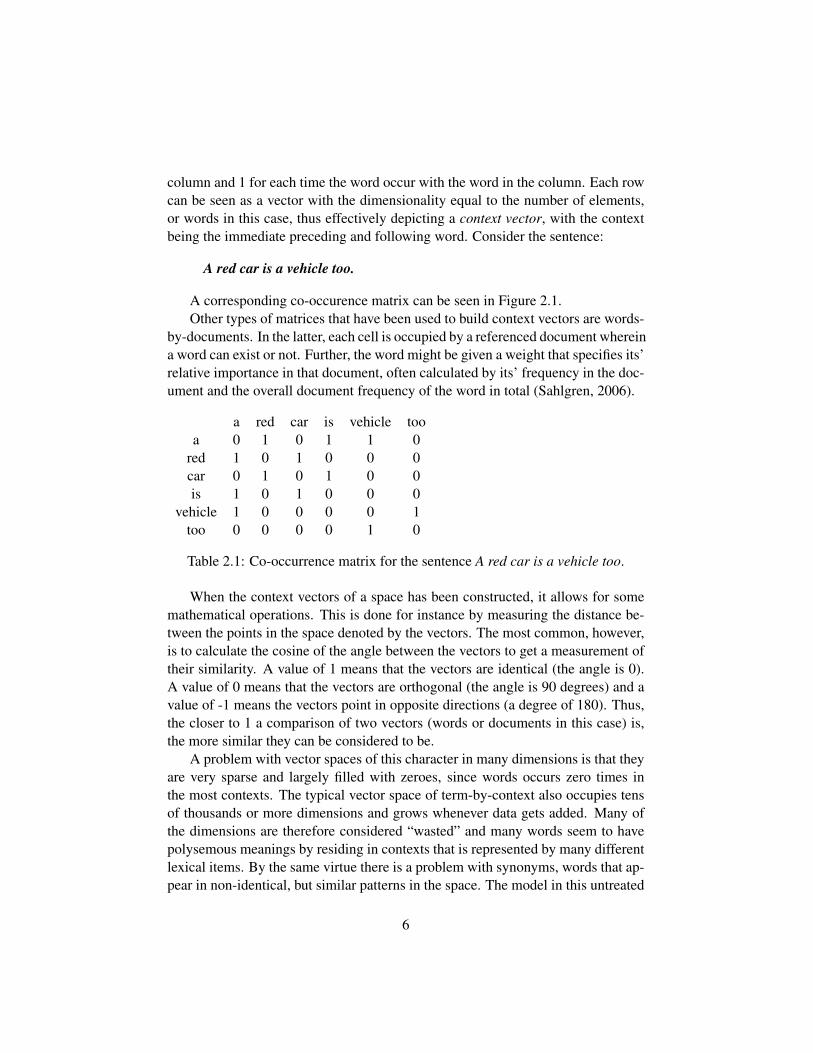
column and 1 for each time the word occur with the word in the column. Each rowcan be seen as a vector with the dimensionality equal to the number of elements,or words in this case, thus effectively depicting a context vector, with the contextbeing the immediate preceding and following word. Consider the sentence:
A red car is a vehicle too.
A corresponding co-occurence matrix can be seen in Figure 2.1.Other types of matrices that have been used to build context vectors are words-
by-documents. In the latter, each cell is occupied by a referenced document whereina word can exist or not. Further, the word might be given a weight that specifies its’relative importance in that document, often calculated by its’ frequency in the doc-ument and the overall document frequency of the word in total (Sahlgren, 2006).
a red car is vehicle tooa 0 1 0 1 1 0
red 1 0 1 0 0 0car 0 1 0 1 0 0is 1 0 1 0 0 0
vehicle 1 0 0 0 0 1too 0 0 0 0 1 0
Table 2.1: Co-occurrence matrix for the sentence A red car is a vehicle too.
When the context vectors of a space has been constructed, it allows for somemathematical operations. This is done for instance by measuring the distance be-tween the points in the space denoted by the vectors. The most common, however,is to calculate the cosine of the angle between the vectors to get a measurement oftheir similarity. A value of 1 means that the vectors are identical (the angle is 0).A value of 0 means that the vectors are orthogonal (the angle is 90 degrees) and avalue of -1 means the vectors point in opposite directions (a degree of 180). Thus,the closer to 1 a comparison of two vectors (words or documents in this case) is,the more similar they can be considered to be.
A problem with vector spaces of this character in many dimensions is that theyare very sparse and largely filled with zeroes, since words occurs zero times inthe most contexts. The typical vector space of term-by-context also occupies tensof thousands or more dimensions and grows whenever data gets added. Many ofthe dimensions are therefore considered “wasted” and many words seem to havepolysemous meanings by residing in contexts that is represented by many differentlexical items. By the same virtue there is a problem with synonyms, words that ap-pear in non-identical, but similar patterns in the space. The model in this untreated
6
way fails to generalize between terms that have non-identical patterns but couldstill be quite similar. Therefore it is practical to apply some form of dimensionreduction or factor analysis to get a condensed representation of the space withco-occurrence patterns more elevated.
A word space can be implemented in several ways (Latent Semantic Analysis(LSA), Hyperspace Analogue to Language(HAL), Random Indexing (RI) to namea few) all using some kind of dimension reduction to increase the effectiveness ofthe space’s semantic modelling and for the sake of computational efficiency.
In LSA, Singular Value Decomposition (SVD) is used to reduce the dimension-ality. SVD is a matrix factorization technique that compresses the sparse space intoa new space of much smaller dimensionality (a couple of hundred), while keepingthe majority of the information intact. Many of the dimension lies latent when theyare compressed due to the nature of SVD, so that vectors with similar contextsare grouped together. This makes for the possibiliy to find occurences with simi-lar contexts that are non-identical, as well as a more managable space with fewerdimensions. Further, LSA uses a words-by-documents matrix with entropy-basedweighting of the words (words containing much information is weighted higher).Latent Semantic Analysis can however be computationally demanding, much dueto SVD. Gorrell (2006) proposes the use of Generalised Hebbian Learning forSVD to improve scalability.
Other methods to reduce the computational cost of LSA includes for instanceRandom Projection (Papadimitriou, Raghavan, Tamaki, & Vempala, 2000). Thistechnique takes the LSA words-by-document matrix and projects it onto a randommatrix of much lower dimensionality, where the distances between the points inthe space are approximately preserved. SVD is then performed on the projectedmatrix, with a substantial gain in processing time as a consequence.
Hyperspace Analogue to Language (HAL) uses a different approach, with a di-rectional word-by-words co-occurence matrix. This directional matrix accounts forthe words appearing after the word in focus, with a weight associated with it basedon the distance. Each row-column pair in the matrix is then concatenated to a vec-tor with a dimensionality twice as large as the vocabulary. If the dimensionaliteygets too large to handle, a dimension reduction step is performed which discardsthe words that have the lowest variance, reaching 100-200 effective dimensions.
Random Indexing is another word space approach which presents an efficient,scalable and incremental alternative to standard word space methods.
2.1.1 Random Indexing
Random Indexing emerged from a family of dimension reduction techniques, in-cluding that of Random Projection (Sahlgren, 2005). Random Indexing is further
7
based on sparse distributed representations (Kanerva, 1988), a mathematical ap-proach of representing human memory in an n-dimensional space. The basic ideaof Random Indexing is to accumulate context vectors based on the occurrence ofwords in contexts. This technique can be used with any type of linguistic context, isinherently incremental, and does not require a separate dimension reduction phaseas for instance Latent Semantic Analysis.
Random Indexing can be described as a two-step process:
Step 1 A unique d-dimensional index vector is assigned and randomly generatedto each context (e.g. each document or each word). These index vectors aresparse and high-dimensional. They consist of a small number, ρ, of randomlydistributed +1s and -1s, with the rest of the elements of the vectors set to 0.
Step 2 Context vectors are produced on-the-fly. As scanning the text, each timea word occurs in a context (e.g. in a document, or within a sliding contextwindow, w), that word’s d-dimensional index vector is added to the contextvector for the word in focus. Words are thus represented by d-dimensionalcontext vectors that are effectively the sum of the index vectors of all thecontexts in which the word appears.
Random Indexing poses several advantages over other word space techniques.No further dimension reduction technique is necessary, since the dimensionalityis set beforehand to a much lower value than the number of contexts. Since thetechnique also is incremental, only a couple of examples need to be encounteredbefore similarity computations are possible, when other techniques need to collectan entire dataset.
2.1.2 Dimensionality
Word spaces are often used on large data sets to get a good semantic representationof meaning. When dealing with large data sets, there is also a constant trade offbetween the quality of the word space and the complexity of it, affecting further op-erations within a reasonable processing time and storage space. Dimensionality isa parameter that has a large effect on time and storage, which is why several meth-ods are proposed to reduce it. Much of the debate regarding word space is aboutwhat dimensionality to choose (Karlgren, Holst, & Sahlgren, 2008). The choiceof dimensionality is often 100 for LSA and 1000 for Random Indexing (Karlgrenet al., 2008), numbers that are acquired through trial and error on synonym tests.Karlgren and Sahlgren (2001) uses a dimensionality of 1800 to perform a TOEFL-test with good results. It is noted that what dimensionality to use is dependent
8
on the size of the text material and Chatterjee and Mohan (2007) uses a dimen-sionality of 100 for smaller documents of a couple of hundred words. In the taskof automatic summarization however, Hassel (2007) performs experiments on dif-ferent dimensionalities of Random Indexing and concludes that the dimensionalitydoesn’t have a large impact on the quality of the extracts and that the random factorwhen creating the indexes is larger.
2.1.3 Stop words
The use of stop words has also been through some debate. By removing extremelyhigh frequent words it is possible to drastically reduce the size of a text thus makingit easier to handle computationally. The notion is that words that occurs in manydifferent context doesn’t add anything important to the meaning of the text and thuscan be removed. Stop words often include words like prepositions, pronouns andparticiples. Not only does the text get computationally more managable, in somecases the quality of the word space may be increased by removing stop words(Hassel, 2007). In words-by-documents matrices or entire document queries stopwords might be important to remove, because those words doesn’t help to distin-guish documents (Elden, 2007). Conversely, other sources have used the most com-mon words as important to denote the style in the text (Campbell, January 2003)rather than semantic content, indicating that the choice of what words should beincluded the space depends on what information one wants to provide.
2.1.4 Focus window
The size of the focus window is effectively the size of the context of each word.For instance, a window size of 5x5 denotes a context consisting of the five preced-ing words of the current focus word and the five following. The context can alsobe weighted so that words that are closer to the focus word gets a higher weightwhile those further away get lesser weight. One example of weighting is the in-verse of the distance of the focus word to neighbouring words where the weightsof a 3x3 window would look like [0.25, 0.33, 0.5, 0, 0.5, 0.33, 0.25]. Another ex-ample is according to the formula 21−l where l is the distance to the focus word,giving a weighting vector [0.125, 0.25, 0.5, 1, 0, 1, 0.5, 0.25, 0.125] which gives amore aggressive falloff of the values where words closer to the focus words areconsidered more important. For determining syntactic category of a word, narrowcontext windows (1x1) with aggressive weighting is better, while a larger window(2x2, 3x3) gives better results when inferring semantic relations (Sahlgren, 2006).
9
2.2 Graph-based ranking
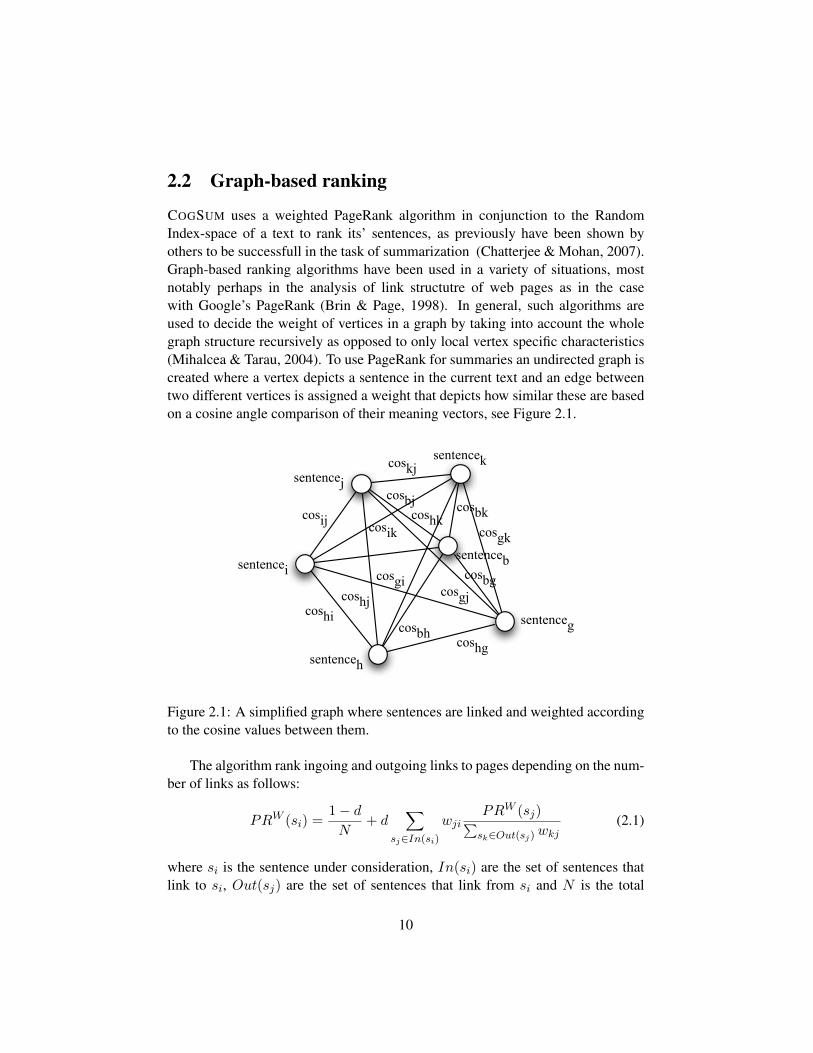
COGSUM uses a weighted PageRank algorithm in conjunction to the RandomIndex-space of a text to rank its’ sentences, as previously have been shown byothers to be successfull in the task of summarization (Chatterjee & Mohan, 2007).Graph-based ranking algorithms have been used in a variety of situations, mostnotably perhaps in the analysis of link structutre of web pages as in the casewith Google’s PageRank (Brin & Page, 1998). In general, such algorithms areused to decide the weight of vertices in a graph by taking into account the wholegraph structure recursively as opposed to only local vertex specific characteristics(Mihalcea & Tarau, 2004). To use PageRank for summaries an undirected graph iscreated where a vertex depicts a sentence in the current text and an edge betweentwo different vertices is assigned a weight that depicts how similar these are basedon a cosine angle comparison of their meaning vectors, see Figure 2.1.
cosij
coshjcoshi
cosbj
coskj
cosgisentencei
sentenceb
sentenceh
sentenceksentencej
sentenceg
cosbk
cosbg
cosbh
cosik
coshg
cosgj
cosgk
coshk
Figure 2.1: A simplified graph where sentences are linked and weighted accordingto the cosine values between them.
The algorithm rank ingoing and outgoing links to pages depending on the num-ber of links as follows:
PRW (si) =1− d
N+ d
∑sj∈In(si)
wjiPRW (sj)∑sk∈Out(sj)wkj
(2.1)
where si is the sentence under consideration, In(si) are the set of sentences thatlink to si, Out(sj) are the set of sentences that link from si and N is the total
10
number of sentences. df is the damping factor.The damping factor is originally set to account for the possibility of a surfer
clicking a ”random web link when he gets bored” (Brin & Page, 1998). Withregards to the ranking of sentences, we see the damping factor as the possibility of asentence containing some implicit information that a certain reader might considermore important at the time. This is much in line with (Mihalcea & Tarau, 2004)that argues that the process can be seen as “text surfing” much alike “web surfing”;connected concepts exists through the discourse that can be followed via semanticor lexical links and that there are related facts spread out that ties the discoursetogether.
In COGSUM the vectors for whole sentences and the similarity between theseand the average document vector are of interest. The average document vector iscalculated by dividing the total document vector, which consists of the sum of allunique words’ context vectors, with the number of unique words in the documentfollowing the formula 2.2
~doc =1
N
N∑i=1
~wi (2.2)
where N denotes the number of unique words.The sentence vectors are then calculated by subtraction of the average doc-
ument vector from the context vectors of the words in the sentence which aresummed together and divided by the number of words in the sentence as in theformula 2.3.
~sentj =1
S
S∑i=1
( ~wi − ~doc) (2.3)
where S denotes the number of words in sentence j.The computation of the algorithm is carried out on all sentences iteratively until
node weights converge. Sentences with similar content will then contribute withpositive support to each other. This does not exclusively depend on the numberof sentences supporting a sentence, but also on the rank of the linking sentences.This means that a few high-ranked sentences provide bigger support than a greaternumber of low-ranked sentences. This leads to a ranking of the sentences by theirimportance to the document at hand and thus to a summary of desired length onlyincluding the most important sentences.
2.3 Readability
In this section some notions of readability is presented, along with some ways ofmeasuring them. The measurements that are examplified are all automatic and have
11
in commmon that they in one way or another correlates with human understandingof the readability of texts.
2.3.1 What is readability?
Generally, easy-to-read material is characterized by simple straightforward lan-guage without necessarily being simplistic or childish. Linguistically, this can beachieved by removing grammatical features while keeping close to the originalmeaning of the text, thus reducing the effort required by the reader to get the sameinformation as in the original text. These features can operate on a syntactic, lexicalor textual level to make text material more readable and comprehensible (Muhlen-bock & Kokkinakis, 2009). Research on readability have been carried out since the1920’s, mainly in the US. The early work focused on vocabulary elements such asword length, percentage of multisyllabic words, subordinate clauses etc. Readabil-ity can also be seen from various angles. In part, it is the extent to which the readercan understand a written text, and the psychological processes involved within thereader. Here, focus lies on individual shortcomings with regards to perception andunderstanding of the written text and not on the text itself. Readability can alsobe seen as a measurable property of a given text where the individual prerequisitesin terms of psychological abilities are often neglected. The latter have long beenpursued as it has been useful to draw statistical conclusions on readaility in experi-ments. This have provided several formulas for different languages that have madeautomatic measures possible on larger texts.
2.3.2 Formulas
Formulas of readability for English is abundant, e.g. The Flesch Reading Ease For-mula, Flesch-Kincaid Grade Level, Dale-Chall, the Coleman-Liau test, GunningFog and SMOG (DuBay, 2004).
The Flesch Reading Easy score can be computed as:
Score = 206.835− (1.015× n(w)
n(s))− (84.6×ASW ) (2.4)
where n(w) denotes the number of words, n(s) the number of sentences andASWthe number of syllables.
The measures correspond to how understandable a text is, e.g. a Flesch ReadingEasy score between 70 and 80 is ”Fairly Easy” which means that the text can easilybe understood by a (U.S.) 7th grade student. The Flesch-Kincaid Grade level isa U.S. grade level version that normalizes (2.4) to correspond to readability forstudents in various grades.
12
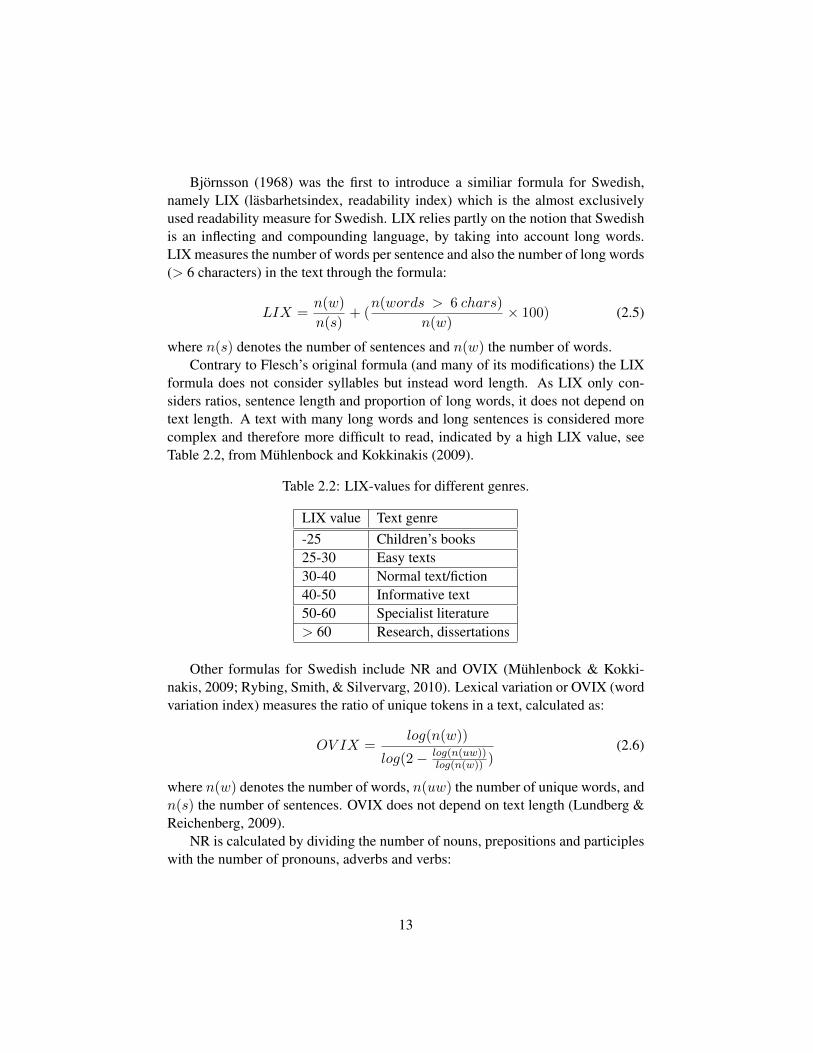
Bjornsson (1968) was the first to introduce a similiar formula for Swedish,namely LIX (lasbarhetsindex, readability index) which is the almost exclusivelyused readability measure for Swedish. LIX relies partly on the notion that Swedishis an inflecting and compounding language, by taking into account long words.LIX measures the number of words per sentence and also the number of long words(> 6 characters) in the text through the formula:
LIX =n(w)
n(s)+ (
n(words > 6 chars)
n(w)× 100) (2.5)
where n(s) denotes the number of sentences and n(w) the number of words.Contrary to Flesch’s original formula (and many of its modifications) the LIX
formula does not consider syllables but instead word length. As LIX only con-siders ratios, sentence length and proportion of long words, it does not depend ontext length. A text with many long words and long sentences is considered morecomplex and therefore more difficult to read, indicated by a high LIX value, seeTable 2.2, from Muhlenbock and Kokkinakis (2009).
Table 2.2: LIX-values for different genres.
LIX value Text genre-25 Children’s books25-30 Easy texts30-40 Normal text/fiction40-50 Informative text50-60 Specialist literature> 60 Research, dissertations
Other formulas for Swedish include NR and OVIX (Muhlenbock & Kokki-nakis, 2009; Rybing, Smith, & Silvervarg, 2010). Lexical variation or OVIX (wordvariation index) measures the ratio of unique tokens in a text, calculated as:
OV IX =log(n(w))
log(2− log(n(uw))log(n(w)) )
(2.6)
where n(w) denotes the number of words, n(uw) the number of unique words, andn(s) the number of sentences. OVIX does not depend on text length (Lundberg &Reichenberg, 2009).
NR is calculated by dividing the number of nouns, prepositions and participleswith the number of pronouns, adverbs and verbs:
13
NR =n(noun) + n(prep) + n(part)
n(pro) + n(adv) + n(v)(2.7)
where n(noun) denotes the number of nouns, n(prep) the number of prepositions,n(part) the number of participles, n(pro) the number of pronouns, n(adv) thenumber of adverbs, and n(v) the number of verbs.
A higher NR indicates a more professional and stylistically developed text,while a lower value indicate more simple and informal language. In some contextsa low NR can indicate a narrative style, such as in children’s books.
2.3.3 A broader view
These measures can by themselves correlate with the perceived readability of atext, however, they should not be seen as the only way of specifying the readabilityof a text. One problem is that they cover only certain parts of what constitutesreadability. Another difficulty in assessing methods for measures of readability isthe hetergenuosity of the different groups of readers (Muhlenbock & Kokkinakis,2009). LIX has therefore been considered insufficient for a complete readabilityassessment of a text as it is based only on the surface structureof the text. LIXwas originally developed to assess the readability of school books and might notalways be applicable and should be used with caution. Even though long wordsare considered as an indication on the readability of a text, short words can not beneglected simply as ”easy”. Bernhardt (1984) tested for the relationship betweenword length and difficulty in second language readers and found that words suchas the, them, they, their, these are difficult despite their short length, much thanksto their graphemic similarity. Eye-movement studies have shown that prepositionsand articles are processed for an excess time of >1000 milliseconds, three timeslonger than for longer words.
Chall (1958) concluded that there are generally four types of elements thatseem to be significant for a readability criteria; vocabulary load, sentence struc-ture, idea density and human interest and further states that vocabulary is of primeimportance for readability, that is, the number of difficult words in a text is highlydeterminate of the readability. However, even if the number of difficult words inthe text is stated as an important factor, it takes a large amount of difficult wordsfor the readability to decrease. Therefore, it might be a mistake to interpret corre-lations between the results of vocabulary tests and reading profiency and to statevocabualry as such an important factor in text comprehension(Freebody & Ander-son, 1983). Duffy and Kabance (1982) also found that a simplified vocabulary andsentences hade little to no effect on the performance on comprehension even thoughformulas such as Flesch-Kincaid stipulates this. They state that word and sentence
14
difficulty is of correlative but not causative factors in comprehension (Duffy &Kabance, 1982).
A way of getting a better view of a text’s readability is to map the psycho-logical criteria of the individual with several measurable readability properties ofa text. This is done by mapping Chall’s elements of readability to the automaticmeasures (Muhlenbock & Kokkinakis, 2009). LIX is for instance mapped to vo-cabulary load. Further, in an effort to enhance the LIX formula, Muhlenbock andKokkinakis (2009) have included an additional parameter called Extra Long Words(XLW). Extra Long Words are words with more than 14 characters and indicates alarger proportion of compounds of usually three or more stems, relatively commonin Swedish. OVIX can be used to indicate the idea density, in conjunction with thenominal ratio (NR). The degree of human interest is measured simply through theproportion of proper nouns (PN) and by measuring the length of sentences (ASL),sentence structure can broadly be gathered (Muhlenbock & Kokkinakis, 2009).
This way, a wider application of the measures is applied and by taking intoaccount additional parameters, a better view of a text’s readability can be achieved.
15
Chapter 3
The summarizer
This chapter reviews in more detail how the summarizer performs when summa-rizing texts.
3.1 Background
COGSUM is based on Random Indexing (RI) and PageRank to rank the sentencesin a text according to importance. When the text has been processed using RI andPageRank, the most important sentences are extracted, for instance 30% of theoriginal text, resulting in a condensed version of the original text with the mostimportant information intact. Since all sentences are ranked, the length of thesummary is easy to specify. It is important to note that the algorithm only takesthe current document as total context and the information within the document,without any knowledge from an outside corpus. This makes it highly portableto different domains, genres and languages (Mihalcea & Tarau, 2004). It is furtherbased on Java and uses the RI toolkit available at (Hassel, 2011). Initial evaluationsof COGSUM with human users show that summaries produced by COGSUM areuseful and considered informative enough (Jonsson et al., 2008). COGSUM hasalso been evaluated on gold standards for news texts and authority texts showingthat it is better than another Swedish summarizer (SweSum, Dalianis et al. (2003))on authority texts and almost as good on news texts, texts that the other summarizerwas especially adapted to handle (Gustavsson & Jonsson, 2010).
Previous studies have recommended a certain setting on some parameters, mainlydimensionality, for texts of a particular length. The next section describes some tri-als to optimize the dimensionality for larger texts using the PageRank method, asresearch on the matter is sparse. It is suspected that different settings provide sum-maries of different qualities.
16
3.2 Evaluation
The traditional way of dealing with word spaces is to build a space on a very largedata set to get a good statistically sound representation of the meaning of words.The method proposed by Chatterjee and Mohan (2007) that is used in COGSUM
uses word spaces that are constructed only on a local much smaller context usingonly the document to be summarized rather than an outside training corpus. Thesentences in a text are instead ranked by an iterative process of recommendation sothat a summary can be extracted, thus how the settings of the word space affect thesummaries is in this sense unclear. To investigate how the parameters affected therelatively small space with regards to the quality of the summaries, some experi-ments were performed.
3.2.1 Dimensionality
The impact of dimensionality to the quality of the summaries were evaluated, as re-search on the matter on smaller texts is sparse. As previous studies (Gustavsson &Jonsson, 2010; Chatterjee & Mohan, 2007) have shown, for shorter texts (200-300words) a dimensionality of 100 is sufficient. It is unclear, however, how the dimen-sionality should be set when the text size increase to a size of about 500 words ormore, such as often is the case with informative authority texts. Gustavsson andJonsson (2010) used the dimensionality 250 to preserve a dimensionality reduc-tion of 50% as in the case with smaller texts at 100 dimensions. Except for thedimensionality, the recommended context window size is 2x2 with a weighting of[0.5, 1, 0, 1, 0.5].
One way to test what dimensionality that should be chosen is simply to sum-marize texts using different dimensionality and then test the resulting texts againsta gold standard to check correspondence with humans. To evaluate the summaries,AutoSummENG (Giannakopoulos, Karkaletsis, Vouros, & Stamatopoulos, 2008)was used to compare the summaries on different parameter settings to a goldstandard (manually created summaries which are considered optimal) created byCarlsson (2009). AutoSummENG is an evaluation system that compares graph n-gram similarities between different texts to get a value on how similar they are. Itallows for a several texts (summaries) to be compared with several target texts (goldstandard texts developed by humans) and get a value denoting the performance ofthe summarizer.
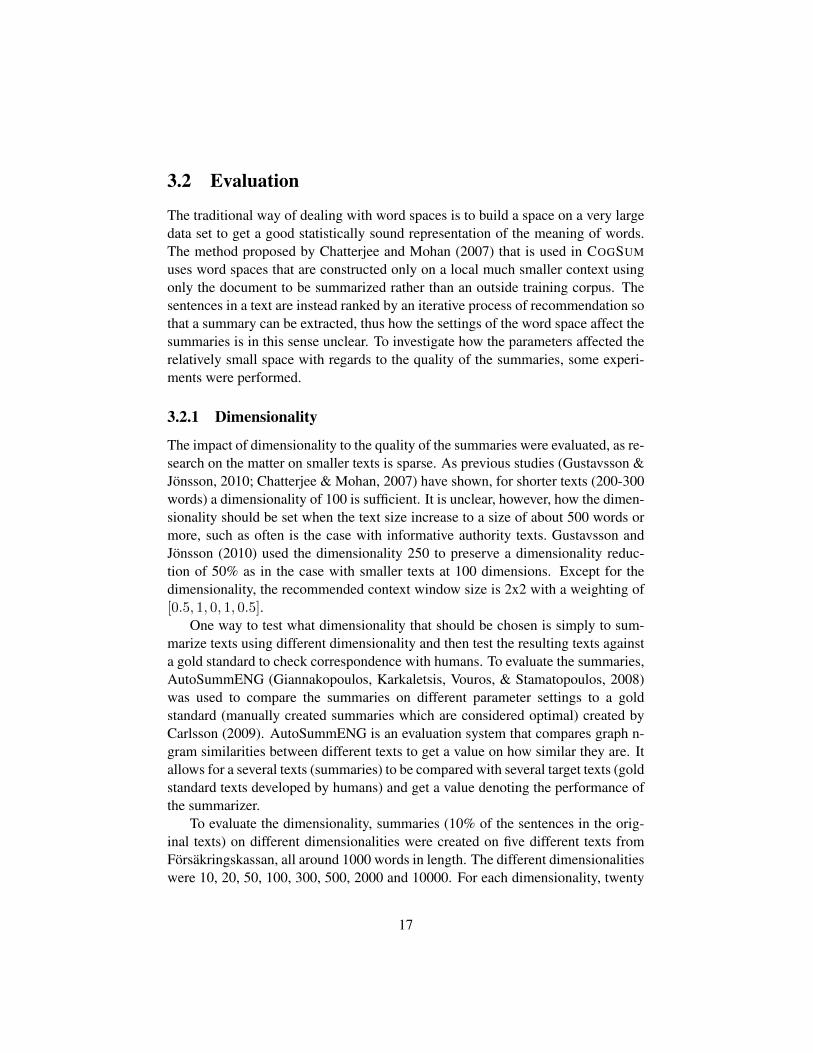
To evaluate the dimensionality, summaries (10% of the sentences in the orig-inal texts) on different dimensionalities were created on five different texts fromForsakringskassan, all around 1000 words in length. The different dimensionalitieswere 10, 20, 50, 100, 300, 500, 2000 and 10000. For each dimensionality, twenty
17
different summaries were created on different random seeds, each compared to thegold standard. The avarage score of the summaries on the different seeds are shownin figure 3.1. A dimensionality of 100 performed best (0.320) while worst at 10000(.297). At 10 the results were .298. As a comparison, randomly selected sentencesperforms at (.236).
10 20 50 100 300 500 1000 2000 10000 Random
Dimensionality
0,22
0,24
0,26
0,28
0,3
0,32
0,34
Auto
Sum
mEN
G m
ean
Figure 3.1: Evaluation of summaries on different dimensionalities. The X-axis de-notes different dimensionalities, the Y-axis plots the mean value from evaluationson several seeds on each dimensionality.
The results indicate that dimensionality doesn’t have a large impact on thequality of the summaries, see 3.1, as long as it is within a certain range. This isin agreement with Hassel (2007) who states that the random factor when buildingindexes is higher than the factor of dimensionality, as long as the dimensionality islarge enough.
To further experiment with the behaviour and to find alternate means of inves-tigating the effect of dimensionality, some additional experiments were performed.By visualizing each step in the ranking process, the behaviour of the PageRank al-gorithm when dealing with different parameters could be investigated. This was tohopefully get a better view of how some of the parameters are affecting the creationof the summary, and how one can evaluate the impact of parameters. The rankingof the sentences were plotted on each iteration of the algorithm for different set-tings of the parameters.
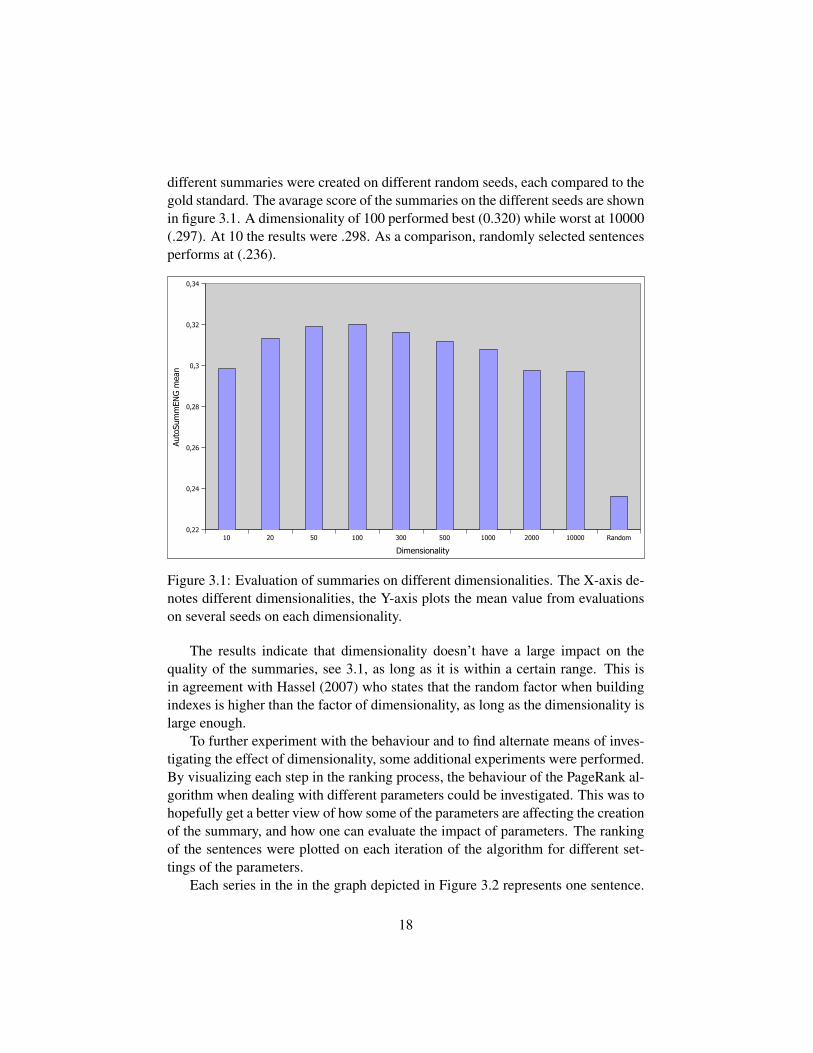
Each series in the in the graph depicted in Figure 3.2 represents one sentence.
18
The Y-axis includes the value of the sentences in the graph during the PageRank-algorithm; the higher the value, the more important a sentence is in the document.On the X-axis, each iteration is plotted. All sentences begin at zero before any iter-ations have been performed and the PageRank-algorithm is then iterated 50 times.Some sentences get a lower value each iteration while others get a higher value. Bytwenty or so iterations, the values stop changing (or the changes are really small)and have thus converged; no further iterations are necessary. Depending on thesetting of for instance dimensionality, it should be possible to spot differences inhow the graphs develop in terms of ranking of the sentences, if the parameters havean effect on the comparison process (cosine-measure between sentences).
1 2 3 4 5 6 7 8 9 10 11 12 13 14 15 16 17 18 19 20
Iterations
−0,5
0
0,5
1
1,5
2
Gra
ph v
alue
Figure 3.2: The iterations of PageRank. The figure depicts the ranks of the sen-tences plotted on the Y-axis and the iterations on the X-axis. Each series representsa sentence.
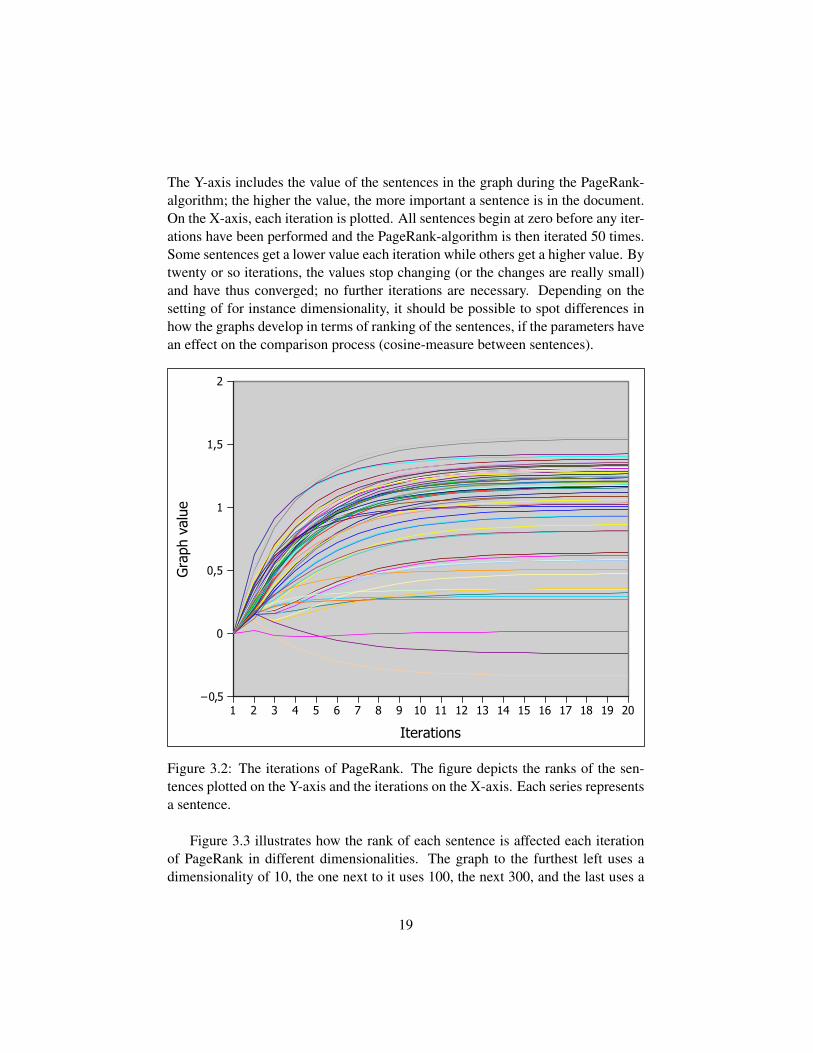
Figure 3.3 illustrates how the rank of each sentence is affected each iterationof PageRank in different dimensionalities. The graph to the furthest left uses adimensionality of 10, the one next to it uses 100, the next 300, and the last uses a
19
dimensionality of 1000.
−1
−0,5
0
0,5
1
1,5
2
Figure 3.3: The iterations of PageRank in different dimensionalities of the RI-space. The figure depicts 4 different graphs, each representing the trial of a specificsetting of the dimensionality. From the left the dimensionalities of 10, 100, 300and 1000 were used. The ranks of the sentences is plotted on the Y-axis and theiterations on the X-axis. Each series represents a sentence.
There seems in this isolated case to be a difference in how the sentences areseparated in a dimensionality of 10 compared to a dimensionality of 100 for in-stance. Between 100 and 300 there is also a difference, although seemingly smaller.Between 300 and 1000 there is an even smaller difference. Nonetheless, as thealgorithm proceeds through the iterations the sentence ranks is separated and con-vergence happen after ≈ 15− 20 iterations.
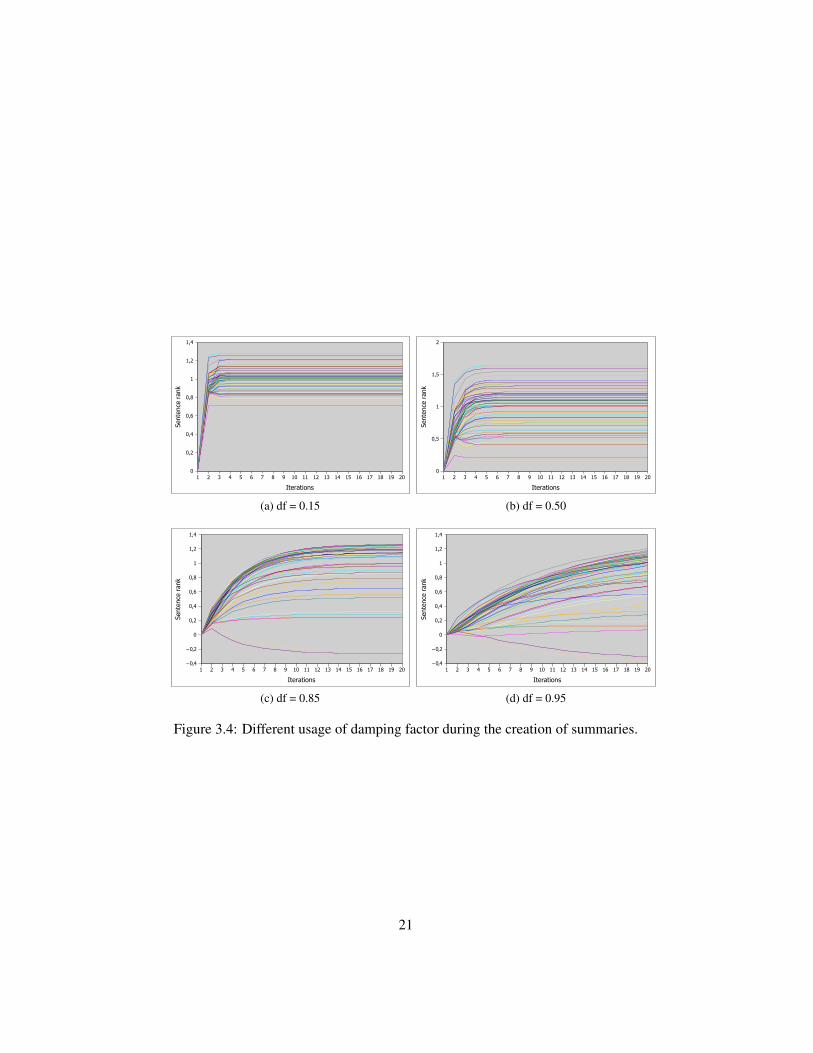
In the Figure 3.4 the same thing is plotted, the sentence ranks on Y and iter-ations on X, in this case however the damping factor is altered in the PageRankalgorithm on a static dimensionality of 100. The graphs use a damping factor (df )of df = .15, df = .50, df = .85 and df = .95 respecitvely. Note that at .15 thevalues converge already after 3 iterations while at .95, it takes much longer.
3.2.2 Randomness
In order to test the effect of the randomness in the space, the same settings on 10different random seeds were used for d=10 up to d=10000 (Figure 3.5). A seed canbe used to make sure that the same random numbers are generated each time. Bychanging the seed it can be specified when the random numbers should be different
20
1 2 3 4 5 6 7 8 9 10 11 12 13 14 15 16 17 18 19 20
Iterations
0
0,2
0,4
0,6
0,8
1
1,2
1,4
Sent
ence
ran
k
(a) df = 0.15
1 2 3 4 5 6 7 8 9 10 11 12 13 14 15 16 17 18 19 20
Iterations
0
0,5
1
1,5
2
Sent
ence
ran
k
(b) df = 0.50
1 2 3 4 5 6 7 8 9 10 11 12 13 14 15 16 17 18 19 20
Iterations
−0,4
−0,2
0
0,2
0,4
0,6
0,8
1
1,2
1,4
Sent
ence
ran
k
(c) df = 0.85
1 2 3 4 5 6 7 8 9 10 11 12 13 14 15 16 17 18 19 20
Iterations
−0,4
−0,2
0
0,2
0,4
0,6
0,8
1
1,2
1,4
Sent
ence
ran
k
(d) df = 0.95
Figure 3.4: Different usage of damping factor during the creation of summaries.
21
−1
−0,5
0
0,5
1
1,5
2
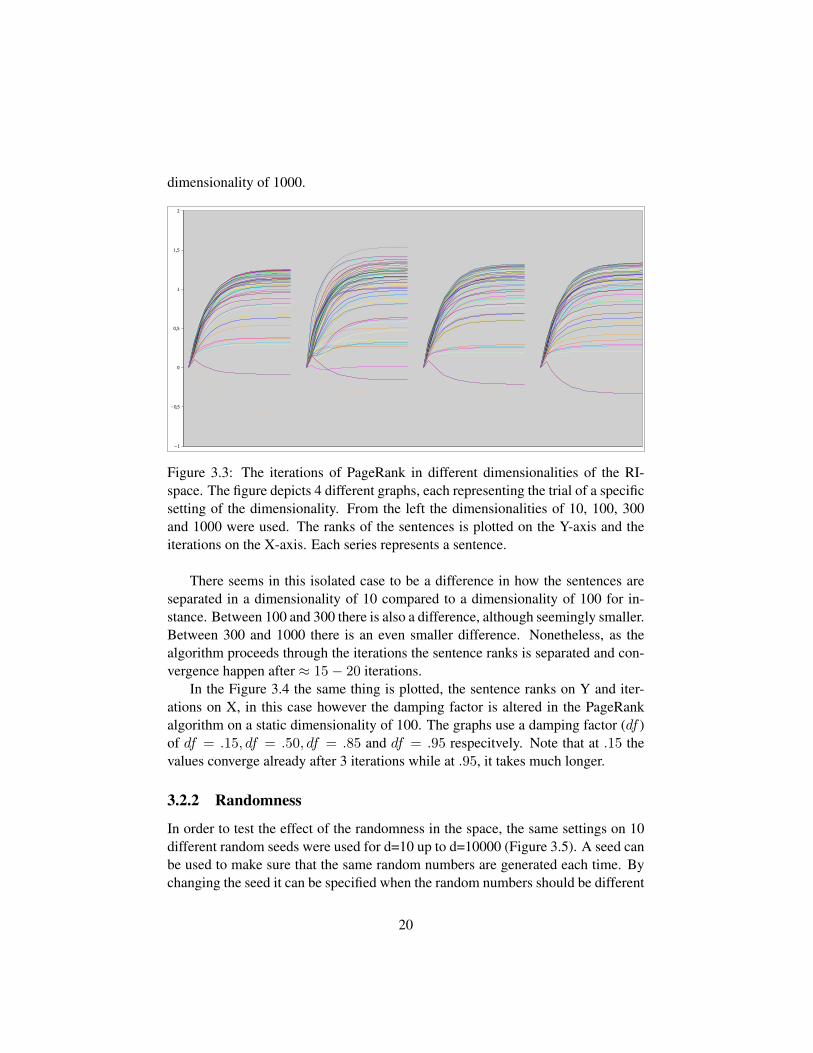
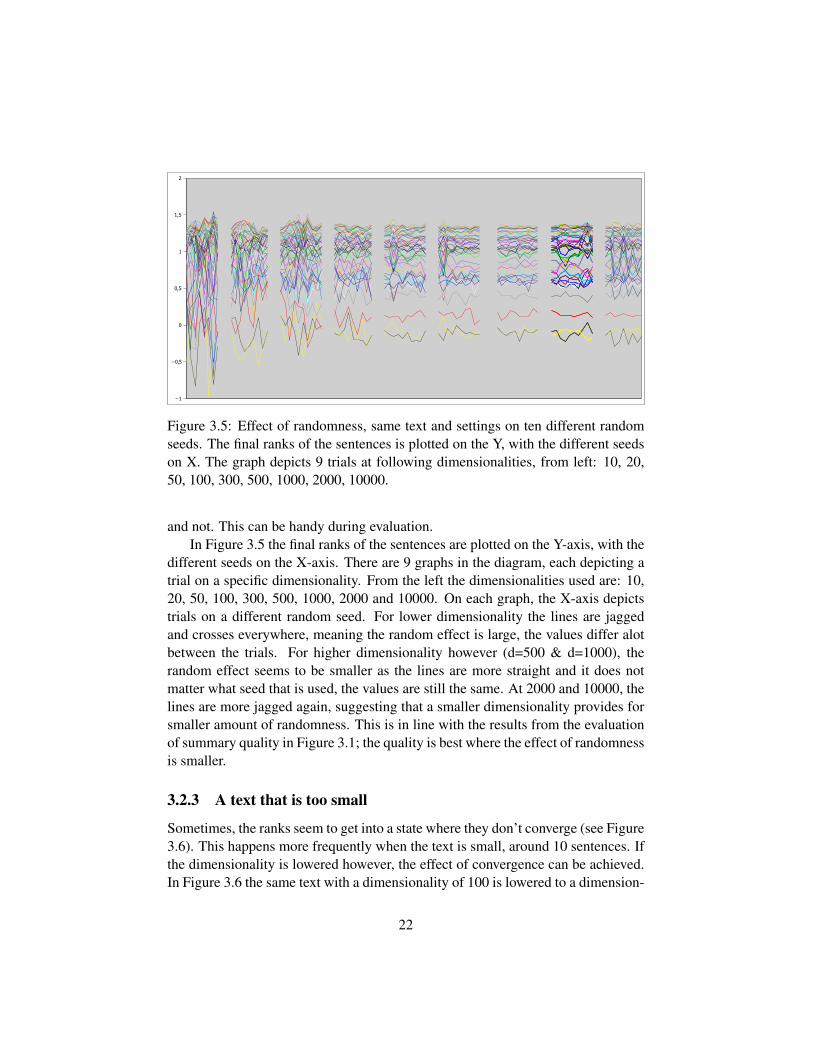
Figure 3.5: Effect of randomness, same text and settings on ten different randomseeds. The final ranks of the sentences is plotted on the Y, with the different seedson X. The graph depicts 9 trials at following dimensionalities, from left: 10, 20,50, 100, 300, 500, 1000, 2000, 10000.
and not. This can be handy during evaluation.In Figure 3.5 the final ranks of the sentences are plotted on the Y-axis, with the
different seeds on the X-axis. There are 9 graphs in the diagram, each depicting atrial on a specific dimensionality. From the left the dimensionalities used are: 10,20, 50, 100, 300, 500, 1000, 2000 and 10000. On each graph, the X-axis depictstrials on a different random seed. For lower dimensionality the lines are jaggedand crosses everywhere, meaning the random effect is large, the values differ alotbetween the trials. For higher dimensionality however (d=500 & d=1000), therandom effect seems to be smaller as the lines are more straight and it does notmatter what seed that is used, the values are still the same. At 2000 and 10000, thelines are more jagged again, suggesting that a smaller dimensionality provides forsmaller amount of randomness. This is in line with the results from the evaluationof summary quality in Figure 3.1; the quality is best where the effect of randomnessis smaller.
3.2.3 A text that is too small
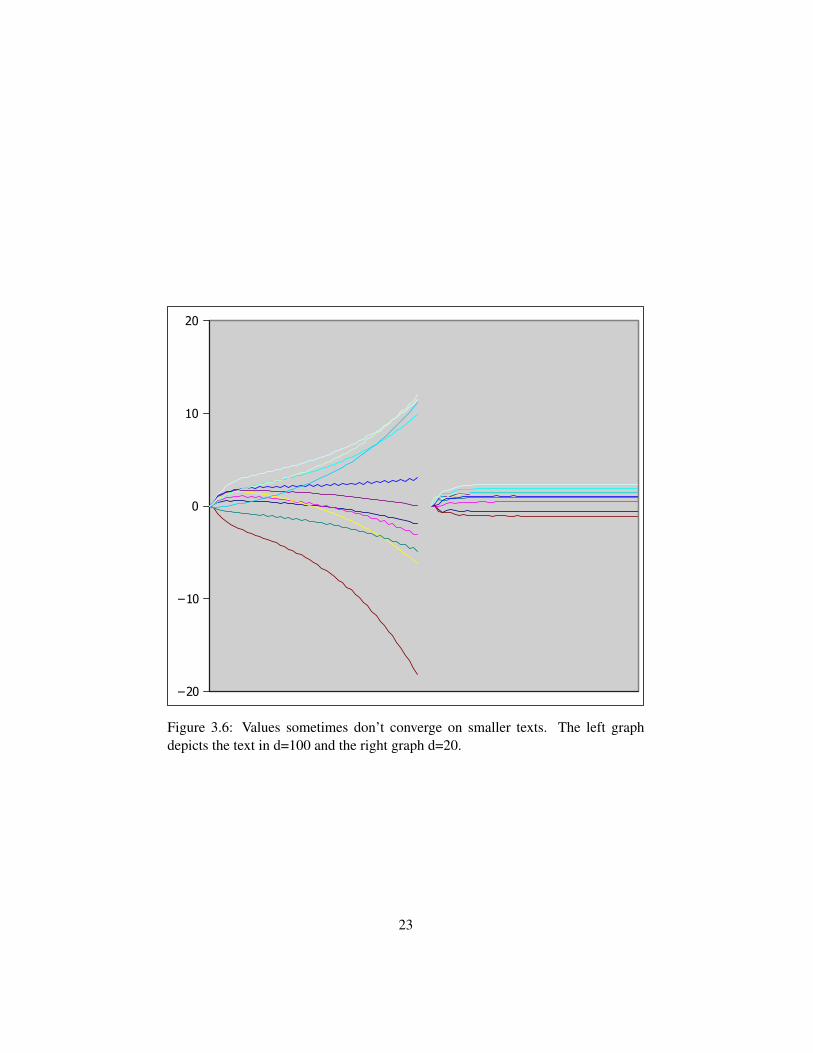
Sometimes, the ranks seem to get into a state where they don’t converge (see Figure3.6). This happens more frequently when the text is small, around 10 sentences. Ifthe dimensionality is lowered however, the effect of convergence can be achieved.In Figure 3.6 the same text with a dimensionality of 100 is lowered to a dimension-
22
−20
−10
0
10
20
Figure 3.6: Values sometimes don’t converge on smaller texts. The left graphdepicts the text in d=100 and the right graph d=20.
23
ality of 20 to gain the effect of convergence as an example.
3.2.4 Stop words
By removing stop words from a large dataset, the quality of the semantic repre-sentation therein can be increased. Stop words are words that do not add any-thing to the meaning of the contexts, as they can appear in many different contexts.Chatterjee and Mohan (2007) use a different approach; by removing the avaragedocument vector from each sentence, the impact of words that appear in manydifferent contexts is lessened in the sentences. To investigate the impact of stopwords using both methods some trials were performed on a text consisting of ap-proximately 2500 words.
3 9 15 21 27 33 39 45 510
0,5
1
1,5
2
+rmsw, -rmdv
(a)
3 9 15 21 27 33 39 45 510
0,2
0,4
0,6
0,8
1
1,2
-rmsw, -rmdv
(b)
3 9 15 21 27 33 39 45 51−3E+021
−2E+021
−1E+021
0
1E+021
2E+021
+rmsw, +rmdv
(c)
3 9 15 21 27 33 39 45 51−0,2
0
0,2
0,4
0,6
0,8
1
1,2
-rmsw, +rmdv
(d)
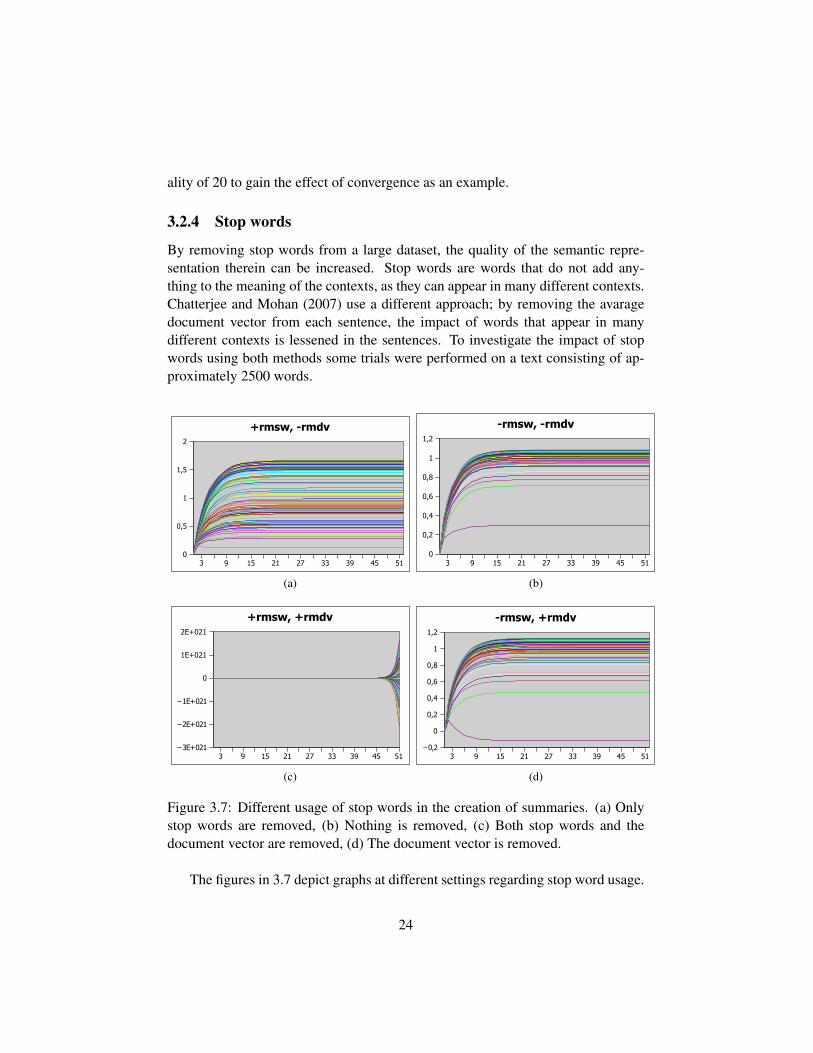
Figure 3.7: Different usage of stop words in the creation of summaries. (a) Onlystop words are removed, (b) Nothing is removed, (c) Both stop words and thedocument vector are removed, (d) The document vector is removed.
The figures in 3.7 depict graphs at different settings regarding stop word usage.
24
On one occasion the stop words were removed instead of subtracting the documentvector (+rmsw, -rmdv). In the second case neither the stop words or the documentvector were removed (-rmsw, -rmdv). In the third case, both stop words and docu-ment vector were removed (+rmsw, +rmdv) and in the last case, only the documentvector was removed (-rmsw, +rmdv).
The graphs all depicts all sentence ranks on Y and iterations on X, the same asbefore.
If nothing is done to account for stop words (Figure 3.7b), no sentence get neg-ative weight and overall, a tighter cluster around the top can be observed. If thestop words are removed instead of the document vector (Figure 3.7a), the sentenceranks get spread out with no distinct top sentences, and also, no sentence withnegative weight. If the stop words are removed in conjunction with the documentvector (Figure 3.7c), too much information is removed and the graph fails to con-verge. If only the document vector is removed (Figure 3.7d), some sentences getlower or even negative weight, while there still is a cluster of top sentences.
With regards to the quality of the summaries, no significant difference could beobserved.
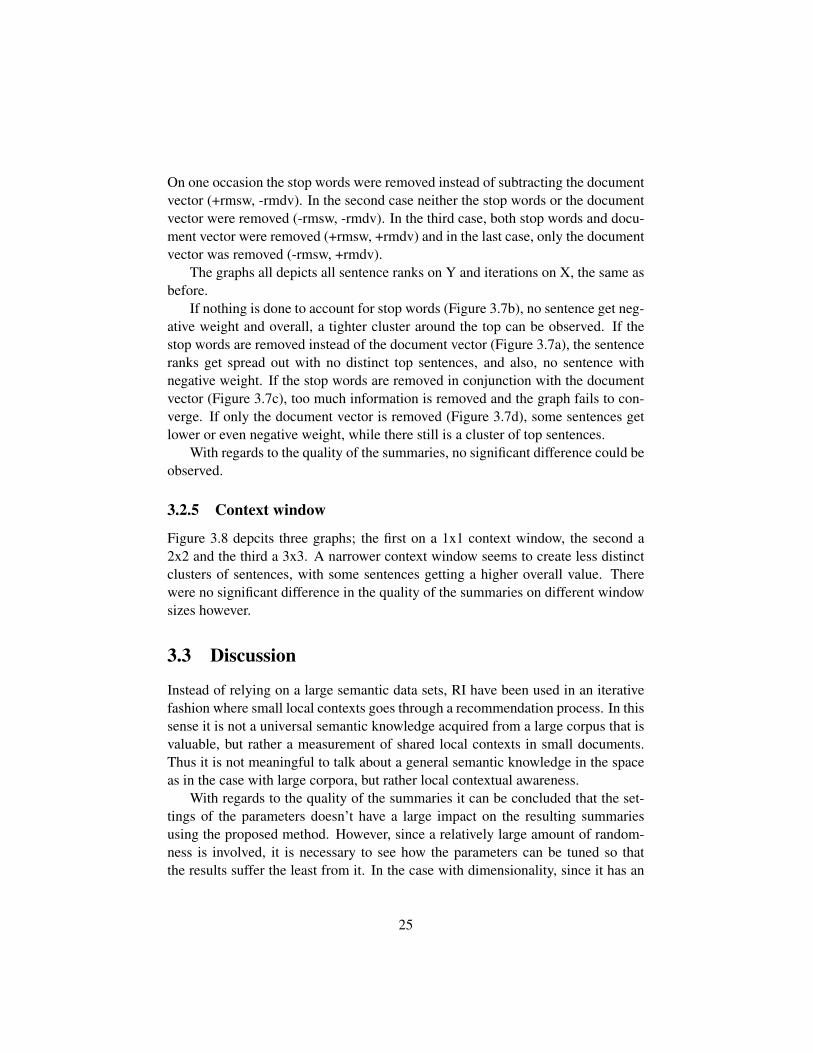
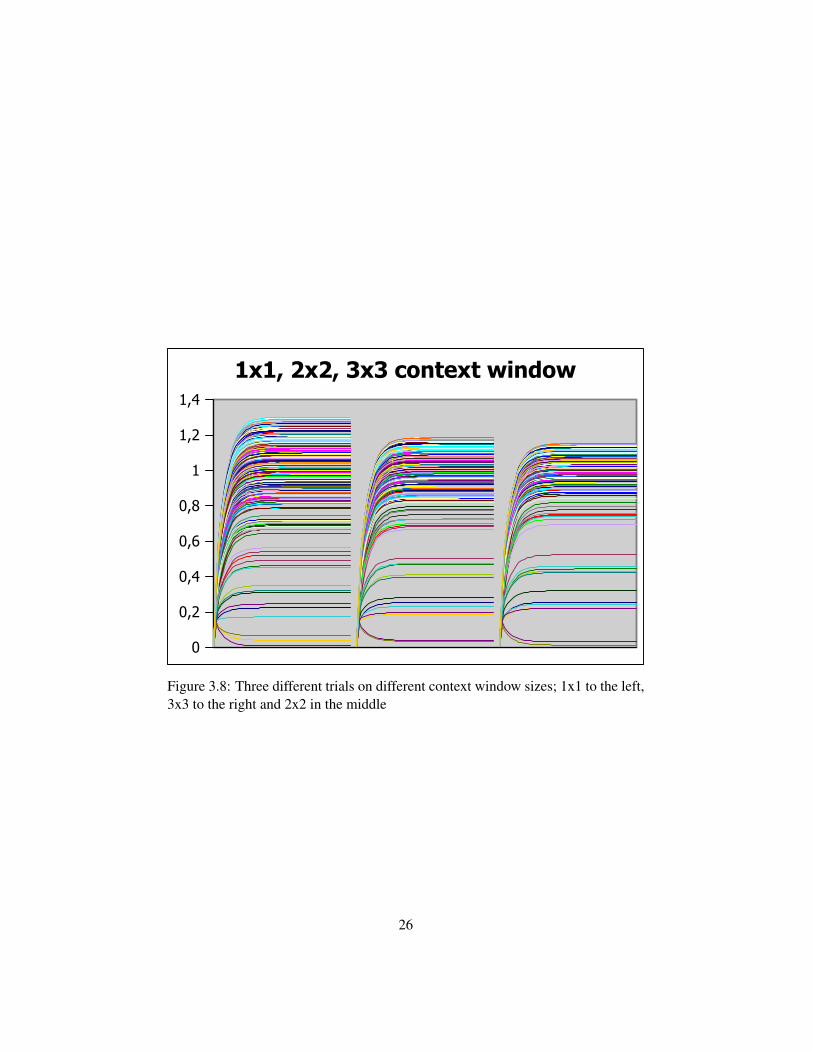
3.2.5 Context window
Figure 3.8 depcits three graphs; the first on a 1x1 context window, the second a2x2 and the third a 3x3. A narrower context window seems to create less distinctclusters of sentences, with some sentences getting a higher overall value. Therewere no significant difference in the quality of the summaries on different windowsizes however.
3.3 Discussion
Instead of relying on a large semantic data sets, RI have been used in an iterativefashion where small local contexts goes through a recommendation process. In thissense it is not a universal semantic knowledge acquired from a large corpus that isvaluable, but rather a measurement of shared local contexts in small documents.Thus it is not meaningful to talk about a general semantic knowledge in the spaceas in the case with large corpora, but rather local contextual awareness.
With regards to the quality of the summaries it can be concluded that the set-tings of the parameters doesn’t have a large impact on the resulting summariesusing the proposed method. However, since a relatively large amount of random-ness is involved, it is necessary to see how the parameters can be tuned so thatthe results suffer the least from it. In the case with dimensionality, since it has an
25
0
0,2
0,4
0,6
0,8
1
1,2
1,4
1x1, 2x2, 3x3 context window
Figure 3.8: Three different trials on different context window sizes; 1x1 to the left,3x3 to the right and 2x2 in the middle
26
impact on processing time, the lowest dimensionality possible would be desired.The results have indicated that a dimensionality of 100 is sufficient even for largertexts of around 1000 words. As observed in experiments, the random factor canbe quite large for smaller texts, but as long as the dimensionality is sufficient therandom factor should not be the prime factor.
It should also be noted that a certain care must be taken when trying to summa-rize smaller texts, as there is a risk of them not containing enough information forthe recomendation process to be meaningful. The failure of convergence as seen inFigure 3.6 probably can be traced to the PageRank-algorithm and more precisely towhere the document vector is subtracted from each sentence. If too many sentencesare too close to the document vector, the effect of the reduction of the documentvector can be that the sentences are left with a representation of a context that isdissimilar to every other sentence. In other words, if there isn’t a ’central theme’in a text, then each sentence doesn’t have anything to vote about or recommend. Inthe PageRank-algorithm, when summing up the ’outgoing’ weights of a sentence,the value becomes close to zero making each iteration increase (or decrease) theranks in an exponential fashion when the weight is divided with that value close tozero. Similarly, Elden (2007) states that a web page that has no outlinks and onlygets its’ weight from inlinks may not converge. A summarized cosine measure fora particular sentence that is zero may thus translate to a web page that has zerooutlinks. The effect of non-convergence can also happen if too much informationis removed from the sentences, as seen in the case with the removal of stop wordsin Figure 3.7c.
By removing the document vector from each word when building the sentencevectors, the impact of sentences containing contexts that include non-functionwords can be lessened. In Figure 3.7d for instance, a particular sentence get neg-ative weight in the text used in the trial, compared to when nothing was done toaccount for stop words as in Figure 3.7b. If stop words are removed as well as thedocument vector, the sentence ranks fail to converge (Figure 3.7c). This is probablydue to that the sentences get to little information and are treated as having no outlinks. If stop words are removed instead of removing the document vector (Figure3.7a) the sentence ranks are more spread out, with no distinct “top” sentences.
The damping factor has a large effect on the behaviour of the ranking algorithmas can be seen in Figure 3.4. The setting of the damping factor should be set sothat enough recomendations between sentences can occur before convergence. At.15 only three iterations are performed before convergence and the resulting ranksdiffer alot from when more recomendations have been performed. At .50 a couplemore is needed before convergence and at .85 around fifteen. When the damp-ing factor increases, so does the number of iterations needed before convergence.Since the number of iterations is determinate of the processing time, a low enough
27
number should be set. .85 is recomended by other sources((Brin & Page, 1998;Chatterjee & Mohan, 2007)) and has also been used here. It would be interestingto investigate more deeply how the damping factor affects the actual quality of thesummaries.
The effect of the context can be seen in Figure 3.8 where the size of the focuswindow is altered. A smaller context region makes for not as distinct separationof sentences, however, the differences in the quality of the summaries were notsignificant.
28
Chapter 4
Readability experiments
This chapter presents some experiments performed on automatically created sum-maries regarding readability and some conclusions thereof.
4.1 Readability of summaries
We have evaluated summarized texts from a readability perspective by creatingsummaries of texts from different genres and compared their readability to theoriginal text.
We used three types of texts representing three different genres:
• DN. Newspaper texts from the Swedish newspaper ”Dagens Nyheter”; ca25,000 words divided in 130 articles.
• FOF. Popular science texts from the Swedish Magasine ”Forskning ochFramsteg”; ca 20,000 words divided in 31 articles.
• FOKASS. Authority texts from the Swedish Social Insurance Administra-tion (Sw. Forsakringskassan); ca 25,000 words from 2 brochures. Thebrochures were divided so that each chapter was an article resulting in atotal of 35 ”articles”
The texts were extracted from the concordances at (Sprakbanken, 2011), ex-cept for the authority texts which were taken from the Swedish Social InsuranceAdministration’s web page (Forsakringskassan, 2011). They were summarized todifferent lengths (30%, 50% and 70%) and compared with the originals (100%)with regards to the different readability measures.
29
The texts were summarized using COGSUM with a random index dimensional-ity, d, of 100, a focus window size, w, of 4 (2 left, 2 right) and ρ = 4, i.e. 2 positive1:s and 2 negative 1:s, in line with (Chatterjee & Mohan, 2007).
The texts were also stemmed using the snowball algorithm, so that the samewords with different endings get counted as the same. The PageRank dampingfactor was set to .85 (Brin & Page, 1998) and the number of iterations was set to50.
The summaries were evaluated using 7 measures, see Table 4.1 for results onreadability indices LIX, NR and OVIX, and Table 4.2 for additional parameters.The values of the measures of the summaries were also compared to the full lengthtexts using a paired-samples T-test.
4.2 Results
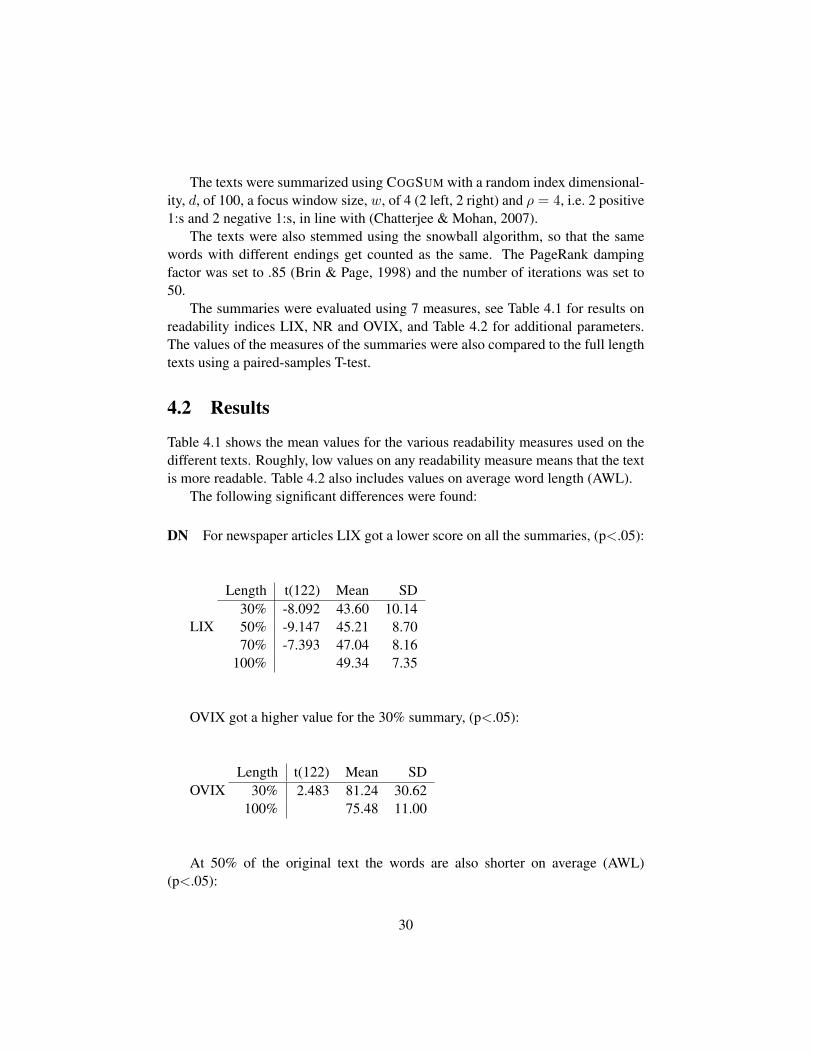
Table 4.1 shows the mean values for the various readability measures used on thedifferent texts. Roughly, low values on any readability measure means that the textis more readable. Table 4.2 also includes values on average word length (AWL).
The following significant differences were found:
DN For newspaper articles LIX got a lower score on all the summaries, (p<.05):
LIX
Length t(122) Mean SD30% -8.092 43.60 10.1450% -9.147 45.21 8.7070% -7.393 47.04 8.16
100% 49.34 7.35
OVIX got a higher value for the 30% summary, (p<.05):
OVIXLength t(122) Mean SD
30% 2.483 81.24 30.62100% 75.48 11.00
At 50% of the original text the words are also shorter on average (AWL)(p<.05):
30
AWLLength t(122) Mean SD
50% -3.4642 4.74 0.51100% 4.83 0.41
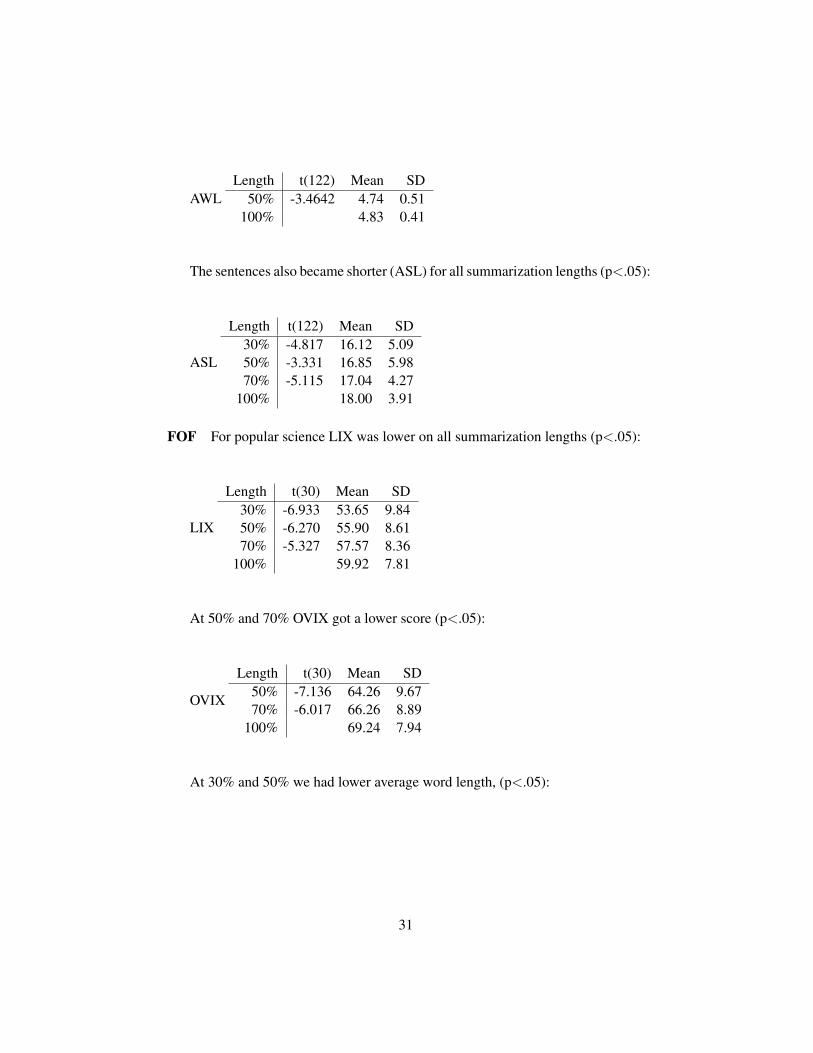
The sentences also became shorter (ASL) for all summarization lengths (p<.05):
ASL
Length t(122) Mean SD30% -4.817 16.12 5.0950% -3.331 16.85 5.9870% -5.115 17.04 4.27
100% 18.00 3.91
FOF For popular science LIX was lower on all summarization lengths (p<.05):
LIX
Length t(30) Mean SD30% -6.933 53.65 9.8450% -6.270 55.90 8.6170% -5.327 57.57 8.36
100% 59.92 7.81
At 50% and 70% OVIX got a lower score (p<.05):
OVIX
Length t(30) Mean SD50% -7.136 64.26 9.6770% -6.017 66.26 8.89
100% 69.24 7.94
At 30% and 50% we had lower average word length, (p<.05):
31
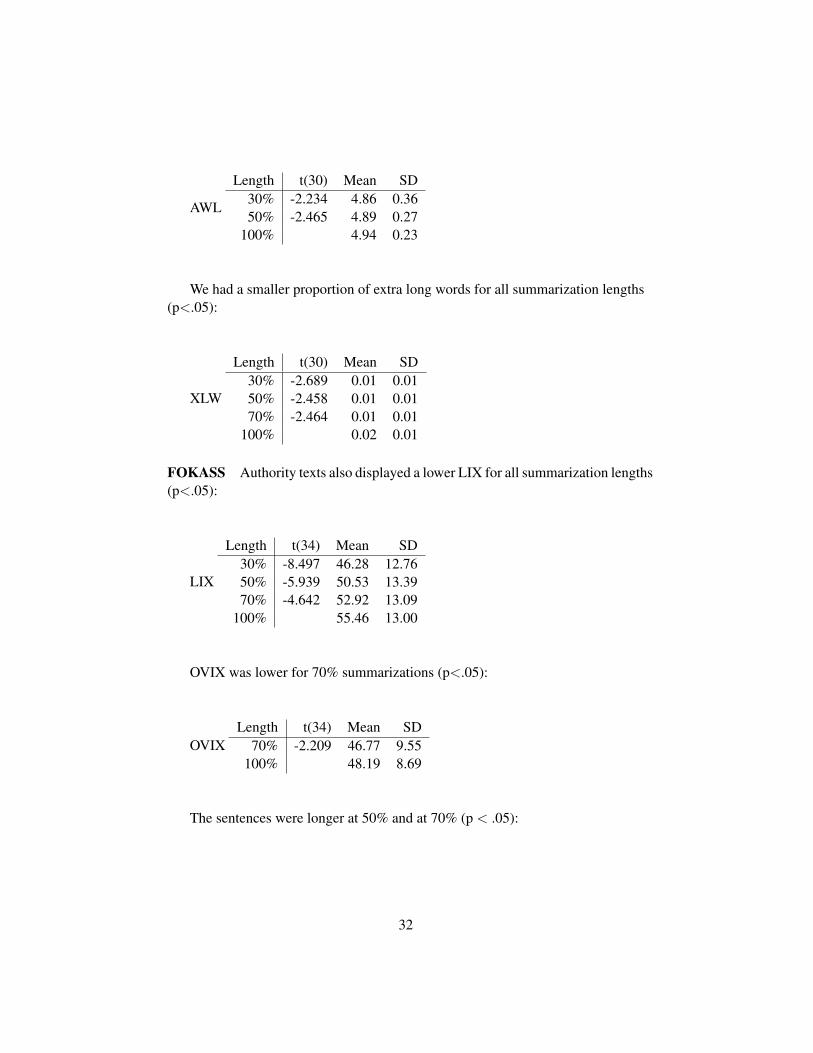
AWL
Length t(30) Mean SD30% -2.234 4.86 0.3650% -2.465 4.89 0.27
100% 4.94 0.23
We had a smaller proportion of extra long words for all summarization lengths(p<.05):
XLW
Length t(30) Mean SD30% -2.689 0.01 0.0150% -2.458 0.01 0.0170% -2.464 0.01 0.01
100% 0.02 0.01
FOKASS Authority texts also displayed a lower LIX for all summarization lengths(p<.05):
LIX
Length t(34) Mean SD30% -8.497 46.28 12.7650% -5.939 50.53 13.3970% -4.642 52.92 13.09
100% 55.46 13.00
OVIX was lower for 70% summarizations (p<.05):
OVIXLength t(34) Mean SD
70% -2.209 46.77 9.55100% 48.19 8.69
The sentences were longer at 50% and at 70% (p < .05):
32
ASL
Length t(34) Mean SD50% 2.144 15.10 3.5570% 2.606 14.87 2.61
100% 14.27 2.41
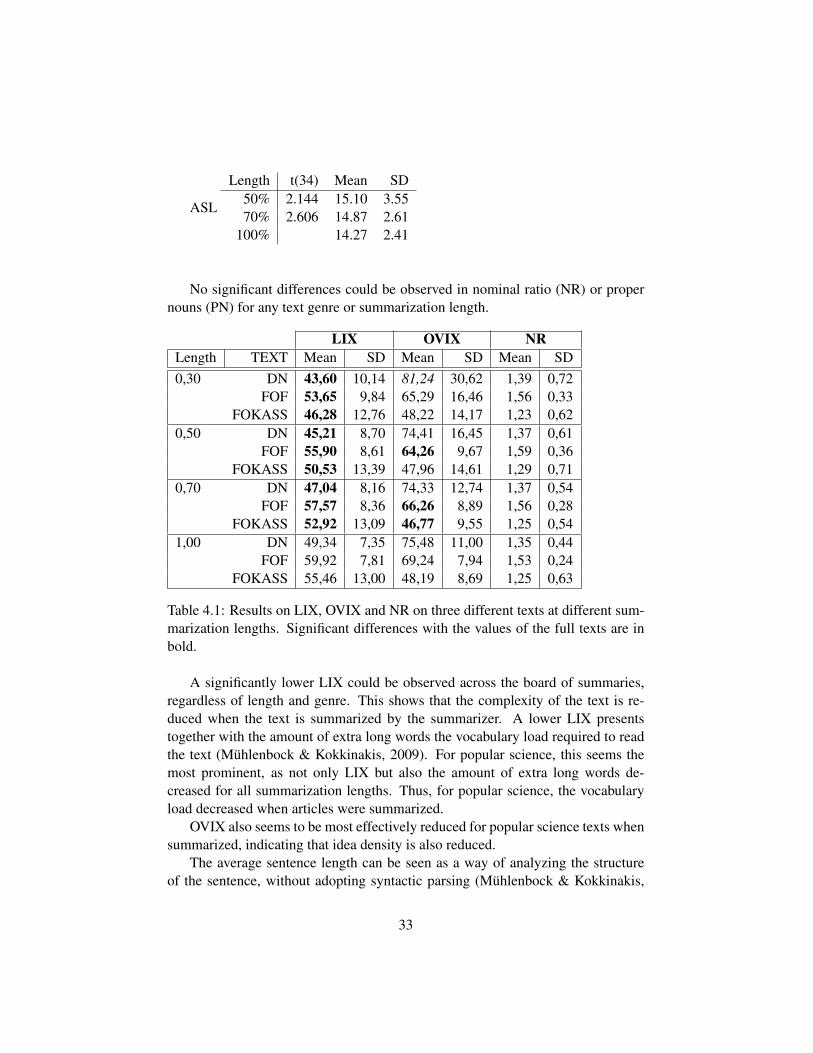
No significant differences could be observed in nominal ratio (NR) or propernouns (PN) for any text genre or summarization length.
LIX OVIX NRLength TEXT Mean SD Mean SD Mean SD0,30 DN 43,60 10,14 81,24 30,62 1,39 0,72
FOF 53,65 9,84 65,29 16,46 1,56 0,33FOKASS 46,28 12,76 48,22 14,17 1,23 0,62
0,50 DN 45,21 8,70 74,41 16,45 1,37 0,61FOF 55,90 8,61 64,26 9,67 1,59 0,36
FOKASS 50,53 13,39 47,96 14,61 1,29 0,710,70 DN 47,04 8,16 74,33 12,74 1,37 0,54
FOF 57,57 8,36 66,26 8,89 1,56 0,28FOKASS 52,92 13,09 46,77 9,55 1,25 0,54
1,00 DN 49,34 7,35 75,48 11,00 1,35 0,44FOF 59,92 7,81 69,24 7,94 1,53 0,24
FOKASS 55,46 13,00 48,19 8,69 1,25 0,63
Table 4.1: Results on LIX, OVIX and NR on three different texts at different sum-marization lengths. Significant differences with the values of the full texts are inbold.
A significantly lower LIX could be observed across the board of summaries,regardless of length and genre. This shows that the complexity of the text is re-duced when the text is summarized by the summarizer. A lower LIX presentstogether with the amount of extra long words the vocabulary load required to readthe text (Muhlenbock & Kokkinakis, 2009). For popular science, this seems themost prominent, as not only LIX but also the amount of extra long words de-creased for all summarization lengths. Thus, for popular science, the vocabularyload decreased when articles were summarized.
OVIX also seems to be most effectively reduced for popular science texts whensummarized, indicating that idea density is also reduced.
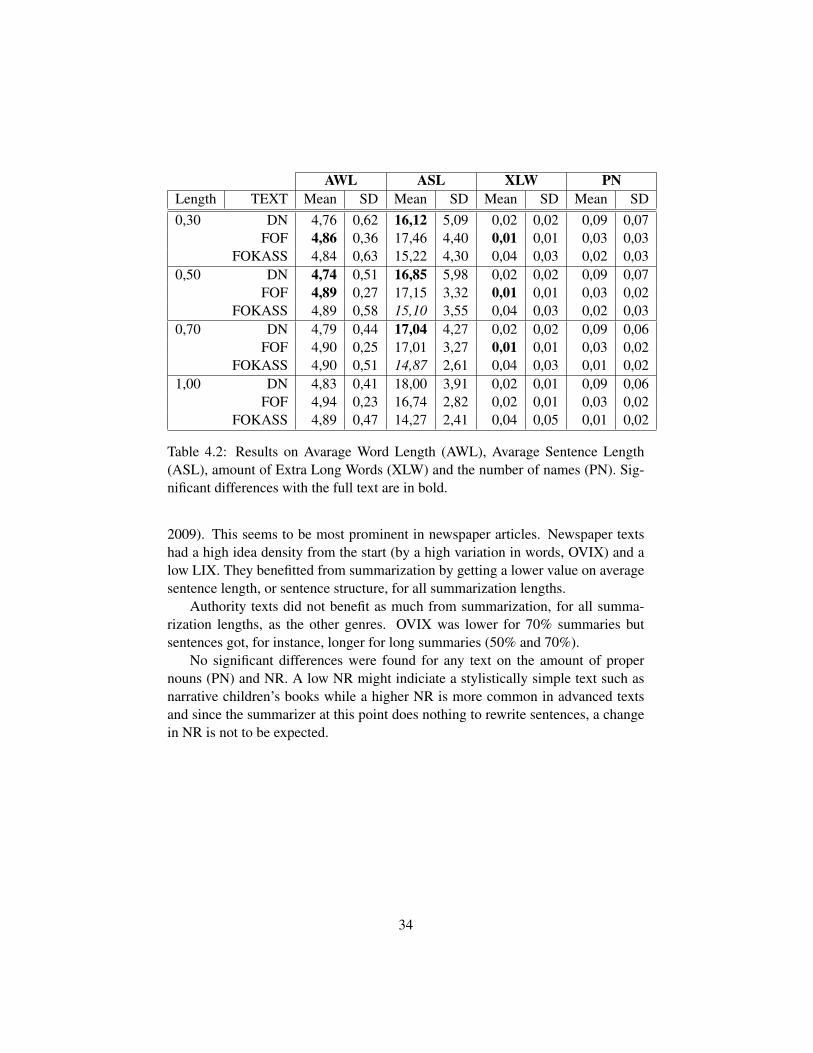
The average sentence length can be seen as a way of analyzing the structureof the sentence, without adopting syntactic parsing (Muhlenbock & Kokkinakis,
33
AWL ASL XLW PNLength TEXT Mean SD Mean SD Mean SD Mean SD0,30 DN 4,76 0,62 16,12 5,09 0,02 0,02 0,09 0,07
FOF 4,86 0,36 17,46 4,40 0,01 0,01 0,03 0,03FOKASS 4,84 0,63 15,22 4,30 0,04 0,03 0,02 0,03
0,50 DN 4,74 0,51 16,85 5,98 0,02 0,02 0,09 0,07FOF 4,89 0,27 17,15 3,32 0,01 0,01 0,03 0,02
FOKASS 4,89 0,58 15,10 3,55 0,04 0,03 0,02 0,030,70 DN 4,79 0,44 17,04 4,27 0,02 0,02 0,09 0,06
FOF 4,90 0,25 17,01 3,27 0,01 0,01 0,03 0,02FOKASS 4,90 0,51 14,87 2,61 0,04 0,03 0,01 0,02
1,00 DN 4,83 0,41 18,00 3,91 0,02 0,01 0,09 0,06FOF 4,94 0,23 16,74 2,82 0,02 0,01 0,03 0,02
FOKASS 4,89 0,47 14,27 2,41 0,04 0,05 0,01 0,02
Table 4.2: Results on Avarage Word Length (AWL), Avarage Sentence Length(ASL), amount of Extra Long Words (XLW) and the number of names (PN). Sig-nificant differences with the full text are in bold.
2009). This seems to be most prominent in newspaper articles. Newspaper textshad a high idea density from the start (by a high variation in words, OVIX) and alow LIX. They benefitted from summarization by getting a lower value on averagesentence length, or sentence structure, for all summarization lengths.
Authority texts did not benefit as much from summarization, for all summa-rization lengths, as the other genres. OVIX was lower for 70% summaries butsentences got, for instance, longer for long summaries (50% and 70%).
No significant differences were found for any text on the amount of propernouns (PN) and NR. A low NR might indiciate a stylistically simple text such asnarrative children’s books while a higher NR is more common in advanced textsand since the summarizer at this point does nothing to rewrite sentences, a changein NR is not to be expected.
34
Chapter 5
Discussion
In this thesis work on an automatic summarizer called COGSUM is presented. Itcan be concluded that automatic summarization may work as a first step in makinga text easier to read. This is based on the results from some experiments regardingthe readability of the resulting texts, acquired through the use of several automaticreadability indices. The summaries are achieved by letting the sentences in the textrecommend eachother so that sentences that share contexts that are important forthe document is valued higher. By tuning different parameters it was hypothesizedthat the quality of the summaries would be different and therefore that it was possi-ble to optimize the settings in order to get as high readability as possible. However,the parameters did not have a large effect on the quality of the summaries, otherthan that outside certain thresholds, the result were more or less random, meaningthat an evaluation of the summaries should not be performed until some insightover how the parameters affects the ranking is gained. By plotting the differentvalues of the sentences during the summarization process, it was possible to ac-quire some knowledge of what happens with the ranking with regards to differentsettings of the parameters, providing for more thorough investigation in future re-search.
5.1 Readability discussion
There seems to be a difference between different genres in how a summary is af-fecting the readability of the texts. For instance, with regards to LIX, it seemsthat the shorter the summary, the lower the score, regardless of text type. WithASL however, summarization on newspaper texts seem to keep sentences that areshorter overall, while summarization on the other genres tend to keep longer sen-tences. Thus for newspaper texts, the most important sentences are the short ones,
35
while the opposite is true for texts of the other genres. Popular science seems tobenefit most by being summarized being the genre that gets a lower vocabularyload and a lower complexity of sentence structure, together with idea density.
However, these results are only indicative and should not be seen as a way ofcompletely assess the readaility of the resulting summaries. One obvious flaw withextraction based summaries of the type used in these experiments is that they lacka way of providing anaphora resolution, meaning the summaries may very wellcontain sentences that refer to preceding sentences. This is currently not capturedwithin the readability indices and a qualitative approach to evaluation would befavorable to assess how the lack of anaphora resoltion affects the subjective expe-rience of readability.
5.2 Conclusions
By using an automatic extraction based summarizer, it is possible to make a texteasier to read by shortening them and keep only the most important information.With regards to vocabulary load, the texts become easier to process for the reader.The sentences that are still present in newspaper texts after summarization are alsoof a simpler structure as they are shorther overall. This indicates that the importantsentences in the text are also shorter. There is further a difference in how summa-rization affects the readability with regards to text type and text length; for instance,the length of the sentences are longer for authority texts and popular science whenthey are more important.
Different parameter settings of the summarizer was hypothesized to producesummaries of different qualities and thus an important aspect in creating morereadable texts. This was also the case to a small extent; the value on the parametersdoes have a small impact on the quality of the summaries, especially dimension-ality. The best dimensionality was spotted at 100 in the trials for texts around1000 words. It is interesting since the same dimensionality generally is chosen forshorter texts of 200-300 words, indicating that a flat percentage with regards todimension reduction may not be optimal.
5.3 Future work
For the future, some further investigation on how different text types are affectedby summaries with regards to readability would be needed, in order to apply the ap-propriate tools to the appropriate texts. Summaries could however be seen as a firststep of simplifying texts and achieve higher readability. Also, in depth evaluationof the quality of the summaries and how it affects the readability as well as how to
36
improve the quality of the summaries by tuning relevant parameters is an importanttask. By scaling up the visualization studies on several text types and lengths infuture research, more conclusions on the matter would be possible. Further, somedeeper qualitative research of the applicability of automated shallow readabilitymeasures when evaluating summaries would be desired. For instance, the dawningera of eye-tracking studies recently poses interesting capabilities of evaluation re-search and would provide interesting insights in how a reader interacts with a text,for instance, how important anaphora resolution is to readability.
37
References
Bernhardt, E. B. (1984). Toward an information processing perspective in foreignlanguage reading. The Modern Language Journal, 68(4), 322-331.
Bjornsson, C. (1968). Lasbarhet. Stockholm: Liber.Brin, S., & Page, L. (1998). The anatomy of a large-scale hypertextual web search
engine. Computer Networks and ISDN Systems, 30(1-7), 107–117.Campbell, R. S. (January 2003). The secret life of pronouns: flexibility in writing
style and physical health. Psychological Science, 14, 60-65(6). Availablefrom http://www.ingentaconnect.com/content/bpl/psci/2003/00000014/00000001/art00010
Carlsson, B. (2009). Guldstandarder – dess skapande och utvardering. Unpub-lished master’s thesis, Linkoping University.
Chall, J. (1958). Readability: An appraisal of research and application. Columbus,OH: Ohio State University Press. Reprinted 1974. Epping, Essex, England:Bowker Publishing Company.
Chatterjee, N., & Mohan, S. (2007). Extraction-based single-document summa-rization using random indexing. In Proceedings of the 19th ieee internationalconference on tools with artificial intelligence – (ictai 2007) (p. 448-455).
Dalianis, H., Hassel, M., Wedekind, J., Haltrup, D., Smedt, K. de, & Lech, T. C.(2003). From SweSum to ScandSum: Automatic Text Summarization forthe Scandinavian Languages. In H. Holmboe (Ed.), Nordisk sprogteknologi2002: Arbog for nordisk sprakteknologisk forskningsprogram 2000-2004(pp. 153–163). Museum Tusculanums Forlag. Available from http://nlp.lacasahassel.net/publications/scandsum02.pdf
DuBay, W. H. (2004). Smart language: Readers, readability, and the grading oftext. Costa Mesa:Impact Information.
Duffy, T. M., & Kabance, P. (1982). Testing a readable writing approach to text re-vision. Journal of Educational Psychology, 74(5), 733 - 748. Available fromhttp://www.sciencedirect.com/science/article/B6WYD-4NV6XF3-D/2/da9af4eccd0e69dbe160186c21ad99f4
38
Elden, L. (2007). Matrix methods in data mining and pattern recognition. Societyfor Industrial & Applied Mathematics (SIAM).
Forsakringskassan. (2011, January). Forsakringskassans website. Avail-able from http://www.forsakringskassan.se (http://www.forsakringskassan.se)
Freebody, P., & Anderson, R. C. (1983). Effects of vocabulary difficulty,text cohesion, and schema availability on reading comprehension. Read-ing Research Quarterly, 18(3), pp. 277-294. Available from http://www.jstor.org/stable/747389
Giannakopoulos, G., Karkaletsis, V., Vouros, G., & Stamatopoulos, P. (2008, Oc-tober). Summarization system evaluation revisited: N-gram graphs. ACMTrans. Speech Lang. Process., 5, 5:1–5:39. Available from http://doi.acm.org/10.1145/1410358.1410359
Gorrell, G. (2006). Generalized hebbian algorithm for dimensionality reduction innatural language processing. Unpublished doctoral dissertation, LinkopingUniversity.
Gustavsson, P., & Jonsson, A. (2010). Text summarization using random index-ing and pagerank. In Proceedings of the third swedish language technologyconference (sltc-2010), linkoping, sweden.
Hassel, M. (2007). Resource lean and portable automatic text summarization. Un-published doctoral dissertation, ISRN-KTH/CSC/A–07/09-SE, KTH, Swe-den.
Hassel, M. (2011). Random indexing java-toolkit. Available from http://www.nada.kth.se/˜xmartin/
Jonsson, A., Axelsson, M., Bergenholm, E., Carlsson, B., Dahlbom, G., Gustavs-son, P., et al. (2008). Skim reading of audio information. In Proceedings ofthe the second swedish language technology conference (sltc-08), stockholm,sweden.
Kanerva, P. (1988). Sparse distributed memory. Cambridge MA: The MIT Press.Karlgren, J., Holst, A., & Sahlgren, M. (2008). Filaments of meaning in word
space. In C. Macdonald, I. Ounis, V. Plachouras, I. Ruthven, & R. White(Eds.), Advances in information retrieval (Vol. 4956, p. 531-538). SpringerBerlin / Heidelberg.
Karlgren, J., & Sahlgren, M. (2001). From words to understanding. In Y. Uesaka,P.Kanerva, & H. Asoh (Eds.), Foundations of real-world intelligence (p. 294-308). Stanford: CSLI Publications.
Lundberg, I., & Reichenberg, M. (2009). Vad ar lattlast? Socialpedagogiskaskolmyndigheten.
Mihalcea, R., & Tarau, P. (2004, July). TextRank: Bringing order into texts. InProceedings of EMNLP-04and the 2004 conference on empirical methods in
39
natural language processing.Muhlenbock, K., & Kokkinakis, S. J. (2009). Lix 68 revisited – an extended
readability measure. In Proceedings of corpus linguistics.Papadimitriou, C. H., Raghavan, P., Tamaki, H., & Vempala, S. (2000).
Latent semantic indexing: A probabilistic analysis. Journal ofComputer and System Sciences, 61(2), 217 - 235. Available fromhttp://www.sciencedirect.com/science/article/B6WJ0-45FC93J-W/2/1a6dfbe012f6fe2fcf927db62e2da5e2
Rybing, J., Smith, C., & Silvervarg, A. (2010). Towards a rule based systemfor automatic simplification of texts. In Proceedings of the third swedishlanguage technology conference (sltc-2010), linkoping, sweden.
Sahlgren, M. (2005). An Introduction to Random Indexing. Methods and Appli-cations of Semantic Indexing Workshop at the 7th International Conferenceon Terminology and Knowledge Engineering, TKE 2005.
Sahlgren, M. (2006). The word-space model: Using distributional analysis torepresent syntagmatic and paradigmatic relations between words in high-dimensional vector spaces. Unpublished doctoral dissertation, StockholmUniversity, Department of Linguistics.
Sprakbanken. (2011, January). Concordances of sprakbanken. Avail-able from http://spraakbanken.gu.se/konk/ (http://spraakbanken.gu.se/konk/)
40