automatic vol. computer-based automation of concentration
TRANSCRIPT
Journal of Automatic Chemistry Vol. 11, No. 3 (May-June 1989), pp. 129-133
Computer-based automationof concentration measurementswith ion-selective electro [es
jos6 A. Ibafiez,, L. Victoria? and Rafael M.Barzanallana,Dept. Fisica Aplicada, Facultad de Ciencias Qulmicas y Matemdticas,
Universidad de Murcia, 30071 Murcia, SpainDept. Informdticay Automdtica, Universidad de Murcia, 30071 Murcia, Spain
An integrated computer system consisting of an expandableionanalyzer and a PC has been used to automate concentrationmeasurements with ion-selective electrodes (ISEs). The ion-analyzer determines ionic concentrations using a reference electrodecoupled with an ISE. The measurements and calibrations arecarried out in a thermostated sample changer equipped with aJlowcell. The data obtained by the ionanalyzer are sent via a standardRS 232-C interface to a microcomputer. In this paper, we describethe automatic data acquisition system and the subsequent processingof the measurements. One program (Transorion) automaticallycollects the measurements carried out by the ionanalyzer, giving areal-time graphic representation of the measurement on thecomputer screen. A second program (Graforion) facilitates themanagement ofthe data stored by thefrstprogram, and listing andgraphics ofthese can be obtained on theprinter The methodhas been used to study continuous concentration changes in anaqueous solution ofpotassium iodide.
Introduction
This paper reports an automatic method for the measure-ment of ionic concentrations using ion-selective elec-trodes (ISEs). Ionic concentrations are measured directlyby an expandable ionanalyzer with an RS 232C (CCITT
STIRRING
[’f][l
MOTOR
R.P.M.DIG. COUNTER
TO WASTE TO M2
V24) output, which gives the concentration, the corre-sponding electrical potential difference and facilitates thenecessary ISE calibrations. The measurements carriedout by the ionanalyzer are received by a microcomputerusing a program (Transorion), and can be stored on ahard or floppy disk and displayed on the computer screen.A second program (Graforion) gives the data read-out,listing the values obtained and/or providing graphics.
Experimental
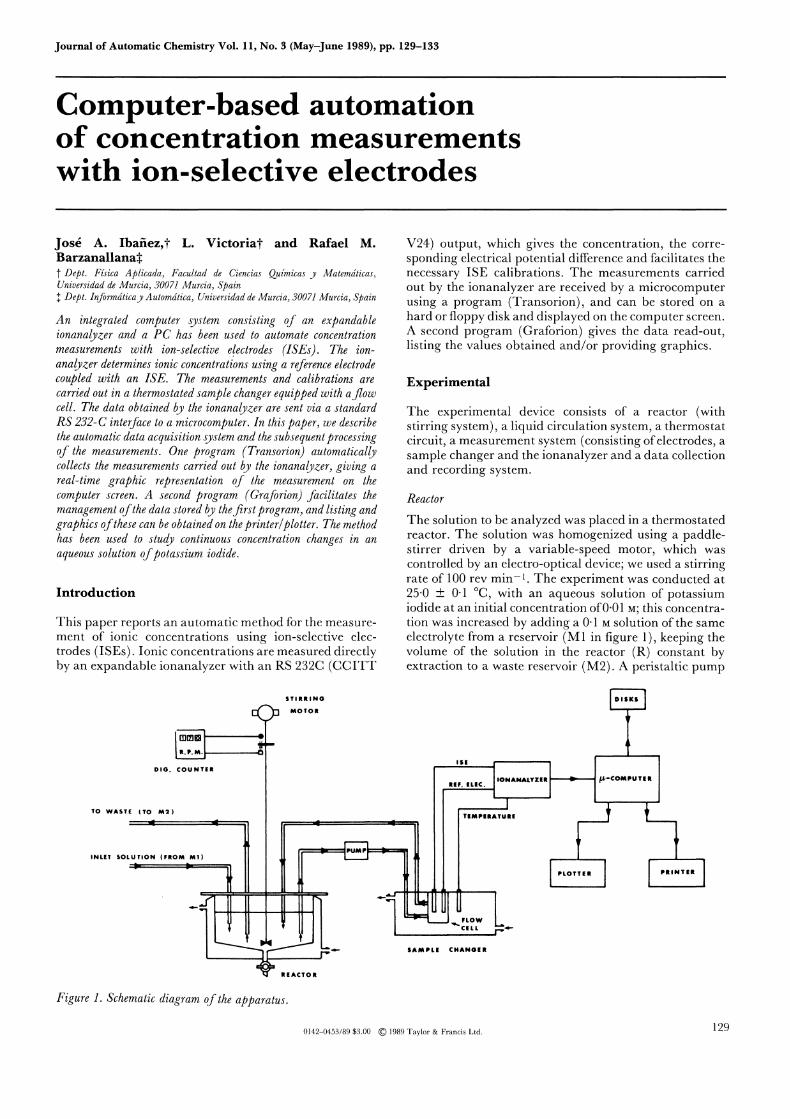
The experimental device consists of a reactor (withstirring system), a liquid circulation system, a thermostatcircuit, a measurement system (consisting ofelectrodes, asample changer and the ionanalyzer and a data collectionand recording system.
Reaclor
The solution to be analyzed was placed in a thermostatedreactor. The solution was homogenized using a paddle-stirrer driven by a variable-speed motor, which wascontrolled by an electro-optical device; we used a stirringrate of 100 rev min-1. The experiment was conducted at25-0 + 0"1 C, with an aqueous solution of potassiumiodide at an initial concentration of0"01 M; this concentra-tion was increased by adding a 0" M solution of the sameelectrolyte from a reservoir (M1 in figure 1), keeping thevolume of the solution in the reactor (R) constant byextraction to a waste reservoir (M2). A peristaltic pump
IONANALYZE L&-OMPU
TEMPERATURE
INLET SOLUI’ION (FROM M1)
PLOTTER PRINTER
SAMPLE CHANGER
REACTOR
Figure 1. Schematic diagram of the apparatus.
0142-0453/89 $3.00 (C) 1989 Taylor & Francis Ltd. 129

j. A. Ibafiez et al. Automation of ion-selective electrode measurements
and a compensating system to eliminate any possibledifference between inlet and outlet volumes wererequired. In this way the concentration of the electrolytewas increased. After reaching a maximum value, thesolution was returned to the original 0"01 M concentrationby continuous dilution.
Liquid circulation system
This circuit consisted of a four-channel peristaltic pump(Gilson-Minipuls), in which only two channels were used(one from M1 and the other to M2). The transport tubeswere previously calibrated to obtain equal flows in thetwo channels. An electro-optical level controller wasnecessary to maintain equilibrium between the inlet andoutlet flows ].
Thermostat circuit
This was a double circuit used for both heating andcooling; these alternative functions could be selected bymanually turning valves. The heating circuit has athermostated bath with a temperature display and a
pump. In the cooling circuit, an appropriate devicereduces the temperature of the coolant inside a containerwith insulating walls, from where it flows through thecircuit.
Measurement system
To measure concentration changes in aqueous potassiumiodide solutions, an ISE for I- (Orion, Model 94-53BN)was used with a double-union reference electrode (Orion,Model 90-02). The ISE has a linear range from to10"5 M. As electrodes require periodical calibration wehave designed a sample changer thermostated in parallelwith the reactor, with six magnetic stirring vessels for
standard solutions, one of which also acts as a washvessel, and a flow cell in which the electrodes are placed(figure 2). This electrode response is fed to an ionanalyzer(Orion, EA940) where the temperature, the concentra-tion and the associated electrical potential difference are
displayed in a continuous form. By means of an outputRS 232C the data obtained are sent to a microcomputer,where they are stored for further use (figure 1).
Data acquisition and recording system
An information system is Used for acquiring, storing andprocessing the data. This system consists of a microcom-puter (Olivetti M24) with three RS 232C interfaces, a
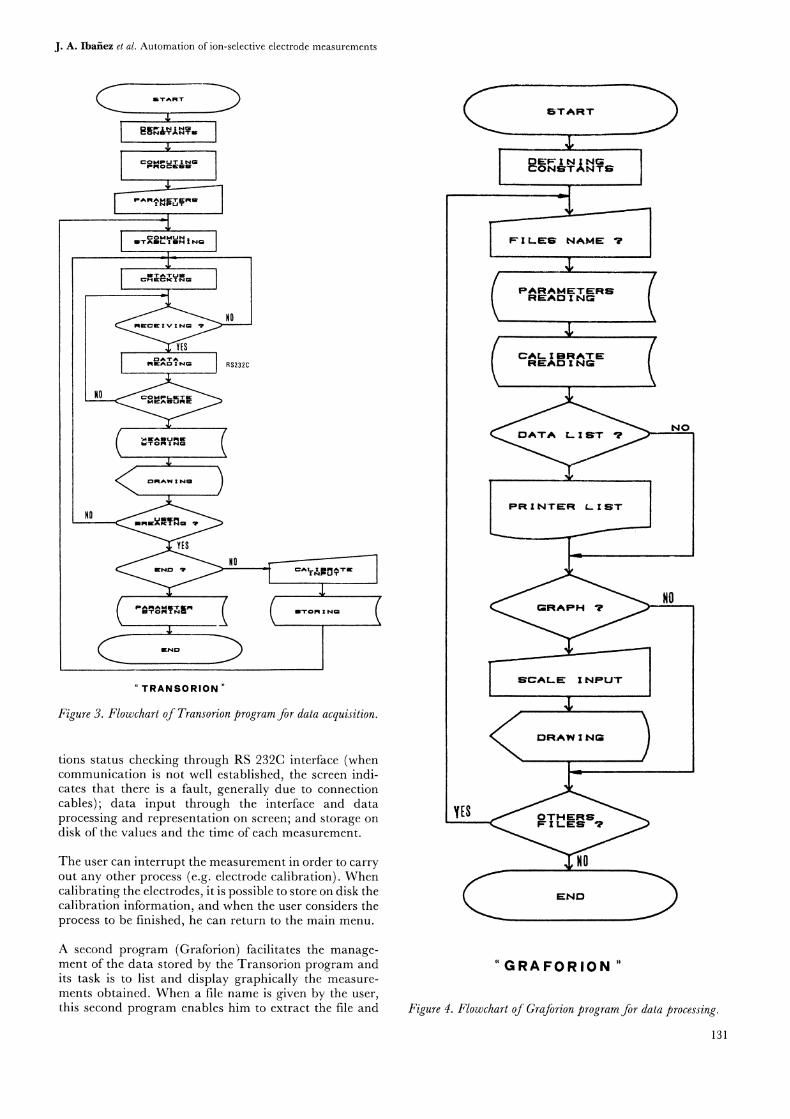
high resolution graphics screen, a printer (Olivetti DM286/2) and a plotter (Roland DXY 880); the operatingsystem is MS DOS. A program (Transorion) automatic-ally collects the measurements carried out by theionanalyzer. It manages the serial asynchronous com-munications interface and continually receives andprocesses the data received from the ionanalyzer. Whenthese data make up a complete measurement the programstores and displays them graphically on the screen. Thetransmission of this information can be interrupted at anytime so that additional information can be enteredthrough the keyboard or electrode calibrations carriedout. It is also possible to interrupt the program to returnto the main menu. Hence the program allows the realtime graphic representation of the measurements and canbe interrupted at any moment to realize other functions.
Figure 3 shows the flowchart of the Transorion and thecomplete development of the program. This program,written in GW BASIC language, is composed of thefollowing parts: Definition of constants and input ofnecessary parameters through the keyboard; communica-
Figure 2. Sample changer. (a) Variable speed stirring motor; (b) vessel for standards (1,2,3,4 and 5); (c) wash vessel (W)," (d) cellfortemperature probe; (e) measurement flow cell," (39 electrodes (reference and ISE); (g) temperature control probe; (h) sample outlet; (i)sample inlet; (j) inlet for thermostating liquid; and (k) outlet for thermostating liquid.
130
J. A. Ibafiez et al. Automation of ion-selective electrode measurements
"TRANSORION"
Figure 3. Flowchart of Transorion program for data acquisition.
tions status checking through RS 232C interface (whencommunication is not well established, the screen indi-cates that there is a fault, generally due to connectioncables); data input through the interface and dataprocessing and representation on screen; and storage ondisk of the values and the time of each measurement.
The user can interrupt the measurement in order to carryout any other process (e.g. electrode calibration). Whencalibrating the electrodes it is possible to store on disk thecalibration information, and when the user considers theprocess to be finished, he can return to the main menu.
A second program (Graforion) facilitates the manage-ment of the data stored by the Transorion program andits task is to list and display graphically the measure-ments obtained. When a file name is given by the user,this second program enables him to extract the file and
CAL Z BRATEREAD l NG
NO
SCALE !NPUT
NO
END
GRAFORION
Figure 4. Flowchart of Graforion program for data processing.
131
jo A. Ibafiez et al. Automation of ion-selective electrode measurements
t(h)
(a)
t(h)
(b)
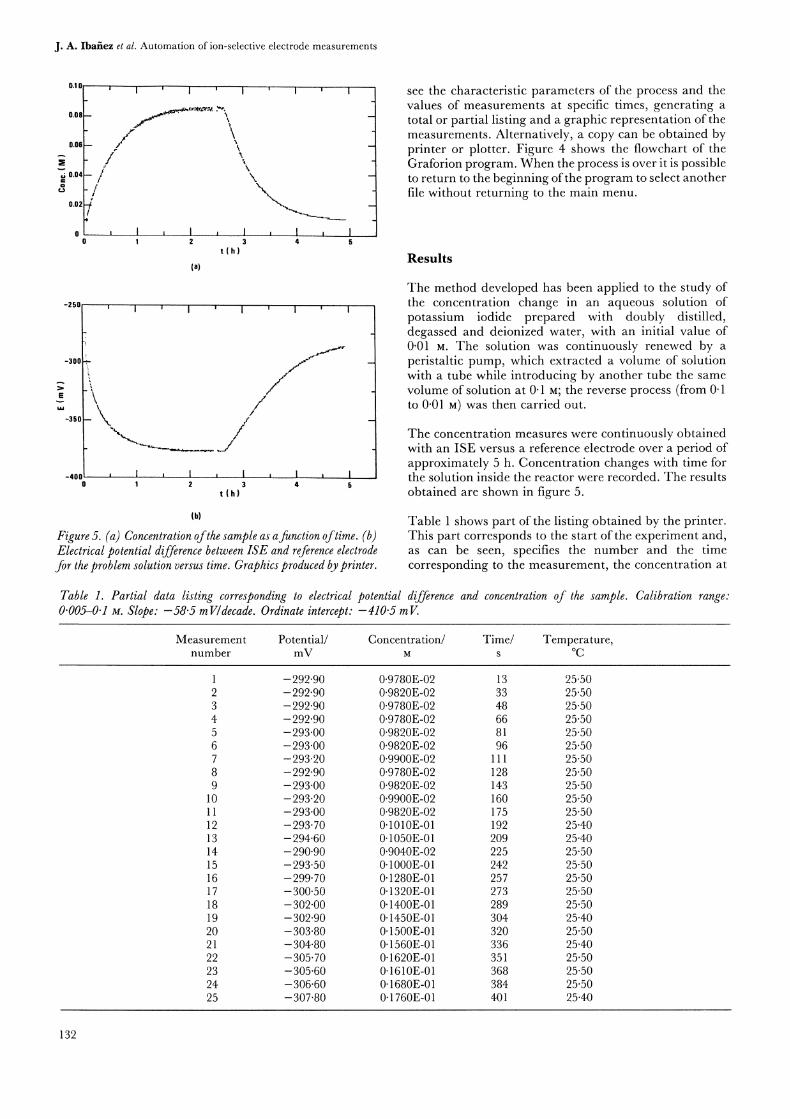
Figure 5. (a) Concentration ofthe sample as afunction oftime. (b)Electrical potential difference between ISE and reference electrodefor the problem solution versus time. Graphics produced by printer.
see the characteristic parameters of the process and thevalues of measurements at specific times, generating a
total or partial listing and a graphic representation of themeasurements. Alternatively, a copy can be obtained byprinter or plotter. Figure 4 shows the flowchart of theGraforion program. When the process is over it is possibleto return to the beginning ofthe program to select anotherfile without returning to the main menu.
Results
The method developed has been applied to the study ofthe concentration change in an aqueous solution ofpotassium iodide prepared with doubly distilled,degassed and deionized water, with an initial value of0"01 M. The solution was continuously renewed by a
peristaltic pump, which extracted a volume of solutionwith a tube while introducing by another tube the samevolume of solution at 0" M; the reverse process (from 0"to 0"01 ) was then carried out.
The concentration measures were continuously obtainedwith an ISE versus a reference electrode over a period ofapproximately 5 h. Concentration changes with time forthe solution inside the reactor were recorded. The resultsobtained are shown in figure 5.
Table shows part of the listing obtained by the printer.This part corresponds to the start of the experiment and,as can be seen, specifies the number and the timecorresponding to the measurement, the concentration at
Table 1. Partial data listing corresponding to electrical potential difference and concentration of the sample. Calibration range."0"005-0"1 yl. Slope: -58"5 m V/decade. Ordinate intercept: -410"5 m V.
Measurement Potential/ Concentration/ Time/ Temperature,number mV M C
292"90 0.9780E-02 13 25"502 292.90 0.9820E-02 33 25.503 292.90 0.9780E-02 48 25"504 292"90 0.9780E-02 66 25.505 293.00 0"9820E-02 81 25.506 -293.00 0.9820E-02 96 25.507 -293"20 0.9900E-02 111 25.508 -292.90 0.9780E-02 128 25.509 -293.00 0"9820E-02 143 25"5010 -293.20 0"9900E-02 160 25"5011 -293.00 0.9820E-02 175 25.5012 -293.70 0.1010E-01 192 25"4013 -294"60 0-1050E-01 209 25"4014 -290.90 0.9040E-02 225 25.5015 -293.50 0.1000E-01 242 25"5016 -299.70 0.1280E-01 257 25.5017 -300"50 0.1320E-01 273 25.5018 -302.00 0.1400E-01 289 25"5019 -302.90 0.1450E-01 304 25.4020 -303.80 0.1500E-01 320 25.5021 -304.80 0.1560E-01 336 25.4022 -305.70 0.1620E-01 351 25"5023 -305.60 0.1610E-01 368 25.5024 -306.60 0.1680E-01 384 25.5025 -307.80 0.1760E-01 401 25.40
132

j. A. Ibafiez et al. Automation of ion-selective electrode measurements
this time, the associated electrical potential differenceand, finally, the temperature.
Conclusion
The technique described in this paper is an efficient andreliable method for measuring concentration changeswith ISEs. The incorporation of a sample changer withmeasuring cell, thermostated in parallel with the reactor,allows the periodic calibration of ISEs and the measure-ment ofproblem concentrations at the same temperature,and can therefore eliminate errors.
Acknowledgement
The authors acknowledge financial support from theCICYT of the Spanish government under grant No.PB85-0240-C02-02.
References
1. IBAv.z,J. A. VICTORIA, L., ORTEGA-NAvAS,J. HERNNDEZ,A. and TEJERINA, F., Anales de Ffsica (B), 82 (1986), 213.
Calendar
JUNE25-30 June 1989 Eurosensors III and 5th International
Conference on Sensors and Actuators: Montreux, Switzerland.Contact Eurosensors (Transducers ’89), COMST S.A.,PO Box 415, 1001 Lausanne 1, Switzerland.
JULY30 July-5 August 1989 SAC 89: Cambridge, UK. ContactAnalytical Division, Royal Society ofChemistry, Burling-ton House, Piccadilly, London W1V 0BN.
SEPTEMBER
11-13 September 1989 RSC/SCI/IOP Surface AnalysisTechniques and Applications: Manchester, UK. Contact MrsE. S. Wellingham, Field End House, Bude Close, Nailsea,Bristol BS 19 2FQ.
20-22 September 1989 International Symposium on Detectionin Liquid Chromatography and Flow Injection Analysis: Cdr-doba, Spain. Contact Dr M. D. Luque de Castro, Dpto.Quimica Analitica, Facultad de Ciencias, 14004 C6r-doba, Spain.
25-27 September 1989 Sensors and their Applications IV:Canterbury, UK. The Meetings Officer, Institute ofPhysics, 47 Belgrave Square, London SW1X 8QX.
25-28 September 1989 Third International Symposium onKinetics in Analytical Chemistry: Dubrovnik, Yugoslavia. Con-tact Professor Gordana A. Milonovi(:. Department ofChemistry, University of Belgrade, KAC PO Box 550,11001 Belgrade, Yugoslavia.
26-28 September 1989 The British Laboratory Week:Olympia, London. Including Laboratory 89, ComputerAided Sciences, Bio 89, Medical Laboratory Sciences andAnalyticon. Contact Curtis Steadman and Partners, TheHub, Emson Close, Saffron Walden, Essex CB 10 1HL.
1990MARCH
5-9 March 1990 41st Pittsburgh Conference and Exposition on
Analytical Chemistry and Applied Spectroscopy: New York,USA. Contact The Pittsburgh Conference, 300 PennCenter Boulevard, Suite 332, Pittsburgh PA 15235, USA.
AUGUST
26-31 August 1990 Euroanalysis VII: Vienna, Austria.Contact Prof. Dr M. Grasserbauer, c/o Interconvention,Austria Center Vienna, A-1450 Vienna, Austria.
133

Submit your manuscripts athttp://www.hindawi.com
Hindawi Publishing Corporationhttp://www.hindawi.com Volume 2014
Inorganic ChemistryInternational Journal of
Hindawi Publishing Corporation http://www.hindawi.com Volume 2014
International Journal ofPhotoenergy
Hindawi Publishing Corporationhttp://www.hindawi.com Volume 2014
Carbohydrate Chemistry
International Journal of
Hindawi Publishing Corporationhttp://www.hindawi.com Volume 2014
Journal of
Chemistry
Hindawi Publishing Corporationhttp://www.hindawi.com Volume 2014
Advances in
Physical Chemistry
Hindawi Publishing Corporationhttp://www.hindawi.com
Analytical Methods in Chemistry
Journal of
Volume 2014
Bioinorganic Chemistry and ApplicationsHindawi Publishing Corporationhttp://www.hindawi.com Volume 2014
SpectroscopyInternational Journal of
Hindawi Publishing Corporationhttp://www.hindawi.com Volume 2014
The Scientific World JournalHindawi Publishing Corporation http://www.hindawi.com Volume 2014
Medicinal ChemistryInternational Journal of
Hindawi Publishing Corporationhttp://www.hindawi.com Volume 2014
Chromatography Research International
Hindawi Publishing Corporationhttp://www.hindawi.com Volume 2014
Applied ChemistryJournal of
Hindawi Publishing Corporationhttp://www.hindawi.com Volume 2014
Hindawi Publishing Corporationhttp://www.hindawi.com Volume 2014
Theoretical ChemistryJournal of
Hindawi Publishing Corporationhttp://www.hindawi.com Volume 2014
Journal of
Spectroscopy
Analytical ChemistryInternational Journal of
Hindawi Publishing Corporationhttp://www.hindawi.com Volume 2014
Journal of
Hindawi Publishing Corporationhttp://www.hindawi.com Volume 2014
Quantum Chemistry
Hindawi Publishing Corporationhttp://www.hindawi.com Volume 2014
Organic Chemistry International
ElectrochemistryInternational Journal of
Hindawi Publishing Corporation http://www.hindawi.com Volume 2014
Hindawi Publishing Corporationhttp://www.hindawi.com Volume 2014
CatalystsJournal of