automating impact data collection and developing
TRANSCRIPT
www.metoffice.gov.uk © Crow n Copyright 2018 Met Office
Automating impact data collection and developing frameworks to support evaluation of impact-based forecasts
Joanne Robbins1, Faye Wyatt1, Michelle Spruce2, Rudy Arthur2, Hywel Williams2
ECMWF UEF 2021
1st – 4th June
1 Met Office, Exeter, UK; 2 University of Exeter, UK
© Crow n Copyright 2018, Met Officewww.metoffice.gov.uk
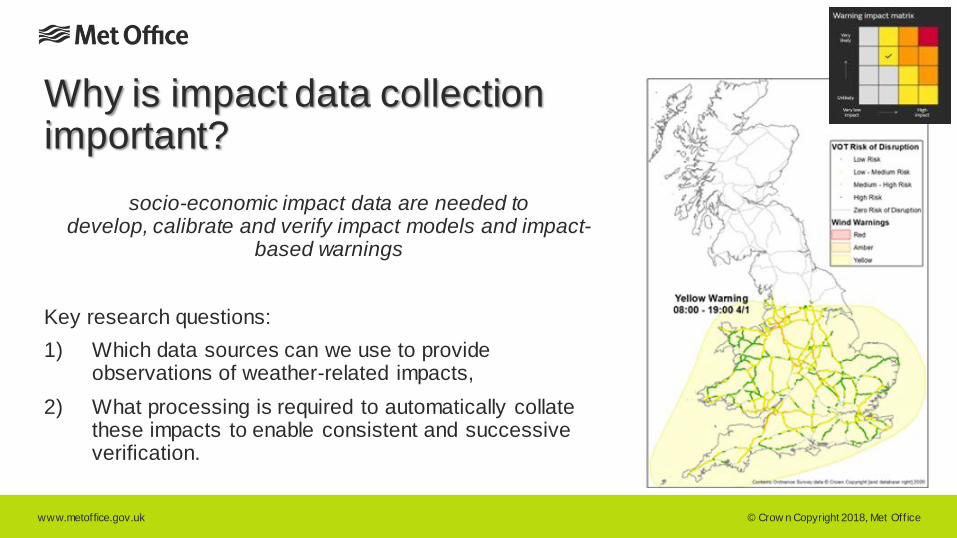
Why is impact data collection important?
socio-economic impact data are needed to develop, calibrate and verify impact models and impact-
based warnings
Key research questions:
1) Which data sources can we use to provide observations of weather-related impacts,
2) What processing is required to automatically collate these impacts to enable consistent and successive verification.

© Crow n Copyright 2018, Met Officewww.metoffice.gov.uk
Which data sources can we use to provide observations of weather-related impacts?
Met Office manually curated Global
impact database
Heavy Rainfall Database
Spatial_ID (entry ID)
Event_ID (hazard event ID)
Record Date
Start Date
End Date
Hazard Type (‘Heavy rainfall’ )
Trigger/Cause
Secondary Hazards
Hazard Notes
Country Name
Region/State/Province Name
Region/State/Province Latitude
Region/State/Province Longitude
Settlement Name
Settlement Latitude
Settlement Longitude
Impact Information
Impact Categorisation
References
• Labour-intensive
• Significant amount of detail in the
impact information
• Good accuracy in temporal and spatial
location of each record
• Increased likelihood of events not
being captured due to the resource
required for manual curation
Location of heavy rainfall impacts (February – December 2015)
261 heavy rainfall events were recorded, resulting in 853 impact
entries

© Crow n Copyright 2018, Met Officewww.metoffice.gov.uk
Traditional Media
Impact/Loss Databases
Impact Report Archives
EM-DAT
Floodlist
AHA Centre
Reliefweb
DFO
Social Media
National media
Local Media
Global media
Which data sources can we use to provide observations of weather-related impacts?
EM-DAT DesInventar DFO GLIDE Reliefweb FloodList AHA Centre Traditional Media Social MediaSpatial Scale Coarse Medium Medium Medium Medium Medium Fine Fine Variable
Magnitude High Variable High High High Moderate Moderate Moderate Variable
Accuracy Verif ied Good Good Verif ied Good Good Verif ied Good TBD
Use Type Publicly available Publicly available Publicly available Accessible Publicly available Accessible Accessible Accessible Accessible
Access Dow nloadable Dow nloadable Dow nloadable View report API View web page View web page View web page API
Usability Formatted Formatted Formatted Formatted Unformatted unformatted Semi-formatted Unformatted Unformatted
Threshold Bias Yes No Yes ? ? No No No No
Geographic bias ? Yes No No No No Yes No No
Hazard Bias No No Yes No No Yes No No ?
Accounting Bias No Yes Yes Yes No No No No ?
Temporal Bias ? ? ? ? No No No ? ?
• Biases associated with each data source
have been examined, together with their
accessibility and usability
Can we compile impact data into a single
source of “truth”?

© Crow n Copyright 2018, Met Officewww.metoffice.gov.uk
What processing is required to automatically collate impacts?
1. Automatically extract data
2. Identify locations, dates, and impacts
observed
3. Structure and classify data using
common framework/approach
4. Homogenize scales (spatial,
temporal, magnitude)
5. Identify unique events and link to
hazard event6. Validate/ verify
7. Assign data quality/confidence
score
8. Create spatial data record
Impact data collection roadmap tested using 7 data sources

© Crow n Copyright 2018, Met Officewww.metoffice.gov.uk
Extracting critical information from unstructured data
Key challenges
associated with step 2:
"Due to heavy rains since 16 March 2018 at 17:00hrs on the mountain, landslides hit the riverbed around Sentani causing flash floods with logs and sedimentary rocks that were channeled to the downstream. Nine villages in Sentani sub-district, Jayapura regency were affected. According to Sutopo Purwo Nugroho, the spoke person from the National Agency for Disaster Countermeasure or Badan Nasional Penganggulangan Bencana (BNPB), during eight hours of rains, the rainfall reached its extreme condition up to 235.1 mm/hour.There is an indication that landslide occurred in Cyclop Mountain which is the upstream area. Cyclop mountain is one of the conservation mountains in Papua. According to the information provided by BNPB and Meteorology, Climatology and Geophysical Agency that was compiled and circulated via e -mail by UNOCHA; as well as information from PMI, on Sunday, 17 March 2019, the flash flood affected nine sub districts in Jayapura regency, and four sub-districts in Jayapura city. Furthermore, according to the report: • Around 11,725 households are affected where among those 77 people died, 43 people missing, 74people injured, and 4,226 people displaced, who are scattered around various sites and evacuated to 6 different evacuation points. • Approximately 350 houses were damaged; while the water also inundated six areas, including 1,450houses in Gajah Mada, 1,000 in Jayapura, Kemiri dan Sentani, 200 district offices, and 200 in Doyo.• Water resource at Cyclop Mountain contaminated by mud and logs from the landslide. The number of casualties is estimated to increase as the evacuation process is still continuing and not all the affected areas have been reached by the joint Search and Rescue (SAR) team, as they are covered by trees, rocks, muds and other flash floods materials. ([IFRC, 20 Mar 2019](https://reliefweb.int/node/3042983))According to media reports as of 2 April at 8.00 UTC, 112 people are dead and at least 90 are still reported missing after flooding and landslides in Sentani District (Jayapura Regency, Papua Province) in mid-March. The National Disaster Management Agency reports more than 11 000 people displaced in 28 sites, 375 buildings severely damaged and four bridges collapsed. ([ECHO, 2 Apr 2019](https://reliefweb.int/node/3064108))"
(1) Wide variety of date formats used. Dates represent different things.
(2) Location naming conventions vary (as does spelling).(3) Linking numbers with impacts in a consistent way is challenging

© Crow n Copyright 2018, Met Officewww.metoffice.gov.uk
Structuring and classifying impact data
How best to classify impact magnitude?
• Compiled and verified database for each database (1 per data
source) by parsing out the impacts from the unstructured &
structured data
• Calculated impact magnitude for each event at the country scale.
The total and maximum impact scores were classified as low,
medium, high, very high based on historical event information.
• Human Loss: Deaths + Missing + Injuries
• Population Impact: Maximum (Families
affected or persons affected or persons
displaced)
• Infrastructure Impact: Damages
education + damages medical + damages
public + damages infrastructure
• Economic Impact: Damage house +
agriculture loss
Compiled database: number of events by impact
category and year
© Crow n Copyright 2018, Met Officewww.metoffice.gov.uk
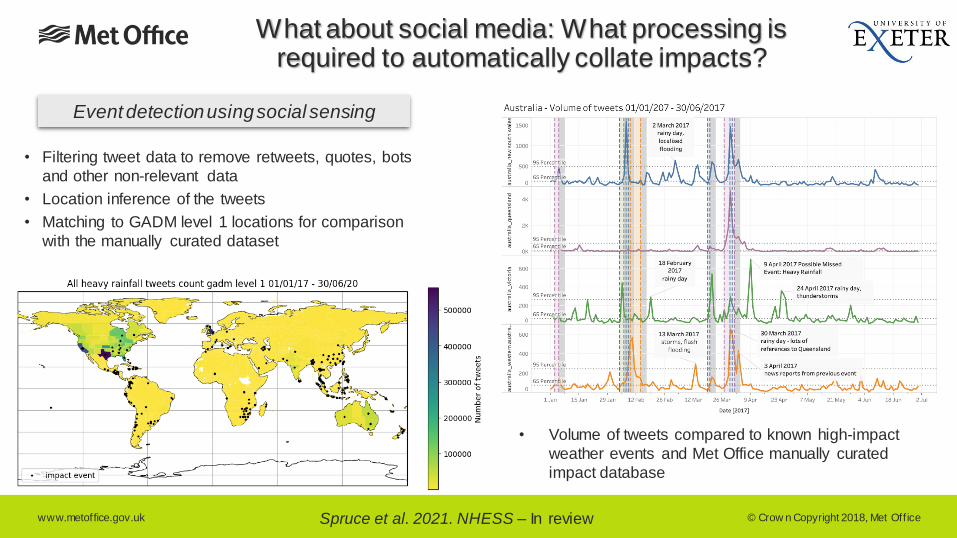
What about social media: What processing is required to automatically collate impacts?
• Filtering tweet data to remove retweets, quotes, bots
and other non-relevant data
• Location inference of the tweets
• Matching to GADM level 1 locations for comparison
with the manually curated dataset
Event detection using social sensing
• Volume of tweets compared to known high-impact
weather events and Met Office manually curated
impact database
Spruce et al. 2021. NHESS – In review

© Crow n Copyright 2018, Met Officewww.metoffice.gov.uk
Summary & On-going Research
• It is possible to automatically extract impact observations from a range of information
sources, however more agnostic methods will likely be needed.
• The use of multiple sources does add detail above singular sources but also introduces
complexity to the methodological framework
• Challenges that are actively being addressed in future work:
➢ Improvements to date and impact extraction
➢ Duplicates and update processing
➢ Improved understanding of the lag associated with sources
➢ Identifying processes to link impact information to hazards
➢ Testing of impact classification strategies
➢ Data visualisation
Better NLP extraction
Better event creation
Better IbF & IbW evaluation techniques
Questions?
Thank you for your attention!
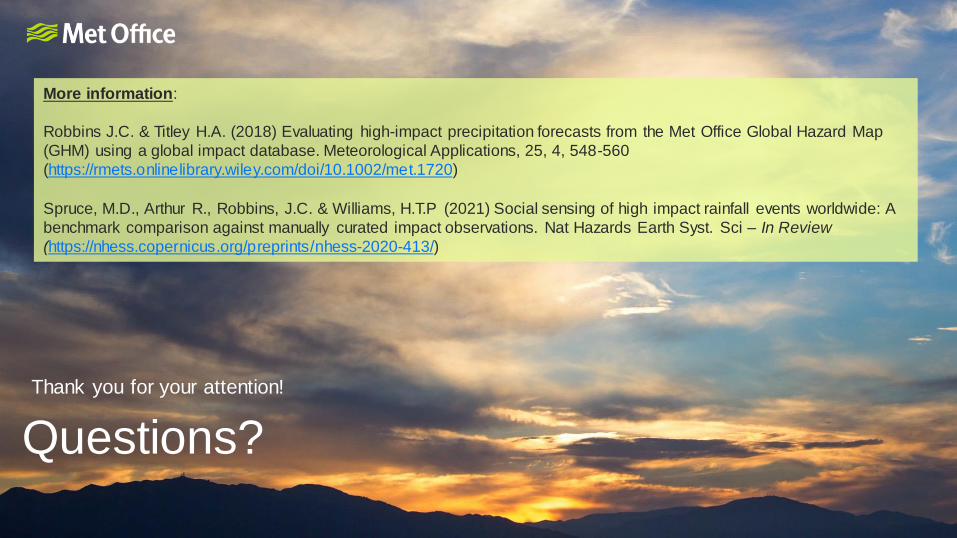
More information:
Robbins J.C. & Titley H.A. (2018) Evaluating high-impact precipitation forecasts from the Met Office Global Hazard Map
(GHM) using a global impact database. Meteorological Applications, 25, 4, 548-560
(https://rmets.onlinelibrary.wiley.com/doi/10.1002/met.1720)
Spruce, M.D., Arthur R., Robbins, J.C. & Williams, H.T.P (2021) Social sensing of high impact rainfall events worldwide: A
benchmark comparison against manually curated impact observations. Nat Hazards Earth Syst. Sci – In Review
(https://nhess.copernicus.org/preprints/nhess-2020-413/)