automation in blood processing and improvement in quality of the
TRANSCRIPT

Automation in Blood Processing and Improvement in Quality of the Blood ComponentsPast, Present and Future of the Automation Project in Brazil
Ricardo Omoto, MS
Scientific Consultant – FK TT Brazil

GOING BACK TO THE PAST…

BACK TO THE 90’s
� Blood Component therapy in the beginning…still using whole blood in transfusion;
� 1,500,000 donations/year;
� 70% of collections were done into the single and double bags. Use of sedimentation to separate red cells and plasma;
� Use of CPDA-1 as anticoagulant/preservative solution in 100% of blood collection;
� Blood Processing 100% Manual;
� Platelet Concentrates were produced by P.R.P. method;
� Quality Control and product specifications did not exist…attention was focused on prevention of HIV infection;
� The only available method for Leukodepletion was the washing procedures.

THINKING OF AUTOMATION…
� Manual removal of Buffy-Coat based upon the method developed by Dr.Prins and Dr. Loos (CLB, The Netherlands), 1980;
� Use of a “stomach clamp” to isolate the buffy-coat layer after a hard spin centrifugation.

MY FIRST COMPOMAT…
� Compomat G3 was first evaluated in Brazil in 1994, through a partnership between NPBI and Blood Centre of Sao Paulo
� First study with TAB bags in Brazil (1995) with concurrent production of Platelets from buffy-coat (pooling 4 or 5 BCs)
Compomat G3…I never forgot!

BACK TO THE PRESENT
“Yesterday is History.
Tomorrow is a mystery.
Today is a gift. That’s why
It is called the present”

2012…
� 3,500,000 donations/year
� 20% of double bags. No more whole blood for transfusion!
� Increasing use of SAGM (60% CPDA-1 and 40% SAGM)
� High demand for plasma for fractionation
� The need to improve processes to get more plasma/whole blood
� High demand for high quality blood components
� Production of Platelet Concentrates by BC methods
� Large use of TAB bags with in-line systems
� Increasing leukodepletion procedures
� 70% of bags are processed by automated system
� Quality Control of Blood Components is mandatory
� High demand for full process traceability

BUFFY-COAT METHOD
BC method is becoming the method of choice to produce plateletconcentrates
� Higher plasma yield
� Standardization of leukodepletion using in-line systems
� Improvements in Process Control
TAB Bag
Whole Blood
Red Cells Platelet Concentrate
Leukodepletion by filtration
Hard Spin Light spin
Dana Devine’s presentation at Hemo 2011

SAMPLES Weight (g) VOLUME (ml) LEU (mm3) LEU (x10
9) PLT (mm
3) PLT (x10
10/UNIT)
POOL 1 350 314 400 0.01 1,060,000 33.3
POOL 2 358 322 800 0.03 1,396,000 44.9
POOL 3 338 302 400 0.01 1,382,000 41.7
POOL 4 358 322 100 0.00 1,101,000 35.4
POOL 5 352 316 100 0.00 977,000 30.8
POOL 6 339 303 NR NR 1,344,000 40.7
POOL 7 326 290 NR NR 1,430,000 41.5
POOL 8 358 322 NR NR 1,582,000 50.9
AVERAGE 347 311 360 0.01 1,284,000 39.9
LOWER 326 290 100 0.00 977,000 30.8
HIGHER 358 322 800 0.03 1,582,000 50.9
PLATELET CONCENTRATES PREPARED BY BUFFY-COAT (5 BC UNITS)
100% ABOVE 30,0x10¹⁰
Data provided by HEMOPA

IMPROVEMENT IN PLASMA YIELD…

…COMPARED WITH PRP METHOD!
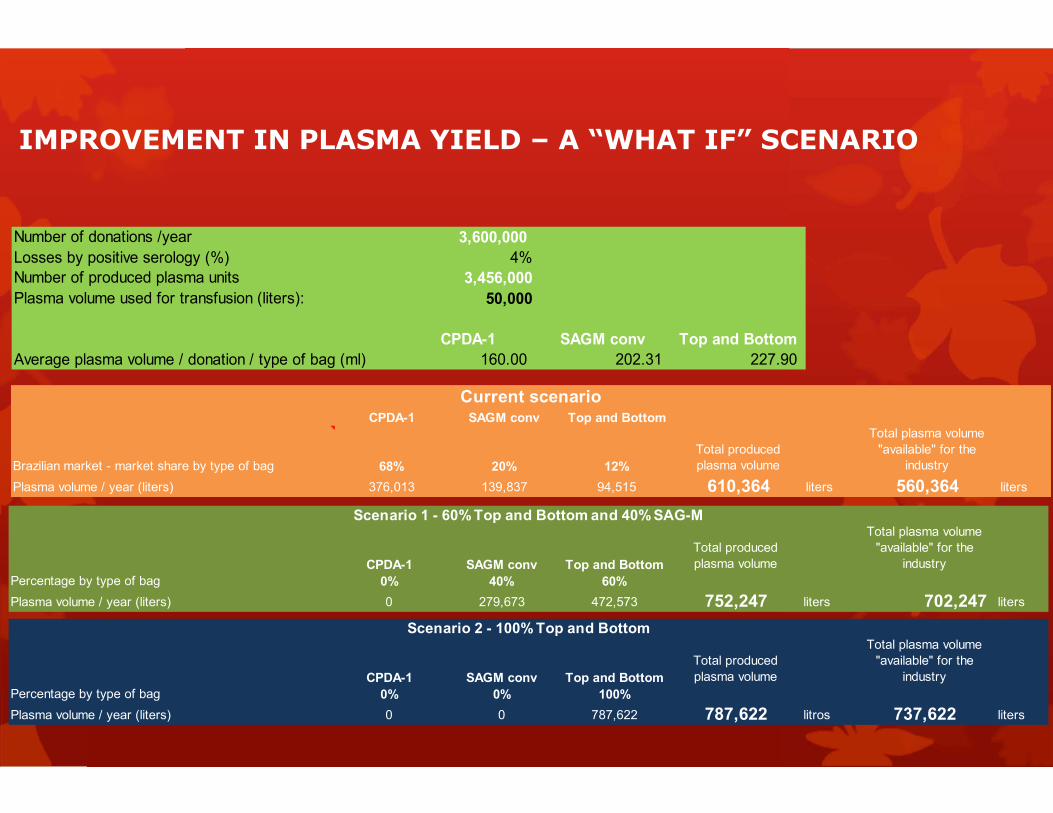
IMPROVEMENT IN PLASMA YIELD – A “WHAT IF” SCENARIO
CPDA-1 SAGM conv Top and Bottom
Brazilian market - market share by type of bag 68% 20% 12%
Total produced
plasma volume
Total plasma volume
"available" for the
industry
Plasma volume / year (liters) 376,013 139,837 94,515 610,364 liters 560,364 liters
Current scenario
CPDA-1 SAGM conv Top and Bottom
Total produced
plasma volume
Total plasma volume
"available" for the
industry
Percentage by type of bag 0% 40% 60%
Plasma volume / year (liters) 0 279,673 472,573 752,247 liters 702,247 liters
Scenario 1 - 60% Top and Bottom and 40% SAG-M
CPDA-1 SAGM conv Top and Bottom
Total produced
plasma volume
Total plasma volume
"available" for the
industry
Percentage by type of bag 0% 0% 100%
Plasma volume / year (liters) 0 0 787,622 787,622 litros 737,622 liters
Scenario 2 - 100% Top and Bottom
Number of donations /year 3,600,000
Losses by positive serology (%) 4%
Number of produced plasma units 3,456,000
Plasma volume used for transfusion (liters): 50,000
CPDA-1 SAGM conv Top and Bottom
Average plasma volume / donation / type of bag (ml) 160.00 202.31 227.90

AUTOMATION PROJECT
� > 2,0 Mio of whole blood donations are processed by the current Automation Project (levels 1 – 4) in Brazil;
� Levels 3 and 4 will move to level 5 by the end of 2013;
� New solutions will be added to the Automation Project in 2012 to improve quality and traceability of blood processing.
LEVEL 0
WithoutCOMPOMAT G4
LEVEL 1
COMPOMAT G4+Conventional Bags or TAB
LEVEL 2
COMPOMAT G41 optional+Interface System orTAB (pool) or In-line
LEVEL 3
COMPOMAT G4+Interface System+ In-line or TAB (pool)
LEVEL 4
COMPOMAT G4+Interface System+ TAB (pool)+In-line
LEVEL 5
COMPOMAT G5+Interface System+CompoFlow +TAB
(14%)
(18%)
(37%)(8%)
(23%) In Validation

“…A Dream Comes True”
TOTAL TRACEABILITY OF THE PROCESS!!!
When the Blood Bag is Fresenius the identification code is ISBT 128
Screening
Screening is defined:
• Volume
• Type of Blood Bag
These information are sent to the Blood Bank Software
Obs: In Bidirectional System the information is automatically sent to the mixer
In this system there is total security of information
Collection
� Blood Bag (code / batch);
� Tube
� Donor identification
� Operator
� Troubles
Automatically after donor identification program for use with this bag is defined by the system with the data:
- Collection Time
- Volume
- Type of Blood Bag
- Other information
CompoGuard Mixer
The results obtained after the collection are automatically sent to the Blood Bank Software:
Processing
CompoMat G4
The results obtained after the processing are automatically sent to the Blood Bank Software:
- Process Time
- Operator
- Weight of Bags
- Type of centrifuge
- Troubles
Automatically after donor identification Compomat G4 program for use with this bag is defined by the system
All results obtained after collecting the blood bag are analyzed automatically by the system and the program is defined in Compomat

WHAT HAS NOT CHANGED?
� Majority of the donations are still collected on site, not mobilecollections;
� The majority of the blood banks use more than one model ofblood bag/preservative solutions
� Hard to standardize blood processing when a diverse models ofblood bag systems are used simultaneously
� Generation of multiples blood components with different levels ofquality and specs
� Blood Inventory Management at risk
� Lack of a National Benchmark in blood component quality andprocessing.

WHAT IS COMING NEXT?
The Future in Blood Processing…

COMPOMAT G5 and COMPOFLOW

COMPOMAT G5 and COMPOFLOW
� Promising results in the validation performed at Hemominas Foundation in 2012.
� Reduced extraction time using G5 plus Compoflow (approx. 20% reduction in extraction time)
� Improved plasma yield
� Improved platelets yield using G5 new protocol
� Potentially reduction in RBC haemolysis during RBC extraction in TAB systems

WHAT WAS STILL MISSING?
Intelligence Module to integrate Process Data!

COMPOVISION

COMPOVISION
CompoVision™ integrates all process data ofFresenius blood bank devices, generatinginformation in real time and providing a newand innovative 360◦ view.
The user friendly interface of CompoVision™delivers critical information for instant decision,avoiding errors and improving safety for patients,blood donors and healthcare professionals.


� Based upon Veritas BI’s software platform, a nextgeneration web-based visualisation system, anddeveloped in partnership with Fresenius-Kabi,CompoVision can capture data from Microsoft SQLServer, OLAP cubes, Oracle, IBM, TeraData,DB2/400, Excel files, XML files or through WebServices.
� This integrating feature allows CompoVision toconnect with variety of blood bank devicesdatabase (Compomat G4, Compomat G5, CompoGuardand Quality Control systems) and build dashboardswithin a 3D cockpit-style interface.
� The 3D cockpit is a scalable display that canincorporate interrelated charts and reports on onescreen, providing a more holistic overview of processes.
COMPOVISION NETWORK
“A BENCHMARK TOOL FOR BLOOD QUALITY AND PROCESSING”

COMPOVISION NETWORK� Goals:
1. A Benchmark tool for the user group
2. Promote on-line meetings every 3 months, using apps like Webex,
Go to Meeting, etc.
3. “Share the Technology” among the Blood Centres involved in the
Automation Project
� Share know-how/experiences among the members
� Development of new KPIs for quality improvements
� Members of the User Group:
� 20 Blood Centres (built in the next 2 years)
� This user group will represent 60 – 70% of the total bloodprocessing in Brazil
� Use of Facebook as a common place to input new ideas/shareexperiences

ENDLESS POSSIBILITIES…
COMING SOON!!!

ENDLESS POSSIBILITIES…
AND JOIN US at www.facebook.com/CompoVisionNetwork
