autonomous crack displacement monitoring of a … crack displacement monitoring of a residence near...
TRANSCRIPT
Autonomous Crack Displacement Monitoring of a Residence Near a Quarry
David E. Kosnik, Northwestern University
Abstract
This paper describes the technology and methods deployed in the continuous autonomous remote mon-itoring of cracks in interior and exterior walls of a residence near a limestone quarry. The objective isto quantitatively compare crack response due to blast-induced ground motion to that induced by diurnaltemperature changes, weather fronts, occupant activity, and other phenomena. The remote monitoring andcommunication technology developed to obtain and disseminate crack response data for this study mayprovide the means to mitigate the effect of public concerns about potential impacts of ground vibrationsinherent in construction and production of raw materials; it is critical to address these concerns becausesubsequent litigation may result in delays and increased costs.
This communication technology consists of four components: displacement sensors with microinch res-olution, autonomous computer control, robust high-speed communication, and Internet display of results.Displacement transducers can be employed to compare the long-term (weather) and dynamic (ground mo-tion, occupant activity, and other events) response of cracks. Comparison of the response of the samecracks to both long-term and dynamic phenomena can be employed to distinguish between the large“silent” effects of weather and the smaller but “noisy” effects of blast-induced ground motion. Datafrom these sensors are electronically recorded and communicated back to a central digital repository fordisplay and analysis.
Throughout the study, it was found that the crack response to long-term weather effects was at least oneorder of magnitude greater than the response to blast-induced ground motion. Crack response to everydayhousehold events such as closing doors or pounding on walls was generally greater than or similar toresponse to blast-induced ground motion.
The remote monitoring system described operates continuously and autonomously. Data are made avail-able for review in near-real time via a password-protected web site. It is hoped that unmoderated, on-demand interaction with the measurements will allow greater public involvement with the vibration mon-itoring program and help assuage fears of damage to nearby property.

Introduction
New communication technology may provide the means to mitigate the effect of public concerns aboutpotential impacts of ground vibrations inherent in construction and production of raw materials. Theseconcerns result in delays and increased costs for construction and raw materials. For instance, neighborsof road aggregate quarries often perceive that their houses are being damaged by vibration resulting fromblasting at the quarry. Subsequent litigation and community action often increases the cost of aggregate,which increases the construction cost of any new projects in the area served by that quarry.
This new communication technology consists of four components: displacement sensors with microinchresolution, autonomous computer control, robust high-speed communication, and display of data via theInternet. Modern sensors capable of measuring microinch displacements can be employed to compareresponse of cracks to both long-term (weather) and dynamic (ground motion and occupant activity) phe-nomena. This comparison allows blaster and neighbors alike to distinguish between the large “silent”effects of weather and the smaller but “noisy” effects of ground motion. Data from these sensors are elec-tronically recorded and communicated back to a central digital repository. The data are then autonomouslydisplayed via the Internet for inspection by concerned parties, including the public, if desired. It is hopedthat unmoderated, on-demand public interaction with the measurements will allow greater involvementwith the vibration monitoring program.
Instrumentation
A residence in Naples, Florida, approximately 14 mile (0.4 km) from the property line of a road aggregate
quarry, was selected for instrumentation. The structure is a slab-on-grade house with stucco-over-CMU ex-terior walls. Two complementary instrumentation systems are employed in the house: a research-orientedcrack monitoring system, and a commercial system used for compliance purposes. Both systems measuretriaxial ground motion; however, only the commercial compliance system’s ground motion data were con-sidered for analysis in this study. The compliance geophone is buried well outside the structure to avoidcontamination of the excitation history by structural response. Three cracks were selected for monitoring:two in south-facing exterior walls and one in an interior wall. Each wall is oriented in an east-west di-rection; this plane corresponds to the transverse axis of the geophone. At each crack, one displacementtransducer was installed across the crack while an identical “null” transducer was positioned on a nearbyarea of uncracked wall surface. Crack response is measured in terms of crack displacement, i.e., changein crack width, rather than total crack width. Since it is a measure of change rather than absolute width,crack response may be positive (crack opening) or negative (crack closing).
A variety of microinch-resolution displacement transducers may be used for crack displacement monitor-ing, including LVDTs, eddy current sensors, and string potentiometers. The suitability of each of thesetransducer types to crack displacement monitoring was described by Siebert (2000), Louis (2000), andDowding et al. (2007), respectively. Kaman SMU-9000 non-contact eddy current displacement trans-ducers were selected for this study for several reasons, including their immunity to binding or stick-slipbehavior in the event of out-of-plane crack displacement and their small footprint on the wall; due tothe former, eddy current sensors can be successfully deployed and removed even in an historic building
subject to Federal preservation regulations (Baillot, 2004).
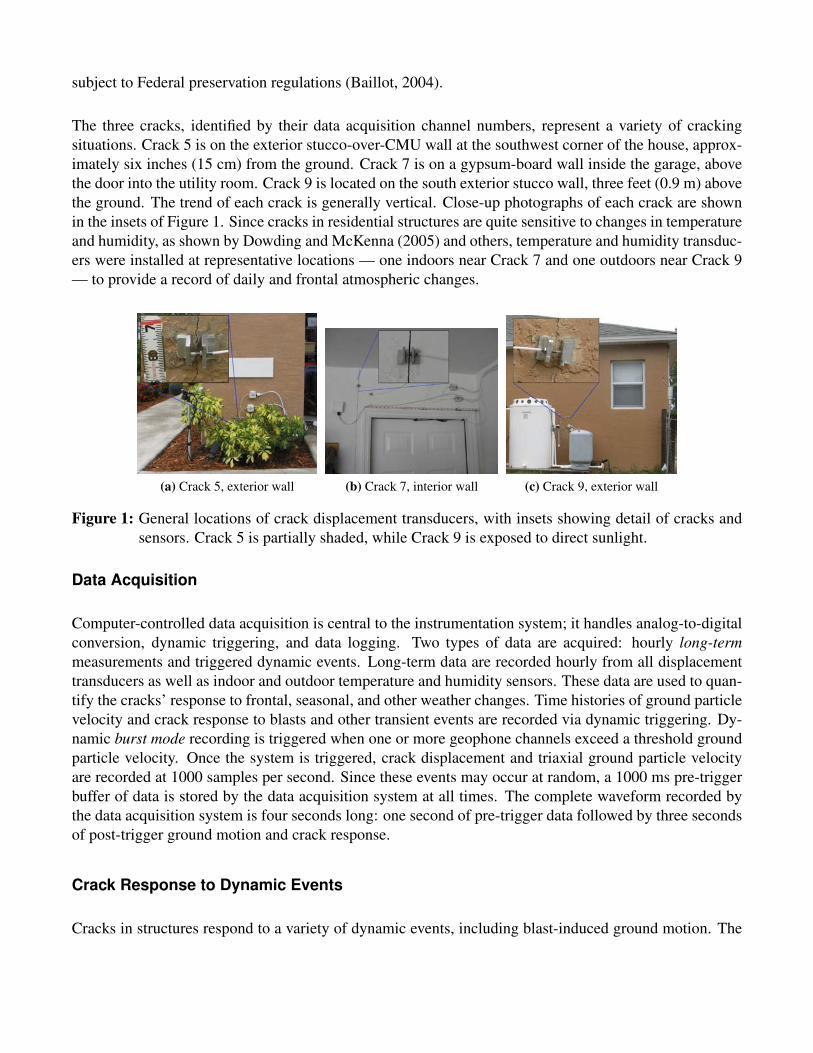
The three cracks, identified by their data acquisition channel numbers, represent a variety of crackingsituations. Crack 5 is on the exterior stucco-over-CMU wall at the southwest corner of the house, approx-imately six inches (15 cm) from the ground. Crack 7 is on a gypsum-board wall inside the garage, abovethe door into the utility room. Crack 9 is located on the south exterior stucco wall, three feet (0.9 m) abovethe ground. The trend of each crack is generally vertical. Close-up photographs of each crack are shownin the insets of Figure 1. Since cracks in residential structures are quite sensitive to changes in temperatureand humidity, as shown by Dowding and McKenna (2005) and others, temperature and humidity transduc-ers were installed at representative locations — one indoors near Crack 7 and one outdoors near Crack 9— to provide a record of daily and frontal atmospheric changes.
(a) Crack 5, exterior wall (b) Crack 7, interior wall (c) Crack 9, exterior wall
Figure 1: General locations of crack displacement transducers, with insets showing detail of cracks andsensors. Crack 5 is partially shaded, while Crack 9 is exposed to direct sunlight.
Data Acquisition
Computer-controlled data acquisition is central to the instrumentation system; it handles analog-to-digitalconversion, dynamic triggering, and data logging. Two types of data are acquired: hourly long-termmeasurements and triggered dynamic events. Long-term data are recorded hourly from all displacementtransducers as well as indoor and outdoor temperature and humidity sensors. These data are used to quan-tify the cracks’ response to frontal, seasonal, and other weather changes. Time histories of ground particlevelocity and crack response to blasts and other transient events are recorded via dynamic triggering. Dy-namic burst mode recording is triggered when one or more geophone channels exceed a threshold groundparticle velocity. Once the system is triggered, crack displacement and triaxial ground particle velocityare recorded at 1000 samples per second. Since these events may occur at random, a 1000 ms pre-triggerbuffer of data is stored by the data acquisition system at all times. The complete waveform recorded bythe data acquisition system is four seconds long: one second of pre-trigger data followed by three secondsof post-trigger ground motion and crack response.
Crack Response to Dynamic Events
Cracks in structures respond to a variety of dynamic events, including blast-induced ground motion. The

response of crack to dynamic events is often of concern to homeowners, as the events may be loud andstartling. While blasting often results in a measurable crack response, a variety of other phenomena, suchas truck traffic, thunder, wind gusts, and everyday household activities also cause crack responses; theeffects of blast vibration and household activities are considered in this study.
Eighteen blasts were conducted at the quarry between June 20 and December 13, 2007. Blasts wereconducted between 0.5 and 1.2 miles (0.8–1.9 km) from the instrumented house, and charge weightsvaried between 25 and 155 pounds (11.3–70.3 kg) per borehole (Jones, 2007); ground motion induced byblasting is a function of the amount of explosives detonated an any particular instant, i.e., the amount ina single hole, rather than the total amount detonated in the entire shot (Dowding, 1996). The maximumpeak particle velocity (PPV) measured at the house in the plane of the instrumented walls was 0.103 inchesper second (2.62 mm/s); the average PPV was 0.056 in/s (1.42 mm/s). In general, larger PPVs result ingreater crack responses, though the influence of excitation frequency is also important. Figure 2 comparesthe time histories of ground motion and crack response for the August 21 shot, which included the largestdynamic crack response observed in the study, 456 µin (11.6 µm) on Crack 7.
Figure 2: Comparison of time histories of ground motion in the plane of the walls containing the cracksand crack response from the August 21 shot, with maximum zero-to-peak ground particle ve-locity and crack responses labeled.
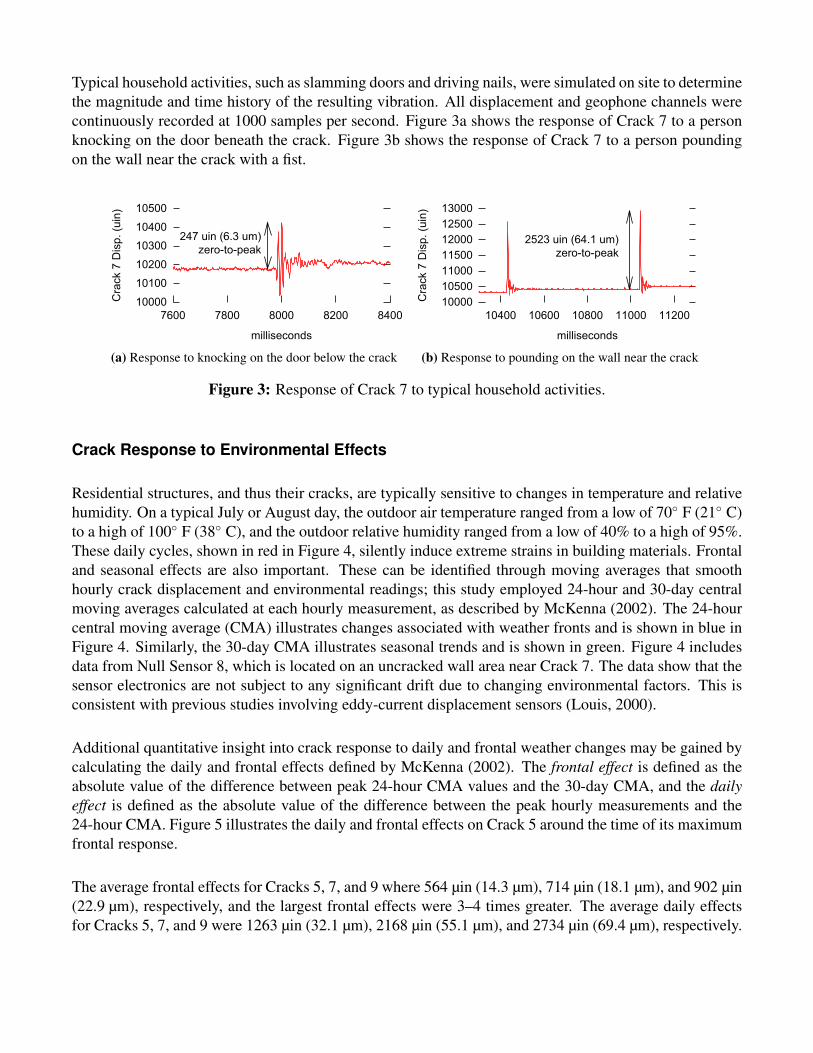
Typical household activities, such as slamming doors and driving nails, were simulated on site to determinethe magnitude and time history of the resulting vibration. All displacement and geophone channels werecontinuously recorded at 1000 samples per second. Figure 3a shows the response of Crack 7 to a personknocking on the door beneath the crack. Figure 3b shows the response of Crack 7 to a person poundingon the wall near the crack with a fist.
(a) Response to knocking on the door below the crack (b) Response to pounding on the wall near the crack
Figure 3: Response of Crack 7 to typical household activities.
Crack Response to Environmental Effects
Residential structures, and thus their cracks, are typically sensitive to changes in temperature and relativehumidity. On a typical July or August day, the outdoor air temperature ranged from a low of 70◦ F (21◦ C)to a high of 100◦ F (38◦ C), and the outdoor relative humidity ranged from a low of 40% to a high of 95%.These daily cycles, shown in red in Figure 4, silently induce extreme strains in building materials. Frontaland seasonal effects are also important. These can be identified through moving averages that smoothhourly crack displacement and environmental readings; this study employed 24-hour and 30-day centralmoving averages calculated at each hourly measurement, as described by McKenna (2002). The 24-hourcentral moving average (CMA) illustrates changes associated with weather fronts and is shown in blue inFigure 4. Similarly, the 30-day CMA illustrates seasonal trends and is shown in green. Figure 4 includesdata from Null Sensor 8, which is located on an uncracked wall area near Crack 7. The data show that thesensor electronics are not subject to any significant drift due to changing environmental factors. This isconsistent with previous studies involving eddy-current displacement sensors (Louis, 2000).
Additional quantitative insight into crack response to daily and frontal weather changes may be gained bycalculating the daily and frontal effects defined by McKenna (2002). The frontal effect is defined as theabsolute value of the difference between peak 24-hour CMA values and the 30-day CMA, and the dailyeffect is defined as the absolute value of the difference between the peak hourly measurements and the24-hour CMA. Figure 5 illustrates the daily and frontal effects on Crack 5 around the time of its maximumfrontal response.
The average frontal effects for Cracks 5, 7, and 9 where 564 µin (14.3 µm), 714 µin (18.1 µm), and 902 µin(22.9 µm), respectively, and the largest frontal effects were 3–4 times greater. The average daily effectsfor Cracks 5, 7, and 9 were 1263 µin (32.1 µm), 2168 µin (55.1 µm), and 2734 µin (69.4 µm), respectively.

The maximum daily effects comprise the largest crack responses observed during the study: 5410 µin(137.4 µm) for Crack 5, 7872 µin (199.9 µm) for Crack 7, and 10751 µin (273.1 µm) for Crack 9. As willbe shown in Figure 7, even the largest blast-induced crack responses recorded during this study are at leastone order of magnitude smaller than the crack responses induced by environmental changes.
Figure 4: Comparison of hourly readings (shown in red) with 24-hour central moving average (blue)and 30-day central moving average (green) for interior crack, null sensor, and environmentalconditions, showing sensitivity of crack to environmental conditions and negligible null sensorresponse.
Figure 5: Crack 5 response to maximum frontal effect with typical daily effect; hourly reading shown inred, 24-hour central moving average in blue, 30-day central moving average in green
Long-Term (Weather) vs. Blast- and Occupant-Induced Dynamic Effects
The data from the remote monitoring system clearly show that silent weather-induced crack responsesare larger than noisy vibratory/blast-induced crack responses. Figure 6 shows crack response from the

August 21 blast in the context of daily changes in temperature and humidity. This blast produced thelargest crack response and ground motions within 8% of the largest ground motions recorded in this study.In each case, the weather-induced crack response on the day of the blast is an order of magnitude greaterthan the dynamic response during the blast. This difference is even greater for blasts that produced smallground motions.
Figure 6: Comparison of daily and vibratory crack responses showing that crack responses to vibratoryexcitation is 20 times smaller than response to daily weather effects. The small dynamic re-sponse waveform in the circle is enlarged above the long-term crack response. After Aimone-Martin and Rosenhaim (2007).

Figure 7 compares the response of the three cracks to daily, frontal, and maximum weather effects withdynamic responses produced by occupant activities and blast-induced ground motion. The August 21 blastis featured for blast effects because the largest crack response recorded during the study, 456 µin (11.6 µm)on Crack 7, occurred during that event. The September 7 blast is a more typical event.
Figure 7: Comparison of crack response to environmental effects, occupant activity, and blast-inducedground motion. Peak particle velocity in the plane of the cracks for August 21, September 7,December 13 test, and December 13 production event is 0.087, 0.037, 0.040, and 0.065 in/sec(2.21, 0.94, 1.02, and 1.65 mm/sec) , respectively.
Communication
Responses must be transmitted from the test house to the central digital repository for processing in atimely manner in order to be useful. Since recording of dynamic events creates a large volume of data,it is preferable to transmit the data via a high-speed Internet connection. It is important to minimize thecommunication time because the data acquisition system is not able to record new data while old data arebeing uploaded. While no practical high-speed Internet connection was available at the residence, sucha connection was available at the on-site trailer at the quarry, 1.6 miles (2.6 km) away. Consequently,the communication link between the laboratory and the data acquisition system in the field consists of firstconnecting the residence to the quarry trailer and then connecting the trailer to the laboratory. An industrialwireless Ethernet link with high-gain antennas aligned via compass bearings was installed to maximizecommunication reliability through the 1.6 miles (2.6 km) of dense vegetation between the residence andthe trailer. Data transmission rates of 154 kb/sec are regularly realized. The wireless Ethernet endpointin the trailer is connected to an existing consumer-grade DSL modem and router in the trailer. ThisDSL connection provided a convenient Internet connection point. An industrial hardware VPN unit wasdeployed at the residence in order to reliably traverse the router’s network address translation system andprovide data security.

Autonomous Operation
Perhaps the most important aspect of this continuous remote monitoring installation is its autonomousoperation. Data are continuously acquired by the on-site datalogger at all times except during a nightlydownload window of less than 15 minutes. Every night, data are downloaded from the remote field com-puter, converted from the field computer’s proprietary data format, archived in the project database, anddisplayed on the project Web site without any human intervention. Figure 8a shows the autonomous dataflow from field site to end users.
Project Web Sites
Data recorded at the house are presented on a Web site for review and analysis. Since measurements fromfield sites are much more readily useful if they become available in a timely manner, custom software wasdeveloped to archive and display data in an Internet-accessible relational database as they arrive (Kosnik,2007). This Internet-enabled data management system eliminates barriers that often prevent the full andtimely utilization of remotely acquired data, including such tasks as manually downloading, parsing, andplotting new data. Storing all project data in an Internet-accessible relational database also eliminates theneed to traverse multiple data files in order to find data of interest. The Web site is password-protected soonly authorized parties may view the data. With this password system, the site can be opened to quarryneighbors in the future. In this capacity, the Web site would act as a powerful communication tool. Itwill be possible to display data within 24 hours of an event, as data are transmitted to the host computernightly. Figure 8b is an example page from the instrumentation Web site.
(a) Flow of remote monitoring data from field to digital repository(Kosnik, 2007)
(b) Screen capture of remote monitoring Web site
Figure 8: Data flow and Web site.

Conclusions
This paper has described the autonomous remote measurement of microinch responses of cosmetic cracksin a residence near a limestone quarry. Microinch-resolution displacement transducers were used to mea-sure the change in crack width in response to vibration from blasting, occupant activity, and changesin temperature and humidity. For each of the three instrumented cracks, the displacement due to daily,frontal, and seasonal changes in temperature and humidity was an order of magnitude greater than the dis-placement induced by blast vibration. Quantitative, scientific measurements of these phenomena contrastsharply with the qualitative perception, based on human senses, that blast vibrations are disruptive.
Commercial off-the-shelf sensors and a general-purpose commercial data acquisition system were usedin conjunction with specialized communication equipment and custom software to create a robust au-tonomous method to record sensor signals, transmit them to a central repository, and distribute them in areadily useful format via the Internet for interpretation, without human intervention.
References
Aimone-Martin, C. and Rosenhaim, V., 2007, ”Structure response study at the Pineville Quarry”, technicalreport, Aimone-Martin Associates LLC, Socorro, New Mexico.
Baillot, R., 2004, ”Crack response of a historic structure to weather effects and construction vibrations”,master’s thesis, Northwestern University, Evanston, Illinois.
Dowding, C.H., 1996, ”Construction Vibrations”, Prentice Hall, Upper Saddle River, New Jersey.
Dowding, C.H. and McKenna, L.M., 2005, ”Crack response to long-term environmental and blast vibra-tion effects”, Journal of Geotechnical and Geoenvironmental Engineering, 131(9).
Dowding, C.H., Ozer, H., and Marron, D.R., 2007, ”Potentiometers for measuring micro-inch crack dis-placements with wireless systems”, Proc. Eighth International Symposium on Rock Fragmentation byBlasting, Fragblast Section, International Society of Explosive Engineers, Cleveland, Ohio.
Jones, D., 2007, personal communication.
Kosnik, D.E., 2007, ”Internet-enabled geotechnical data exchange”, Proc. 7th Intl Symposium on FieldMeasurements in Geomechanics, Boston, Massachusetts.
Louis, M., 2000, ”Autonomous Crack Comparometer Phase II”, master’s thesis, Northwestern University,Evanston, Illinois.
McKenna, L.M., 2002, ”Comparison of measured crack response in diverse structures to dynamic eventsand weather phenomena”, master’s thesis, Northwestern University, Evanston, Illinois.
Siebert, D., 2000, ”Autonomous Crack Comparometer”, master’s thesis, Northwestern University, Evanston,Illinois.

References
Aimone-Martin, C. and Rosenhaim, V. (2007). Structure response study at the Pineville Quarry. Technicalreport, Aimone-Martin Associates LLC, Socorro, New Mexico.
Baillot, R. (2004). Crack response of a historic structure to weather effects and construction vibrations.Master’s thesis, Northwestern University, Evanston, Illinois.
Dowding, C. H. (1996). Construction Vibrations. Prentice Hall, Upper Saddle River, New Jersey.
Dowding, C. H. and McKenna, L. M. (2005). Crack response to long-term environmental and blastvibration effects. Journal of Geotechnical and Geoenvironmental Engineering, 131(9).
Dowding, C. H., Ozer, H., and Marron, D. R. (2007). Potentiometers for measuring micro-inch crackdisplacements with wireless systems. In Proc. Eighth International Symposium on Rock Fragmentationby Blasting, Cleveland, Ohio. Fragblast Section, International Society of Explosive Engineers.
Jones, D. (2007). Personal communication.
Kosnik, D. E. (2007). Internet-enabled geotechnical data exchange. In Proc. 7th Int’l Symposium on FieldMeasurements in Geomechanics, Boston, Massachusetts. American Society of Civil Engineers.
Louis, M. (2000). Autonomous Crack Comparometer Phase II. Master’s thesis, Northwestern University,Evanston, Illinois.
McKenna, L. M. (2002). Comparison of measured crack response in diverse structures to dynamic eventsand weather phenomena. Master’s thesis, Northwestern University, Evanston, Illinois.
Siebert, D. (2000). Autonomous Crack Comparometer. Master’s thesis, Northwestern University,Evanston, Illinois.