available online at envision …acfa.apeejay.edu/docs/volumes/envision-2016/envision... · ·...
TRANSCRIPT

Available online at http://afca.apeejay.edu
ENVISION – International Journal of Commerce and Management ISSN: 0973-5976 (P); 2456-4575 (E)
VOL-10, 2016
Page | 1
Equity Valuation of Public Sector Enterprises: Power Grid Corporation of
India Limited & ONGC Limited Anjala Kalsie,
Ashima Arora
ABSTRACT
The objective of the paper is to find the equity value of public sector enterprises i.e. Oil and
Natural Gas Corporation Limited (ONGC) and Power grid Corporation of India Limited.
The DCF valuation method was used for valuing the two companies. The cash flows were
projected by analysing the income statement, capital expenditure and changes in working
capital and were discounted to present value. The paper concludes that the current position
of the companies from investment prospects is positive. After analysis and valuation of
companies, a buy rating for POWERGRID and for ONGC was recommended for investor
having investment horizon of 5-6 years.
Keywords: Valuation, Power Grid, ONGC, DCF, Weighted Average Cost of Capital,
Terminal Value, Enterprise Value
1. Introduction
Company Overview
1.1 Power Grid Corporation of India Limited:
The Power Grid Corporation of India Limited (POWERGRID) is an Indian „Navaratna‟
Central Public Sector Enterprise, established in 1989. POWERGRID is a central transmission
Utilities Company headquartered in Gurgaon, India. It is India‟s largest electric power
transmission utility, listed in 2007. Government of India holds 57.90% stake in
POWERGRID and rest 42.10% by public. Company is listed in both NSE and BSE and
paying dividend since 1993.
Business Divisions: POWERGRID has mainly 3 divisions –
a) Power System Management: POWERGRID owns and operates more than 1,25,475
Ckt. kms network of transmission lines, 203 number of stations, 2,45,744 MVA
transformation capacity that constitutes most of India‟s interstate and inter-regional
electric power transmission system and carries electric power across India. Total
Inter-regional power transfer capacity is 53,150 MW.
b) Telecom: under the brand name „POWERTEL‟. The overhead optic fibre network
that employs Optical Ground Wire on power transmission lines is possessed
exclusively by POWERTEL in the country. Approximately, 36,563 km of Telecom
network is owned and operated by POWERGRID.
c) Domestic Consultancy: Advancing on its excellent techno-managerial expertise in
various field of power system, POWERGRID has been providing one stop
consultancy services to State Owned Utilities, Central Public Sector Undertakings,
Private Utilities, and Government departments. A client base of about 145 exists for
it in the power sector and which is still expanding.
POWERGRID group is consisting of 13 Joint Ventures and 10 Subsidiaries. POWERGRID
is dominant in national transmission, operating around 90% of inter-state / inter-regional
networks.
POWERGRID‟s national grid is managed through its wholly owned subsidiary Power
System Operation Corporation Limited (POSOCO).
Assistant Professor, Department of Management Studies, University of Delhi, Delhi 110007, India Doctoral Research Scholar, Faculty of Management Studies, University of Delhi, Delhi 110007, India

Equity Valuation of Public Sector Enterprises: Power Grid Corporation of India Limited & ONGC Limited
ENVISION - International Journal of Commerce and Management, Vol. (10), 2016 Page | 2
POWERGRID has leveraged its transmission business by exploring telecom market through
the union of power sector with telecom sector by facilitating low cost and high quality
telecom infrastructure on its existing and planned transmission infrastructure. POWERGRID
is providing consultancy services in the field of Power Transmission, Sub-transmission,
Distribution, Load Dispatch & Communication and Telecom sectors. Revenue Break-up as
per financial year 2015 is given in figure 1 below
Figure 1
1.2 Oil & Natural Gas Corporation Limited:
Oil and Natural Gas Corporation Limited (ONGC), incorporated in 1956 is an Indian multi-
national oil and gas company. ONGC is a Public Sector Enterprise under Government of
India, headquartered in Dehradun, India. Government of India holds 68.94% of stake and rest
by public. ONGC is listed in both NSE and BSE with market capitalization of over INR 2
trillion.
ONGC being an India‟s largest oil and gas exploration and production company
contributes about 79% (about 25% of India‟s total demand) to the India‟s crude oil
production and about 60% to its natural gas production. ONGC limited owns and
operates more than 26,600 km of pipelines, largest route length in India. Major
Products and services of ONGC are crude oil, natural gas supplies and other value
added products to oil and gas marketing companies.
ONGC has several subsidiaries and an international subsidiary ONGC Videsh
Limited operating in international markets having projects in 15 countries. ONGC
has two joint ventures: ONGC Tripura Power Company (OTPC) and ONGC Petro
Additions Limited. ONGC employs best-in-class infrastructure and facilities and
efficient technology in its operations.
ONGC has 7.59 billion tones of In-place hydrocarbon reserves, largest share of
hydrocarbon reserve in India. ONGC has 1/10th of total refining capacity of India.
ONGC produces over 3 million tons per year of value added products such as LPG, ,
Naphtha, C2 - C3, MS, Aviation Fuel, HSD SKO etc. ONGC has cumulatively
produced 851 Million Metric Tons (MMT) of crude and 532 Billion Cubic Meters
(BCM) of Natural Gas, from 111 fields.
ONGC in its roadmap for plan 2030 has mentioned that it aims to increase its
production by double to 130 million metric tons of oil and oil equivalent gas annually
over the period with 4%-5% growth rate. To increase ONGC Videsh limited
production by six times by 2030 it must generate over 6.5 GW power from nuclear,
wind and solar and 9 MTPA of LNG; and scale up refining capacity to over 20
MMTPA.
Initiatives for future - ONGC has taken structured steps to use unconventional energy
sources through unconventional gases like Underground Coal Gasification, Coal Bed
Methane, Shale Gas and Gas Hydrates, or unconventional energy sources like wind, solar
etc. ONGC has already commissioned a 50 MW Wind Farm in Gujarat and plan is to set up
another 100 MW Wind Farm in Rajasthan. Company has also set up three Solar Thermal
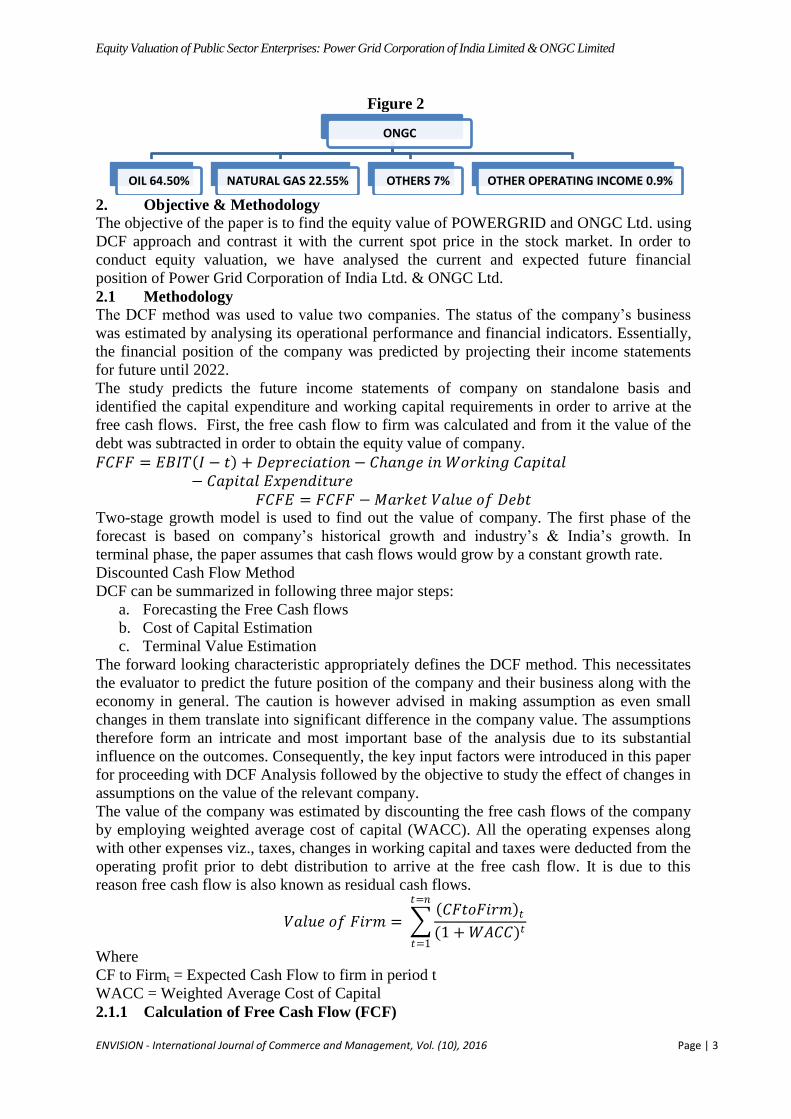
Engines at Solar Energy Centre. Revenue Break-up as per financial year 2015 is given in
figure 2 below :
POWERGRID
TRANSMISSION 92.52% TELECOM 1.55% CONSULTANCY 2.14%
Equity Valuation of Public Sector Enterprises: Power Grid Corporation of India Limited & ONGC Limited
ENVISION - International Journal of Commerce and Management, Vol. (10), 2016 Page | 3
Figure 2
2. Objective & Methodology
The objective of the paper is to find the equity value of POWERGRID and ONGC Ltd. using
DCF approach and contrast it with the current spot price in the stock market. In order to
conduct equity valuation, we have analysed the current and expected future financial
position of Power Grid Corporation of India Ltd. & ONGC Ltd.
2.1 Methodology
The DCF method was used to value two companies. The status of the company‟s business
was estimated by analysing its operational performance and financial indicators. Essentially,
the financial position of the company was predicted by projecting their income statements
for future until 2022.
The study predicts the future income statements of company on standalone basis and
identified the capital expenditure and working capital requirements in order to arrive at the
free cash flows. First, the free cash flow to firm was calculated and from it the value of the
debt was subtracted in order to obtain the equity value of company.
𝐹𝐶𝐹𝐹 = 𝐸𝐵𝐼𝑇 𝐼 − 𝑡 + 𝐷𝑒𝑝𝑟𝑒𝑐𝑖𝑎𝑡𝑖𝑜𝑛 − 𝐶𝑎𝑛𝑔𝑒 𝑖𝑛 𝑊𝑜𝑟𝑘𝑖𝑛𝑔 𝐶𝑎𝑝𝑖𝑡𝑎𝑙− 𝐶𝑎𝑝𝑖𝑡𝑎𝑙 𝐸𝑥𝑝𝑒𝑛𝑑𝑖𝑡𝑢𝑟𝑒
𝐹𝐶𝐹𝐸 = 𝐹𝐶𝐹𝐹 − 𝑀𝑎𝑟𝑘𝑒𝑡 𝑉𝑎𝑙𝑢𝑒 𝑜𝑓 𝐷𝑒𝑏𝑡 Two-stage growth model is used to find out the value of company. The first phase of the
forecast is based on company‟s historical growth and industry‟s & India‟s growth. In
terminal phase, the paper assumes that cash flows would grow by a constant growth rate.
Discounted Cash Flow Method
DCF can be summarized in following three major steps:
a. Forecasting the Free Cash flows
b. Cost of Capital Estimation
c. Terminal Value Estimation
The forward looking characteristic appropriately defines the DCF method. This necessitates
the evaluator to predict the future position of the company and their business along with the
economy in general. The caution is however advised in making assumption as even small
changes in them translate into significant difference in the company value. The assumptions
therefore form an intricate and most important base of the analysis due to its substantial
influence on the outcomes. Consequently, the key input factors were introduced in this paper
for proceeding with DCF Analysis followed by the objective to study the effect of changes in
assumptions on the value of the relevant company.
The value of the company was estimated by discounting the free cash flows of the company
by employing weighted average cost of capital (WACC). All the operating expenses along
with other expenses viz., taxes, changes in working capital and taxes were deducted from the
operating profit prior to debt distribution to arrive at the free cash flow. It is due to this
reason free cash flow is also known as residual cash flows.
𝑉𝑎𝑙𝑢𝑒 𝑜𝑓 𝐹𝑖𝑟𝑚 = 𝐶𝐹𝑡𝑜𝐹𝑖𝑟𝑚 𝑡(1 + 𝑊𝐴𝐶𝐶)𝑡
𝑡=𝑛
𝑡=1
Where
CF to Firmt = Expected Cash Flow to firm in period t
WACC = Weighted Average Cost of Capital
2.1.1 Calculation of Free Cash Flow (FCF)
ONGC
OIL 64.50% NATURAL GAS 22.55% OTHERS 7% OTHER OPERATING INCOME 0.9%

Equity Valuation of Public Sector Enterprises: Power Grid Corporation of India Limited & ONGC Limited
ENVISION - International Journal of Commerce and Management, Vol. (10), 2016 Page | 4
The cash flows for DCF valuation can be estimated using two ways:
i. First, by employing free cash flows to firms (FCFF) facilitating cash flows to both
the debt and equity holders, or
ii. Secondly by employing free cash flow to equity (FCFE) facilitating cash flows to
only the equity holders of the company.
The difference between FCFF and FCFE is that the former, FCFF employs inputs based
upon accounting figures which had been estimated before the distribution of interest to the
debt holders. Alternatively, FCFE employs inputs from which interest payments have
already been deducted. Further, FCFF yields the enterprise value of the company whereas
FCFE yields the equity value. Since, all liabilities, debt and equity of a company holds
relevance for the acquirer, FCFF emerges as a more appropriate and favoured approach than
FCFE.
The FCFF is estimated by subtracting taxes from earnings before interest and taxes (EBIT)
of the company which yields net operating profit after tax (NOPAT). It is followed by the
subtraction of capital expenditure and any increase in net working capital (NWC). Increase
in NWC is subtracted because it does not signify actual cash flows. Further, capital
expenditure represents the cost incurred i.e., cash outflow to acquire the capital asset for the
company and accordingly is found on the asset side of the balance sheet.
The formula for calculating the FCFF is shown below:
𝐹𝐶𝐹𝐹 = 𝐸𝐵𝐼𝑇 1 − 𝑡 + 𝐷&𝐴 − 𝐼𝑛𝑐𝑟𝑒𝑎𝑠𝑒 𝑖𝑛 𝑁𝑒𝑡 𝑊𝑜𝑟𝑘𝑖𝑛𝑔 𝐶𝑎𝑝𝑖𝑡𝑎𝑙 − 𝐶𝑎𝑝𝑒𝑥 Where, FCFF = Free Cash Flow for firms,
EBIT = Earning before interest and tax
t = tax ratein percentage
D&A = Depreciation and Amortization
Capex = Capital Expenditure
2.1.2 Weighted Average Cost of Capital
An extensive analysis of both the company‟s financial structure and current market situation
is required for the effective estimation of the discount rate. This discount rate employed for
discounting the FCFF is known as Weighted Average Cost of Capital (WACC). The firm
value is highly sensitive to changes in WACC underling its immense significance in the
DCF model. A small change in WACC would yield significant change in firm‟s value.
WACC is estimated by multiplying the cost of source of capital with their proportionate
weight in the company‟s overall capital structure.
Therefore the formula for the WACC calculation is:
𝑊𝐴𝐶𝐶 =𝐸𝑞𝑢𝑖𝑡𝑦
𝐷𝑒𝑏𝑡 + 𝐸𝑞𝑢𝑖𝑡𝑦× 𝐶𝑜𝑠𝑡 𝑜𝑓 𝐸𝑞𝑢𝑖𝑡𝑦 +
𝐷𝑒𝑏𝑡
𝐷𝑒𝑏𝑡 + 𝐸𝑞𝑢𝑖𝑡𝑦× 𝐶𝑜𝑠𝑡 𝑜𝑓 𝐷𝑒𝑏𝑡
Cost of Equity
The cost of equity (Ke) is calculated with the help of the capital asset pricing model
(CAPM). The CAPM reveals the return that investors require for bearing the risk of holding
a company's share. This required return is the return on equity (ROE) that investors demand
to bear the risk of holding the company's share, and is therefore equivalent to the company's
cost of equity.
According to the CAPM, the required ROE, or in this case the Ke is derived with the
following formula
𝐾𝑒 = 𝑟𝑓 + 𝛽 (𝑟𝑚 − 𝑟𝑓)
Where, Ke = is the cost of equity
𝑟𝑓= is the risk-free rate of return
𝑟𝑚 = Expected market returns
Equity Valuation of Public Sector Enterprises: Power Grid Corporation of India Limited & ONGC Limited
ENVISION - International Journal of Commerce and Management, Vol. (10), 2016 Page | 5
β = refers to systematic risk of a security or a portfolio
Cost of Debt
The interest rate which a company is obliged to pay to its investors on its outstanding debt is
known as cost of debt (Kd). The company‟s credit rating significantly influences its Kd.
Credit worthiness estimated through credit rating along with the market conditions together
determines the credit spread of the company. Credit spread indicates as the difference
between risk-free interest rate and interest rate offered by the company on its borrowed
capital. Consequently, dependence of overall market conditions forms an essential feature in
the calculation of Kd, particularly during the period when the company has a high leverage
ratio.
Cost of debt is essentially lower than interest rate paid by a company to its debt holders
because the interest rate costs are tax deductible in most economies. The Kd post-tax is
computed as follows:
𝐾𝑑 = 𝑖(1 − 𝑡) Where, Kd = Cost of Debt,
i = interest rate on outstanding debt, and
t = effective tax rate
Conclusively, Ke assists in the estimation of WACC. Ke, in turn is estimated through CAPM
model with its underlying assumptions for beta. On the other hand, Kd is estimated through
interest rate that the company pays to its debt holders along with the corporate tax rate
applicable on profits. Thus, changing the assumptions for the cost of capital would
significantly impact the value of the firm.
2.1.3 Calculation of Terminal Value
Terminal Value is estimated through the NPV of all future cash flow accruing after the time
period covered by the scenario analysis. Terminal value is based on average growth
expectations which are relatively easier to predict.
Thus, the assumption of constant growth rates for the time following the time period that
was analysed more extensively holds much significance for the estimation of terminal value.
Therefore, terminal value is determined by using simple dividend discount model that
employs constant perpetual growth rate “g”, and WACC as the discount rate “r”.
Correspondingly, the TV can be expressed as where the FCF is one period before the TV
period:
𝑇𝑉 = 𝐹𝐶𝐹𝑡𝑣 ×𝑟 + 𝑔
1 − 𝑔
Re-discounting of terminal value is required as these cash flows in entirety are discounted to
a date in the future and also so as to obtain the NPV of all free cash flows that emerges for
post-prediction period. Further, perpetual growth rate must be in line with nominal GDP
growth.
2.1.4 Determining Firm Value
The terminal value is discounted to its NPV when both the NPV of cash flows accruing
within the scenario period and terminal value itself had been determined. Using additive
property of NPV, both NPV are added to yield enterprise value or equity value
corresponding to the method of valuation employed i.e., FCFF or FCFE.
𝐶𝑜𝑚𝑝𝑎𝑛𝑦 𝑉𝑎𝑙𝑢𝑒 = 𝐹𝐶𝐹 𝑡(1 + 𝑟)𝑡
+𝑇𝑉
(1 + 𝑟)𝑛+1
𝑡=𝑛
𝑡=1
Generally, the company value is estimated by employing different levels of leverage to
discover an optimal financial structure. The company value estimated is then employed for

Equity Valuation of Public Sector Enterprises: Power Grid Corporation of India Limited & ONGC Limited
ENVISION - International Journal of Commerce and Management, Vol. (10), 2016 Page | 6
further analysis. For instance, the equity value obtained can be used to estimate a fair share
price for listed companies by dividing it with the number of shares outstanding.
All financial data has been taken from company‟s annual report listed on website and all
other information used which is available in public domain. Several assumptions were made
based on the company‟s annual report, management outlook which was published in annual
report, industry outlook.
The valuation is based on the following assumptions:
i. Compounded quarterly growth rates were used to estimate the total revenues for the
FY 2015 and onwards.
ii. Revenues are assumed to grow at a constant positive rate every quarter.
iii. Operating margins were assumed to be stagnant over the years reflecting no increase.
In other words, a conservative measure of operating margin was considered.
iv. It was assumed that the company did not issue new shares.
v. Assumption was made that there was no change in number of debentures issued,
number of preference shares issued, and thus impacting number of diluted shares.
vi. Company was not found to be under any long-term debt burden and it was assumed to
maintain this status-quo in near-future as well.
vii. Correspondingly, no dividends were issued and it was assumed to maintain this
status-quo in near-future as well. The shareholders earned their returns through an
increase in market price of the shares.
viii. No shares would be issued by the company in future.
ix. It is assumed that fair value of assets and liabilities of the company is equal to its
present book value.
x. Company will continue to use straight line depreciation method.
xi. Tax rate is assumed to be 25%.
xii. After a substantial time gap, the long term growth rate of the company will reduce to
long term economic growth rate. World Bank had estimated India‟s real GDP growth
rate at 7.8%. It is assumed that the company will grow at around rate of 7.5%.
3. Equity Valuation: Power Grid Corporation of India Limited.
Analysis of growth figures
1. Revenue – The revenue growth has been forecasted based on the historical growth rates
and also power sector dynamics, industry competitiveness of company and country‟s
growth. In previous years, demand for electricity has increased substantially and is
expected to continue in the future as still large numbers of households are not electrified.
Large number of households without electricity and rising income levels and large
spending by the government in infrastructure in last one year is also driving the growth.
2. EBITDA Margin – Operating Margin of the company has been increasing over last some
years due to growth in electricity demand and India is emerging economy. With the
current economic scenario and growth in power sector and optimistic market sentiments,
we expect growth to continue. For each forecasted year operating margin has been
calculated using the primary building blocks like operating expenses and depreciation. We
expect long term operating margin to be 15% - 20%. Each of the following building
blocks were calculated using relevant drivers such as historical data and company‟s future
plans whose information was obtained from company‟s annual report.
3. Operating Expenses – Operating expenses were obtained using company‟s historical
expenses and future business plans and growth of operating expenses were calculated
based on the growth of revenue. Mainly, operating expenses were derived from the
transmission assets, administration and other expenses consist primarily of costs of the
repair and maintenance of buildings, plant and machinery and power charges.
Equity Valuation of Public Sector Enterprises: Power Grid Corporation of India Limited & ONGC Limited
ENVISION - International Journal of Commerce and Management, Vol. (10), 2016 Page | 7
4. Depreciation & Amortization – The depreciation charges have been obtained as an
average percentage of historical data. The company has revised depreciation charge on
certain fixed assets w.e.f. April‟1st‟2014. By charging depreciation at the revised
depreciation rates, the depreciation charge for the year ended 31st March, 2015 is higher
by Rs. 22.31 Cr. and profit before tax for the year is lower by Rs. 22.31 Cr.
5. Capital Expenditure – POWERGRID sets capital expenditure target on the basis of 5
year plan. POWERGRID increased its target capital expenditure (capex) for XIIth
Five
Year Plan from Rs. 1,00,000 Cr. to Rs. 1,10,000 Cr. Capital expenditure of 65,651 Cr.
cumulatively has been achieved in first three years of 5 year plan. For the capex of FY
2014-15, 13,014 Cr. were mobilized through private placement of bonds & term loan,
3,070 Cr. were mobilized through External Commercial Borrowings (ECB)/Suppler credit
and balance, 6372 Cr. was met through internal resources generated & Fellow on Public
Offering proceeds. Company‟s capital expenditure is primarily for the installation of new
transmission capacity and the expansion of existing capacity. We have assumed capital
expenditure for the 13th
Five Year plan of around Rs. 1,00,000 Cr. Net capex is calculated
by deducting the depreciation from capital expenditure incurred for a particular year.
6. Working Capital – POWERGRID calculates its working capital as: (i) consisting of
receivables equivalent to two months of fixed cost; (ii) maintenance spares at 15% of
operation and maintenance expenses; and (iii) operation and maintenance expenses for
one month.
7. Tax Rate – Tax rate is assumed to be 25%. Finance Minister of India in his budget for FY
2015 announced that corporate tax rate to be reduced from 30% to 25% in the next five
years.
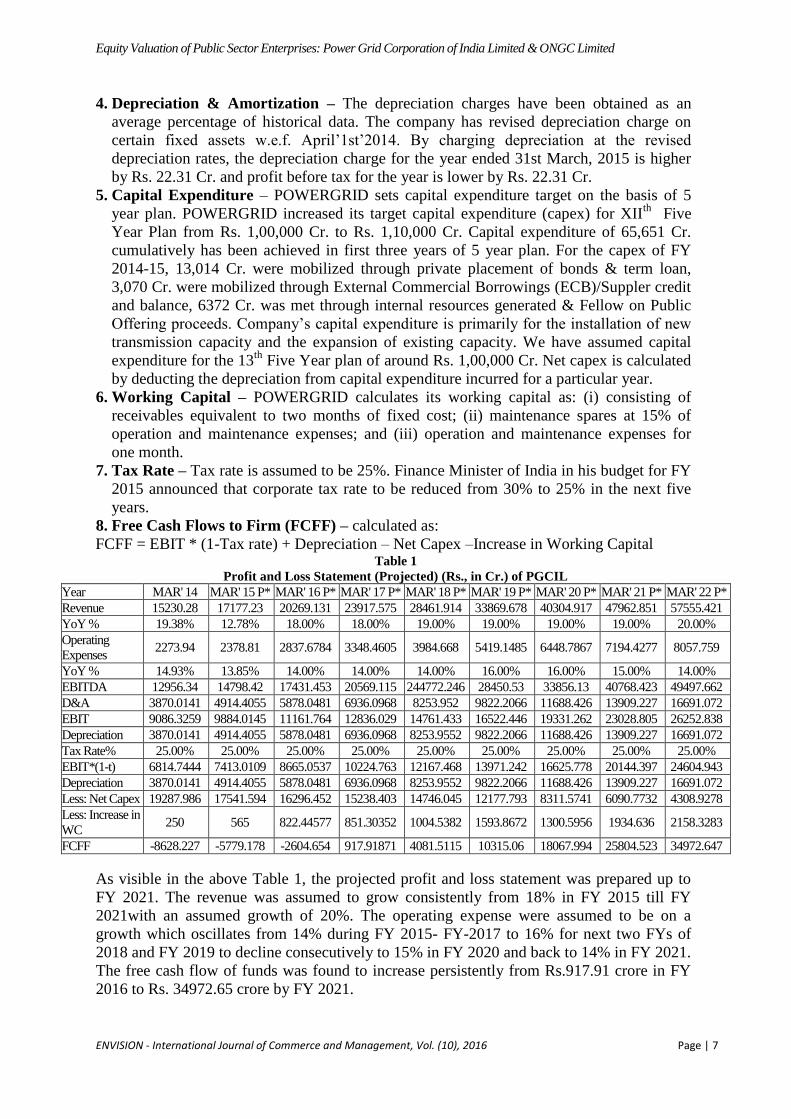
8. Free Cash Flows to Firm (FCFF) – calculated as:
FCFF = EBIT * (1-Tax rate) + Depreciation – Net Capex –Increase in Working Capital Table 1
Profit and Loss Statement (Projected) (Rs., in Cr.) of PGCIL
Year MAR' 14 MAR' 15 P* MAR' 16 P* MAR' 17 P* MAR' 18 P* MAR' 19 P* MAR' 20 P* MAR' 21 P* MAR' 22 P*
Revenue 15230.28 17177.23 20269.131 23917.575 28461.914 33869.678 40304.917 47962.851 57555.421
YoY % 19.38% 12.78% 18.00% 18.00% 19.00% 19.00% 19.00% 19.00% 20.00%
Operating
Expenses 2273.94 2378.81 2837.6784 3348.4605 3984.668 5419.1485 6448.7867 7194.4277 8057.759
YoY % 14.93% 13.85% 14.00% 14.00% 14.00% 16.00% 16.00% 15.00% 14.00%
EBITDA 12956.34 14798.42 17431.453 20569.115 244772.246 28450.53 33856.13 40768.423 49497.662
D&A 3870.0141 4914.4055 5878.0481 6936.0968 8253.952 9822.2066 11688.426 13909.227 16691.072
EBIT 9086.3259 9884.0145 11161.764 12836.029 14761.433 16522.446 19331.262 23028.805 26252.838
Depreciation 3870.0141 4914.4055 5878.0481 6936.0968 8253.9552 9822.2066 11688.426 13909.227 16691.072
Tax Rate% 25.00% 25.00% 25.00% 25.00% 25.00% 25.00% 25.00% 25.00% 25.00%
EBIT*(1-t) 6814.7444 7413.0109 8665.0537 10224.763 12167.468 13971.242 16625.778 20144.397 24604.943
Depreciation 3870.0141 4914.4055 5878.0481 6936.0968 8253.9552 9822.2066 11688.426 13909.227 16691.072
Less: Net Capex 19287.986 17541.594 16296.452 15238.403 14746.045 12177.793 8311.5741 6090.7732 4308.9278
Less: Increase in
WC 250 565 822.44577 851.30352 1004.5382 1593.8672 1300.5956 1934.636 2158.3283
FCFF -8628.227 -5779.178 -2604.654 917.91871 4081.5115 10315.06 18067.994 25804.523 34972.647
As visible in the above Table 1, the projected profit and loss statement was prepared up to
FY 2021. The revenue was assumed to grow consistently from 18% in FY 2015 till FY
2021with an assumed growth of 20%. The operating expense were assumed to be on a
growth which oscillates from 14% during FY 2015- FY-2017 to 16% for next two FYs of
2018 and FY 2019 to decline consecutively to 15% in FY 2020 and back to 14% in FY 2021.
The free cash flow of funds was found to increase persistently from Rs.917.91 crore in FY
2016 to Rs. 34972.65 crore by FY 2021.

Equity Valuation of Public Sector Enterprises: Power Grid Corporation of India Limited & ONGC Limited
ENVISION - International Journal of Commerce and Management, Vol. (10), 2016 Page | 8
WACC Analysis
Weighted Average Cost of Capital (WACC) is the firm‟s cost of capital where capital of
each type is proportionately weighted. Cost of equity (Ke) has been calculated using the
Capital Asset Pricing Model (CAPM). The risk free rate is based on the current yield of 10-
year Indian Government bond. Beta of 1.398 was calculated using Covariance method. The
market risk premium is taken as 8.75%. Applying CAPM to the components above resulted
in a cost of equity of 19.9825%. The after tax cost of debt of 6.94% is based on the interest
rate paid by company on bonds issued by it.
1. Current Debt to Equity ratio = 1.27
2. Current market value of equity in the company = 74,916.2 (current market capitalization)
3. Current book value of debt in the company = 95338.75 (from balance sheet)
Table 2 and 3 below depicts the cost of debt and cost of equity. Table 2
Debt Contribution
Before Tax Cost of Debt 9.25%
After Tax Cost of Debt 6.94%
Weight of Debt 56%
Contribution 3.89%
Equity Contribution
Beta Calculation Beta of POWERGRID stock has been calculated using the 5 year historical price of share
and benchmark index Nifty50. Calculation of beta is simply the Covariance of historical
prices of stock and index divided by historical prices of index.
𝐵𝑒𝑡𝑎 𝛽 =𝐶𝑜𝑣 𝑆𝑡𝑜𝑐𝑘 𝐼𝑛𝑑𝑒𝑥
𝑉𝐴𝑅 𝐼𝑛𝑑𝑒𝑥
Once we have beta estimate, cost of equity can be obtained as: Table 3
Equity Contribution, Cost of Equity
Weight of Equity 44%
Risk Free Rate (10 Yr Yield) 7.75%
Equity Risk Premium 8.75%
Beta(𝛽) 1.398
Ke 19.98%
Contribution 8.79%
Now, combining the debt and equity contribution, we arrive at WACC of 12.68% shown in
table 4 below. Table 4
WACC Computation
Debt Contribution 3.89%
Equity Contribution 8.79%
WACC 12.68%
Terminal Phase
In terminal phase, the paper assumed that company would grow at constant rate and terminal
value of a company was calculated using the above cited formula. Terminal growth rate has
been calculated based on the GDP growth rate of Indian economy. World Bank had
estimated India‟s real GDP growth rate at 7.8%. It is assumed that the company will grow at
around rate of 7.5%. The terminal value is shown in table 5 below. The equity value and the
enterprise value on the basis of the relevant inputs is shown in table 6 below.

Equity Valuation of Public Sector Enterprises: Power Grid Corporation of India Limited & ONGC Limited
ENVISION - International Journal of Commerce and Management, Vol. (10), 2016 Page | 9
Table 5
Estimation of Terminal Value
FCFF (2023) 46642.81
WACC-g 0.05
TV (2023) 353528.6
TV (2015) 136057.84
The terminal value was found to be Rs. 353528.6 crore for the year 2023 whereas a higher
terminal value was estimated for the year 2015 at Rs 136057.84 crore. Table 6
Estimation of Total Enterprise Value(Rs., in Crore)
Total Enterprise Value 181443.57
Total Debt 95338.75
Total Equity Value 86104.82
Total Outstanding Shares 523.16
Equity Value 164.58
The above analysis yielded the total enterprise of Rs. 181443.57 crore whereas the equity
value of each share was found to be Rs.164.58.
4. Equity Valuation: Oil & Natural Gas Corporation
1. Revenue: ONGC‟s crude oil production has increased quarter on quarter (QoQ) around
1% and natural gas production declined around 2.5% QoQ. ONGC‟s net revenue has
declined in last fiscal due to decline in crude oil prices. ONGC‟s future earnings depend
on the subsidy sharing mechanism. Recently Government approved subsidy sharing
mechanism for FY‟2016 which will reduce the subsidy burden of ONGC substantially.
The long term clarity on the subsidy sharing formula and higher oil prices will hold the
key for future profitability of the company. We have assumed the approved subsidy
sharing mechanism for long term which is giving share price of Rs. 251. We believe oil
prices will recover in the next 2-3 years, which will drive earnings for ONGC, as the
company‟s earnings are extremely sensitive to oil price. Moreover, domestic reforms
continued with the implementation of Direct Benefit Transfer of LPG (DBTL) on LPG,
which will likely to reduce under recovery (difference between subsidized price and
actual price). Revenue growth has been forecasted based on the above facts and
assumptions and industrial and economic dynamics.
2. EBITDA Margin: With the current economic scenario in oil and gas industry, we expect
ONGC‟s operating margins continue to grow. For each forecasted year operating margin
has been calculated using the primary building blocks like operating expenses and
depreciation. Each of the following building blocks were calculated using relevant
drivers such as historical data and company‟s future plans whose information was
obtained from company‟s annual report.
3. Operating Expenses: Operating expenses were obtained using company‟s historical
expenses and future business plans and growth of operating expenses were calculated
based on the growth of revenue.
4. Depreciation & Amortization – The depreciation charges have been obtained as an
average percentage of historical data. Depreciation is stated using written down value
method over the useful life of asset.
5. Capital Expenditure – ONGC has incurred capex of Rs. 1,49,497 Cr. in last five years.
Capital Expenditure has been calculated on the basis historical capex for forecasted
years.
6. Working Capital – working capital is forecasted on the basis of historical working
capital.
7. Tax Rate – tax rate is assumed to be 25%. Finance Minister of India in his budget for
FY 2015 announced that corporate tax rate to be reduced from 30% to 25% in the next
five years.

Equity Valuation of Public Sector Enterprises: Power Grid Corporation of India Limited & ONGC Limited
ENVISION - International Journal of Commerce and Management, Vol. (10), 2016 Page | 10
8. Free Cash Flows to Firm (FCFF) – calculated as:
FCFF = EBIT * (1-Tax rate) + Depreciation – Net Capex –Increase in Working Capital Table 7
Profit and Loss Statement (Projected) of ONGC Limited (Rs., in Crore)
Year MAR'14 MAR'15 P* MAR'16 P* MAR'17 P* MAR'18 P* MAR'19 P* MAR'20 P* MAR'21 P* MAR'22 P*
Revenue 83890.27 82870.96 84263.192 93405.7485 108210.56 125361.933 145231.8 168251.04 194918.83
YoY % 1.0661% -1.215% 1.68% 10.85% 15.85% 15.85% 15.85% 15.85% 15.85%
Operating
Expenses 39816.44 39482.25 42643.29 46547.41 53529.522 61558.9497 70792.792 81411.711 93623.4677
YoY % 0.009393369 -0.0083933 0.0800623 0.09155297 0.15 0.15 0.15 0.15 0.15
EBITDA 44073.83 43388.71 41619.902 46858.3385 54681.038 63802.9836 74439.008 86839.329 101295.362
D&A 10925.89 11458.31 9774.5303 10835.0668 12552.425 14541.9843 16846.889 19517.121 22610.5843
EBIT 33147.94 31930.4 31845.372 36023.2717 42128.613 49260.9993 57592.119 67322.208 78684.7779
Depreciation 10925.89 11458.31 9774.5303 10835.0668 12552.425 14541.9843 16846.889 19517.121 22610.5843
Tax Rate% 0.25 0.3 0.3 25% 25% 25% 25% 25% 25%
EBIT*(1-t) 24860.955 23947.8 22291.76 27017.4537 31596.46 36945.7495 43194.089 50491.656 59013.5834
Depreciation 10925.89 11458.31 9774.5303 10,835.07 12,552.42 14,541.98 16,846.89 19,517.12 22,610.58
Less: Net
Capex 21543.61 21011.19 22694.97 21,634.43 19,917.08 17,927.52 15,622.61 12,952.38 9,858.92
Less:
Increase in
WC
-2065.3 162 300 400 376 407 602 401 310
FCFF 16,308.54 14,232.92 9,071.32 15,818.09 23,855.81 33,153.22 43,816.37 56,655.40 71,455.25
For ONGC as well, the projected profit and loss statement was prepared up to FY 2021-
2022. The growth rates of various variables were assumed to be different from what was
assumed for the Power Grid Corporation of India Limited. The growth rate of revenue were
assume to be 1.68% in FY 2015 increasing to 10.85% in FY 2016 and thereby assuming a
constant growth rate of 15.85% from FY 2017 till FY 2021. Similarly, the operating
expenses were also assumed to grow by 8% in FY 2015 to 15% in FY 2021.
Correspondingly, the free cash flow generated also witness a consistent growth increasing
from Rs. 9,071.32 crore in FY 2015 to Rs. 71,455 crore in FY 2021.
WACC Analysis
Weighted Average Cost of Capital (WACC) is the firm‟s cost of capital where capital of
each type is proportionately weighted. Cost of equity (Ke) has been calculated using the
Capital Asset Pricing Model (CAPM). The risk free rate is based on the current yield of 10-
year Indian Government bond. Beta of 1.398 was calculated using Covariance method. The
market risk premium of 8.75% is taken. Applying CAPM to the components above resulted
in a cost of equity of 22.18%. The after tax cost of debt of 6.40% is based on the interest rate
paid by company on bonds issued by it.
1. Current Debt to Equity ratio = 0.007
2. Current market value of equity in the company = 189934 (current market capitalization)
3. Current book value of debt in the company = 1393 (from balance sheet) Table 8
DEBT Contribution for ONGC Limited
Before Tax Cost of Debt 8.54%
After Tax Cost Of Debt 6.41%
Weight of Debt 0.96%
Contribution 0.06%
Equity Valuation of Public Sector Enterprises: Power Grid Corporation of India Limited & ONGC Limited
ENVISION - International Journal of Commerce and Management, Vol. (10), 2016 Page | 11
The analysis found the contribution of debt in the capital structure of ONGC Limited to be at
0.06%.
Equity Contribution
Beta Calculation Beta of POWERGRID stock has been calculated using the 5 year historical price of share
and benchmark index Nifty50. Calculation of beta is simply the Covariance of historical
prices of stock and index divided by historical prices of index.
𝐵𝑒𝑡𝑎 =𝐶𝑂𝑉 𝑆𝑡𝑜𝑐𝑘, 𝐼𝑛𝑑𝑒𝑥
(𝑉𝐴𝑅(𝐼𝑛𝑑𝑒𝑥)
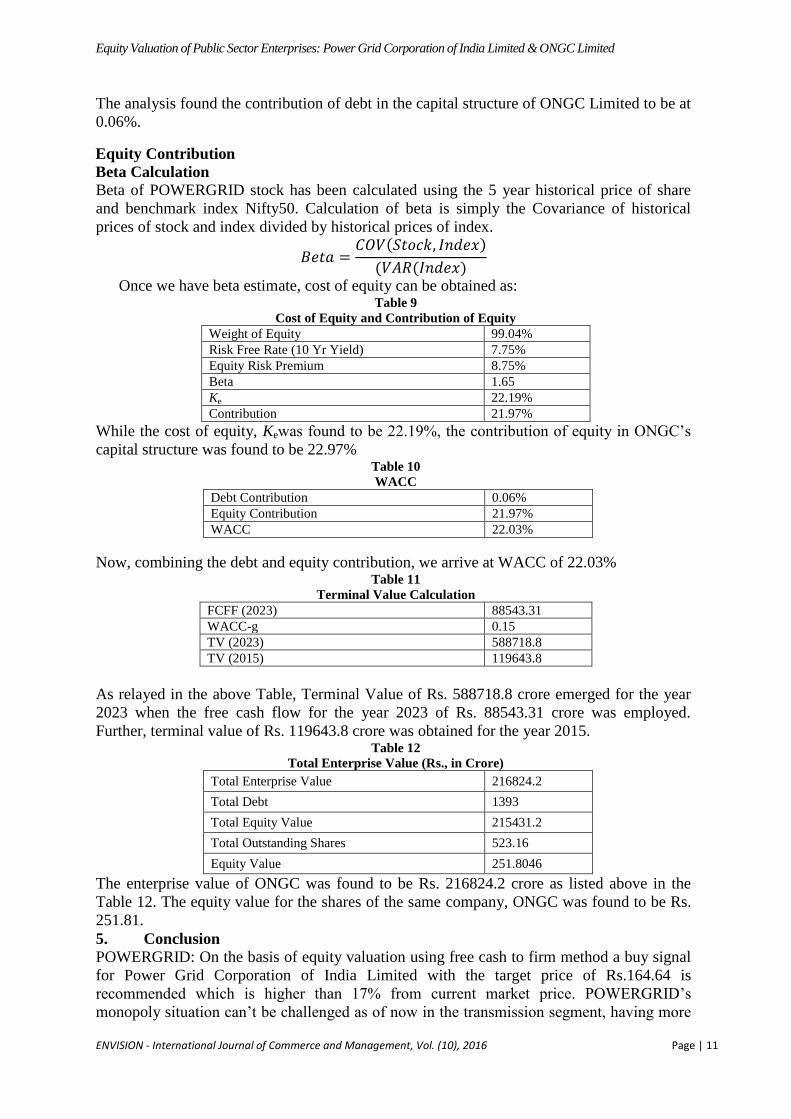
Once we have beta estimate, cost of equity can be obtained as: Table 9
Cost of Equity and Contribution of Equity
Weight of Equity 99.04%
Risk Free Rate (10 Yr Yield) 7.75%
Equity Risk Premium 8.75%
Beta 1.65
Ke 22.19%
Contribution 21.97%
While the cost of equity, Kewas found to be 22.19%, the contribution of equity in ONGC‟s
capital structure was found to be 22.97% Table 10
WACC
Debt Contribution 0.06%
Equity Contribution 21.97%
WACC 22.03%
Now, combining the debt and equity contribution, we arrive at WACC of 22.03% Table 11
Terminal Value Calculation
FCFF (2023) 88543.31
WACC-g 0.15
TV (2023) 588718.8
TV (2015) 119643.8
As relayed in the above Table, Terminal Value of Rs. 588718.8 crore emerged for the year
2023 when the free cash flow for the year 2023 of Rs. 88543.31 crore was employed.
Further, terminal value of Rs. 119643.8 crore was obtained for the year 2015. Table 12
Total Enterprise Value (Rs., in Crore)
Total Enterprise Value 216824.2
Total Debt 1393
Total Equity Value 215431.2
Total Outstanding Shares 523.16
Equity Value 251.8046
The enterprise value of ONGC was found to be Rs. 216824.2 crore as listed above in the
Table 12. The equity value for the shares of the same company, ONGC was found to be Rs.
251.81.
5. Conclusion
POWERGRID: On the basis of equity valuation using free cash to firm method a buy signal
for Power Grid Corporation of India Limited with the target price of Rs.164.64 is
recommended which is higher than 17% from current market price. POWERGRID‟s
monopoly situation can‟t be challenged as of now in the transmission segment, having more
Equity Valuation of Public Sector Enterprises: Power Grid Corporation of India Limited & ONGC Limited
ENVISION - International Journal of Commerce and Management, Vol. (10), 2016 Page | 12
than 50% market share. POWERGRID has doubled its capital expenditure plan for 12th plan
over 11th plan to drive future growth. The company has been consistently providing around
20% profit growth every year driven by its capital expenditure.
Overall power sector is expected to show growth because of following reasons: Increase in
electricity demand, Government‟s new initiative focusing on infrastructure development and
electricity to all. In transmission segment, over the next few years, the demand for
transmission capacity is expected to increase significantly, driven primarily by increase in
generation capacity and also due to requirements of open access, inter-regional transfers and
integration of in firm renewable power in the system.
ONGC: On the basis of equity valuation using free cash to firm method a buy signal for Oil
and Natural Gas Corporation Limited with the target price of INR 251.80 is recommended
which is higher than 14.45% from current market price. In past due to large decline in
international crude oil price led to increase in under recoveries, ONGC stock price has taken
a toll as a result of less net realization because of increased subsidy burden.
The paper assumes that ONGC‟s subsidy burden to reduce substantially in the next fiscal
after government‟s recent approval of subsidy sharing mechanism. Long term subsidy
sharing mechanism holds the key for future earnings. In upstream segment companies,
ONGC has many times more oil and gas production capacity than other companies.
For ONGC, over last year crude oil prices have come down sharply which led to increase in
under recoveries for Indian oil companies and thereby increasing subsidy burden on ONGC
resulting in less net realization. In future, one expects crude oil prices to settle and long term
subsidy sharing mechanism would be approved by the government which will decrease
subsidy burden for ONGC.
References:
(n.d.). Retrieved 2016, from India Brand Equity Foundation: http://www.ibef.org/
Tata Motors - Financing the Acquisition of Jaguar and Land Rover. (2009). Retrieved 2015, from ICMR
India: http://www.icmrindia.org/casestudies/catalogue/Finance/FINC050.htm
Form 20-F. (2013, August 2). Retrieved 2015, from United States Securities and Exchange Commission:
http://www.sec.gov/Archives/edgar/data/926042/000119312513317498/d570474d20f.htm
ONGC sees 20-30% lower capex next fiscal on crude price slump. (2015, November 24). Retrieved 2016,
from Economic Times: http://articles.economictimes.indiatimes.com/2015-11-24/news/68536362_1_kg-
blocks-capex-plan-higher-gas-price
Earnings estimates to be impacted due to lower duty cut: ONGC. (2016, March 1). Retrieved 2016, from
India Infoline: http://www.indiainfoline.com/article/equity-earnings-result-commentary/ongc-reports-
%2011-07-yoy-decline-in-q2fy16-standalone-net-profit-beats-estimates
Damodaran, A. (2010, October 14). The Little Book of Valuation. Retrieved 2016, from Stern, New York
University: http://people.stern.nyu.edu/adamodar/pdfiles/papers/littlebookvaln.pdf
Damodaran, A. (n.d.). An Introduction to Valuation. Retrieved 2016, from People Stern, New York
University: http://people.stern.nyu.edu/adamodar/pdfiles/ovhds/dam2ed/ValIntro.pdf
Damodaran, A. (n.d.). Valuation. Retrieved 2016, from Stern, New York University:
http://people.stern.nyu.edu/adamodar/pdfiles/ovhds/ch12.pdf
Damodaran, A. (n.d.). Valuation: Basics. Retrieved 2016, from People Stern, New York University:
http://people.stern.nyu.edu/adamodar/pdfiles/invphiloh/valuation.pdf
Damodaran, A. (n.d.). Valuation: Part I, Discounted Cash Flow Valuation. Retrieved 2016, from People
Stern, New York University: http://people.stern.nyu.edu/adamodar/pdfiles/eqnotes/packet1apg2.pdf
Kalsie, A., & Arora, A. (2016). Jaguar Landrover Acquisition by Tata Motors : A Case Study. Working
Paper- Unpublished.
Miscellaneous. (n.d.). Retrieved 2016, from Money Control: http://www.moneycontrol.com/
Miscellaneous. (n.d.). Retrieved 2016, from Live Mint: http://www.livemint.com/industry
Money Control, Elite. (2000-2013). Research Reports on Power Grid Corporation of India. Retrieved
2015, from Money Control: http://www.moneycontrol.com/news/powergridcorporationindia/brokerage-
reports-PGChttp://www.moneycontrol.com/news/powergridcorporationindia/brokerage-reports-PGC-
6months-5.html6months-5.html

Equity Valuation of Public Sector Enterprises: Power Grid Corporation of India Limited & ONGC Limited
ENVISION - International Journal of Commerce and Management, Vol. (10), 2016 Page | 13
Oil and Natural Gas Corporation Limited. (n.d.). Retrieved 2015, from ONGC: Oil and Natural Gas
Corporation Limited
PGCIL. (n.d.). Power Grid Corporation of India Limited. Retrieved 2016, from
https://www.powergridindia.com/_layouts/PowerGrid/User/index.aspx?LangID=English
Profit, NDTV. (n.d.). Research @ Power Grid Corporation Of India Ltd. Retrieved 2016, from NDTV
Profit: http://profit.ndtv.com/stock/power-grid-corporation-of-india-ltd_powergrid/research
Saikia, S. P. (2015, July 8). New subsidy formula to boost ONGC, OIL India earnings in Q1. Retrieved
2016, from The Financial Express: http://www.financialexpress.com/article/companies/new-subsidy-
formula-to-boost-ongc-oil-india-earnings-in-q1/96836/
Sawardekar, S. (2011, June 6). Pass or Fail: Tata Steers Jaguar Land Rover to Profit. Retrieved 2016, from
The Wall Street Journal:
http://www.wsj.com/articles/SB10001424052702304432304576368243041445416
Securities and Exchange Commission. (2008, September 25). Forms 6-K. Retrieved 2016, from Wiki
Invest: http://www.wikinvest.com/stock/Tata_Motors_(TTM)/Filing/6-K/2008/F3309292
Yahoo Finance. (Miscellaneous). S&P BSE SENSEX. Retrieved 2016, from Yahoo Finance:
http://finance.yahoo.com/q/hp?s=^BSESN&a=03&b=1&c=2000%20&d=03&e=18&f=2010&g=d&z=66&
y=0,%20for%20the%20period%20April%207,%202000-
April%2016,%202010,%20downloaded%20April%2018,%202010
About the Author:
Anjala Kalsie, (Ph.D). is associated with Faculty of Management Studies, University of
Delhi, in the capacity of Assistant Professor. She has 15 years of experience. She is also a
fellow member of the Institute of Company Secretaries of India. She has published more than
50 empirical papers in various national and international journals. She has also presented
papers in various national and international conferences. The areas of her interests are
Financial Economics, Currency and Financial. She has done extensive work on Corporate
Restructuring. She has won 1st position in the Best Paper Award Competition in an
International Conference. Her paper has also figured in top 10 papers of SSRN in 2009. She
has a rich experience in imparting Management Development Programme. She can be
reached at [email protected]
Ashima Arora, (Ph.D.) has completed her Ph.D. in International Finance from Faculty of
Management Studies, University of Delhi, India. She had been a recipient of Junior Research
Fellowship and Senior Research Fellowship awarded by University Grant Commission. She
has published papers in journals of both national and international repute. She has presented
papers at both national and international conferences and seminars. Her area of scholarly
interest is international finance, international crisis, financial modelling and corporate
governance. She can be reached at [email protected]