aviation weather information requirements studymln/ltrs-pdfs/nasa-2000-cr210288.pdf · june 2000...
TRANSCRIPT

June 2000
NASA/CR-2000-210288
Aviation Weather InformationRequirements Study
Byron M. Keel, Charles E. Stancil, Clifford A. Eckert, Susan M. Brown,Gary G. Gimmestad, and Mark A. RichardsGeorgia Tech Research Institute, Atlanta, Georgia

The NASA STI Program Office ... in Profile
Since its founding, NASA has been dedicated tothe advancement of aeronautics and spacescience. The NASA Scientific and TechnicalInformation (STI) Program Office plays a keypart in helping NASA maintain this importantrole.
The NASA STI Program Office is operated byLangley Research Center, the lead center forNASAÕs scientific and technical information. TheNASA STI Program Office provides access to theNASA STI Database, the largest collection ofaeronautical and space science STI in the world.The Program Office is also NASAÕs institutionalmechanism for disseminating the results of itsresearch and development activities. Theseresults are published by NASA in the NASA STIReport Series, which includes the followingreport types:
· TECHNICAL PUBLICATION. Reports of
completed research or a major significantphase of research that present the results ofNASA programs and include extensivedata or theoretical analysis. Includescompilations of significant scientific andtechnical data and information deemed tobe of continuing reference value. NASAcounterpart of peer-reviewed formalprofessional papers, but having lessstringent limitations on manuscript lengthand extent of graphic presentations.
· TECHNICAL MEMORANDUM. Scientific
and technical findings that are preliminaryor of specialized interest, e.g., quick releasereports, working papers, andbibliographies that contain minimalannotation. Does not contain extensiveanalysis.
· CONTRACTOR REPORT. Scientific and
technical findings by NASA-sponsoredcontractors and grantees.
· CONFERENCE PUBLICATION. Collected
papers from scientific and technicalconferences, symposia, seminars, or othermeetings sponsored or co-sponsored byNASA.
· SPECIAL PUBLICATION. Scientific,
technical, or historical information fromNASA programs, projects, and missions,often concerned with subjects havingsubstantial public interest.
· TECHNICAL TRANSLATION. English-
language translations of foreign scientificand technical material pertinent to NASAÕsmission.
Specialized services that complement the STIProgram OfficeÕs diverse offerings includecreating custom thesauri, building customizeddatabases, organizing and publishing researchresults ... even providing videos.
For more information about the NASA STIProgram Office, see the following:
· Access the NASA STI Program Home Pageat http://www.sti.nasa.gov
· E-mail your question via the Internet to
[email protected] · Fax your question to the NASA STI Help
Desk at (301) 621-0134 · Phone the NASA STI Help Desk at
(301) 621-0390 · Write to:
NASA STI Help Desk NASA Center for AeroSpace Information 7121 Standard Drive Hanover, MD 21076-1320
National Aeronautics andSpace Administration
Langley Research Center Prepared for Langley Research CenterHampton, Virginia 23681-2199 under Contract NAS1-99073
June 2000
NASA/CR-2000-210288
Aviation Weather InformationRequirements Study
Byron M. Keel, Charles E. Stancil, Clifford A. Eckert, Susan M. Brown,Gary G. Gimmestad, and Mark A. RichardsGeorgia Tech Research Institute, Atlanta, Georgia

Available from:
NASA Center for AeroSpace Information (CASI) National Technical Information Service (NTIS)7121 Standard Drive 5285 Port Royal RoadHanover, MD 21076-1320 Springfield, VA 22161-2171(301) 621-0390 (703) 605-6000

i
Contents1 STUDY OVERVIEW ............................................................................................................................... 1
References ................................................................................................................................................ 2
2 AVIATION WEATHER DATA PRODUCT INVESTIGATION............................................................ 32.1 Task Summary................................................................................................................................. 32.2 Introduction ..................................................................................................................................... 32.3 Atmospheric Hazards ...................................................................................................................... 42.4 Aviation System Components ......................................................................................................... 5
2.4.1 Aircraft Operators ................................................................................................................................. 52.4.1.1 Part 91 - General Operating and Flight Rules ................................................................................................... 62.4.1.2 Part 135 – Air Taxi Operators and Commercial Operators ............................................................................... 62.4.1.3 Part 121 – Domestic Commercial Operators..................................................................................................... 7
2.4.2 Aviation Weather Information Support System.................................................................................... 82.4.2.1 Federal Aviation Administration ...................................................................................................................... 82.4.2.2 National Oceanic and Atmospheric Administration.......................................................................................... 8
2.5 A Review of Weather Products and Delivery Systems ................................................................. 102.5.1 Summary of Aviation Weather Products ............................................................................................ 102.5.2 Sensors................................................................................................................................................ 162.5.3 Delivery Systems ................................................................................................................................ 16
2.6 Database Development and User Feedback .................................................................................. 172.6.1 Survey ................................................................................................................................................. 172.6.2 Weather Product Database.................................................................................................................. 17
2.6.2.1 Overview ........................................................................................................................................................ 172.6.2.2 Future Capabilities.......................................................................................................................................... 19
2.6.3 User Inputs.......................................................................................................................................... 192.6.3.1 United Parcel Service (UPS)........................................................................................................................... 192.6.3.2 Delta Airlines.................................................................................................................................................. 212.6.3.3 National Weather Service Weather Forecast Offices...................................................................................... 222.6.3.4 Southern Region Air Traffic Control .............................................................................................................. 232.6.3.5 Flight Information Systems – Dean Resch...................................................................................................... 24
2.7 Deficiencies in the Current Set of Weather Products .................................................................... 252.7.1 Introduction......................................................................................................................................... 252.7.2 Data Format ........................................................................................................................................ 262.7.3 Support System................................................................................................................................... 262.7.4 Sensors................................................................................................................................................ 272.7.5 Forecasting and Modeling................................................................................................................... 28
2.8 A Look Forward to Requirements ................................................................................................. 28References .............................................................................................................................................. 30
3 AVIATION WEATHER INFORMATION REQUIREMENTS RECOMMENDATIONS................... 313.1 Task Summary............................................................................................................................... 313.2 Introduction ................................................................................................................................... 333.3 Fundamentals of Weather Phenomena .......................................................................................... 33
3.3.1 The Atmosphere.................................................................................................................................. 343.3.2 Moisture.............................................................................................................................................. 343.3.3 Air Masses .......................................................................................................................................... 353.3.4 Thunderstorms .................................................................................................................................... 353.3.5 Gust Fronts.......................................................................................................................................... 363.3.6 Downbursts ......................................................................................................................................... 363.3.7 Wind ................................................................................................................................................... 373.3.8 Icing .................................................................................................................................................... 37
3.4 Categories of Weather Hazards ..................................................................................................... 373.5 VFR and IFR Flight....................................................................................................................... 403.6 Weather Product Requirements as a Function of Phase of Flight ................................................. 41
3.6.1 Preflight Planning and Flight Plan Filing............................................................................................ 453.6.2 Preflight Operations............................................................................................................................ 46
ii
3.6.3 Taxi and Take-Off .............................................................................................................................. 463.6.4 Departure, Initial Climb, and Initial Cruise ........................................................................................ 463.6.5 Cruise.................................................................................................................................................. 473.6.6 Approach............................................................................................................................................. 483.6.7 Landing ............................................................................................................................................... 483.6.8 Taxi In and Post Flight Operations ..................................................................................................... 48
3.7 Existing Weather Products ............................................................................................................ 483.8 National Transportation Safety Board (NSTB) Data..................................................................... 543.9 Weather Product Requirements Recommendations ...................................................................... 58References .............................................................................................................................................. 65
4 AN INVESTIGATION OF SENSOR SYSTEM USES, NEEDS, AND REQUIREMENTS FORAVIATION WEATHER INFORMATION COLLECTION ..................................................................... 66
4.1 Task Summary............................................................................................................................... 664.2 Introduction ................................................................................................................................... 664.3 Overview of Sensors in Support of Aviation Related Weather Information................................. 674.4 Sensor Descriptions ....................................................................................................................... 71
4.4.1 Airborne Weather Radars ................................................................................................................... 714.4.1.1 Rockwell Collins Airborne Weather Radar System........................................................................................ 724.4.1.2 Honeywell....................................................................................................................................................... 734.4.1.3 Allied Signal’s RDR Weather Radar .............................................................................................................. 73
4.4.2 Terminal Doppler Weather Radar (TDWR)........................................................................................ 734.4.3 ASR-9 with a Wind Shear Processor .................................................................................................. 734.4.4 Air Route Surveillance Radar ............................................................................................................. 744.4.5 Weather Surveillance Radar – 1988 – Doppler................................................................................... 764.4.6 NOAA Profiler Network..................................................................................................................... 774.4.7 Radio Acoustic Sounding System....................................................................................................... 794.4.8 Boundary Layer Profiler Network ...................................................................................................... 794.4.9 Terminal Area Surveillance System ................................................................................................... 804.4.10 Unisys Microburst Prediction Radar................................................................................................... 814.4.11 Weather Mode for the SPY-1 Radar ................................................................................................... 824.4.12 Bistatic Multiple-Doppler Network .................................................................................................... 824.4.13 Dual Doppler Radars........................................................................................................................... 834.4.14 Dual Frequency Radars....................................................................................................................... 834.4.15 Polarization Diverse Radars................................................................................................................ 834.4.16 Satellite Sensors .................................................................................................................................. 834.4.17 Runway Visual Range Sensors ........................................................................................................... 85
4.4.17.1 Introduction ............................................................................................................................................... 854.4.17.2 Transmissometers ...................................................................................................................................... 854.4.17.3 Forward Scatterometers............................................................................................................................. 864.4.17.4 New Generation RVR................................................................................................................................ 87
4.4.18 Wake Vortex Detection....................................................................................................................... 874.4.18.1 Introduction ............................................................................................................................................... 874.4.18.2 Aircraft Vortex Spacing System................................................................................................................ 88
4.4.19 ASOS/AWOS ..................................................................................................................................... 914.4.20 Low Level Wind Shear Alert System ................................................................................................. 914.4.21 Meteorological Data Collection and Reporting System......................................................................924.4.22 Radiosonde.......................................................................................................................................... 924.4.23 Lightning Detection Systems.............................................................................................................. 92
4.4.23.1 National Lightning Detection Network ..................................................................................................... 924.4.23.2 Honeywell Lightning Sensors.................................................................................................................... 93
4.4.24 Global Positioning System Integrated Precipitable Water Measurement ........................................... 934.4.25 Integrated Terminal Weather Support System.................................................................................... 934.4.26 Rapid Update Cycle II Model ............................................................................................................. 94
4.5 Potential Sensor Solutions to Previously Identified Hazards ........................................................ 944.5.1 Detection of Hail................................................................................................................................. 954.5.2 Icing Sensors....................................................................................................................................... 95
4.5.2.1 Introduction .................................................................................................................................................... 95

iii
4.5.2.2 Radiometry ..................................................................................................................................................... 964.5.2.3 Radar............................................................................................................................................................... 974.5.2.4 Recommendations........................................................................................................................................... 98
4.5.3 Optical Detection of CAT................................................................................................................... 984.5.4 Slant Range Visibility ......................................................................................................................... 99
4.5.4.1 Introduction .................................................................................................................................................... 994.5.4.2 Technology ................................................................................................................................................... 1004.5.4.3 Recommendations......................................................................................................................................... 100
4.5.5 Vector Wind Sensing and Wind Shear Detection ............................................................................. 1014.6 EPIREPS...................................................................................................................................... 101
REFERENCES ......................................................................................................................................... 104
ACRONYMS............................................................................................................................................ 108
APPENDIX A ENHANCED WEATHER INFORMATION SYSTEMS .............................................. A-1
APPENDIX B PARTS 121/135 WEATHER INFORMATION SYSTEMS.......................................... B-1
APPENDIX C AVIATION WEATHER PRODUCTS........................................................................... C-1
APPENDIX D EXAMPLE SURVEY FORM......................................................................................... D-1
APPENDIX E WEATHER PRODUCT DATABASE.............................................................................E-1
APPENDIX F DELTA DISPATCHER REQUIREMENTS....................................................................F-1
APPENDIX G WEATHER PRODUCTS SUMMARY.......................................................................... G-1

1
1 Study Overview
The White Commission on Aviation Safety and Security, chaired by Vice President Al Gore, issued itsfinal report to President Clinton on February 12, 1997. One of the key recommendations of that reportwas to reduce the rate of aviation accidents by 80% within the next five years. As a result, the NationalAeronautical and Space Administration (NASA) and the Federal Aviation Administration (FAA) haveteamed to form the NASA-led Aviation Safety Program (AvSP). The goal of the AvSP is to develop anddemonstrate technologies that will contribute to an increase in aviation safety by a factor of 5 in the next10 years and by a factor of 10 in the next 20 years [1-1]. This increase in safety is to be achieved inparallel with a goal of tripling the aviation system capacity, under all weather conditions, within the next10 years [1-2]. The first phase of the program will focus on the 10 year goal of increasing aviation safetyby a factor of 5. This first phase of the program is designed to take place between fiscal years 2000 and2004. The AvSP is divided into a number of level 2 programs, as shown in Figure 1-1. Since weather isa factor in 30% of all aviation accidents, a significant portion of the AvSP program is focused on weather-related accident prevention. This level 2 element, entitled “Weather Accident Prevention,” is being ledby Goddard Research Center (GRC). The goal of this element of the program is to develop enablingtechnologies which will contribute to a reduction in aviation weather-related accidents. This element ofthe program contains a number of level 3 projects, one of which is the Aviation Weather Information(AWIN) Distribution and Presentation project led by Mr. Paul Stough at the Langely Research Center(LaRC). This level 3 project is further subdivided into four level 4 tasks: Enhanced Weather Products(ExWP), Data Communication/Link (DCL), Operator Support (O/S), and Systems Engineering (SE). TheExWP task is led by Mr. Phil R. Schaffner at LaRC. The objective of the ExWP task is to “develop newand derivative weather products, complementing existing weather sources with in situ and remote sensingcapability where necessary, to provide the necessary information at appropriate temporal and spatialresolution for both tactical and strategic decision making for aviation users” [1-3].
In aviation, knowledge of the existing conditions and those forecast along the flight path are critical tooperating the aircraft in a manner so as to avoid or mitigate the affects of hazardous atmospheric events.The aviation community relies on weather products prepared by the Federal Aviation Administration(FAA), National Weather Service (NWS), and commercial vendors who add value to NWS products.Under the Enhanced Weather Product task, a study, entitled “Aviation Weather InformationRequirements,” was defined to investigate present applications of aviation weather information and todevelop weather information requirements for operators and weather products. The study was brokeninto three phases.
In the first phase of the subtask, the current set of aviation weather products were examined andcataloged. An analysis was performed to identify deficiencies in this set of weather products. The secondphase of the subtask focused on recommending weather information requirements for each category ofuser (e.g., Parts 121, 135, and 91) during each phase of flight. Recommendations were made to supportboth strategic and tactical decisions in the presence of atmospheric hazards. In the third phase of thesubtask, sensor technologies (existing, modified, fused, or new) were assessed in terms of their ability tofill the weather information gaps defined in phases I and II.
This report captures the findings of the three phases of the study. The individual phases of the studywere originally captured in separate reports. These reports were combined to form this composite report.This report is divided into three major sections each one corresponding to a particular phase of the study.Because the phases did not overlap and the individual reports were written at separate times, the phasesmay contain some overlapping information or in some cases, the latter two sections may build upon orcontain additional information not found in the first section related to the weather products and sensors.

2
The first phase of the study examined the current set of weather products. The findings were compiledin a database for ease of access and analysis. The present applications of the weather products and theirusefulness were examined through a limited survey and interviews with a number of the users andsuppliers of aviation related weather information. Through an analysis of the weather products andopinions of current users and suppliers of weather information, deficiencies were identified. Thedeficiencies identified under this study are described in Section 2.7.
The second phase of the study focused on the defining weather information requirements for eachphase of flight in support of both strategic and tactical decision making. The requirementrecommendations are given in Section 3.9. The third phase of the study included an assessment ofexisting sensors that either directly or indirectly support the collection of weather information in supportof aviation. Recommendations were given for existing, modified, or new sensors that could help fill inthe gaps identified in Sections 2 and 3. These recommendations are given in Section 4.5. Included inphase III of this study was an analysis of potential onboard sensors that could be included in an electronicpilot report (EPIREP). Recommendations for sensors in support of EPIREPS are given in Section 4.6.
Aviation Safety Program Organization
Aviation SafetyProgram Office
System-WideAccident Prevention
2.2Dave Foyle (ARC)
System-WideAccident Prevention
Dave Foyle (ARC)
Single AircraftAccident
Prevention2.3
John White (LaRC)
Single AircraftAccident
Prevention
John White (LaRC)
Weather AccidentPrevention
2.4Ron Colantonio
(GRC)
Weather AccidentPrevention
Ron Colantonio(GRC)
Aviation SystemMonitoring &
Modeling2.1
Yuri Gawdiak (ARC)
Aviation SystemMonitoring &
Modeling
Yuri Gawdiak (ARC)
AccidentMitigation
2.5Doug Rohn (GRC)
AccidentMitigation
Doug Rohn (GRC)
Technical Integration1.1
George Finelli (LaRC)
Technical Integration
George Finelli (LaRC ))
Gov’t IndustryProgram LeadershipTeam
Level 1- Program
Level 2- Elements
Level 3- Projects
Aircraft Icing
(Base Program)
Aircraft Icing
(Base Program)
Aviation Weather InformationDistribution & Presentation
2.4.1Paul Stough (LaRC)
Aviation Weather InformationDistribution & Presentation
Paul Stough (LaRC)
Synthetic VisionDisplay
2.4.2Dave Eckhardt (LaRC)
Weather InformationCommunication
Gus Martzaklis (GRC)(
TurbulenceDetection & Mitigation
2.4.3Rod Bogue (DFRC)
TurbulenceDetection & Mitigation
Rod Bogue (DFRC)
EnhancedWeather Products
2.4.1.1Phil Schaffner (LaRC)
EnhancedWeather Products
Phil Schaffner (LaRC)
Data Comm/Link
2.4.1.2Gus Martzaklis (GRC)
Data Comm/Link
Gus Martzaklis (GRC)
Operator Support
2.4.1.3Dan Shafer (LaRC)
Operator Support
Dan Shafer (LaRC)
Level 4 – Tasks
Operator Support
2.4.1.3Dan Shafer (LaRC)
Systems Engineering
Ed Johnson (LaRC)
AccidentMitigation
2.5Doug Rohn (GRC)
SyntheticVision
Dan Baize (LARC)
Figure 1-1. An organization chart for the Aviation Safety Program
References
1-1. NASA Aviation Safety Program, Program Plan, Draft Copy, March, 1999
1-2. http://www.aero-space.nasa.gov/goals/iindex.thm
1-3. Aviation Weather Information Distribution and Presentation, Level 3 Plan, NASA LaRC, 1999

3
2 Aviation Weather Data Product Investigation
2.1 Task Summary
Under the first phase of this study, an analysis of weather products and how they are applied towardaviation safety was performed by the Georgia Tech Research Institute (GTRI). The analysis included areview of relevant documentation, surveys, and one-on-one interviews. Based on this analysis, GTRI hasidentified four areas where deficiencies exist. The four areas are data format, support systems, sensors,and forecasting and modeling. In the area of data format, the lack of a graphical display capability in thecockpit limits the pilot’s ability to consume and interpret weather products as they become available. Alow cost graphical display system is needed for Parts 121, 135, and 91 operators. In the area of weatherinformation support systems, an identified deficiency is the shortfall in tailoring weather products to thespatial and temporal needs of the aviation community. For the air traffic control system to functionproperly, weather information must be distributed in a common format that permits the individual parts ofthe system to work together.
Weather products are, in most cases, derived from sensor outputs. There are five areas related to thecurrent set of sensors where deficiencies have been identified: lack of availability, lack of confidence, lossof capability, lack of capability, and a need for required tuning to meet the needs of the aviationcommunity. The low number of runway visual range sensors is a major safety concern for some membersof the aviation community. There exists a perception that the Low Level Wind Shear Alert System(LLWAS) is associated with a high false alarm rate, resulting in a lack of confidence in the system. Thereexists the potential loss of the Geostationary Operational Environmental Satellite (GOES) as an asset indetecting volcanic ash after the year 2002. There are a number of atmospheric hazards (e.g., turbulence,in-flight icing, hail, and ceilings/visibility) for which sensor suites have not been developed that candetect and quantify these hazards on a regular basis.
In the area of mesoscale forecasting deficiencies have also been identified. To support the forecastingspatial resolution needs of the aviation community, higher fidelity mesoscale models and closer spacedsensors are required.
2.2 Introduction
This study is funded as a subtask under the AvSP’s Enhanced Weather Products (ExWP) task. Thefocus of the subtask is “to examine present applications for aviation weather information and, from thatperspective, to develop weather information requirements for operators and weather products in order tohighlight deficiencies and to identify requirements for new or enhanced weather products or sensors.Future work will be directed at developing the necessary weather products, presentations, and sensors toimprove aviation safety in accordance with the AvSP goals.” The subtask is divided into three phases. Inthis first phase of the subtask, an investigation of the existing weather products is performed. Theinvestigation identifies current aviation weather products and their attributes (e.g., update rate) andidentifies deficiencies associated with the weather products. Weather product information is captured in adatabase which will a provide tool for further investigation. This report provides an overview of thecurrent set of aviation weather products and how they are applied to impact aviation safety. This reportgoes on to discuss deficiencies associated with the weather products based on surveys and interviews withusers of the products and on analysis of the available data.
4
2.3 Atmospheric Hazards
Weather impacts aviation in a number of different areas including safety and efficiency/cost. In termsof efficiency, commercial airlines use winds aloft information to their advantage during flight planning toreduce fuel consumption and to provide their passengers with a safer and smoother ride. Weatherinformation is also required by the pilot and/or air traffic control system during all phases of flight tomake both strategic and tactical decisions impacting flight safety. The detection of a windshear eventduring or prior to the arrival and departure phases of a flight is an example of where weather informationmay directly impact flight safety.
The atmosphere, which provides the aerodynamic forces needed for flight, is an ever-evolving systemof complex structures defined over large and small temporal and spatial scales. This complex system isdefined by a number of variables (e.g., wind speed and direction, temperature, and phase of water) whoseabsolute value or relative change temporally or spatially may have a major impact on an aircraft’sperformance. Without going into an in-depth discussion of the individual hazards and the physics behindtheir development, this section is intended to give a general overview of some of the more commonatmospheric hazards.
The phase and concentration of water molecules in the atmosphere impacts aviation in a number ofdifferent ways. Visibility is often limited by clouds, fog, rain, and snow. To the pilot flying under visualflight rules (VFR), ceiling and visibility information is critical in all phases of flight. Even in the case ofinstrumented flight rules (IFR) certain minimums must exists for safe landing and take-off. Icing candramatically impact aircraft performance by changing the shape of the aerofoils and by adding additionalweight to the aircraft. Large hail represents a dangerous impact hazard to aircraft, which are generallymoving at speeds between 100 and 1000 km/hr during the cruise phase of flight. Hail stones may rangein size from 5 mm in diameter (pea size) to 60 mm in diameter (tennis ball size). Hail has been known tocrack windshields and to damage the surface structures of an aircraft.
Temperature, besides playing a significant role, in combination with other variables (e.g., moisture) inthe development of atmospheric hazards, has a direct impact on aircraft safety in the area of fuel capacityand performance. For non-stop trips between continents, the outside temperature at the airport duringfueling may impact the fuel storage capacity of the aircraft since fuels tend to expand as the temperaturerises. Also, in extreme cases, fuels may gel or freeze in extremely low temperatures.
The movement of air in the atmosphere is both beneficial and hazardous to aircraft performance.Turbulence (random motion) and wind shear (a more systematic motion) are both known to impactaircraft performance. Turbulence may originate from a number of different sources includingthunderstorms, strong surface winds, and mountain waves. Clear air turbulence (CAT) is often associatedwith turbulence at high altitudes and is generally not associated with thunderstorms. CAT is a product ofboth wind and temperature gradients that result in turbulence at the boundaries between the two airmasses. Severe turbulence may damage the structural integrity of an aircraft. To aid other pilots inavoiding CAT, pilots often report turbulence as light, moderate, severe, or extreme via pilot reports(PIREPS). Gust fronts, which are outflows from thunderstorms, may impact aviation safety in theterminal area. These transitory cross-winds may cause an unsuspecting pilot to deviate from his approachor landing causing him to miss the runway.
Wind shear involves a more systematic variation of wind speed and direction both temporally andspatially. Wind shear events include, for example, high winds and microburst. A microburst is alocalized downdraft, which may or may not contain a large number of precipitants (dry or wetmicroburst). As the downdraft encounters the ground, an outflow is developed in all directions. The

5
horizontal and vertical wind components may cause a deflection of the aircraft from its ascent or descenttrajectory. At low altitudes, wind shear may cause an aircraft to lose altitude and result in an impact withthe ground.
Volcanic ash and lightning are phenomena that also pose a hazard to aviation. Cloud to cloudlightning poses a threat to aircraft since the skin of the aircraft serves as a conductor. Lightning maydamage critical digital and analog components. This electrical activity is most often associated withthunderstorms. Volcanic ash is a threat to aviation because it contains glass shards that may damageaircraft engines [2-1].
Aircraft also induce variations in the atmosphere that may impact safety. The angle of attack duringtake off and landing induces a turbulent flow along the wing tips of the aircraft. This turbulent flowresults in horizontally oriented trailing vortices. The vortices pose a problem to smaller, trailing aircrafton landing or take-off from the same or an adjacent runways. The vortex (or horizontal tornado) maycause a smaller aircraft to flip.
Cyclic atmospheric phenomena including tornadoes, hurricanes, and tropical cyclones may also pose asevere threat to aviation. Hurricanes and tropical cyclones represent large scale cyclonic events withstrong steady wind fields over large extents. Whereas, tornadoes exhibit extreme winds on a muchsmaller scale. However, the probability of an aircraft encountering a tornado is rather small.
This section has summarized the significant atmospheric hazards. For a more detailed examination ofeach of the hazards see [2-2,2-3].
2.4 Aviation System Components
2.4.1 Aircraft Operators
All pilots need the same basic weather information for safe operation. How the aircraft performs inadverse conditions is a function of the type of aircraft, the equipment, and the pilot’straining/certification. However, FAA weather information requirements vary depending upon thecategory of operation: Parts 121, 135, and 91. Similar weather information is needed for each type ofoperator, but the Federal Aviation Regulation (FAR) requirements differ on how that information is to beobtained. The following paragraphs provide an overview of FAR requirements for weather informationby category of operator. However, this study does not go on to define requirements for weatherinformation in terms of category of operator. There is such a significant overlap between categories, interms of weather information needs for safe flight, that to do so would be redundant. Any exceptions willbe stated in the text.
There are various civilian categories of aircraft operators identified by the FAA. Each category has itsown set of requirements under the Federal Aviation Regulations. The largest segment of operators fallsunder the following three categories:
• Part 91 - General Operating and Flight Rules
• Part 135 – Air Taxi Operators and Commercial Operators
• Part 121 – Domestic Commercial Operators
6
2.4.1.1 Part 91 - General Operating and Flight Rules
The Part 91 segment of civilian aviation constitutes more than half of the domestic operations. In1996, there were 35.2 million general aviation operations representing almost 60% of all operations. Part91 flight operations include personal flights, business and corporate flights, training flights and specialoperations, (e.g., flight-tests, glider towing, parachuting, etc.). As a general rule, Part 91 operations donot include flights for compensation or hire. Under Part 91 operations, aircraft types range in complexity,equipage, and sophistication from the smallest single engine aircraft to large commercial jets (operatingduring maintenance and ferry flights).
Weather information requirements are relatively lenient under Part 91. FAR 91.103 states, “Each pilotin command shall, before beginning a flight, become familiar with all available information concerningthat flight. This information must include--For a flight under IFR or a flight not in the vicinity of anairport, weather reports and forecasts, fuel requirements, alternatives available if the planned flightcannot be completed, and any known traffic delays of which the pilot in command has been advised by airtraffic control (ATC)…other reliable information appropriate to the aircraft, relating to aircraftperformance under expected values of airport elevation and runway slope, aircraft gross weight, and windand temperature” [emphasis added].
The FAR does not state what types of weather reports or forecasts are required or information abouttheir timeliness. Since the FARs are not specific on how weather information is to be obtained, manyPart 91 pilots obtain weather information from TV, radio, and the Internet.
2.4.1.2 Part 135 – Air Taxi Operators and Commercial Operators
Part 135 operations represent the smallest of the three segments with approximately 17% of alloperations in 1996. From a regulatory perspective, it is a step up from Part 91 operations.
Generally, Part 135 operations include:
• Commuter (scheduled passenger-carrying operations in airplanes that have passenger-seatingconfigurations of less than 10) or on-demand (charter) operations, and
• Nonstop sightseeing flights for compensation or hire that begin and end at the same airport, andare conducted within a 25 statute mile radius of that airport [2-4].
Aircraft operating under Part 135 are generally more sophisticated than many Part 91 operated aircraftand are required to have certain communication and navigation equipment, flight instruments, electricalpower generating sources, and approved thunderstorm detection equipment or approved airborne weatherradar equipment. Under Part 135 operations, there are also extensive administrative, maintenance, andflight crew requirements.
Weather requirements under Part 135 are more stringent than Part 91. FAR 135.213 states:“Whenever a person operating an aircraft under this part is required to use a weather report or forecast,that person shall use that of the U.S. National Weather Service, a source approved by the U.S.National Weather Service, or a source approved by the Administrator. However, for operationsunder VFR, the pilot in command may, if such a report is not available, use weather information based onthat pilot's own observations or on those of other persons competent to supply appropriateobservations…weather observations made and furnished to pilots to conduct IFR operations at an airport

7
must be taken at the airport where those IFR operations are conducted, unless the Administrator issuesoperations specifications allowing the use of weather observations taken at a location not at the airportwhere the IFR operations are conducted” [emphasis added].
2.4.1.3 Part 121 – Domestic Commercial Operators
Part 121 operations are the second largest segment of operations with approximately 23% ofoperations in 1996. Part 121 operations include:
• Passenger and cargo domestic, flag (international), and supplemental operations (e.g., operatingaircraft with 10 or more seats or more than 7,500 pounds payload capacity), and
• Nonstop sightseeing flights conducted with airplanes having a passenger-seat configuration of30 seats or fewer and a maximum payload capacity of 7,500 pounds or less that begin and end atthe same airport, and are conducted within a 25 statute mile radius of that airport [2-4].
Part 121 operating requirements are more rigorous than Part 135 operations with extensiverequirements related to route approvals, operating limitations, instrument and equipment requirements,maintenance, preventive maintenance and alterations, airman and crew member requirements, training,dispatcher functions, records, and reports.
Part 121 operators conducting domestic or flag operations must have sufficient dispatch centerslocated at points necessary to ensure proper operational control of each flight.
Weather service requirements under Part 121 are extensive. FAR 121.101 states in part: “domestic orflag operations must show that enough weather reporting services are available along each route to ensureweather reports and forecasts necessary for the operation. (b) Except as provided in paragraph (d) of thissection, no certificate holder conducting domestic or flag operations may use any weather report tocontrol flight unless--
(1) For operations within the 48 contiguous States and the District of Columbia, it was prepared bythe U.S. National Weather Service or a source approved by the U.S. National WeatherService; or
(2) For operations conducted outside the 48 contiguous States and the District of Columbia, it wasprepared by a source approved by the Administrator.
(c) Each certificate holder conducting domestic or flag operations that uses forecasts tocontrol flight movements shall use forecasts prepared from weather reports specified inparagraph (b) of this section and from any source approved under its system adoptedpursuant to paragraph (d) of this section.
(d) Each certificate holder conducting domestic or flag operations shall adopt and put intouse an approved system for obtaining forecasts and reports of adverse weatherphenomena, such as clear air turbulence, thunderstorms, and low altitude wind shear,that may affect safety of flight on each route to be flown and at each airport to be used.”
FARs further specify weather reporting information be required at all airports used by Part 121operators. This includes runway visual range information and prevailing wind information under lowvisibility conditions. Part 121 airline operation centers may be supported by FAA certified enhanced

8
weather information systems (EWINS) (see Appendix A). In addition, dispatchers may be FAA certifiedas having flight movement forecast (FMF) authority. For additional information on Part 135 and Part 121weather information requirements, see Appendix B.
2.4.2 Aviation Weather Information Support System
2.4.2.1 Federal Aviation Administration
The current system which provides weather information to the aviation community is a partnershipbetween the FAA and the National Oceanic and Atmospheric Administration (NOAA). The FAA-administered national air traffic control system’s central office is located in Herndon, Virginia. Thisfacility manages the nation’s airspace in an effort to maximize efficiency and safety. Since weather playsa major role in aviation safety, the center employs weather unit specialists who provide weatherinformation updates to aid in local and national traffic management flow and safety.
An aircraft’s flight phases can be grouped into two general categories: en route and terminal area. Thenational air traffic control system has been designed to support the specific needs of these two phases offlight. The air route traffic control centers (ARTCC) provide air space management to aircraft operatingunder IFR flight plans. The ARTCC are nominally assigned 150 nautical mile jurisdictions. A centerweather service unit (CWSU), composed of both NWS meteorologists and FAA support personnel, isassociated with each of the ARTCCs. The weather service units provide up-to-date weather informationbased on analysis of weather products obtained from a number of different sources.
The terminal area is managed by the airport traffic control tower (ATCT). Weather information isprovided to the tower from a number of sources. In turn, the tower serves as one potential source ofweather information for arriving and departing aircraft. At some airports, an automated system is in placeto provide up-to-date weather information to arriving and departing pilots. This automated system istermed the automatic terminal information service (ATIS). ATIS provides weather information as well asother pertinent information related to the airport’s operation.
Another component of the FAA weather information support system is the FAA Flight ServiceStations (FSSs) and the Automated Flight Service Stations (AFSSs) which serve as the primary providersof flight information services throughout the U.S. Although both types of stations serve the samepurpose, AFSSs serve a broader area, usually an entire state, and are equipped with more advancedelectronic services to allow for more efficient planning of weather and flight information. FSSs andAFSSs provide pilots with pre-flight weather briefings, flight planning assistance, weather and en routeflight information, and airport terminal advisory services.
In an effort to modernize the FAA’s weather processing system, the FAA is sponsoring the Weatherand Radar Processing (WARP) program. WARP is being developed by Harris Corp. with developmentslated for completion in June 2000. The new system will ingest weather information from a number ofsources (including radar, lightning detection, satellites, gridded forecast) and process and analyze the datafor dissemination to air traffic controllers and managers [2-5].
2.4.2.2 National Oceanic and Atmospheric Administration
The National Weather Service, under the National Oceanic and Atmospheric Administration (NOAA),measures, analyzes, forecasts, and distributes weather information to the different FAA centers and topilots as official FAA approved weather products. The NWS is organized into a number of offices and

9
centers which serve the meteorological and hydrological needs of the nation. In this report, the discussionwill be limited to those parts of the NWS that provide direct information to the aviation community. TheNWS contains nine National Centers for Environmental Prediction (NCEP). The nine centers are listed inTable 2-1. The last four centers in Table 2-1 (highlighted in bold) provide services to the aviationcommunity.
Table 2-1. A Listing of the Different Centers Associated with the NCEP
National Centers for Environmental Prediction
Climate Prediction Center
Space Environment Center
Marine Prediction Center
Hydrologic Prediction Center
Environmental Modeling Center
National Center Operations
Storm Prediction Center
Aviation Weather Center
Tropical Prediction Center
Table 2-2 contains a summary of some of the products [2-3] the centers provide. Another agencyunder NOAA that provides weather information to the aviation community is the National EnvironmentalSatellite, Data, and Information Service (NESDIS). NESDIS provides satellite images of the atmosphere,which are used in modeling and forecasting. The main research arm of NOAA is the office of Oceanicand Atmospheric Research (OAR). This office is further divided into a number of laboratories includingthe Environmental Research Laboratory, which houses the National Severe Storms Laboratory and theForecast Systems Labs.
The National Centers for Environmental Prediction supports several mesoscale models. A few of thecurrent and future models are described here. The Eta-32 model produces 48 hour forecast twice a day at0000 and 1200 UTC, a 33 hour forecast at 0300 UTC, and a 30 hour forecast at 1800 UTC [2-6]. Insupport of shorter range forecast, the NCEP supports the Rapid Update Cycle (version 2) (RUC-2) model.The RUC forecasts are unique in that they are initialized with very recent data. The RUC-2 producesupdated forecast every hour [2-7]. A third mesoscale model that has found acceptance in the modelingcommunity is the fifth-generation National Center for Atmospheric Research (NCAR)/Penn StateMesoscale Model (MM5). This mesoscale model is a limited-area, nonhydrostatic or hydrostatic terrain-following sigma-coordinate model designed to simulate or predict mesoscale and regional-scaleatmospheric circulation [2-8]. The NCEP is also currently overseeing the development of the nextgeneration in mesoscale modeling termed the Weather Research and Forecast (WRF) model. Thiscollaborative effort is scheduled to produce a product by the end of 2003. The model will provide acommon tool for both research and operations [2-9].

10
Table 2-2. A Cursory Overview of the Aviation Specific Weather Products Provided by the NWS
NWS Products Supporting Aviation
Provider Weather Product
National Center Operations(Washington, DC)
1. Serves as focal center for the nations weather processing2. Measures winds and temperatures aloft
Storms Prediction Center(Norman, Oklahoma)
1. Generates convective outlooks and forecast2. Issues severe weather watches
Aviation Weather Center(Kansas City, Missouri)
1. Identifies hazardous weather to aircraft and issues warnings2. Produces 48 hour operational forecast3. Prepares and issues aviation area forecasts4. Prepares and issues in-flight aviation weather advisories
Tropical Prediction Center(Miami, Florida)
1. Issues hurricane advisories
NWS Weather Forecast Office(Regional)
1. Provides route forecast2. Provides terminal area forecasts
The NWS also has Weather Forecast Offices (WFO) located in each state. The NWS WFO providesup-to-date information on weather in its assigned region. The NWS WFOs also provide route forecastand terminal area forecast.
2.5 A Review of Weather Products and Delivery Systems
This section of the report summarizes the major weather products and gives the reader an overview ofthe major delivery systems. In this report, weather products are defined as information (measured data,processed data, forecasts) that have been packaged for interpretation by the recipient to aid in makingboth strategic and tactical decisions affecting aviation safety. Where as, delivery systems are defined asthe communications paths over which weather products are delivered to the user.
2.5.1 Summary of Aviation Weather Products
The intent of this section of the report is to give the reader a summary overview of the major weatherproducts and to illustrate how weather products are designed to address the specific phases of flight and toaddress specific coverage areas. The weather product information was captured in a database for ease ofretrieval and analysis. Table 2-3 contains a listing and brief description of 23 of the 45 weather productscontained in the database. A more detailed description of each of the weather products can be found inAppendix C.
Table 2-4 contains information, extracted from the database, on 23 of the weather products. Theexample query provides weather product source, coverage area, update rate, and product life information.Table 2-5 has been color coded to illustrate how different weather products have been tailored to specificportions of the flight phase. Note that the METAR, SPECI, TAF, TDWR, LLWAS, and WSP are alllocalized measurements or forecast for the terminal area. For the en route phase of flight, weatherproducts may provide information on atmospheric events that are affecting a very large area or theweather product may address events on a much smaller scale or along a specific route. For example, theAIRMETs and SIGMETs are inflight advisories provided by the Aviation Weather Center which warn
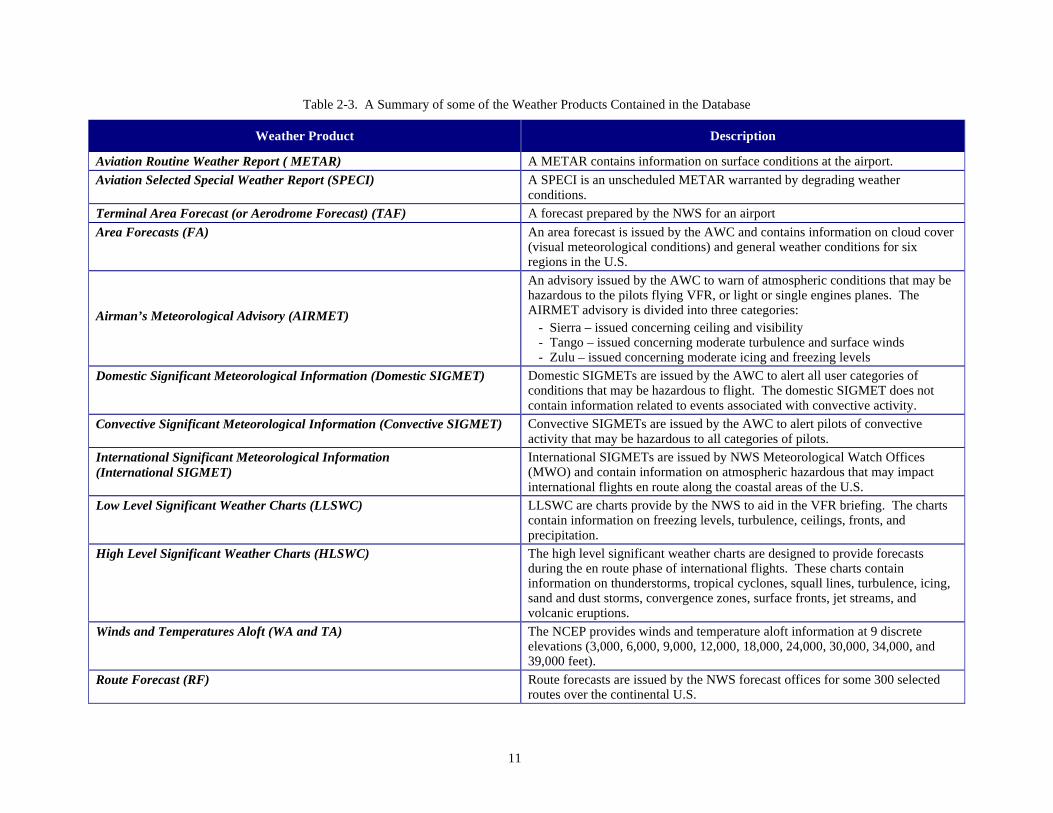
11
Table 2-3. A Summary of some of the Weather Products Contained in the Database
Weather Product Description
Aviation Routine Weather Report ( METAR) A METAR contains information on surface conditions at the airport.
Aviation Selected Special Weather Report (SPECI) A SPECI is an unscheduled METAR warranted by degrading weatherconditions.
Terminal Area Forecast (or Aerodrome Forecast) (TAF) A forecast prepared by the NWS for an airport
Area Forecasts (FA) An area forecast is issued by the AWC and contains information on cloud cover(visual meteorological conditions) and general weather conditions for sixregions in the U.S.
Airman’s Meteorological Advisory (AIRMET)
An advisory issued by the AWC to warn of atmospheric conditions that may behazardous to the pilots flying VFR, or light or single engines planes. TheAIRMET advisory is divided into three categories:
- Sierra – issued concerning ceiling and visibility- Tango – issued concerning moderate turbulence and surface winds- Zulu – issued concerning moderate icing and freezing levels
Domestic Significant Meteorological Information (Domestic SIGMET) Domestic SIGMETs are issued by the AWC to alert all user categories ofconditions that may be hazardous to flight. The domestic SIGMET does notcontain information related to events associated with convective activity.
Convective Significant Meteorological Information (Convective SIGMET) Convective SIGMETs are issued by the AWC to alert pilots of convectiveactivity that may be hazardous to all categories of pilots.
International Significant Meteorological Information(International SIGMET)
International SIGMETs are issued by NWS Meteorological Watch Offices(MWO) and contain information on atmospheric hazardous that may impactinternational flights en route along the coastal areas of the U.S.
Low Level Significant Weather Charts (LLSWC) LLSWC are charts provide by the NWS to aid in the VFR briefing. The chartscontain information on freezing levels, turbulence, ceilings, fronts, andprecipitation.
High Level Significant Weather Charts (HLSWC) The high level significant weather charts are designed to provide forecastsduring the en route phase of international flights. These charts containinformation on thunderstorms, tropical cyclones, squall lines, turbulence, icing,sand and dust storms, convergence zones, surface fronts, jet streams, andvolcanic eruptions.
Winds and Temperatures Aloft (WA and TA) The NCEP provides winds and temperature aloft information at 9 discreteelevations (3,000, 6,000, 9,000, 12,000, 18,000, 24,000, 30,000, 34,000, and39,000 feet).
Route Forecast (RF) Route forecasts are issued by the NWS forecast offices for some 300 selectedroutes over the continental U.S.
12
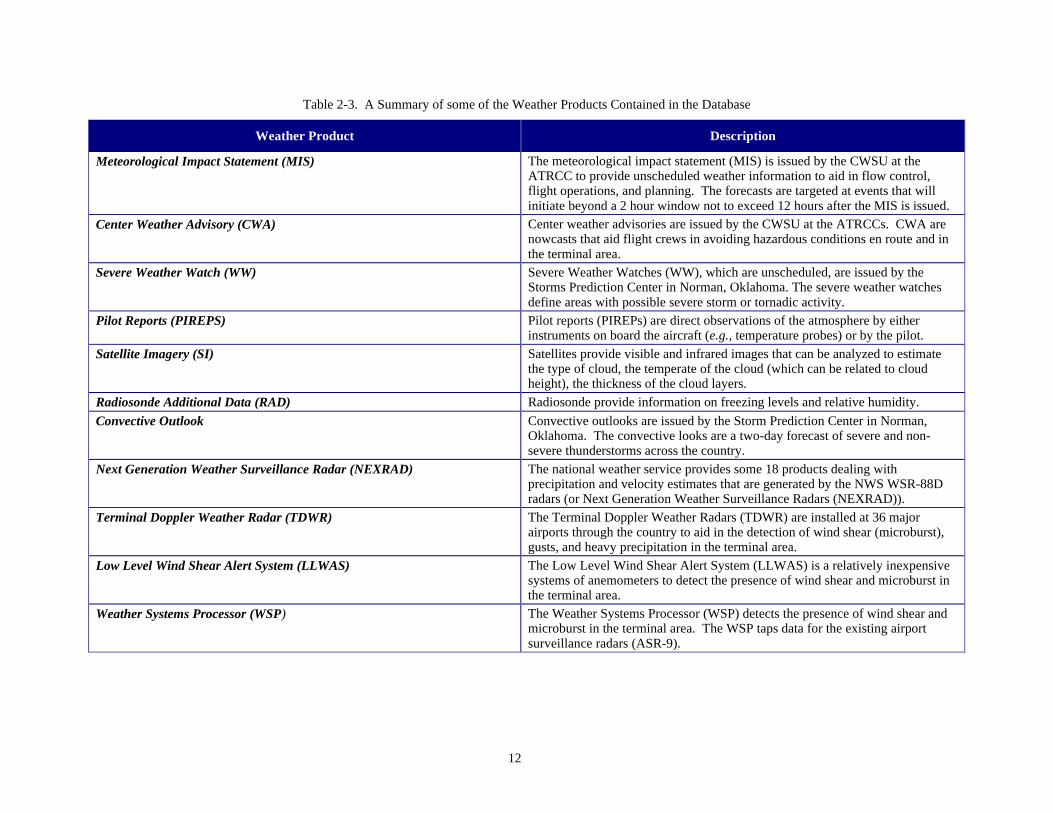
Table 2-3. A Summary of some of the Weather Products Contained in the Database
Weather Product Description
Meteorological Impact Statement (MIS) The meteorological impact statement (MIS) is issued by the CWSU at theATRCC to provide unscheduled weather information to aid in flow control,flight operations, and planning. The forecasts are targeted at events that willinitiate beyond a 2 hour window not to exceed 12 hours after the MIS is issued.
Center Weather Advisory (CWA) Center weather advisories are issued by the CWSU at the ATRCCs. CWA arenowcasts that aid flight crews in avoiding hazardous conditions en route and inthe terminal area.
Severe Weather Watch (WW) Severe Weather Watches (WW), which are unscheduled, are issued by theStorms Prediction Center in Norman, Oklahoma. The severe weather watchesdefine areas with possible severe storm or tornadic activity.
Pilot Reports (PIREPS) Pilot reports (PIREPs) are direct observations of the atmosphere by eitherinstruments on board the aircraft (e.g., temperature probes) or by the pilot.
Satellite Imagery (SI) Satellites provide visible and infrared images that can be analyzed to estimatethe type of cloud, the temperate of the cloud (which can be related to cloudheight), the thickness of the cloud layers.
Radiosonde Additional Data (RAD) Radiosonde provide information on freezing levels and relative humidity.
Convective Outlook Convective outlooks are issued by the Storm Prediction Center in Norman,Oklahoma. The convective looks are a two-day forecast of severe and non-severe thunderstorms across the country.
Next Generation Weather Surveillance Radar (NEXRAD) The national weather service provides some 18 products dealing withprecipitation and velocity estimates that are generated by the NWS WSR-88Dradars (or Next Generation Weather Surveillance Radars (NEXRAD)).
Terminal Doppler Weather Radar (TDWR) The Terminal Doppler Weather Radars (TDWR) are installed at 36 majorairports through the country to aid in the detection of wind shear (microburst),gusts, and heavy precipitation in the terminal area.
Low Level Wind Shear Alert System (LLWAS) The Low Level Wind Shear Alert System (LLWAS) is a relatively inexpensivesystems of anemometers to detect the presence of wind shear and microburst inthe terminal area.
Weather Systems Processor (WSP) The Weather Systems Processor (WSP) detects the presence of wind shear andmicroburst in the terminal area. The WSP taps data for the existing airportsurveillance radars (ASR-9).

13
Table 2-4. A Summary of some of the Weather Products Contained in the Database
Weather Product Description
Aviation Routine Weather Report ( METAR) A METAR contains information on surface conditions at the airport.
Aviation Selected Special Weather Report (SPECI) A SPECI is an unscheduled METAR warranted by degrading weatherconditions.
Terminal Area Forecast (or Aerodrome Forecast) (TAF) A forecast prepared by the NWS for an airport
Area Forecasts (FA) An area forecast is issued by the AWC and contains information on cloud cover(visual meteorological conditions) and general weather conditions for sixregions in the U.S.
Airman’s Meteorological Advisory (AIRMET)
An advisory issued by the AWC to warn of atmospheric conditions that may behazardous to the pilots flying VFR, or light or single engines planes. TheAIRMET advisory is divided into three categories:
- Sierra – issued concerning ceiling and visibility- Tango – issued concerning moderate turbulence and surface winds- Zulu – issued concerning moderate icing and freezing levels
Domestic Significant Meteorological Information (Domestic SIGMET) Domestic SIGMETs are issued by the AWC to alert all user categories ofconditions that may be hazardous to flight. The domestic SIGMET does notcontain information related to events associated with convective activity.
Convective Significant Meteorological Information (Convective SIGMET) Convective SIGMETs are issued by the AWC to alert pilots of convectiveactivity that may be hazardous to all categories of pilots.
International Significant Meteorological Information(International SIGMET)
International SIGMETs are issued by NWS Meteorological Watch Offices(WMO) and contain information on atmospheric hazardous that may impactinternational flights en route along the coastal areas of the United States.
Low Level Significant Weather Charts (LLSWC) LLSWC are charts provide by the NWS to aid in the VFR briefing. The chartscontain information on freezing levels, turbulence, ceilings, fronts, andprecipitation.
High Level Significant Weather Charts (HLSWC) The high level significant weather charts are designed to provide forecastsduring the en route phase of international flights. These charts containinformation on thunderstorms, tropical cyclones, squall lines, turbulence, icing,sand and dust storms, convergence zones, surface fronts, jet streams, andvolcanic eruptions.
Winds and Temperatures Aloft (WA and TA) The NCEP provides winds and temperature aloft information at 9 discreteelevations (3,000, 6,000, 9,000, 12,000, 18,000, 24,000, 30,000, 34,000, and39,000 feet).
Route Forecast (RF) Route forecasts are issued by the NWS forecast offices for some 300 selectedroutes over the continental U.S.

14
Table 2-4. A Summary of some of the Weather Products Contained in the Database
Weather Product Description
Meteorological Impact Statement (MIS) The meteorological impact statement (MIS) is issued by the CWSU at theATRCC to provide unscheduled weather information to aid in flow control,flight operations, and planning. The forecasts are targeted at events that willinitiate beyond a 2 hour window not to exceed 12 hours after the MIS is issued.
Center Weather Advisory (CWA) Center weather advisories are issued by the CWSU at the ATRCCs. CWA arenowcast that aid flight crews in avoiding hazardous conditions en route and inthe terminal area.
Severe Weather Watch (WW) Severe Weather Watches (WW), which are unscheduled, are issued by theStorms Prediction Center in Norman, Oklahoma. The severe weather watchesdefine areas with possible severe storm or tornadic activity.
Pilot Reports (PIREPS) Pilot reports (PIREP) are direct observations of the atmosphere by eitherinstruments on board the aircraft (e.g., temperature probes) or by the pilot.
Satellite Imagery (SI) Satellites provide visible and infrared images that can be analyzed to estimatethe type of cloud, the temperate of the cloud (which can be related to cloudheight) , the thickness of the cloud layers.
Radiosonde Additional Data (RAD) Radiosonde provide information on freezing levels and relative humidity.
Convective Outlook Convective outlooks are issued by the Storm Prediction Center in Norman,Oklahoma. The convective looks are a two-day forecast of severe and non-severe thunderstorms across the country.
Next Generation Weather Surveillance Radar (NEXRAD) The national weather service provides some 18 products dealing withprecipitation and velocity estimates that are generated by the NWS WSR-88Dradars (or Next Generation Weather Surveillance Radars (NEXRAD)).
Terminal Doppler Weather Radar (TDWR) The Terminal Doppler Weather Radars (TDWR) are installed at 36 majorairports through the country to aid in the detection of wind shear (microburst),gusts, and heavy precipitation in the terminal area.
Low Level Wind Shear Alert System (LLWAS) The Low Level Wind Shear Alert System (LLWAS) is a relatively inexpensivesystems of anemometers to detect the presence of wind shear and microburst inthe terminal area.
Weather Systems Processor (WSP) The Weather Systems Processor (WSP) detects the presence of wind shear andmicroburst in the terminal area. The WSP taps data for the existing airportsurveillance radars (ASR-9).

15
Table 2-5. Weather Product Attributes Extracted from the Database
Weather Produce Source Coverage Area Update Rate Product Life
METAR ASOS, AWOS, HO Terminal 1 hour 1 hour
SPECI ASOS, AWOS, HO Terminal As conditions warrant < 1 hour
TAF NWS WFO Terminal 4 hours 24 hours
FA AWC 6 regions 8 hours 12 hours
AIRMET – Sierra AWC 3000 square miles 6 hours 6 hours
AIRMET – Zulu AWC 3000 square miles 6 hours 6 hours
AIRMET – Tango AWC 3000 square miles 6 hours 6 hours
SIGMET – Domestic AWC 3000 square miles As conditions warrant 4 hours
SIGMET – Convective AWC 3 Regions (E, C, W) 1 hour 2 hours
SIGMET – International NWS WMO 3000 square miles As conditions warrant 4 hours
LLSWC NWS U.S. region 4 times per day 12 to 24 hours
HLSWC NWS U.S. region 4 times per day 6 hours
Winds and Temperatures Aloft NCEP U.S. region 12 hours 6 | 12 | 24 hours
Route Forecast NWS WFO Route specific 3 times per day 15 hours
MIS CWSU Regional As conditions warrant 12 hours
CWA CWSU Regional As conditions warrant 2 hours
WW SPC Variable As conditions warrant
PIREPS Pilots Localized As conditions warrant variable
Satellite Imagery GOES/NOAA National 15 min – 1 hour
Radiosonde NWS National 12 hours current conditions
Convective Outlook SPC National 5 | 2 times per day 24 | 48 hours
NEXRAD NWS ~200 mile radius 6 – 12 minutes now cast
TDWR FAA/NWS Terminal As conditions warrant now cast
LLWAS FAA/NWS Terminal As conditions warrant now cast
WSP FAA/NWS Terminal As conditions warrant now cast

16
pilots of hazardous conditions that are affecting or will be affecting an area of at least 3,000 square milesat any one instant in time. Route forecasts, issued by the NWS WFOs, provide pilots forecast informationfor more than 200 specific routes over the contiguous United States. Weather products also are designedto provide the pilots with information that is very location specific. For example, pilot reports (PIREPS)are issued by pilots who have experienced adverse weather conditions in flight. This informationprovides other pilots with a snap shot of potential adverse conditions that may lie along his route.
2.5.2 Sensors
Sensors provide the means of measuring a property of the atmosphere either remotely or in situ. Inthis report, sensor outputs are considered, in most cases, weather products. A complete analysis of sensorsystems is given in Section 4 of this report.
2.5.3 Delivery Systems
Pilots rely on a number of different delivery systems to receive weather and flight information duringthe en route and terminal phases of flight.
In the terminal area, pilots may receive weather and forecast information from a number of differentsources. The Automated Weather Observing System (AWOS) and Automated Surface ObservationSystem (ASOS) broadcast local weather information directly to pilots via discrete very high frequency(VHF) transmissions or as the voice portion of a local navigational aid (NAVAID). The AutomaticTerminal Information Service (ATIS) is a continuous broadcast of recorded weather and runwayconditions of importance to arriving and departing aircraft. ATIS is also broadcast over discrete VHFradio channels or the voice portion of a local NAVAID. The Aircraft Communications Addressing andReporting System (ACARS) is a VHF air/ground datalink that relays weather information to the cockpitin a digital format. Both Terminal Weather Information for Pilots (TWIP) and the Digital AutomatedTerminal Information Service (D-ATIS) are available through ACARS.
In the domestic en route flight phase, pilots have direct access to weather information and flightplanning assistance via Flight Service Stations (FSSs) and Automated Flight Service Stations (AFSS). Ifavailable, an En Route Flight Advisory Service (EFAS) (Flight Watch) provides weather updates andadvisories by providing pilots direct access to weather specialists. FSSs, AFSSs and EFASs all transmitdata directly over VHF radio. For short or local flights, pilots can use the Transcribed Weather Broadcast(TWEB), which provides continuous, up-to-date, recorded weather information. Pilots can also receive orrequest weather information directly from their operation centers over VHF radio through ACARS. AirRoute Traffic Control Centers (ARTCCs) are capable of direct communications with IFR air traffic onspecific frequencies. If hazardous weather conditions develop, pilots will be advised to tune into theHazardous In-Flight Weather Advisory Service (HIWAS) for a continuous broadcast of recorded in-flightweather advisories. For oceanic flights, pilots can receive updated weather information via ACARS.The Lockheed Martin report [2-10] provides additional incites into the current set of delivery systems.
The main conclusion of this discussion is that a number of systems have been developed to providepilots with the latest weather information. However, the majority of these systems require the pilot tomanually request information. In some cases, the pilot may not know what information to request sinceconditions may have changed considerably since initiating flight. For all of the delivery systems, exceptACARS, voice is the only means of receiving information during flight. For the high-end aircraft,ACARS provides the capability to support both text and voice.

17
At the time of this reporting, the FAA seems to be moving in a direction that will support informationpresentation to the pilot in a graphical format, making it easier to interpret and making possible additionalinformation to aid the pilot in making both strategic and tactical decisions. The FAA has agreed toestablish a partnership with industry to make available to the general aviation community FlightInformation Services via Data Link. The FAA/Industry partnership includes NavRadio Corp. andARNAV Systems Inc. This system will allow pilots to display both text and graphical weatherinformation. Full national deployment is scheduled for the year 2000 [2-11].
2.6 Database Development and User Feedback
GTRI used two information sources, user surveys and visits, to investigate how weather products areapplied in the aviation community. Due to time and resource constraints, the number of surveys andvisits was limited to a small sampling of the cross section of the user community.
2.6.1 Survey
GTRI developed a survey (see Appendix D) containing questions that focused on user operationalparameters, weather product utilization as a function of the phase of flight, and user opinion of weatherproduct attributes (e.g., utilization, accuracy, constraints, utility, and price). Results from these surveysprovided insights into how, when, and where weather products are used as well as how the aviationcommunity perceives these weather products.
Table 2-6 indicates to whom the surveys were sent and the role of the respondent under each of theFAR categories. Multiple entries in the table indicate more than one respondent from a given company.Three of the surveys were not returned as noted in Table 2-6. The results of the surveys were recorded ina relational database for both current and future analysis. For example, a rank ordering of the mostfrequently used weather products by flight phase is shown in Table 2-7. This type of information caneasily be extracted from the database to aid in current and future analysis.
2.6.2 Weather Product Database
2.6.2.1 Overview
A Weather Product Database was developed as a requirement under this subtask for the purpose ofcompiling information about current information products and sources in a format that provided readyaccess to the information. Guidelines for the database were specific in that the database should includeinformation about the weather information source, the route from origin to user, the method ofapplication, related economics, the extent of use, latency, adequacy, criticality, information format,displays, availability, and required hardware and software. Weather information was also to becategorized by user type (e.g., Part 91, Part 135, Part 121, AOC, ATC, etc.)
GTRI chose to implement the database using Microsoft Access (“Access”), a relational databaseapplication, for two primary reasons. First, a relational database has the ability to integrate or link datafrom various data tables by using common attributes (columns of information). Thus the information inone table may be related to the information in another. Relational databases also help eliminate redundantinformation, reduce storage retirements, and heighten data integrity and consistency. Second, Access is awidely used, user friendly database application that will allow users to develop tables, forms, reports, andqueries without requiring programming skills.

18
Table 2-6. A List of Survey Participants
user_name Role FAR Part Comments
1 Tri-Star Pilot 135
2 Epps Aviation (Charter) Pilot 135
3 Epps Aviation (Charter) Pilot 135
4 United Parcel Service Pilot 121
5 United Parcel Service Dispatcher 121
6 United Parcel Service Meteorologist 121
7 United Parcel Service Meteorologist 121
8 United Parcel Service Meteorologist 121
9 Southern Company Pilot 91
10 Southern Company Pilot 91
11 Southern Company Pilot 91
12 Southern Company Pilot 91
13 Delta Airlines Dispatcher 121
14 Delta Airlines Dispatcher 121
15 Delta Airlines Dispatcher 121
16 Northern Air Cargo (Alaska) Pilot 121 survey not received
17 Northern Air Cargo (Alaska) Pilot 121 survey not received
18 Northern Air Cargo (Alaska) Pilot 121 survey not received
Table 2-7. Frequency of Weather Product Use by Phases of Flight
Flight Phase Weather Product (Most Frequent)
Preflight Planning TAF, Winds Aloft, METARTaxi Out and Takeoff ATISDeparture Operations Weather Radar (Airborne)Initial Climb Weather Radar (Airborne)Cruise Winds Aloft, Weather Radar (Airborne)Approach Operations ATIS, Weather Radar (Airborne)Landing Operations Weather Radar (Airborne)Taxi In and Park ATISAlternate Airport Operations METAR, TAF
There are three primary purposes for the database:
(1) The database will allow users to easily access information about the various weather products andthe characteristics of the weather products. Once the data are entered, questions can be asked ofthe weather products by using queries into the various tables.
(2) The data obtained from the surveys provides insight into who, what, when, and where weatherproducts are used. While the survey data are not a true statistical sampling of weather productusers, the survey respondents do represent a meaningful segment of users and provide a realisticview of how weather products are used and the perceived value of the weather products.

19
(3) The database can be used as a tool for determining weather requirements and deficiencies. Bylinking the survey tables to the weather product and weather element tables, the database canprovide insightful information. For example, time constraints faced by the different pilot andaircraft categories can be uncovered by querying weather products by weather element, productinformation, duration, and frequency.
The database was populated with data obtained from the surveys and from sources listed in thereference section of this report. The survey participants are described in Table 2-6.
2.6.2.2 Future Capabilities
The Weather Products Database is capable of providing more than just summary and detailinformation queries. With additional development, algorithms can be built and incorporated into queriesthat when linked to the various tables could be used for scenario or “what if” analysis. For example, analgorithm that incorporates the temporal and spatial coverage of the various weather products and thenlinks them to a flight scenario reflecting a given type of aircraft, time of day, and weather condition couldreveal where the weather product has limitations, deficiencies, or is more than adequate under thescenario.
Also, additional weather element attributes or characteristics could be developed for the weatherelement table that would make the database more useful. For example, by adding intensity levels, hazardranges, and concentration levels as weather element attributes, the database would reveal associationsbetween weather element characteristics, flight phases, aircraft classes, and weather products. Additionalfeatures of the database could also include a more comprehensive definition of the weather products andlinks to selected Internet sites that provide additional weather product information.
2.6.3 User Inputs
GTRI made four formal visits and conducted one phone call interview as a part of the survey process.Table 2-8 lists the operators that were visited. Results from these interviews are summarized in thefollowing sections.
Table 2-8. Companies that Participated in Formal Interviews
Operator Department
FAA Southeast Region Terminal Radar Approach Control (TRACON)
Delta Airline Systems Operations Control Center
FAA Headquarters FIS Project Office
National Weather Service Peachtree City NWC
United Parcel Service Flight Operations
2.6.3.1 United Parcel Service (UPS)
GTRI selected two 121 Part operators to interview on a more formal basis (face-to-face interviewswith key operations personnel) in addition to the informal weather product surveys sent to the twocompanies. UPS was selected because of its status as the world’s largest package distribution company.UPS has 224 jet aircraft in its fleet and charters another 302 aircraft. UPS flies 995 domestic segments

20
and 559 international segments on a daily basis into 391 domestic airports and 219 international airports.In support of its operations, UPS maintains a well equipped and staffed meteorological department at itsaviation headquarters in Louisville, Kentucky. GTRI’s point of contact at UPS is Randy Baker, ChiefMeteorologist for Flight Operations.
The purpose of the interview was to gather information from UPS on how they applied weatherinformation in regard to safety and day to day operations (cost/efficiency). The following is a summaryof those discussions. UPS also provided additional information in their response to the survey. Thisinformation in partially captured in the text and the full content of the survey response is captured in thedatabase.
In the interview, UPS was asked to elaborate on which components of the aviation weatherinformation system (dissemination, sensors, weather products) needed improvement. UPS’s response canbe grouped into two main areas: sensor capabilities/support and weather product dissemination/availability.
For UPS, the reduction in the number of runway visual range (RVR) sensors providing real-timeupdates across the country has had an impact on their operations in terms of both safety and economics.Besides providing a tactical sensor on approach, RVR trend monitoring permits one to predict changingconditions at an airport. This type of information allows the pilot to make an informed decision aboutchanging conditions at the destination and alternate airports. UPS’s perception of a reduction in RVRsupport needs to be investigated further.
UPS also noted that the Low Level Wind Shear Alert System (LLWAS) is reported to have a highfalse alarm rate. This high false alarm rate may reduce pilot confidence in the system, resulting in “go”decisions when conditions are marginal. LLWAS is a relatively inexpensive system of anemometers,positioned around the terminal area, that are integrated as a system to provide microburst, gust front, andwindshear information. Over a hundred airports were equipped with the original system during the1977-1987 time frame. A LLWAS enhanced network (LLWAS-NE) is being developed that will bedeployed at 39 airports across the country [2-3]. Gleim [2-3] notes that the original LLWAS willeventually be phased out at the remaining 61 airports. In addition to the problem of a high false alarmrate, LLWAS is a surface level sensor, which does not provide information needed to characterizeconditions along the glide slope. The terminal Doppler weather radar (TDWR) was developed to aid inthe characterization of higher level winds in the terminal area. UPS’s comment needs to be investigatedin light of the advances of the LLWAS-NE and the potential reduction in the number of LLWAS sites.
UPS is also concerned with the potential lack of a satellite to detect the presence of volcanic ash. Theperceived situation, by UPS (and Delta), is that the existing GOES asset used to detect volcanic ash willnot be available after the year 2002. This is a perceived gap that needs to be investigated further. Theduration of this study did not permit GTRI to validate this assertion, but two sources (Delta and UPS)seem to confirm that it is a potential issue and one that has the aviation community concerned.
UPS meteorologists have also identified the need for a water vapor sensor to predict icing and fogconditions. Water vapor is a key variable in attempting to define a number of weather conditions,including: ceiling and visibility, turbulence, icing, thunderstorms, precipitant type and amount. UPS isinvolved in a joint program with NOAA and American Airlines to investigate the use of an airborne watervapor sensor to provide real-time data collection. The current developmental system provides real-timedisplay of water vapor, temperature, and wind information as it is being collected. The display isavailable on a limited access internet site. The airborne system would provide a finer sampling of the

21
atmosphere than the current system of radiosonde. Water vapor data are used in conjunction with windsand temperature information as an input to mesoscale models (e.g., the rapid update cycle (RUC) model)to predict atmospheric conditions on both a large and small scale. The quality of the forecast is a functionof both the model fidelity and the quality of the data input to the model. Incorporation of sensors onaircraft in conjunction with radiosonde and additional ground based sensors (e.g., wind profilers andDifferential Absorption Lidar (DIAL) water vapor profiles) would lead the way to improved forecastingon the scale required for aviation. Mesoscale modeling and sensor capabilities and spacings need to beinvestigated in terms of their potential impact on aviation safety.
Prediction of icing conditions is another area of major concern for both UPS and Delta. Icing impactsboth safety and operations (cost/efficiency). The predicted level of icing will determine what proceduresa company will follow to prevent ice buildup (e.g., type of de-icing solvent). Delays and costs due toicing can impact the parallel goal of increasing the aviation system capacity while improving safety. UPSconsiders this as an area where more can be done to improve safety and efficiency.
Pilot reports (PIREPS) are an integral part of UPS’s flight planning and hazardous weather avoidancesystem. PIREPS are a very useful aviation safety tool (e.g., notification of unforecasted severe turbulencein an area). UPS collects PIREPS from their pilots on a regular basis. However, UPS perceives areduction in the number of reports and a lack of dissemination of PIREPS between Part 121 operators.Delta also employs pilot reports on a regular basis. The movement toward electronic PIREPS (EPIREPS)will help in increasing the number of reports and the quality of the information. In parallel with definingsensors for EPIREPS, dissemination networks, with sufficient bandwidth, need to be identified to supportthe increased amount of information to be down linked and distributed to user community.
UPS made the statement that it would like to see new products or those under development be madeavailable to all members of the aviation community as soon as possible. In particular, UPS would like tosee as many products as possible made available to both the pilot and dispatchers. One example ofmoving in the right direction is the integrated terminal weather support system (ITWS) that is currentlybeing developed to integrate weather products generated by LLWAS, TDWR, ASOS, and other sensors inthe terminal area. The terminal weather information for pilots (TWIP) digital communications system isan example of a parallel effort to provide TDWR and ITWS in text and character graphic messages.Limiting a product’s dissemination or data format reduces the product’s ability to aid the pilot in makingboth tactical and strategic decisions. In this same spirit, UPS would also like to see more of the weatherproducts formatted to directly support the aviation community.
2.6.3.2 Delta Airlines
GTRI also selected Delta Airlines to participate in a formal interview. Delta Airlines represents one ofthe top five commercial airlines in the Nation and is a 121 Part certificate holder. GTRI’s contacts at theAtlanta based Delta Airlines Flight Operations and Weather Center are Mr. Hank Echols, Manager andChief Dispatcher, and Mr. Joe Luisi, Chief Meteorologist.
Delta Airlines’ operations center is supported by a staff of 18 meteorologists and is equipped withsome of the most modern weather information systems. Weather information plays a major role in flightsafety and operations. In the case of Delta, a performance degradation due to winds, equivalent to aone cent increase in fuel cost, amounts to a loss of $25 million dollars over the course of a year. Delta iscontinually applying weather information to identify optimum routes in order to take advantage of tailwinds and to reduce the effects of head winds. Delta is also very concerned with weather’s impact onsafety. For example, Delta is concerned with identifying regions that may contain severe turbulence.

22
Severe turbulence is a hazard to both passengers and equipment. To support hazardous weatheravoidance, Delta dispatchers are Enhanced Weather Information Systems (EWINS) certified (seeAppendix E) which permits them to make and issue flight movement forecast to avoid hazardous areas.Appendix F contains a job description for a Delta aircraft dispatcher. In should be noted, that thedispatcher shares the responsibility for flight safety with the pilot. In addition, the major hubs receiveweather briefings from the Atlanta-based Delta Airlines operation center four times a day.
Delta places a high value on accurate forecasting of winds and temperature aloft information. Asnoted, these forecasts are currently based on mesoscale models with input from sensors (radiosonde)whose spacings are on the order of 200 nautical miles apart. Delta would like to see improvements inthese forecasts both from a safety and economic stand point. Delta noted that trans-Atlantic flightsrequire accurate winds aloft information due to the close spacing between the flights in this crowdedcorridor. Only a finite set of economically efficient tracts exists in the corridor. Approximately300 flights enter this corridor once a day with most of the flights confined within a 12 hour window. Theaircraft are stacked vertically and temporally with 10 minute spacings. In addition, mountain waves fromGreenland are known to induce turbulence in this region. Delta has also identified turbulence detectionand mitigation as an area where they would like to see improvements.
Delta pointed out their concern that much of the weather information collection in the terminal area isbeing obtained through an automated system (e.g., ASOS). Delta’s chief meteorologist expressed hisview that the man-in-the-loop is still required to convey accurate information concerning certainatmospheric conditions, for example, ceilings and visibility. Sensors tend to look through a straw whenobserving the environment and tend not to provide a composite view of the terminal area.
Delta points out that hail continues to be a significant hazard to aviation. Delta’s operating procedurescall for their aircraft to stay at least 20 miles from thunderstorms. Thunderstorms produce a number ofhazards including hail. The ability to distinguish hail from other precipitant types is an area whereresearch into improved sensor systems (e.g., radars employing polarization diversity) may benefit theaviation community.
One of the concerns voiced by Delta is the apparent move by the NWS away from supporting thespatial resolution needs of the aviation community. NWS forecasts tend to characterize weather eventsover large regions, whereas, the aviation community would like to have more localized forecasts. On asimilar note, there is currently a bill in Congress to take the NWS out of the aviation weather informationprovider role. Aviation weather information would be obtained directly from commercial suppliers.Delta currently purchases enhanced weather information from a number of providers including BraknelWinds, Suitland Winds, and Litton Weather Services International (WSI). Delta and WSI have jointlybeen developing an advanced weather information system termed DWINS which will be installed in thelatter part of 1999.
As a final note, Delta pointed out that the electro-optic and infrared imaginary supplied by WSI is notcapable of providing water vapor information at the lower altitudes. This may be significant inforecasting potential icing conditions.
2.6.3.3 National Weather Service Weather Forecast Offices
As one of the key components in the NWS and FAA aviation weather information support system, theNational Weather Service Weather Forecast Offices (NWS WFO) provide a number of products tosupport the aviation community. As an example, the NWS WFOs provide both route and terminal area

23
forecasts. NEXRAD radars located at the NWS WFO sites generate some 18 weather products providinginformation on precipitation levels and weather movement and development. These products areprovided to four commercial vendors who add value and market them commercially. A direct feed fromthe NWS WFO is also made available to a number of government agencies within the FAA/NWS supportsystem. The FAA-sponsored NEXRAD product development team is investigating a number of possibleupgrades to the NEXRAD radar that may directly impact the aviation community. These include:
• Development and enhancement of the damaging downburst detection and prediction algorithm
• Polarization algorithm development
• Enhancement of NSSL’s mesocyclone detection and tornado detection algorithms
• Rapid update, improving the update rate from the current 5 to 6 minute rate
• Integration of the storm cell identification and tracking
• High resolution layered composite reflectivity
• Develop and implement volume coverage patterns
The enhancements will provide scanning patterns and update rates commensurate with aviationweather information needs. The enhancements will also improve storm tracking and identification andprecipitant type discrimination. These enhancements can improve the quality and timeliness ofinformation. However, the infrastructure to support aviation weather information dissemination andinterpretation must also be in place to take advantage of these enhancements as they come on-line.
GTRI visited the NWS WFO in Peachtree City, Georgia to get an overview of how this office supportsthe aviation community. GTRI’s point of contact at the NWS WFO in Peachtree City is ChiefMeteorologist Gary Bealy. One of the main observations extracted from that interview was the fact thatthe NWS WFO’s role in providing weather information to the aviation community has changed. The rolehas shifted away from being a provider of weather briefings directly to pilots. This role of interfacingwith the general aviation pilot has been assumed by the Flight Service Stations who provide pre-flightbriefings and en route information.
The NWS WFO are official sites for administering radiosonde observations. These soundings aretaken twice a day at 0000Z and 1200Z. These observations are used as inputs to mesoscale models.Radiosonde observations are taken at 102 discrete locations across the country with an approximatespacing of 200 nautical miles. This sparse network of observations is the focal point of Delta’s andUPS’s concerns in the previous sections.
2.6.3.4 Southern Region Air Traffic Control
To get a perspective from the air traffic control community, GTRI contacted the FAA Air TrafficControl Southern Region Headquarters in Atlanta, Georgia. The primary contact at the Southern RegionHeadquarters is Ms. Nancy Shelton. Ms. Shelton focused her comments on the role of Flight ServiceStations (FSS) in providing updated weather information to the Part 91/135 operator.
Ms. Shelton provided the following commentary on the role of the FSS in support the PIREP program.A key feature of the FSS activity is responding to requests from pilots in flight and during the planningphase. This includes the function of receiving and processing PIREPS. The point was made that thePIREP process depends on the individual skill and proficiency of the person handling the report. Theprocess is described as “manual” by Ms. Shelton. The PIREP is received and must be manually recorded

24
and then entered into the system. It is immediately apparent that this can become labor intensive whenconditions are severe and changing rapidly and air traffic is dense. Nevertheless the “Flight Watch”activity within the FSS is a very important function, and under the present system, it is the primary modeof update for the general aviation Part 91 aviation consumer and for some 135 operators.
2.6.3.5 Flight Information Systems – Dean Resch
The National Aeronautics and Space Administration (NASA), in partnership with the Federal AviationAdministration (FAA), is conducting research and development programs to modernize the NationalAirspace System (NAS). Advanced Air Transportation Technologies (AATT) is one effort, under thisprogram, developing concepts and decision support tools for eventual deployment and implementation bythe FAA and the private sector. A major objective of the NASA AATT project is to understand andpromote the needs of all aviation user categories (Parts 91, 121, and 135). The Gulf of Mexico presentssome challenging NAS opportunities that will impact all three categories of users.
There is a large region over the middle of the Gulf of Mexico where no communication with aircraftflying above 18,000 feet is possible due to inadequacies in the communication network. This area isreferred to as the “doughnut.” Understandably, this presents a problem in providing weather informationto aircraft at these flight levels. The FAA is addressing this high altitude communication problem byusing four communication relay buoys designed to serve as radio relay stations. These stations will bestrategically placed in the Gulf “doughnut” to support continuous communication with aircraft in thisarea. FAA funds have already been allocated for this project, and the buoys are undergoing tests at thepresent time. When the tests are completed, the buoys will be deployed with a spare ready to take theplace of any station that experiences problems or needs periodic maintenance.
For low altitude operations, below FL180, a similar communication and weather information problemexists. Due to the large number of helicopters operating in the Gulf (more than 600 helicopterssupporting 35,000 offshore workers) and the extreme weather elements associated with the Gulf, a similarprogram of deployed buoys is being considered.
Helicopters normally operate at low altitudes; however, in the Gulf, there is an issue of VFR/IFRoperations, which is being addressed by the Flight Information Systems (FIS) program headed by DeanResch. VFR operations are normally conducted at 3,500 feet or below, and IFR operations are normallyconducted at 7,000 feet or below. Helicopters typically operate in the Gulf under VFR without ATCseparation services. During inclement weather when flights cannot be conducted under VFR conditions,the low operating altitudes and line-of-sight limitations on communication and radar signals limit FAAsurveillance and make mandatory the use of non-radar separation standards. These are very inefficient interms of traffic throughput.
Specialized pilot training and flight procedures are utilized for IFR flights in the Gulf. IFR flightsbegin with pilots receiving weather information from company dispatchers and AWOS or certifiedweather observers. Flight plans are filed with the FSS via commercial telephone, VHF voicecommunications, Direct user access terminal (DUAT), or with Houston ARTCC via VHF voicecommunications. IFR clearances are relayed through company dispatchers and pilots via commercialtelephone. Dispatchers and FSS may issue weather updates. Radar and communication coverage at theplatform level is limited with limitations extending to the onshore hubs as well. As a result, IFR serviceto helicopters operating in the region is based on the rule commonly referred to as the “one in/one out”rule. This can generate delays of one or more hours during instrument meteorological conditions.

25
Consequently, the FAA FIS program is also looking at solutions for the helicopter IFR problem. Todate, there is not a formal program such as that for the above FL 180 situation. The program director hasheld meetings with the Gulf region helicopter community, and it appears that a program is taking shape.The oil industry is considering donating at least two offshore platforms that could serve as sites forweather observation and communication equipment to better support helicopter IFR operations.NEXRAD like radars are being consider for placement on these platforms to aid in obtaining a compositeview of weather in the Gulf.
2.7 Deficiencies in the Current Set of Weather Products
2.7.1 Introduction
This phase of the subtask has focused on collecting a body of information characterizing the currentset of aviation weather products. The information was collected from a number of sources including theworld wide web, literature, surveys, and interviews. This information was then captured in a databaseand in text format (within this report). The last portion of this phase of the subtask is to identify anydeficiencies in the current set of weather products. The approach taken was to combine the opinions ofthe user community (albeit limited within the scope of this task) with GTRI’s assessment, based on thecollected information, to develop an overview of where the deficiencies lie.
GTRI identified four key areas that contain components that are deficient in some qualitative way.The four key areas are data format, support systems, sensors, and forecasting and modeling as shown inFigure 2-1. Each of these areas will be expanded upon in the following sections.
Data Format
Text Graphics
SupportSystems
InformationDissemination
Equity inInformationQuality
AviationTailoredWeatherInformation
Sensors
Availability
RVR
TDWR
Confidence
LLWAS
Loss of Capability
Volcanic Ash
Lack of Capability
Turbulence
In- flight Icing
Hail
Ceiling and Visibility
Required Tuning
NEXRAD
Forecasting and Modeling
Convective Weather
Mesoscale Modeling
Sensor grid
Fidelity
Overlays
VisualCues
Regional
Identified Deficiencies in the Current Weather Product System
Referencedto
Location
Figure 2-1. Identified deficiencies in the current weather product system

26
2.7.2 Data Format
The utility of a weather product, in many cases, depends on the delivery system’s ability to provide theinformation in a timely manner and in a format that can be easily interpreted. With the amount ofinformation and the format of some of the information (e.g., radar products) currently available to thepilot, a graphical display is needed to reduce the pilot’s workload and to aid in the interpretive process(e.g., a coordinate overlay with hazard areas defined). A graphical display system permits the pilot toswitch between a number of different data sources (provided the communication bandwidth is available)and to overlay the information in order to obtain a composite view of the current or forecasted conditions.There exists the need to develop low cost communication and display systems that can provide currentweather products to the pilot during the en route flight phase to aid him/her in making both tactical andstrategic decisions. The content of the weather products should be correlated with the aircraft’s position.This ability to receive regularly scheduled updates (without operator intervention) in a format that can bequickly and easily interpreted is paramount to enhancing safety.
The timeliness of a weather product also impacts its usefulness. One case in point is the NEXRADradar, which has a 5 to 6 minute update rate. The NEXRAD products are updated after all the data hasbeen collected from each of the elevation scans. An effort is underway to develop the necessaryalgorithms to process the data on a scan by scan basis. The faster update rate may benefit the aviationcommunity. The ability to provide timely updates need to be addressed along with the enhanced dataformat to provide the pilot with quality information.
2.7.3 Support System
Both Part 121 operators interviewed under this subtask observed deficiencies in the “system” designedto provide weather information to the aviation community. One area of concern, expressed by thoseinterviewed, is the slow process in which new products are introduced. In addition, regional, and notnational, implementation limits access to the entire community. This concern is being addressed as oneof the goals under the FAA’s Aviation Weather Research Program (AWRP). However, as new productsare proposed under AWIN, a path for distribution to the end users should be defined.
The FAA depends on the NWS to provide weather information that can be tailored to the needs of theaviation community. However, as stated previously, the NWS often provides weather information on amuch coarser grid than that required for aviation. For example, a number of the in-flight advisories areissued for events that are affecting or will affect an area of at least 3,000 square miles at any one time. Insome cases, an event over a much smaller area may have a significant impact on safety. The aviationcommunity would like to continue to see weather products that are designed for aviation. This mayrequire input earlier in the weather product development process, starting even at the sensor level.AWRP is one FAA program tailored to focus research in those areas that will directly impact flight safetyand to tailor products that will meet the needs of the aviation community. The Aviation Gridded ForecastSystem product develop team, under AWRP, is an example of an effort to move in that direction.
During this investigation, GTRI received comments from at least two sources that the NWS may bemoving in a direction away from supporting the weather information needs of the aviation community.The idea would be to turn the role of providing aviation weather information over to the private sector.This would have both positive and negative impacts, and would need to be investigated more closely froman aviation safety and regulatory standpoint if this idea moves forward.

27
From the Part 121 operator’s viewpoint, the air traffic control system depends on a cooperativeworking relationship between the FAA, NWS, and the airlines. However, in some cases there seems to bea perceived difference in the “quality” of weather information available to the ATC and that available andused by commercial airlines through private vendors. Delta supplied the following example: on the 9th ofAugust, 1999, at the Hartsfield International Airport, it was reported that Atlanta traffic was beingvectored over Nashville because of weather affecting the normal feeder fix to Hartsfield International.However, Delta’s weather support system and staff indicated no reason to divert traffic flow. Deltareceives its value added weather information from WSI, whereas the ATC depends on the NWS. TheFAA has the regulatory authority to make the call, but in many cases will consult with Delta for theirview on developing weather conditions. There is, at least in this case, a perception that the weatherproducts made available to the airlines through private companies are in some ways superior to thoseprovided by the NWS.
The issues discussed in this section are very sensitive in nature and require a joint effort between theFAA, NWS, and industry to develop an infrastructure/support system that can supply the best availableweather products to all parties involved to meet the goals of the AvSP.
2.7.4 Sensors
Sensors were identified as having deficiencies in a number of areas. The deficiencies have beengrouped into five categories: lack of availability, lack of confidence, loss of capability, lack of capability,and required tuning. These are illustrated in Figure 2-1.
The dream is to have a full suite of weather sensors at every airport, but from an economicsstandpoint, this is not feasible. Trades must be made in the allocation of resources. The ability toproliferate radars throughout the country continues to be limited by cost. These sensors provide a unique,remote capability to sense wind conditions along the glide slope. The LLWAS and the ASR-9 WSP arelower cost systems that are intended to provide some of the capability that is afforded by the TDWR. Thedevelopment of lower cost systems would provide the opportunity to place sensors at more sites aroundthe country. A region not supported by weather systems is the Gulf of Mexico. This is an area of densehelicopter traffic used to support the offshore oil industry. The Flight Information Systems program isinvestigating the possibility of siting weather radars on oil platforms in the Gulf to provide the neededinformation to support IFR flight. Finally, during this investigation the lack of runway visual rangesensors at some airports was identified as a key area of concern.
There also exists a lack of confidence in some of the weather products. In particular, UPS has noted ahigh false alarm rate associated with LLWAS. Further analysis is required to confirm or refute thisperception.
Loss of any support function is always viewed as a step backwards. The reported scheduled loss of avolcanic ash detection capability from GOES satellites after the year 2002 has a number of members ofthe aviation community concerned.
Currently, there are a number of hazards that are not detectable/predictable on a regular and consistentbasis using existing deployed sensor suites. Without the necessary sensor capability, the current set ofweather products cannot provide sufficient information to support turbulence detection, in-flight icingprediction, hail detection, and ceiling and visibility measurements.

28
During this weather product investigation, the suggestion was made that a sensor or suite of sensorsshould be developed to provide visibility and ceiling conditions along the glide slope. The sensors wouldprovide information about conditions at airports prior to the pilot initiating the approach phase. A go-around, due to ceilings and visibility below minimums, places the pilot in a higher stress condition thatcould be avoided if conditions at the airport could be known in advance.
As noted in the previous section, deficiencies also exist in some of the weather products when thesensor is not designed to meet the spatial and temporal needs of the aviation community. One example ofthis is the NEXRAD product update rate.
2.7.5 Forecasting and Modeling
The fourth area where deficiencies have been identified is in the area of forecasted weather products.Mesoscale modeling is required to forecast winds and temperatures aloft. However, the model’s forecastproducts are a function of the model’s fidelity and the sensor data input to the model. As noted in thisanalysis, a finer spaced grid of sensors (e.g., radiosonde or wind profilers) is required to provide the levelof forecast needed to support the aviation community.
2.8 A Look Forward to Requirements
This section is intended as a look forward into phase 2 of this subtask. As a reminder, phase 2 focuseson developing weather information requirements for users during each phase of flight. There exists anumber of reports [2-12, 2-13] written in the early 1990’s that look at the weather informationrequirements of the aviation community. These reports will be used as a starting point in the phase IIanalysis so as not to re-invent the wheel. Crabill [2-13] addresses the weather information needs of thepilot in each phase of twelve phases of flight. These phases of flight are depicted in Figure 2-2. Asummary of the weather information requirements, as identified in Crabill’s report, are given in Table2-9.
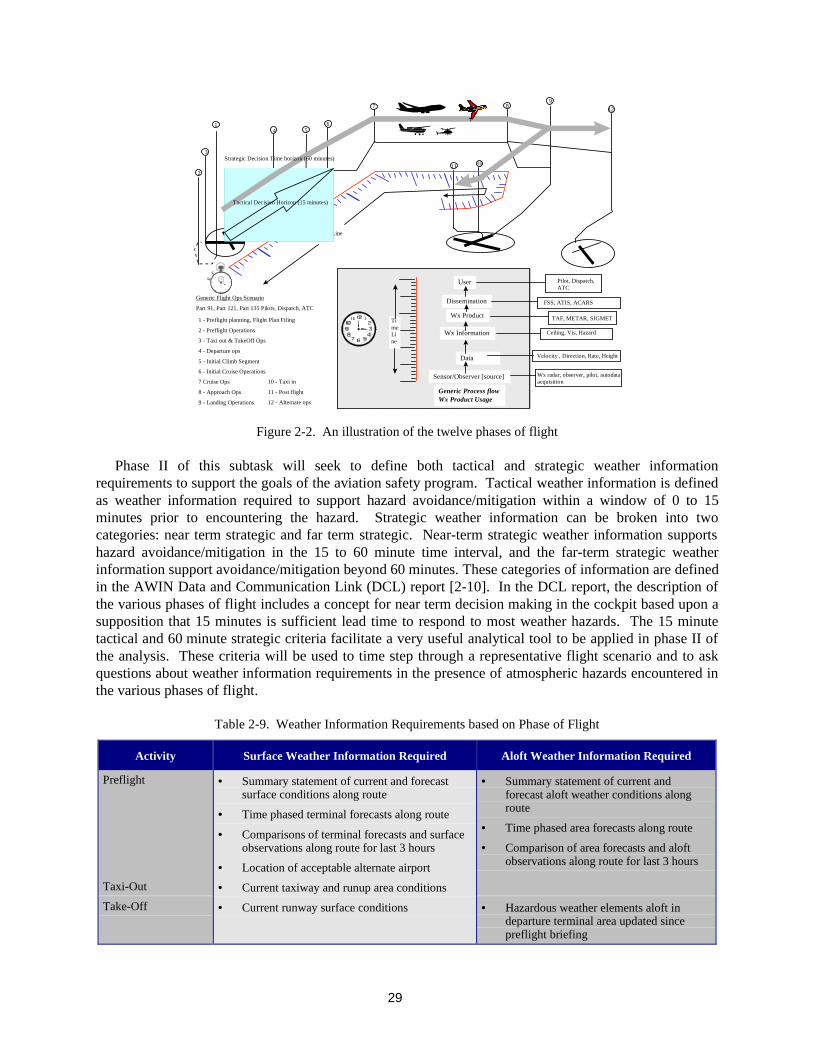
29
1
2
3
4 56
7 89
1011
12
Time Line
Tactical Decision Horizon (15 minutes)
Strategic Decision Time horizon (60 minutes)
Generic Flight Ops Scenario
Part 91, Part 121, Part 135 Pilots, Dispatch, ATC
Sensor/Observer [source]
Data
Wx Information
Wx Product
Dissemination
User
Generic Process flowWx Product Usage
TimeLine
Velocity , Direction, Rate, Height
Wx radar, observer, pilot, autodataacquisition
Pilot, Dispatch,ATC
FSS, ATIS, ACARS
TAF, METAR, SIGMET
Ceiling, Vis, Hazard
1 - Preflight planning, Flight Plan Filing
2 - Preflight Operations
3 - Taxi out & TakeOff Ops
4 - Departure ops
5 - Initial Climb Segment
6 - Initial Cruise Operations
7 Cruise Ops
8 - Approach Ops
9 - Landing Operations
10 - Taxi in
11 - Post flight
12 - Alternate ops
Figure 2-2. An illustration of the twelve phases of flight
Phase II of this subtask will seek to define both tactical and strategic weather informationrequirements to support the goals of the aviation safety program. Tactical weather information is definedas weather information required to support hazard avoidance/mitigation within a window of 0 to 15minutes prior to encountering the hazard. Strategic weather information can be broken into twocategories: near term strategic and far term strategic. Near-term strategic weather information supportshazard avoidance/mitigation in the 15 to 60 minute time interval, and the far-term strategic weatherinformation support avoidance/mitigation beyond 60 minutes. These categories of information are definedin the AWIN Data and Communication Link (DCL) report [2-10]. In the DCL report, the description ofthe various phases of flight includes a concept for near term decision making in the cockpit based upon asupposition that 15 minutes is sufficient lead time to respond to most weather hazards. The 15 minutetactical and 60 minute strategic criteria facilitate a very useful analytical tool to be applied in phase II ofthe analysis. These criteria will be used to time step through a representative flight scenario and to askquestions about weather information requirements in the presence of atmospheric hazards encountered inthe various phases of flight.
Table 2-9. Weather Information Requirements based on Phase of Flight
Activity Surface Weather Information Required Aloft Weather Information Required
Preflight • Summary statement of current and forecastsurface conditions along route
• Time phased terminal forecasts along route
• Comparisons of terminal forecasts and surfaceobservations along route for last 3 hours
• Location of acceptable alternate airport
• Summary statement of current andforecast aloft weather conditions alongroute
• Time phased area forecasts along route
• Comparison of area forecasts and aloftobservations along route for last 3 hours
Taxi-Out • Current taxiway and runup area conditions
Take-Off • Current runway surface conditions • Hazardous weather elements aloft indeparture terminal area updated sincepreflight briefing

30
Activity Surface Weather Information Required Aloft Weather Information Required
Departure • Current surface conditions at departure terminalarea airports
• Hazardous weather elements aloft indeparture terminal area updated sincetake-off
En route • Current and forecast surface conditions atsuitable accessible airports along route,including destination and alternates
• Actual and time-phased forecast aloftconditions along the route with emphasison location and intensity of hazardousweather to be expected
Descent • Current and forecast surface conditions atdestination airport and alternates
• Current and forecast aloft conditions indestination terminal area with emphasis onlocation and intensity of hazardousweather to be expected
Landing • Current runway surface conditions • Current aloft conditions in destinationterminal area with emphasis on location,intensity, and movement of hazardousweather
Taxi-In and Parking • Current taxiway and parking area conditions
Post flight • Current and forecast surface conditions for thestay time
References
2-1. Marshall, R. E., Richards, M. A., and et al., “Advanced Microwave Sensing Technology Study forCivil Aviation Atmospheric Hazards,” Research Triangle Institute, Final Technical Report, NAS1-18925, February 1993.
2-2. Mahapatra, Pravas, “Aviation Weather Surveillance Systems,” The Institution of ElectricalEngineers, Michael Faraday House, United Kingdom, 1999.
2-3. Gleim, I. N., “Aviation Weather and Weather Services,” Gleim Publishing, Inc., March 1998.
2-4. www.landings.com/_landings/pages/fars.html
2-5. www.govcomm.harris.com/environmental/ programs/warp/
2-6. www.comet.ucar.edu/nwplessons/etalesson2/
2-7. maps.fsl.noaa.gov/ruc2.tpb.html
2-8. www.mmm.ucar.edu/mm5/overview.html
2-9. www.emc.ncep.noaa.gov/mmb/wrf/
2-10. Ball, J. W., et al., “Aviation Weather Communication Requirements,” Lockheed MartinAeronautical Systems, Phase I Report for Glenn Research Center, June 1999.
2-11. http://www.arnav.com/prFIS01.htm
2-12. Air Traffic Weather Requirements Report, by the Air Traffic Weather Requirements Team(ATWRT), February 11, 1993.
2-13. Crabill, N. L., and Dash, E. R., “Pilot’s Automated Weather Support System (PAWSS) ConceptsDemonstration Project,” DOT/FAA/RD-91-9.

31
3 Aviation Weather Information Requirements Recommendations
3.1 Task Summary
This section of the report contains recommendations for new or modified aviation weather informationrequirements that have been developed during the second phase of the Aviation Weather RequirementsStudy under the Enhanced Weather Products task. The requirements are derived to meet the statedobjective of increasing flight safety under the auspices of National Aeronautics and Space Administration(NASA’s) Aviation Safety Program. The requirements put forth in this report were developed under astudy performed by the Georgia Tech Research Institute (GTRI), which included the followingcomponents:
(1) An overview of weather phenomena and their impact on aviation;
(2) A grouping of atmospheric phenomena, that may pose a hazard to aviation, into eight categories:weather systems, air motion, precipitation, icing, visibility/ceilings, lightning, volcanic ash, andwake vortices;
(3) An analysis of twelve phases of flight (the analysis identified requirements for weatherinformation content, coverage, and timeliness while addressing the eight categories of weatherphenomena defined in item 2);
(4) An evaluation of the existing weather products and their ability to support each phase of flight;and
(5) A review of National Transportation Safety Board (NTSB) accident data. The NTSB review isrestricted to those accidents where weather was either a cause or factor. The NTSB data wereapplied in identifying deficiencies in the existing weather products. These deficiencies signal theneed for new or modified requirements.
This analysis also included a review of studies performed in the early 1990s that addressed weatherinformation requirements as a function of the phase of flight. The recommendations included in thesestudies, where appropriate, were folded into the requirements developed under this task.
A cooperative decision making relationship must exist between the pilot, air traffic control, and thedispatcher. However, under this study an explicit assignment of common and distinct requirementsbetween the users was not developed. The requirements focus more on the weather information neededduring each phase of flight and the hardware/communication equipment required to disseminate andinterpret the information. It is assumed that the partitioning of the information between pilot, ATC, anddispatcher will be developed at a later date and will require input from all three groups in order to satisfyregulatory, commercial, and personal (pilots versus air traffic control) views of weather information.
The following bullets provide a summary overview of the recommended requirements developedunder this study.
• A requirement for aviation weather products to address the eight categories of weatherphenomena defined in the report (reference Tables 3-2, 3-3, 3-4, 3-5, 3-6, and 3-7)

32
• A requirement for aviation weather products to address hazards in terms of forecastedconditions, current conditions (observations/measurements), intensity, location, extent,movement, and life cycle
• A requirement for aviation weather products to provide both strategic and tactical (forforecasted and current conditions) information as a function of the phase of flight (referenceTables 3-13, 3-14, 3-15, and 3-16)
• A requirement for more accurate, localized descriptions of forecasted and current conditionstailored to the needs of the aviation community
• A requirement for integration/fusion of weather sensors to develop an improved compositeview of the weather conditions in the terminal area
• A requirement to support three-dimensional wind sensing in the terminal area
• A requirement to support detection of wind phenomena that contain low levels of precipitants(e.g., dry microburst and gust fronts)
• A requirement for lower cost systems to support wind sensing in the terminal area; this isintended to increase the number of airports having this capability
• A requirement for wake vortex detection and tracking in the terminal area under all weatherconditions
• A requirement for a sensor system to provide real-time slant range visibility conditions alongthe glide slope
• A requirement for improvements in ceiling and visibility forecast
• A requirement for an automated system allowing a user to enter route and aircraft specificinformation that would then provide the pilot with tailored weather products to aid in preflightplanning
• A requirement for a real-time system providing current information on visual meteorologicalconditions (VMC) and instrument meteorological conditions (IMC) (e.g., cloud ceilings andcoverage) on a finer time and spatial scale than currently exists
• A requirement for an increase in the update rate associated with a number of weather productsused in pre-flight planning
• A requirement for a finer time and spatial spacing between radiosonde measurements
• A requirement for an automated system, requiring little pilot interaction, to deliver updates tothe pilot as weather conditions change
• A requirement for a standardized three dimensional coordinate system (e.g., GPS coordinates)in which to describe a hazard’s position, extent, and movement

33
• A requirement for on-board equipment to interpret position and movement of hazardousconditions (based on a three dimensional coordinate system) in relation to the aircraft’scurrent position and intended route
• A requirement for an autonomous, on-board, expert system providing weather information inthe cockpit in a graphical format; the expert system should be capable of handling andinterpreting large amounts of data and should provide specific options for the pilot based oncurrent and forecasted weather information
• A requirement for on-board sensors to address in-flight icing
• A requirement for on-board sensors to address turbulence
• A requirement for lower cost, on-board weather systems to support the smaller aircraft that fallunder Part 91 operations
• A requirement for a reduction in the number of airports where the pilot is required to relysolely on personal observation or PIREPs to obtain local information
• A requirement for on-board sensors to provide inputs for EPIREPS
• A requirement for a system to sense and report runway surface conditions (e.g., runwaycoefficient of friction) that relate to the pilots ability to stop or main control of the aircraftwhile the aircraft is on the runway
• A requirement for a replacement sensor (due to a loss of the GOES split channel) to detectvolcanic ash
3.2 Introduction
This section of the report contains recommendations for weather information requirements developedunder the second phase of the Aviation Weather Information Requirements Study. These requirementsare designed to support the National Aeronautics and Space Administration’s Aviation Safety Program(AvSP) goal of improving aviation safety by a factor of five in the next ten years. The requirements focuson weather information needs as a function of the category of user and the phase of flight in support ofboth strategic and tactical decisions. The supporting analysis includes a review of weather phenomenaand their impact on aviation, a categorization of atmospheric phenomena based on their impact onaviation, a flight phase analysis of weather information needs, an assessment of existing weatherproducts, and a review of National Transportation Safety Board accident data.
3.3 Fundamentals of Weather Phenomena
This section provides a basic overview of weather phenomena which may pose a threat to aviation.This overview is derived from three excellent references [3-1,3-2,3-3] that address weather’s impact onaviation. In this study, weather information requirements are formulated to address some of thethreatening weather conditions covered in this section.

34
3.3.1 The Atmosphere
The atmosphere nearest the earth is divided into three basic layers: the troposphere, the tropopause,and the stratosphere. The troposphere is the layer that extends between 25,000 to 30,000 feet at the polesand 55,000 to 65,000 feet at the equator. The troposphere is characterized by a general decrease intemperature with increasing altitude and contains the highest concentration of water vapor of the threelayers. The tropopause extends above the troposphere and is characterized by a constant temperatureversus elevation profile. The tropopause serves as a boundary layer trapping most of the moisture in thetroposphere. The stratosphere exists above the tropopause and is characterized by an inversion in thetemperature gradient. Table 3-1 contains minimum and maximum cruise altitudes [3-1] for differenttypes of aircraft. Note that the majority of commercial and general aviation cruise operations take placein the troposphere.
Table 3-1. Approximate Minimum and Maximum Cruise Altitudesfor Some Basic Types of Aircraft
Aircraft TypeCruise Altitude
(minimum/maximum), feet
Propeller-driven 2000 – 15,000
Subsonic airliners and transport aircraft (turbojet and turbofan engines) 20,000 – 40,000
Supersonic transport 60,000 – 70,000
The earth’s atmosphere is a complex system that is composed mostly of oxygen and nitrogen.Temperature around the globe varies as a function of altitude, season, latitude, topography, and time ofday. Heating and cooling of the land and sea has a direct impact on the atmosphere. These changes intemperature directly affect atmospheric pressure. Atmospheric pressure is a measure of the weight of theatmosphere at a given altitude. Temperature and pressure differences are a major source of the complexsystem of winds observed around the globe. Differences in temperature drive circulatory motion (termedconvection) as the warmer air ascends and the cool air descends. Pressure gradients result in movement ofair from high pressure to low pressure. The spherical shape and rotation of the earth also plays a majorrole in the movement of winds as evidenced by the Coriolis forces [3-2]. Topography also plays a majorrole in defining wind patterns. The heating and cooling of mountain surfaces causes temperaturegradients between the air near the surface of the mountain and the surrounding air. The result is a flow ofair along the mountain’s face as the temperature gradients cause warm and cold air to rise and fall. Landand sea interfaces also produce winds due to the fact that the land is warmer than the sea during the dayand the reverse is true during the night. As will be seen, winds have a direct impact on the aerodynamicperformance of an aircraft and can present a lethal hazard to aircraft under certain conditions.
3.3.2 Moisture
Water vapor exists in the atmosphere as a gas. Two terms are often used to characterize water vaporin the atmosphere: relative humidity and dew point. Relative humidity is defined as the ratio of theamount of water vapor currently in the atmosphere to the amount that would present if the atmospherewere saturated. Dew point is the temperature to which the air must be cooled in order for the current levelof water vapor in the air to result in saturation. The current temperature and dew point spread near thesurface of the earth is an indicator of the potential development of fog. Fog tends to result when the dewpoint is less than 3° C.
35
Precipitation requires condensation of water vapor on what are termed condensation nuclei (e.g., smallsolids in the atmosphere). As the water vapor condenses, the nuclei grow, forming liquid or ice particles.In some cases, “super cooled” water droplets may exist between 0° C and –20° C [3-1, page 67]. Thesesuper cooled water droplets are a major contributor to in-flight icing. Sublimation defines the directconversion of water vapor (a gas) to ice (a solid) skipping the water phase entirely. Precipitation resultswhen precipitants (e.g., rain, snow, hail, sleet) are sufficiently heavy that the atmosphere can no longersupport them. It should be noted that the precipitants are not stationary during this growth process.Horizontal and vertical winds carry the precipitants aloft, resulting in additional condensation,evaporation, freezing, and melting as the precipitants grow and shrink in size. Precipitation may occur athigh altitudes but may never be observed on the ground due to evaporation as the precipitants descendthrough the atmosphere (e.g., Virga).
3.3.3 Air Masses
Air masses are often termed stable or unstable. A stable air mass resists upward or downwarddisplacement, whereas an unstable air mass may permit an upward or downward movement of air or both(e.g., a convective process). The structure of clouds may be used by pilots to sense the presence ofcertain atmospheric phenomena. Layered or “stratiform clouds” are indicative of a stable air masswhereas unstable air masses exhibit cumuliform clouds that extend upward due to vertical air movement.The structure of clouds may also be an indicator of the presence of ice crystals, water and super cooledliquids, and convection. Pilots may use the structure of a cloud as an aid in interpreting currentatmospheric conditions in a local area [3-2].
The term “air mass” is used to describe a body of air that exhibits a fairly uniform temperature andmoisture profile. The origins of air masses tend to be stationary or slowing moving air that acquires itsproperties by association with a particular geographic region (e.g., polar regions or tropical oceans).Fronts define the boundaries between differing air masses. A cold front defines the leading edge of anadvancing cold air mass as it overtakes warmer air. At low altitudes, the cold air replaces the warm air.A warm front defines the leading edge of an advancing warm air mass as it moves over the denser coldair. A stationary front is a stalemate between a cold and warm air mass where neither is replacing theother. Air masses may also be influenced by the geographic regions over which they move. A cold airmass moving over a warm region may experience instabilities as the warmer air, near the earth’s surface,rises through the air mass. In addition, air masses may add or loss water vapor to due evaporation orprecipitation as the air mass moves along. The weather associated with a front is a function of themoisture in the atmosphere and the stability or instability of the air mass.
3.3.4 Thunderstorms
As pointed out by a number of authors [3-4,3-5], thunderstorms are a primary source of many of theweather related aviation hazards. Thunderstorm life cycles are characterized by three stages: the cumulusstage, the mature stage, and the dissipating stage. The cumulus stage consists of cumulus clouds that area result of convective processes. The clouds tend to extend less than a few kilometers across and havelarge vertical extents. These clouds may experience stronger convective forces as they pass over warmerregions. The stronger convective forces in combination with the cooler temperatures in the upperatmosphere result in the formation of both updrafts and down drafts that coexist within the cell. Thestorm tops are generally between 25,000 feet and 40,000 feet [3-1] and in extreme cases extend to 65,000feet (above sea level). The storm top may take on a characteristic anvil shape due to the prevailing winds.Single cell thunderstorms are typically several kilometers across and have a life cycle between 20 minutesand 1.5 hours. The updrafts in a storm cell may reach 25 m/s at heights of 25,000 feet [3-1]. Storm cells

36
may also move at speeds up to 50–70 m/s in the upper atmosphere. Super cells are a class of severethunderstorms that exhibit giant hail, strong surface winds, and strong updrafts and down drafts. Supercells are also known to spawn tornadoes. Super cells may exist up to 6 hours. A squall line is a lineararrangement of single storm cells that extend over hundreds of kilometers. Squall lines are associatedwith violent rain, hail, and strong winds.
All thunderstorms contain moderate turbulence and may also be the source of severe/extremeturbulence in a number of cases. Thunderstorms may also produce mesocyclones which exhibit a circularrotation over a large area. The rotation generally has little impact on aviation since the variation in windspeed changes slowly over a large region; however, mesocyclones are known to produce tornadoes.Tornadoes have an average diameter of 100 meters and typically travel less than 2 kilometers [3-1].Maximum wind speeds can reach 110–125 m/s in extreme cases [3-1]. Large amounts of rain are alsoassociated with thunderstorms. The amount of precipitation varies with altitude with the heaviestamounts of precipitation found in the higher altitudes. Hail is also associated with most thunderstormssince the cells generally extend above the freezing level. Hail size varies between less than 5 millimeters(shot size hail) to greater than 60 millimeters (tennis ball size hail). Hail is generally localized in what aretermed hail shafts that may appear offset from the storm cell. The typical cross section of a hail shafthas an area of approximately 1 km2. Hail is most often encountered at altitudes between 10,000 and25,000 feet [3-1]. Hail stones have been found to be carried by updrafts and cross winds for distances upto 20 kilometers from the center of the storm cell. Thunderstorms are also known to harbor supercoldliquids which support icing conditions. In addition, thunderstorms produce electrical discharges knownas lightning that are hazardous to aviation. Cloud to cloud and cloud to ground lightning strikes are goodindicators of convective activity.
3.3.5 Gust Fronts
Gust fronts are thunderstorm related phenomena that are particularly hazardous to aircraft at lowaltitudes. Gust fronts are the leading edge of a divergent outflow near the earth’s surface that is generatedby strong down drafts within a thunderstorm. The cold denser air moves out away from the thunderstormcausing the surrounding warm air to rise above it. Gust fronts may move at speeds up to 25 m/s [3-1].Large velocity gradients are observed as the airspeed changes by tens of meters/sec over relatively shortdistances. High levels of turbulence also exist behind the gust front. Gust fronts are known to propagatesignificant distances. In some cases, gust fronts may be found several tens of kilometers away from theparent thunderstorm. One problem in detecting gust fronts is the fact that they may be characterized as“dry” or containing little precipitant. The low precipitant levels correspond to low reflective properties inthe case of remote sensing.
3.3.6 Downbursts
Downbursts are strong downdrafts which cause a divergent flow of wind in all directions. Thediverging winds represent a velocity gradient which may be hazardous to aircraft at low altitudes.Macrobursts are defined as downbursts whose maximum radial components of wind velocity are spacedby more than 4 kilometers. Microbursts exhibit a separation, between radial wind velocity maxima, thatis less than 4 kilometers and exhibit a differential radial velocity maxima that exceeds 10 m/s. Radialwind components in a microburst may exceed 75 m/s. The maximum wind speeds tend to occur at thelowest altitudes (< 100 feet above ground level (AGL)). This low altitude wind shear is hazardous toaircraft during take-off and landing. Microbursts can be characterized as either wet or dry dependingupon the amount of precipitation they contain. For microbursts, the dimensions of the downburst are, onaverage, approximately 1 km across at the outflow. The outflow tends to start less than 1 km above the

37
ground. Studies have shown that average lifetime for a microburst is approximately 13 minutes withmaximum wind speeds lasting 2 to 5 minutes [3-1]. The short life cycle, small dimension, low altitude,and potentially low reflective properties of the microburst combine to make it a difficult condition topredict and detect.
3.3.7 Wind
Wind motion may be characterized in a number of different ways. However, two terms are often usedto describe wind motion that may be hazardous to aircraft: turbulence and wind shear. Turbulent airmotion (i.e., turbulence) is characterized by variations in wind speed over small spatial extents (i.e.,random motion). The term wind shear describes a more systematic variation of wind speed and directionin both spatial and temporal domains. Turbulence tends to excite the dynamics of the aircraft body,resulting in oscillations in the aircraft, which may induce a loss in performance and a bumpy andpotentially hazardous ride for passengers. An example of wind shear is a variation in wind speed versusaltitude. On landing, if the aircraft experiences head winds which then transition to strong tail winds asthe aircraft descends through a shear layer, the aircraft may experience a loss in altitude and deviationfrom the intended flight path. Turbulence is associated with a number of atmospheric events includingthunderstorms, mountain waves, wind shear layers (or boundaries), convection, and topographic featuresaffecting wind flow. Clear air turbulence (CAT) is a term used to describe turbulence that is notassociated with clouds or thunderstorms and generally takes place above 15,000 feet. Efforts are underway, under the FAA sponsored Product Development Teams and the Aviation Safety Program, to developsensor systems that may aid in the detection of CAT, but none are fielded at this time. Meteorologists dohave the ability to forecast turbulence, but the forecasts tend to be issued for a generally large area eventhough the turbulence may only be present in a smaller sub-region of the forecasted area. Turbulence ischaracterized as either light, moderate, severe, or extreme. These categories of turbulence can be relatedto the vertical acceleration experienced by the aircraft [3-1]. Aircraft should avoid areas of severe orextreme turbulence. Wind gusts are also a hazard to aircraft during landing and take-off and arecharacterized by a transitory burst of wind.
3.3.8 Icing
Icing is a major threat to aviation in that icing increases drag, reduces thrust, reduces lift, and increasesthe weight of the aircraft. Icing is also known to clog carburetors and Pitot tubes. All clouds above thefreezing level have the potential to exhibit icing conditions. Icing tends to occur more often in thepresence of supercooled water droplets. As an aircraft moves through the supercooled liquids, the waterdroplets impact the wings of the aircraft and freeze almost instantaneously. Icing is also an issue in theterminal area since icing may occur while an aircraft is waiting for taxi and take-off [3-1].
3.4 Categories of Weather Hazards
Weather, as described in the previous section, is a complex system driven by winds, temperature,pressure, and moisture. To try and enumerate or describe all of the atmospheric conditions that couldeventually lead to a hazardous condition impacting flight safety is a monumental task. However,atmospheric events can be placed into categories based on their impact on aviation. This approachpermits one to compartmentalize atmospheric events in a way that an analysis of weather informationrequirements may be handled within the scope of this task.
In this study, GTRI has grouped weather phenomena into eight categories that may contribute to orare, in themselves, hazardous conditions impacting flight safety. These categories are similar to the five

38
categories proposed by Mahapatra [3-1]. Mahapatra groups weather phenomena into the followingcategories: (1) “phenomena involving the physical motion of air,” (2) “hydrometeorological phenomena,”(3) “phenomena inducing and facilitating ice formation on aircraft surfaces,” (4) “phenomena causing lowvisibility,” and (5) “phenomena involving atmospheric electricity.” The eight categories of weatherapplied in this analysis are: weather systems, air motion, icing, visibility/ceiling, precipitation, volcanicash, wake vortices, and lightning. These categories include the service areas identified in the NationalAviation Weather Initiatives report prepared by the Joint Action Group for Aviation Weather [3-6].
Since air masses and convective systems are the source of many of the atmospheric hazards, acategory, entitled “Weather Systems,” is defined. Table 3-2 contains a listing of some of the types ofsystems include in this category. Weather products that address these systems need to includeinformation about their location, intensity, extent, movement, and life cycle. Specific atmosphericphenomena/conditions that are a product of these weather systems will be included in separate categoriesbased on their impact on aviation.
Table 3-2. A Listing of Some the Weather Phenomena Containedin the Category “Weather Systems”
Weather Systems
Thunderstorms
Single Cells
Super Cells
Squall Lines
Mesoclyclones
Tornadoes
Hurricanes
Pressure Systems
Warm and Cold Fronts
As noted in the previous section, air motion has a significant impact on aviation safety. Table 3-3contains a listing of the significant atmospheric phenomena that are included in the category “air motion.”This category is divided into two sub-categories: flight level phenomena and terminal area phenomena(including take-off and landing). The phenomena contained in the two sub-categories are not exclusive,but a distinction is made in order to address the differing requirements for the terminal and en routephases of flight.
In the terminal area, microbursts and gust fronts are significant hazards at low altitudes. At flightlevel, clear air turbulence (CAT) is a significant hazard. Currently, the are no fielded systems to detectthe presence of CAT with sufficient time for the pilot to react. Requirements developed in the latersections will focus on a number of the air motion related hazards.
Since precipitation may impact aircraft performance in a number of different ways, precipitation isassigned a separate weather hazard category. Table 3-4 contains a list of some of the types of precipitationincluded in this category. Precipitation may impact visibility, but it may also result in other hazardousconditions that impact flight safety. For example, hail is a real threat to aircraft due to the high speeds atwhich hail impacts the surface of the aircraft during flight.
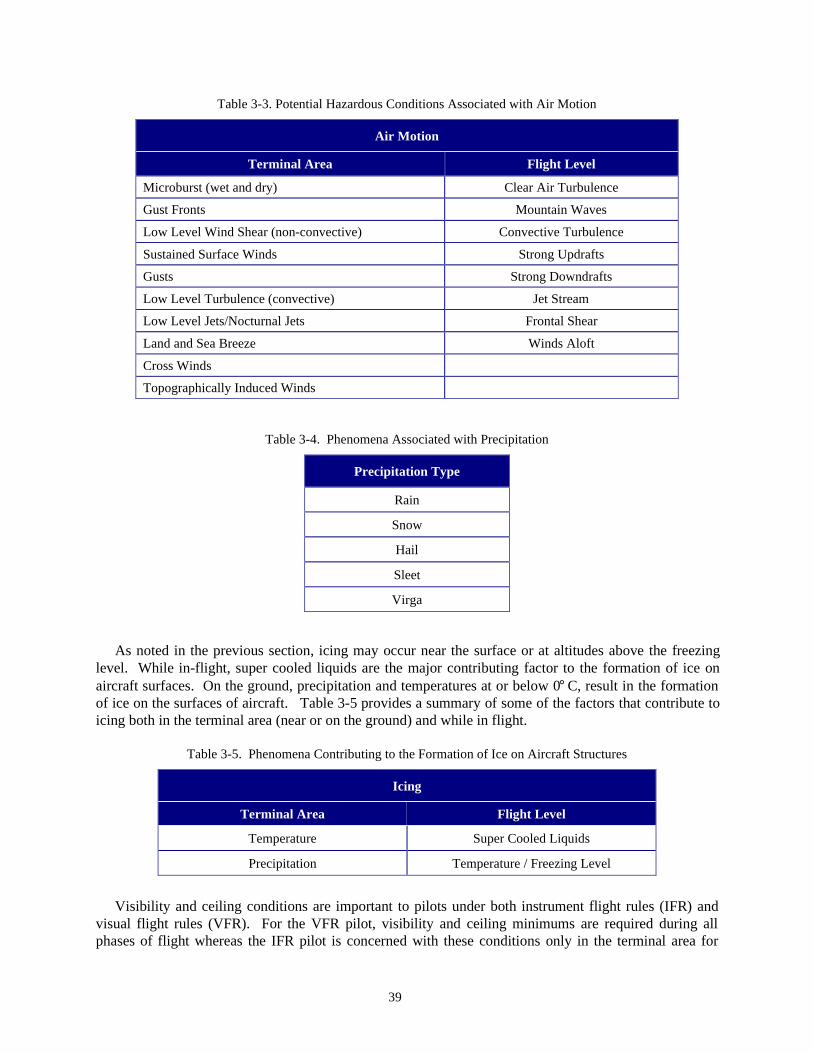
39
Table 3-3. Potential Hazardous Conditions Associated with Air Motion
Air Motion
Terminal Area Flight Level
Microburst (wet and dry) Clear Air Turbulence
Gust Fronts Mountain Waves
Low Level Wind Shear (non-convective) Convective Turbulence
Sustained Surface Winds Strong Updrafts
Gusts Strong Downdrafts
Low Level Turbulence (convective) Jet Stream
Low Level Jets/Nocturnal Jets Frontal Shear
Land and Sea Breeze Winds Aloft
Cross Winds
Topographically Induced Winds
Table 3-4. Phenomena Associated with Precipitation
Precipitation Type
Rain
Snow
Hail
Sleet
Virga
As noted in the previous section, icing may occur near the surface or at altitudes above the freezinglevel. While in-flight, super cooled liquids are the major contributing factor to the formation of ice onaircraft surfaces. On the ground, precipitation and temperatures at or below 0°
C, result in the formationof ice on the surfaces of aircraft. Table 3-5 provides a summary of some of the factors that contribute toicing both in the terminal area (near or on the ground) and while in flight.
Table 3-5. Phenomena Contributing to the Formation of Ice on Aircraft Structures
Icing
Terminal Area Flight Level
Temperature Super Cooled Liquids
Precipitation Temperature / Freezing Level
Visibility and ceiling conditions are important to pilots under both instrument flight rules (IFR) andvisual flight rules (VFR). For the VFR pilot, visibility and ceiling minimums are required during allphases of flight whereas the IFR pilot is concerned with these conditions only in the terminal area for

40
take-off and landing. Table 3-6 contains a list of some of the atmospheric conditions that impact visibilityand ceiling.
Table 3-6. Phenomena Contributing to Hazardous Visibility and Ceiling Conditions
Visibility/Ceilings
Terminal Area Flight Level
Low Level Clouds Cloud Ceilings
Fog Cloud Cover
Rain Rain
Snow Snow
Dust/Sand Storms
Smoke/Pollution
Runway Visual Range Conditions
Three other categories (Table 3-7) have been defined in this analysis: lightning, volcanic ash, andwake vortices. Lightning is an electrical discharge that is generally associated with thunderstorms. Themetal surface of the aircraft serves as a conductor, which permits electrical currents to damage sensitiveaircraft components. Volcanic ash is the result of volcanic eruptions which spew large amounts of glassand acidic compounds into the atmosphere. Wake vortices are “horizontal tornadoes” induced by airflowalong the tips of the aircraft wings during take-off and landing. Smaller aircraft are at a particular risk tothe effects of wake vortices.
Table 3-7. Additional Categories of Weather Phenomena Impacting Aviation Safety
Additional Categories
Lightning
Volcanic Ash
Wake Vortices
These eight categories of weather phenomena will be used in the following sections to defineinformation requirements for each phase of flight.
3.5 VFR and IFR Flight
Aircraft may operate under one of two sets of flight rules: visual flight rules and instrument flightrules. Under visual flight rules, the pilot is required to maintain minimum flight visibility conditions andminimum distances from clouds during all phases of flight. These minimums are given in Section 91.155of the Federal Aviation Regulations (FAR) and are provided in Table 3-8 as a reference. Therequirements are defined in terms of the airspace in which the aircraft is operating. All flights under VFRconditions must occur below 18,000 feet. For the VFR pilot, ceiling and visibility information plays amajor role in his ability to remain VFR and to perform safe flight operations during all phases of flight.

41
Instrument flight rules permit en route operations in instrument meteorological conditions (IMC).During the approach phase of flight, a pre-defined altitude is reached at which the pilot must be able tomake visual contact with the runway or abort the approach. For precision approaches, the minimumaltitude is referred to as the decision height (DH), and for non-precision approaches, the minimumaltitude is referred to as the minimum descent altitude (MDA). At the decision height, the pilot must beable to see the runway environment. The measure of visibility along the runway is termed the “runwayvisual range” (RVR). Table 3-9 contains decision heights and RVR requirements for different categoriesof landing. Weather products, tailored to inform the pilot of visibility conditions before reaching the DH,aid in reducing the number of missed approaches which may jeopardize the safety of the air space.
Table 3-8. FAR VFR Requirements for Visibility and Distance from Clouds
Airspace Flight Visibility Distance from Clouds
Class B 3 statute miles Clear of clouds
Class C 3 statute miles 500 feet below1,000 feet above2,000 feet horizontal
Class D 3 statute miles 500 feet below1,000 feet above2,000 feet horizontal
Class E (< 10,000 ft. mean sealevel (MSL))
3 statute miles 500 feet below1,000 feet above2,000 feet horizontal
Class E (> 10,000 ft. MSL) 5 statute miles 1,000 feet below1,000 feet above1 statute mile horizontal
Table 3-9. Decision Heights and RVR Requirements for IFR Flight
Landing TypeDecision Height, feet
(not less than)Runway Visual Range, meters
(not less than)
CAT I 200 550
CAT II 100 350
CAT IIIA (‘see to land’) 100 200
CAT IIIB (‘see to taxi’) 50 50
CAT IIIC (‘zero visibility’)
3.6 Weather Product Requirements as a Function of Phase of Flight
A number of studies [3-8, 3-9, 3-10] were performed during the early 1990s that specified weatherinformation requirements for each phase of flight. This study seeks to consolidate those requirements andexpand upon them to reach the goals set forth by the AvSP of improving aviation safety. In reviewingand assessing the weather information needs of the aviation community, it was seen that the differentFAR categories (e.g., Parts 121, 135, and 91) all require similar weather information to perform safeflight. However, a difference in weather information requirements does exist between VFR and IFRoperations. These differences will be expanded upon as weather information requirements are developed

42
in the following sections. The term “requirements” in this study should be viewed from the standpoint ofmeeting the AvSP goal of improving flight safety and should not be viewed as a FAR or regulatoryrequirement. When this study refers to existing FAR requirements, the term “FAR” will be included inthe text.
The effect of weather on an aircraft is a function of the type of aircraft, its equipment, and thecapabilities of the pilot. The minimum equipage requirements for an aircraft are defined by the FARcategories of operation. An example of a piece of equipment that is required to support operation ininclement weather is the airborne weather radar. This radar is required for Part 121 operators but is notrequired for Part 91 operators. However, both the Part 91 and Part 121 aircraft need to be aware of thepresence of hazardous weather conditions while in flight. The differences in the requirements are afunction of the relationship between the operator and his passengers and cargo. Part 121 operators arecarrying passengers for hire and many lives are at stake. In contrast, Part 91 operators are not for hire andcarry few passengers. The following analysis does not address weather information requirements from aregulatory (FAR) standpoint. If safety is to be improved, specific pieces of weather information areneeded by all operators. Whether this information will be required from a regulatory standpoint is anissue to be resolved after the needed improvements have been identified.
In the most general sense, the term “weather product” may contain weather information at differentstages of processing/interpretation: raw, measured data (e.g., temperature), processed data (e.g., amicroburst hazard alert obtained from processing range gated velocity profiles), and forecast data (e.g.,winds aloft forecast). The term “weather product” may also encompass the sensor, the processor, themeteorologist/forecaster/observer, and/or the delivery system (communication/data link). Aviationweather products are, in general, tailored to convey information about events within a defined region ofspace. Aviation weather products also have a temporal factor associated with them that denotes current orforecast conditions and an interval of time over which the weather product is valid. The weatherinformation requirements defined in this study focus on weather information content (e.g., temperature,dewpoint, and microburst conditions), spatial coverage (e.g., en route and terminal area), and timeliness(i.e., supporting tactical versus strategic decisions). The data and communication requirements needed tosupport new weather products are addressed in a separate effort and documented in reference [3-7].
Figure 3-1 illustrates the 12 phases of flight as defined in the Crabill [3-8] report. The 12 phases offlight begin with preflight planning and flight plan filing at the departure airport and end with post flightoperations at the destination airport. The time an aircraft spends in each phase of flight is a function ofthe flight plan (route and purpose of flight). Also, in some cases, there may not be a clear boundarybetween when an aircraft transitions from one phase of flight to the next. The altitude at which thedifferent phases of flight are performed is a function of the aircraft’s and pilot’s certification and theflight plan. The 12th phase of flight is included to illustrate the fact that certain conditions may requirethat an alternative airport be used for landing. In general, phases VIII–XI would need to be repeatedwhen diverting to an alternative airport. In this analysis, the first 11 phases of flight are grouped in threemajor segments: departure (D), en route (E), and arrival (A). These segments are denoted in Figure 3-1.The departure segment includes preflight planning and operations, taxi and take-off operations, anddeparture operations (phases I-IV). The departure segment should not be confused with the fourth phaseof flight termed “departure operations.” The en route segment includes climb and cruise operations(phases V-VII), and the arrival segment includes approach, landing, and taxi in operations (phases VIII-XI).

43
1 2
3
4
7
9
1011
12
TOWER
TOWER
TOWER
5
8
DepartureSegment
En-RouteSegment
ArrivalSegment
6
Phases of Flight
1. Preflight Planning; Flight Plan Filing 7. Cruise Operations
2. Preflight Operations 8. Approach Operations
3. Taxi Out and Take Off Operations 9. Landing Operations
4. Departure Operations 10. Taxi In and Parking Operations
5. Initial Climb Segment Operations 11. Post Flight Operations
6. Initial Cruise Operations 12. Alternate Operations (if required)
Figure 3-1. The 12 phases of flight applied in defining weather information requirements
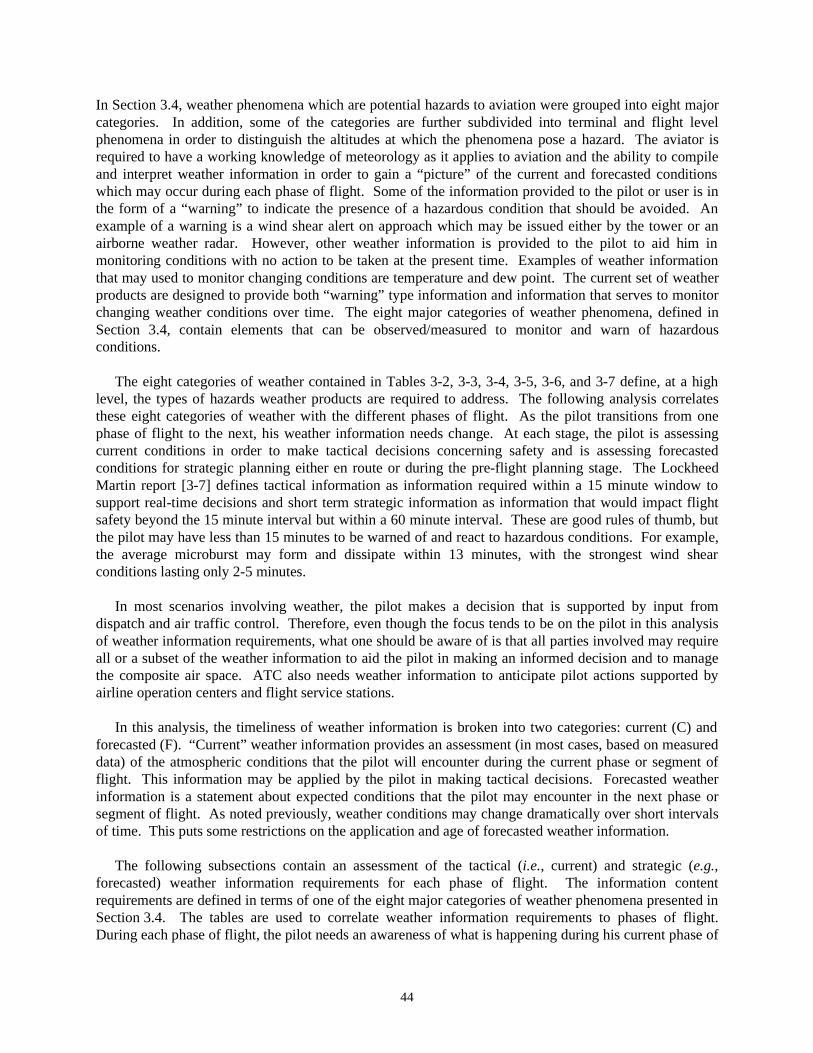
44
In Section 3.4, weather phenomena which are potential hazards to aviation were grouped into eight majorcategories. In addition, some of the categories are further subdivided into terminal and flight levelphenomena in order to distinguish the altitudes at which the phenomena pose a hazard. The aviator isrequired to have a working knowledge of meteorology as it applies to aviation and the ability to compileand interpret weather information in order to gain a “picture” of the current and forecasted conditionswhich may occur during each phase of flight. Some of the information provided to the pilot or user is inthe form of a “warning” to indicate the presence of a hazardous condition that should be avoided. Anexample of a warning is a wind shear alert on approach which may be issued either by the tower or anairborne weather radar. However, other weather information is provided to the pilot to aid him inmonitoring conditions with no action to be taken at the present time. Examples of weather informationthat may used to monitor changing conditions are temperature and dew point. The current set of weatherproducts are designed to provide both “warning” type information and information that serves to monitorchanging weather conditions over time. The eight major categories of weather phenomena, defined inSection 3.4, contain elements that can be observed/measured to monitor and warn of hazardousconditions.
The eight categories of weather contained in Tables 3-2, 3-3, 3-4, 3-5, 3-6, and 3-7 define, at a highlevel, the types of hazards weather products are required to address. The following analysis correlatesthese eight categories of weather with the different phases of flight. As the pilot transitions from onephase of flight to the next, his weather information needs change. At each stage, the pilot is assessingcurrent conditions in order to make tactical decisions concerning safety and is assessing forecastedconditions for strategic planning either en route or during the pre-flight planning stage. The LockheedMartin report [3-7] defines tactical information as information required within a 15 minute window tosupport real-time decisions and short term strategic information as information that would impact flightsafety beyond the 15 minute interval but within a 60 minute interval. These are good rules of thumb, butthe pilot may have less than 15 minutes to be warned of and react to hazardous conditions. For example,the average microburst may form and dissipate within 13 minutes, with the strongest wind shearconditions lasting only 2-5 minutes.
In most scenarios involving weather, the pilot makes a decision that is supported by input fromdispatch and air traffic control. Therefore, even though the focus tends to be on the pilot in this analysisof weather information requirements, what one should be aware of is that all parties involved may requireall or a subset of the weather information to aid the pilot in making an informed decision and to managethe composite air space. ATC also needs weather information to anticipate pilot actions supported byairline operation centers and flight service stations.
In this analysis, the timeliness of weather information is broken into two categories: current (C) andforecasted (F). “Current” weather information provides an assessment (in most cases, based on measureddata) of the atmospheric conditions that the pilot will encounter during the current phase or segment offlight. This information may be applied by the pilot in making tactical decisions. Forecasted weatherinformation is a statement about expected conditions that the pilot may encounter in the next phase orsegment of flight. As noted previously, weather conditions may change dramatically over short intervalsof time. This puts some restrictions on the application and age of forecasted weather information.
The following subsections contain an assessment of the tactical (i.e., current) and strategic (e.g.,forecasted) weather information requirements for each phase of flight. The information contentrequirements are defined in terms of one of the eight major categories of weather phenomena presented inSection 3.4. The tables are used to correlate weather information requirements to phases of flight.During each phase of flight, the pilot needs an awareness of what is happening during his current phase of

45
flight and what may occur during the next phase or segment of flight. The tables define weatherinformation requirements as current or forecasted and identify which segment of flight (departure, enroute, or arrival) the weather information should address. The tables also contain an additional rowlabeled “alternate.” This row is used to indicate when current or forecasted information is required for thealternate airport. The following sections step through each phase of flight commenting on weatherinformation requirements for that phase of flight.
3.6.1 Preflight Planning and Flight Plan Filing
Preflight planning involves an assessment of current and forecasted conditions at the departure anddestination airports and along the intended route. This assessment is initially performed to determine ifthe trip is feasible. The assessment is made by first examining the weather’s history over the areaencompassing the intended flight. Crabill’s study [3-8] states that an assessment of significant weatherfor the past 3 hours is needed over an area encompassing 150 nautical miles on either side of the route.This assessment should be validated by comparing forecasted information with observed weather reportsto identify discrepancies in the forecasted data. This is intended to provide some level of confidence orvalidity to the forecast data which will be used during the planning stages. Table 3-10 contains therequired weather information by flight segment (D,E,A) for the planning phase. Note that both current(C) and forecasted (F) information is required for each segment of flight. The only category ofinformation that is not required during this phase of flight is wake vortex information. Wake vortexinformation is required in real-time during the taxi and take-off phases and the landing phase. Forecastedceiling and visibility (C&V) conditions should be collected for the departure airport, along the route, andfor the destination and alternate airports. In order to account for conditions below minimum at thedestination airport, Crabill [3-8] states that the C&V forecast should be obtained for the estimated time ofarrival (ETA) plus one hour. The C&V conditions should also be estimated at the alternate airport takinginto account this one hour delay.
Table 3-10. Weather Information Required During the Planning,Preflight, and Taxi and Take-Off Phases of Flight
F C F C F C F C F C F C F C F C F CWeather Systems x x x x x x x xAir Motion
Flight Level x x x x x xTerminal x x x x x x x x x
Precipitation x x x x x x x x xIcing
Flight Level x x x x x xTerminal x x x x x x x x x
VisibilityFlight Level x x x x x xTerminal x x x x x x x x x
Lightning x x x x x x x xVolcanic Ash x x x x x x x x xWake Vortices xAlternate
Route x x x x x xTerminal x x x x x x
D = Departure Segment, E = Enroute Segment, A = Arrival Segment, F = Forecasted, C = Current
AE A D ED E A DPlanning Preflight Ops Taxi and Take-off

46
Flight planning involves assessing the impact of current and forecasted weather conditions on thedifferent aspects of flight. Table 3-11 contains a number of the aspects of flight planning that must beassessed in terms of the available weather information [3-8].
Table 3-11. Flight Plan Components that May be Impacted by Weather
Flight Plan Considerations
VMC/IMC Ground Speeds
Departure Time Trip Time
Take-off and Climb Performance Fuel Burn
Route Arrival Time at Destination
Altitudes Daylight/Darkness
Airspeeds Alternate Conditions
3.6.2 Preflight Operations
Preflight operations require a check-out of equipment for proper operation. Past, current, andforecasted weather information [3-8] is required to assess the need for de-icing and engine and carburetorheating. Preflight operation is also a time for validating weather information collected during theplanning phase for the departure area. Personal observation of prevailing conditions (e.g., ceiling,visibility, and winds) is the method most often applied. Prevailing conditions may require the pilot torevisit the flight plan. The focus is on conditions at the departure airport at the estimated time ofdeparture (ETD). Table 3-10 contains the categories of weather information required during this phase ofoperation. The focus is on the current and forecasted conditions in the terminal area. In this analysis, theterminal area is included in the departure segment of flight.
3.6.3 Taxi and Take-Off
During taxi and take-off, the focus is on tactical information required to execute a taxi-out onto therunway and a take-off operation. Low altitude air motion information is critical in this phase of flight.Types of low altitude air motion include: microburst, non-convective wind shear, gust fronts, wind gust,surface winds, and turbulence. Section 3.3 provides an explanation of these low-level phenomena.Additional types of low altitude air motion are included in Table 3-3. Icing and visibility conditions arealso tactical considerations. Of additional concern during this phase of flight is the presence of wakevortices produced by arriving and departing aircraft.
3.6.4 Departure, Initial Climb, and Initial Cruise
The departure phase is the last phase in the departure segment. During this phase the pilot needstactical (i.e., current) weather information associated with this phase of flight. The pilot is also starting tofocus on weather information that he will need to make strategic decisions during the en route segment offlight. During the initial climb and initial cruise phases of flight, the pilot’s weather informationrequirements are focused on the en route segment of flight from both a tactical and strategic decisionperspective. In all three phases of flight, the required weather information transitions from informationabout conditions near the surface to flight level condition information. During these phases of flight,weather information and aircraft performance are assessed to determine if the flight plan needs to beupdated to account for current and forecasted conditions. Table 3-12 contains a listing of the weatherinformation required for each phase of flight.
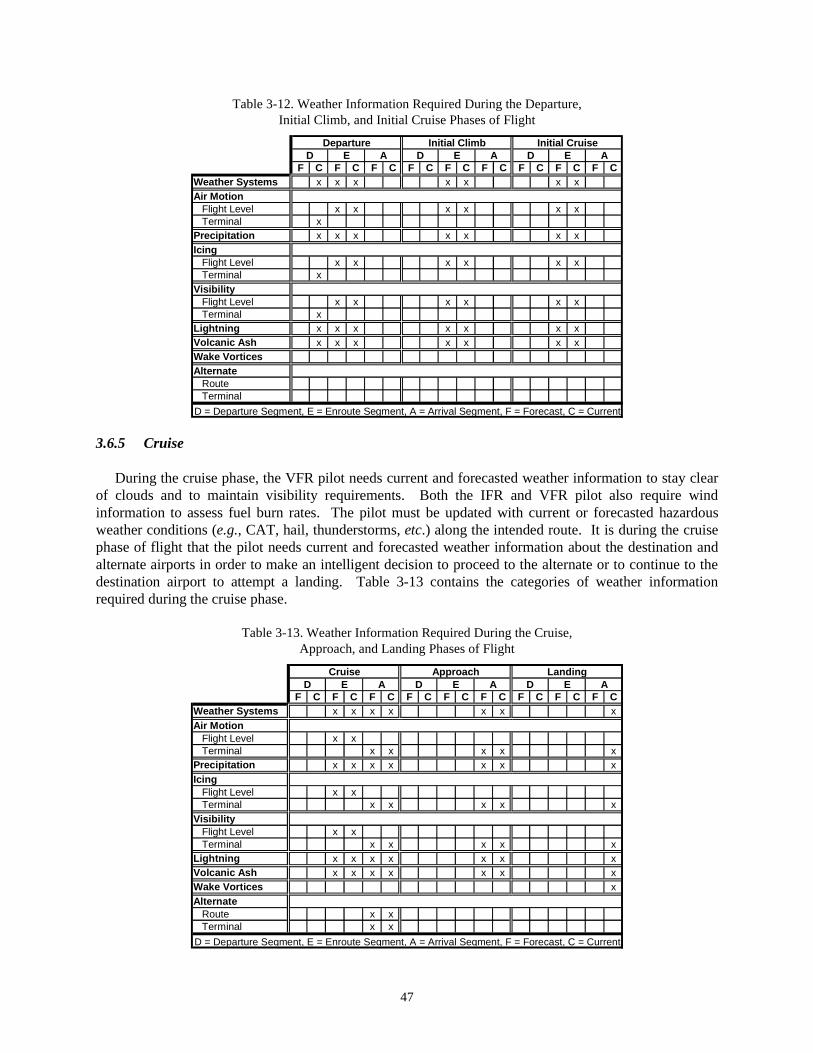
47
Table 3-12. Weather Information Required During the Departure,Initial Climb, and Initial Cruise Phases of Flight
F C F C F C F C F C F C F C F C F CWeather Systems x x x x x x xAir Motion
Flight Level x x x x x xTerminal x
Precipitation x x x x x x xIcing
Flight Level x x x x x xTerminal x
VisibilityFlight Level x x x x x xTerminal x
Lightning x x x x x x xVolcanic Ash x x x x x x xWake VorticesAlternate
RouteTerminal
D = Departure Segment, E = Enroute Segment, A = Arrival Segment, F = Forecast, C = Current
AE A D ED E A DDeparture Initial Climb Initial Cruise
3.6.5 Cruise
During the cruise phase, the VFR pilot needs current and forecasted weather information to stay clearof clouds and to maintain visibility requirements. Both the IFR and VFR pilot also require windinformation to assess fuel burn rates. The pilot must be updated with current or forecasted hazardousweather conditions (e.g., CAT, hail, thunderstorms, etc.) along the intended route. It is during the cruisephase of flight that the pilot needs current and forecasted weather information about the destination andalternate airports in order to make an intelligent decision to proceed to the alternate or to continue to thedestination airport to attempt a landing. Table 3-13 contains the categories of weather informationrequired during the cruise phase.
Table 3-13. Weather Information Required During the Cruise,Approach, and Landing Phases of Flight
F C F C F C F C F C F C F C F C F CWeather Systems x x x x x x xAir Motion
Flight Level x xTerminal x x x x x
Precipitation x x x x x x xIcing
Flight Level x xTerminal x x x x x
VisibilityFlight Level x xTerminal x x x x x
Lightning x x x x x x xVolcanic Ash x x x x x x xWake Vortices xAlternate
Route x xTerminal x x
D = Departure Segment, E = Enroute Segment, A = Arrival Segment, F = Forecast, C = Current
DCruise Approach Landing
AE A D ED E A

48
3.6.6 Approach
The approach phase represents the transition phase between the cruise and landing phases. Thecurrent conditions during the final portion of the cruise phase and the current and forecasted conditionsfor the arrival segment are required by the pilot. During the approach phase, the pilot is correlatingcurrent weather conditions with those forecasted for the destination airport. At this point in the flight, thepilot’s options continue to narrow as the aircraft transitions into a more confined air space and a loweraltitude. The aircraft may be placed in a holding pattern prior to starting the approach if conditions arebelow minimums or hazardous weather conditions exist. A possible holding pattern and unexpectedwinds experienced during flight may result in an in-flight emergency as a result of fuel starvation. Table 3-13 contains the categories of weather information required during the approach phase.
3.6.7 Landing
During the landing phase, VFR pilots must achieve minimum visibility and ceilings conditions with anuncompromised visual reference of the runway. For the IFR pilot, the approach end of the runway mustbe visible at the decision height (DH) for precision approaches and at the MDA for non-precisionapproaches. In addition, runway visual ranges (RVR) must be met by IFR pilots for the different IFRlanding categories (CAT I, II, and III). At the altitudes associated with landing, low level wind and windshear information is critical in making a safe landing. The focus of the weather information during thelanding phase is on the current weather conditions (i.e., tactical information). As in the take-off phase,information on wake vortex movement and strengths becomes a critical piece of information in an airportenvironment supporting all aircraft types. In addition, both precipitation and icing change the coefficientof friction of the runway which may impact the aircraft’s ability to decelerate or to maintain position inthe desired direction along the runway. Table 3-13 contains the categories of weather informationrequired during the landing phase.
3.6.8 Taxi In and Post Flight Operations
During taxi in operations, the pilot needs to be aware of taxi way and ramp conditions. Winds, surfaceconditions (e.g., snow on the ground), visibility, and other hazardous conditions may impact the aircraftas it moves from the runway to the ramp. Post flight operations should be supported by forecastinformation covering the remainder of the time the aircraft is in the terminal area. This weatherinformation will be used by the pilot to assess actions to be taken before continuing flight or to be takenin securing the aircraft. The weather information required during these two phases of flight is given inTable 3-14.
3.7 Existing Weather Products
The current system of aviation weather products is designed in such a way that individual weatherproducts are tailored to address specific hazards or to monitor specific atmospheric conditions. Aviationweather products are also tailored to address current and forecasted conditions and to address weatherconditions in the terminal area and along specific air routes. Specific weather products are designed toalert pilots in real-time of changing conditions that are deemed hazardous to aviation. A number of thecurrent weather products are described in Appendix G.
Table 3-15 contains a listing of weather products that are directed at current and forecasted conditionsalong specific air routes and at specific airports. The aviation routine weather report (METAR) describescurrent conditions at an airport and is updated on an hourly basis. A non-routine aviation weather report(SPECI) may be issued between METAR reports if changing conditions warrant. The terminal

49
aerodrome forecast (TAF) is a forecast issued by the NWS WFO about conditions within a five mileradius of the terminal area. This forecast is issued every six hours or as changing conditions warrant. Itshould be noted that a METAR and TAF may not be available for every airport. Some 300 routes aresupported by route forecasts which are issued by the NWS WFO. A route forecast is issued every 8 hoursand describes expected conditions within a corridor 50 miles wide along the specified route. Theseproducts are available to the pilot en route (via voice or digitally) for use in making both strategic andtactical decisions. However, their application depends greatly on the time of issuance. These productsmay also be used in the flight planning phases. The aviation forecast (FA) is a more widespread forecast(generally addressing expected conditions over an area the size of several states) which is updated on aneight hour basis or as conditions warrant. The FA describes visual meteorological and general weatherconditions.
Table 3-14. Weather Information Required During the Taxi Inand Post Flight Phases of Flight
F C F C F C F C F C F CWeather Systems x xAir Motion
Flight LevelTerminal x x
Precipitation x xIcing
Flight LevelTerminal x
VisibilityFlight LevelTerminal x
LightningVolcanic AshWake VorticesAlternate
RouteTerminal
D = Departure Segment, E = Enroute Segment, A = Arrival Segment, F = Forecast, C = Current
E AD E A DTaxi In Post Flight Ops
A pilot needs to be made aware of weather conditions that have reached a level that is deemedhazardous to aviation. This information needs to be available both while en route and during flightplanning. In-flight weather advisories, issued by the Aviation Weather Center and the Center WeatherService Units, serve this role. Table 3-16 lists properties associated with the in-flight weather advisories.Each weather product is tailored to address specific weather hazards. The Significant MeteorologicalInformation (SIGMET) and Airman’s Meteorological Information (AIRMET) are issued by the AviationWeather Center (AWC) for the entire U.S. airspace; while, the meteorological impact statement (MIS)and center weather advisory (CWA) address hazards that may impact air traffic flow associated with aparticular air route traffic control center (ARTCC). These weather products tend to be updated on aregular basis, but all are amendable based on changing conditions. One should note that a number of thein-flight advisories use VHF omnidirectional range (VORs) locations, airports, or well known geographicareas as landmarks in referencing areas containing hazardous conditions.
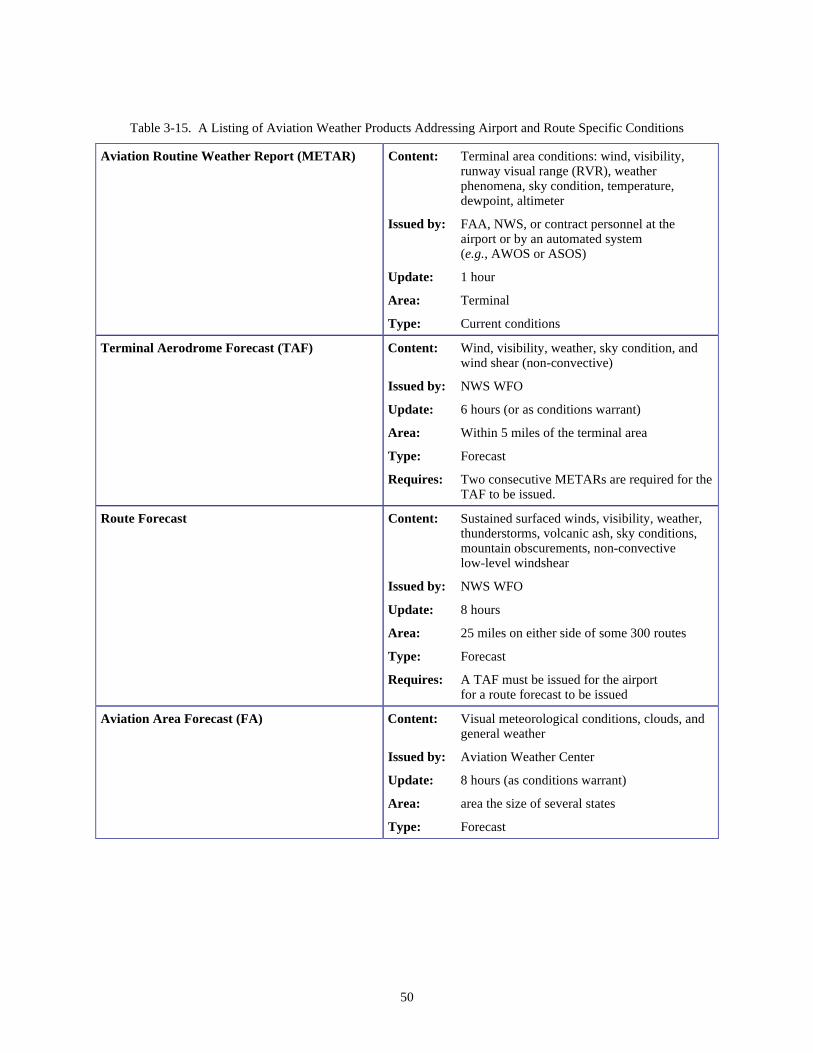
50
Table 3-15. A Listing of Aviation Weather Products Addressing Airport and Route Specific Conditions
Aviation Routine Weather Report (METAR) Content: Terminal area conditions: wind, visibility,runway visual range (RVR), weatherphenomena, sky condition, temperature,dewpoint, altimeter
Issued by: FAA, NWS, or contract personnel at theairport or by an automated system(e.g., AWOS or ASOS)
Update: 1 hour
Area: Terminal
Type: Current conditions
Terminal Aerodrome Forecast (TAF) Content: Wind, visibility, weather, sky condition, andwind shear (non-convective)
Issued by: NWS WFO
Update: 6 hours (or as conditions warrant)
Area: Within 5 miles of the terminal area
Type: Forecast
Requires: Two consecutive METARs are required for theTAF to be issued.
Route Forecast Content: Sustained surfaced winds, visibility, weather,thunderstorms, volcanic ash, sky conditions,mountain obscurements, non-convectivelow-level windshear
Issued by: NWS WFO
Update: 8 hours
Area: 25 miles on either side of some 300 routes
Type: Forecast
Requires: A TAF must be issued for the airportfor a route forecast to be issued
Aviation Area Forecast (FA) Content: Visual meteorological conditions, clouds, andgeneral weather
Issued by: Aviation Weather Center
Update: 8 hours (as conditions warrant)
Area: area the size of several states
Type: Forecast

51
Table 3-16. A Listing of In-Flight Weather Advisories Issued by the AWC and CWA
In-Flight Weather Advisories
Convective SIGMET Issued for: Thunderstorms (TS): severe, embedded, and line of,heavy precipitation affecting 40% of 3,000 squaremile area.
Issued by: Aviation Weather CenterUpdate: Hourly (or as conditions warrant)Reference: VORs, airports, or well known geographic areas
Domestic SIGMET Issued for: Non-convective phenomena: severe icing, extreme orsevere turbulence or CAT, dust and storms, volcanicash
Issued by: Aviation Weather CenterUpdate: As conditions warrantReference: VORs, airports, or well known geographic areas;
generally widespread forecast
International SIGMET Issued for: Thunderstorms, tropical cyclones, severe icing,severe or extreme turbulence, dust and sand storms,volcanic ash
Issued by: ICAO Meteorological Watch OfficesUpdate: As conditions warrant
AIRMET Sierra Issued for: IFR weather conditions (< 1,000 ft. and 3 miles)affecting a large area, extensive mountain obscuration
Issued by: Aviation Weather CenterUpdate: 6 hours (as conditions warrant)
AIRMET Tango Issued for: Moderate turbulence, 30 knot surface winds, low-level wind shear
Issued by: Aviation Weather CenterUpdate: 6 hours (or as conditions warrant)
AIRMET Zulu Issued for: Moderate icing, freezing-level heightsIssued by: Aviation Weather CenterUpdate: 6 hours (or as conditions warrant)
Meteorological Impact Statement (MIS) Issued for: Convective SIGMET criteria, icing, turbulence,surface winds, wind shear, volcanic ash, sand anddust storms
Issued by: Center Weather Service Unit at ARTCCUpdate: As conditions warrant– event to begin beyond 2 hours
Center Weather Advisory (CWA) Issued for: Weather phenomena that will impact air traffic flowwithin the next 2 hours.
Issued by: Center Weather Service Unit at ARTCCUpdate: As conditions warrant; event to begin within less than
2 hours
Severe Weather Watch Bulletin Issued for: A watch issued for areas where expected severethunderstorms or tornadoes may exists.
Issued by: Storms Prediction Center in Norman, OklahomaUpdate: As conditions warrant

52
A number of the weather products are designed to support pre-flight planning and strategic decisions.These are captured in Table 3-17. Their applicability to tactical decision making is limited due to theupdate rates which vary from 1 hour to 12 hours.
There are a number of sensors that have been developed to aid in characterizing weather conditions in theterminal area. Table 3-18 contains a list of these sensor systems. Currently, three sensors are employedin the terminal area to address microburst and gust front detection. The low level wind shear alert systemconsists of an integrated set of anemometers placed along a runway to alert of potentially hazardousconditions. The terminal Doppler weather radar (TDWR) and the ASR-9 retrofitted with a weathersystems processor (WSP) serve as remote sensors for the detection of wind shear conditions in theterminal area. The ASR-9 WSP is a lower cost alternative to the TDWR, which was designed specificallyas a weather radar for the terminal area. Automated systems have also been developed to provide themeasurements needed to file a METAR. Two systems, the Automated Weather Observation System(AWOS) and the newer Automated Surface Observation System (ASOS), provide continuous broadcastof measured conditions in the terminal area. The integrated terminal weather system (ITWS) is a systembeing developed by Massachusetts Institute of Technology (MIT) Lincoln Laboratories to combinemeasurements from a number of systems (e.g., TDWR, next generation radar (NEXRAD), AWOS/ASOS,PIREPS). This integration of resources makes possible a more complete picture of current and forecastedconditions in the terminal area. Even though these systems exist and are fielded at a number of airports,cost currently limits the number of airports which can be supported by these systems. It should bepointed out that the NEXRAD (WSR-88D) radar provides input to a number of the weather productslisted in Tables 3-15, 3-16 , and 3-17. The WSR-88D provides three moment data to the FAA/NWSsupport system (e.g., AWC, CWSU, ATCT, etc.) to aid in the analysis of current and forecastedconditions. In general, NEXRAD radars are not located in the terminal area but provide wide areacoverage out to approximately 200 nautical miles. There are approximately 162 WSR-88D installationslocated throughout the U.S.
Pilots do have some options in terms of on-board weather sensors (see Table 3-19). The most basicinstrument is the pitot tube which measures flight speed and from which prevailing wind speeds may bederived. This information can be used in real-time to estimate fuel burn rates. A storm scope is availablefor the detection of lightning, which is an indicator of severe weather. The storm scope provideslightning strike intensity and direction information. Airborne weather radars are available and requiredfor Part 121 operators. The airborne weather radar serves as a remote sensor to aid the pilot in identifyingregions which may contain hazardous weather. Airborne weather radars have also been developed thatcan detect the presence of wind shear conditions during take-off and landing. However, current versionsof airborne weather radars are not capable of distinguishing between different forms of precipitations,(e.g., rain, snow, and hail) and are not capable of detecting phenomena containing low levels ofprecipitants (e.g., clear air turbulence).
In a number of cases, the first level of defense for many pilots is personal observation. However,visual range is limited and many phenomena cannot be identified through visual observation. A finalweather product that is used by many pilots is the pilot report or PIREP. This is a verbal description ofconditions the pilot has experienced during flight that may be of interest to other pilots (e.g., moderate tosevere turbulence).

53
Table 3-17. Aviation Weather Products Used During PreflightPlanning and in Making Strategic Decisions
Winds and Temperature Aloft Forecast Content: Winds and temperatureUpdate: 12 hoursElevations: 3,000, 6,000, 9,000, 12,000, 18,000, 24,000,
30,000, 39,000, 45,000, and 53,000 ft(pressure alternate)
Radiosonde Additional Data Content: Freezing level and relative humidityUpdate: 12 hours
Constant Pressure Analysis Charts Content: Temperature, wind, dew pointUpdate: 12 hoursElevations: 1,500, 3,000, 18,000, 30,000, 34,000, and
39,000 ft (pressure altitude)
Composite Moisture Stability Chart Content: Stability, freezing levels, precipitationwater, and relative humidity
Update: 12 hoursElevations: Surface, 1,000, 850, 700, and 500 b/hPa
U.S. Low-level Significant Weather Prognosis Content: Fronts, pressure centers, precipitation, TS,IMC, VMC, turbulence, freezing levels
Update: 6 hoursElevations: Surface to 24,000 feet
High Level Significant Weather Prognosis Content: TS, turbulence, fronts, jet stream,tropopause, volcanic activity
Update: 6 hoursElevations: 25,000 to 60,000 ft (pressure altitude)
Convective Outlook Content: Forecast of areas at risk for severethunderstorms over the next 24-48 hours
Update: 5 times per day
Surface Analysis Charts Content: Pressure systems, isobars, and observableweather at reporting stations
Update: 3 hoursElevation: Surface
Weather Depiction Chart Content: Summary of METAR reportsUpdate: 3 hours
Radar Weather Report Content: Precipitation informationUpdate: 1 hour
Radar Summary Chart Content: Precipitation informationUpdate: 1 hour
Satellite Weather Pictures Content: Clouds: type and heightUpdate: 0.25 to 1 hour
Hurricane Advisory Issued for: Hurricanes 300 nm offshoreIssued by: Tropical Prediction Center (Miami)Update: As conditions warrant
Volcanic Ash Forecast and Dispersion Chart Issued for: Ash concentration forecast at differentaltitudes
Issued by: NOAA Air Resources Laboratory (ARL)Update: 6, 12, 24, and 36 hours after a volcanic
eruption

54
Table 3-18. A Listing of the Major Terminal Area Ground Based Sensor Systems
Terminal Area Ground Based Sensor Systems
Microburst and Gust Front Detection
Low Level Wind Shear Alert Systems (LLWAS)
Terminal Doppler Weather Radar (TDWR)
ASR-9 with Weather Systems Processor (WSP)
Automated Surface and Terminal Area Observations
Automated Weather Observation System (AWOS)
Automated Surface Observation System (ASOS)
Runway Visual Range
Combined Systems
Integrated Terminal Weather System (ITWS)
Table 3-19. A Listing of On-Board Weather Sensors
On-board Weather Sensors
Pitot Tube
Storm Scope
Airborne Weather Radar
3.8 National Transportation Safety Board (NSTB) Data
In this analysis, the development of requirements for new or improved weather products is partiallybased on the use of NTSB accident data as an indicator of possible deficiencies in the current system. Astudy [3-11] has been conducted by the NTSB that identifies weather as either a cause or factor in some3,978 accidents between 1989 and 1997. The study groups weather phenomena into eight categories:turbulence, visibility/ceiling, winds, wind shear, density altitude, icing, precipitation, and thunderstorms.The accident data are also partitioned by FAR Parts: 121, 135, 137, and 91. Part 137 is associated withthose operating agricultural aircraft.
Figures 3-2, 3-3, 3-4, and 3-5 contain graphics showing the percentage of accidents indexed byweather and FAR category (121, 135, 137, and 91, respectively). Table 3-20 contains a summary of thetotal number of accidents and the total number of weather events that may have been either a cause or afactor in these accidents.

55
Part 121: Weather Related Accident Causes or Factors(1989-1997)
79.71.6
3.1
1.6
1.6
3.1
6.3
3.1
Turbulence: 79%
Visibility/Ceiling: 1.6 %
Winds: 3.1%
Windshear: 1.6%
Density Altitude: 1.6%
Icing: 3.1%
Precipitation: 6.3%
Thunderstorm: 3.1%
Figure 3-2. Results of an FAA study on weather related causes or factors inaircraft accidents between 1989 and 1997 for Part 121 operators
Part 135: Weather Related Accident Causes or Factors
(1989-1997)
7.2
36.8
23.6
1
3.6
6.7
18.9
2.4
Turbulence: 7.2%
Visibility/Ceiling: 36.8%
Winds: 23.6%
Windshear: 1.0%
Density Altitude: 3.6%
Icing: 6.7%
Precipitation: 18.9%
Thunderstorm: 2.4%
Figure 3-3. Results of an FAA study on weather related causes or factors in aircraft accidents between 1989 and 1997 for Part 135 operators
Part 137: Weather Related Accident Factors and Causes(1989-1997)
12.56.3
52.52.5
18.8
5.6
0
12.5Turbulence: 12.5%
Visibility/Ceiling: 6.3%
Winds: 52.5%
Windshear: 2.5%
Density Altitude: 18.8%
Icing: 5.6%
Precipitation: 0.0%
Thunderstorm: 12.5%
Figure 3-4. Results of an FAA study on weather related causes or factorsin aircraft accidents between 1989 and 1997 for Part 137 operators

56
Part 91: Weather Related Accident Causes or Factors(1989 - 1997)
8.5
23.7
43.3
1.2
6.37.9
6.8
2.2
Turbulence: 8.5%
Visibility/Ceiling: 23.7%
Winds: 43.3%
Windshear: 1.2%
Density Altitude: 6.3 %
Icing: 7.9%
Precipitation: 6.8%
Thunderstorm: 2.2%
Figure 3-5. Results of an FAA study on weather related causes or factors inaircraft accidents between 1989 and 1997 for Part 91 operators
Table 3-20. A Listing of the Number of Weather Related Causes or Factors by FAA Category
Part Number of Accidents Weather Related Causes or Factors
121 60 64
135 249 419
137 128 160
91 3,510 5,231
Table 3-21 provides a comparison of the accident data by FAR category, and Table 3-22 provides arank ordering of the weather events based on the percentages in descending rank order. Based on thestudy, the majority of the weather related accidents for Part 121 operators involved some form ofturbulence. For Parts 135/137 and Part 91 operators, the majority of weather related accidents involvedwinds and visibility/ceiling conditions.
Table 3-21. A Comparison of the Weather Related Accident Causes or Factors by FAA Category
Weather Category Part 121 Part 135 Part 137 Part 91
Turbulence 79.7 7.2 12.5 8.5
Visibility/Ceiling 1.6 36.8 6.3 23.7
Winds 3.1 23.6 52.5 43.3
Windshear 1.6 1 2.5 1.2
Density Altitude 1.6 3.6 18.8 6.3
Icing 3.1 6.7 5.6 7.9
Precipitation 6.3 18.9 0.0 6.8
Thunderstorm 3.1 2.4 12.5 2.2

57
Table 3-22. A Listing of the Weather Categories in Descending Orderthat Have Contributed to Aircraft Accidents
Part 121 Part 135 Part 137 Part 91
Turbulence Visibility/Ceiling Winds Winds
Precipitation Winds Density Altitude Visibility/Ceiling
Winds Precipitation Turbulence Turbulence
Icing Turbulence Thunderstorm Icing
Thunderstorm Icing Visibility/Ceiling Precipitation
Visibility/Ceiling Density Altitude Icing Density Altitude
Windshear Thunderstorm Windshear Thunderstorm
Density Altitude Windshear Precipitation Windshear
In cases where visibility/ceiling conditions are a cause or factor, fog, haze/smoke, and low ceilingswere the major contributors. The data supporting this analysis are shown in Figure 3-6. Figure 3-7contains a break out of the different categories of wind that either caused or were a factor in theseaccidents. The categories of winds used in this study do not correlate directly to the atmosphericconditions that produced them. However, it should be noted that winds are a major contributing factor inaccidents for Part 135 and Part 91 operators.
The NTSB study provides an indicator of the types of weather phenomena that continue to contributeto weather accidents. In some cases, the percentage of accidents is small, but for the Part 121 or 135operator, a single accident may put a number of lives at risk. A number of the existing weather productsaddress weather phenomena in the NTSB report; however, the accident data indicate that room exists forimprovements. The NTSB study is used in this analysis to provide the basis for some of the weatherrequirements defined in the next section.
Visibility/Ceiling C onditions
37.3
10.7
0.2
0.1
2.2
12.8
34.4
2.3
Low Ceiling
Obscuration
Sand/Dust Storm
Sunglare
Below ApproachMinimums
Clouds
Fog
Haze/Smoke
Figure 3-6. A summary of the conditions leading to visibility/ceiling related accidents

58
Winds
28.18.2
17
11.4
0.3
0.8
0.8
33.4
Gusts
High Wind
Tailwind
Unfavorable Wind
Dust Devil / Whirlwind
Sudden Wind Shift
Variable Wind
Cross Wind
Figure 3-7. A summary of the conditions leading to wind related accidents
3.9 Weather Product Requirements Recommendations
The goal of this study is to define recommendations for weather information requirements that willresult in improved aviation safety. These requirements are developed within a framework thatsimultaneously supports an increase in aviation system capacity. The recommended requirements arebased on an analysis of weather hazards, phase of flight weather information requirements, currentweather products, and NTSB data discussed in the previous sections. A number of the weatherinformation requirements defined in studies performed in the early 1990s [3-8, 3-9, 3-10] still hold true inthe year 2000 and are also included in this analysis.
A cooperative decision making relationship must exist between the pilot, air traffic control, and thedispatcher. However, under this study, an explicit assignment of common and distinct requirementsbetween the users was not developed. The requirements focus more on the weather information neededduring each phase of flight and the hardware/communication equipment required to disseminate andinterpret the information. It is assumed that the partitioning of the information between pilot, ATC, anddispatcher will be developed at a later date and will require input from all three groups in order to satisfyregulatory, commercial, and personal (pilot and ATC) views of weather information.
In Section 3.4, the weather hazards were grouped into eight major categories: weather systems, airmotion, precipitation, icing, visibility and ceiling, lightning, volcanic ash, and wake vortices. Theatmospheric conditions that are potential hazards to aviation could be grouped in a number of ways withacknowledged overlaps between categories. However, the categories provide a mechanism for definingthe types of atmospheric conditions that impact aviation safety without the need to list all of the possibleconditions and the sources of those conditions, for fear of omitting one. There is a general requirementthat aviation weather products address each of the weather hazards in terms of: forecast, observations,intensity, location, extent, movement, and life cycle. Based on an assessment of aviation weatherhazards, GTRI proposes the following general requirements:
• A requirement for aviation weather products to address the eight categories of weatherphenomena defined in the report (reference Tables 3-2, 3-3, 3-4, 3-5, 3-6, and 3-7)
• A requirement for aviation weather products to address hazards in terms of forecastedconditions, current conditions (observations/measurements), intensity, location, extent,movement, and life cycle

59
The phases of flight analysis, described in Section 3.6, includes the forecasted or current weatherinformation required by the pilot as a function of the departure, en route, and arrival segments. Ingeneral, forecasted weather information is applied in making strategic decisions; whereas, information oncurrent weather conditions is required to make real-time tactical decisions. Tables 3-13, 3-14, 3-15, and2-16 define the required weather information on a per-phase of flight basis using the eight categories ofweather hazards defined in Section 3.4. The timeliness of the weather information is grouped into twocategories: forecast and current. Based on GTRI’s analysis of the 12 phases of flight, GTRI proposes thefollowing requirement:
• A requirement for aviation weather products to provide both strategic and tactical (forforecasted and current conditions) information as a function of the phase of flight (referenceTables 3-13, 3-14, 3-15, and 3-16)
Based on a review of the current weather products and interviews with users, GTRI proposes thefollowing requirement:
• A requirement for more accurate, localized descriptions of forecasted and current conditionstailored to the need of the aviation community
The terminal area has been identified as the area where weather may have the most impact in terms offlight safety. The dense aircraft environment, reduced airspeeds, and low altitudes combine to intensifythe effects of weather on the pilot and aircraft. New requirements for the terminal area are focused onhazards associated with winds and ceiling/visibility. As noted in the previous sections, low altitude winds(wind shear and turbulence) can result in an aircraft deviating from the intended flight path, which at lowaltitudes, may result in impact with the ground or low trajectories on take-off.
Current sensor systems in the terminal area include Terminal Doppler Weather Radars (TDWR), LowLevel Wind Shear Alert System (LLWAS), and ASR-9 radars equipped with a weather systems processor(WSP). A capability to support three-dimensional wind sensing in the terminal area is desired tomaximize safety. However, to date, system cost and complexity have placed a limit on the number offield systems that may be used to address this requirement. There are some 45 TDWRs located across thecountry. However, the TDWR also has its limitations [3-2]. The TDWR does not provide warnings ofwind shear conditions outside the alert boxes on the approach and departure ends of the runway. TheTDWR does not report wind shear conditions that are not associated with a microburst or gust front. TheTDWR does not detect turbulence and cross or gusty winds.
The low level wind shear alert system (LLWAS) consists of anemometers placed on poles (as high as150 feet above the surface) which are located around the runway environment. The sensors provide inputto a processor that is used to detect wind shear conditions. The LLWAS was originally located at110 airports. These systems are being phased out and are being replaced by an upgraded system termedthe LLWAS-NE (network expansion) which will be located at 39 airports. In general, the LLWAS isrestricted to in situ measurements of low level phenomena.
The ASR-9 radar retrofitted with a weather systems processor is used at airports where financialconstraints do not permit the installation of a TDWR. The ASR-9 is scheduled for deployment at34 airports across the continental U.S. The integrated terminal weather support system (ITWS) is asystem designed to combine the inputs from a number of sensors including TDWR, LLWAS, ASOS, andWSR-88D in order to develop a better composite picture of conditions in the terminal area. On boardweather radars also serve a major role in providing a pilot real-time information on microburst conditions.

60
An analysis of the aforementioned systems and the weather hazards found in the terminal area led to thefollowing set of requirements:
• A requirement for integration/fusion of weather sensors to develop an improved compositeview of the weather conditions in the terminal area
• A requirement to support three-dimensional wind sensing in the terminal area
• A requirement to support detection of wind phenomena that contain low levels of precipitants(e.g., dry microburst and gust fronts)
• A requirement for lower cost systems to support wind sensing in the terminal area; this isintended to increase the number of airports having this capability
Wake vortex detection and tracking is needed in the terminal area to support a safe environment whileincreasing airport capacity by reducing the time between landings. As noted previously, wake vorticesare induced by aircraft on take-off and landing and pose a threat to smaller aircraft. To support increasedcapacity and flight safety, a wake vortex detection system must be able to operate under all weatherconditions. Based on current wake vortex sensor development programs and known hazards associatedwith wake vortices, GTRI proposes the following requirement:
• A requirement for wake vortex detection and tracking in the terminal area under all weatherconditions
For both VMC and IMC, some level of visibility is required to support an attempted landing. For theVFR pilot, visibility minimums are approximately 3 statute miles with 500 foot separation below clouds.For the IFR pilot, a decision height is defined at which the pilot must see the runway environment basedon visual cues. In general, a pilot may be provided with ceilings and RVR conditions prior to entering theterminal area. The information is provided by sensors which take point or very localized measurementsor by human observation. The pilot must use this information to extrapolate conditions which may existalong the intended glide slope. Through discussions with pilots and NASA, GTRI has identified a desirefor a sensor system to provide real-time slant range visibility conditions along the glide slope. Thiswould permit a pilot to make strategic decisions concerning the conditions at an airport thereby allowinghim to divert to an alternate airport at an early point in the flight phase. The concept of a slant rangevisibility sensor is shown in Figure 3-8. Based on initial discussions and analysis, GTRI proposes thefollowing requirements:
• A requirement for a sensor system to provide real-time slant range visibility conditions alongthe glide slope
• A requirement for improvements in ceiling and visibility forecast
As noted in the preflight analysis, the pilot (and/or dispatcher and ATC) may need to review largequantities of data from a number of sources to obtain an accurate picture of the current and forecastedconditions along the intended route. The need exists for an automated system that would permit a pilot toquery a database using flight specific information. The weather products supplied to the pilot would thenbe tailored to his route, to the type of aircraft, and to the intent of the pilot as indicated by the flight plan.Based on a review of the current weather products, GTRI proposes the following requirement:
• A requirement for an automated system allowing a user to enter route and aircraft specificinformation that would then provide the pilot with tailored weather products to aid inpreflight planning

61
Horizontal
Slant RangeDecisionHeight
Figure 3-8. The concept of a slant range visibility sensor to alert the pilot of conditions along the glide slope
A need exists for a system to alert pilots (and/or dispatcher and ATC) in real-time of changingconditions that would result in a VMC to IMC transition with sufficient time for the pilot to takenecessary measures to perform replanning in-flight. Such a system would need to provide real timeupdates of cloud ceilings and coverage on a finer spatial grid that currently exists. Area forecasts, whichprovide visual meteorological conditions, are forecasted over large areas (several states). Based on areview of the current weather products, GTRI proposes the following requirement:
• A requirement for a real-time system providing current information on VMC and IMC (e.g.,cloud ceilings and coverage) on a finer time and spatial scale than currently exists
Weather products are required which support finer spatial and temporal grids than currently exist ifimprovements in aviation safety are to be achieved. From a temporal perspective, a number of weatherproducts used in pre-flight planning and strategic analysis are updated at intervals of hours (anywherefrom 1 to 12 hours). The first four weather products in Table 3-18 are derived from radiosondemeasurements that are taken at 0000Z and 1200Z each day. The spatial and temporal spacings of thesemeasurements limit the accuracy of the weather prediction models and the update rates of thecorresponding weather products. A requirement exists for updates to the radiosonde measurements on afiner temporal and spatial scale. Other weather products could also be updated on a finer time scale (e.g.,a METAR, a weather depiction chart, a radar weather report, and a radar summary chart) in order to bettermonitor changing conditions that impact aviation. However, the infrastructure must exists to support theincreased amount of data. Based on a review of the current weather products, GTRI proposes thefollowing requirements:
• A requirement for an increase in the update rate associated with a number of weatherproducts used in pre-flight planning
• A requirement for a finer time and spatial spacing between radiosonde measurements
Weather products are also needed which report conditions that were not forecasted. The currentsystem of delivering weather products to the pilot, based upon requests, needs to be converted to anautomated system that provides continuous updates to changing conditions, especially those that were innot in the original forecast. Based on a review of the current weather products and delivery systems,GTRI proposes the following requirement:
• A requirement for an automated system, requiring little pilot interaction, to deliver updates tothe pilot as weather conditions change

62
In terms of spatial requirements, weather products need to be designed to provide a more accuratelocalized description of forecasted and current conditions. Atmospheric conditions should be quantifiedin terms of a three dimensional coordinate system (e.g., GPS coordinates) describing position, extent, andmovement. A number of the in-flight weather advisories reference hazardous weather locations byVORs, airports, and geographic features. Systems should be developed that can interpret threedimensional coordinates and relate them to the aircraft’s position and intended route in real-time. Basedon a review of the current weather products, GTRI proposes the following requirements:
• A requirement for a standardized three dimensional coordinate system (e.g., GPScoordinates) in which to describe a hazard’s position, extent, and movement
• A requirement for on-board equipment to interpret position and movement of hazardousconditions (based on a three dimensional coordinate system) in relation to the aircraft’scurrent position and intended route
Expert systems are required to support the large amounts of weather information that will be needed toincrease flight safety. Both the air traffic control system (e.g., tower, TRACON, ARTCC, AWC, FSS,etc.), support operations (e.g., dispatchers and air line operation centers), and the pilot will need somelevel of artificial intelligence to handle the large amounts of data and to provide interpretation/analysisbased on a particular flight plan. Some of the FAA/NWS systems already exhibit some level of artificialintelligence. However, pilots need to be supported by on-board weather data processors and displays thatcan receive, process, and display weather information in a format that is specific to their particular flightand is easily interpreted. The demands on the pilot are already high, and operating in adverse weatherconditions dramatically increases the workload. The system needs to be as autonomous as possible,providing specific options for the pilot under duress. An autonomous, expert system would start to bridgethe gap between Part 91 operators who rely solely on the FAA support system and Part 135/121 operatorswho are backed up by dispatchers and airline operations center personnel who provide automatic updatesas conditions warrant. Based on a review of the current weather products and systems, GTRI proposes thefollowing requirements:
• A requirement for an autonomous, on-board, expert system providing weather information inthe cockpit in a graphical format; the expert system should be capable of handling andinterpreting large amounts of data and should provide specific options for the pilot based oncurrent and forecasted weather information
Two atmospheric phenomena/conditions that are not adequately detected or characterized by thecurrent set of weather products and sensors are icing and turbulence. Currently, this information isprovided either through forecast data or via PIREPS which pilots use to provide reports of adverseweather conditions they have experienced. On-board sensors are required to remotely detect and warnpilots of hazardous conditions with sufficient time for pilots to take evasive action. Based on a lackcapability and the reality of the potential hazards, GTRI proposes the following requirements.
• A requirement for on-board sensors to address in-flight icing
• A requirement for on-board sensors to address turbulence
Cost is always a factor in the process of defining requirements and in some cases requirements areimposed or not imposed based on cost feasibility. Every effort should be made to provide the safestpossible environment with the understanding that there exists a limit to the amount of funds which can beexpended. The FAA, NASA, commercial airlines, and the aviation industry must work together to

63
provide the safest environment possible. Some of the effort needs to focus on low-cost solutions that maypermit certain weather products to be expanded in support of the user with limited funds. GTRI proposesthe following requirements that will require a cooperative effort to obtain.
• A requirement for lower cost, on-board weather systems to support the smaller aircraft thatfall under Part 91 operations
• A requirement for a reduction in the number of airports where the pilot is required to relysolely on personal observation or PIREPs to obtain local information
The current PIREP system is based on manual entry of information provided to flight service stationsby pilots. This system is known to be stressed during times of adverse weather conditions. In addition,the reports are subjective based on pilot observations. To provide better reporting capabilities and moredetailed information, an electronic pilot reporting system is desired. EPIREPs will provide a real-timemethod of receiving and entering reports into the system for dissemination without operator/pilotintervention. On-board sensors will provide inputs to EPIREPs for a more quantitative view of thecurrent conditions. Based on stated objectives for EPIREPS and the obvious benefits in terms of bothsafety and further research, GTRI proposes the following requirement:
• A requirement for on-board sensors to provide inputs for EPIREPS
Precipitation and icing can have a significant impact on the runway coefficient of friction. This canimpact an aircraft’s ability to stop or main control during landing and takeoff. A sensor is need to reportrunway surface conditions. GTRI proposes the following requirement:
• A requirement for a system to sense and report runway surface conditions (e.g., runwaycoefficient of friction) that relate to the pilot’s ability to stop or maintain control of theaircraft while the aircraft is on the runway
With the future loss of the GOES split channel, satellite detection of volcanic ash will be significantlyimpaired. GTRI sees a need for a requirement to identify a replacement sensor to detect and trackvolcanic ash. Therefore, GTRI proposes the following requirement:
• A requirement for a replacement sensor (loss of GOES split channel) to detect volcanic ash
A summary of the weather information requirements developed during this study are captured inTable 3-23. These recommended requirements are intended as steps toward improving flight safety andefficiency.
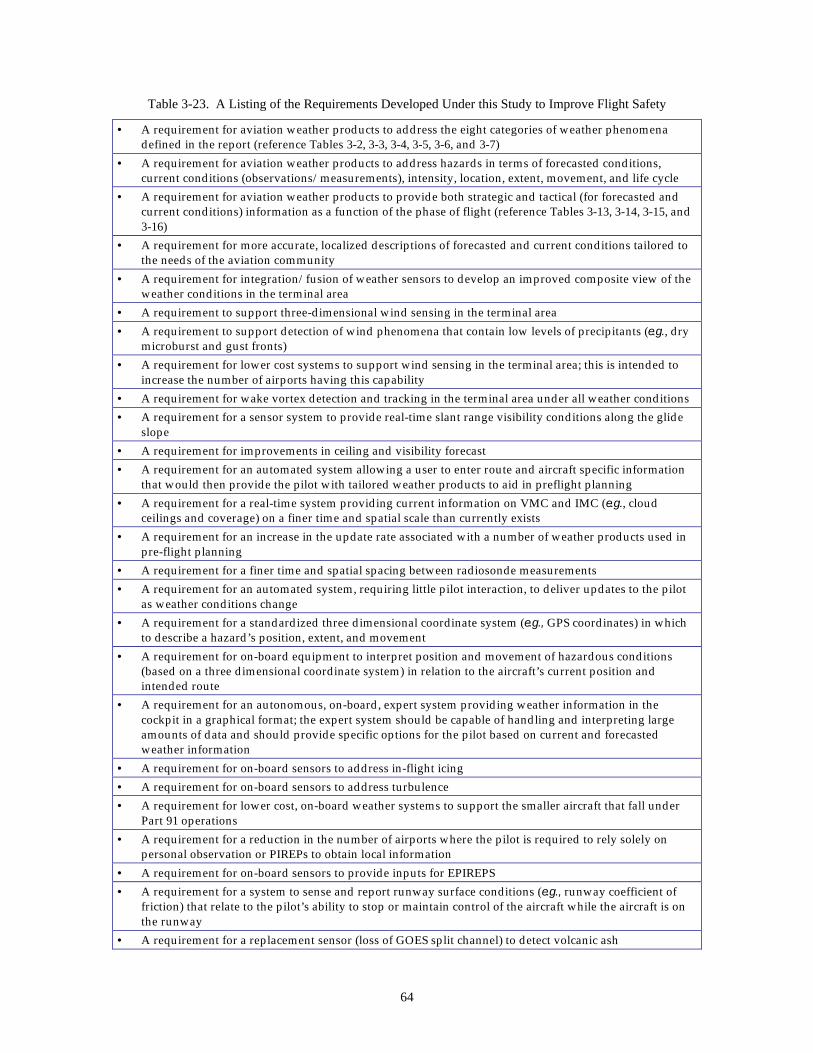
64
Table 3-23. A Listing of the Requirements Developed Under this Study to Improve Flight Safety
• A requirement for aviation weather products to address the eight categories of weather phenomenadefined in the report (reference Tables 3-2, 3-3, 3-4, 3-5, 3-6, and 3-7)
• A requirement for aviation weather products to address hazards in terms of forecasted conditions,current conditions (observations/measurements), intensity, location, extent, movement, and life cycle
• A requirement for aviation weather products to provide both strategic and tactical (for forecasted andcurrent conditions) information as a function of the phase of flight (reference Tables 3-13, 3-14, 3-15, and3-16)
• A requirement for more accurate, localized descriptions of forecasted and current conditions tailored tothe needs of the aviation community
• A requirement for integration/fusion of weather sensors to develop an improved composite view of theweather conditions in the terminal area
• A requirement to support three-dimensional wind sensing in the terminal area
• A requirement to support detection of wind phenomena that contain low levels of precipitants (e.g., drymicroburst and gust fronts)
• A requirement for lower cost systems to support wind sensing in the terminal area; this is intended toincrease the number of airports having this capability
• A requirement for wake vortex detection and tracking in the terminal area under all weather conditions
• A requirement for a sensor system to provide real-time slant range visibility conditions along the glideslope
• A requirement for improvements in ceiling and visibility forecast
• A requirement for an automated system allowing a user to enter route and aircraft specific informationthat would then provide the pilot with tailored weather products to aid in preflight planning
• A requirement for a real-time system providing current information on VMC and IMC (e.g., cloudceilings and coverage) on a finer time and spatial scale than currently exists
• A requirement for an increase in the update rate associated with a number of weather products used inpre-flight planning
• A requirement for a finer time and spatial spacing between radiosonde measurements
• A requirement for an automated system, requiring little pilot interaction, to deliver updates to the pilotas weather conditions change
• A requirement for a standardized three dimensional coordinate system (e.g., GPS coordinates) in whichto describe a hazard’s position, extent, and movement
• A requirement for on-board equipment to interpret position and movement of hazardous conditions(based on a three dimensional coordinate system) in relation to the aircraft’s current position andintended route
• A requirement for an autonomous, on-board, expert system providing weather information in thecockpit in a graphical format; the expert system should be capable of handling and interpreting largeamounts of data and should provide specific options for the pilot based on current and forecastedweather information
• A requirement for on-board sensors to address in-flight icing
• A requirement for on-board sensors to address turbulence
• A requirement for lower cost, on-board weather systems to support the smaller aircraft that fall underPart 91 operations
• A requirement for a reduction in the number of airports where the pilot is required to rely solely onpersonal observation or PIREPs to obtain local information
• A requirement for on-board sensors to provide inputs for EPIREPS
• A requirement for a system to sense and report runway surface conditions (e.g., runway coefficient offriction) that relate to the pilot’s ability to stop or maintain control of the aircraft while the aircraft is onthe runway
• A requirement for a replacement sensor (loss of GOES split channel) to detect volcanic ash

65
References
3-1. Mahapatra, Pravas, Aviation Weather Surveillance Systems, The Institution of ElectricalEngineers, Micheal Faraday House, United Kingdom, 1999.
3-2. Gleim, I. N., Aviation Weather and Weather Services, Gleim Publications, Inc., Gainesville,Florida, 1998.
3-3. Doviak, R. J., and D. S. Zrnic, Doppler Radar and Weather Observations, 2nd Edition, AcademicPress, San Diego, 1993.
3-4. Mahapatra, P. R., and D. S. Zrnic, “Sensors and Systems to Enhance Aviation Safety AgainstWeather Hazards,” Proceedings of the IEEE, Vol. 79, No. 9, pp. 1234-1267, September 1991.
3-5. Fujita, T. T., and J. McCarthy, “The Application of Weather Radar to Aviation Meteorology,”Radar in Meteorology, American Meteorological Society, Boston, MA, Chapter 31a, pp. 657-681.
3-6. Sherertz, F., et al., National Aviation Weather Initiatives, FCM-P34-1999, Washington, D.C.,February, 1999, available at http://www.ofcm.gov/homepage/text/pubs_linx.htm
3-7. Ball, J. W., et al., “Aviation Weather Communication Requirements,” Lockheed MartinAeronautical Systems, Phase I Report for Glenn Research Center, June 1999.
3-8. Crabill, N. L., and E. R. Dash, “Pilot’s Weather Information Requirements and Implications forWeather Data Systems Design,” DTFA-01-90-4-01019, NAS1-18585, available via NTIS, April,1991.
3-9. “Two-Way Data Link versus Broadcast Communications for Flight Information Services,” RTCASC – 169, Working Group 3, Cockpit Requirements Issues Subgroup, DRAFT, August, 1993.
3-10. “Air Traffic Weather Requirements Report,” prepared by the Air Traffic Weather RequirementsTeam (ATWRT), February, 1993.
3-11. FAA Office of System Safety, Weather Study, available at Internet World Wide Web Sitewww.asy.faa.gov/safety_analysis/weather_study
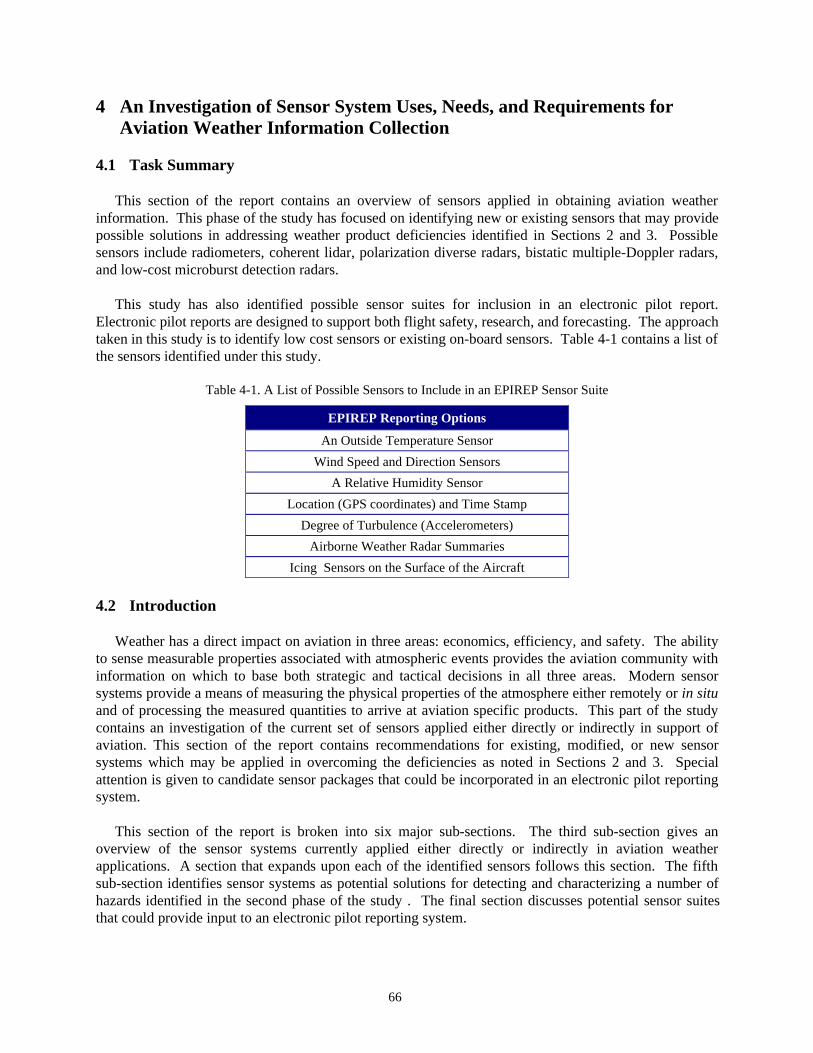
66
4 An Investigation of Sensor System Uses, Needs, and Requirements forAviation Weather Information Collection
4.1 Task Summary
This section of the report contains an overview of sensors applied in obtaining aviation weatherinformation. This phase of the study has focused on identifying new or existing sensors that may providepossible solutions in addressing weather product deficiencies identified in Sections 2 and 3. Possiblesensors include radiometers, coherent lidar, polarization diverse radars, bistatic multiple-Doppler radars,and low-cost microburst detection radars.
This study has also identified possible sensor suites for inclusion in an electronic pilot report.Electronic pilot reports are designed to support both flight safety, research, and forecasting. The approachtaken in this study is to identify low cost sensors or existing on-board sensors. Table 4-1 contains a list ofthe sensors identified under this study.
Table 4-1. A List of Possible Sensors to Include in an EPIREP Sensor Suite
EPIREP Reporting Options
An Outside Temperature Sensor
Wind Speed and Direction Sensors
A Relative Humidity Sensor
Location (GPS coordinates) and Time Stamp
Degree of Turbulence (Accelerometers)
Airborne Weather Radar Summaries
Icing Sensors on the Surface of the Aircraft
4.2 Introduction
Weather has a direct impact on aviation in three areas: economics, efficiency, and safety. The abilityto sense measurable properties associated with atmospheric events provides the aviation community withinformation on which to base both strategic and tactical decisions in all three areas. Modern sensorsystems provide a means of measuring the physical properties of the atmosphere either remotely or in situand of processing the measured quantities to arrive at aviation specific products. This part of the studycontains an investigation of the current set of sensors applied either directly or indirectly in support ofaviation. This section of the report contains recommendations for existing, modified, or new sensorsystems which may be applied in overcoming the deficiencies as noted in Sections 2 and 3. Specialattention is given to candidate sensor packages that could be incorporated in an electronic pilot reportingsystem.
This section of the report is broken into six major sub-sections. The third sub-section gives anoverview of the sensor systems currently applied either directly or indirectly in aviation weatherapplications. A section that expands upon each of the identified sensors follows this section. The fifthsub-section identifies sensor systems as potential solutions for detecting and characterizing a number ofhazards identified in the second phase of the study . The final section discusses potential sensor suitesthat could provide input to an electronic pilot reporting system.

67
4.3 Overview of Sensors in Support of Aviation Related Weather Information
The aviation community depends on both direct sensor observation and forecast of meteorologicalconditions for safe and efficient flight. The forecasts, in turn, are generally derived from inputs from anumber of different sensors. The current FAA and NOAA/NWS support system provides weatherproducts that are tailored specifically for aviation or provides weather products that may be applied toaviation with some additional interpretation. The resulting weather products, derived from sensormeasurements, may be applied in both strategic and tactical decision making. This section provides anoverview of the current set of sensor systems supporting the aviation community. A more detaileddescription of the individual sensors and their operating parameters is given in Section 4.4.
The Federal Aviation Administration (FAA) is the governing agency that oversees or approvesweather information sources for aviation. In a number of cases, the FAA has directly funded thedevelopment of aviation weather sensor systems and governs the operation and maintenance of thesesystems once they are fielded. Sensing, analysis, interpretation, prediction, and reporting of weatherinformation on a national scale falls under the jurisdiction of the National Weather Service (NWS). TheNWS owns and operates a number of assets that are used by the aviation community. In addition to FAAand NWS operational assets, a number of aviation weather sensing systems (including commercial,academic, and NWS/FAA funded) are under development. Sensors often provide weather informationthat may be applied in support of tactical aviation decisions. Sensors may also collect information thatwill used to derive forecast of weather conditions over the next several hours or days supporting bothnear-term strategic and long-term strategic decisions. For example, the National Centers forEnvironmental Prediction’s Rapid Update Cycle (RUC) II model generates 3 hour forecasts using inputsfrom a number of different sensors positioned across the country. The following sections describe bothtactical and strategic sensors which provide weather information to the aviation community either directlyor indirectly (e.g., as input to a forecast model).
Weather sensing systems perform measurements either remotely or in situ (in direct contact with). Inthe case of aviation, these sensors may be located on the ground, or they may be positioned on an aircraft,balloon, or satellite. A number of the weather sensors use electromagnetic (EM) energy as a means ofeither actively or passively measuring some property of the atmosphere. Radars are active EM sensorsthat operate in the 3 MHz to 300 GHz range [4-1]. Radars are a unique remote weather sensing devicedue to their ability to characterize the internal structure of a storm and to see through one storm and intothe next. Attenuation is a factor, but long range systems have been designed to operate in all weatherconditions in the frequency range from 3 MHz to 12 GHz (HF-band to X-band). The aviation weathersupport structure includes radars which support both en route and terminal area weather surveillance. Onboard the aircraft, FAA-approved and commercially available airborne weather radars (AWR) provideprecipitation intensity, turbulence detection (when associated with precipitation), and wind sheardetection (on approach and landing). Manufactures include Honeywell, Rockwell Collins, and AlliedSignal (now merged with Honeywell). Parameters for several of the AWRs are given in Section 4.4. Thewind shear mode is only found on versions supporting the commercial aircraft industry.
In the terminal area, the terminal Doppler weather radars (TDWR) and airport surveillance radars(ASR-9) retrofitted with a weather systems processor (WSP) provide wind shear detection, wind shiftprediction, precipitation intensity, and storm tracking. The TDWRs are located at 45 major airports in theU.S., and the ASR-9s with a WSP are located at some 34 major airports in the U.S. The ASR-9’s primaryfunction is air traffic surveillance in the terminal area. The WSP retrofit is intended to provide thefunctionality of the TDWR without the additional cost. The air route surveillance radar (ARSR) isassociated with an air route traffic control center (ARTCC). The ARSR provides en route air traffic

68
surveillance. The ARSR also provides coarse precipitation information in the area assigned to theARTCC. Each of these radars is under the jurisdiction of the FAA.
The National Weather Service also oversees a number of radar assets. NWS radar products, ingeneral, find their way back into the aviation community either directly or indirectly. The NWS’s mostpopular, and in some sense vital, asset is the weather surveillance radar – 88 D (WSR-88D). The networkof 158 operational radars provides almost complete coverage of the 48 contiguous states, Hawaii, andAlaska. Weather products generated by the WSR-88D are supplied directly to the aviation weather center(AWC) and other air traffic control centers. The NWS falls under the jurisdiction of the National Oceanicand Atmospheric Administration (NOAA). NOAA also houses the Forecast Systems Laboratory (FSL)under the office of Oceanic and Atmospheric Research. The FSL maintains the NOAA wind profilernetwork (NWPN). Wind profilers are vertically oriented UHF radars that provide horizontal wind speedand direction information as a function of elevation. This information may be used as an input to theRUC II forecast model providing forecasted winds over the contiguous 48 states. A number of theNWPN sites are also equipped with a radar-acoustic sounding system (RASS) which providestemperature estimates as a function of altitude. The RASS uses a radar to estimate the speed at which anacoustic pulse travels through the atmosphere. The speed of propagation can be directly related to thetemperature of the atmosphere. NOAA has also developed a more loosely bound network of boundarylayer wind profilers. The boundary layer profilers are owned by some 34 different agencies. Theboundary layer network provides an additional source of horizontal wind information for the RUC IIforecast model. Wind profilers have been used at a limited number of airports to map horizontal windsbut are not currently a part of the FAA radar support system. Table 4-2 and Table 4-3 contain a list ofFAA and NOAA/NWS radar assets described in the preceding paragraphs.
Table 4-2. List of FAA and NOAA/NWS Radars
Operational Radar Systems Governing Agency Operational Area
Airborne Weather Radars Pilot/FAA Approved On-board Aircraft
Terminal Doppler Weather Radar FAA Terminal Area
Airport Surveillance Radar – 9 FAA Terminal Area
Air Route Surveillance Radar FAA En route
Weather Surveillance Radar – 88D NOAA/NWS Continental U.S.
NOAA Wind Profiler Network NOAA/NWS Localized
Radio Acoustic Sounding System NOAA/NWS Localized
Boundary Layer Profiler Network NOAA/NWS Localized
Section 4.4 of this report contains a description of a number of experimental radars and some proposedoperational radars that are in the concept or demonstration phase. A very brief description of each radaris given here as an overview. Table 4-4 contains a list of a number of these radars. The FAA has in itsplans the development of a next generation terminal area surveillance system (TASS) that willincorporate the functions of the TDWR and ASR-9 into one radar system. The focus has been on aphased array radar providing electronic scan capabilities. However, the program seems to have stalled.
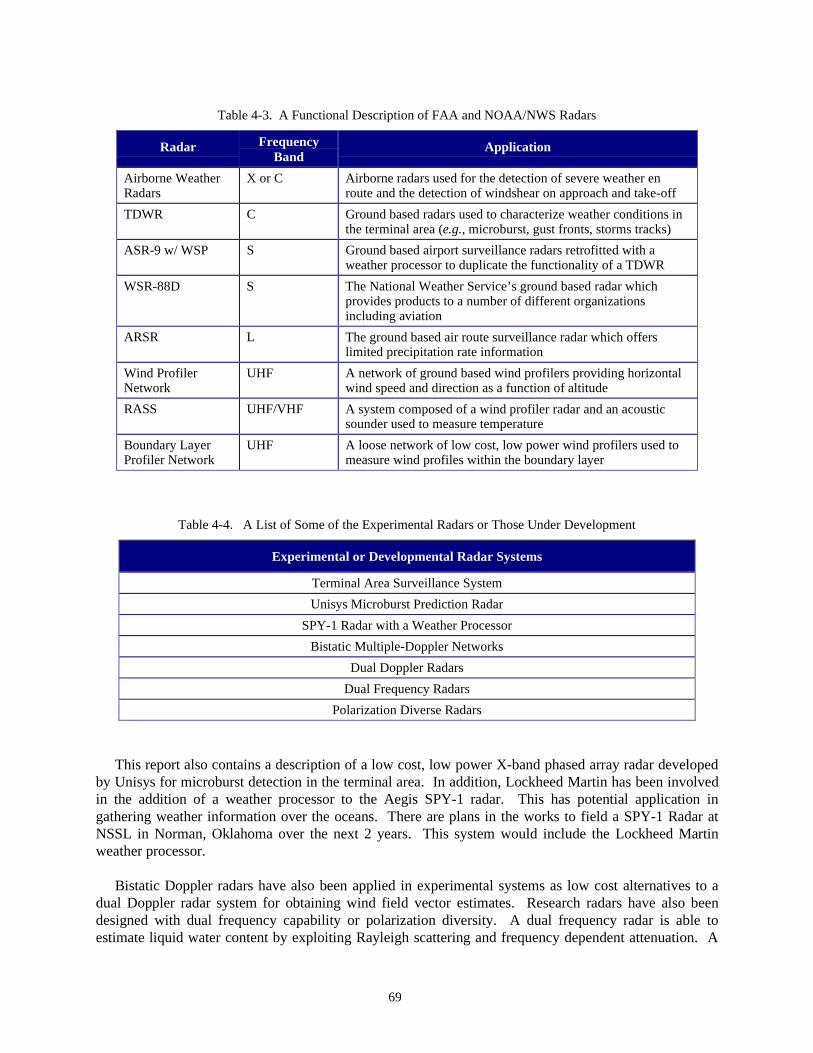
69
Table 4-3. A Functional Description of FAA and NOAA/NWS Radars
Radar FrequencyBand
Application
Airborne WeatherRadars
X or C Airborne radars used for the detection of severe weather enroute and the detection of windshear on approach and take-off
TDWR C Ground based radars used to characterize weather conditions inthe terminal area (e.g., microburst, gust fronts, storms tracks)
ASR-9 w/ WSP S Ground based airport surveillance radars retrofitted with aweather processor to duplicate the functionality of a TDWR
WSR-88D S The National Weather Service’s ground based radar whichprovides products to a number of different organizationsincluding aviation
ARSR L The ground based air route surveillance radar which offerslimited precipitation rate information
Wind ProfilerNetwork
UHF A network of ground based wind profilers providing horizontalwind speed and direction as a function of altitude
RASS UHF/VHF A system composed of a wind profiler radar and an acousticsounder used to measure temperature
Boundary LayerProfiler Network
UHF A loose network of low cost, low power wind profilers used tomeasure wind profiles within the boundary layer
Table 4-4. A List of Some of the Experimental Radars or Those Under Development
Experimental or Developmental Radar Systems
Terminal Area Surveillance System
Unisys Microburst Prediction Radar
SPY-1 Radar with a Weather Processor
Bistatic Multiple-Doppler Networks
Dual Doppler Radars
Dual Frequency Radars
Polarization Diverse Radars
This report also contains a description of a low cost, low power X-band phased array radar developedby Unisys for microburst detection in the terminal area. In addition, Lockheed Martin has been involvedin the addition of a weather processor to the Aegis SPY-1 radar. This has potential application ingathering weather information over the oceans. There are plans in the works to field a SPY-1 Radar atNSSL in Norman, Oklahoma over the next 2 years. This system would include the Lockheed Martinweather processor.
Bistatic Doppler radars have also been applied in experimental systems as low cost alternatives to adual Doppler radar system for obtaining wind field vector estimates. Research radars have also beendesigned with dual frequency capability or polarization diversity. A dual frequency radar is able toestimate liquid water content by exploiting Rayleigh scattering and frequency dependent attenuation. A

70
polarization diverse radar offers the potential for discrimination between precipitant types. Theapplication of polarization diversity is currently being addressed in the FAA sponsored NEXRADEnhancements Product Development Team. These enhancements will be examined in Section 4.5 aspossible solutions to fill the gaps identified in Sections 2 and 3.
Table 4-5 contains a list of some of the electro-optical/infrared (EO/IR) and millimeter wave sensorsused in aviation weather sensing. Radiometers are passive devices operating in the tens of GHz range.These passive sensors have been applied in measuring the temperature of the atmosphere and measuringthe integrated liquid water and water vapor content of the atmosphere. Radiometers are sensitive to watervapor content at specific frequencies where water vapor is strongly emitting. Weather satellites areequipped with radiometers, infrared sensors, and electro-optic sensors (visible light sensors). Theinfrared sensors are used to measure temperature, and the electro-optic sensors are used to observe cloudformations. The runway visual range sensors are derived from optical measurements of light scatteringby hydrometers such as fog droplets. A ceilometer is a type of laser range finder. The altitude of a cloudis determined from the round-trip time for a pulse of light to travel from the ground to the cloud and back.A coherent lidar operates on the same basic principles as a coherent radar: a pulse of laser light istransmitted, and the received light is mixed with light from another laser that serves as a reference localoscillator. The local oscillator is usually offset in frequency by about 10 MHz to create an intermediatefrequency (IF). Coherent lidars can estimate radial velocities by measuring scatterer induced Dopplershifts.
Table 4-5. A List of EO/IR and Passive Millimeter Wave Sensors
Sensors
Radiometers
Electro-optic Sensors (Visible Range)
Infrared Sensors
Runway Visual Range Sensors
Ceilometers
Coherent Lidar
In situ sensors also play an integral role in the aviation weather information support system. Table 4-6contains a list of the in situ sensor systems. Automated surface observation systems (ASOS) located atairports provide wind, temperature, dew point, visibility, clouds/ceiling, and precipitation information.The ASOS sensor package includes a ceilometer, a visibility sensor, a precipitation identification sensor,a freezing rain sensor, pressure sensors, an ambient temperature sensor, a dew point sensor, and ananemometer. The automated weather observing system (AWOS) is a predecessor to the ASOS and maybe fielded in a number of different configurations, some consisting of a subset of the sensors listed above.The low level wind shear alert system (LLWAS) is a network of anemometers placed in the terminal areato detect the presence of a wind shear condition. In situ sensors are also available on board aircraft. Thebasic aircraft is outfitted with sensors to measure wind speed and direction along the route and withsensors to measure the outside temperature. The meteorological data collection and reporting system(MDCRS) provides a telemetry capability for ACARS-equipped aircraft to report temperature and windinformation as a function of altitude. Some aircraft have also been outfitted with a relative humiditysensor. This type of system provides data for input to forecast models. The NWS also maintains anational radiosonde network. Radiosondes are balloons instrumented with sensors to measuretemperature, wind speed and direction, and relative humidity.

71
Table 4-6. A List of In Situ Based Sensors
In Situ Sensor Systems
Automated Surface Observation System/Automated Weather Observing System
Low Level Wind Shear Alert System
Meteorological Data Collection and Reporting System
Radiosonde
Table 4-7 contains a list of sensors that did not fit neatly under the previously defined categories butare also an integral part of the aviation weather information support system. Lightning is a real threat toaviation since it is a source of electrical energy that may damage sensitive aircraft components. Inaddition, the presence of lightning is an indicator of severe weather. The National Lightning DetectionNetwork (NLDN) is operated by Global Atmospherics, Inc. The NLDN is responsible for providinginformation on cloud-to-ground lightning strikes through a network of EM sensors. This information ismade available to the aviation weather support system. Some aircraft are also outfitted with on-boardlightning detection systems.
Table 4-7. List of Additional Sensors Used in Support of Aviation
Sensor Systems
National Lightning Detection Network
Airborne Lightning Detection Sensors
Global Positioning System - Integrated Precipitable Water Measurement System
Integrated Terminal Weather Support System
NOAA’s Forecast Systems Laboratory (FSL) operates a network of global positioning systemreceivers that are used to estimate the integrated precipitable water along the signal path. Again, thisinformation is used to support forecasting and modeling. Finally, the Massachusetts Institute ofTechnology (MIT)/Lincoln Laboratories (LL) has developed a system to integrate the outputs of anumber of sensors (e.g., TDWRS, WSR-88D, LLWAS, ASOS, etc.) in the terminal area. The goal is toprovide a more complete characterization of weather in the terminal area.
4.4 Sensor Descriptions
The following sub-sections provide an overview of sensors currently in use or under development foraviation weather information collection. Each sensor is described in terms of its operating parameters,application, and output.
4.4.1 Airborne Weather Radars
Airborne weather radars are used by pilots to identify areas containing significant precipitation,turbulence (associated with precipitation), and wind shear on take-off and landing. These radars arecommercially available through a number of companies. During this study, literature was obtained forradars manufactured by Rockwell Collins, Honeywell, and Allied Signal. These radars are described inthe next two sections.

72
4.4.1.1 Rockwell Collins Airborne Weather Radar System
Airborne weather radars are designed to provide relative precipitation rate information, precipitation-related turbulence detection, and windshear detection. Rockwell Collins markets two radar systems, theWXR-700 and the TWR-850. The WXR-700 weather radar is flown on major airlines worldwide. TheWXR-700 has captured more than 50% of the major airline market share. The TWR-850 weather radar istargeted for the business and regional airline aircraft. Both radars are solid state radars. The TWR-850supports three antenna sizes: 12, 14, and 18 inches. The TWR-850 detects precipitation at ranges up to300 miles and detects precipitation-related turbulence up to 50 nautical miles. Advertised turbulencedetection is possible for rainfall rates below 0.8 mm/hr. Based on available literature, the TWR-850 doesnot possess a wind shear detection mode for application in the terminal area, whereas, the WXR-700contains both a weather/turbulence detection mode and a wind shear detection mode. Table 4-8 contains alist of system parameters associated with the WXR-700.
Table 4-8. Rockwell Collin’s WXR-700
Rockwell Collins WXR-700
Maximum Weather Detection Range 320 nautical miles (592.6 kilometers)
Windshear Detection
Coverage Area ±30o
Detection Range 5 nautical miles
Automatic Operation Below 2,300 feet (above ground level)
Transmitter/Receiver
Transmit Frequency 9.33 GHz (X-Band)
Transmit Frequency 5.44 GHz (C-Band)
Pulse Repetition Frequency 180 Hz (up to 9,000 Hz)
Pulse Widths 1 to 20 microseconds
Peak Power, X-band 150 watts (nominal)
Peak Power, C-band 200 watts (nominal)
Antenna
Type Flat Plate
Beam Width 3.5o
Gain 34 dB (nominal)
First Side Lobe -31 dB
Scan Angle
Weather/Turbulence Mode ±90o
Windshear ±60o
Scan Rate
Weather/Turbulence Mode 4 seconds
Windshear 3 seconds
Scan Increment 0.25o (nominal)
Elevation Range ±40o
Elevation Rate 45o/second (minimum)
Elevation Increment 0.25o

73
4.4.1.2 Honeywell
Honeywell also produces a line of turbulence detection and weather avoidance radars for the non-commercial transport aircraft. This line of weather radars does not include a wind shear detection mode.The Honeywell radar parameters are given in Table 4-9. Note that the P-880 is the only one of the threeradars with a precipitation-related turbulence detection mode. These radars are not solid state radars.Honeywell also produces a line of multi-function SAR radars for helicopters that incorporates a weathermode. This line of radars is termed the Primus 700 or 701 series.
Table 4-9. Honeywell Family of AWARs
Honeywell
Primus-880 Primus-660 Primus-440
Transmitter Power 10 kW 10 kW 10 kW
Pulse Width 1 or 2 µsec 1 or 2 µsec 1 or 2 µsec
Available Antenna Size 12”, 18”, and 24” 12” and 18” 12”
Sector Scan Angle 60o 60o 60o
Maximum Scan Angle 120o 120o 120o
Tilt Range +15o to –15o +15o to –15o +15o to –15o
Maximum Displayable Range 320 nm 320 nm 320 nm
Modes Weather and Turbulence Weather Weather
4.4.1.3 Allied Signal’s RDR Weather Radar
Allied Signal has recently merged with Honeywell and taken on the Honeywell company name.Allied Signal manufactures the RDR-4B Weather Radar with forward-looking windshear detection. Thisradar was the first to receive FAA/NASA approval for windshear detection. The approval was obtainedon September 1, 1994. Table 4-10 contains a list of system parameters associated with the BDR-4B.
4.4.2 Terminal Doppler Weather Radar (TDWR)
The Federal Aviation Administration (FAA) funded, C-band terminal Doppler weather radar (TDWR)[4-2, 4-3, 4-4, 4-5, 4-6] provides windshear detection (microburst and gust fronts), wind shift prediction,precipitation intensity, and storm motion in the terminal area. These products are used by air trafficcontrollers to provide warnings of hazardous wind shear conditions and as flight planning products by airtraffic supervisors. Table 4-11 contains a list of the parameters associated with the TDWR. TDWRs arelocated at approximately 45 airports within the U.S.
4.4.3 ASR-9 with a Wind Shear Processor
The FAA’s Airport Surveillance Radar (ASR-9) [4-2, 4-3, 4-6, 4-7, 4-8] provides air trafficsurveillance in the terminal area. With the success of the TDWR, a number of the ASR-9s have beenequipped with a weather channel and a signal processor to provide similar functionality as that observedin the TDWR. Table 4-12 contains a list of the ASR-9 parameter set. The beam shape and blockstaggered pulse repetition frequencies of the ASR-9 impose some formidable processing requirements tomeet the performance of the TDWR. These are discussed in [4-8]. There are some 34 ASR-9s locatedthroughout the U.S. that are equipped with a WSP.

74
Table 4-10. Allied Signal’s RDR-4B
Allied Signal RDR-4B
Maximum Weather Detection Range 320 nautical miles (592.6 kilometers)
Windshear Detection
Coverage Area ±40o
Detection Range 5 nautical miles
Automatic Operation Below 2,300 feet (altimeter)
Transmitter/Receiver
Transmit Frequency 9.4 GHz (X-band)
Pulse Repetition Frequency 190 Hz (up to 6,000 Hz)
Pulse Widths 1.5 to 18 microseconds
Peak Power, X-band 125 watts (nominal)
Antenna
Type Flat Plate
Beam Width 3.3o
Gain 35 dB (nominal)
First Side Lobe -30 dB
Scan Angle
Weather/Turbulence Mode ±90o
Windshear ±60o
Scan Rate
Weather/Turbulence Mode 48 degrees/second
Windshear 48 degrees/second
Elevation Range ±43o
Elevation Rate 45o/second (minimum)
4.4.4 Air Route Surveillance Radar
The air route surveillance radars (ARSR) [4-9, 4-10] under the jurisdiction of the air route trafficcontrol centers (ARTCC) provide both en route traffic surveillance in the airspace under the ARTCC’scontrol and coarse precipitation intensity level estimates. Table 4-13 contains a list of operatingparameters for the ARSR-2 [4-10]. The ARSR provides two levels of intensity. Moderate rainfall isdefined for dBZ values between 30-41 dBZ and heavy rainfall is defined by dBZ values above 41 dBZ.The ARSR integrates 12 scans in estimating the dBZ values, which equates to an update rate of144 seconds.

75
Table 4-11. Terminal Doppler Weather Radar Parameters
Terminal Doppler Weather Radar
AntennaBeamwidth < 0.55o Pencil beamGain 50 dBSidelobes Near-in - 27 dB
Far-out - 40 dBTransmitter
Frequency 5.60 - 5.65 GHzPower Peak 250 kW
Average 550 wattsPulsewidth 1.1 µsec 165 m range equivalent
PRF 2000 Hz Maximum
ReceiverLinearity 61 dBNoise Figure 2.3 dBDynamic Range 129 dBSTC 26 dBAGC 42 dBClutter Suppression 55 dB
Range of ObservationRadial Velocity 89 km ±1m/sec (accuracy)Reflectivity 460 km ±1 dB (accuracy)
Table 4-12. Parameters for an ASR-9
ASR-9 with a Wind Shear Processor
Frequency 2.884 GHz (S-band)
Transmitter Type Klystron
Antenna Pattern Cosecant-squared elevation
Peak Power 1.10 MW
Pulse Width 1.0 µsec
Range Sample Spacing 120 meters
Block Staggered Mode 8 pulses @ 940 Hz10 pulses @ 1200 Hz
Maximum Range 60 nmi
Reflectivity Six levels
Clutter Rejection 45 dBSensitivity -108 dBm
Beam Width 6.0o elevation1.3o azimuth
Polarization Vertical/circular
Antenna Gain 34 dB
Scan Rate 12.5 RPM

76
Table 4-13. Air Route Surveillance Radar Parameters
ARSR-2
Beamwidth (az) 1.2o
Beamwidth (el) 3.75o
Frequency (L-band) 1.3 GHz
Peak Transmitted Power 5000 kW
Antenna Fan beam
Scan Rate 5 revs/min
Nominal Range 280 km
Pulse Duration 2 µsec
Pulse Repetition Frequency 360 Hz
4.4.5 Weather Surveillance Radar – 1988 – Doppler
The National Weather Service’s (NWS) weather surveillance radar (WSR) [4-10,4-11,4-12,4-13,4-14,4-15,4-16] was developed under the Next Generation Radar Program (NEXRAD). The developmentphase was completed in 1988 and represented a major milestone in NWS radars. This radar incorporatesa Doppler capability not present in earlier versions (e.g., WSR-74 radar). The new radar’s officialacronym is WSR-88D denoting the type of radar, the year its development phase ended, and the fact thatis possesses a Doppler capability; however, the acronym NEXRAD is also often used to denote this radar.The S-band radar is located at some 158 operational [4-11] sites around the U.S. The WSR-88D providesweather information to a number of different governmental agencies and private companies meeting abroad spectrum of meteorological and hydrological needs. The FAA and air traffic control (ATC)support system are major users of this information. However, because the WSR-88D must supplyinformation to meet the needs of a broad spectrum of users, the products are not necessarily tailored toaviation. Table 4-14 contains parameter values for the WSR-88D, and Table 4-15 contains a list of someof the higher level WSR-88D products.
Table 4-14. WSR-88D System Parameters
WRS-88D
System ParametersFrequency 2.7 to 3.0 GHz (S-band)
Antenna Type Center-fed parabolic dish
Circular Reflector Diameter 8.5 mPolarization Circular: RH transmit LH receive
Beamwidth (one-way) 0.89o at 2.7 GHz0.95o at 3.0 GHz
Gain 45.5 dB @ 2.8 GHz
First Sidelobe Level -29 dB
Steerability 360o (Az), -1o to +45o (El)
Rotation Rate (max) 36o/sec
Peak Power Output 750 kW
Pulse Widths 1.57 µsec and 4.5 µsec

77
Table 4-14. WSR-88D System Parameters
WRS-88D
Pulse Repetition Frequency 318-452 Hz (long pulse)318-1304 Hz (short pulse)
Signal ProcessingBasic Products Reflectivity, mean radial velocity,
Doppler spectral width
Algorithm Pulse-pair
Accuracy Reflectivity – 1 dBVelocity and width – 1m/sec
Number of Pulses Averaged 6 to 64 (reflectivity)40 to 200 (velocity and width)
Range Resolution 1 km (reflectivity)0.25 km (velocity and width)
Azimuth Resolution 1o
Table 4-15. WSR-88D Weather Products
WSR-88D Products
Precipitation
1 and 3 hour accumulation
Storm total accumulation
Storms
Storm tracks
Storm structure
Hail
Echo Tops
Vertically integrated liquid
Severe weather probability
Mesocyclone
Tornado
Velocity azimuth display
Velocity azimuth display (VCO) wind profile
Combined shear
Turbulence
4.4.6 NOAA Profiler Network
The National Oceanic and Atmospheric Administration currently oversees a network of wind profilers.Wind profilers [4-17, 4-18] provide clear air horizontal wind speed and direction information as afunction of height. The reflective properties of clear air are due to fluctuations in the refractive indexassociated with relatively large eddies which dissipate slowly [4-10, page 292]. The network consists ofthirty-four wind profilers located at the sites noted in Figure 4-1. The profilers are phased array radarsoperating at 404.37 MHz. The radars are capable of generating five beams: one vertically oriented, and

78
four beams that are positioned 15o from vertical in the north, south, east, and west directions. The beamsare positioned to derive horizontal wind speed information from radial wind speed components alongeach beam. The profilers measure wind speeds at heights up to 16.25 kilometers (53,300 feet). Thisincludes the majority of the troposphere, and for this reason, the profilers are often denoted as“tropospheric wind profilers.” The winds are measured every six minutes. Average wind profiles aregenerated every hour at 500 meter increments in elevation and with an accuracy of 1 m/s. Table 4-16contains specifications for the Lockheed Martin Wind and Temperature Profiler used in the NOAAprofiler network. The wind profiles are used to improve the accuracy of forecasts and to improve flightsafety and fuel economy when applied to aviation.
Table 4-16. NOAA Wind Profiler
NOAA Profiler NetworkLockheed Martin Wind and Temperature Profiler
Maximum data height 16.25 km (53,300 feet)
Minimum data height 0.5 km (1640 feet)
Pulse width (compressed) 1.67 or 6.67 microseconds
Vertical resolution cell 250 or 1000 meters
Pulse repetition interval 100 or 153 microseconds
Frequency range 400 – 500 MHz (404.37 MHz)(UHF)
Peak power 16 kilowatts
Average power 2200 watts
Antenna type Coaxial collinear array
Antenna gain > 32 dB
Antenna sidelobes - 30 to – 40 dB
Beamwidth 6 degrees
Number of beams 5 beams
Beam orientation 1 vertical, 4 in the N, S, E, and Wdirections at 15o from vertical
Maximum horizontal wind 200 mph
Maximum vertical wind 50 mph
In general, clear air reflectivity is higher at the lower altitudes. Systems designed for lower altitudemeasurements, (e.g., lower tropospheric and boundary layer measurements), therefore, require less powerand can in general operate at higher frequencies. Strauch [4-17] describes a 915 MHz wind profiler thatwas installed at the Denver Stapleton Airport to monitor wind conditions in the terminal area. Windprofilers, however, have not made their way into the aviation sensor suite supporting the terminal area.

79
Figure 4-1. Locations of NWPN and RASS Sites
4.4.7 Radio Acoustic Sounding System
The speed of sound is related to virtual temperature through the following equation
2
047.20
= a
v
cT
where ca is the speed of sound and Tv is the virtual temperature. Radio Acoustic Sounding Systems(RASS) use coherent radar to determine the speed of acoustic wavefronts and thereby estimate thetemperature of the atmosphere as function of altitude. The reflective properties of clear air are enhancedby the irregularities in the index of refraction induced by the acoustic wave. The scattering due toirregularities in the index of refraction is termed the Bragg effect. Reflectivity is maximized for the casewhere the acoustic wavelength is matched to half of the radar wavelength. May [4-19] describes anumber of RASS systems that were tested during 1988. The system parameters are given in Table 4-17.The 404.37 MHz system is similar to that employed in the profiler network. As shown in Figure 4-1, anumber of the profile network sites are also instrumented with a RASS. Note that in Table 4-17, themaximum altitude increases with decreasing frequency, but the minimum altitude also increases.
4.4.8 Boundary Layer Profiler Network
The boundary layer profiler network [4-20,4-21] is a network of some 65 boundary layer profilersoperated by some 30 different agencies. The profilers are small, low-cost UHF Doppler radars providinghorizontal wind profiles up to 3 kilometers above ground level. The profilers update wind estimates onan hourly basis or in some cases every 10 minutes. Figure 4-2 shows the location of the 65 profilers. Thered (or dark colored) circles indicate profilers that are routinely providing updates while the blue (or lightcolored) circles denote profilers that have a more intermittent update rate.

80
Table 4-17. Example Wind Profilers
Site Platteville Erie Denver Boulder
Radar
Frequency 49.8 MHz 404.37 MHz 915 MHz 915 MHz
Wavelength 6.0 m 0.74714 m 0.3 m 0.3 m
Antenna Size 10,000 m2 25 m2 100 m2 4m2
Beamwidth (one way) 3o 7.8o 2o 9o
Range Resolution 300 m 150 m 150 m 150 m
Mean Power 200 W 30 W 100 W 3 W
Update Rate 1 min. 1 min. 1 min. 1 min.
Acoustic
Frequency 110 Hz 900 Hz 2000 Hz 2000 Hz
Beamwidth (one way) 60o 18o 8o 9o
Acoustic Power 50 W 5 W 5 W 5 W
RASS Coverage
Minimum Altitude 2.1 km 400 m 200 m 120 m
Maximum Altitude 5-9 km 1.5 – 2.5 km 0.7 – 1.5 km 0.6 – 1.0 km
4.4.9 Terminal Area Surveillance System
The terminal area surveillance system (TASS) program [4-22,4-23,4-24,4-25,4-26] has as its missionthe development of the next generation terminal area surveillance radar which will incorporate thefunctions currently performed by the ASR-9 and TDWR radars. The single radar will incorporate bothaircraft surveillance and weather prediction and detection functions. The TASS program has focused onan electronically scanned system with multiple faces. Table 4-18 contains a list of the proposed TASSweather mode capabilities.
Figure 4-2. Sites containing boundary layer profilers

81
Table 4-18. A List of the Proposed TASS Weather Mode Capabilities
Proposed TASS Weather Capabilities
Microburst detection
Microburst with intensity returns above –10 dBZ
Detection within 12 km of the airport
Microburst predictive products (ITWS derived)
Microburst alert trend – microburst projection
Microburst strength
Microburst duration
Microburst onset prediction (10 minutes)
Weather impacted airspace detection
Six level intensity map
Individual storm identification
Hail and icing (freezing level) detection
Tornado detection
Snow detection
Freezing rain aloft
Gridded reflectivity
Gust front detection and prediction
Above –10 dBZ and 20 minute lead time
Wind shift line detection
Wind detection
Approach/departure corridor winds
Terminal winds
Vertical wind shear
Gridded winds
Weather impacted airspace prediction (ITWS derived)
Storm motion
Storm duration
Storm strength
4.4.10 Unisys Microburst Prediction Radar
In 1995, Unisys reported [4-27] that they had developed a low cost X-band weather surveillance radar.The system was advertised to provide warnings of hazardous microburst conditions 2 to 4 minutes inadvance. The radar was to be sited at airports providing a coverage area out to a 10 km radius. Theadvertised price was $500K to $700K including installation. Based on a survey of the current literature,these radars have not made their way into the official U.S. air traffic control weather support system;however, they may have been used internationally. The parameters associated with the microburstprediction radar (MPR) are given in Table 4-19 and Table 4-20.

82
Table 4-19. Antenna Parameters for the UNISYS Microburst Prediction Radar
UNISYS Microburst Prediction Radar
Parameter Prediction Beam Surface Beam
Antenna Type Linear Phased Array Flat Plate (slot dipole radiators)
Number of Beams Six Pairs (12 Beams) Single Beam
Steering:ElevationAzimuth
Electrical, 10o – 70o
MechanicalFixed, 1.8o
Mechanical
Beamwidth:ElevationAzimuth
6.5o – 10.2o
7.0o3.2o
3.2o
Gain 28 – 23 dBi 37 dBi
Table 4-20. System Parameters for the UNISYS Microburst Prediction Radar
UNISYS MPR
Frequency 9.345 GHz
Peak Power 60 Watts
PRF 7092 Hz
Pulse Width 1.25 µsec
Range Resolution 225 meters
Unambiguous Range 21 km
Unambiguous Velocity ±56 m/s
4.4.11 Weather Mode for the SPY-1 Radar
Lockheed Martin (LM) in Moorestown, New Jersey has developed a weather processor that providesa non-intrusive weather capability to the SPY-1 radar. Land-based experiments have been validatedagainst data obtained from a WSR-88D. A coherent pulsed mode was added to the SPY-1 radar toprovide Doppler information (mean radial velocity and spectrum width). A 3 pulse, pulse-pair approachis used in estimating mean radial velocity and spectral widths. The SPY-1 radar provides enhanced rangeand az/el resolution over a WSR-88D. A combination of enhanced resolution and multi-channelfrequency agility permits an averaging in range, cross range, and frequency, over a single pulse, to reducethe measurement variance as compared to multiple pulses required in the WSR-88D. Field tests aboardan AEGIS cruiser were scheduled for 1999. SPY-1 radar parameters were not available for inclusion inthis report.
4.4.12 Bistatic Multiple-Doppler Network
A single transmitter bistatic dual Doppler radar network has been proposed by Wurman [4-28,4-29] asa low-cost method for obtaining wind field vector information. A single transmitter and a low-costbistatic receiver were deployed in Boulder, Colorado in 1993. Tests showed favorable results when

83
compared to a Dual-Doppler system located in the area. Wurman notes that the bistatic receivers have anestimated cost of less than $40,000.
4.4.13 Dual Doppler Radars
Dual Doppler radars [4-30] provide the capability to estimate wind field vectors as opposed toestimating only the radial component of the wind. Research systems have been deployed such as theCHILL and Pawnee radars owned by Colorado State University [4-31,4-32]. However, dual Dopplerradar technology is currently not applied in aviation weather applications, primarily due to cost.
4.4.14 Dual Frequency Radars
Under Rayleigh scattering conditions, (hydrometers with diameters much shorter than the radarwavelength), scattering and attenuation are a function of frequency. A single radar capable of operatingover a wide frequency range or two radars with different center frequencies can be applied underRayleigh conditions to estimate liquid water content [4-33,4-34]. Vivekanandan [4-33] shows somepromising results using data taken with X-band and Ka-band radars, but further investigation is requiredsince regions of non-Rayleigh scattering introduce errors in the process.
4.4.15 Polarization Diverse Radars
The current set of FAA and NWS radars described in this report employ a uniform polarization.However, research has shown that polarization diversity (e.g., the ability to alternate pulses withorthogonal polarizations) [4-10,4-30] has the potential benefit of increasing the accuracy of rain rateestimates and provides the additional capability to discriminate between hail, heavy rain, and mixed phasehydrometers.
4.4.16 Satellite Sensors
Weather sensors located on satellites provide global coverage, which is important for aviation, becauseairline companies and regulation entities have geographical scales of operation that span much of theglobe. Weather data from satellites come in two basic forms: multispectral imagery and sounding data.Visible-light imagery is confined to local daylight hours, while infrared sensing can be performedanytime. Infrared imagery is used to find cloud top temperatures, while soundings are used to developvertical profiles of atmospheric temperature and water vapor concentration. Satellite data products areused as inputs for monitoring, modeling, and forecasting weather on a global scale [4-10].
Satellites are especially useful for tracking large-scale weather phenomena such as tropical cyclonesand movements of fronts. They are less applicable for tracking terminal-area hazards because oflimitations in their resolution. For example, the GOES have nominal resolutions of 1 km in the visibleband, 8 km in the infrared band, and 14 km for soundings. In addition, the update rate of satellite data isusually 30 - 90 minutes, which is too slow to monitor evolving hazards in the terminal areas.
In spite of these limitations, a great deal of progress has been made in the satellite data reductionprocesses used to identify hazards, and this work is ongoing. For example, the National Oceanic andAtmospheric Administration (NOAA) routinely monitors hazards and disasters worldwide by analyzingimage data from GOES, GMS, METEOSAT, and NOAA 12, 14, and 15. Daily reports are available by e-mail as a subscription, or at their web site [4-35]. The following hazard categories are available:

84
• dust
• fires
• floods
• ice
• severe weather
• snow
• storms
• unique
• volcanic
As an example of aviation-related weather information obtained from satellites, the NOAA websitecontains an image showing fog in the San Francisco Bay area on December 28, 1998. According to thecaption, this fog persisted for days, causing delays and cancellations of many flights. The update rate ofthe NOAA information is probably too slow for aviation purposes, but it does serve to illustrate the kindsof satellite-based hazard warning data that might be available in future operational systems.
Volcanoes erupt at unpredictable times and locations around the globe. Many volcanoes are in remoteregions. For these regions, satellites are probably the only technology that can monitor the entire globalvolcanic hazard. There are monitoring programs in place in NASA [4-36,4-37], and there are also on-going research efforts to improve the forecasting of eruptions.
One NASA program is known as the Interdisciplinary Science (IDS) Volcanology Team, which is aproject activity of the Earth Observing System (EOS). The team, centered at the University of Hawaii, isprimarily concerned with the environmental effects of volcanoes. They are developing new methods,models, and algorithms to monitor volcanoes with satellite sensors. This work may find futureapplications in monitoring potential aviation hazards associated with volcanic eruptions.
The GOES Project Volcano Watch is a collection of satellite images, including animations, ofinteresting volcanic events captured by the GOES weather satellites. As such, it does not currentlyprovide useful warnings to the aviation community, but it does serve as a way to explore the utility of thistype of technology.
The use of GOES imagery specifically for monitoring volcanic ash as an aviation hazard is an activeresearch area. F. R. Mosher [4-38], of the Aviation Weather Center in Kansas City, Missouri, recentlypresented a new ash detection algorithm that produces an image product from the GOES visible channeland three of its infrared channels. Mosher demonstrated the ability of his approach to track ash cloudswith data from the recent Montserrat eruption as well as a small eruption of Popocatepetl, near MexicoCity. Mosher’s algorithm provides clear pictures of ash clouds.
Erupting volcanoes emit a great deal of sulfur dioxide in addition to dust and small pieces of rock. Thedust and rock settle out of the atmosphere quickly and so, in general, do not present a hazard to aviation.At aircraft altitudes, the phenomenon known as “ash” is actually hydrated droplets of sulfur dioxide.Sulfur dioxide has spectral characteristics somewhat like ozone, so the Total Ozone MappingSpectrometer (TOMS) is capable of detecting it. Krueger and others [4-39,4-40] have investigated thistechnique.

85
Future capabilities for monitoring volcanic eruptions using next-generation satellites have also beenaddressed by Krueger [4-41]. Future multispectral imaging satellites may provide a capability to predicteruptions in advance by detecting a plume of sulfur dioxide that is emitted just before the eruption.
In summary, satellite sensors already provide some capability to monitor the volcanic ash hazard andthere are significant ongoing efforts to improve this capability. Great improvements are expected in thenext few years. It will then become increasingly important to develop mechanisms for transmitting real-time volcanic ash hazard data to the aviation community.
4.4.17 Runway Visual Range Sensors
4.4.17.1 Introduction
“Adequate” visibility is crucial to landing operations. The level of visibility must be measured andquantified for pilots and air traffic controllers. The measure of visibility relevant to airport operations isrunway visual range (RVR), which is defined as the distance a pilot can see along a runway from theapproach end. The earliest method of estimating RVR was human observation. Control tower personnelwould simply look for fixed structures at known distances in the airport clearing. This method provides arough idea of visibility, but in general airport structures are not ideal visibility targets, and their distancesfrom the tower are arbitrary, so this approach does not lead to a good quantitative estimate over the fullrange of relevant RVR values.
4.4.17.2 Transmissometers
The first instruments developed for measuring RVR were transmissometers [4-10]. The weatherphenomena that reduce runway visibility, such as fog and precipitation, are sometimes highly variable inboth time and space. For this reason, each runway at major airports may be equipped with an RVRinstrument near its midpoint, and time averaging is used to remove short-term time variations in themeasured values.
A transmissometer has two ends: a projector, which transmits a collimated beam of light, and adetector, which measures the intensity of the light at some distance, generally in the range of 75 to 150 m.The measured transmittance τ is defined as
0/ II=τ , (4-1)
where I is the light intensity in obscured conditions and 0I is the light intensity in clear conditions. The
range of values of τ is from 0 to 1. The value of τ only characterizes the optical path of thetransmissometer, so it is necessary to derive a more general quantity from the transmissometer data. Thisquantity is the atmospheric extinction coefficient, which accounts for reductions in the intensity of thedetected light by both absorption and scattering. The extinction coefficient is related to the measuredtransmittance through the Beer-Lambert law,
xe ατ −= (4-2)
where τ is the transmittance, e is the base of the natural logarithms, α is the extinction coefficient, andx is the distance between the projector and the detector. By taking the logarithm of both sides of equation(2), we can derive the relation

86
( ) x/ln τα −= . (4-3)
The extinction coefficient α is related to human visual range. The earliest, and simplest, relationshipwas developed by Koschmieder [4-42] who studied the ability of observers to detect black objects againstthe horizon sky in a sea coast environment. Koschmieder noted that, as the range was increased, thecontrast between the black objects and the sky decreased, until finally the objects were no longerperceptible. Koschmieder found that the smallest contrast that could be perceived by the observers wastwo percent of the contrast at zero range. The natural logarithm of 0.02 is -3.91, so putting this value intothe equation above and solving for x we have Koschmieder’s Relation
α/91.3=x . (4-4)
This is the basic relation between the atmospheric extinction coefficient and human visual range. Forexample, if the measured value of α is 1/km, equation (3-4) predicts that the visual range will be3.91 km. In practice, several corrections are applied when calculating RVR to allow for different types oftargets and the particular lighting conditions, including the brightness of runway lights at night [4-10].
Transmissometers have found widespread application, and they are in operation at many airports.However, they have several disadvantages as instruments for measuring the atmospheric extinctioncoefficient α .
The detector’s maximum signal occurs in clear conditions. As α increases (worsening visibility), thedetector signal becomes smaller. At some point it becomes equal to the system’s electronic noise level.As α increases beyond this point, no further change in the transmissometer’s output is possible. Thiscauses a dynamic range problem.
Several phenomena unrelated to α can cause the detector signal to decrease. Among these are dirt onthe optical windows of the projector and detector, changes in the optical alignment of the projector anddetector, changes in the output of the projector bulb, and changes in the detector sensitivity. For thesereasons, transmissometers require frequent maintenance and calibration.
Installation of a transmissometer requires the construction of two steel platforms and the installation ofpower and signal cables to both.
4.4.17.3 Forward Scatterometers
A different type of RVR sensor known as a forward scatterometer was developed to overcome theseproblems. The forward scatterometer has a transmitter and a receiver, but they are both mounted on twoarms of the same instrument. The intersection of the transmitted light beam and the receiver field of viewdefines a region in space known as the sample volume. The receiver is off-axis relative to the transmittedbeam, so when the air is clear, no light is received. When particles, such as fog droplets, enter the samplevolume, light is scattered into the receiver. An electronic signal is generated, and the strength of theelectronic signal is related to the density of the particles in the scattering volume, which is in turn relatedto the atmospheric extinction coefficient.
The amount of light scattered by a particle depends on its size. This could, in principle, be a problemfor scatterometer calibration, because obscuring particles at airports range in size from 1 µ m or less for
fog droplets to several mm for large raindrops. However, choosing a scattering angle where the scattering

87
by various sizes of droplets is nearly the same minimizes this problem. All scatterometers are designed inthis way.
A scatterometer has a much greater dynamic range than a transmissometer because its receiver signalis zero in clear conditions and increases as visibility worsens. Dirt on the optical windows will cause acalibration error, but it will not cause an erroneous reading during clear conditions. Installation andcalibration of a scatterometer are both facilitated by the fact that it is a single instrument, mounted on onepole. For these reasons, forward scatterometers have become the airport visibility instrument of choice.They are used in the AWOS and ASOS systems.
4.4.17.4 New Generation RVR
As a part of the FAA’s Aviation System Capital Investment Plan, a new generation RVR system isbeing acquired and deployed, and a pre-planned product improvement will be conducted. The purpose ispartly to replace obsolete fielded systems that are becoming difficult to maintain, but the larger purpose isto introduce improved technology.
The new generation sensor determines RVR in the same way as the previous sensors (i.e., frommeasured visibility, background luminance, and runway light intensity), but it has been designed andproven to perform over the full range of instrument meteorological weather conditions, including fog,rain, freezing rain and snow. It measures RVR from 6,500 feet to 0 feet.
4.4.18 Wake Vortex Detection
4.4.18.1 Introduction
Every airplane generates a pair of vortices, which may be visualized as counter-rotating “horizontaltornadoes.” The vortices are generally invisible and can possess sufficient air motion to seriously affectthe trajectories of aircraft flying into them. This is especially hazardous during landings when aircraft areoperating at low speeds close to the ground. Small airplanes encountering vortices in the wake of largeairplanes have been flipped upside down, causing fatal accidents. Therefore, wake vortices are a potentialaviation hazard.
The diameter of a typical wake vortex is tens of meters, and they have been observed to persist atairfields for up to 3 minutes after the landing of a large aircraft. The velocity fields in the vortices extendbeyond their separation, so they affect each other. Each vortex pushes its neighbor down, so the pairdescends toward the ground. Descent rates are in the range 1-2 m/s. Interaction with the ground pushesthe vortices apart, but then secondary vortices can be generated that cause the original ones to rise.Generation of secondary vortices is a nonlinear effect, so it is sensitive to details of the local meteorologyand even terrain conditions.
When vortices rise after an encounter with the ground, they may drift to an adjacent runway if acrosswind is present. This is a concern at airports with parallel runways. In the U.S., runways must be3,400 feet apart for independent operation. If parallel runways are closer than 3400 feet, arrivals anddepartures must be synchronized. These rules are due, in part, to the fact that vortices generated at onerunway may drift to an adjacent one.
The phenomenon of wake vortices is well known to pilots, and the precautions that are used to avoidthem depend on flight conditions. Under VFR conditions, pilots have the primary responsibility for

88
maintaining a safe spacing during landings. Because wake vortices move downward, pilots are trained toavoid them by not flying under the glide path of a leading aircraft.
During instrument landing conditions, the controller determines the aircraft spacing. The FAAmandates separations based on size according to three categories: heavy aircraft, such as DC-10s and747s, large aircraft, in a range from 757s to Lear jets, and small aircraft, such as Cessnas. The mandatedseparation is six nautical miles for a small airplane behind a heavy airplane. At typical landing speeds,this corresponds to about three minutes, which is the longest time that vortices have been observed topersist near the ground. Current procedures are therefore based on a worst-case scenario, because real-time information on the wake vortex hazard is not available to controllers.
If the actual behavior of wake vortices were known in real time, controllers could reduce aircraftspacing during some periods of operation without compromising safety. This would increase airportcapacity. This is the primary purpose of research on wake vortex detection: to increase airport landingcapacity during instrument landing conditions.
4.4.18.2 Aircraft Vortex Spacing System
Work on wake vortex detection is the U.S. is under the umbrella of the NASA Aircraft Vortex SpacingSystem (AVOSS) program. Information on the program is available on the World Wide Web athttp://avsp.larc.nasa.gov/avoss/avoss.html. AVOSS is an element of NASA’s Terminal Area ProductivityReduced Spacing Operation Research Program, and it involves both the Langley and the Ames ResearchCenters. The goal of AVOSS is to provide Air Traffic Control (ATC) with a means to reduce spacingduring instrument operations when the current weather conditions are such that wake vortices havedissipated or moved outside the terminal area and are no longer a threat. The full benefit of AVOSS isexpected when it is interfaced to advanced ATC automation such as the Center-TRACON AutomationSystem (CTAS).
AVOSS has three subsystems: Weather, Predictor, and Wake Sensor. The Weather subsystem isunusual in that atmospheric conditions from the surface to the top of the instrument approach path areused, rather than only surface wind. The predictor subsystem uses the weather information to predict thetime required for the vortices of approaching aircraft to move out of the approach corridor or to decay.The wake sensor provides an independent measure of actual vortex behavior. The information from thethree subsystems is integrated and provided to ATC as a separation matrix. The values are conservative.Human factors research is being conducted to optimize the presentation of AVOSS information tocontrollers.
AVOSS is being coordinated closely with CTAS and with the FAA’s Integrated Terminal WeatherSystem (ITWS). Current activities are focused on development of a prototype AVOSS for the Dallas-FortWorth (DFW) International Airport. The goal is to do a demonstration at DFW in the year 2000 with allsubsystems operating live. AVOSS will not actually change the separation of aircraft during thedemonstration; airport capacity gains will be evaluated post-experiment using simulation tools at NASAAmes Research Center.
The development of AVOSS requires a large team comprising numerous disciplines. The current teamincludes the following participants:
• Boeing Commercial Airplane Company
• Dallas-Fort Worth International Airport

89
• FAA R&D Field Office at Langley, VA
• MIT Lincoln Laboratory
• Memphis International Airport
• NASA Ames Research Center
• NASA Langley Research Center
• North Carolina State University
• NorthWest Research Associates
• Transport Canada
• Volpe National Transportation Systems Center
Three major types of sensors have been used in the AVOSS program: MIT Lincoln Laboratory’scontinuous wave (CW) laser radar, coherent Doppler lidars built by Coherent Technologies, Inc. (CTI),and the Volpe Center’s Ground Wind Vortex Sensing System (GWVSS). Although these sensors havebeen successfully used in demonstrations, it should be noted that laser-based sensors (laser radar andlidar) will have a limited range in weather conditions with reduced visibility.
The MIT laser radar, described by Su [4-43], is an infrared Doppler system, but it is not a conventionallidar. It is based on a CW laser operating at 10.6 µ m with an output power of 20 Watts. The system is
not range gated, so the scattering volume must be defined geometrically. The laser beam is focused in aregion of interest, at any range from 12 to 300 m, and a typical scattering volume length is about 6 metersat a range of 100 m. The infrared laser light does not scatter significantly from air molecules; it isscattered by aerosols entrained in the moving air. MIT researchers have found that airport environmentshave sufficient aerosol concentrations to make this approach reliable. The local oscillator is offset infrequency by 10 MHz, and a Doppler shift of 1 MHz corresponds to a wind velocity of 5 m/s.
The MIT system was used in a demonstration at Memphis International Airport (among others). Themain objective of this work was to determine how wake vortex behavior is affected by local meteorology.The system has a scanning capability, and it is operated under computer control to recognize vortices andtrack them. MIT researchers have used the system to investigate vortices in three different scenarios,which they refer to as “vortex regimes”:
• Out-of-ground (under the approach path, looking up)
• Near-ground (off to the side, closer to touchdown)
• Touch-down (off to the side)
The MIT system is currently being used as a research tool. Because it uses a CW laser, it is simplerthan a pulsed, range-gated lidar.
CTI has built a series of coherent, wind-sensing Doppler lidars operating at wavelengths near 2 µ m.Information on CTI can be obtained at www.ctilidar.com. Performance predictions for coherent 2µ m
lidars were summarized by Hannon [4-44,4-45]. CTI lidars have been used for a variety of applications,and CTI recently completed development of a transceiver specifically for wake vortex detection andtracking under Phase II SBIR funding. The laser pulse energy and duration are nominally 7 mJ and 400
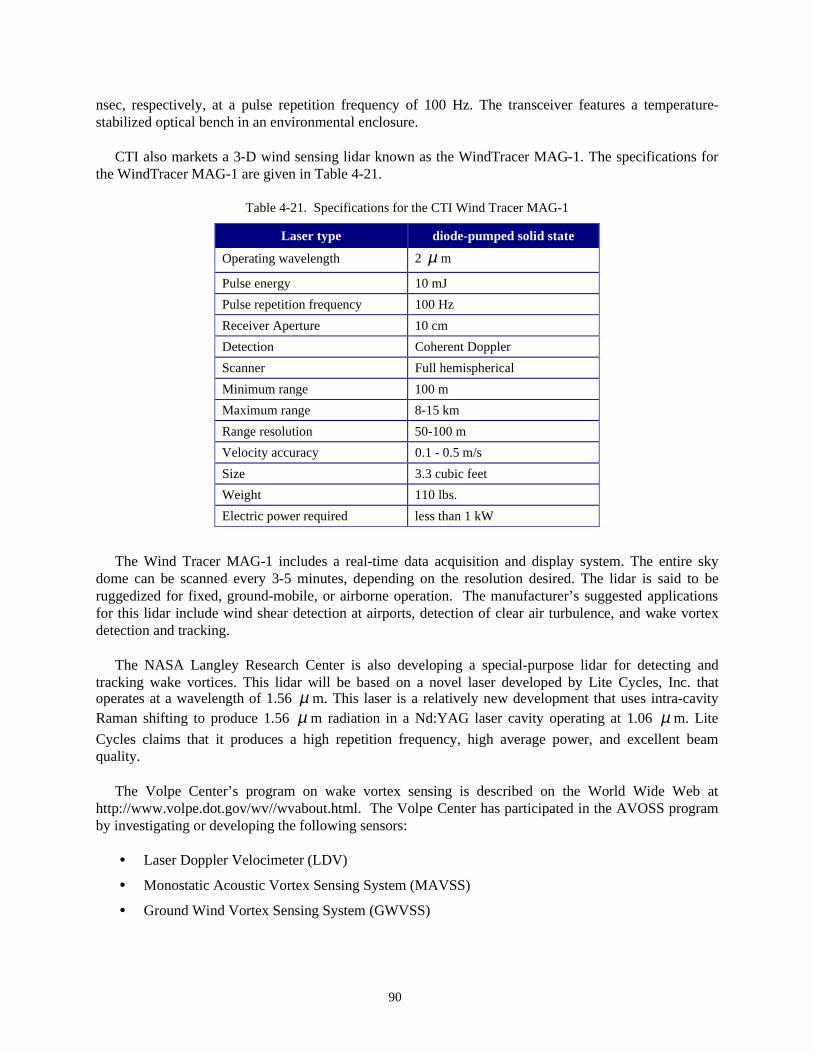
90
nsec, respectively, at a pulse repetition frequency of 100 Hz. The transceiver features a temperature-stabilized optical bench in an environmental enclosure.
CTI also markets a 3-D wind sensing lidar known as the WindTracer MAG-1. The specifications forthe WindTracer MAG-1 are given in Table 4-21.
Table 4-21. Specifications for the CTI Wind Tracer MAG-1
Laser type diode-pumped solid state
Operating wavelength 2 µ m
Pulse energy 10 mJ
Pulse repetition frequency 100 Hz
Receiver Aperture 10 cm
Detection Coherent Doppler
Scanner Full hemispherical
Minimum range 100 m
Maximum range 8-15 km
Range resolution 50-100 m
Velocity accuracy 0.1 - 0.5 m/s
Size 3.3 cubic feet
Weight 110 lbs.
Electric power required less than 1 kW
The Wind Tracer MAG-1 includes a real-time data acquisition and display system. The entire skydome can be scanned every 3-5 minutes, depending on the resolution desired. The lidar is said to beruggedized for fixed, ground-mobile, or airborne operation. The manufacturer’s suggested applicationsfor this lidar include wind shear detection at airports, detection of clear air turbulence, and wake vortexdetection and tracking.
The NASA Langley Research Center is also developing a special-purpose lidar for detecting andtracking wake vortices. This lidar will be based on a novel laser developed by Lite Cycles, Inc. thatoperates at a wavelength of 1.56 µ m. This laser is a relatively new development that uses intra-cavityRaman shifting to produce 1.56 µ m radiation in a Nd:YAG laser cavity operating at 1.06 µ m. Lite
Cycles claims that it produces a high repetition frequency, high average power, and excellent beamquality.
The Volpe Center’s program on wake vortex sensing is described on the World Wide Web athttp://www.volpe.dot.gov/wv//wvabout.html. The Volpe Center has participated in the AVOSS programby investigating or developing the following sensors:
• Laser Doppler Velocimeter (LDV)
• Monostatic Acoustic Vortex Sensing System (MAVSS)
• Ground Wind Vortex Sensing System (GWVSS)

91
In addition, the Volpe Center has conducted extensive test programs at airports, includingmeasurement and classification of vortices generated by rotorcraft. During AVOSS work at MemphisInternational airport, GWVSS was set up for unattended data collection.
The Surveillance and Sensors Division of the Volpe Center maintains the most complete existingsource of information on wake vortices, in the form of a web-based annotated bibliography. This isavailable at http://www.volpe.dot.gov/ssd/. The bibliography is searchable by keywords.
4.4.19 ASOS/AWOS
Automated Weather Observing Systems (AWOS) [4-10] support measurements of meteorologicalconditions in the terminal area. The AWOS system consists of a set of ground based sensors that provideboth in situ and remote sensing. The AWOS system is available in several versions each with its ownconfiguration of sensors. Table 4-22 provides a list of the measurements provided under eachconfiguration. Qualimetrics, Inc. (www.qualimetrics.com) is an FAA approved supplier of AWOSsystems. The Automated Surface Observation System (ASOS) is an upgrade to the AWOS system.ASOS sensors provide similar information including cloud height, visibility, precipitation identification,freezing rain, pressure, ambient temperature, dew point, wind speed and direction, and rainfallaccumulation.
Table 4-22. A List of Measurements Derived from an AWOS System
AWOS I AWOS II AWOS III AWOS III-P AWOS III-T AWOS-P-T
Wind Speed √ √ √ √ √ √Wind Gust √ √ √ √ √ √Wind Direction √ √ √ √ √ √Variable WindDirection
√ √ √ √ √ √
Temperature √ √ √ √ √ √Dew Point √ √ √ √ √ √Altimeter Setting √ √ √ √ √ √Density Altitude √ √ √ √ √ √Visibility √ √ √ √ √VariableVisibility
√ √ √ √ √
Precipitation √ √ √ √ √Day/Night √ √ √ √ √Sky Condition √ √ √ √Cloud Height √ √ √ √Cloud Type √ √ √ √Present Weather √ √PrecipitationDiscrimination
√
LightningDetection
√ √
4.4.20 Low Level Wind Shear Alert System
The low level wind shear alert system (LLWAS) consists of anemometers placed on poles (as high as150 feet above the surface) which are located around the runway environment [4-10]. The sensors

92
provide input to a processor that is used to detect wind shear conditions. The LLWAS was originallylocated at 110 airports. These systems are being phased out and are being replaced by an upgradedsystem termed the LLWAS-NE (network expansion) which will be located at 39 airports.
4.4.21 Meteorological Data Collection and Reporting System
The aircraft addressing and reporting system (ACARS) provides a digital data link on whichappropriately equipped aircraft can provide meteorological reports. These reports are used as inputs toweather prediction models. This subsystem within ACARS is termed the meteorological data collectionand reporting system (MDCRS) [4-20]. The current system reports the time of observation,latitude/longitude, flight level, temperature, and wind speed/direction. The reports are issued every 7.5minutes during cruise and every 2,000 feet during ascent and descent. The number of participatingaircraft ranges from 500 to 600. The accuracy of the measurements is: < 0.5o C RMS temperature errorand < 3 m/s RMS wind vector error. An effort is currently under way to include a water vapor sensingsystem as a part of the MDCRS report. The sensors provide relative humidity measurements. BothUnited Parcel Services (UPS) and American Airlines have participated in this pilot program. Efforts areunder way to equip additional aircraft with relative humidity sensors.
4.4.22 Radiosonde
Radiosondes are instrumented balloons that are released by the NWS at 0000Z and 1200Z each day.The radiosondes provide temperature and relative humidity information as a function of pressure altitude[4-46]. The temperature and humidity sensors are electrical devices whose resistive properties change asa function of temperature and humidity, respectively. Winds aloft information is also made available bytracking the radiosonde using a radar or a radio direction finder. The instrument packages currently usedby the NWS are available from Vaisala (RS-80-57H), Sippican (VIZ-B2), and Sippican Loran-Microsondes. Radiosondes transmit data to ground-based telemetry stations for collection and furtherprocessing. Table 4-23 contains specifications for the Vaisala RS80 [4-47]. The NWS is in the processof implementing a program to upgrade the current radiosonde system to include GPS for tracking and thecapability to support high resolution data collection [4-48].
4.4.23 Lightning Detection Systems
Lightning detectors have been developed both for ground based and airborne sensor applications. Thenext two sub-sections describe two such systems.
4.4.23.1 National Lightning Detection Network
The National Lightning Detection Network (NLDN) is operated by Global Atmospherics, Inc., inTucson, Arizona. The NLDN [4-49,4-50] supplies cloud-to-ground lightning strike information includingtime, location, polarity, and amplitude. This information is provided to the electric utility industry, theNational Weather Service, commercial users, and researchers. The network consists of approximately105 ground based sensors located throughout the continental United States. Lightning strike informationis collected by the individual sensors and linked via a satellite to the Network Control Center in Tucson.The information is then processed and distributed to the user community in near real time. GlobalAtmospherics advertises an IMPACT (Improved Accuracy from Combined Technology) enhancedsensitivity (ES) sensor with nominal operating ranges out to 540 kilometers. The IMPACT ES combinesdirection finding and time-of-arrival technology for improved location accuracy and detection

93
performance. Global Atmospherics also markets a number of products for cloud to ground lightningdetection in a more localized area (detection ranges out to 30 nautical miles).
Table 4-23. Sub-System Parameters for the VAISALA RS80 Radiosonde
VAISALA RS80 Technical Specifications
Pressure Sensor BAROCAP Capacitive aneroid
Measurement range 1060 hPa to 3 hPa (mb)
Resolution 0.1 hPa
Reproducibility 0.5 hPa
Repeatability of Calibration 0.5 hPa
Temperature Sensor THERMOCAP Capacitive bead
Measurement range +60oC to –90oC
Resolution 0.1oC
Reproducibility 0.2oC up to 50 hPa, 0.3oC for 50 - 15 hPa, 0.4oC above 15hPa level
Repeatability of Calibration 0.2oC
Humidity Sensor HUMICAP Thin film capacitor
Measurement range 0 to 100% RH
Resolution 1 % RH
Reproducibility < 3% RH
Repeatability of Calibration 2% RH
4.4.23.2 Honeywell Lightning Sensors
Honeywell markets an on-board lightning sensor system for aircraft. The LSZ-860 provides strikedetection out to 200 nautical miles while providing 360o coverage. The presence of lightning is a goodindicator of areas containing strong turbulence, hail, and heavy amounts of rain.
4.4.24 Global Positioning System Integrated Precipitable Water Measurement
The global positioning system (GPS) provides a means of estimating the integrated water vapor in theatmosphere. Water vapor delays radio signals transmitted from GPS satellites. The amount of delay canbe related to the total water vapor content along the signal path. As of February 1999, the ForecastSystems Lab’s Demonstration Division [4-51] had instrumented 40 sites with dual frequency GPSreceivers with plans for 65 sites by the end of 1999 and 200 sites by 2002. The signal delays are typicallyestimated from 6 or more satellites. Figure 4-3 shows the current or scheduled GPS-IPW sites.
4.4.25 Integrated Terminal Weather Support System
The Massachusetts Institute of Technology/Lincoln Labs (MIT/LL) has developed the integratedterminal weather support system (ITWS) [4-52,4-53,4-54] which permits fusion of data from a number ofsensors in the terminal area. The system is intended to support improvements in safety, efficiency, andcapacity. The system accepts inputs from WSR-88D, TDWR, ASR-9 with WSP, LLWAS,ASOS/AWOS, NLDN, MDCRS, and NWS numerical forecasts (e.g., RUC-II). The ITWS generates

94
some 30 products that are made available to air traffic personnel, air traffic management (e.g., TRACON),pilots, airlines, and air route traffic control centers (ARTCC). Over the past several years, MIT/LL hastested prototype systems at the Memphis, Orlando, and Dallas/Fort Worth airports. The FAA hasawarded a contract to Raytheon Systems Co., Sudbury, Massachusetts, to build a full-scale system withfour pre-production systems scheduled for 2000 with full scale deployment to commence in 2001. TheITWS is scheduled for deployment at some 45 major airports in the U.S.
Figure 4-3. Locations of GPR-IPW sites
4.4.26 Rapid Update Cycle II Model
The Rapid Update Cycle II Model [4-55,4-57] located at the National Center for EnvironmentalPrediction (NCEP) provides three dimensional analysis and short range forecasts. The RUC-II provides a12 hour forecast that is updated every 3 hours and a 3 hour forecast that is updated hourly. The analysisis based on inputs from rawinsonde (temperature, height, moisture, wind), aircraft (MDCRS providingwind and temperature), wind profiler networks, surface observations (wind, temperature, dewpoint, andaltimeter setting), ship reports, GOES integrated precipitable water retrievals, GOES high-density clouddrift winds, and tropical storm dropwindsonde data. The RUC-II provides information on a 40 kmhorizontal resolution grid for some 40 elevations.
4.5 Potential Sensor Solutions to Previously Identified Hazards
Section 3 of this report identified areas where improvements were needed in the current set of weatherproducts. A number of these areas dealt with specific weather related hazards that could be addressedusing existing or improved sensor technology. The first column in Table 4-24 contains a list of some ofthe identified hazards or phenomena. The second column contains a list of potential sensors that might beapplied in the detection and characterization of these phenomena. Each potential sensor solution will beaddressed in the following subsections.

95
Table 4-24. Hazards and Potential Sensor Options
Hazard/Phenomena Potential Sensor
Hail Polarization Diverse Radars
Icing Temperature – RadiometryWater and Water Vapor – Dual Frequency Radar and Radiometry
Clear Air Turbulence Lidar
Slant Range Visibility Lidar
Vector Wind Sensing (Terminal Area)and Wind Shear Detection
Bistatic Doppler RadarUnisys Microburst Prediction Radar
4.5.1 Detection of Hail
The discrimination of precipitant type based solely on single a polarization reflectivity measurement isnot possible since different precipitant types can exhibit equivalent reflectivity values (e.g., hail andheavy rain). However, polarization diverse radars offer the potential capability to support precipitantdiscrimination. For example, Aydin [4-58] proposes the use of a differential reflectivity measure todistinguish between hail and rain. Differential reflectivity is defined as the logarithm of the ratio of thereflectivity measured using a horizontal polarization to that measured using a vertical polarization. Otherpolarimetric approaches [4-30] have been proposed for discriminating between mixed phases andestimating the percentage of each phase within a volume. Both airborne and ground based weather radarscould benefit from polarization diversity. For example, the CHILL research radar at Colorado StateUniversity has a dual polarization capability. Polarization diversity does add significant cost to a radarsystem, but additional research is warranted in order to assess the cost versus benefit trades.
4.5.2 Icing Sensors
4.5.2.1 Introduction
At altitudes up to the tropopause, the atmosphere generally becomes colder with height. The height atwhich the air temperature equals the freezing point of water is known as the freezing altitude [4-10]. Thisaltitude varies with latitude and season of the year, but it is common for aircraft to encounter freezingtemperatures during some part of their operations. Under certain atmospheric conditions, the freezingtemperatures lead to accretion of ice on the aircraft. This generally causes a decrease in lift and anincrease in drag.
Icing is a major aviation hazard. Table 3-21 in this study shows that icing is a cause or factor in 3percent (for Part 121) to 8 percent (for Part 91) of weather related accidents.
The rate of ice accretion depends on many atmospheric parameters, such as temperature, liquid watercontent, and cloud droplet size distribution. The effect of icing depends on the aircraft flight conditions,including speed, altitude, climb/descent rate, angle of attack, and wing loading [4-10]. Icing is a verycomplex phenomenon, but the atmospheric conditions that are particularly conducive to ice accretionhave been identified.
The atmospheric conditions, most conducive to icing are the presence of supercooled liquid drops.Although water normally freezes at 00 C, under certain conditions it may exists as liquid drops at

96
temperatures below zero. Such drops freeze immediately on contact with an aircraft. The temperaturerange from -100 to 00 C is particularly conducive to ice accretion [4-59].
In addition to temperature, drop size is a key factor. Supercooled large drops (SLDs) have beenidentified as the primary aircraft icing hazard [4-60]. These drops, with diameters in the range from 30-400 µ m, are larger than typical cloud droplets but smaller than raindrops. In everyday experience they
correspond to freezing drizzle. Studies have shown that “... freezing drizzle results in maximum rates ofperformance degradation, while cloud drops, freezing rain drops, and mixed phase environments result inminor rates of performance degradation (Ashenden and Marwitz, 1997). Ice particles grow at the expenseof water droplets, so if ice is present, it will consume the droplets and diminish the icing hazard.
Because the atmosphere’s temperature changes with altitude, icing conditions only exist in a fairly thinlayer. This means that by a simple evasive maneuver (i.e., changing altitude), a pilot can avoid an icingcondition if provided with a warning with sufficient lead-time to take evasive action. A practical sensorfor detecting icing conditions would therefore be a valuable resource. Three types of sensors might beimagined: an in situ sensor, a remote sensor, or a satellite sensor. In situ sensors have the disadvantage ofnot giving advance warnings. Satellite sensors are considered in a different section of this report. Here,the current status of research and development efforts using airborne remote sensors for the detection oficing conditions is summarized.
Icing occurs in clouds, which are opaque at optical wavelengths, so remote sensing techniques mustnecessarily employ microwaves. There are two basic approaches: radiometry and radar. The history andcurrent status of these techniques is discussed below, along with recommendations for further work.
4.5.2.2 Radiometry
Microwave techniques for detecting icing conditions have been investigated during the past few yearsin a series of experiments and analytical work known as the Winter Icing and Storms Program (WISP).The main objective of the WISP experiments was to investigate remote sensing of inflight icingconditions. However, a limited range of environmental conditions was experienced during theseexperiments, and in particular, no extensive testing occurred in freezing drizzle.
In April 1999, an extension of this program, known as the Mount Washington Icing Sensors Project(MWISP) took place on Mount Washington in New Hampshire [4-61]. Mount Washington frequently hascloudy and supercooled conditions at the summit, and it typically experiences freezing drizzle on severaldays during April. Based on weather records, the investigators expected 2 to 3 freezing drizzle events,each lasting 3 to 6 hours. The use of a mountaintop site rather than an aircraft made it possible for a largeteam of investigators to assemble a suite of instruments, so that comprehensive truth data could becollected along with the radar and radiometry data.
Passive microwave radiometry has been proposed as a means to provide advance warning of icingconditions to pilots. The radiometer would be aimed forward (in the direction of flight) and scanned upand down, above and below the horizon. Characteristic signals are expected from clouds of super-cooledwater droplets, so signal processing techniques should be able to provide an advance warning when anaircraft is approaching such a cloud. The algorithms would determine the temperature and phase of thewater in the cloud (i.e., whether it is liquid water or ice). If the water is in the liquid phase and itstemperature is in the super-cooled range, then an alarm would sound.
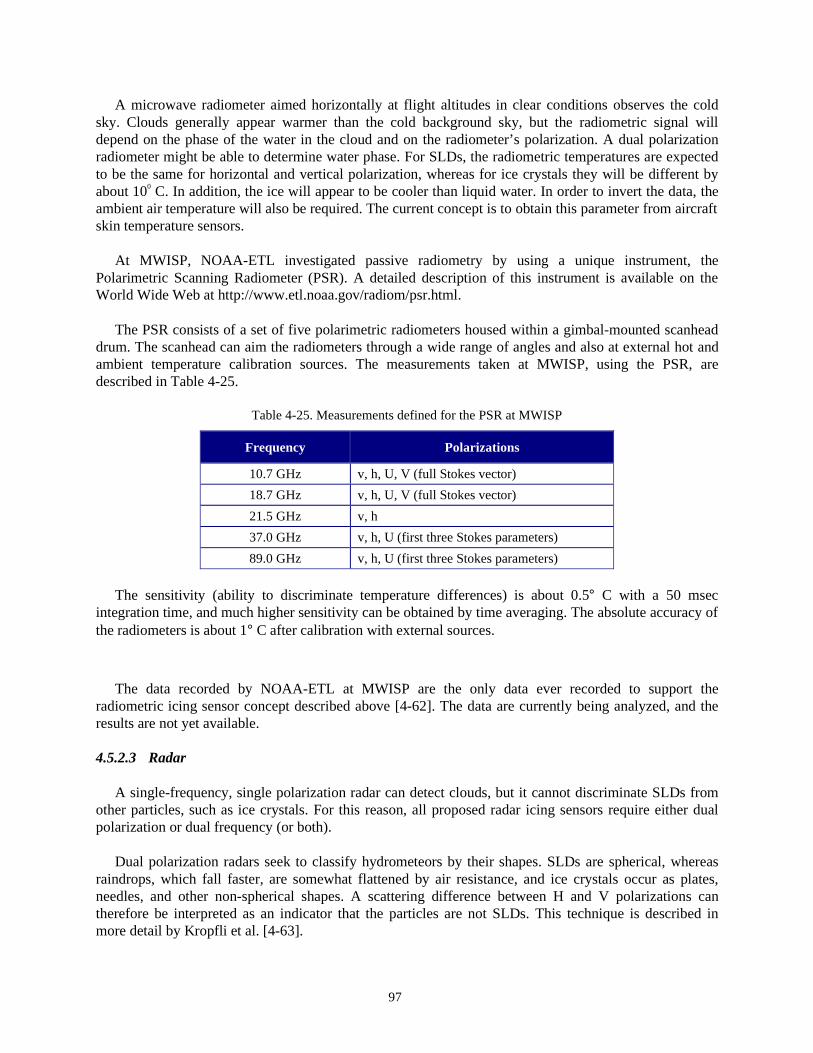
97
A microwave radiometer aimed horizontally at flight altitudes in clear conditions observes the coldsky. Clouds generally appear warmer than the cold background sky, but the radiometric signal willdepend on the phase of the water in the cloud and on the radiometer’s polarization. A dual polarizationradiometer might be able to determine water phase. For SLDs, the radiometric temperatures are expectedto be the same for horizontal and vertical polarization, whereas for ice crystals they will be different byabout 100 C. In addition, the ice will appear to be cooler than liquid water. In order to invert the data, theambient air temperature will also be required. The current concept is to obtain this parameter from aircraftskin temperature sensors.
At MWISP, NOAA-ETL investigated passive radiometry by using a unique instrument, thePolarimetric Scanning Radiometer (PSR). A detailed description of this instrument is available on theWorld Wide Web at http://www.etl.noaa.gov/radiom/psr.html.
The PSR consists of a set of five polarimetric radiometers housed within a gimbal-mounted scanheaddrum. The scanhead can aim the radiometers through a wide range of angles and also at external hot andambient temperature calibration sources. The measurements taken at MWISP, using the PSR, aredescribed in Table 4-25.
Table 4-25. Measurements defined for the PSR at MWISP
Frequency Polarizations
10.7 GHz v, h, U, V (full Stokes vector)
18.7 GHz v, h, U, V (full Stokes vector)
21.5 GHz v, h
37.0 GHz v, h, U (first three Stokes parameters)
89.0 GHz v, h, U (first three Stokes parameters)
The sensitivity (ability to discriminate temperature differences) is about 0.5° C with a 50 msecintegration time, and much higher sensitivity can be obtained by time averaging. The absolute accuracy ofthe radiometers is about 1° C after calibration with external sources.
The data recorded by NOAA-ETL at MWISP are the only data ever recorded to support theradiometric icing sensor concept described above [4-62]. The data are currently being analyzed, and theresults are not yet available.
4.5.2.3 Radar
A single-frequency, single polarization radar can detect clouds, but it cannot discriminate SLDs fromother particles, such as ice crystals. For this reason, all proposed radar icing sensors require either dualpolarization or dual frequency (or both).
Dual polarization radars seek to classify hydrometeors by their shapes. SLDs are spherical, whereasraindrops, which fall faster, are somewhat flattened by air resistance, and ice crystals occur as plates,needles, and other non-spherical shapes. A scattering difference between H and V polarizations cantherefore be interpreted as an indicator that the particles are not SLDs. This technique is described inmore detail by Kropfli et al. [4-63].

98
Under certain conditions, dual wavelength radars can be used to measure the liquid water content ofclouds because the attenuation of microwaves by clouds depends on wavelength [4-59]. In addition, usingtwo wavelengths provides some information on the size of hydrometeors. The radar cross sections ofspherical particles are dependent on both particle size and frequency, so a radar with two appropriatelychosen frequencies might be capable of size discrimination.
Simulations have shown that a radar operating at Ka band (8.66 mm) and X band (3 cm) candiscriminate between drizzle, ice, graupel, and rain. However, the inversion scheme would break down ifsnow crystals were present because they are non-spherical.
Radar data were also acquired during the MWISP experiment, using several different radars andseveral different scan patterns. These data are currently being analyzed.
4.5.2.4 Recommendations
Task 3 of the FAA Inflight Aircraft Icing Plan (1997) calls for accelerating the development ofairborne technologies that remotely assess icing conditions. As mentioned before, such technologies willnecessarily have operating wavelengths in the microwave region in order to penetrate clouds. Research inthis area (both radar and radiometry) is basically in its infancy, but it has the potential to provide remotesensing techniques for icing conditions. For these reasons, GTRI recommends continued development inthe microwave techniques.
Dual-frequency and dual-polarization radars are complex systems incurring a higher price tag. Thiswill limit their range of application. On the other hand, radiometry has the potential for widespread andinexpensive deployment on aircraft, using low-cost Monolithic Microwave Integrated Circuit (MMIC)technology. For this reason, GTRI recommends continued development of techniques based onmicrowave radiometry as a first priority.
4.5.3 Optical Detection of CAT
The term Clear Air Turbulence (CAT) generally refers to air turbulence at altitudes above 15,000 feetthat is not associated with thunderstorms or cumulus clouds [4-10]. There are several mechanismsresponsible for CAT: shear instabilities, breaking gravity waves, and turbulence generated near strongconvective regions. In general, CAT occurs in regions of vertical shear and low stability [4-56].
It is important for aircraft to avoid CAT. In May 1998, six people were injured when a U.S. Airwaysflight hit CAT south of Wichita, Kansas. In December 1998, a United Airlines flight encountered CAT ona flight from Japan to Hawaii, causing one death and injuries to over 100 passengers. The annual cost toairlines for turbulence damage and injury is estimated as $100 M. These factors provide a strongmotivation to provide advance warnings so that aircraft can avoid regions of CAT.
CAT regions are elusive. Although they are more likely over mountainous regions, they can occuranywhere on the earth at altitudes from the surface to the upper troposphere. Currently there is noeffective means of detecting CAT. Several different approaches have been tried, but they were all tooexpensive or too cumbersome. For this reason, the FAA currently relies mainly on pilot reports (PIREPs)to reroute aircraft around CAT regions, even though the PIREPs are subjective and tend to be unreliable.
NOAA’s Forecast Systems Laboratory is attempting to improve forecasting by using data from avariety of sources in a fine-resolution numerical weather model [4-56]. NOAA’s Environmental

99
Technology Laboratory has also conducted several experiments to evaluate Doppler lidar as an airborneCAT sensor. NASA has also conducted airborne measurements of the ability of Doppler lidar to detectCAT, under the ACLAIM (Airborne Coherent Lidar Advanced In-flight Measurement) program. Thesetests included flights over the Rocky Mountain region, in conjunction with the National Center forAtmospheric Research (NCAR).
Coherent Doppler lidars operate at infrared wavelengths, where light scattering by air molecules isinsignificant. The infrared lidar’s signal is provided by light scattering from atmospheric aerosols, whichare entrained in the air, so they act as tracers for air motion. The lidar is aimed in the direction of flight toprobe the air ahead of the aircraft. A scattering volume is defined at some distance ahead of the aircraft byrange gating. If the air is not turbulent, the lidar signal will contain one Doppler shift that corresponds tothe velocity of the aircraft relative to the scattering volume. If the air is turbulent, the signal will exhibitdifferent Doppler shifts for parcels of air moving at different velocities. This spreading of the Dopplerspectrum is taken as the signature of turbulent air. Some current lidar research efforts are aimed atcorrelating lidar turbulence signatures with the level of turbulence actually encountered, as measured withon-board accelerometers.
The fundamental problem with all turbulence lidar sensors to date is that their range is limited to a fewkilometers. For a 747 flying at 600 mph, a lidar range of 2 km would provide an advance warning of onlya few seconds, far too short to take evasive action or even to get all seat belts fastened. Today’s researchon airborne optical remote sensing of turbulence may be laying the foundation for future technology, buta practical system should not be expected in the immediate future.
4.5.4 Slant Range Visibility
4.5.4.1 Introduction
As noted in Section 3.5 of this report, during IFR landings a pilot must see the runway environment,based on visual cues, by the time he reaches the decision altitude. The FAA has defined a set of decisionaltitudes for various types of aircraft and levels of pilot training. If a pilot cannot see the runway when hereaches his decision altitude, he must abort the landing. This is undesirable from both airport capacityand safety points of view. Knowing in advance which aircraft can land safely in IFR conditions would beof great benefit.
At the time a pilot reaches his decision altitude, his aircraft is on the glide slope and is at somespecified distance from the end of the runway. His line of sight to the runway is along or slightly abovethe glide slope. The relevant parameter is the line of sight distance at which the pilot will be able to seethe runway. The term coined for this distance is the Slant Visual Range (SVR).
A present, there are no instruments to measure SVR, and neither the pilot nor the air traffic controllershave a reliable means of estimating it. RVR instruments measure surface visibility, but only at one height(ten feet above the surface). Ceilometers measure cloud base height, and when a cloud ceiling is the onlylimitation to visibility, this may be sufficient. But in the general case, where fog, haze, or precipitationmay be present at any altitude between the surface and the decision altitude, there is currently no way tomeasure or infer SVR.
100
4.5.4.2 Technology
The SVR problem requires a single-ended remote sensor that can be pointed from the ground towardthe approaching aircraft. The sensor should be optically based since visibility is an optical quantity. Theserequirements suggest the use of lidar.
Lidar systems operate by transmitting a short pulse of laser light and measuring the return signal fromaerosols or cloud droplets as a function of time, which can be interpreted in terms of range. The lidarsignal is due to light, which is backscattered by the particles, but the atmosphere between the scatteringvolume and the lidar system also attenuates the light. Lidar signals therefore depend on both backscatterand attenuation, so a mathematical inversion technique must be used to infer the extinction coefficient αas a function of range. The SVR can then be determined from the range profile of α .
Attempts to measure SVR with lidar date back 30 years [4-64]. This early work did not result in usefulsystems because eye safe lasers were not available at that time, and mathematical inversion techniqueswith sufficient accuracy had not yet been developed. Recent progress on both lasers and inversiontechniques has made the development of an SVR system possible.
In practice, the eye safety requirement means that the laser wavelength must be greater than 1.4 µ m.
Patterson [4-65] reported a lidar for clouds and aerosols that operated in this wavelength range by usingStimulated Raman Scattering in a high-pressure gas cell to shift the light from an Nd:YAG laser from1.06 µ m to 1.54 µ m. Since this time, reliable solid state lasers have been developed that shift Nd:YAGradiation to 1.57 µ m by use of Optical Parametric Oscillator OPO) technology. These lasers are
commercially available from Big Sky Laser Technologies in Bozeman, Montana, in a range of modelswith different specifications.
Using modern laser technology, it would be fairly straightforward to develop a reliable, eye safe lidarwith sufficient sensitivity for the SVR problem. The other requirement is a sufficiently accurate inversiontechnique.
As noted above, lidar signals depend on both backscatter and attenuation, so the inversion problem isnot simple. The beginning of practical lidar inversion schemes is generally traced to the work of Klett[4-66], and much work has been done since.
Bissonnette [4-67] has recently reported a side-by-side comparison of a lidar with a transmissometer.This unusual experiment took place in the Alps, on a slant path 2,325 m long, inclined at 30 degrees. Thelidar and the transmissometer were operated on parallel optical paths. The main measurement event lasted1.5 hours, and it included transmittances in a range from less than 5 percent to more than 90 percent. Themeasurements showed a good correlation between the lidar data and the transmissometer data. This result,along with many others over the past two decades, indicates that lidar techniques can give sufficientlyaccurate measurements to be useful in the SVR scenario.
4.5.4.3 Recommendations
Lidar technology is sufficiently advanced so that a prototype SVR system could be developed andfielded. GTRI recommends that this technology be pursued. The payoff in having SVR available to airtraffic controllers would probably be much like the payoff of wake vortex detection: it would increaseairport capacity and also enhance safety, by providing controllers with real-time information about aspecific aviation hazard.
101
4.5.5 Vector Wind Sensing and Wind Shear Detection
As noted in Section 3.5 of this report, wind field vector sensing in the terminal area would improveboth safety and efficiency. A dual Doppler radar system provides such a capability, but at the cost of twoDoppler radars. Wurman [4-28] has proposed the use of a single transmitter bistatic system as a low-costsystem for estimating wind field vectors. In the terminal area, a TDWR could serve as the transmitterwith multiple receiving sites located throughout the terminal area. GTRI recommends investigation ofthis technique as a possible low cost solution for obtaining additional wind vector information in theterminal area.
In terms of a low-cost wind shear prediction system, a system similar to the Unisys MicroburstPrediction Radar might be proposed. This system would not have the range and functionality of a TDWRbut would provide some additional level of wind shear detection at a lower cost. This type of systemmight be used in a conjunction with an existing LLWAS for better detection at those airports or as astand-alone system for those airports not currently supported by a wind shear detection system. GTRIwould recommend an initial review of tests performed by Unisys to further access the capabilities of theMPR.
4.6 EPIREPS
The FAA’s Aeronautical Information Manual (AIM) [4-68] states that FAA air traffic facilities (e.g.,flight service stations (FSS) and ARTCC) are to solicit pilot reports (PIREPS) when the followingconditions are reported or forecast:
• Ceilings at or below 5000 feet
• Visibility at or below 5 miles (surface or aloft)
• Thunderstorms and related phenomena
• Icing of light degree or greater
• Turbulence of moderate or greater degree
• Wind shear
• Volcanic ash clouds
Pilots are urged to provide requested information and volunteer information as conditions warrant.The main objective of the PIREP system is to warn other pilots and air traffic facilities of adverse weatherconditions experienced en route. The current system requires FSSs and ARTCCs to verbally solicitPIREPs and manually enter the reports into the National Weather Service’s (NWS) communicationgateway. However, a number of problems exist with the current system [4-69]. FSSs can only receivePIREPs on selected frequencies. However, as is often the case, the pilot is using a different set offrequencies to communicate with air traffic control or is monitoring other frequencies [4-69]. In addition,during FSS peak workloads PIREPS may not get entered into the system [4-69]. In addition to thewarning aspect of a PIREP, there is also a desire to use PIREP data in weather research and forecasting.For example, PIREPs could possibly be used to aid researchers in the development of turbulence andicing forecasts.
With the need for more consistency in reporting and with the desire for additional information tosupport flight safety and research/forecasting, an automated approach to PIREPs has been proposed. Thisautomated approach is termed an electronic pilot report (EPIREP). An example of such a system is

102
MDCRS, which reports temperature, wind speed and direction, and relative humidity via ACARS. Thisinformation is only available from specially equipped commercial aircraft participating in the MDCRSprogram. As a part of this task, GTRI examined possible suites of sensors that one might want to includeas a part of an EPIREP system both to directly impact aviation safety and to impact safety indirectlythrough support of research and forecasting.
In an ideal world, an EPIREP sensor suite would support measurements associated with each of thehazards listed above, for both flight safety reasons (alerting pilots and air traffic facilities of hazardous in-flight conditions) and research and forecasting initiatives. However, due to costs and limits on sensorcapabilities, such a sensor suite is not feasible. The approach then is to identify low cost or existingsensors that could be used to collect information about specific hazards.
The easiest sensor to include in such a suite is the outside temperature probe. All aircraft are requiredto be equipped with such a device. Outside temperature information aids the pilot in identifying areas ofpotential supercooled liquids (-20oC to 0oC) and provides research and forecast models with in situmeasurements. Aircraft are also required to be equipped with a Pitot tube for measuring flight speed.Wind speed and direction are available on aircraft equipped with GPS or an inertial navigation system.Wind speed and direction should be a part of any EPIREP sensor suite. Both temperature and watervapor/liquid water content are important in predicting icing conditions and are needed to supportatmospheric models. As described in the section on MDCRS, a relative humidity sensor is being used toprovide moisture information at different altitudes.
To aid in registering the data, EPIREPs should include positional information as well as a time stamp.PIREPs have traditionally included pressure altitude and location referenced to a fixed navigation aid(NAVAID) identifier, a distance from a NAVAID, or a route segment [4-69]. EPIREPs should includepressure altitude information and when available GPS coordinates.
To aid in the reporting of turbulence, accelerometers (which are a part of the inertial navigationsystems found in many aircraft [4-10, p. 310]) can be used to measure the severity of turbulenceexperienced by an aircraft. Modifications to these systems may aid in the reporting of turbulence. Forthe researcher, associating turbulence with precipitation, clouds, or the lack of both is key in categorizingthe source of the turbulence (e.g., clear air turbulence). Aircraft equipped with weather radars provide anexisting source of data that could be summarized or compressed for down linking as a part of an EPIREP.The airborne weather radar provides information on precipitation amounts and precipitation relatedturbulence. Radial wind information as a function of range is also available. A summary of theinformation averaged of time or spatially may be needed to reduce the amount of data to downlink.
Commercial aircraft are often equipped with acoustic or electrical sensors for the detection of icingwhile in-flight. These sensors are applied in-flight to activate de-icing systems. A sensor thatautomatically reports icing, via EPIREPs, on the surface of the aircraft would greatly enhance the presentreporting system requiring pilot intervention. Sensors could also be designed to report the amount oficing accumulating on the wings. Allied Signal markets an ice detection sensor called the C/FIMS [4-70]for in-flight detection of icing on the wings of the aircraft.
In the future, if aircraft are retrofitted with additional sensors (e.g., lidar or radiometers) to detect orpredict other hazards such as hail, icing, or clear air turbulence, these sensors can be incorporated into theEPIREP’s data link. For example, radiometers could provide information on atmospheric temperaturesand integrated liquid water and water vapor content in the atmosphere. However, these systems represent

103
a larger capital investment. However, equipping a limited number of aircraft with additional sensors, thatare accessible via EPIREPs, would support a number of research efforts.
Table 4-26 contains a list of the proposed sensors to include in an EPIREP sensor suite. A number ofthe sensors are already present on some aircraft, but interfacing issues may limit access. However, exceptfor the AWR, these sensors are relatively low cost. A second set of the sensors could be added to theaircraft in support of EPIREPs. An equivalently important question that needs to be addressed is “whatinfrastructure will be in place to receive and process the EPIREP data.” This question is not addressedunder this task, but users of the data should be identified and benefits defined as a part of the EPIREPeffort.
Table 4-26. A List of Possible Sensors to Include in an EPIREP Sensor Suite
EPIREP Reporting Options
Outside Temperature Sensor
Wind Speed and Direction Sensors
Relative Humidity Sensors
Location (GPS Coordinates) and Time Stamp
Degree of Turbulence (Accelerometers)
Airborne Weather Radar Summaries
Icing Sensors on the Surface of the Aircraft
104
References
4-1. Skolnik, M., Radar Handbook, 2nd Edition, McGraw-Hill Publishing, New York, 1990.
4-2. Mahapatra, P. R., and D. S. Zrnic’, “Modern Aviation Weather Systems for Efficient FlightManagement,” 1990 IEEE National Radar Conference, pp. 457-463.
4-3. Turnbull, D. H., “Aviation Weather Radar,” IEEE International Radar Conference, pp. 748-751.
4-4. Evans, J. E., et al., “Terminal Doppler Weather Radar Clutter Control,” 1990 IEEE InternationalRadar Conference, pp. 12-16.
4-5. Evans, J., and D. Turnbull, “Development of an Automated Windshear Detection System UsingDoppler Weather Radar,” Proceedings of the IEEE, Vol. 77, No. 11, November 1989, pp. 1661-1673.
4-6. Mahapatra, P. R., and D. S. Zrnic’, “Sensors and Systems to Enhance Aviation Safety AgainstWeather Hazards,” Proceedings of the IEEE, Vol. 79, No. 9, September 1991, pp. 1234-1267.
4-7. Weber, M. E., and M. L. Stone, “Low Altitude Wind Shear Detection Using Airport SurveillanceRadars”, IEEE AES Systems Magazine, June 1995, pp. 3-9.
4-8. Weber, M. E., et al., “Data Processing Techniques for Airport Surveillance Radar WeatherSensing,” 1995 IEEE International Radar Conference, pp. 521-528.
4-9. Whiton, R. C., and P. L. Smith, “History of Operational Use of Weather Radar by U.S. WeatherServices, Part I: The Pre-NEXRAD Era,” American Meteorological Society, NEXRAD SpecialIssue, June 1998, Vol. 13, No. 2, pp. 219-243.
4-10. Mahapatra, P., Aviation Weather Surveillance Systems, The Institution of Electrical Engineers,Michael Faraday House, United Kingdom, 1999.
4-11. Crum, T. D., et al., “An Update on the NEXRAD Program and Future WSR-88D Support toOperations,” American Meteorological Society, NEXRAD Special Issue, June 1998, Vol. 13, No.2, pp. 253-262.
4-12. Alberty, R. L., and T. D. Crum “NEXRAD and the Operational Doppler Weather Radar for the1990s and Beyond,” Dig. Int. Geosci. Remote Sensing Symposium, 1990, pp. 725-728.
4-13. Federal Meteorological Handbook No. 11, Doppler Radar Meteorological Observations, Part B,Doppler Radar Theory and Meteorology, FCM-H11B-1990, June 1990.
4-14. Federal Meteorological Handbook No. 11, Doppler Radar Meteorological Observations, Part D,WSR-88D Unit Description and Operational Applications, FCM-H11D-1992, April 1992.
4-15. Federal Meteorological Handbook No. 11, Doppler Radar Meteorological Observations, Part C,WSR-88D Products and Algorithms, FCM-H11C-1991, February 1991.
4-16. Federal Meteorological Handbook No. 11, Doppler Radar Meteorological Observations, Part A,System Concepts, Responsibilities, and Procedures, FCM-H11A-1991, June 1991.
4-17. Strauch, R. G., and et al., “Wind Profilers for Support of Flight Operations,” Journal of Aircraft,Vol. 26, No. 11, pp. 1009-1015, November 1989.
4-18. Martner, B. E., and et al., “An evaluation of Wind Profiler, RASS, and Microwave RadiometerPerformance,” Bulletin of the American Meteorological Society, Vol. 74 No. 4, pp. 599-613, April1993.

105
4-19. May, P. T., and et al., “Temperature Sounding by RASS with Profiler Radars: A PreliminaryStudy, IEEE Transactions on Geoscience and Remote Sensing, Vol. 28, No. 1, pp. 19-28, January1990.
4-20. Ramamurthy, M., “Modern Observing Systems Used in National Weather Prediction,”Department of Atmospheric Sciences, University of Illinois at Urbana-Champaign, COMETFaculty Course on NWP, June 7, 1999, available at www.comet.ucar.edu/class/faculty/Jun071999/html/OSSE2/ sld001.htm.
4-21. Forecast Systems Lab Boundary Layer Profilers available at http://www.fsl.noaa.gov/~vondaust/fir96/www.fir96deo.html.
4-22. Rogers, J. W., C. J. Tidwell, “Terminal Area Surveillance System,” 1995 IEEE InternationalRadar Conference, pp. 501-504.
4-23. Buckler, L. M., “The Use of Phased Array Radars at Civilian Airports,” 1996 IEEE InternalSymposium on Phased Array Systems, pp. 334-339.
4-24. “Terminal Area Surveillance System (TASS) Phased Array Radar Study,” Final Technical Report,prepared by Raytheon, submitted to FAA, DTFA01-94-C-00049, June 1995.
4-25. “Phased Array Technology Status and Assessment,” prepared by Horizons Technology, Inc.,prepared for Technology Planning Incorporated, October 29, 1993.
4-26. “TASS Four Faced Electronically Scanned Array Radar Point Design,” prepared by MassachusettsInstitute of Technology, Lincoln Laboratory, prepared for James Rogers, Federal AviationAdministration, June 1994.
4-27. Leyh, C., et al., “A Low Cost Microburst Early Warning and Detection Radar,” IEEEInternational Radar Conference, 1995, pp. 496-500.
4-28. Wurman, J., “Vector Winds from a Single-Transmitter Bistatic Dual-Doppler Radar Network,”Bulletin of the American Meteorological Society, Vol. 75, No. 6, June 1994, pp. 983-994.
4-29. Wurman, J., “A Bistatic Multiple-Doppler Radar Network: Part I, Theory,” available atwww.atd.ucar.edu/rsf/bistatic/network/bistatic.network.2.html.
4-30. Doviak, R. J., and D. S., Zrnic, Doppler Radar and Weather Observations, 2nd Edition, AcademicPress, New York, 1993.
4-31. The CSU CHILL Radar System available at http://olympic.atmos-colostate.edu/CHILL/Radar.html.
4-32. Pawnee Doppler Radar available at http://olympic.atmos-colostate.edu/CHILL/chill_pawnee.html
4-33. Vivekanandan, J., et al., “Aircraft Icing Detection Using Dual-wavelength and Polarization RadarObservations”, IEEE 1998.
4-34. Adams, W. M. and J. Vivekanandan, “Snowfall Rate and Supercooled Liquid Water ContentRetrieval Using the Dual-Frequency Radar Technique,” Dig. Int. Geoscience Remote SensingSymposium, 1993, pp. 1922-1924.
4-35. NOAA satellite images are available from the Satellite Services Division web site athttp://www.ssd.noaa.gov, and from the Operational Significant Event Imagery database athttp://www.osei.noaa.gov.
4-36. Information on the NASA EOS satellite volcanology program may be found athttp://volvano2.pgd.hawaii.edu/eos/.

106
4-37. Information on the NASA GOES Project Volcano Watch may be found athttp://rsd.gsfc.nasa.gov/goesb/chesters/web/text/goes.volcanoes.html.
4-38. Mosher, F. R., “Four channel volcanic ash detection algorithm,” available at http://www.awc-kc.noaa.gov/publications/mosher/paper3.html.
4-39. Krueger, A. J., Walter, L. S., Bhartia, P. K., Schnetzler, C. C., Krotkov, N. A., Sprod, I., Bluth, G.J. S., “Volcanic sulfur dioxide measurements from the total ozone mapping spectrometerinstruments”, Journal of Geophysical Research, 100 (D7), pp. 14057-14076, 1995.
4-40. Krueger, A. J, Doiron, S. R., Bluth, G. J. S., Walter, L. S. Schnetzler, C. C. “Volcanic hazarddetection with the total ozone mapping spectrometer (TOMS),” U.S. Geological Survey Bulletin v.2047, pp.367-372, 1994.
4-41. Krueger, A. J., “The earth System Science Pathfinder VOLCAM Volcanic Hazard Mission,” paperC08_11:30, IEEE International Geoscience and Remote Sensing Symposium, Hamburg, Germany,28 June-2 July 1999.
4-42. Koschmieder, H., “Measurements of visibility at Danzig,” Monthly Weather Review 58, No. 11,pp. 439-444, 1930.
4-43. Su, F., “CW laser radar detects wake vortices”, OE Reports No. 148, April 1996.
4-44. Hannon, S. M., and T. L Clark, “Lidar measurement of windshear and turbulence and comparisonwith a predictive fine-mesh mesocale model,” Proc. SPIE, 2464, 1996.
4-45. Hannon, S. M., S. W. Henderson, J. A. Thomson, and P. GATT, “Autonomous lidar wind fieldsensor: performance predictions”, Proc. SPIE, 2832, pp. 76- 90, 1996.
4-46. Gleim, I. N., Aviation Weather and Weather Services, Gleim Publications, Inc., Gainesville,Florida, 1998.
4-47. Vaisala RS80 available at www.vaisala.fi
4-48. NWS Radiosonde available at www.rrs.nws.noaa.gov
4-49. Global Atmospherics, Inc., available at www.glatmos.com/products/products.html
4-50. National Lightning Detection Network Platform Document, available at http://eosims.msfc.nasa.gov:5721/source_documents/nldn_platform.html.
4-51. NOAA/FSL Ground-Based GPS-IPW Demonstration Network available at http://www-dd. fsl.noaa.gov/gps/background.html.
4-52. Nierow, A., et al., “The Role of ITWS in the Modernization of the National Airspace System,”The 8th Conference on Aviation, Range, and Aerospace Meteorology, abstract available atwww.confex2.com/ams/99annual/abstracts/527.htm.
4-53. Wieler, J. G., et al., “Integrated Terminal Weather Surveillance – A System Perspective,” The 29thConference on Radar Meteorology, abstract available at www.confex2.com/ams/rm29/abstracts/304.htm.
4-54. MIT Lincoln Lab Aviation Weather available at www.ll.mit.edu/AviationWeather/index.html.
4-55. Implementation of the Rapid Update Cycle available at http://maps.fsl.noaa.gov/tpbruc.cgi.
4-56. “Clear Air Turbulence Primer,” NOAA, available at http://www-frd.fsl.noaa.gov/mab/scatcat/cat.html, 1999.

107
4-57. Rapid Update Cycle available at www.comet.ucar.edu/nwplessons/RUClesson4/rucpp/sld001.htm.
4-58. Aydin, K., et al., “Remote Sensing of Hail with a Dual Linear Polarization Radar,” J. Clim. Appl.Meteorol. Vol. 25, 1986, pp. 1475-1484.
4-59. Westwater, E. R., and R. A. Kropfli, “Remote Sensing Techniques of the Wave PropagationLaboratory for the measurement of supercooled water: Application to Aircraft Icing,” NOAATechnical Memorandum ERL WPL-163, May 1989.
4-60. Politovich, M. K., “Aircraft icing caused by large supercooled droplets,” J. Appl. Meteorol. 28, pp.856-868, 1989.
4-61. Politovich, M. K., Mount Washington Icing Sensors Project, National Center for AtmosphericResearch, 1999.
4-62. Gasiewski, A. J. , NOAA-ETL, private communication, 1999.
4-63. Kropfli, R. A. , et al., “Radar and radiometer measurements of the physical parameters of cloudsand precipitation at the NOAA Environmental Technology Laboratory,” Conference onBattlespace Atmospheric and Cloud Impacts on Military Operations, Hanscom AFB,Massachusetts December 1-3, 1998 (8 pp.).
4-64. Viezee, W., E. E. Uthe, and R. T. H. Collis, “Lidar observations of airfield approach conditions:an exploratory study,” J. Appl. Meteor. 8, pp. 274-283, 1969.
4-65. Patterson, E. M., G. G. Gimmestad, and D. W. Roberts, ”Initial measurements using a 1.54 µ meyesafe Raman-shifted lidar,” Appl. Opt. 28, pp. 4978-4981,1989.
4-66. Klett, J. D. “Stable analytical inversion solution for processing lidar returns,” Appl. Opt. 20, 211-220, 1981.
4-67. Bissonnette, L. R., G. Kunz, and K. Weiss-Wrana, “Comparison of lidar and transmissometermeasurements,” Opt. Eng, 36(1) pp.131-138, 1997.
4-68. Gleim, I. N., Federal Aviation Regulations and Aeronautical Information Manual, 1999 Edition,Gleim Publications, Inc., Gainesville, Florida, 1998.
4-69. Schwartz, B., “The Quantitative Use of PIREPS in Developing Aviation Weather GuidanceProducts,” Weather and Forecasting, Vol. 11, September 1996, pp. 372-384.
4-70. Allied Signal Ice Detector (C/FIMS) available at http://aerospace.alliedsignal.com/aerosp…raft/products/products/ice_detector.html

108
Acronyms
A arrival
AATT Advanced Air Transportation Technologies
ACARS Aircraft Communications Addressing and Reporting System
AFSS Automated Flight Service Stations
AGL above ground level
AIM Aeronautical Information Manual
AIRMET Airman’s Meteorological Advisory
ARC AMES Research Center
ARL Air Resources Laboratory
ARSR air route surveillance radar
ARTCC air route traffic control centers
ASOS Automated Surface Observation System
ATC Air Traffic Control
ATCT airport traffic control tower
ATIS automatic terminal information service
AVOSS Aircraft Vortex Spacing system
AvSP Aviation Safety Program
AWC aviation weather center
AWIN Aviation Weather Information
AWOS Automated Weather Observing System
AWR airborne weather radar
AWRP Aviation Weather Research program
Az azimuth
C current
C&V ceiling and visibility
CAT clear air turbulence
Convective SIGMET Convective Significant Meteorological Information
CTAS Center-TRACON Automation System
CTI Coherent Technologies, Inc.
CW continuous wave
CWA Center Weather Advisory
CWSU center weather service unit
D departure
D-ATIS Digital Automated Terminal Information Service
DCL data communication link
109
Acronyms (Continued)
DFRC Dryden Flight Research Center
DFW Dallas-Fort Worth International Airport
DH decision height
DIAL Differential Absorption Lidar
Domestic SIGMET Domestic Significant Meteorological Information
DUAT direct user access terminal
E en route
EFAS En Route Flight Advisory Service
El elevation
EM electromagnetic
EO electro-optical
EOS Earth Observing System
EPIREP electronic pilot report
ES enhanced sensitivity
ETA estimated time of arrival
ETD estimated time of departure
EWINS Enhanced Weather Information Systems
ExWP Enhanced Weather products
F forecasted
FA area forecasts
FA aviation forecast
FAA Federal Aviation Administration
FAR Federal Aviation Regulations
FBR visual flight rules
FIS Flight Information Systems
FMF flight movement forecast
FSL Forecast Systems Laboratory
FSS Flight Service Stations
GOES Geostationary Operational Environmental Satellites
GPS Global Positioning System
GRC Goddard Research Center
GTRI Georgia Tech Research Institute
GWVSS Ground Wind Vortex Sensing System
H horizontal
HIWAS Hazardous In-Flight Weather Advisory Service
HLSWC High Significant Weather Charts
110
Acronyms (Continued)
HO human observer
IDS Inter-disciplinary Science
IF intermediate frequency
IFR instrumented flight rules
IMC instrument meteorological conditions
IMPACT Improved Accuracy from Combined Technology
International SIGMET International Significant Meteorological Information
IR infrared
ITWS integrated terminal weather support
LaRC Langely Research Center
LDV Laser Doppler Velocimeter
LH left hand
LL Lincoln Laboratories
LLSWC Low Level Significant Weather Charts
LLWAS Low Level Wind Shear Alert System
LLWAS-NE LLWAS-Network Expansion
LM Lockheed Martin
MAVSS Monostatic Acoustic Vortex Sensing System
MDA minimum descent altitude
MDCRS meteorological data collection and reporting system
METAR Aviation Routine Weather Report
MIS Meteorological Impact Statement
MIT Massachusetts Institute of Technology
MMIC Monolithic Microwave Integrated Circuit
MPR microburst prediction radar
MSL mean seal level
MWISP Mount Washington Icing Sensors Project
NAS National Airspace System
NASA National Aeronautics and Space Administration
NAVAID navigational aid
NCAR National Center for Atmospheric Research
NCEP National Centers for Environmental Prediction
NESDIS National Environmental Satellite, Data, and Information Service
NEXRAD Next Generation Weather Surveillance Radar
NLDN National Lightening Detection Network
111
Acronyms (Continued)
nmi nautical miles
NOAA National Oceanic and Atmospheric Administration
NTSB National Transportation Safety Board
NWPN NOAA wind profiler network
NWS National Weather Service
O/S Operator/Support
OAR Oceanic and Atmospheric Research
OPD Optical parametric Oscillator
PIREPS pilot reports
PRF pulse repetition frequency
PSR Polarimetric Scanning Radiometer
R&D research and development
RAD Radiosonde Additional data
RASS radio-acoustic sounding system
RF route forecast
RH right hand
RPM revolutions per minute
RUC rapid update cycle
RVR runway visual range
SE Systems Engineering
SEPCI Aviation Selected Special Weather Report
SI satellite imagery
SIGMET significant meteorological information
SLD supercooled large drops
SVR slant visual range
TA temperatures aloft
TAF Terminal Area Forecast
TASS terminal area surveillance system
TOMS Total Ozone mapping Spectrometer
TOWR Terminal Doppler Weather Radar
TRACON Terminal Radar Approach Control
TS thunderstorms
TWEB Transcribed Weather Broadcast
TWIP Terminal Weather Information for Pilots
UHF ultra-high frequency

112
Acronyms (Concluded)
UPS United Parcel Service
V vertical
VAD velocity azimuth display
VHF very high frequency
VMC visual meteorological conditions
VOR VHF omnidirectional range
WA winds aloft
WARP Weather and Radar Processing
WFO Weather Forecast Offices
WISP Winter Icing and Storms Program
WMO meteorological watch offices
WRF Weather Research and Forecast
WSI Weather Services International
WSP Weather Systems Processor
WW Severe Weather Watch

A-1
Appendix A Enhanced Weather Information Systems
1453. GENERAL. Enhanced weather information systems (EWINSs) incorporate advanced technical capabilities,are FAA approved, and provide certificate holders with aviation weather data which permits quick, flexible, andoperationally efficient responses to changing meteorology conditions. These systems detect, track, report, andforecast ordinary weather conditions as accurately as they do adverse weather phenomena. An EWINS usesreported and forecast weather conditions not only to aid in controlling daily flight movements, but also to permitshort and long-term operational planning for enhancing an operator's capability to protect schedules and to useequipment and personnel with maximum efficiency.
1455. CONCEPT OF AN EWINS. The basic concept of an EWINS is to use a weather information system formaximum effectiveness in tracking, evaluating, reporting and forecasting the presence or absence of adverseweather phenomena. The basic requirement of an EWINS is it must always incorporate a subsystem capable ofobtaining, evaluating, and disseminating reports and forecasts of adverse weather phenomena. Adverse weatherphenomena, by definition, can directly diminish flight operation safety. Consequently, an Adverse WeatherPhenomena Report and Forecasting subsystem must effectively, rapidly, and reliably process weather informationfrom the time the information is obtained from approved sources until it is used by flightcrews and other operationalcontrol personnel in making decisions concerning the control of flight movements.
1457. CHARACTERISTIC FUNCTIONS OF AN EWINS. There are three basic functions of an EWINS.These functions are an inward flow of weather information, analysis and evaluation of the information, and anoutward flow of the information in an operationally appropriate format. Additional components include a policiesand procedures manual, training programs, quality assurance procedures, work facilities, and equipment.
A. An EWINS must include sufficient procedures, personnel, and communication and data processingequipment, to effectively obtain the aeronautical weather data described in section 2 from approved sources.The communication and data processing equipment and procedures must include back-up capabilities toprovide uninterrupted operation should any single component of the system fail.
B. An EWINS must have the necessary qualified personnel, procedures, and equipment for effective analysisand evaluation of aeronautical weather data and of the affect of changing weather conditions on current andfuture operations. Based on conclusions derived from EWINS data, authorized personnel may prepare andissue flight movement forecasts, forecasts of adverse weather phenomena, and other meteorologicaladvisories to control flight operations. Personnel authorized to analyze and evaluate weather data for thepurpose of making and issuing forecasts must be trained and qualified in accordance with paragraphs 1463and 1465.
C. An EWINS must have the necessary communication systems, data processing equipment, procedures, andpersonnel to provide rapid, timely, and reliable dissemination of weather information used to makeoperational decisions. Flight movement forecasts, adverse weather phenomena forecasts, and any othermeteorological advisories must be appropriately disseminated to flightcrews during preflight planning andwhile they are en route. The same information must be provided to other operational control elements withinthe operator's organization.
1459. FAA POLICIES CONCERNING EWINSs. The following are FAA policy statements concerningEWINSs used by Parts 121 and 135 operators.
A. Each EWINS must be FAA approved. FAA approval of an EWINS includes approval of an Adverse WeatherPhenomena Reporting and Forecasting subsystem and requires certificate holders to use that subsystem.
B. An EWINS must provide rapid and reliable dissemination of weather data through communication channelsindependent of any air traffic control system.
C. Each EWINS includes capabilities for continuous quality assurance and authoritative procedures forcorrecting discovered deficiencies.

A-2
D. Except for provisions for quality assurance, any other appropriate part of an EWINS may be owned and/oroperated by a private weather company, private communication company, or by another U.S. Parts 121 or135 operator.
E. An aviation meteorologist or a dispatcher with IMF authority must continuously be on duty when any flightoperations are in progress.
F. Properly trained and qualified aviation meteorologists and dispatchers with IMF authority who operate anEWINS may be authorized to prepare and issue flight movement forecasts.
G. Flight movement forecasts are official weather forecasts which control specific flight operations for aparticular operator.
H. Aeronautical weather data provided by an EWINS satisfies all regulatory requirements
for each Part 121 and/or Part 135 certificate holder specifically authorized to use a particular
EWINS.
1461. EWINS POLICIES AND PROCEDURES MANUAL
A. Responsibility for Preparing an EWINS Manual. A certificate holder or a combination of certificate holdersand noncertified organizations may jointly operate an EWINS. The operator or operators of an EWINS mustdevelop, prepare, and keep current an EWINS policies and procedures manual.
(1) If an EWINS is operated by a single certificate holder, that certificateholder shall be responsible for preparation and currency of an EWINS policies andprocedures manual. This manual shall be incorporated as part of the manualrequirements of FAR 121.133 or FAR 135.21.
(2) If an EWINS is cooperatively or contractually operated by more than one organization (at least one ofwhich must be a certificate holder authorized to operate under Part 121 or Part 135), the EWINS policiesand procedures manual must establish who is responsible for preparing and keeping the manual current.Each cooperating certificate holder must incorporate appropriate provisions of the EWINS manual in itsmanual.
(3) A certificate holder who does not operate an EWINS and does notparticipate with others in a cooperative EWINS arrangement may, through contractualarrangements, acquire aeronautical meteorological data from an approved EWINS. Inthis case the certificate holder must use all the weather products provided by theapproved EWINS for control of its flight operations. The contracting certificate holdermust incorporate in its manual appropriate provisions of the approved EWINS policiesand procedures manual. Additionally, the contracting certificate holder's manual mustcontain specific restrictions on use of forecasts from sources other than the approvedEWINS.
B. Contents of an EWINS Manual. An EWINS policies and procedures manual must include descriptions of thestructure of the EWINS and how the EWINS operates. This manual must provide information concerning thefollowing areas:
(1) Facilities:
(a) The location of the primary meteorological office
(b) Descriptions of, and instructions for, using communications and data processing equipment
(2) Weather Sources:
(a) A list of sources for weather reports
(b) A list of sources for weather forecasts

A-3
(c) Normal, abnormal, and emergency procedures
(d) Conditions and limitations for use of private weather services as sources for reports and forecasts
(3) Personnel:
(a) Qualification standards for dispatchers with FMF authority and aviation meteorologists
(b) Training requirements for dispatchers with FMF authority and aviation meteorologists
(c) Staffing requirements for the EWINS
(4) Operating Policies and Procedures:
(a) Detailed procedures for obtaining, evaluating, and disseminating aviation weather
(b) Procedures for obtaining PIREPS/AIREPS
(c) Procedures for operating in areas affected by adverse weather
(d) A description of the EWINS interface with dispatch/operational control elements
(e) The identification, authorization, and responsibility of persons permitted to make flightmovement forecasts
(5) Quality Assurance Procedures:
(a) Procedures to assure accuracy of the EWINS weather reports and forecasts
(b) Procedures to measure effectiveness of the EWINS communication capabilities
(c) Policies and procedures for correcting deficiencies detected within an EWINS
1463. PERSONNEL QUALIFICATIONS. Aviation meteorologists and dispatchers with FMF authority who arepart of an EWINS must meet the following special qualifications:
A. Aviation Meteorologist. An aviation meteorologist must have a degree in meteorology (or its equivalent)awarded by an accredited university or college and be certified by his employer as competent to performaviation forecasting duties. Each EWINS operator must have a program which ensures that aviationmeteorologists understand that their professional actions influence aviation safety, and the requiredoperational and regulatory responsibilities for persons using the meteorologists' forecasts. In addition,aviation meteorologists must receive briefings, as necessary, to obtain current information on changes to theoperations controlled by their forecasts. A briefing and training scheme for aviation meteorologists must beincluded in the EWINS policies and procedures manual. Training can be self-directed study, briefings, and/orformal training. It must include information on weather requirements of the FARs which regulate certificateholders who use the EWINS. Traditional types of professional meteorological training are encouraged.
B. Dispatcher with FMF Authority. A dispatcher who has satisfactorily completed an approved training pro-gram which includes the training specified in paragraph 1465, may be authorized by his employer to makeand issue flight movement forecasts.
1465. TRAINING FOR DISPATCHERS WITH FMF AUTHORITY
A. Dispatchers shall not be authorized to make and issue flight movement forecasts unless they havesatisfactorily completed an FAA-approved initial training course in meteorology. In addition, dispatcherswith FMF authority must satisfactorily complete an FAA-approved recurrent training course in meteorologyat least once every 24 months. Recurrent training modules may be scheduled at periodic intervals thatprovide for a complete cycle of recurrent meteorological training every 24 months. Any dispatcher with FMFauthority who is also assigned duties in domestic or flag operations under Part 121 must satisfactorilycomplete the training and qualification requirements specified in Subparts N and P of Part 121 in addition tothe meteorological training specified in this paragraph. Any meteorological training required by Subpart N,however, is satisfied by the meteorological training specified in this paragraph.
B. Approved initial and recurrent meteorological training curriculum segments must include
training in at least the following subjects:

A-4
(1) Basic properties of the atmosphere:
Composition
Density
Measurement
General circulation
Solar heating
(2) Clouds:
Formation
Condensation
Precipitation
Use of cloud knowledge in forecasting
Stability and instability
(3) Air mass analysis:
Classification
Flying conditions
Use of air mass knowledge in forecasting
(4) Analysis of fronts:Structure and characteristics
Cloud sequences in fronts
Establishing positions of fronts by cloud types
Fronts and seasonal variation
Flying weather in fronts
Cyclones and anticyclones
(5) Fog: Reading a weather map
Type
Cause and formation
(6) Ice:
Types
Cause and formation
(7) Thunderstorms, hurricanes, tornadoes:
Causes
Methods of forecasting
Structure and complexity of internal winds
Hail (cause and formation)
(8) Windshear: Detection
Reporting
Cause
Avoidance technique
(9) Turbulence
Determining the smooth level of flights
Cause

A-5
(10) Interpreting weather data:
Weather sequences and symbols
Weather map symbols
Drawing a weather map
Reading a weather map
Upper-level charts
Adiabatic charts
Winds-aloft charts
Instruments used to gather and record weather data
Radar products and images
Satellite products and images
(11) Weather forecasting:
Extrapolation
Movement of fronts and air masses
Isobars
Barometric tendency
Use of advanced technology in weather forecasting techniques
(12) Application of weather knowledge
Planning
Domestic
Oceanic (if applicable)
International
1467. APPROVAL OF AN EWINS
A Requests for Approval. Part 121 and Part 135 operators are not required to use an EWINS. These operators,however, may elect to establish and use an EWINS. All EWINS must be FAA approved. An operator orgroup of operators choosing to establish an EWINS must make a written request for approval. The lettermust describe the planned EWINS in sufficient detail to allow the POI (or POI'S) to evaluate the proposal.The letter must be accompanied by the proposed EWINS policy and procedures manual, details of anycontractual arrangements, and resumes of the key personnel employed by any commercial weather service tobe involved in the proposed EWINS.
B. Evaluations and Inspections of an EWINS. Before approving an EWINS, POIs must evaluate the materialsubmitted with the request for approval and conduct inspections of the facilities, equipment, and other com-ponents. POIs must also verify the professional qualifications and training of aviation meteorologists anddispatchers with FMF authority who will be used in the EWINS. When the POI has determined the proposedEWINS has the characteristic functions described in paragraph 1457, and complies with the FAA policystatements in paragraph 1459, and meets the criteria specified in paragraphs 1461, 1463 and 1465, theEWINS may be approved.
C. Approval or Denial of an EWINS
(1) Approval for a certificate holder to use an EWINS shall be accomplished by issuing operations spec-ifications paragraph AIO with reference to the EWINS policy and procedures manual to be used by theoperator. The original date of the EW INS manual, and the last revision date, shall also be referenced inparagraph A IO of the operations specifications. Any revisions to the EWINS and/or the EWINS manualshould be evaluated and inspected by the FAA as soon as possible, but not later than 15 days after therevision is made.
(2) If after evaluation and inspection, the POI determines a proposed EWINS does not meet the requirementsof this handbook, all submitted materials shall be returned to the operator with an explanatory letter.

A-6
This letter must state the proposed EWINS is not approved and clearly explain why. If an EWINS hasbeen approved, and a POI determines later that the EWINS does not continue to meet the requirements ofthis handbook, the POI shall immediately inform the certificate holder. If the certificate holder does nottake immediate and appropriate corrective action the POI must take action to amend paragraph AIO ofthe operations specifications and rescind approval of the EWINS.

B-1
Appendix B Parts 121/135 Weather Information Systems

B-2
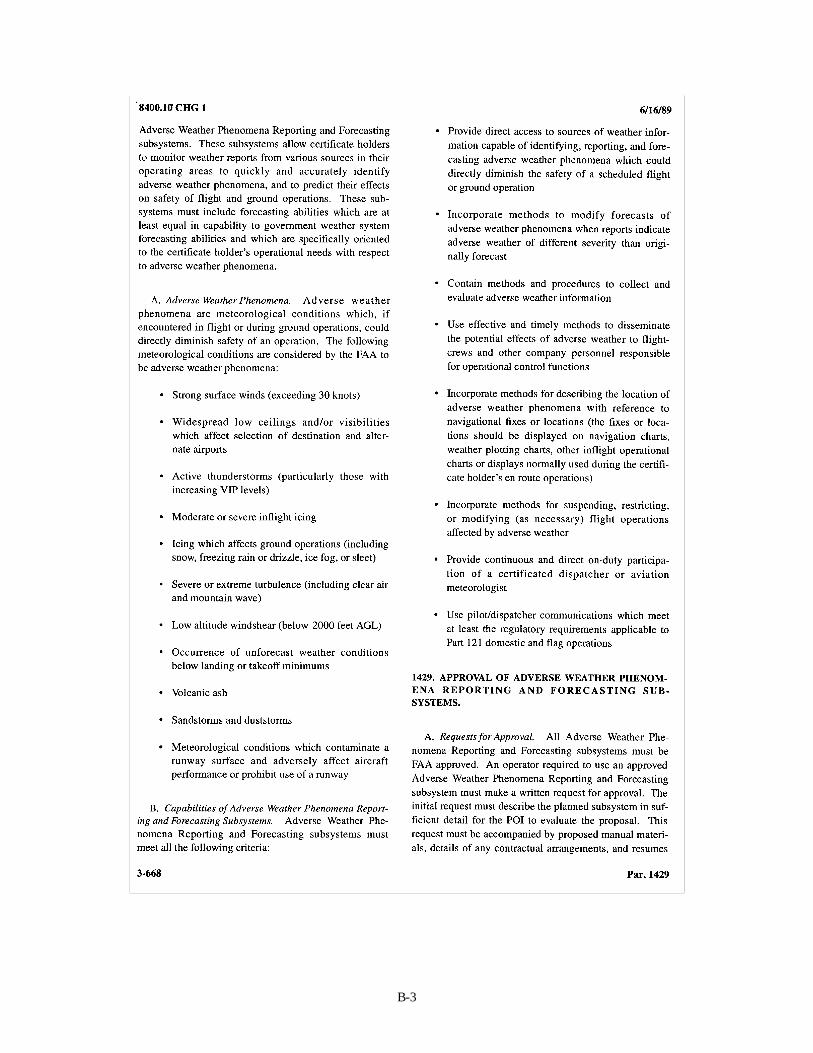
B-3

B-4

B-5

C-1
Appendix C Aviation Weather Products
4.7 C.1 International Aviation Products
4.7.1 C.1.1 Aviation Routine Weather Reports (METAR)
The aviation routine weather report (METAR), provided by the National Weather Service, containsinformation on surface conditions at the airport. The METAR is derived from human observations of theweather conditions and/or instruments located at the airport or from Automated Weather ObservingSystems (AWOS) or Automated Surface Observation Systems (ASOS). It represents weather informationthat is associated with only the terminal area. The METAR provides information on winds, visibility,runway visual range (RVR), weather phenomena, sky conditions, dewpoint, temperature, and altimetersettings. The reports are updated on an hourly basis. In the case of degrading weather conditions thatmay impact aviation in the terminal area, an Aviation Selected Special Weather Report (SPECI) may beissued. The SPECI contains the same information contained in the METAR, but with additional remarkspertaining to the information contained in the report. The SPECI is issued as soon as possible after thecriteria has been met. The SPECI provides real-time updates to support both tactical and near-termstrategic decisions in the terminal area. The current delivery systems for METAR to the cockpit areFSS/AFSS/EFAS, AWOS/ASOS, ATIS, D-ATIS, and TWIP. Each of these systems are described in thisappendix. [C-1, C-2, C-3, C-4, C-5]
4.7.2 C.1.2 Terminal Aerodrome Forecasts (TAF)
Terminal area forecasts or aerodrome forecasts (TAF) are prepared by the NWS weather forecastoffices and are issued four times a day. The schedule times are 000 UTC, 0600 UTC, 1200 UTC, and1800 UTC. The forecasts are valid for 24 hours. The forecasts contain specific information affectingaviation within five statute miles of the center of a runway complex. Weather information includes:wind, visibility, weather phenomena, sky conditions, optional data (e.g., windshear). Amended forecastsare made when significant changes in flight category and atmospheric conditions, which impact aviationare noted. The significant conditions are given in Reference [7.] The amended forecast may be issued atnon-scheduled times to alert pilots of changing conditions. TAFs are provided to the cockpit viaFSS/AFSS/EFAS. [C-1, C-2, C-6, C-7, C-8, C-9, C-10]
4.8 C.2 USA Aviation Products
4.8.1 C.2.1 In-Flight Advisories
In-Flight Advisories notify en-route pilots of the possibility of encountering hazardous flyingconditions.
4.8.1.1 C.2.1.1 Airman’s Meteorological Information (AIRMET)
Airman’s Meteorological Information is provided by the Aviation Weather Center. They advise ofweather that may be hazardous to single engine, light aircraft, or aircraft flying under VFR. TheAIRMET does not contain information on convective activity which is covered in a SIGMET. They areissued for weather conditions affecting or forecast to affect an area of at least 3000 square miles at onetime. AIRMETs are issued for six hour periods. There are three Types of AIRMET Bulletins: AIRMETSierra, AIRMET Tango and AIRMET Zulu. AIRMET Sierra items include ceilings less than 1000 feetand/or visibility less than three miles affecting over 50% at one time and Instrument Flight Rules (IFR)

C-2
and Extensive mountain obscuration. AIRMET Tango bulletins are issued for moderate turbulence andsustained surface winds exceeding 30 knots. AIRMET Zulu bulletins are issued for moderate icing andfreezing levels. Amendments may be made to AIRMETs as conditions warrant. [C-1, C-2, C-11]
4.8.1.2 C.2.1.2 Significant Meteorological Information (SIGMET)
Significant Meteorological Information is provided by the Aviation Weather Center. SIGMETs coverweather that is potentially hazardous to all aircraft. Items covered are severe and extreme turbulence,severe icing, volcanic ash and widespread dust or sandstorms that reduce visibility to less than threemiles. SIGMETs must be affecting or be forecast to affect an area of at least 3000 square miles at anyone time. There are three types of SIGMETs: Domestic, Convective and International. DomesticSIGMETs are issued for potential hazardous conditions other than convective. Weather items includesevere icing, severe or extreme turbulence, duststorms/sandstorms lowering visibility to less than threemiles and volcanic ash. SIGMETs issued for Alaska and Hawaii also include tornadoes, lines ofthunderstorms, embedded thunderstorms and hail less than or equal to 3/4 inch diameter. ConvectiveSIGMETs are used for any convective situation which the forecaster feels is hazardous to all aircrafttypes. They are issued for the Eastern (E), Central (C) and Western (W) United States for regionsaffecting 40% or more of an area at least 3000 square miles. Bulletins issued hourly and are valid for twohours. Weather items reported include: severe thunderstorms, embedded thunderstorms, lines ofthunderstorms and thunderstorms affecting 40% or more of a 3000 square mile area. InternationalSIGMETs are used for oceanic areas adjacent to the United States and routes over United States coastalwaters. They are issued by the Meteorological Watch Office (MWO). International SIGMET bulletinsare issued hourly and are valid for four hours for the following phenomena: thunderstorms, lines ofthunderstorms, embedded thunderstorms, large areas of thunderstorms, tornadoes, large hail, severe icing,severe or extreme turbulence and duststorms/sandstorms lowering visibility to less than three miles.Tropical cyclones are issued for six hours and volcanic ash is issued for twelve hours. [C-1, C-2, C-12,C-13]
4.8.1.3 C.2.1.3 Severe Weather Forecast Alerts/Severe Weather Watch (AWW/WW)
Severe Weather Forecast Alerts are a service provided by the National Severe Storm Forecast Center.Severe Weather Watches (WW), are issued by the Storms Prediction Center in Norman, Oklahoma. AnAlert Serve Weather Watch precedes a WW to notify users (e.g., WFOs, CWSUs, and FSSs) that a WWis to follow. AWW/WWs define areas of possible severe thunderstorms or tornado activity. Severethunderstorms are defined as those containing ¾ inch hail or greater and/or wind gust in excess of50 knots. AWW/WW messages are unscheduled and issued as required. [C-1, C-2]
4.8.1.4 C.2.1.4 Center Weather Advisories (CWA)
The Center Weather Service Unit of the National Weather Service at the Air Route Traffic ControlCenter (ARTCC) issues Center Weather Advisories. They are an unscheduled in-flight, flow control, airtraffic, and air crew weather. CWA are nowcast that aid flight crews in avoiding hazardous conditions enroute and in the terminal area. CWAs contain information about conditions that will exist within a twohour time period starting at the issuance of advisory. CWAs may modify or redefine a SIGMET,Convective SIGMET or AIRMET. [C-1, C-2]
C-3
4.8.2 C.2.2 Area Forecasts (FA)
Area forecasts (FA) are issued by the Aviation Weather Center for the 48 contiguous states, by theAlaska Aviation Weather Unit for Alaska, and by the NWS Weather Forecast Office in Honolulu for thatarea in the pacific. The area forecast contains VFR cloud information and weather conditions over anarea the size of several states. Information regarding IFR conditions are contained in the AIRMET Sierraweather product. The area forecasts contain twelve hour forecast with a six hour outlook. Theseforecasts are issued three times a day. Amendments to the FA are issued as needed. The AWC help pagenotes that AIRMET Sierra and FA may used in conjunction to provide en-route weather forecast and toestimate weather conditions at airports not supported by TAF. The FA provides en-route information toaid in both near and far-term strategic decisions. [C-1, C-2, C-14, C-15]
4.8.3 C.2.3 Route Forecast
Route Forecasts are issued by the NWS forecast offices for some 300 selected routes over thecontinental U.S. The forecasts provide information about atmospheric conditions along the route in acorridor 25 miles wide on either side. The forecasts include information on: Sky cover (height andamount of cloud base), Cloud tops, Visibility, Weather and Obstructions to vision. The information issimilar to that given in a TAF. Route forecasts are issued three times a day and are valid for 15 hours.
4.8.4 C.2.4 Meteorological Impact Statement (MIS)
The Center Weather Service Unit at the ARTCC issues a Meteorological Impact Statement. MISsprovide unscheduled weather information to aid in flow control, flight operations and planning. Theforecasts are targeted at events that will initiate to begin beyond two hours but within twelve hours afterissuance. It enables the impact of expected weather conditions to be included in air traffic controldecisions in the near future. MISs are issued for: Convective SIGMETs criteria, moderate or greater icingand/or turbulence, heavy or freezing precipitation, low IFR conditions, surface winds/gusts greater than orequal to thirty knots, low-level wind shear within 2,000 feet of the surface and volcanic ash, dust orsandstorms. [C-16]
4.8.5 C.2.5 Winds and Temperatures Aloft
Winds and Temperatures Aloft are computer prepared forecasts of wind direction and speed as well asforecast temperatures for different flight levels above specific navigation reference points. They aregenerated using models and inputs from a number of sensors including radiosonde and satellites. Thereports are provided by the National Center for Environmental Prediction. Winds and Temperatures Aloftare provided for 176 locations in the United States and twenty-one locations in Alaska. They are updatedtwice a day and include a six hour, a twelve hour and twenty four hour forecast. Each forecast includes avalid time, the forecast location, forecast winds for 3000 feet and forecast winds (heading and speed) andtemperature data at other flight levels. The forecast of winds and temperatures are provided for eightdiscrete elevations above mean sea level (6,000, 9,000, 12,000, 18,000, 24,000, 30,000, 34,000, and39,000 feet). [C-2, C-17]
4.8.6 C.2.6 Pilot Reports (PIREPs)
Pilot reports (PIREPs) are direct observations of the atmosphere by either instruments on board theaircraft (e.g., temperature probes and pilot tubes) or by the pilot. PIREPs are most often given in aspecified format and contain information on: sky cover (cloud amount, height of cloud base and height of
C-4
cloud tops), flight visibility, temperature, wind speed and direction, turbulence, icing, and remarks (whichmay contain information on wind shear if experienced by the pilot at low altitudes). PIREPs may betagged as routine or urgent to alert other pilot of hazardous conditions. PIREPs may also be used to fill inthe gaps between observations and to aid the NWS in verifying and refining a forecast. [C-1, C-2]
4.8.7 C.2.7 National Weather Service (NWS) Fax Products
The National Weather Service has several weather phenomena and products available to the aviationcommunity. These include: standard barotropic levels, winds/streamlines, surface analysis, weatherdepiction/significant weather, radar summary, cloud thickness, multi-panel forecasts, hemisphericproducts and miscellaneous products including precipitation, thunderstorm probability, freezing levels,observed temperatures and relative humidity. [C-18]
4.8.8 C.2.8 World Area Forecast System (WAFS) Fax Products
The National Weather Service, through the World Area Forecast System has available the followingweather information: winds, temperatures, significant weather and Volcanic Ash. [C-19]
4.8.9 C.2.9 High Level Significant Weather Charts
High Level Significant Weather Charts are issued by the Aviation Weather Center. They are providedfor the en-route portion of international flights. These charts are issued four times a day to aid airlinedispatchers and flight crews. The weather information is associated with flight levels between 25,000 feetand 60,000 feet. Items forecast include: thunderstorms and cumulonimbus clouds, tropical cyclones,severe squall lines, moderate or severe turbulence, moderate or severe icing, widespread sand storms anddust storms, well-defined surface convergence zones, surface fronts with speed and direction ofmovement, tropopause heights, jetstreams and volcanic eruptions. [C-20]
4.8.10 C.2.10 Low Level Significant Weather Charts
Low Level Significant Weather Charts are issued by the Aviation Weather Center. The low-levelgraphics product is a forecast of aviation weather hazards, providing graphical information to aid inbriefing the VFR pilot. The low level significant weather chart is composed of four panels displayinginformation on freezing levels, turbulence, low cloud ceilings, fronts, and precipitation areas. The chartsare issued four times a day at specified time periods. The ETA model is used to derive the charts, whichare valid for twelve to twenty four hours. Some of this information is provided by the National Center forEnvironmental Prediction and the Hurricane Prediction Center. The charts cover the 48 contiguous states,southern Canada, and the coastal water for flights below 24,000 feet. [C-21]
4.8.11 C.2.11 Hurricane Advisory
The National Weather Service will issue a Hurricane Advisory if a hurricane threatens a coastline butis still located at least 300 NM offshore. The advisory gives the location of the storm center, its expectedmovement and the maximum winds in and near the storm center. Hurricane advisories do not containdetails of associated weather, such as ceilings, visibility and hazards. [C-16]

C-5
4.8.12 C.2.12 Convective Outlook
Convective outlooks are issued by the Storm Prediction Center (SPC), in Norman, Oklahoma.Convective outlooks are a two-day forecast of severe and non-severe thunderstorms across the nation.They are used as a tool for planning flights later in the day to avoid thunderstorms. Convective Outlooksconsist of a Day 1 (24 hour) and a Day 2 (next 24 hour) forecast. These forecasts describe where a high,moderate or slight risk of thunderstorms exists. The forecast for the first 24 hours is issued/updated fivetimes a day (0600Z, 1100Z, 1500Z, 1930Z, and 0200Z) and the next 24 hours is issued/updated twice aday (0800Z and 1800Z). [C-16]
4.8.13 C.2.13 Stormscope
The Stormscope Series II Weather Mapping System from 3M is a real-time thunderstorm detectionand mapping system. Stormscope is the first airborne instruments developed specifically to detect andmap thunderstorms (with their potentially dangerous turbulence and convective wind shear). The BFGoodrich® WX-950 Stormscope® provides views of up to 200 NM with heading stabilization. It has asophisticated processor which precisely maps lightning while filtering out electronic pulses from othersources. In cell mode, the WX-950 detects lightning up to 200 nautical miles out and displays storm cellareas of greatest intensity. In strike mode, the WX-950 detects and maps individual strikes, allowing youto monitor sporadic electrical activity which may indicate the beginnings of a storm. [C-22, C-23]
4.8.14 C.2.14 Additional Charts
A number of weather related charts are also available to the aviation community. These include:Surface Analysis Chart, Weather Depiction Chart, Radar Summary Chart, Constant Pressure AnalysisChart, Composite Moisture Stability Chart, Winds and Temperature Aloft Chart, Convective OutlookChart and Volcanic Ash Forecast Transport and Dispersion Chart. For a complete description of thesecharts see [C-16].
4.9 C.3 Aviation Weather Radar and Satellite Products
4.9.1 C.3.1 Terminal Doppler Weather Radar (TDWR)
Terminal Doppler Weather Radar is a highly sensitive, high resolution radar are installed at 36 majorairports through the country to aid in the detection of wind shear (microbust), gusts, and heavyprecipitation in the terminal area. It is provided by the Federal Aviation Administration (FAA). TDWRis a C-band Doppler radar that automatically detects and displays a set of weather products from the radarbase data. Base data consists of estimates of reflectivity, mean Doppler velocity, spectrum width, andsignal-to-noise ratio. Data comes in a readily understood format that can be read directly to pilots. Radarand processor are typically located eight to twelve miles from the airport, because TDWR cannot lookdirectly up to see the weather developing overhead. There are four types of weather products: Microburstdetection, windshear detection, gust front detection and precipitation detection. The products aregraphical, alphanumeric, and/or an alarm representation of detected weather phenomena. TDWR has fourmajor functional divisions: Radar Data Acquisition (RDA), Radar Product Generation (RPG), RemoteMonitoring Subsystem (RMS) and Display functions. These four functions provide timely detection andreporting of hazardous windshear phenomena in and near the terminal approach and departure zones of anairport. [C-1, C-24, C-25]
C-6
4.9.2 C.3.2 Next Generation Weather Radar (NEXRAD)
The National Weather Service provides some 18 products which are generated by the WSR-88Dradars (or Next Generation Weather Service Radars (NEXRAD)) located thorough the country. Theseproducts are delivered to private companies, which then add value for resale. There are three privatecompanies, WSI, Kavouras and UNISYS, that are permitted to receive NEXRAD products under theNEXRAD Information Dissemination System. These companies add value (e.g., overlays) to theproducts and then resell them. The NWS also provides direct feeds to different agencies within thefederal government, which are responsible for air traffic safety and management. NEXRAD is an "S"band Doppler weather radar capable of detecting the location, severity, and movement of both routine andhazardous weather phenomena in the en-route and oceanic environment. These capabilities allow formore efficient air traffic control since aircraft can be rerouted around bad weather systems detected inadvance. The FAA is deploying NEXRAD systems at non-CONUS (offshore) locations such as Alaska,Hawaii and the Caribbean. [C-1, C-2, C-26]
4.9.3 C.3.3 Radar Weather Report
The WSR-88D radars located across the country provide weather reports that contain information onthe type (limited to rain, rain shower, snow, snow shower, and thunderstorm), intensity, and location ofthe echo top of the precipitation. These reports are generated every hour by the NWS. The reports aregiven in a coded format. [C-16]
4.9.4 C.3.4 Radiosonde Additional Data (RADAT)
Radiosonde additional data is obtained from radiosonde observations, which are conducted everytwelve hours. Radiosondes are instrumented balloons that are released at specified locations across thecountry. The balloons are released at 0000Z and 1200Z. RADAT is a report generated from thesesoundings. Data is measured and transmitted, via radio transmitter, to a ground station. RADATinformation includes: the observed freezing level (height) and the relative humidity associated with thefreezing level. [C-16]
4.9.5 C.3.5 Weather Radar (Airborne)
Airborne weather radars provide real-time information on precipitation and windshear events. Theinformation may be displayed graphically or provided audibly as a warning (e.g., in the case of ahazardous wind shear event).
4.9.6 C.3.6 Airport Surveillance Radar
An alternative solution to the more expensive TDWR, is to add a Weather System Processor (WSP) tothe existing Airport Surveillance Radars (ASR-9) to extract weather information from the measured datain the terminal area. There are currently 34 airports that have this capability. Hazard information isreported directly to the ATC tower.
4.9.7 C.3.7 Satellite Imagery
The National Weather Service/FAA as well as private companies provide visible & infrared satelliteimagery through weather satellites in orbit. There are two types of Satellites: Geostationary OperationalEnvironment (GOES) Satellite and the National Oceanic and Atmospheric Administration (NOAA)

C-7
satellite. The two GOES satellites cover North and South America and the surrounding waters. Eachtransmits an image of the earth, pole to pole every 15 minutes. If severe weather exists, the satellites canscan small areas rapidly and transmit images as often as every 7.5 minutes. The NOAA satellite orbitsthe earth on a track that nearly crosses the north and south poles. Two types of imagery are available:Visible, which is available only during the day and Infrared, which is available both day and night. Thetype of cloud (from shape & texture), temperature of cloud tops, height of cloud and the thickness ofcloud layers can be determined through interpretation. [C-16]
4.10 C.4 Aviation Weather Sensors
4.10.1 C.4.1 Low-Level Windshear Alert System (LLWAS)
The Low-Level Windshear Alert System is provided by the Federal Aviation Administration.LLWAS provides air traffic controllers and pilots with information on microbursts and windshear in theterminal area. It uses a network of anemometers to determine the presence of dangerous windshear andmicrobursts on or near airports. There are two configurations for the 110 LLWASs currently inoperation: LLWAS-2 and LLWAS Network Expansion (NE). LLWAS-2 uses six anemometers locatedaround the airport to measure and report sector-oriented wind direction, speed and gust. LLWAS-NEuses a much larger network of up to 32 anemometers to provide increased probability of detectingmicrobursts and windshear on the airport and along the runway corridors. The LLWAS-NE can beintegrated with the TDWR and provide an interface to the maintenance processor system. The LLWAS islocated at 39 airports through the country. The LLWAS system provides hazard information directly tothe ATC tower. [C-1, C-2, C-27]
4.10.2 C.4.2 Automated Weather Observing Systems (AWOS)
The Automated Weather Observing Systems provided by the FAA, consist of various sensors,processors, computer-generated voice subsystems, and a transmitter to broadcast local weather datadirectly to pilots via a VHF discrete frequency or a navigational aid voice channel as a voice message.The basic AWOS sensors provide wind speed and direction, temperature, dew point, pressure (altimetersetting), visibility, and cloud height information. [C-1, C-2, C-28]
4.10.2.1 C.4.2.1 AWOS Data Acquisition System (ADAS)
The AWOS Data Acquisition System (ADAS) was developed to collect (from AWOS), process, andarchive weather data and then disseminate this information to various National Airspace System (NAS)subsystems. [C-29]
4.10.2.2 C.4.2.2 Automated Lightning Detection & Reporting System (ALDARS)
The Automated Lightning Detection & Reporting System (ADAS/ALDARS) eliminates manualobservation of lighting at airports by having the ADAS collect, process and disseminate the NationalLightning Detection Network (NLDN) data. [C-2, C-30]
4.10.3 C.4.3 Automated Surface Observation Systems (ASOS)
The Federal Aviation Administration Automated Surface Observation Systems consist of varioussensors, processors, computer-generated voice subsystems, and a transmitter to broadcast local weatherdata directly to pilots. ASOS provides surface weather observations in METAR format which is updated
C-8
every sixty seconds, or when weather conditions cross preset thresholds for ceiling height and/orvisibility. Data is transmitted over discrete VHF or voice portion of local NAVAID. Each ASOScontains: cloud height indicator, visibility sensor, precipitation identification, freezing rain sensor,pressure sensor, ambient temperature/dew point temperature sensor, anemometer (wind direction andspeed sensor) and rainfall accumulation sensor. [C-1, C-2, C-31, C-32, C-33]
4.10.4 C.4.4 Runway Visual Range (RVR)
Runway Visual Range is an FAA product which measures visibility, background luminance, andrunway light intensity to determine the distance a pilot should be able to see down the runway. It is usedto define the precision landing category of operations. The forward scatter visibility sensor, whichmeasures the amount of light scattered by fog or snow particles, is designed and proven to perform overthe full range of instrument meteorological weather. The system measures RVR from 6500 feet to 0 feetin all conditions of fog, snow, and freezing rain. [C-1, C-34, C-35]
4.11 C.5 Aviation Weather Processors
4.11.1 C.5.1 Weather Systems Processor (WSP)
The Airport Surveillance Radar-9 (ASR-9) Weather Systems Processor is provided by the FAA toenhance the safety of air travel through the timely detection and reporting of hazardous windshear in andnear the terminal approach and departure zones of an airport. Specific sources of the hazardouswindshear that are to be detected are microbursts and gust fronts. The WSP detects, locates, quantifies,and displays low altitude terminal area windshear and microburst events. It Generates runway specificalerts in the event of hazardous windshear and microburst events. It detects, locates, quantifies, predictsand displays the current and future location of gust fronts. It detects, locates, quantifies and extrapolatesthe future position of, storm cells. The WSP generates National Weather Service six-level precipitationintensity maps and reduces false heavy precipitation errors caused during atmospheric conditions ofAnomalous Propagation (AP). [C-1, C-36, C-37]
4.11.2 C.5.2 Meteorologist Weather Processor (MWP)
The FAA Meteorologist Weather Processor provides the processing tools to consolidate weather datafrom multiple sources into one database. Processed data is used to provide weather updates and forecastsfor air traffic personnel. [C-38]
4.11.3 C.5.3 Integrated Terminal Weather System (ITWS)
The Integrated Terminal Weather System is an FAA automated weather system that provides nearterm (thirty minute) prediction of significant terminal area weather in the terminal domain. The ITWSacquires, processes, and disseminates weather products to other subsystems and users. It providesNEXRAD and TDWR weather radar data and enhanced terminal forecasts to the controller’s trafficdisplay at the Terminal Radar Approach Control (TRACON) and airport control tower facilities. Itprovides the air route traffic control center (ARTCC) with information to help track storm activity atmajor airports and to coordinate traffic flow with the TRACONs. It also generates products includingwindshear and predictions, storm cell and lightening information, and terminal area winds aloft. TheITWS can differentiate between real and false weather returns. [C-2, C-39]

C-9
4.11.4 C.5.4 Weather and Radar Processor (WARP)
The FAA Weather and Radar Processor receives and processes real time weather data from multiplesources, and produces displays of weather information for multiple users in the en route domain. WARPacquires, processes, and disseminates weather products to other subsystems and users. It provides amosaic of NEXRAD data to the ARTCC controller’s traffic display and improved weather data toARTCC meteorologists, traffic managers, and flight service station specialists via the operational andsupportability implementation system (OASIS). WARP will replace existing Meteorologist WeatherProcessor (MWP) systems. [C-2, C-40, C-41]
4.12 C.6 Aviation Weather Delivery Systems/Services
4.12.1 C.6.1 In-Flight Delivery Systems
4.12.1.1 C.6.1.1 Air Route Traffic Control Center (ARTCC)
Federal Aviation Administration Air Route Traffic Control Centers are capable of directcommunications with IFR air traffic on certain frequencies. ARTCCs broadcast Severe weather forecastalerts (AWWs), Convective SIGMETs, SIGMETs, or Center Weather Advisories (CWAs). ARTCCsalert once on all frequencies, except emergency, when any part of the area described is within 150 milesof the airspace under their jurisdiction. [C-1, C-2]
4.12.1.2 C.6.1.2 Hazardous In-Flight Weather Advisory Service (HIWAS)
The Federal Aviation Administration Hazardous In-Flight Weather Advisory Service is a continuousbroadcast of recorded in-flight weather advisories. HIWAS broadcasts: AWW, Convective SIGMETs,SIGMETs, CWAs, AIRMETs and Urgent PIREPs. Where HIWAS has been implemented, a HIWASalert will be broadcast on all except emergency frequencies once upon receipt by ARTCC and terminalfacilities, which will include an alert announcement, frequency instruction, number, and type of advisoryupdated. [C-1, C-2]
4.12.1.3 C.6.1.3 Transcribed Weather Broadcast (TWEB)
Transcribed Weather Broadcast are provided by the National Weather Service, World Forecast Office(WFO). TWEBs provide continuously updated recorded weather information and aeronautical data forshort or local flights. TWEBs are based on a route-of-flight concept. Broadcasts are made from a seriesof individual tape recordings, and changes, as they occur, are transcribed onto the tapes. Informationavailable includes: In-Flight Advisories, winds aloft, METAR/SPECI, Notice’s to Airmen (NOTAMs)and any other special notices. TWEB products are valid for twelve hours and are issued four times a day.[C-1, C-2, C-16]
4.12.1.4 C.6.1.4 Automatic Terminal Information Service (ATIS)
The FAA’s Automatic Terminal Information Service is a continuous broadcast of recorded non-control information. It is primarily used by airports for weather/runway conditions of importance toarriving and departing aircraft. ATIS is broadcast over discrete VHF radio or the voice portion of a localNAVAID. [C-1, C-2]

C-10
4.12.1.5 C.6.1.5 Aircraft Communications Addressing and Reporting System (ACARS)
The Aircraft Communications Addressing and Reporting System is a VHF air/ground datalink thatrelays Aircraft Operational Control (AOC), Airline Administrative Control (AAC), and Air TrafficControl (ATC) messages between ground-based organizations and the cockpit. Aeronautical Radio, Inc.(ARINC) was the first to design and implement a VHF data link using dedicated aeronautical frequenciesto transmit ACARS information from aircraft to ground host processing facilities. Weather information isprovided to the cockpit in digital format. In-Flight Weather Information currently available: TerminalWeather Information for Pilots (TWIP), Digital Automated Terminal Information Service (D-ATIS),airport weather, runway status, field conditions, and various products from resources within AOC. [C-2,C-42]
4.12.1.6 C.6.1.6 Terminal Weather Information for Pilots (TWIP)
Terminal Weather Information for Pilots provides ground-based terminal weather information to pilotsvia ACARS. It is generated using weather data from Terminal Doppler Weather Radar (TDWR) or theIntegrated Terminal Weather System (ITWS) testbed. TWIP is updated every minute for text messagesand every five minutes for character graphics messages. TWIP data includes microburst alerts, windshear alerts, gust fronts, significant precipitation and convective activity within 30 NM of the terminalarea. [C-1, C-2]
4.12.1.7 C.6.1.7 Operational and Supportability Implementation System (OASIS)
OASIS is a Federal Aviation Administration program designed to enhance the safety, security, andefficiency of the National Airspace System (NAS) and to reduce the supportability problems of theexisting Flight Service Automation System. The capabilities provided by OASIS include: alphanumericand graphic weather product acquisition and display, flight plan processing, search and rescue services,administrative and supervisory capabilities, flight planning and regulatory information and systemmaintenance functions. The weather graphic capabilities include: capability to acquire, display, and storenear real-time weather radar images and products, weather satellite imagery and lightning detection data.[C-43]
4.12.1.8 C.6.1.8 Flight Information Service (FIS)
Flight Information Service is an FAA generated data link program. FIS provides information for safeflight and flight planning in the air and on the ground. FIS provides weather products from the Weatherand Radar Processor (WARP), the Integrated Terminal Weather System (ITWS) and aeronauticalinformation to pilots by commercial service providers. [C-2]
4.12.1.9 C.6.1.9 Direct User Access Terminal System (DUATS)
DUATS is an FAA funded program which provides immediate online access to FAA approvedinformation. DUATS can be accessed by pilots with a current medical certificate via personal computer.Information is current, continuously updated, and easy-to-understand. DUATS includes graphicalweather maps, flight plan filing and closing, and automated flight planning. DUATS can receive alpha-numeric preflight weather data and file domestic VFR and IFR flight plans. Two commercial vendorsprovide Service: Data Transformation Corporation (DTC) and GTE Federal System Division. GTEDUATS only provides weather for the United States, including Alaska, Hawaii, and Puerto Rico. Theflight planning databases contain only U.S. airports, navigational aids, and airways. Flight plan filing can
C-11
only be done for plans that would be filed with U.S. FAA facilities (flight service stations for VFR flightplans and air traffic control facilities for IFR flight plans). [C-1, C-44, C-45]
4.12.2 C.6.2 Aviation Weather Call-Up Services
4.12.2.1 C.6.2.1 Flight Service Stations (FSS)
Flight Service Stations are FAA traffic facilities which provide pilot briefings, en routecommunications and VFR search and rescue services, assist lost aircraft in emergency situations, relay airtraffic control clearances, originate NOTAMs, broadcast aviation weather and NAS information, receiveand process IFR flight plans and monitor navigational aids (NAVAIDs). Most of the older FSSs havebeen consolidated and replaced with Automated Flight Service Stations (AFSSs). [C-1, C-2]
4.12.2.2 C.6.2.2 Automated Flight Service Stations (AFSS)
Federal Aviation Administration Automated Flight Service Stations are replacing FSSs. AFSSsprovide preflight and in-flight briefings, transcribed weather briefings, scheduled and unscheduledweather broadcast and furnishes weather support to flights in its area. AFSSs also provide VFR searchand rescue services, assist lost aircraft and aircraft in emergency situations, relay ATC clearances,originate NOTAMs, broadcast aviation weather and NAS information and receive and process IFR flightplans. [C-1, C-2]
4.12.2.3 C.6.2.3 En Route Flight Advisory Service (EFAS), (Flight Watch)
En Route Flight Advisory Service (Flight Watch) is a Federal Aviation Administration program whichprovides en-route aircraft weather advisories pertinent to the type of flight intended, route of flight, andaltitude. It is intended for weather updates only. EFAS is available 6am to 10pm. EFAS is provided byspecially trained aviation weather specialists in selected AFSSs. [C-1, C-2, C-46]
4.12.2.4 C.6.2.4 Pilot’s Automatic Telephone Weather Answering System (PATWAS)
PATWAS is a continuous telephone recording of meteorological and/or aeronautical informationprovided by FSS briefing offices. PATWAS messages are recorded and updated at a minimum of everyfive hours. [C-16]
4.12.2.5 C.6.2.5 Telephone Information Briefing Service (TIBS)
The Telephone Information Briefing Service is provided by Automatic Flight Service Stations(AFSSs). TIBS is a continuous recording of meteorological and aeronautical information. It providesarea and/or route briefings, airspace procedures, and special announcements. TIBS also provides surfaceobservations, METARs, TAFs, and winds/temperature aloft forecasts. [C-1]
4.13 C.7 Aviation Weather Data Sources
4.13.1 C.7.1 National Weather Service Telecommunications Gateway (NWSTG)
The National Weather Service Telecommunications Gateway is provided by the National WeatherService. It provides unaltered weather information services to Government, Commercial andInternational customers. Weather information service is known as the NWS FOS (Family of Services).

C-12
There are six data streams of weather information: Public Product Service, Domestic Data Service (DDS),International Data Service, High Resolution Data Service, Digital Facsimile Service, AFOS GraphicsService. [C-2]
4.13.1.1 C.7.1.1 Domestic Data Service (DDS)
The NWS Domestic Data Service provides users with coded observations, reports, forecasts andanalyses. Aviation Weather Products available on the Domestic Data Service include: METAR/SPECI,TAF, FA, AIRMETs, SIGMETs, Convective SIGMETs, CWA (Center Weather Advisories), WindsAloft, PIREPs/Urgent PIREPs, Meteorological Impact Statements, Offshore Aviation Area Forecasts,PIBAL Observations, Hourly Observations, Transcribed Weather Broadcasts and Wind and TemperatureForecasts. [C-2]
4.13.2 C.7.2 Aviation Digital Data Service (ADDS)
The Aviation Digital Data Service is developed as the data distribution component of the FAAAviation Gridded Forecast System (AGFS). It is a Web-based aviation Weather products/informationtool. ADDS makes available digital and graphical analyses, forecasts, and observations of meteorologicalvariables. Aviation weather products available on ADDS include: PIREPs, AIRMETs, METARs, TAFs,IFR, WINDS, ICING, TURBULENCE, CONVECTIVE, SATELLITE and RADAR. [C-2, C-47]
4.13.3 C.7.3 Weather Concepts
Weather Concepts is a Web-based aviation weather products/information tool. It is provided byWeather Concepts Online Services. Available weather products include: TAFs, AIRMETs, FAs, Windsand Temperatures Aloft, NOTAMs, PIREPs, SIGMETs, Convective SIGMETs, TWEBs, Satellite,National Radar and Local NEXRAD. Weather Concepts updates every eight minutes for LocalNEXRAD, thirty to sixty minutes for Live Weather and every twelve to twenty four hours for ForecastedWeather Depictions Charts. [C-48]
4.13.4 C.7.4 International Flight Folder Documentation Program (IFFDP)
The United States provides standardized meteorological information to all countries under theInternational Civil Aviation Organization (ICAO). The International Flight Folder DocumentationProgram is a standardized meteorological service provided to ensure safety of flight and a consistent levelof service worldwide. Weather data is obtained from the World Area Forecast System (WAFS) out of theOffice of System Operations and the AWC, utilizing a high-speed data line. The AWC providesmeteorological information to flight crews and operators for (1) dispatch planning, (2) flight crew pre-flight, and (3) en-route decisions. Information is provided for specific airports within the U.S. Theinformation is packaged as a folder contains the following weather products: wind and temperature aloftforecast charts, significant weather charts, Terminal Aerodrome Forecasts (TAFs) for departure,destination and alternate, SIGMET charts of tropical cyclones and/or volcanic ash as appropriate,METAR/SPECI, SIGMETs and appropriate special air reports (aireps). This information is available asFAX products or on the internet. The information is tailored to the specific route and altitude and for thedeparture, destination, and alternate airport. [C-49]

C-13
4.14 C.8 Experimental Forecast Products
4.14.1 C.8.1 Aircraft Vortex Spacing System (AVOSS)
NASA’s Langley Research Center is currently developing the Aircraft Vortex Spacing System.AVOSS will provide the means to allow Air Traffic Control to safely reduce spacing in instrumentoperations when the appropriate weather conditions exist. The full benefit of AVOSS will be realizedwhen interfaced to advanced Air Traffic Control (ATC) automation, such as the Center-TRACON(Terminal Radar Approach Control) Automation System (CTAS). The AVOSS differs substantially fromprevious efforts to deploy wake vortex systems in that the atmospheric conditions from the surface to thetop of the instrument approach path are measured and used, rather than only surface wind. AVOSSPerforms the integration of several subsystems: The Weather Subsystem is responsible for providingmeasurements of wind, temperature, and turbulence levels aloft as well as making short term predictionsof likely weather changes in the next hour. The Predictor Subsystem predicts the time required for thewake vortices of approaching aircraft to move out of the approach corridor or to decay. The Wake SensorSubsystem provides an independent measurement of actual wake vortex behavior. This measurementprovides a safety monitoring function to prevent reduced separation from being applied if the WeatherSubsystem or Prediction Subsystem fails to predict long lived wakes. [C-50]
4.14.2 C.8.2 Convective Forecasts
4.14.2.1 C.8.2.1 Vertical Velocity Storm (VVSTORM)
Vertical Velocity Storm is provided by the Aviation Weather Center (AWC). The AWC computesgrids of VVSTORM every hour. Forecasts are out from two or three to twelve hours. VVSTORM usesnumerical model outputs from toady's numerical models to find the most unstable air parcel at a modelgrid point. It then lifts that parcel with a vertical velocity determined by the maximum of one of threemethods: frontogenesis, Eckman pumping, or model-based omega. If that parcel reaches its Level of FreeConvection (LFC) still with an upward vertical velocity, then buoyancy takes over and accelerates theparcel upward through the troposphere until it reaches the Equilibrium Level (EL). At the EL the parcelbegins deceleration. The vertical velocity at the EL is a measure of a thunderstorm's intensity. [C-51]
4.14.2.2 C.8.2.2 Probabilistic Outlook
The Aviation Weather Center/Storm Prediction Center (SPC) provides a tool called ProbabilisticOutlook. Probabilistic Outlook includes forecasts of Tornado Probabilities, Severe Hail Probabilities andSevere Thunderstorm/Wind Event Probabilities. As part of this effort, a scheme has been developed toconvey the expected likelihood of large hail, damaging winds, and tornadoes in terms of probabilities.Probability forecasts will allow forecasters more flexibility in producing forecasts, plus the graphics willprovide more explicit information regarding the severe weather threat. [C-52]
4.14.3 C.8.3 Turbulence Forecasts
4.14.3.1 C.8.3.1 Mountain Wave (MWAVE)
Mountain Wave (which can also be called gravity waves) is defined as turbulence caused by mountainwaves. MWAVE is a mountain wave diagnostic developed by the Experimental Forecast Facility (EFF)at the Aviation Weather Center. Mountain waves develop as air flows over a mountain in a stablestratified atmosphere. Mountain Waves can propagate both horizontally and vertically because there is no

C-14
sharp density boundary in the atmosphere. MWAVE computes two diagnostics: the strength of the wave,which MWAVE estimates as the drag the mountain wave exerts on the atmosphere and the breakingpotential, which MWAVE estimates as a non-dimensional wave amplitude. [C-53]
4.14.4 C.8.4 Icing Forecasts
4.14.4.1 C.8.4.1 Neural Network Icing (NNICE)
Neural Network Icing is an icing intensity predictive forecast tool being developed by the AviationWeather Center. Neural networks are an artificial intelligence tool that does very well at patternrecognition. The maps of icing intensity are composites of the output of two neural networks taught topredict icing intensity from input data of temperature, relative humidity, and convective potential fromthe Rapid Update Cycle model. The output values range from zero to six with zero representing no icingand six severe icing. A two is light icing and a four is moderate icing. [C-54]
4.14.4.2 C.8.4.2 Vertical Velocity Icing (VVICE)
Vertical Velocity Icing is a physically-based aircraft icing diagnostic/forecast tool developed by theAviation Weather Center. VVICE bases aircraft icing forecasts on ice accumulation potential and thesubsequent degradation of aircraft performance. The pilot that encounters icing will increase power tomaintain altitude and airspeed. VVICE shows forecast icing contours as a Percent Power Increase (PPI)required to overcome the additional drag so the aircraft can continue at a steady speed and altitude.VVICE attempts to: improve aircraft icing forecasts, improve communication of the icing threat to pilots,and improve pilot reporting of the icing threat back to forecasters. VVICE not only forecastsmeteorological factors but also makes an initial interpretation of the possible aerodynamic consequencesof these forecasts. [C-55]
4.15 C.9 Commercial Aviation Weather Providers
Several private weather companies provide pre-flight briefing services and aviation weatherinformation for pilots. The most common are: [C-2]
Company Weather Tools Web Site
Kavouras Weatherlink Vistas http://kavouras.com/
WSI PILOTbrief VECTOR http://www.wsicorp.com/
UNISYS Weather Processor http://www.weather.unisys.com/
Alden Weather Works http://www.alden.com/
Universal Windstar Plus http://www.univ-wea.com/
Accu-Wx AMPS/AccuData http://www.accuweather.com/
GTE Skycentral DUATS http://www.skycentral.com/
Harris WeatherTAP - Aviation Weather http://www.hisd.harris.com/
WINGS – OASIS Workstation equiv. to DUATS
WINDS – Part of WARP System

C-15
4.16 References
3-1. Irvin N. Gleim, FAR/AIM Reprint, Federal Aviation Regulations and Aeronautical InformationManual, 1998, Gleim Publications, Inc.
3-2. Lockheed Martin Aeronautical Systems, NASA John H. Glenn Research Center at Lewis Field,Data Communications Requirements, Technology and Solutions for Aviation Weather InformationSystems, Phase I Report, Aviation Weather Communication Requirements, June 1999.
3-3. National Weather Service METAR/TAF information, http://www.nws.noaa.gov/oso/oso1/oso12/metar.htm
3-4. METAR/TAF, http://www.faa.gov/avr/news/Metar.htm
3-5. METAR Data Access, http://weather.noaa.gov/weather/metar.shtml
3-6. National Weather Service Operations Manual, Part D, Chapter 31, Part 1, June 6, 1997.
3-7. National Weather Service Operations Manual, Part D, Chapter 31, Part 2, June 6, 1997.
3-8. National Weather Service METAR/TAF information, http://www.nws.noaa.gov/oso/oso1/oso12/metar.htm
3-9. METAR Data Access, http://www.faa.gov/avr/news/Metar.htm
3-10. TAF Data Access, http://weather.noaa.gov/weather/taf.shtml
3-11. Aviation Weather Center, “What is are AIRMETs?”, http://www.awc-kc.noaa.gov/awc/help/what_are_airmets.html
3-12. Aviation Weather Center, “What is are SIGMETs?”, http://www.awc-kc.noaa.gov/awc/help/what_are_sigmets.html
3-13. Aviation Weather Center “What are Convective SIGMETs?”, http://www.awc-kc.noaa.gov/awc/help/what_are_convective_sigmets.html
3-14. Aviation Weather Center “What are Aviation Area Forecasts?”, http://www.awc-kc.noaa.gov/awc/help/what_is_the_fa.html
3-15. Aviation Weather Center, “What is an Aviation Area Forecast?”, http://204.185.136.10/awc/help/what_is_the_fa.html.
3-16. Irvin N. Gleim, Aviation Weather and Weather Services, 1998, Gleim Publications, Inc.
3-17. Aviation Weather Center “What are Winds and Temperatures Aloft?”, http://www.awc-kc.noaa.gov/awc/help/what_are_fd.html
3-18. NWS Fax Charts, http://weather.noaa.gov/fax/nwsfax.shtml
3-19. WAFS Facsimile (T4) Charts, http://weather.noaa.gov/fax/wafsfax.shtml
3-20. About High Level SIGWX Charts (FL250-FL600), http://www.awc-kc.noaa.gov/awc/help/sgwxinfo.html
3-21. About Aviation Low Level SIGWX Charts, http://www.awc-kc.noaa.gov/awc/help/lolvlinfo.html
3-22. American Flying Adventures, Stormscope, http://www.amfly.com/wx950.html
3-23. Georgia Avionics, Stormscope, http://www.gaavionics.com/wx1000.htm
3-24. Terminal Doppler Weather Radar, http://www.af.jccbi.gov/aboutaf/org/440/tdwr/tdwr.htm
3-25. FAA, Terminal Doppler Weather Radar, http://wx.aw.tc.faa.gov/tdwr.htm
3-26. FAA, Next Generation Radar, http://wx.aw.tc.faa.gov/nexrad.htm

C-16
3-27. FAA, Low-Level Windshear Alert System, http://wx.aw.tc.faa.gov/llwas.htm
3-28. FAA, AWOS Information, http://www.faa.gov/asos/awosinfo.htm
3-29. FAA, AWOS Data Acquisition System (ADAS), http://wx.aw.tc.faa.gov/aldars.htm
3-30. FAA, Automated Lightning Detection & Reporting System, http://wx.aw.tc.faa.gov/aldars.htm
3-31. AWOS Data Acquisition System (ADAS), http://wx.aw.tc.faa.gov/ace.htm
3-32. ASOS: Automated Surface Observing System, http://www.nws.noaa.gov/asos/index.html
3-33. ASOS Information, http://www.faa.gov/asos/asosinfo.htm
3-34. Federal Meteorological Handbook No. 1 Chapter 7 RUNWAY VISUAL RANGE,http://www.nws.noaa.gov/oso/oso1/oso12/fmh1/fmh1ch7.htm
3-35. FAA, New Generation Runway Visual Range (RVR), http://wx.aw.tc.faa.gov/rvr.htm
3-36. FAA Weather Systems Processor (WSP), http://wx.aw.tc.faa.gov/wsp.htm
3-37. http://wx.aw.tc.faa.gov/WeatherRadarGrp/Wsp/Wsp.htm
3-38. Weather Systems Processor, www.faa.gov/and/and400/and460.htm
3-39. FAA, Integrated Terminal Weather System (ITWS), http://wx.aw.tc.faa.gov/itws.htm
3-40. FAA, Weather and Radar Processor (WARP), http://wx.aw.tc.faa.gov/warp.htm
3-41. WARP, http://www.faa.gov/aua/ipt_prod/weather/warp1.htm
3-42. ARINC, ACARS, http://www.arinc.com/Products_Services/acars.html
3-43. Welcome to the OASIS Homepage, http://www.faa.gov/aua/ipt_prod/oasisweb/
3-44. GTE Federal Systems, http://www.duats.com/
3-45. Data Transformation Corporation, http://www.duat.com/,
3-46. Enroute Flight Advisory Service http://www.faa.gov/ats/afss/gnvafss/EFAS.HTM
3-47. Aviation Digital Data Service, http://adds.awc-kc.noaa.gov/
3-48. Weather Concepts, http://weatherconcepts.com/
3-49. AWC, International Flight Folder Documentation Program, http://www.awc-kc.noaa.gov/awc/iff/iffdp.html
3-50. The Aircraft Vortex Spacing System (AVOSS), http://avsp.larc.nasa.gov/avoss/
3-51. AWC, Vertical Velocity Storm, http://www.awc-kc.noaa.gov/awc/vvstorm.html
3-52. AWC, Experimental Forecast Products, http://www.awc-kc.noaa.gov/awc/experimental.html
3-53. AWC, Mountain Wave, http://www.awc-kc.noaa.gov/awc/mwave.html
3-54. AWC, Neural Network Icing, http://www.awc-kc.noaa.gov/awc/nnice.html
3-55. AWC, Vertical Velocity Icing, http://www.awc-kc.noaa.gov/awc/vvice.html

D-1
Appendix D Example Survey Form
July 29, 1999
RE: NASA Survey
Tom:
Attached is the NASA /GTRI survey for which you have kindly agreed to participate. If youhave any questions please don’t hesitate to call or e-mail with your questions.
This survey is in Word 97 format. If you have any difficulty opening the document please let usknow. Once you have opened the document please print the document and enter yourresponses on the printed survey. DO NOT ENTER YOUR RESPONSES DIRECTLY TO THEWORD DOCUMENT. If you can have 2 or 3 pilots complete the survey it will help to get morediverse opinions on weather products.We would appreciate your returning the completed survey to us by mail or fax not laterAugust 6, 1999. Please send or fax the survey to:
Cliff EckertAerospace and Transportation LaboratoryGeorgia Tech Research Institute7220 Richardson RoadSmyrna, GA 30080Fax 770 528-3271
NASA and GTRI greatly appreciate your time and effort.

D-2
AVIATION WEATHER INFORMATION REQUIREMENTS STUDY
NASA Langley Research Center has tasked Georgia Tech Research Institute to conduct a survey ofaviation weather users as part of the Aviation Weather Information (AWIN) Requirements Study. AWINis a level III project under the NASA Aviation Safety Program’s (AvSP), Weather Accident Preventionelement. The goal of the Weather Accident Prevention element is to “develop and support theimplementation of technologies to reduce aviation weather-related accidents and focus its work in threeareas: synthetic vision displays, turbulence detection and mitigation, and aviation weather informationdistribution and presentation.”
The purpose of this survey is to gather information from the various weather information stakeholderson weather information functional utility and availability for aeronautical decision making. Theinformation gathered in this survey will be combined in a database with weather product characteristics,flight phase characteristics, aircraft characteristics and weather element characteristics. The database willbe used to develop correlations between “users”, flight phases, hazards, and weather products. It willassist in determining weather information shortfalls and will aid in developing requirements that representthe most effective path to improving weather information.
What follows is a questionnaire seeking responses from various aviation weather user perspectives.Individual responses will not be divulged or made public. Once the responses have been reviewed byGTRI, further dialogue may be necessary to clarify your responses or to ask additional information.
Please contact Cliff Eckert (770 528-7933), Chuck Stancil (770 528-3224) or Susan Brown (770 528-7889) if you have any questions.
We appreciate the time and effort you put into responding to this survey. Ultimately, your time andeffort will lead toward better weather information and a reduction in weather related accidents.
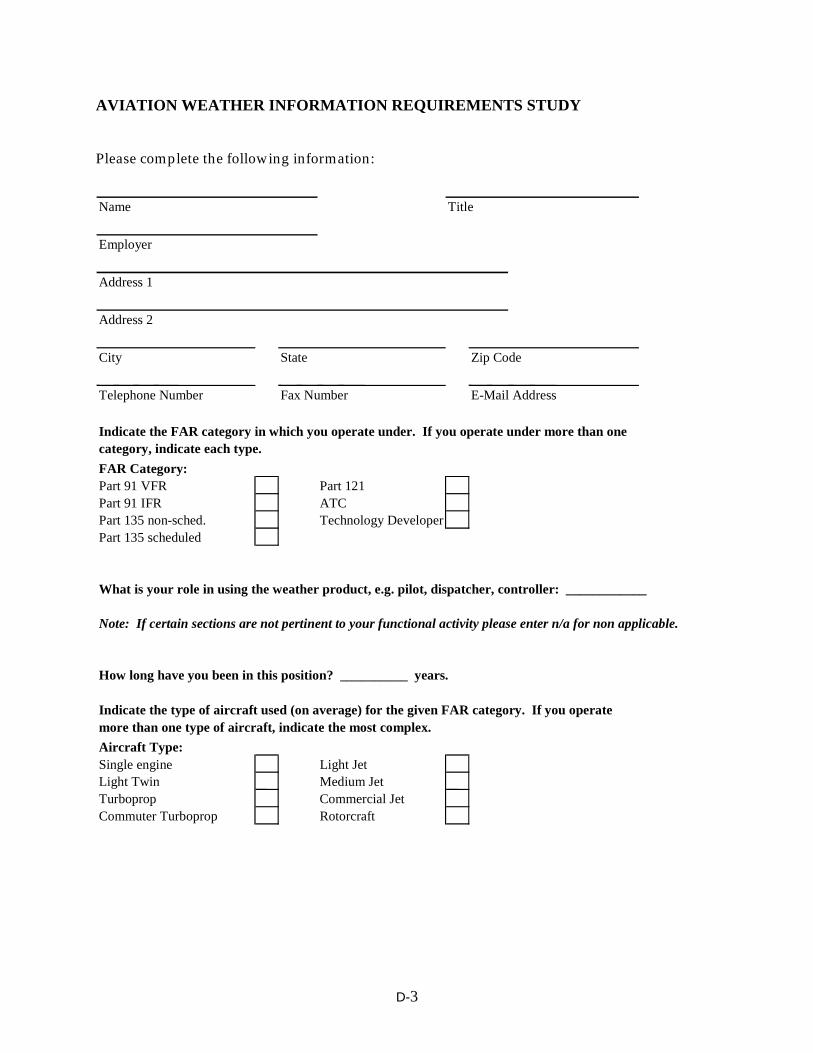
D-3
AVIATION WEATHER INFORMATION REQUIREMENTS STUDY
Please complete the following information:
Name Title
Employer
Address 1
Address 2
City State Zip Code
Telephone Number Fax Number E-Mail Address
Indicate the FAR category in which you operate under. If you operate under more than onecategory, indicate each type.
FAR Category:Part 91 VFR Part 121Part 91 IFR ATCPart 135 non-sched. Technology DeveloperPart 135 scheduled
What is your role in using the weather product, e.g. pilot, dispatcher, controller: ____________
Note: If certain sections are not pertinent to your functional activity please enter n/a for non applicable.
How long have you been in this position? __________ years.
Indicate the type of aircraft used (on average) for the given FAR category. If you operatemore than one type of aircraft, indicate the most complex.
Aircraft Type:Single engine Light JetLight Twin Medium JetTurboprop Commercial JetCommuter Turboprop Rotorcraft

D-4
4.17 MATRIX A – OPERATIONAL DATA
Matrix A provides operational information related to selected flight phases identified by the FAA.Please complete this matrix for each type of aircraft you identified on the first page (if you have indicatedmore than one aircraft type, please make a copy of the matrix and complete for each aircraft type.)
The speeds and times asked for in this matrix should be for your typical or average flight. The lowerand upper altitudes requested are the approximate altitude ranges you would fly during the cruise, climband decent flight phases.
(6) Enter the aircraft type
(7) Enter the appropriate information in each of the white boxes.
Matrix A
Aircraft T ype: ______________
Pre
fligh
t Pla
nnin
g; F
light
Pla
n F
iling
Tax
i Out
& T
akeo
ff O
pera
tions
Initi
al C
limb
Seg
men
t
Initi
al C
ruis
e O
pera
tions
Cru
ise
Ope
ratio
ns
App
roac
h O
pera
tions
Land
ing
Ope
ratio
ns
Time for Prefli ght Planning (min)
Average Taxi Time (min)
Average Cruise Speed (kts)
Average Cruise Range (statute miles)
Cruise: Lower Altitude (MSL)
Cruise: Upper Altitude (MSL)
Rate of Climb (ft/min)
Climb Speed (Vy) (kts)
Climb: Lower Altitude (MSL)
Climb: Upper Altitude (MSL)
Rate of Descent (ft/min)
Descent Speed (kts)
Descent: Lower Altitude (MSL)
Descent: Upper Altitude (MSL)
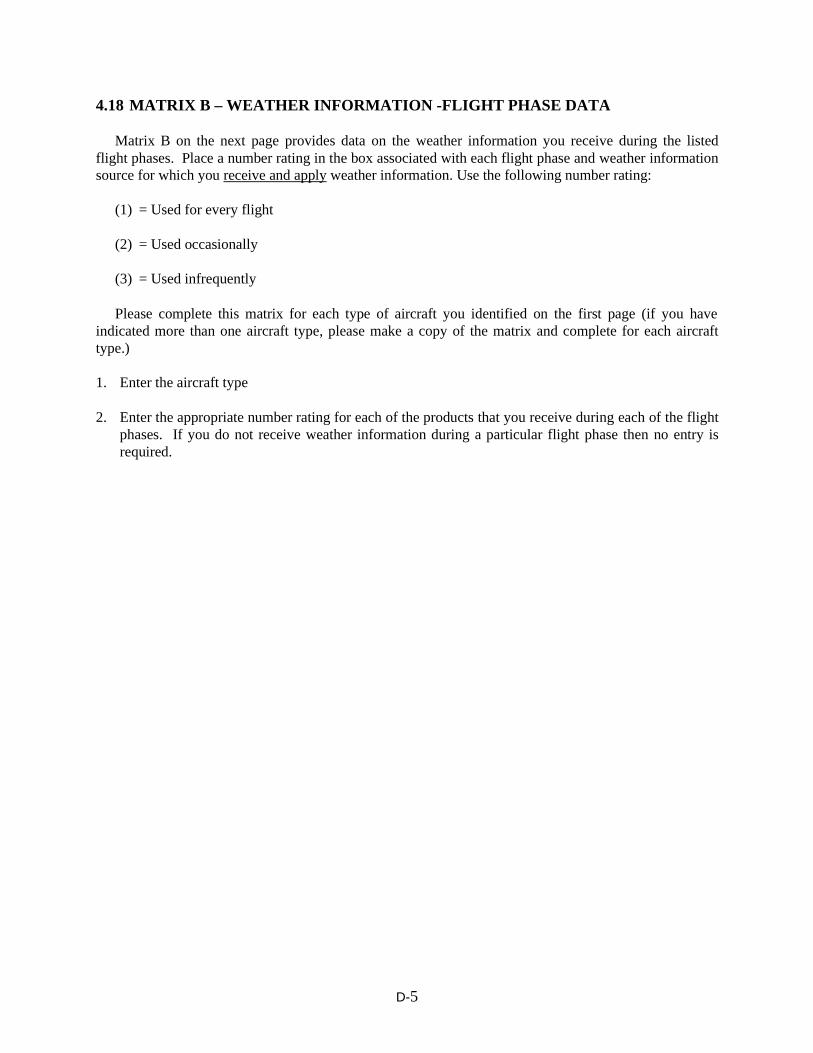
D-5
4.18 MATRIX B – WEATHER INFORMATION -FLIGHT PHASE DATA
Matrix B on the next page provides data on the weather information you receive during the listedflight phases. Place a number rating in the box associated with each flight phase and weather informationsource for which you receive and apply weather information. Use the following number rating:
(1) = Used for every flight
(2) = Used occasionally
(3) = Used infrequently
Please complete this matrix for each type of aircraft you identified on the first page (if you haveindicated more than one aircraft type, please make a copy of the matrix and complete for each aircrafttype.)
1. Enter the aircraft type
2. Enter the appropriate number rating for each of the products that you receive during each of the flightphases. If you do not receive weather information during a particular flight phase then no entry isrequired.

D-6
Matrix B
Aircraft Type: ______________
Pre
fligh
t Pla
nnin
g; F
light
Pla
n F
iling
Pre
fligh
t Ope
ratio
ns
Tax
i Out
& T
akeo
ff O
pera
tions
Dep
artu
re O
pera
tions
Initi
al C
limb
Seg
men
t
Initi
al C
ruis
e O
pera
tions
Cru
ise
Ope
ratio
ns
App
roac
h O
pera
tions
Land
ing
Ope
ratio
ns
Tax
i In
& P
arki
ng O
pera
tions
Pos
t Flig
ht O
pera
tions
Alte
rnat
e A
irpor
t Ope
ratio
ns
METARTAFFAAIRMET SierraAIRMET TangoAIRMET ZuluSIGMET DomesticSIGMET ConvectiveSIGMET InternationalAWW/WWCWAWinds AloftPIREPsNWS Fax ProductsWAFS Fax ProductsAVOSSLow Level Sig Wx ForecastsHigh Level Sig Wx ForecastsTDWRNEXRADWeather Radar (Airborne)StormscopeLLWASAWOSASOSRVRWSP (ASR-9)MWPITWSWARPARTCCHIWASTWEBATISACARSOASISFISDUATSFSSAFSSEFASPATWASNWSTGADDSIFFDPKavourasWSIUNISYSAldenUniversalAccu-WeatherGTEHarrisOther _________________Other _________________Other _________________
Weather Information Source
[1] = Used for every flight [2] = Used occasionally [3] = Used infrequently

D-7
MATRIX C – WEATHER INFORMATION DATA
Matrix C provides data on weather information you currently use or have used in the past. For eachweather information source listed please apply the appropriate code keeping in mind the flight phases forwhich you use(d) the weather information. Feel free to add any comments in the comment section below.(For an explanation of “Utilization” please see the definition paragraph below.)
Matrix C
* Utili
zatio
n: 1 -
Tactica
l, 2 -
Strategic
Near
Term, 3
- Stra
tegic Far T
erm
Accuracy
: 1 -
Reliably
Accura
te,
2 - Somewhat A
ccura
te, 3 -
Marginally
Accura
te
Constraints:
1 - A
vaila
bility,
2 - Equipment
Requirements,
3 - Complexit
y, 4 -
Other - E
nter
in Comments
Below
Utility:
1 - Criti
cal, 2
- Very
Useful,
3 - Somewhat U
seful
Price: 1
- Not a
n Issu
e, 2 -
Moderately
Expensiv
e, 3 -
Too Exp
ensive
METARTAFFAAIRMET SierraAIRMET TangoAIRMET ZuluSIGMET DomesticSIGMET ConvectiveSIGMET InternationalAWW/WWCWAWinds AloftPIREPsNWS Fax ProductsWAFS Fax ProductsAVOSSLow Level Sig Wx ForecastsHigh Level Sig Wx ForecastsTDWRNEXRADWeather Radar (Airborne)StormscopeLLWASAWOSASOSRVRWSP (ASR-9)MWPITWSWARPARTCCHIWASTWEBATISACARSOASISFISDUATSFSSAFSSEFASPATWASNWSTGADDSIFFDPKavourasWSIUNISYSAldenUniversalAccu-WeatherGTEHarrisOther _________________Other _________________Other _________________
Weather Information Source

D-8
*Utilization defined:
The FAA often refers to airborne weather-related decisions as “tactical” and “strategic”. Tacticaldecisions refer to reactive penetration decisions which need to be made quickly and are often safetyrelated and time-critical. For this survey, tactical decisions have a time frame of 0 to 15 minutes ahead ofthe aircraft. Strategic decisions are more pro-active, planning for avoidance rather than penetration.Strategic decisions can be further categorized as “near-term strategic” and “far-term strategic”. For thissurvey near-term strategic decisions have a time frame of 15 to 60 minutes ahead of the aircraft, far-termstrategic decisions have a time frame of 60 minutes or greater.
Utilization Comments:
Accuracy Comments:
Constraints Comments:
Utility Comments:
Price Comments:
Other Comments:
Comment on what areas you feel weather products could be improved(please address in relation to the various flight phases):

E-1
Appendix E Weather Product Database
4.19 E.1 Database Structure
The Weather Product Database is organized into various tables. The primary tables include (the namein parentheses indicate the table name used by Access):
Weather Element Table (WXELEMENT_TABLE)
Weather Product Table (WXPRODUCT_TABLE)
Delivery System Table (DELIVERYSYSTEM_TABLE)
Survey Tables (SURVEY_QUALITY_TABLE) (SURVEY_USAGE_TABLE)(OPERATIONS_TABLE)
Weather Product Table & Delivery System Table DELIVERYSYTEM_WXPRODUCT_TABLE)
Reference Tables
Each of the above tables are linked by common attributes as shown in relationship figure below:
Weather Element Table (WXELEMENT_TABLE)
The weather element table currently has a single attribute of name (wxelement_name). Examples ofweather elements include visibility, thunderstorm, icing, hail, fog, precipitation, and lightening. One ormore weather elements are linked to each weather product by the weather element attribute in the weatherproduct table.
Weather Product Table
As mentioned previously, each weather product is linked to one or more weather elements via theweather element attribute in this table. For example, AIRMET Tango is linked with three differentweather elements: surface winds, turbulence and windshear. AIRMET Zulu is linked to two different

E-2
weather elements: icing and temperature. This method of linking weather elements to weather productsallows a more granular breakdown of the weather product’s characteristics and capabilities. The weatherproduct table has thirty attributes identified for each weather product. In some cases, the productattributes have not been assigned due to a lack of information. Several of the product’s attributes havenot been assigned values due to the lack of information on the weather product.
Delivery System Table
A number of different delivery systems exist which may used to disseminate weather products to theuser community. Each delivery system is linked to one or more weather products and is linked to aweather element by way of the weather product table. Attributes in this table are the same as theattributes in the weather product table with the exception of the weather element attribute.
Survey Tables
The survey data has been organized into three separate tables. Each table corresponds to a matrix inthe survey. Matrix A data was entered into OPERATIONS_TABLE, Matrix B data was entered intoSURVEY_USAGE_TABLE and Matrix C data was entered into SURVEY_QUALITY_TABLE. A useridentification number (user_id) links the three survey tables.
There are ten attributes in OPERATIONS_TABLE that deal with operational information about thesurveyed user. The attributes consist of altitude ranges and speeds for each flight phase as well as aircraftrange and taxi times.
There are five attributes in the SURVEY_USAGE_TABLE. Four of the attributes uniquely identifythe user to a given flight phase and weather product /delivery system. The fifth attribute (usage_code)indicates the frequency of weather product use by flight phase.
There are eight attributes in the SURVEY_QUALITY_TABLE that describe, from the surveyrespondent’s point of view, the use and quality of the weather product. “Use” refers to a pilot’s tactical orstrategic application of the weather product. Quality refers to the weather product accuracy, constraints,criticality, and price.
Weather Product Table and Delivery System Table
This table links delivery systems to one or more weather products. For example, TIBS is linked to theweather products METAR, TAF, and Winds Aloft. When additional delivery systems are added toDELIVERYSYSTEM_TABLE, the DELIVERYSYSTEM_WXPRODUCT_TABLE must be updated toestablish the appropriate link to one or more weather products in WXPRODUCT_TABLE.
Reference Tables
Reference tables are used primarily for converting coded values (e.g., 1,2,3) to textual values. Forexample, for the usage_code attribute in the SURVEY_USAGE_TABLE, data is entered as a 1, 2 or 3.The >usage_code table converts the values 1, 2 or 3 to “used for every flight,” “used occasionally”, and“used infrequently” respectively. Reference tables are preceded with the symbol “>”
List Table
List tables are used for drop down menus that are incorporated in various table, queries, and forms.

E-3
4.20 E.2 Database User Instructions
Microsoft Access is required to use the Weather Product Database. Once the database file(AWIN_v1.0.mdb) has been loaded on the computer, start MS Access and open AWIN_v1.0. When thefile is opened a welcome screen will appear (see figure below).
From the Welcome screen the user can quit the application, close the form or proceed to the MainMenu by clicking on the appropriate button. If “Proceed to Menu” is selected a new menu screen appears(see figure below).

E-4
The Main Menu screen provides direct access to the Weather Product Table, the Delivery SystemTable, the Survey Data tables and the Operations Table. This Menu screen also provides a few samplequeries that show the types of queries that can be performed on the database. “Wx Product Summary” is asimple query that goes to the Weather Product Table and selects and displays certain weather productattributes. The figure below shows the result of this query. There is also the query “Count of Wx ProductUsers” that allows the user to input “user frequency” and “flight phase” parameters then queries fivelinked tables. The result is a list which ranks the weather products and delivery systems used by surveyrespondents by flight phase and frequency of use. The figure below shows the result of this query. Thereare an unlimited number of queries that can be derived from the various tables in the database. With aworking knowledge of Access and familiarity with the tables in the database the user can develop manyuseful queries thus making the Weather Product Database an extremely useful tool.
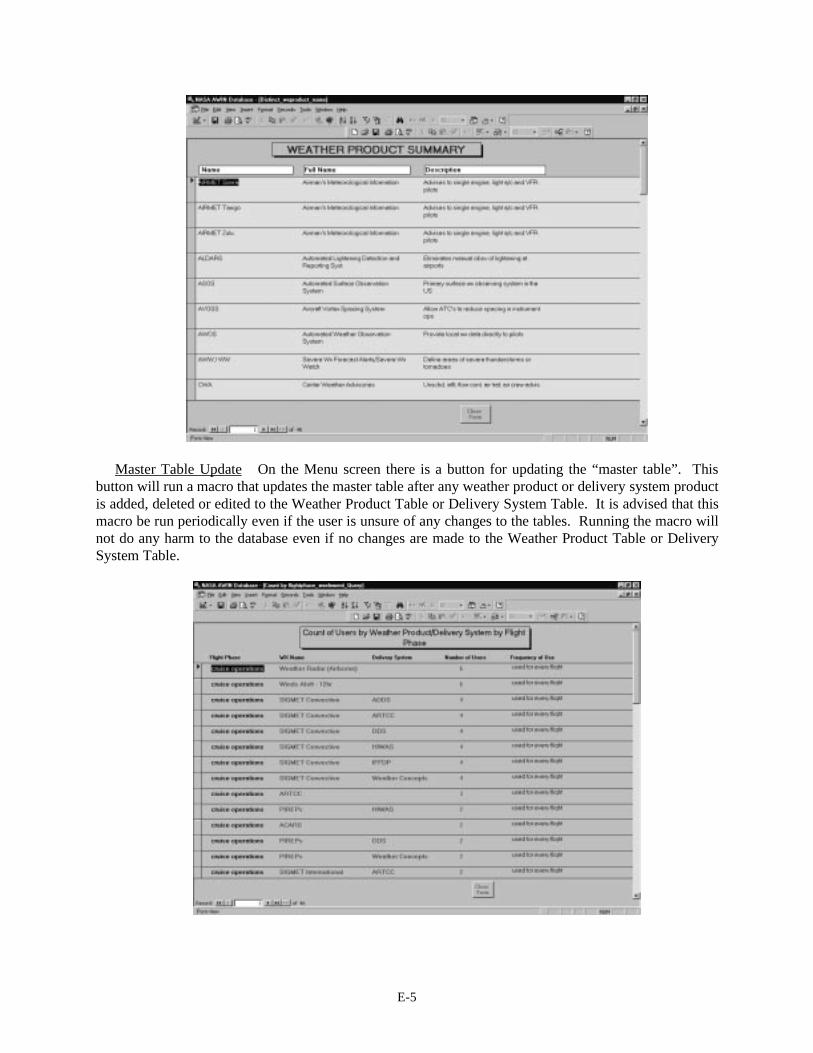
E-5
Master Table Update On the Menu screen there is a button for updating the “master table”. Thisbutton will run a macro that updates the master table after any weather product or delivery system productis added, deleted or edited to the Weather Product Table or Delivery System Table. It is advised that thismacro be run periodically even if the user is unsure of any changes to the tables. Running the macro willnot do any harm to the database even if no changes are made to the Weather Product Table or DeliverySystem Table.
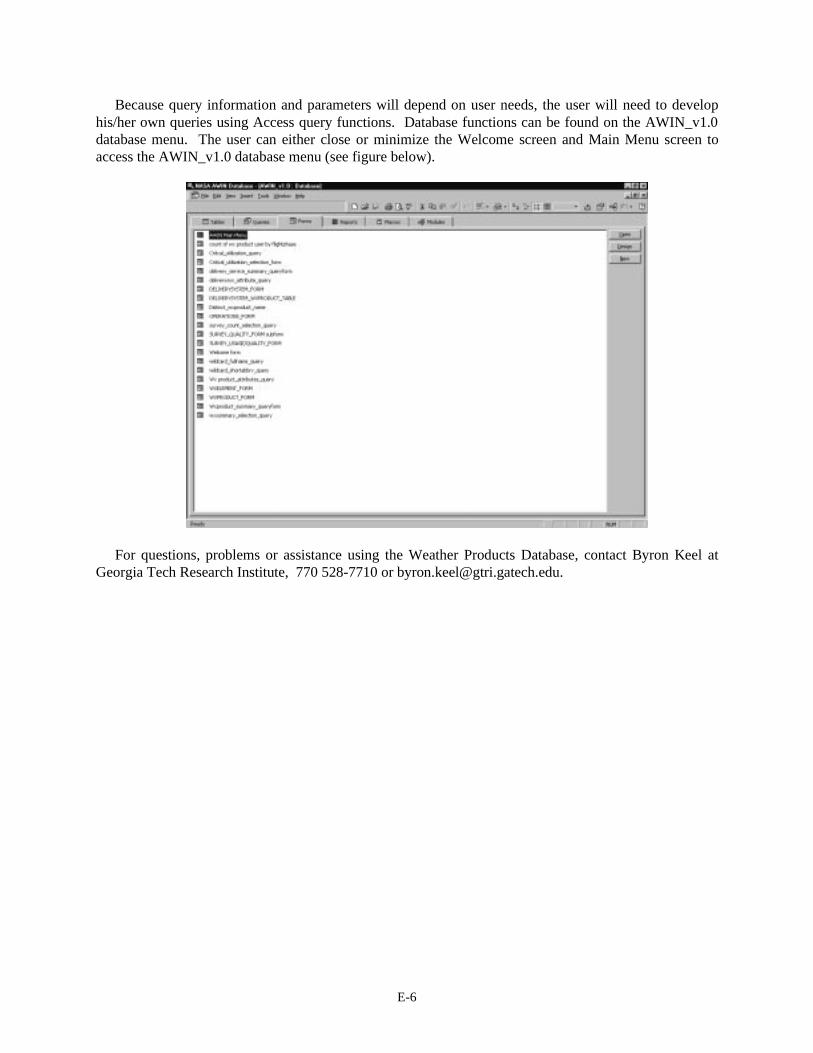
E-6
Because query information and parameters will depend on user needs, the user will need to develophis/her own queries using Access query functions. Database functions can be found on the AWIN_v1.0database menu. The user can either close or minimize the Welcome screen and Main Menu screen toaccess the AWIN_v1.0 database menu (see figure below).
For questions, problems or assistance using the Weather Products Database, contact Byron Keel atGeorgia Tech Research Institute, 770 528-7710 or [email protected].

F-1
Appendix F Delta Dispatcher Requirements
The following is a job description for a Delta Airlines dispatcher:
(a) Job Description of the AircraftDispatcher
The Aircraft Dispatcher is licensed airman certificated by the Federal Aviation Administration.
He/She has joint responsibility with the captain for the safety and operational control of flights underhis/her guidance.
He/She authorizes, regulates and controls commercial airline flights according to government andcompany regulations to expedite and ensure safety of flight.
He/She is also responsible for economics, passenger service and operational control of day to dayflight operations.
He/She analyzes and evaluates meteorological information to determine potential hazards to safety offlight and to select the most desirable and economic route of flight.
He/She computes the amount of fuel required for the safe completion of flight according to type ofaircraft, distance of flight, maintenance limitations, weather conditions and minimum fuel requirementsprescribed by federal aviation regulations.
He/She prepares flight plans containing information such as maximum allowable takeoff and landingweights, weather reports, field conditions, NOTAMS and many other informational components requiredfor the safe completion of flight.
He/She prepares and signs the dispatch release which is the legal document providing authorization fora flight to depart.
He/She delays or cancels flights if unsafe conditions threaten the safety of his/her aircraft orpassengers.
He/She monitors weather conditions, aircraft position reports, and aeronautical navigation charts toevaluate the progress of flight.
He/She updates the pilot in command of significant changes to weather or flight plan and recommendsflight plan alternates, such as changing course, altitude and, if required, enroute landings in the interest ofsafety and economy.
He/She originates and disseminates flight information to others in his/her company including stationsand reservations. This is the source of information provided to the traveling public.
He/She has undergone extensive training to have earned the coveted Aircraft Dispatcher’s certificatehaving taken and passed both an extensive oral examination and the comprehensive Dispatch ADX test,administered by the Federal Aviation Administration. These tests are equivalent to the same AirTransport Pilot (ATP) written and oral examinations that an airline captain must successfully complete.

F-2
He/She participates in frequent and detailed recurrent training courses covering Regulations asrequired by the FAA.

G-1
Appendix G Weather Products Summary
The following tables contain summary information on existing weather products.
Weather Product Name: Route Forecast
Issued by: NWS WFO
Type: Forecast
Application Area: Air Traffic Routes
Coverage Area: A 25 mile corridor on either side of some 300 routes in the 48 contiguousstates
Update Rate: Issued 3 times per day
Product Life: Valid for 15 hours
Contains information on: 1. Sustained surface winds2. Visibility3. Weather and obscuration to vision4. Thunderstorms5. Volcanic ash6. Sky conditions (coverage and ceiling/cloud heights)7. Mountain obscurements8. Non-convective low-level windshear
Comments: A synopsis may also be issued with the route forecast which describesweather systems affecting the route (pressure systems, fronts, upper airdisturbances, and air flow). A route forecast does not address icing orturbulence. A route forecast will not be issued if a TAF has not beenissued for that airport.

G-2
Weather Product Name: Terminal Aerodrome Forecast (TAF)
Issued by: NWS WFO
Type: Forecast
Application Area: Terminal Area
Coverage Area: A forecast of conditions within 5 miles of the terminal area
Update Rate: Issued 4 times per day, amended as conditions warrant
Product Life: Forecast are valid for 24 hours
Contains information on: 1. Wind2. Visibility3. Weather4. Sky condition5. Wind shear (non-convective low-level windshear)
Comments: Has the same report format as a METAR. The issuance of a TAF isdependent upon the availability of two (either a manual or automated)METARs spaced no less than 30 minutes apart and no more than 1 hourapart. If the METARs are not available, a TAF will not be issued.
Weather Product Name: Aviation Routine Weather Report (METAR)
Issued by: Weather observer (FAA, NWS, or contract personnel) at the airport or byautomated systems. The weather data are collected through manual orautomated observation.
Type: Current Conditions
Application Area: Terminal Area
Coverage Area: Terminal area, measurement site
Update Rate: Hourly
Product Life: 1 hour
Contains information on: 1. Wind2. Visibility3. Run way visual range4. Weather phenomena5. Sky condition6. Temperature/dew point7. Altimeter8. Remarks
Comments: A SPECI (a non-routine aviation weather report) may be issued asconditions warrant on less than an hourly basis.

G-3
Weather Product Name: Convective SIGMET
Issued by: Aviation Weather Center (AWC)
Type: In-flight Advisory – current and forecast conditions
Application Area: En route and terminal area
Coverage Area: The bulletins are divided into three regions of the U.S. 48: eastern, central,and western. These regions are separated at 87oW and 107oW. Theconvective activity is referenced to specific location identifiers (eitherVORs, airports, or well-known geographic areas).
Update Rate: Hourly; special bulletins may be issued as conditions warrant
Product Life: 2 hours
Contains information on: Issued if the following conditions exists:
1. Severe thunderstorm witha. Surface winds greater than or equal to 50 knotsb. Hail at the surface greater than or equal to 0.75 inches in diameterc. Tornadoes
2. Embedded thunderstorms3. A line of thunderstorms4. Thunderstorms producing heavy precipitation affecting 40% or more
of an area of least 3000 square miles
Comments: A convective SIGMET implies the presence of severe or extremeturbulence, severe icing, and low-level wind shear. In Alaska, the AlaskaAviation Weather Unit issues in-flight advisories, and in Honolulu, theWFO issues the advisories.

G-4
Weather Product Name: Domestic SIGMET
Issued by: Aviation Weather Center (AWC)
Type: In-flight Advisory – current and forecast conditions
Application Area: En route and terminal area
Coverage Area: Are issued for six regions in the continental U.S., for 23 regions in Alaska,and for Hawaii. These are considered as “widespread” forecast becausethe conditions must be affecting or forecast to affect an area of at least3,000 square miles. The forecasted area may be considerably larger eventhough conditions are only affecting a small portion (3,000 square miles)of the area.
Update Rate: As conditions warrant
Product Life: 4 hours, unless associated with a hurricane then the product life is 6 hours
Contains information on: Issued if the following conditions exists or expected to exists:
1. Severe icing not associated with a thunderstorm2. Severe or extreme turbulence or CAT not associated with a
thunderstorm3. Dust storms, sandstorms, or volcanic ash lowering surface or in-flight
visibilities to below 3 miles.4. Volcanic eruption
In Alaska and Hawaii, SIGMETs also include:
1. Tornadoes2. Lines of thunderstorms3. Embedded thunderstorms4. Hail greater than or equal to ¾ inches in diameter

G-5
Weather Product Name: International SIGMET
Issued by: International Civil Aviation Organization designated MeteorologicalWatch Offices (in the U.S., the Meteorological Watch Office (MWOs) arethe NWS offices in Anchorage, AK, Honolulu, HI, Kansas City, MO, andGaum Island. The tropical prediction center in Miami, FL is also anMWO.
Type: In-flight advisory – current and forecast conditions
Application Area: En route
Coverage Area: Alaska, Hawaii, portions of the Atlantic and Pacific Oceans, and the Gulfof Mexico
Update Rate: As conditions warrant
Product Life: 12 hours for volcanic ash events, 6 hours for hurricanes and tropicalstorms, and 4 hours for all other events
Contains information on: Issued if the following conditions exists or expected to exists:1. Thunderstorms occurring in lines, embedded in clouds, or occurring
in large areas that produce tornadoes or large hail2. Tropical cyclones3. Severe icing4. Severe or extreme turbulence5. Dust storms and sandstorms lowering visibility to less than 3 miles6. Volcanic ash

G-6
Weather Product Name: AIRMET
Issued by: Aviation Weather Center (AWC)
Type: In-flight Advisory – current and forecast conditions
Application Area: En route and terminal area
Coverage Area: Are issued for six regions in the continental U.S., for 23 regions in Alaska,and for Hawaii. These are considered as “widespread” forecasts becausethe conditions must be affecting or forecast to affect an area of at least3,000 square miles. The forecasted area may be considerably larger eventhough conditions are only affecting a small portion (3,000 square miles)of the area.
Update Rate: Every six hours, updated as conditions warrant
Product Life: 6 hours, variable
Contains information on: There are three types of AIRMET each advising of specific weatherconditions:
AIRMET Sierra – issued for
1. IFR weather conditions – ceilings less than 1000 ft. and/or visibilityless than 3 miles affecting over 50% of the area at one time
2. Extensive mountain obscuration
AIRMET Tango – issued for
1. Moderate turbulence2. Sustained surface winds of 30 knots or greater3. Low-level wind shear
AIRMET Zulu – issued for
1. Moderate icing2. Freezing-level heights

G-7
Weather Product Name: Aviation Area Forecast (FA)
Issued by: Aviation Weather Center (AWC)
Type: In-flight advisory – current and forecast conditions
Application Area: En route and terminal area
Coverage Area: Are issued for six regions in the continental U.S., for 23 regions in Alaska,and for Hawaii. A specialized FA is issued for the Gulf of Mexico by theTPC in Miami, FL.
Update Rate: 3 times per day or as conditions warrant
Product Life: 8 hours
Contains information on: An area forecast is a forecast of visual meteorological conditions (VMC),clouds, and general weather conditions over an area the size of severalstates. International area forecast also are prepared for the Atlantic Ocean,the Caribbean Sea, and the Gulf of Mexico. The international forecasts areprepared in text format for altitudes from the surface to 25,000 feet.Charts are prepared for forecast containing significant weather between25,000 and 60,000 feet.
Weather Product Name: Winds and Temperature Aloft Forecast
Issued by: National Center for Environmental Prediction
Type: Forecast
Application Area: En route
Coverage Area: Winds and temperature aloft forecast at specific locations through out thecontiguous U.S.; most states contain several forecast locations
Update Rate: 2 times per day
Product Life: 12 hours
Contains information on: Winds and temperature aloft forecast available for the following altitudes:
True altitudes: 3,000, 6,000, 9,000, and 12,000 feet
Pressure altitudes: 18,000, 24,000, 30,000, 39,000, 45,000, and 39,000 feet.

G-8
Weather Product Name: Meteorological Impact Statement (MIS)
Issued by: Center Weather Service Unit located at the ARTCC
Type: Forecast
Application Area: En route and terminal areas
Coverage Area: Airspace assigned to the ARTCC
Update Rate: As conditions warrant
Product Life: 2 to 12 hours
Contains information on: Forecast of conditions that will impact air traffic flow in the ARTCC area.The conditions are forecast to begin beyond 2 hours of the issuance, butwithin 12 hours of the issuance. MISs are issued for the followingconditions:
1. Convective SIGMET criteria2. Moderate or greater icing and/or turbulence3. Heavy or freezing rain4. Low IFR conditions (ceilings less than 500 ft. and/or visibility less
than 1 mile)5. Surface winds/gusts 30 knots or greater6. Low-level wind shear within 2000 feet of the surface7. Volcanic ash, dust, or sand storm
Weather Product Name: Center Weather Advisory (CWA)
Issued by: Center Weather Service Unit located at the ARTCC
Type: Forecast
Application Area: En route and terminal areas
Coverage Area: Airspace assigned to the ARTCC
Update Rate: As conditions warrant
Product Life: 2 hours
Contains information on: Forecast of conditions that will impact air traffic flow in the ARTCC area.The conditions are forecast to begin within 2 hours of the advisory. TheCWA may refine/tailor the forecast for the ARTCC area of responsibility.CWA may also be issued in advance of an in-flight advisory as conditionswarrant. A CWA may even be issued when conditions do not meet AWCin-flight advisory status but may impact the safe flow of traffic in theARTCC area of responsibility.

G-9
Weather Product Name: Severe Weather Watch Bulletin (WW)
Issued by: Storms Prediction Center in Norman, Oklahoma
Type: Watch (Forecast)
Application Area: En route and terminal area
Coverage Area: Regional
Update Rate: As conditions warrant
Product Life: Not available
Comments: An alert severe weather watch (AWW) may be issued prior to the WW tonotify WFOs, CWSUs, FSS, and other users of the pending WW. TheAWW will contain a brief message contain a summary of the watchinformation.
Weather Product Name: Hurricane Advisory
Issued by: Not available
Type: Advisory
Application Area: En route and terminal area
Coverage Area: Hurricanes location
Update Rate: Once hurricane is 300 nm offshore
Product Life: Not available
Contains information on: Provides:
1. Location of storm center2. Expected movement3. Maximum winds near the center of the hurricane

G-10
Weather Product Name: U.S. Low-Level Significant Weather Program
Issued by: Not available
Type: Forecast
Application Area: En route and terminal area
Coverage Area: U.S.
Update Rate: 4 times per day
Product Life: 12 | 24 hour forecast
Contains information on: Some of the information provided on the charts:
1. Fronts2. Pressure centers3. Forecast precipitation and/or thunderstorms4. IFR, MVFR, turbulence, and freezing levels5. The significant weather is forecast from the surface to 24,000 feet
referenced to MSL.
Weather Product Name: High-Level Significant Weather Program
Issued by: Not available
Type: Forecast
Application Area: En route and terminal area
Coverage Area: U.S. and International
Update Rate: 4 times per day
Product Life: 6 hours
Contains information on: These charts contain information on the airspace between (25,000 feet and60,000 feet ( in pressure altitude)). Some of the information provided inthe charts includes:
1. Thunderstorms2. Tropical cyclones3. Moderate or severe turbulence4. Convergence zones5. Fronts6. Tropopause heights7. Jet stream8. Volcanic activity

G-11
Weather Product Name: Convective Outlook
Issued by: Storms Prediction Center
Type: Forecast
Application Area: En route and terminal area
Coverage Area: U.S.
Update Rate: 5 | 2 times per day
Product Life: 24 | 48 hours
Contains information on: A convective outlook defines areas which are at risk of severethunderstorms over the next 24 and 48 hours.
Weather Product Name: Surface Analysis Charts
Issued by: Not available
Type: Current conditions
Application Area: En route and terminal area
Coverage Area: U.S.
Update Rate: Every 3 hours
Product Life: 3 hours
Contains information on: A chart showing the pressure systems and isobars across the48 contiguous states and adjacent areas.
Weather Product Name: Radar Summary Chart
Issued by: NWS
Type: Current conditions
Application Area: En route and terminal area
Coverage Area: U.S.
Update Rate: Every hour
Product Life: 1 hour
Contains information on: A graphical display of areas of precipitation. Includes information ontype, intensity, location, coverage, echo top, and cell movement. Thesecharts are generated from data collected by the WSR-88D network.
Comments: The charts are to be used for pre-flight planning purposes only.

G-12
Weather Product Name: Weather Depiction Chart
Issued by: NWS
Type: Current conditions
Application Area: En route and terminal area
Coverage Area: U.S.
Update Rate: Every 3 hours starting at 0100Z
Product Life: 3 hours
Contains information on: A summary of METARs across the U.S. in a chart format. The chartprovides, a broad overview of sky conditions based on the METARs.Include are sky cover, cloud height, weather and obstructions to vision,and visibility.
Comments: The charts are to be used for pre-flight planning purposes only sinceweather conditions can change considerable in a 3 hour period. Specific,up-to-date METARs should be consulted along the planned route.
Weather Product Name: Weather Depiction Chart
Issued by: NWS
Type: Current conditions
Application Area: En route and terminal area
Coverage Area: U.S.
Update Rate: Every 3 hours starting at 0100Z
Product Life: 3 hours
Contains information on: A summary of METARs across the U.S. in a chart format. The chartprovides a broad overview of sky conditions based on the METARs.Included are sky cover, cloud height, weather and obstructions to vision,and visibility.
Comments: The charts are to be used for pre-flight planning purposes only sinceweather conditions can change considerable in a 3 hour period. Specific,up-to-date METARs should be consulted along the planned route.

G-13
Weather Product Name: Radar Weather Report
Issued by: NWS WFO
Type: Current conditions
Application Area: En route and terminal area
Coverage Area: U.S.
Update Rate: Every hour
Product Life: 1 hour
Contains information on: This report describes general areas of precipitation. The reports includetype (limited to rain, rain shower, snow, snow shower, thunderstorm),intensity, and location of echo top.
Comments: Should be used for planning purposes only. Does not provideinformation on clouds and fog that impact ceilings and visibility.
Weather Product Name: Satellite Weather Pictures
Issued by: NWS and private companies
Type: Current conditions
Application Area: En route and terminal area
Coverage Area: U.S.
Update Rate: 15 minutes to 1 hour
Product Life: Not available
Contains information on: Visible Imagery:
1. Presence of clouds2. Type of cloud infrared imagery3. Cloud height based on cloud temperature
Weather Product Name: Radiosonde Additional Data
Issued by: NWS
Type: Current conditions
Application Area: En route and terminal area
Coverage Area: U.S.
Update Rate: Every 12 hours
Product Life: 12 hours
Contains information on: Observed freezing level and relative humidity at the freezing levelobtained from radiosonde data.
Weather Product Name: Constant Pressure Analysis Charts
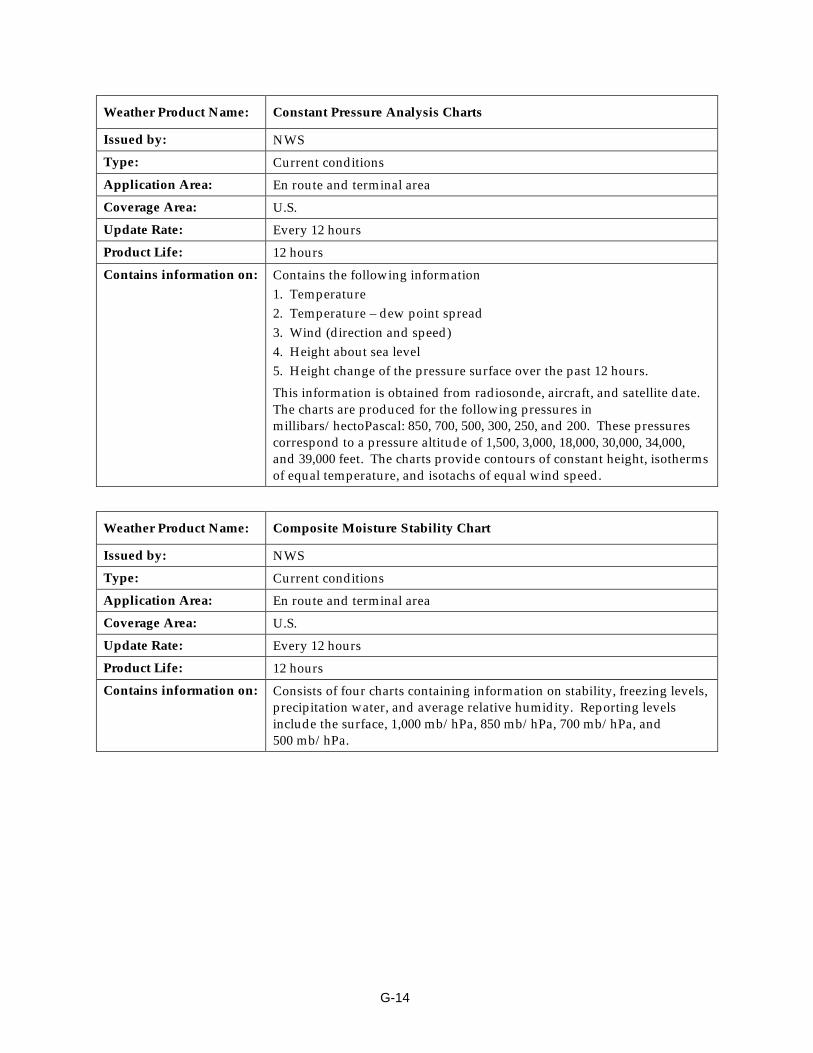
G-14
Weather Product Name: Constant Pressure Analysis Charts
Issued by: NWS
Type: Current conditions
Application Area: En route and terminal area
Coverage Area: U.S.
Update Rate: Every 12 hours
Product Life: 12 hours
Contains information on: Contains the following information1. Temperature2. Temperature – dew point spread3. Wind (direction and speed)4. Height about sea level5. Height change of the pressure surface over the past 12 hours.
This information is obtained from radiosonde, aircraft, and satellite date.The charts are produced for the following pressures inmillibars/hectoPascal: 850, 700, 500, 300, 250, and 200. These pressurescorrespond to a pressure altitude of 1,500, 3,000, 18,000, 30,000, 34,000,and 39,000 feet. The charts provide contours of constant height, isothermsof equal temperature, and isotachs of equal wind speed.
Weather Product Name: Composite Moisture Stability Chart
Issued by: NWS
Type: Current conditions
Application Area: En route and terminal area
Coverage Area: U.S.
Update Rate: Every 12 hours
Product Life: 12 hours
Contains information on: Consists of four charts containing information on stability, freezing levels,precipitation water, and average relative humidity. Reporting levelsinclude the surface, 1,000 mb/hPa, 850 mb/hPa, 700 mb/hPa, and500 mb/hPa.

G-15
Weather Product Name: Volcanic Ash Forecast Transport and Dispersion Chart
Issued by: NOAA Air Resources Laboratory (ARL)
Type: Forecast
Application Area: En route and terminal area
Coverage Area: International
Update Rate: 6, 12, 24, and 36 hours after a volcanic eruption
Product Life: 6 and 12 hour forecast
Contains information on: A model is used to forecast ash concentrations for three layers of theatmosphere:1. surface to 20,000 ft (MSL)2. 20,000 to 35,000 ft (MSL)3. 35,000 to 55,000 ft (MSL)
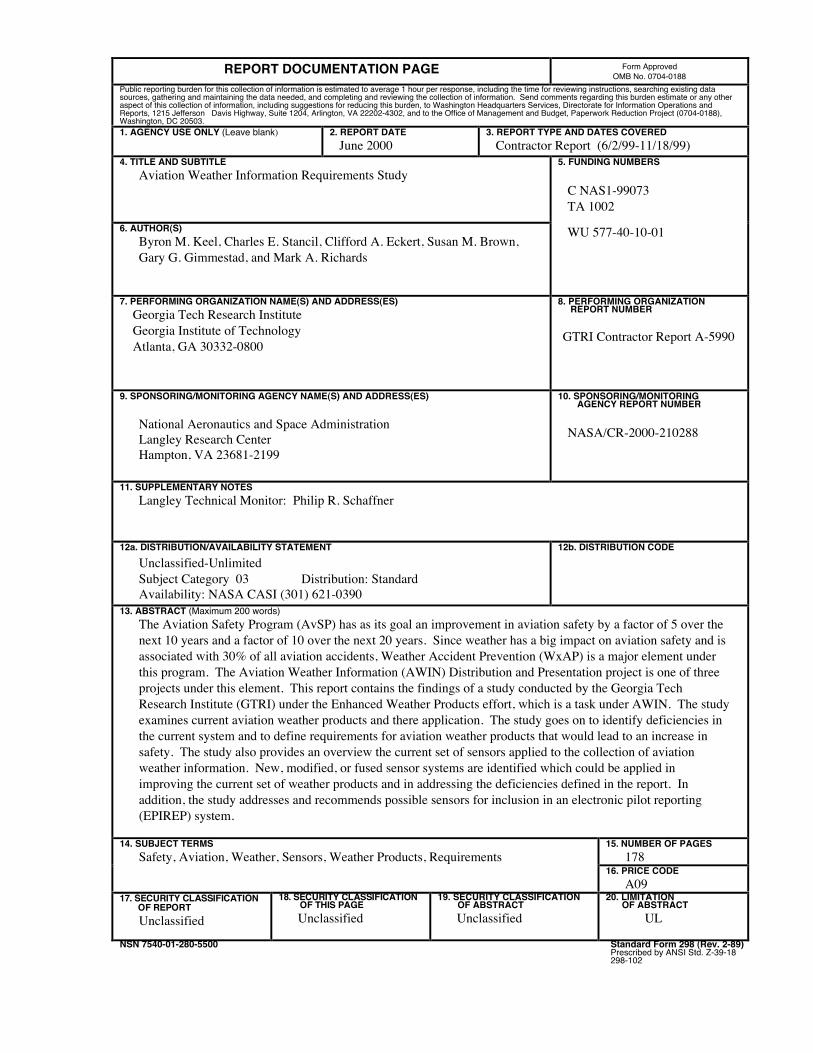
REPORT DOCUMENTATION PAGE Form ApprovedOMB No. 0704-0188
Public reporting burden for this collection of information is estimated to average 1 hour per response, including the time for reviewing instructions, searching existing datasources, gathering and maintaining the data needed, and completing and reviewing the collection of information. Send comments regarding this burden estimate or any otheraspect of this collection of information, including suggestions for reducing this burden, to Washington Headquarters Services, Directorate for Information Operations andReports, 1215 Jefferson Davis Highway, Suite 1204, Arlington, VA 22202-4302, and to the Office of Management and Budget, Paperwork Reduction Project (0704-0188),Washington, DC 20503.1. AGENCY USE ONLY (Leave blank) 2. REPORT DATE
June 20003. REPORT TYPE AND DATES COVERED
Contractor Report (6/2/99-11/18/99)4. TITLE AND SUBTITLE
Aviation Weather Information Requirements Study5. FUNDING NUMBERS
C NAS1-99073TA 1002
6. AUTHOR(S)Byron M. Keel, Charles E. Stancil, Clifford A. Eckert, Susan M. Brown,Gary G. Gimmestad, and Mark A. Richards
WU 577-40-10-01
7. PERFORMING ORGANIZATION NAME(S) AND ADDRESS(ES) Georgia Tech Research Institute Georgia Institute of Technology Atlanta, GA 30332-0800
8. PERFORMING ORGANIZATIONREPORT NUMBER
GTRI Contractor Report A-5990
9. SPONSORING/MONITORING AGENCY NAME(S) AND ADDRESS(ES)
National Aeronautics and Space AdministrationLangley Research CenterHampton, VA 23681-2199
10. SPONSORING/MONITORINGAGENCY REPORT NUMBER
NASA/CR-2000-210288
11. SUPPLEMENTARY NOTESLangley Technical Monitor: Philip R. Schaffner
12a. DISTRIBUTION/AVAILABILITY STATEMENTUnclassified-UnlimitedSubject Category 03 Distribution: StandardAvailability: NASA CASI (301) 621-0390
12b. DISTRIBUTION CODE
13. ABSTRACT (Maximum 200 words)The Aviation Safety Program (AvSP) has as its goal an improvement in aviation safety by a factor of 5 over thenext 10 years and a factor of 10 over the next 20 years. Since weather has a big impact on aviation safety and isassociated with 30% of all aviation accidents, Weather Accident Prevention (WxAP) is a major element underthis program. The Aviation Weather Information (AWIN) Distribution and Presentation project is one of threeprojects under this element. This report contains the findings of a study conducted by the Georgia TechResearch Institute (GTRI) under the Enhanced Weather Products effort, which is a task under AWIN. The studyexamines current aviation weather products and there application. The study goes on to identify deficiencies inthe current system and to define requirements for aviation weather products that would lead to an increase insafety. The study also provides an overview the current set of sensors applied to the collection of aviationweather information. New, modified, or fused sensor systems are identified which could be applied inimproving the current set of weather products and in addressing the deficiencies defined in the report. Inaddition, the study addresses and recommends possible sensors for inclusion in an electronic pilot reporting(EPIREP) system.
14. SUBJECT TERMSSafety, Aviation, Weather, Sensors, Weather Products, Requirements
15. NUMBER OF PAGES178
16. PRICE CODEA09
17. SEC U RITY CL ASSIF IC AT ION O F REPO R TUnclassified
18. SEC U RITY CL ASSIF IC AT ION O F TH IS PA GEUnclassified
19. SECURITY CLASSIFICATION OF ABSTRACTUnclassified
20. LIMITATION OF ABSTRACT UL
NSN 7540-01-280-5500 Standard Form 298 (Rev. 2-89)Prescribed by ANSI Std. Z-39-18298-102