aviva - fundsquare
TRANSCRIPT
AVIVA

Chairman's Report
Board of Directors
Management and Administration
Schedules of investments Reserve Funds EUR Reserve Fund GBP Reserve Fund USD Reserve Fund
Bond Funds European AAA Bond Fund Long Term European AAA Bond Fund Short Term Global AAA Bond Fund
Specialist Bond I Balanced Funds Emerging Markets Bond Fund European Corporate Bond Fund Global Balanced Fund Global Convertibles Fund
Equity funds American Equity Fund Asia-Pacific Equity Fund European Equity Fund French Equity Fund Global Equity Fund Japanese Equity Fund Nordic Equity Fund UK Equity Fund
Specialist Equity Funds Emerging Countries Equity Fund European Convergence Equity Fund European Property Fund European Smaller Companies Equity Fund European Socially Responsible Equity Fund European Value Equity Fund Global Socially Responsible Equity Fund Global Themes Equity Fund
1
2
3
4 5 6
7
8 9
10 12 15 18
21 23 25 27 28 30 32 33
34 37 38
39
41 42
44 46
Statement of Net Assets 48
Net Assets Comparative 48
Shares Outstanding 48
Statement of Changes in Shares Outstanding 53
Statement of Operations and Changes in Net Assets 57
Notes t o the Financial Statements 62
This report does not cons t i tu te an o f f e r of shares. Subscript ions are o n l y val id i f m a d e on t h e basis of t h e cu r ren t prospectus supp lemen ted t; t he last avai lable a n n u a l r e p o r t and t h e latest semi-annual repo r t i f pub l i shed a f t e r such an annua l report. Past per fo rmance is n o t necessari: , indicative o f f u t u r e returns. Copies o f t h e prospectus, annual report, semi -annua l r e p o r t a n d de ta i l s o f changes in inves tments for the sub- funds are avai lab le from tk.: reg is tered office, f ree of charge.

Chairman‘s Report Unaudited Report
Dear Shareholder,
On behalf of the Directors of Aviva Funds I have pleasure in presenting the unaudited semi-annual report and accounts to shareholders for the six months period ended 30th June 2004.
In March when I wrote my last Chairman’s report I indicated that the Company’s invest- ment advisors Morley Fund Management were broadly optimistic for the global econo- mic background and financial markets, with a modest asset allocation bias for equities over bonds. Broadly speaking this proved to be a correct asset allocation stance for the first half of the year, although it is disappointing to note that the markets favoured most ie Asian and Emerging Markets declined more than the developed markets. The best performing fund in the Aviva Funds SICAV was the Aviva European Convergence Equity fund which rose by +20.86 % as the new member countries joined the EU and investors began to discount the economic benefits that will arise over the medium to long term. Global bond markets marginally outperformed cash on a local currency basis.
As expected economic growth has broadened out significantly during the first half of 2004, both sectorally and geographically. In the US concerns about the narrowly based growth profile proved misplaced as buoyant consumer expenditure and rising corporate profitability finally extended into better employment numbers. This is hardly surprising given the scale of the fiscal and monetary stimulus that has been seen in the US. Some- what more surprising has been the re-emergence of a positive growth scenario in Japan with exports led growth finally being supplemented by more positive domestic spending. Similarly in Europe, growth trends have been more positive although not for all coun- tries. The German economy has benefited most from the impact of stronger world trade on exports, and France from domestic consumer optimism. In sharp contrast the growth rate in Italy remains disappointing.
Better growth rates globally, added to the already rapidly expanding Chinese economy have contributed to rising prices across a wide range of primary commodities. The impact has been particularly visible in crude oil where at the time of writing the spot prices for crude oil futures contracts in the US and Europe have been trading a t record highs in the region of 540 per barrel. in the case of oil, increased demand has coincided with supply fears, not only in the Middle East but also in Russia where the political heat surrounding Yukos, a major oil producing company, has been rising. The impact on inflationary expectations has thus far been muted although one can expect central ban- kers everywhere to be monitoring monthly price and cost data with increased vigilance. Short-term interest rates have already been raised, substantially in the UK, and by smaller amounts in the US and Australia. Further increases can be expected in the second half of 2004.
The outlook for financial markets in the second half of 2004 is particularly difficult to forecast. On the one hand the better global growth scenario suggests rising corporate profitability, increased employment levels and sustained confidence in the consumer sector. However there is no escaping the fact that after several years of very low short term interest rates central banks everywhere, including Europe, will be raising rates in the second half. This is likely to result in volatile trading within financial markets. The Company’s investment advisor Morley Fund Management, within an overall cautious investment strategy will be seeking out opportunities to benefit from the increased vola- tility. Aviva Funds shareholders can obtain regular updates on Morley’s investment views on fund performance at the Company’s website www.avivafunds.com.
Keith Jones 20 August 2004
1

Board of Directors
Chairman
Keith Jones Morley Fund Management Limited 1, Poultry London ECZR 8EJ, England
Directors
André Elvinger Elvinger, Hoss & Prussen 2, place Winston Churchill L-1340 Luxembourg
Marcel Ernzer FAS S.A. I O , bvd Grande-Duchesse Charlotte L-1330 Luxembourg
Alan Gadd (appointed on April 6, 2004) Morley Fund Management Limited 1, Poultry London ECZR 8EJ, England
Gerald Holtham (resigned on April 6, 2004) Morley Fund Management Limited 1, Poultry London ECZR 8EJ, England
Secretary
Aviva Fund Services S.A. 34, avenue de la Liberté, 4th Floor L-I930 Luxembourg
Unaudited Report
2

Management and Administration
Distribution in Luxembourg and Registered Office
Aviva Funds 34, avenue de la Liberté, 4th Floor L-1930 Luxembourg
Manager
Aviva Holdings Luxembourg S.A. 34, avenue de la Liberté, 4th Floor L-I930 Luxembourg
Investment Adviser
Morley Fund Management Limited 1, Poultry London EC2R XEJ, England
Administrative Agent and Registrar
Aviva Fund Services S.A. 34, avenue de la Liberté, 4th Floor L-1930 Luxembourg
Corporate and Domiciliary Agent
Aviva Corporate Services S.A. 34, avenue de la Liberté, 4th Floor L-1930 Luxembourg
Paying Agent and Custodian
JP Morgan Bank Luxembourg S.A. 5, rue Plaetis L-2012 Luxembourg
Auditor
Ernst &i Young S.A. 6, rue Jean Monnet L-2180 Luxembourg
Legal Advisers
Elvinger, Hoss 8 Prussen 2, place Winston Churchill L-1340 Luxembourg
Marketing and Distribution Agent
Aviva Funds International Limited 1, Le Marchant Street S t Peter Port, Guernsey Channel Islands GY1 4HP
Unaudited Report
3

Aviva Funds - EUR Reserve Fund
Schedule of Investments as at 30 June 2004 (expressed in EUR)
Nominal Description of Securities Market % of Value Net Assets
Bonds Traded on an Official Stock Exchange
2,000,000
1,500,000
2,000,000
500,000
1,000,000
2,000.00c
1,000,000
?,000,000
500,000
900,000
2,000,000
4,00C,OOO
1,000,000
1,000,000
2,000,000
2,000,000
2,000,000
2,000.000
1,000,000
2,000,000
500,000
2,000.000
1,500,000
2,000,000
1,000,000
2,000,000
880,000
?,000,000
1,000,000
1,000,000
7,000,000
Abbcy National Treasury Services
Achmea Hypotheekbaik FRN 18/05/2006 All ilrice I: Leicester FRN 12/08/2008 Artesia Overseas FRN 24/02/2005 Australia & NFW Zealand Bank FRN 23/06/2006 Banco Sdntaritier tRN 5/04/2007 Bank Austria of Credit FRN 20/11/2006 Bank of America FRN 20/11/2008 B a l k of Scotland FRN 02/07/2004 Barclays Bank FRN 22/02/2005 Bbva Global Finance FRN 29/04/2005 Bradtord & Binglei FRN 16/01/2008 Caisse Certrale C:edi! I-imobilie:e FKN 22/03/2005 Caisse Centrale Créait Immobilière FRN 28/06/2005 Cdisw Centrêle Jardiri Quebec FRN 19/12/2008 C ~ r i ~ C i ~ r i Imperidl Biink FRN 28/01/2009 Citigroup FRN 10/11/2008 Der Norjke Bank FRN 23/05/2007 Golriman Sachs FRN 6/10/2005 Hbos Treasbry FRN 23/06/2009 Irijh Life & Perrriariert FRN 27/03/2006 KBC Ifima FRN 28/01/2009 Kommuralkred*t TRN 14/09/2007 Merrill Lynch & Co FRN 9/02/2009 Natexis Banq.ies Popii ar FRN 22/05/2007 National B a v k of Canada FRN 28/02/2008 Nationwide Building Society FRN 29/09/2005 Nationwide B i i i 1 t i . q SriciPty FRN 3/11/2008 Nib Capi!al Barik FRN 12/02/2008 Nib Capital Bark FRN 19/0 l/2007 Republic of lrelanti FRN 6/04/2006
FRN 2711 m o o 6 1,998,700
1,500,632
2,001,900
500,425
1,000,200
1,996,500
1,001,950
1,998,100
500,124
900,360
2,001,200
3,991,200
1,000,200
1,000,500
1,997,900
1,995,400
1,996,800
,999,500
,003,950
,995,900
501,150
,996,400
1,499,850
1,999,l O0
1,000,000
2,001,800
880,308
1,998,300
1,000,750
999,350
1,996,700
3.20
2 41
3.21
0.80
1 60
3 20
1 .61
3 20
0.80
1.44
3.21
6.40
1.60
1.60
3.20
3.20
3.20
3.21
161
3.20
0.80
3.20
2.40
3.21
1.60
3 21
141
3.20
1 6 0
1 6 0
3.20
Unaudited Report
Nominal Description of Securities Market % of Value Net Assets
2,000,000 Unior Bank of Norway
2,000,000 Yorkshire Builoing Society FRN 4/07/2008 1,999,l O0 3 21
FRN 26/09/2007 2,001,800 3.21
Investment Portfolio at Market Value 52,256,049 83.78
Deposits
9,900,000 HSBC Midland Bank TD 9,900,000 15 87
Total Deposit
Cash at bank Other assets Liabilities
9,900,000 15.87
75,390 0.12 197,175 0.32 (54,374) (0.09)
Total Net Assets 62,374,240 100.00
Geographic Division of Investments as a t 30 June 2004
% of Net Assets
Australia Austria Canada France Germany lceiand Ireland Italy Netherlands Norway Uriited Kinydorri USA
1.60 1.61
13.62 4.80 5.60 3.20 0.80 3.20 8.82 6.42
22.88 11 23
Investment Portfolio at Market Value
Deposits Cash at bank Other assets Liabilities
83.78
15.87 0.12 0.32
(0.09)
Total Net Assets 100.00
I
4

Aviva Funds - GBP Reserve Fund Unaudited Report
Schedule of Investments as at 30 June 2004 (expressed in GBP)
Nominal Description of Securities Market % of Value Net Assets
Bonds Traded on an Official Stock Exchange
3,000,000
1,000,000
500,000
1,000,000
500,000
1,500,000
1,500,000
1,500,000
1,500,000
1,500,000
1,500,000
2,000,000
1,500,000
1,500,000
2,000.000
500,000
1,000,000
2,000,000
2,000.000
500,000
500,000
2,000.000
1,000,000
Abbey NaTional Treasuy Servites FRN 1 011 0/2006 3,000,000 Alliance 8i Leicester Group FRN 25/05/2006 1,001,100 Bark of Ireland FRN Î/08/2005 500.2 15 Barik of Nova Scotio tKN 1/09/2005 1,000,400 Barclays Bank FRN 7/04/2006 500,500 Britannia Bui!dirg Socie:y FRN 25/07/2006 1,501,500 Canadian lmoeiial Bank of Comrierce FRN 19/06/2006 c I tigro J O FRN 2E/03/2009 Coventry Buiidiry 8ocie:y FRN 9/10/2007 üer Norske Bank FRN 8/07/2008 Derbysiire Bui!diny 8ocie:y FRN 5/06/2007 Gener5l Electric Capital UK FRN 14/10/2005 Irish Life IIi Permanent FRN 1E/01/2007 Leeds R Hulbetk B d d i n y Sotiety FRN 1 C/09/2007 National Australia Bank FRN 16/OR/2005 Nation:vide Bu!ldirig So( iety FRN 7/07/2004 Na:iori:vide Bii:lding Society FRN 7/07/2009 Nib Capital Bank FRN 18/03/2009 Poit,*ei Buildiriy Sotiety FRN 1E/09/2007 San Paolo lrni Bank FRN 14/06/2006 Westpac Banking FRN 14/06/2006 Westpac Banking FRN 23/07/2008 Yorksh re Bliildinç Society FRN IÊ/10/2005
1,500,675
1,498 500
1,500,000
1,499,250
1,498 350
2,000,700
1.497.900
1,498,425
?.000.?00
500.000
999,800
2,000,400
1,997,000
500,575
500,750
1,998,100
1 ,O0 1,500
8 O 1
2 67
1 3 4
2 67
1 3 4
4 O1
4 O 1
4 O0
4 O 1
4 O0
4 oc 5 34
4 O0
4 00
5 34
1 3 4
2 67
5 34
5 33
1 3 4
1 3 4
5 34
2 67
Investment Portfolio at Market Value 31,495,840 84.12
Deposits
6,700,000 Centre Barik TD 6,700,000 17 89
Total Deposit
Cash at bank Other assets Liabilities
6,700,000 17.89
37,052 0.10 258.371 0.69
(1,050,403) (2.80)
Geographic Division of Investments as at 30 June 2004
% of Net Assets
A J st ra I i a 12.02 Cariada 6 68 Ire.and 10 68 Neheriaids 5 34 Norway 4 O0 Portuga! 1 3 4 Ilriited Kiriydom 40.05 USA 4.01
Investment Portfolio at Market Value 84.12
Deposits Cash at bank Other assets Liabilities
17.89 0.10 0.69
(2.80)
Total Net Assets 100.00
Total Net Assets 37,440,860 100.00
5

Aviva Funds - USD Reserve Fund Unaudited Report
Schedule of Investments as at 30 June 2004 (expressed in USD)
Nominal Description of Securities Market % of Value Net Assets
Bonds Traded on an Official Stock Exchange
400,000
400,000
400,300
500,000
500,000
300,000
300,000
470,000
300,000
300,000
500,000
500,000
500,000
500,000
500,000
400.000
500,000
A i l i m e & Leicester FRN 4/04/2007 An2 Banking Grtiiip FRN 7/04/2008 Bank of M o n t w FRN 30/06/2008 Banc of Nova S C O : ~ ~ FRN 22/05/2008 Bos International AusPalia FRN 16/04/2009 Caisse Centrale Jardin Quebet FRN 1/06/2006 Canadian Imperial Bank FRN 24/01/2008 Cayniùdrid lriterriationa FRN 28/11/2005 Crédit Agricole FRN 30/07/2006 Der Norkse Bank FRN 17/07/2007 Hainburg Landensbdnkeri FiriancP FRN 24/09/2007 Morgan StanlPy FRN 22/01/2009 National Bank of Canada FRN 10/10/2007 Natioriwidp Builtiirg Society FRN 9/03/2009 Nib Capital Bank FRN 6/02/2007 Royal Bank of Canadd FRN 28/03/2008 We5tIbankeq FRN 10/03/2009
400,500
400,620
401,300
500,850
499,425
300,045
300,135
469,695
300,180
300,195
499,500
5 O O, 4 5 0
500,650
499,400
499,674
400,380
499,700
3 91
3 91
3 92
4 89
4 88
2 93
2 93
4 59
2 93
2 93
4 88
4.89
4 89
4 88
4 a8
3 91
4 88
Investment Portfolio at Market Value
Deposits
1,000,000 ABN Amr0 TO 1,900,000 HSEC Midlarid TD
7,272,699 71.00
1,000,000 9.76 1,900,000 18.55
Total Deposit
Cash at bank Other assets Liabilities
2,900,000 28.31
67,087 0.65 12,138 0.12 (9,287) (0.08)
Geographic Division of Investments as at 30 June 2004
% of Net Assets
Australia Canada France Gerrndriy Netherlands Norway Uniied Kirigdom USA
8.79 28.06
2.93 9.76 4.88 2.92 8.78 4.88
Investment Portfolio at Market Value
Total Deposits Cash at bank Other assets Liabilities
71.00
28.31 0.65 0.12
(0.08)
Total Net Assets 100.00
Total Net Assets 10,242,637 100.00
6

Aviva Funds - European AAA Bond Fund - Long Term
Schedule of Investments as at 30 June 2004 (expressed in EUR)
Nominal Description of Securities Market % of Value Net Assets
Bonds Traded on an Official Stock Exchange
2,845,000
2,295.000
4,500,000
7,710,000
10,352,000
1 1,752,000
2,205,000
4,885,000
2,700,000
4,580,000
Austria
France OAT
France OAT
France OAT 5% 25/10/2016 France OAT 5.5% 25/04/2029 Germany
Germany
Germany 6.250'0 4/01/2024 Hbos Treasury Services 4.5% 17/12/2008 Netherlands
6.25% 15/07/2027
4% 25/10/2013
4 25% 25/04/2019
5.5% 4/01/2031
5.625% 4/01/2028
7 5% 15/01/2023
3,358.807 5 55
2,235.789 3.60
4,293,725 7.09
8.05d.252 13.31
1 1,174,984 18.47
12,718,014 21.02
2,409,183 3 Y8
5,753,065 9 51
2,695.267 4.45
6,079,721 10.05
Investment Portfolio at Market Value 58.772.307 97.12
Cash at bank Other assets Liabilities
491,281 0.81 1,343,056 2.22
(91,937) (0.15)
Unaudited Report
Geographic Division of Investments as a t 30 June 2004
% of Net Assets
Austria France Germany Npthprldnds United Kingdom
5.55 42 56 34.51 10.05 4.45
investment Portfolio a t Market Value 97.12
Cash at bank 0.81
Liabilities (0.15)
Total Net Assets 100.00
Other assets 2.22
Total Net Assets 60,514,707 100.00
7

Aviva Funds - European AAA Bond Fund - Short Term
Unaudited Report
Schedule of Investments as at 30 June 2004 (expressed in EUR)
Nominal Description of Securities Market % of Value Net Assets
Geographic Division of Investments as at 30 June 2004
% of Net Assets
Bonds Traded on an Official Stock Exchange
9,085,000 BuridPssrhatzanv/eisungen 2 5% 16/09/2005 9,088,979 8.61
5.2506 i5/0//2008 23,418,455 22.18
4.5% 12/07/2006 14.7 14,008 13.94
5.5'13 2 5/04/200 I 24,041,080 22.77
4% 16/02/2007 5,584,070 5 29
6 % 5/01/2006 15,537,107 14.72
3.5910 12/02/2009 10,381,063 9.83
71,950,000 Dutch
14,235,000 France OAT
22.595.000 France OAT
5,450,000 Gprliany
14,805,000 Germany
10,500,000 HBOS Treasury Services
Investment Portfolio at Market Value 102,764,762 97.34
Cash at bank (874,041) (0.83) Other assets 3,819,302 3.62 Liabilities (1 41.352) (0.13)
Total Net Assets 105,568,671 100.00
Frarce Gerrnapy NethPrlards Uri ied Kiriyriom
36.71 28 62 22.18 9.83
Investment Portfolio at Market Value 97.34
Cash at bank (0.83) Other assets 3.62 Liabilities (0.13)
Total Net Assets 100.00
a

Aviva Funds - Global AAA Bond Fund Unaudited Report
Schedule of Investments as at 30 June 2004 (expressed in USD)
Nominal Description of Securities Market % of Value Net Assets
Geographic Division of Investments as at 30 June 2004
% of Net Assets
Bonds Traded on an Official Stock Exchange
3 10,000
96,000
1,810,000
920,000
1,500,000
4,245,000
750,000
1,190,000
285,000
505.000
41,000,000
240,000
41 7,000,000
282,500,000
5,000,000
91,000,000
1,075,000
1,310,000
350,000
277,000
727,000
425,000
2,320,000
50,000
334,000
770,000
Ausyralia 6.75% 15/1 1/2006 Aus:ralia 8.75% 15/08/2008 Bundesschatzanweisungen 2.5% 16/09/2005 Canada 6% 1/09/2005 Denmark 5% 15/11/2013 Denmark
France OAT 6.5% 25/04/201 1 Germany 3.75% 04/07/2013 Germany 5% 4/01/2012 Germany
Italy BTP 0.375% 10/10/2006 Italy BTP 6% 1/05/2031 Japx 0 .8c /~ 20/03/2013 Japa- 0 .89 20/06/2009 J a pa r i 1 1% 20/03/2033 Japx 3 3?6 20/06/2006 \pain 6% 31/01/2008 Sweden 5% 28/01/2009 IJK reasury
UK Teasury 8% 15/11/2021 US Treasury 8% 15/11/2021 US Treasury 1.625% 30/04/2005 US Treasury 4% 15/06/2009 US Tredsury 4.875% 15/02/2012 US Tredsury 5.625% 15/05/2008 115 Treasury
6% 15/1 1/201 1
6.2E% 4/0 1/2025
5% 7/03/2008
6 2596 15/05/2030
221.708
74,052
2,201.41 1
708,190
253,989
770.448
1,046.139
1,391,077
366,471
773.033
318,271
330.680
3,570,684
2,592,367
32,441
887.568
1,423,078
181,083
632,475
668.566
946,364
423,5/2
2,330,784
51,370
358,463
856.1 14
0.9'
0.30
9.02
2.90
1.04
3.16
4.29
5.70
1.50
2.96
1.55
1 .35
14 63
10 62
0.13
3 64
5.83
0.74
2.59
2.74
3.88
1.74
9 55
0 2 1
1.47
3.51
Investment Portfolio at Market Value 23,419,898 95.95
Cash a t bank Other assets Liabilities
1,312,057 5.38 437.862 1.79
(762,588) (3.12)
Australia Canada Denmdrk Fraicc Germany
Japan Spain Swpdpri Uniled Ki USA
It&
ngdom
1 2 1 2.90 4.20 4 29
19.18 2.90
29.02 5.83 0.74 5.32
20.36
Investment Portfolio at Market Value
Cash at bank Other assets liabilities
95.95
5.38 1.79
(3.12)
Total Net Assets 100.00
Total Net Assets 24,407,229 100.00
9

Aviva Funds - Emerging Markets Bond Fund
Schedule of Investments as at 30 June 2004 (expressed in USD)
Nominal Description of Securities Market % of Value Net Assets
Bonds Traded on an Official Stock Exchange
3,500,000
10,500,000
2,000,000
632,000
43,000
5,000,000
1,000,000
1,700,000
8,000,000
G51,OOO
5,860,000
19,000,000
6,750,000
1,000,000
4,000,000
7,000,000
4,950,000
3,000,000
500,000
2,000,000
1,500,000
3,000,000
5,000,000
7,000,000
3 000.000
5,500,000
~,000.000
3,000,000
6,000,000
13,000,000
2,200,000
4,000,000
2,000,000
3anque Centrale de Tunisie
3 r d 8 % 15/04/2014 3razil 109.; 1G/01/2007 3razil 1 O0/c 30/07/2007 3 r m 1096 7/08/?01 1 3 r a 1 1 17/06/2040 3rJzll 12Olc 17/11/2006 3 r m
3fazil
3razil
3razil
3 r d FRN 15/04/2012
1.5% 15/01/2013 3ulgaria 8.2S% 15/01/2015 Bulydrid FKN 28/07/2024 Colombia
Zolombia 1 1 375% 31/01/2008 Colomb d 11 5% 31/05/2011 Corporation Andina de Forrento
Ecuador 12% 15/11/?017 ?mdor 5% 15/08/2030 Vex c m
Mexico 5.375% 10/06/7013 \lexl( (1
7.375% 13/03/2008 Mexico 3.875% 1/02/201c Mexico 1 1.50% 15/05/2026 Ivlpxic o 5.675% 15/01/2014 Mexico 7 5% 8/03/2010 Mexico 7.5% 8/04/2033 Mexicu 6 125% 30/1 2/2019 Mexico 8 37596 14/01/2011 Mcxlco FRN 13/01/2009 Mex,co Vahe Recovey Right 30/6/2005
4.75% 7/04/201 1
12.75% 15/01/2020
14.5% 15/10/2009
8.875% 15/04/2024
8.875% 15/04/2024
3ulgarla
9.75% 9/04/2011
6 , 3 7 5 ~ ~ ia/06/20~9
8% 24/09/2022
Unaudited Report
Nominal Description of Securities Market % of Value Net Assets
4,189,906
11,240,769
2,102,500
1,173,898
41.338
4,652,500
1,320,633
1,802,000
9,297,520
522,428
4,733,708
14,977,739
12,246,976
1,161,550
4,003,760
1,746,762
6,786,270
4,122,373
655,666
1.81 5,000
1,057,675
3,082,500
5,928,442
9,326.552
3,533,250
7,627,400
1,904,900
4,042,865
5,761,500
13,840,970
2,476,100
4,069,000
47,000
1.15
3.09
0.58
0.32
0 01
1.26
0.36
0 50
2 56
0.14
1 3 0
4 12
3.37
0 32
1.10
0.48
1.86
1.13
0.18
0.50
0.29
0.65
1.63
2 56
0 99
2.10
0 52
1.11
1.58
3.80
0.68
1 1 2
0.01
2,000,000
2,000,000
?.000,000
1,000,000
2,400,000
5,000,000
2,000,000
1,000,000
3,000,000
2,000,000
2,000,000
880,000
9,500,000
1,000,000
1,000,000
1,000,000
3,000,000
4,500,000
10,550,000
500,000
6,700.000
10,500,000
9,675,000
7,000,000
7,000,000
700,000
4,100,000
2,000,000
5,000,000
2,000,000
6,500,000
2,000,000
1,000,000
Mexico Value Recovery Right 30/6/2006 Mexico Value Recovery Right 30/6/2007 Panama
Pdnamd 9.375% 16/01/2023 Panama 9.625% 8/02/201 1 Pernex blaster FRN 15/06/2010 Pemex Master FRN 15/10/2009 Peru
Peru
Pctronas
Petronas
Philippincs 8.37596 12/03/2009 Philippines
Philippines 9% 15/02/2013 Philip pirics 9.375% 7/12/2006 Poldnd 3.75% 27/10/2024 RJ% Ldffdn Liquid Nationdl GAS
Romania 10 625% 27/06/2008 R u w d
Russia 12 75Yo 24/06/2028 Russia 3% 14/05/2006 Ruwa 3% 14/05/2008 Russia 5% 31/03/2030 Russia
South Africa 5.25% 16/05/2013 South Africa
5outh Africa 9 125% 19/05/2009 Turkey 10.50% 13/01/2008 Turkey 11% 14/01/2013 Turkey 1 1 5% 23/01/2012 Turkey
Turkey
Ukraine
10.75% 15/5/2020
9.125% 15/01/2008
9.1 2 5% 2 1 /02/20 1 2
7.625% 15/10/2026
7.875% 22/05/2022
8.375% I 5/02/20i I
3 437% 15/09/2009
10% 26/06/2007
8.25% 31/03/2010
7% 10/04/2008
9% 30/06/2011
9.875% 19/03/200a
1 0G/o 15/03/2007
41.000
34,000
2,266,300
1,320,600
2,664,000
5.31 8,500
2,372,500
1,392,500
3,375,000
2,106,400
2.1 95,100
31 6,344
9,348,000
367,500
1,299,358
833.750
2,949.000
6,662,248
11,870,333
723,750
6,465,500
9,200,625
8,782,481
7,542,500
8,300,669
926,996
4.766.045
2,149,500
5,425,000
2,221,400
6.480.500
2.1 10,000
730,432
0.01
0.01
0.62
0.28
0.73
1.36
0.57
0.30
0.85
0.58
0.60
0.25
2.57
0 27
0 36
0 23
0.81
1 8 3
3.26
0.20
1.78
2.53
2.41
2.07
2.26
0.25
1.31
0 59
1 49
0.61
I .7a
0.58
0.20
10

Aviva Funds - Emerging Markets Bond UnauditedReport
F U n d (continued)
Schedule of Investments as at 30 June 2004 (expressed in USD)
Nominal Description of Securities Market % of Value Net Assets
Geographic Division of Investments as at 30 June 2004
% of Net Assets
Bonds Traded on an Official Stock Exchange (continued)
1,500,000
4,205,000
1,000,000
500,000
1,000,000
2,000,000
3.000.000
4,500,000
1,000,000
5,000,000
750,000
Ukraine
Ukrdirie
Uruguay 7 2596 15/0?/201 1 Uruguay 7.59'0 15/03/2015 Uruguay 7 875% 15/01/2033 Venezuela 10 75% 19/09/2013 Vcnezdeld 1 14'0 5/03/2008 Venezuela 5.37596 7/08/2010 Veneiuela
Venezuela FRN 20/04/2020 Venezuela FRN 31/12/2007
1 On/" 15/03/2007
6 875% 4/03/201 1
6 759.0 31/03/2020
907,200
3,982,345
824,750
371,275
642,300
1,985,000
3,836,437
3,566,LI;G
886,250
3,8/4.750
237.71 1
0 25
1 09
0 23
0 10
0 18
0 51..
1 0 5
0 98
0 14
1 0 6
0 01
Investment Portfolio at Market Value 294,745,969 81 .OO
Cash a t bank Other assets Liabilities
61,805,325 16.99 9,779,016 2.69
(2,450,304) (0.68)
Bra711 BiJlgaria Colorribia E c u 6 do r Malaysia Mexlc-o Panamd Peru Phil ppires Poiand Roumaria
Sou!h Afr ica lunisia Turkey Ukraine Urquay Veriezwa
R Js'il a
14.26 4.79 3 47 0 79 118
16.97 3.58 1.15 3.45 0 23 1 8 3
13.25 3.84 1.15 5.05 1 54 0 51 3.96
Investment Portfolio at Market Value 81 .oo
Cash at bank 16.99 Other assets 2.69 Liabilities (0.68)
Total Net Assets 100.00
Total Net Assets 363,880,006 100.00
Open Forward Foreign Exchange Transactions as at 30 June 2004
Economic Division of Investments as at 30 June 2004
% of Net Assets
Coyorate Ronds Govcrnrrwrit Bond:
3.95 17 05
Investment Portfolio at Market Value
Cash at bank Other assets Liabilities
81.00
Purchase Sale Value date Unrealised prof i t
USD
US0 71,949,470 FUR 58,700,000 10/09/2004 669,775 US[) 1,184,300 GBP 650,000 10/09/2004 14,116
Total 683,891
16.99 2.69
(0.68)
Total Net Assets 100.00
1 1

Aviva Funds - European Corporate Bond UnauditedReport
Fund
Schedule of Investments as at 30 June 2004 (expressed in EUR)
Nominal Description of Securities Market % of Value Net Assets
Bonds Traded on an Official Stock Exchange
500,000
100.000
45.000
320,000
500,000
100,000
60,000
500,000
200.000
150.000
140,000
?50.000
250,000
150,000
75.000
100,000
100,000
250,000
57,000
25,000
100,000
50,000
10?,000
25,000
300.000
200,000
250,000
400,000
150.000
ao.000
435.000
200,000
130,000
Abb Irtcrnationa’ Finance 6 5% 30/1 1/201 1 Abbey Ndtional Sterling 10 1259’0 4/01/2023 Agco Corporation
AGZ Finance
Ahold Fi,id:>ce 5.87591~ 14/03/2012 Ai< Products & Chemicals 6.50”o 12/07/2007 Akzo Nobel 5.625% 7/05/2009 Alcatel 6.375% 7/04/2014 Allied Domecq Finance
Anglo Arriprican Capi:al
Anglo Irish Bank
Aspwpulsion Cap ta l 9 625% 1/10/2013 A \ W 5 75% 1411 1/202! B d t Iniernattonal Finance
Bdyer
Bmw Fiqance 5% 6/08/2015 Bombardier Capital 5.75% 22/02/2008 Britisn T&(:orri 6 37550 15/02/2006 Britisb Telecom 6 875% 15/02/2011 BSN F’nacciny 10.25% 1/08/2009 B5N Glasspaclc 9,2 5 Yo 1 /08/2 009 Carrefou r 3 375% 15/06/2011 Chesapeake
Ziba 4 87596 24/06/2005 ;#erica1 Medical 6.45% 5/07/2023 Coyn s 9.5% 15/05/2014 Zompass Group 6% 29/05/2009 Credit Suisse Group Finance 6.87 5 96 7/06/2 040 Da,mlercnrysler 75’0 21/03/201 1 Debenhams F.nance 10.5”’~ 28/08/2012 DFUtSc+ TeleKom
Didyeo Caoital
Eco-Ba! Finance
6 875% 15/04/2014
1070 15/07/201 !
5.875% 1?/06/2001!
3 625% 5/06/2008
8.532 5 Yo 28/06/2049
5.125% 9/07/20 1 3
6 % 4/10/2012
10.375% 15/1 1/2C11
8.125% 29/05/2012
3.8 75% 6/0 112009
10.1 2596 3 1/01/2013
520,625 2.16
204,144 0.85
42,975 0 18
356.800 1 48
480,075 2.00
108,572 0.45
63,858 0 27
499,000 2.07
214,l 16 0.89
148,434 0.62
235.975 0.98
256,575 1.07
264,491 1 1 0
148.472 0.62
80,428 0.33
99,326 0.41
94,745 0 39
262.918 1.09
64,913 0.27
26,313 0 1 1
105.690 0.44
49,855 0.21
164,155 0.68
13,051 0 05
329,906 1.37
196,380 0 . ~ 2
269,550 112
622,836 2.59
169,936 0.71
123.307 0 51
527,867 2.19
198,841 0.83
144,625 0.60
Nominal Description of Securities Market % of Value Net Assets
100,000
100,000
50,OOC
200,000
130,000
500,000
70,000
300,000
150,000
250,000
125.000
300,000
245,000
100,000
a5.000
200.000
200,000
150,000
500.000
100,000
135.000
200,000
75.000
2 10,000
325,000
270,000
225,000
225,000
285,000
250,000
75,000
200,000
125,000
Eircom Funding 8.2596 15/08/2013 Fnel Azioni
Energie Oberoesterreicn 4% 26/02/2009 Er>od,s 10.375% 15/04/2012 Fsselte Holdings 7 625% 15/03/2011 Fiat Finance &Trade 6.25% 24/02/2010 Firstg-oup
FImder Holdings 11% 1/08/2010 Focus Wickes Finance 109’0 28/07/201 1 Ford Motor Credit 6.75% 14/01/2008 France Telecom 4 625% 23/01/2012 France Telecom 7.59’0 14/03/201 1 Fresenius Medical Care 7.375% 15/06/2011 Gal Finance 11.5% 30/11/2009 Ga laher
General Motors 6% 16/10/2006 General Motors
Glaxosmithkline Capital 3.375% 15/04/2008 HSBC Capital Funding a . 0 3 ~ 2911 212049 lberdrola 1n:ernationa 3 25% 15/04/2006 Imperial Tobacco 6.25% 6/06/2007 Impress Group
lneos Group Holdings 10.5% 1/08/2010 Innarsat Finar1c.e
Intcrrlatioral Endesa 5,3 75 9’0 2 1 /02/20 1 3 Johnson Diversey 9 625% 15/05/2012 JSG Funding 1 0.1 25 %b 1 /10/20 1 2 Kamps 8 596 15/02/2009 Kappa Beheer 10.625% 15/07/2009 Kaufman Broad
Kingfisher 4.509’0 21/10/2010 Klocknfr Pentapla 9.375% 15/02/2012 Koninklijkc KPN 4.75% 5/1 1/2005
4.125% 20/05/2011
6.125% 1 8/01 /20 19
5.875% 8/06/2008
7 25% 3/07/2013
10 5% 25/05/2007
7.62 5% 30/06/20 1 2
8 75% 1/08/2009
.s 05,13 5 0.44
98,890 0.41
49,875 0 21
327,833 1 3 6
127,524 0.53
485,000 2.02
102,196 0.42
343,140 1.43
207,529 0.86
267.428 1 1 1
123,879 0.51
488,281 2.03
264,367 1.10
1 12,984 c. 47
90,738 0.38
208.859 0.57
2 16,370 0.90
148,674 0.62
599,865 2.49
100,683 0.42
144,304 0.60
204,000 0.85
83,250 0.35
169.71 5 0.71
339,316 1.41
291,600 1.21
245,048 102
235,125 0.98
300,148 1.25
278,750 1 1 6
75,212 0.3 1
2 14,870 0.89
128,752 0.54
12

Aviva Funds - European COrpOrate Bond UnauditedReport
F U n d (continued)
Schedule of Investments as at 30 June 2004 (expressed in EUR)
Nominal Description of Securities Market % of Value Net Assets
Nominal Description of Securities Market % of Value Net Assets
~~
Bonds Traded on an Official Stock Exchange (continued)
400,000
375,000
290,000
685,000
300,000
300,000
175,000
90,000
50,000
150,000
125,000
2 10,000
200,000
100,000
125,000
100,000
250,000
50,000
150,000
500,000
150,000
75,000
300,000
100,000
125,000
125,000
80,000
250,000
85,000
250,000
125,000
360,000
50,000
Krows Inte*riational 8.87596 30/06/2009 Ldfarye 6 375% 26/07/2007 Legrand 8.5% 15/02/2025 Lighthouse lnternatiorial 8% 30/04/2014 Lloyds TSB Capital
hlarcoii
Nalco 9% 15/11/2013 Natiorial Cable
N G G Finance 6.12596 23/08/2011 Nom: Luxembourg 9.75% 15/07/201 1 Nom? Ldxcmoourg 9.75':o 15/07/2020 Nyco Holdings
Olivetti Inrc'ndtiorial Finaice
Pearsori 6.125Y0 1/02/2007 Perriex Master Trust 7.75% 2/08/2007 Punch Tavercs 6.46896 15/04/2033 RBOS Capita' Trust 6 467% 29/1 2/2049 Rexarn 6.62 5% 27/03/2 007 Roche Finance Europe 4% 9i10/2008 Royal Bank of Scotland 6Oh 10/05/2013 RWE Finance 6,375% 3/06/2013 Safeway 6 5% 12/04/2010 Safilo Capital 9.62570 15/05/2013 Sair!skury
Suez Alliance 5.5% 20/02/2009 Tate &Lyle International Finance 5 75% 6/10/2006 TDL lnfornedia Holdings 12.1 25% 15/10/2009 Teksid Aluminium Lux
T e l ~ Columbus FRN 15/04/2010 Telecom Italia Spa 6 25% 1/02/2012 Telefonica Europe 6.1 25% 21/09/2005 Telenet Commuriication 9% 15/12/2013 Tesco 4.75% 13/04/2010
7 375% 29/12/2049
8% 30/04/2008
9.7596 1 5/04/20 1 4
11.5% 31/03/2013
6.875910 24/01/2013
5.625% 11/07/2008
11.375% 15/07/2011
424,380
404,374
245,748
660.5EG
348,330
193,320
179,375
128,333
54,432
150,143
125.863
235,725
224,658
106.516
136,544
153,150
275,204
53,738
152,097
548,030
230,257
83.263
275,070
105.325
132,302
131,223
130,537
2 1 3,950
81,256
270.851
129,9/6
359,496
51,404
1.76
1.68
1.03
2.75
1.45
0 86
0.73
0.53
0.23
0.62
0.52
0 98
0.93
0 44
0.57
0 64
i.14
0.22
0.63
2.28
C 96
0.35
1 1 L
0.44
0.55
0.55
0.54
0 89
0.34
1 1 3
0.54
1 4 9
0.21
390,000
300.000
100,000
100,000
250,000
40,000
250.000
200.000
100,000
125,000
40,000
100,000
;45,000
TVN Finance Corporatior. 9.S0/o 1511 2/2013 Tyro International 5 5% 19/11/2008 Un il eve, 4. 2 5 "0 26/09/2007 Unique Pub Finance 6.464% 30/03/2032 United Biscuits 10 625% 15/04/2011 UPM-Kymmene 6.1 2 5 96 23/0 1 /20 1 2 Vdlerltia Telecom 7,2596 15/08/2013 Vpolla Environmen: 5 875% 1/02/2012 VNU 6.7596 29/10/2008 Vdafone Group
Warner blusic Group 8 125% 15/04/2014 WPP Gram 6% 18/06/2008 Yell Findr:ce 10.75% 1/08/2011
5 125% 10/04/2015
405,600
315,123
102,334
153,068
27 1,562
43,070
259,062
214,564
110,399
126,793
57,022
107,240
240,920
1 6 9
131
0 43
0 64
1 1 3
0.18
1 08
0 89
0 46
0 53
0.24
0 45
1 00
Investment Portfolio 98.38 at Market Value 23,671,301
Cash at bank 751,731 3.12 Other assets 566,254 2.35 Liabilities (928,443) (3.85)
24,060,843 100.00 Total Net Assets
13

Aviva Funds - European Corporate Bond UnauditedReport
c I
1 u n d (continued)
Economic Division of Investments as at 30 June 2004
% of Net Assets
Autorr:oblles 4.22 Ct!e~ilcdls 7.12 Conglomerates 2.38 Construction & Bu i ld iy Mdterlais 3 44 Consumer Goods 4 56 E,ectrical & Other Fnqinwririy 1 2 1 Financial Institiitiorw 23.14 Fooo 7.42 Hedlth 8, Persoral Care 2 24 IndJstval 1.43 Insuranrp 1 1 0 Mdnufacruring 1.70 Media 9.15 MPtals & Minerals 0.62 Mkcellancous 0 42 Oil & Gas 0.57 Paper & Packagiriy 4.18 Pharmaceutic c ~ l ~ 2.23 Property 0.64 Reta,l 1.68 T P ~ P ~ oirirriunicat ons 13 85 Trdnsportaaon 0,47 Utilit,es 4.66
Investment Portfolio at Market Value 98.38
Cash at bank Other assets Liabilities
3.12 2.35
(3.85)
Total Net Assets 100.00
Geographic Division of Investments as at 30 June 2004
% of Net Assets
Austria 0 21 Belgum 1.48 Canaria 0 38 Dwrmr i c 0 97 Finlarid 0 18 Franc e 10 56 Germany 6.49 Ireland 2.54 Italy 3 56 Nethcdands 13.35 Spain 0 4) Sweden 0.53 Switzerland 4.75 United Kinqrlorii 40.1 1 USA 12 85
Investment Portfolio at Market Value 98.38
Cash at bank Other assets Liabilities
3.12 2.35
(3.85)
Total Net Assets 100.00
Open Forward Foreign Exchange Transactions as at 30 June 2004
Purchase Sale Value date Unrealised loss EUR
EUR 3,679,004 GBP 2.504.000 20/08/2004 !39,334) EUK 636.404 US0 159,000 20/08/2004 11,504
14

Aviva Funds - Global Balanced Fund
Schedule of Investments as at 30 June 2004 (expressed i n USD)
Quantity Description of Securities Market % of Value Net Assets
Equities Traded on an Official Stock Exchange
2,000 936
3,500 1.163 1,172 3,650 3,600 5,000 4,000 1,200 3,200 3,600 1,900
900 4,400
21,367 10,327
179,000 6,500 5,428 5,505 2,400 6,400 2,617 1,800 5,276
16,000 2.000
612 2,526 6,700 2,500
13,000 1 1,500
1,227 12,000 13,359 4,000 2,248 7,000
16,000 7,000 5,307 1,021 7,190 4,500 5,000 4,800
500 729
2.600 12,000 13,000 13,000
1,198 2,400
17,000 61,000
16 2,800
360 1,100
L1,OOO 20,500 70,000
3M Company Aflac Alroa Altria Group American Express Amer can lnterriational Group Amgen Astrazeneca Atlas Copto Class ' A Aventis Bayer Motoren Werk Bowater Brascan Class 'A' Canon Cdrr1i.m Cisco Systerris C it i g rou p Cnoo: Coach Corporalion Coca-Cola Comcasl Corporation Class ' A Conorophillips Credi: Suisse Group Dell Deutsche Bank Deutsche Telekom Diageo Dow Chemical Ehay Eridesa Sa Eni Estee Lauder Class 'A Exxon Mobil Corporation Foot Locker Franc? Telecom General Electric Glaxoimilhklirie Harley Davidson Hewlett Packard Honda Motor HSBC Holdings Hypo Redl Estate Holdings Iberdnla IRM Intel Corporation lnterbrew Johnson &Johnson Kao Corporalion Keyence Corporation Kimberly-Clark Marriolt International Class 'A' Marui Corporation MatsLshita Electric Industries Mbna Corporation Medtronic Merck & Co Microsoft Mitsubishi Electric Corporalion
179,580 37,941
1 15,273 58.41 2 60,094
260,446 194,670 225,816 151.108 91,288
141,237 149,418 5?.688 47,546
2 14,222 50/,146 478.398
75,444 290.323 274,358 153.562 181,704 229,716
93.309 142.808 93,358
2 16.450 81,870 56,209 49, 1 19
133,949 120.263 579.41 0 273,930
32.109 387,960 272.747 245.180 47,433
338,285 240,436 204,070 1 1 1,939 90,180
198,264 142,458 278,725 1 1 5.984 114,339 48.01 9
129,883 162,068 185,010 335,075
58.588 1 13,640 484.075 300.396
Mitsubishi Tokyo Finan'cial First Section 148,471 Morgan Stanley DW Group 146.664 Munchener Ruckvers 39,599 Nestle 295,297 Nokia 305,722 Nomura Holdings 304,177 Nomura Topix Barlks Cxchange [Open ended Fund] 181,362
0 49 0 10 0 31 0.16 0 16 0.70 0.53 0.61 0.41 0.21, 0.38 0.40 0.14 0.1 3
1 3 7 1.29 0.20 0 78 0.74 0.41 0.49 0.62 0.25 0.39 0.25 0 58 0 22 0.15 0.13 0.36 0.33 1.57 0.75 0.09 105 0 74 0 66 0 13 0 91 0.65 0.55 0.30 0 24 0.54 0 38 0 . /5 0 31 0 31 0.13 0.35 0.44 0 50 0 91 0 16 0,31 1.3' 0.8' 0.40 0.40 0.1 1 0 80 0 83 0.82
0.49
o sa
Quantity/ Description of Securities Nominal
6,400 19
1,300 28,000
3,632 10,600 5,300 1,578 6.966 6,513 5,233 1,400 2,300
23,932 ? , lo0
28,000 9,000
2,383 8,000
38.000 1 1.956 3,245 1,656 3.80G 2,900 1,874
99,000 5,300 9.000 3.070
Novar:is NT l Docono Orrinicom Group Orace Corporation Pepsico Petrol Brd>ileiros Adr Pfizer Philips Electric Procter I: Gamble Rin Tirito Royal Berik of Scotland S a n d Synthdabo SAP Shell Transport &Trading SMC Corporation Smith & Nephew 5te Nationale Etude Coristructions Moteurs Suez .lelefonica Telepor Group TP5K Texds Iri$trurrierits To!al UBS United Technologies Verizon Communications Vodafone Group Wdl-Mart Stores Wall Disney VVells Fargo & Co
Total Equities
Bonds Traded on an Official Stock Exchange
410,000
69,000
1,660,000
385,000
3,855,000
335,000
762.000
478,000
471,000
302,000,000
99,500,000
4,000,000
77,000,000
367,000
885,000
Australid 6.75% 15/11/2006 Australia 8 75% 15/08/2008 Burir~esschatzanweis~ingen
Canaoa 6% 1/09/2005 Denmark 6% 15/1 1/201 1 rranre OAT 6 5% 25/04/2011 Germany 6"/0 5/01/2007 Gerrriariy 6.25910 4/01/2026 Italy B.1 P 6% 1/05/2031 Japan 0 896 2C/03/)013 Japdn 0.896 20/06/2009 Japan
Iapan
Spain 6% 31/C1/2008 Swederi
2 5% 16/09/2005
1 1 Yo 2G/03/2033
3.3 % 2 0/06/2006
5% 28/01/2009
Unaudited Report
Market % of Value Net Assets
284,053 0 77 34,040 0.09 98.937 0.27
329.700 0 89 195,075 0.53 258.693 0.70 182.002 0.49 42,742 0 12
382,155 1.03 155.805 0.42 152,772 0.41 89,398 0.24
383,632 1.04 176.618 0 48 227,661 0.62 303.968 0.82
175,282 0 47 49,409 0 13
119,189 0.32 264,026 0.72
57,750 0.16 78,058 0.21
3 15,976 0.85 ?70.138 0.73 262.580 0 71
67,520 0 18 21 8.1 32 0 59 275,493 0.74 229,500 0.62 1 18,694 0.33
17,869,124 48.28
292,565
53,225
2,018,973
296,362
699,664
467,276
972,185
684,376
648.959
2,585,963
9 13,064
25,953
751.01 9
485,832
122,334
0 79
0.14
5.46
0 80
1 89
1.26
2.63
1.85
1.75
6.99
2.47
0.07
2 03
131
0.33
15

Aviva Funds - Global Balanced Fund (continued)
Schedule of Investments as at 30 June 2004 (expressed in USD)
Nominal Description of Securities Market % of Value Net Assets
Bonds Traded on an Official Stock Exchange (continued)
11 3.000 IJK Treasury
165,000 UK Treasilry
1.046.000 US Treasury
489.000 US Treasury
1,280.000 US Treasury
5"h 7/03/2OOY 204,199 0.55
8 % 7/06/2021 398,243 1.08
8% 1511 112022 1,361,618 3.68
1 625% 30/04/2006 487,356 1.32
5 625"k 15/05/2009 1,373,750 3.72
Total Bonds 14,842,916 40.12
Investment Portfolio at Market Value 32,712,040 88.40 Cash at bank 4,660,249 12.59 Other assets 319,795 0.86 Liabilities (688,137) (1.85)
Total Net Assets 37,003.947 100.00
Unaudited Report
Economic Division of Investments as at 30 June 2004
% of Net Assets
Aerospace Auturriobiles Business Services & Computer Sottware Chemicals Computer Systems Conglomerates Consumer Goods Electrical & Other Engineeririg Electronics Financial Institutions Food Government Bonds Health & Personal Care Insurance Leisure & Hotels Manufacturing MPdld Vetals & Minerals Miscellaneous Oil & Gas Paper & Packaging Phdrrnaceuticals Retail Telecommunications Utilities
0.71 1.29 3.52 0.22 0.62 0.14 3.67 2.31 1.18 7.66 0 96
40 12 4 06 0.91 1.59 1.54 1.30 0.73 0.74 4.65 0.40 3.16 1.92 4 44 0.56
Investment Portfolio at Market Value 88.40
Cash at bank 12.59 Other assets 0.86 Liabilities (1.85)
Total Net Assets 100.00
16
. . . -

Aviva Funds - Global Balanced Fund (continued)
Geographic Division of Investments as at 30 June 2004
% of Net Assets
Aultralia Belgium Brazil Canada China Denmark Finland France Germany Italy Japan Netherlands Norway Spain Sweden Switzerland United Kingdom USA
0.93 0.38 0.70 0.94 0 20 1.89 0.83 3.29
12.66 2.1 1
17 39 0 12 0 72 2.06 0.74 2.92 7.67
32 85
Investment Portfolio at Market Value 88.40
Cash at bank 12.59 Other assets 0.86 Liabilities (1.85)
Total Net Assets 100.00
Unaudited Report
Open Forward Foreign Exchange Transactions as at 30 June 2004
Purchase Sale Value date Unrealised gain/(loss)
USD
FUR 758,890 IPY 99,000,000 ElJR 671.607 JPY 79,000,000 EUR 307,390 AUD 647,000 AUD 640,000 USD 457,709 USD 265,874 CAD 358,000
JPY 39,000,000 EUR 755,725 JPY 79,000,000 EUR 595,597 AUD 647,000 EUR 377,629 US0 438,624 AUD 640,000 CAD 358.000 USD 259,583
24/09/2004 24/09/2004 14/07/2004 14/07/2004 15/07/2004 15/07/2004 15/07/2004 15/07/2004 21/07/2004 2 1/07/2004
1 1,849
29,684 1,929
35,044 I1 1,028)
4,462 14,622
(242) 6,534
(8,006)
~
Total 84,848
Tw nr t ~inrcal~sed profit a!trioJ:ed to Those transactio'>s is iricl:ided 'vi tkr " o t i r r assets" a i d 111 !he Stxrmrn* nf aperations as mrealijed resuk un?il the tidnsdlion5 drP d o w l riefei t:' i i ok 3.2 $3..
17

Aviva Funds - Global Convertibles Fund UnauditedReport
Schedule of Investments as at 30 June 2004 (expressed in USD)
Nominal Description of Securities Market % of Value Net Assets
Nominal Description of Securities Market % of Value Net Assets
Bonds Traded on an Official Stock Exchange
4,000,000
80,000
3,300.GOO
3,000,000
3,000,000
372,000
5,000,000
2,500,000
4,000,000
5,000,000
5,110,000
5,000.000
5,000,000
6,000.000
3,000,000
5,000,000
4,000,000
200,000,000
5.000,000
1,200.000
2,000,000
3,200,000
500,000,000
3,000,000
2,000,000
15,000
120,000
4,200,000
1,500,000
4,000,000
5,000,000
3,000.000
31 1 375% CIV 1/08/2008 Accor 1.75% Crv 1/01/2008 Adinas 2.5% 8/10/2018 Advarced Medica 2 5"/6 Crrv 15/07/2024 Ayco Corporation 1 75% Criv 31/12/2033 Alberi 7.2596 Crv 16/05/2007 Allegro Investment 0.25% Cnv 15/06/2009 Alliant Technology 2.75% Cnv 15/02/2024 Allied Waste 4 2516 Crrv 15/04/2034 American Express' 1.85% Cnv 11/22/2033 Amer,cari Findnce Group' 1 4861 Yb Cnv 2/06/1033 Amyiii Pharrrid 2 25% C Q V 30/06/2008 Anglo Americav 3.375% Cnb 17/04/2007 Anixter*
Baa 2 62596 Cnv 19/C8/2009 Bedzer 4.G254h Cnv 15/06/2074 Best BJY 2.25% Cnv 15/01/2022 Best Denki 09b Cnv 9/02/2010 B I Services 0.5% Cnv 24/04/2027 Bmw Finance 1.87596 Criv 18/12/2008 Bunqe 3 75% Cnv 15/1 1/2022 Crlixd Finance 0.25% Cnv 3/07/2006 C h b u E:ectric 1 VO Cnv 31/03/2006 Chu,ch & Dwight* 5 25% Cnv 15/08/7033 Coeur Da 1.2596 Cnv 15/01/2024 Compagnie de S:-Gobair ? 62596 Criv 10/12/200/ Coisiellatlon
0% CIV 7/07/2033
5 75% C W 15/01/2024 csg Sys:F!S 2 . 5 8 Cnv 15/06/2024 Decode Genetics
Deulsche Post
Dicks
3 5% C W 15/04/2011
2 6!i% C ~ \ J 2/07/2007
1.6061 96 C ~ V 18/02/2024 DST 3 6259'0 Criv 15/08/2023
4,841,470
4,024.508
4,673,822
3,230,100
3,258.900
10,244,880
6.1 84.958
2,575,250
3,920,000
5,395,500
2,187,591
4,965,000
5,525,000
2,985,600
5,686,431
5,000,000
4,125,600
2,106,336
4.21 1,500
1,728,749
2,600,000
4,119,042
4,742,610
3,720,000
1,640,000
4.01 1,865
3,946,800
4,357,500
1,356,645
5,057,381
3,625,000
3,570,000
1.12
0 93
1 .oa 0.75
0 76
2 37
1.43
0.60
0 91
1 2 5
0.51
1.15
1 2 8
0.69
1.32
1.16
0.96
0.49
0 98
0.40
0.60
0 95
1.10
0 56
0 38
0.93
0 91
1.01
0.3 1
1 1 7
0.84
0.83
3,000,000
151,500
3,500,000
2,200,000
750,000,000
200,000
210,000
5,200,000
2,000,000
2,000,000
350,000,000
1,700,000
3,000,000
50.000
1,800,000
2,500,000
5,000,000
2,800,000
2,800,000
300,000,000
3,400,000
1,500,000
6,200,000
6.000.000
5,000,000
4,000,000
1,300,000
1,500,000
6,000,000
330,000,000
350,000,000
5,230,000
Electronic 1 59/0 Crrv 1/06/2023 Ford Capital 6 . 5 O I c Cnv Pref 15/01/2032 Fortfinlux 3.422% Cnv 29/11/2049 Friends 5 25% Cnv 11/12/2007 Fujitsu 0% Cnv 27/05/2009 Generdl Motors* 5.25% Cnv 15/07/2033 General Motors* 6.25% Cnv Pref 15/07/2033 Glencore 4.125% Cnv 6/10/2010 Goodyear
Halliburton
Harriarridts 0 2% Cnv 28/09/2007 Hannstdr 0% Cnv 14/10/2008 Hanover 4 75% Cnv 15/01/2014 Hartford 7% Cnv Pref 16/08/2006 Hilton Finance 3 375% Cnv 2/10/2010 Hilton Hotel 3.375% Cnv 15/04/2023 Hypovereins 0% C n v 4/04/2005 lmclone 1.375% Cnv 15/05/2024 lnfineor Technoloqy 5% Criv 5/06/2010 Kawasaki 0% Cnv 30/09/2010 KFW lnternatiorial 0.875% Crrv 8/01/2007 King Yuan 0% Cnv 16/01/2009 Kredit fur Wiederau' 0.75% Cnv 8/08/2008 [.ear Corpordtion 0% Cnv 20/02/2022 Leucadia 3 7596 Cnv 15/04/2014 Liberty Medical 0.75% Criv 30/03/2323 Mdn Group 3 75% Cnv 12/11/2009 Medarex 2 25% Cnv 15/05/2011 Medtronic 1.25% Cnv 15/09/2021 Mitsubishi C9b Cnv 17/06/201 1 Nec Electronic 0% Cnv 27/05/2011 Nestle OVO Cnv 11/06/2008
4 8 Crrv 15/06/2034
3.125% Cnv 15/07/2023
3,539,730
9,578,870
4,520.946
4,286,825
6,899,616
4,924,000
6,092,100
6,493,760
7,031,200
2,131,800
3,440,735
1,904,000
3,367,500
3,299,000
3,762,403
2,693,750
6,663,950
3,241,280
4,466,056
3,297,318
4,335,975
1,541,250
7.645.228
3,083,400
5,025,000
4,526,400
3,008,615
1,222,500
6,099,600
3,308.701
3,279,953
5,399,250
0.82
2.31
1 0 5
0 99
1 6 0
1.14
141
1.51
0 4,'
0 49
0 80
0.44
0.78
0.76
0.87
0.62
1 5 4
0.75
1.04
0 76
1.01
0.36
1 7 7
0.71
1 1 6
1.05
0.70
C 25
1.41
0.77
0 76
1.18
18

Aviva Funds - Global Convertibles Fund UnauditedReport
(continued)
Schedule of Investments as at 30 June 2004 (expressed in USD)
Nominal Description of Securities Market % of Value Net Assets
Nominal Description of Securities Market % of Value Net Assets
Bonds Traded on an Official Stock Exchange (continued)
250,000,000
5,000,000
26,700
52,000
5,000,000
3,000,000
3,00L\.OOO
3 , 5 0 0 , o r ~ ~
2,500,000
80,000
2,250,000
4,000.000
5,000,000
6,800.000
9,000,000
5,000.000
3,000,000
3,300,000
3,500.000
5.1 00,000
500,000,000
4.300.000
200,000
200,000,000
200,000,000
4,000,000
10,000,000
3,800,000
3,500,000
90,000
35,000
50,000
PenTax
Perfoima
Per:iod Rirard 2.5°/~ Cnv 1/01/2008 Pin-Print 2.5'10 Cni; 1/01/2008 Pixt.lworks 1 75'1 Cnv 15/05/2024 Placer Dorw 2.75910 Cnk 15/10/2023 PP/l Group 2 5 % Cnv IYli7/2021 PPL Energy
QJdritd D S ~ K 0% Cnv 5/02/2009 Rdliye 3 7556 Cnv 1/01/2008 Rank Group 3.E75% Cnv 20/01/2009 Reenok Inteindt:onal 2% Cnc 1/05/2024 Relimc e 0% Cnv 24/03/2009 Repcon 4 596 Cnv L6/01/2011 Roche Holding 0% Cnv 25/07/2021 Ropw Industry 14183% Cnv 15/01/2034
4.259'0 Cnv 10/08/2006 Scl-lumbeiger 1 59'~ Cnv 1/06/2023 S e a W Air- 3% C:w 30/06/7033 Siemens klnance 1 375% Cnl/ 4/06/2010 Sory 1.4'16 Cnv 31/03/2005 51 Phc.roelectr:c 04b Cnv 5/07/2013
0 4 C r v 31/03/2009
5 5% C I?, 16/10/2008
2.6?5'/3 ClV 15/05/2023
SJb Fir.di\c.t.
SUP2
4.570 Cn\l 22/05/2006 Siimitomo 0% Cnv 27/03/2009 Suzuki Motor 0% Crw 3 1/03/2010 Telecom I t a h 1.5"' cnr 1/01/2010 Teva Pbarma 0.5"/0 Cnv 1/02/2024 Tu i 4% C C V 1/12/2008 T p Iriternational 2./546 Crw 15/01/2018 Valeo 2.375% Cnv 1/01/2C11 VlPCl
2% Cnv 1/01/2018 Williams 5.5% Cnv Pref 1/06/2033
L,681,G15
5,147,500
4,638,481
6,: 75,694
4,8'2,500
3,326,850
3.~108.3GO
3,608,850
2,875,000
5,096,284
5,132,350
3.YGO.000
5,375.000
7,514,000
5,467.500
2,237,500
5,537,500
3,464,340
3,55/.050
7,228,140
5,058.?03
4,166,700
4,55 1,641
2,06?,604
2,159,073
6,158,820
10,357,000
4,839,160
5,L52,100
5,103.092
4,43 i ,591
3,533,000
0.62
1.19
1 0 8
1 .43
1 1 7
0.77
0.:9
0 84
0 67
1.18
0.96
0 92
1 c.1
1 7 4
1.27
0.52
105
0 EO
0 82
1 6 8
1.17
0 97
1 OG
0 45
0 50
1.43
2 40
1 .12
1 .2L
1.18
1 0 3
0.82
40.000 Xerox 6 2536 Cnv Pref 1/06/2033 5,234,800 121
6.59.; Cnv 1/07/2006 4,038,400 0.94
0% C:lv4/1 1/?010 2.630.163 0.61
160,1100 XL Cdpltal
250,000,300 Yodoqawa
Investment Portfolio at Market Value 422,649,552 97.97
Cash at bank Other assets Liabilities
7,447,351 1.73 8,700,788 2.02
(7,395,967) (1.72)
Total Net Assets 431,401,724 100.00
19

Aviva Funds - Global Convertibles Fund UnauditedReaort
(con t i n u e d)
Economic Division of Investments as at 30 June 2004
Aerospace Automotiilej BLisircss Services & Cnrvputer Software Chcmicals Co-puter Sys:ern< Conglomerate5 Constructio:i & Building Ma:erials Consumer Goods Clec tricdl & Other Engineering Eleciroiiics Financsal Irsritutiom Food tiealth & Pccsonal Care Indusrrlal Insumi t r Leisure & Hotels Mmufacturing Media Merals & Minerrils Miscellaneou5
Paper & Packaging Priarmaceuticals Retail Sewvices Teirr.ciminunicat,ons Transportation Utlllt~es
011 & GdS
% of Net Assets
0.60 8.12 2.22 0 69 3 25 1.98 2.09 8 44 3.1 1 6.77
14.95 4.74 2.47 0 91 3.99 2.67 4.80 1 0 5 1 6 6 0.77 3.05 0 82 5 86 5.39 0.96 1 4 3 1 1 7 4.01
Investment Portfolio at Market Value
Cash at bank Other assets Liabilities
97.97
1.73 2.02
(1.72)
Geographic Division of Investments as at 30 June 2004
% of Net Assets
France 8.83 Germany 5 69 India 101 Italy 1.43
Nethersand% 7.75 Sweden 1 0 5 Tdiwdn 1.47 Unitcd Klngdom 6.36 USA 54.71
Investment Portfolio at Market Value 97.97
Japan 9.67
Cash at bank Other assets Liabilities
1.73 2.02
(1.72)
Total Net Assets 100.00
Total Net Assets 100.00
20

Aviva Funds - American Equity Fund
Schedule of Investments as at 30 June 2004 (expressed in USD)
Quantity Description of Securities Market % of Value Net Assets
Equities Traded on an Official Stock Exchange
1 1,990
26,350 13,100 51,900 8,680
18,120 14,100 29,870 1 1,050 12,050 28,560 12,300 22.1 50
9,920 23,625 40,050 30,020
7,550 6,350
40.850 27,250 10,200 5,100
13,350 33,007 14,800 12,550 5,610
12,550 33,020
9,800 48,850
5,100 8,850
29,l SO 21,200
15,650 12,250 75,660
8,800
78,050 2 1,940 18,600 6,650
10,586 10,010 16,450 14,050 73,250 17,750 9,800 5,600
27,850 25,150 63.880 19,070 7,550
11,150
11,750 3,300
109,290 21,850
8,500
74.680
45,860
3M Company Ace Acuity Brdnds Acxiorn Corporation Administaff Advance Auto Parts Allstatc Alpharma Class 'A' Altria Group Amerada Hess Americdri Express American International Group Amgen Andrx Corporation Delaware Anheuser-Busch Anntaylor Stores Archsr Daniels Mid ATBT Corporation Autc Data Process Autozone Avaya Avnet Avor Products Bdll Corporatton Banc Orie Corporation Bank ol America Bard Bausrh B Lorrib Bear Stearns Bectori Dirkinson Bellsouth Corporation Boston Sciectific Bristol-Myers Squibb Career Educatiori Corpcration CEC Entertainment Cent,epoint Energy Char es River Laboratories International Chevron Texaco Chiqutta Brands Interna:iorial Ci>cc Systems Cit Group Citigroup CMS Energy Corporatiori Coca-Cula Coca-Cold Enterprise Colgate-Palmolive Comcast Corporation Class ' A Conccophillips Constellation Energy
Crown Holdings Dell Dora1 Firiancial Corporation Dun & Bradstreet Edison International EMC Corpofation Exxon Mobil Corporation Fannie Mae Feder Corporatiun Fresh Del Monte Proaucts
Genentech General Dynamics Corporation Gene,al Electric Georgia Pacific
Copart
Gap
1,076,582 358,488 71 1,055
834.293 392,466 832,976 291,165
324.81 5
1,500 221 853,392 61 7,864
2,037,899 665,123 6 2,115 537,862
661,826 440,393 3'8,610 560,197 645,226 607,266 463,947 364,880 673,641
7,791,897 835,090 81 ?,930
633,273 853,732 401,702
1,204,641 226,874 2G3.199 329,395
1 ,OC9.226 1,462,414
253,514 1,795,790
329,868 3,459.551
708,304 I , I 08.957
534,378 389,723 295,296 757,857
684.534
475.81 2
624.278 375.486
632.876 735,796
335,601 297,696 7 10,732 287.2 13
2,847,132 1,363,931
612,079 279,196
1,109,353 635,3?3 331,782
3,533.346 790,970
0 84 0 28 0 55 0 25 0 65 0 31 0 65 0 23 1 17 0 66
1 5 9 0 52 0 48 0 42 0 53 0 51 0 34 0 2 5 0 44 0 50 0 47 0 36 0 28 0 52 2 17 0 65 0 63 0 37 0 LO 0 66 0 31 0 94 0 18 0 20 0 26
0 79 1 14 0 20 1 40 0 26 2 65 0 55 0 86 0 42 0 30 0 23 0 59 0 49 0 19 0 57 0 49 0 26 0 23 0 55 0 22 2 22 1 05 0 43 0 22 0 85 0 43 0 25 2 75 0 62
o 48
Quantity Description of Securities
33,600 16,550
5,500 6,350
42,250 30,460 8,050
20,150 66.400 1 1.580 25.1 50 41 260
8.900 20,540
5,000 9,800 5,100
118 6,850 4,200
25,350 24,300 36,000 29,100 14,100 24,370 26 630 1?,960 8,050
142.970 4.150
23,800 4,600
18,100 39.910 26,590 10,850 9,800
47,940 47,500
8,500
7,050 27,500 21,350 24,490 36,550 85,618 15,550 49.050 44.500
6,650 9,800
32,730 11,010 21,150 13.345 20,750
9,700 66,520 42,690 18,100 5,200
'2.050 57,000
14,700
10,280
Gillette tilobdl Power Equipment Group Guidant Halliburton HPwlett Packard Home Depot Huobell liic Class 'B' IBM lritel Corporation Interndtional Game Technology JC Penney Johnson & lotirison Joncs Apparel Gruup JP Morgan Chase Kelloy y Keycorporation Kimberly-Clark Kronos Worldwide Lafargc North America Liliy El i & Co Liscolrt National L o w s Corporation Carolina Groi Mac Vonald's Magnum Hiinter Resources hlarathon Oil Corporation Max Re Capital Mbna Corporation Merck & Co Merrill Lynch & Co MGM Mirage blicrosoft Morgan Stdriley DW Group Motorola Murphy Oil Corporation National City Corporation Newmont Mining Corporation Nextei Comms Class ' A NI Industries Northrop Grumrnan 0:acle Corporation Owen-Illinois Pacificare Health Systerri Partnerre Peabody Energy Corporation Pentair Pepsi Bottling Group Pepstco Perkinelmcr Pfizer PG&E Corporation Phoenix Procter & Gamble Progressive Corporation Oualcomm
UP
Unaudited Report
Market % of Value Net Assets
1.41 9,936 132,648 307,670 189,738 891,475
1,071.12b 362,854
1,779,749 1,830,980
436.1 03 950,041
2,300,039 347,901 786.687 207,900 289,786 335.937
3,948 298.078 295,008 686,931 609,541 642,006 376,200
1,077,137 274,386 628.137
1.260.93 1 754.1 19 382,254
4.07 1.07 1 222.61 5 428,281 330,763 628.342
1,519,773 713,809 147,126 524,251 564,494 788,738 3 2 2,448 581,694 390,958 733,388 649.574
1,315,358 732,279
2.940.1 22 434.3 12 603,560
2,441,270 564,785 700.455
Qwest Conimuriications International Radioshack Corporatiun Readers Digest Rent-+Center Rockweil Automation Rockwell Collins Sdnrnina-Sct Corporation SBC Communications 1 Schering-Plough Corporation Schlurriherqer Sepraco, Service Corporation International
1 15,373 31 5,547 326,239 401,084 769,618
603,004 ,035,233 330,687 324,194 629,673 421,515
322.089
1 10 0.10 0.24 0.15 0 69 0 83 0.28 1.38 1.42 0.34 0 74 1 7 9 0.27 0.61 0.16 0 23 0.26
0.23 0.23 0 53 0 47 0 50 0.29 0.84 0 21 0 49 0.98 0.59 0.30 3.1 I 0 17 0.33 0.26 0.49 1 1 8 0 56 0.1 1 0.41 0.44 0.61 0 25 0.45 0.30 0.57 0 51 1.02 0.57 2.29 0.34 0 47 1.90 0.44 0.55 0.09 0 75 0.25 0.31 0.60 0 25 0.47 0.81 0 26 0 25 0.49 0.33
21

Aviva Funds - American Equity Fund (continued)
Schedule of Investments as at 30 June 2004 (expressed in USD)
Quantity Description of Securities Market % of Value Net Assets
Equities Traded on an Official Stock Exchange (continued)
14,520 15,134 4,990
17,650 21,950
6,790
10,000 2 1,050 15,650 39.900 19.900 20,040
5,500 12.250 i 1,350 19,260 1 1,550 4,000
22.880 26,780 20,450 27,? 10 47,530 1 1 ,E90 8,810
15,660 32,300
8.800 16,680 45,750
6 , i x 11.750 10,800
8,800
SLhl Corpo:at'ori St Paul Stancorp Financial Group S l J d C Y Works Supervalue Syvaritpc Corporation Sysco Corporalior Tektronix Texas 1nstrumen:s Texlron T.me Warner Tommy Hilfsyer Tvco Inlernational United Health Groi.li Ui i ted TP( hnologies 118 Bdncofp Valcro tnergy Varian MPdi(dl SysLernj Verita5 Sofharc VeriLon Communicatiors Viacorn Class ' R ' Viad Corooratiov Wachovla CorporCilon Wal-Mart S:ore\ bVasl;ington Mutiidl Vdatsorr Phar-a We'ls Fargo & Co Wliams Wil,is Group Holdings Wveth Xerox Corporation XTO Energy YA ti00
ZJ'C Corporation
590.31 1 61i.473 330,039 793.456 675.51 1 293,803 3 1 5,040 349,450 506,358 924,993 694,260 298,998 6G1.520 337.864
1,109.1 75 3 1 1,443
896,106 1 1 1,340 824,365 940,780 545,912
1,705,174 2,470.608
426.91 0 237.208
383,886 327,052 604,900 658.343 178.319 417,654 287.064
i.j90,37a
897,944
Investment Portfolio at Market Value 123,982,649
Cash at bank Other assets Liabilities
4.1 13,920 635,823
(212,238)
0 46 0 48 0 26 0 62 0 53 0 23 0 25 0 27 0 39 0 72 0 54 0 23 0 51 0 26 0 86 0 24 1 08 0 70 0 09 0 64 0 73 0 42 0 94 1 9 2 0 33 0 18 0 70 0 30 0 25 0 47 0 51 0 14 0 32 0 22
96.47
3.20 0.49
(0.16)
Economic Division of Investments as at 30 June 2004
Unaudited Report
% of Net Assets
Aerospace 1.79 Business Servites & Computcr Software 5.49 Criernicdls 0.12 Computer Systems 2.79 Construction I: Bi.il(iing hlalerials 0.24 Consumer Goods 5 72 Ele(tricdl & Other Evgineering 1 60 Electronics 3 59 Financial lnstituiinns 13.06 h o d 1 .e/ Health & Personal Care 11.04 Ins~rance 5 61 Lcisure & Hotels 0 30 Manbfactimiy 5.94 Medid 1.75 Metals & Minerals 118 Oil & Gas 8.37 Paper & Packaging 2 08 Pharmaceuticals b.55 Retail 6.59 Services 2.39 T?lecommunications 5 88 Transportat:on 0 48 LJiilitiej 2.19
Investment Portfolio at Market Value 96.47
Cash at bank Other assets Liabilities
3.20 0.49
(0.16)
Total Net Assets 100.00
Total Net Assets 128,520,154 100.00
22

Aviva Funds - Asia-Pacific Equity Fund
Schedule of Investments as at 30 June 2004 (expressed in USD)
Quantity Description of Securities Market % of Value Net Assets
Equities Traded on an Official Stock Exchange
1 1 1,500 153,000 504,800 22,357
370,900 214,000 139,050
1,854,237 55,300
843,300 35.1 70
1,770 43 1,400 171,900
1,602,600 200,515
2,236,000
192,800 5,880
154.707 676,000
36,325 37,067
465,000 1,257,800
42,770 202,300 278,000
33,300 2.81 5
625,000 31,520 54,484
608,100 1 1,380
774,100 67,900
1 15,400 189,552 228,700
66,900 9,637
14,840 13,080 22,800
713,600 409,000
74,270 630,900 303,900 46,070
759,900 4,190
28,800 7,700
198,800 94,600
398,493 273,400 432,103
14,380 94,500
701,000 1 1,900
787.000
Advanced Info SPrvice Aduznccd Semiconductor Amrrb Holdings APN News & Media Astrr International Astro All Asia Networks AU Optronics Bank Mandiii Bhp Billiton Boc Hong Kong Holdings Brambles Industries Cheil Communications Cbina Life Insurance China Mobile Hong Kong C h i n Oilfield Services Chirnd Steel Corporation China Telecom Corporation HK China Trust Findric:ial City Dwelopments Singapore City Developments Warrants 10/05/2020 CLP Holdirigs Cnooc Colei Myer Colorado Group Commerce Asset Holdirg Comnal Electronics Daishin Serurity Company Dbs Group Holdings D-Lirk Corporation Espiii Holdings Eva Airways Evergreen Marine Class 'C' Fisher & Paykcl Healthcare Formosa Plastic Giorddrio Iriternationa! Hana Bank Hanc Lung Property Hans Seng Bdnk Hencerson Land Develo:irnent Hon i a i Precision Industry Hong Kong Exchanges & Clcarirg Hmhison Wharnpoa Hysdn Development Hyundai Dept Store Hyundai Mobis Hyundai Motor I-Cable Communications Indmat Industrial Bank of Korea Kasikorbank Kcppel Corporation Kookmin Bank Land & Houses Lg Electronics Li & Fung Macquarie Bank Malajan Banking Bcrhad Mdlajsia International Slipping Mass Transit Maxis Communications Nan Ya Plastic Orica Overseas Chirie?e Bank Petrochina HK Philippine Long Distance
241,651 120.731 439,805
65,628 217,979 258,547 208,948 229,289 479.7 16
1,435,230 146,094
256,489 519,005 459,720 189,098 784,149 871,521 608.037
10,067 844,9 3 7 284.91 6 21 5,146 131,904 596,067 578,507 483,963
1,687,605 324,319 148,787
1,169 524,644 262,942
76,548 381,036 239.32 0 907,397 872,688 497,847 700,165 468,395 455,648
14,301 367,629 580.140 876,583 273,318 174,568 430,323 757,291
1,249,914 1,430,346
180.465 108,894 42,000
180.664
302,538 604,125 631,479 567,430 150,130 661,975 277,096 243,300
238.962
525,891
0.46 0 23 0 85 0 13 0 42 0.50 0.40 0 44 0.512 2.76 0 28 0 46 0.49 1 .oo 0.88 0.36 1.51 1.67 1.17
0 02 1 .b2 0 55 0 41 0.25 1 1 5 1 1 1 0 g3 3 24 0 62 0.29
1 .c1 0.51 0.15 0.73 0.46 1 a2 1 E8 0 56 1.35 0 a0 0 8R 0 c3 0.71 1 . 1 1 1.68 0.53 0 34 0 83 1.53 2 40 2 75 0.35 0 38 0.08 0.35 1.01 0.58 1.16 1.21 1 09 0.29 1 2 7 0 53 0.47
Unaudited Report
Quantity Description of Securities Market % of Value Net Assets
3,880 ?S 1.000 106,000 496,300 100,000 190,700 R7.050 92,000 18,984 8,080
10,790 6,680
493.000 2,700
40,900 285,600 53 1,000
453,700 149,100 64,910 36.600
440,000 1,238,000
495.200 64,673
459.108
29,400 152,400 86.618 53,090
720 43.000
659,000 1 1,000
312,000 91,400 19,885 12,170 44.790
175,500 979,000 137,000 163,000
m , o o o
Posco 499,482 Powerclip Senwonductor 281,129 Premier Imdge Tectnnology 128,369 Pt Telekomunikasi Indonesia Class 'B' 391,982 Ptt Public Company 379,731 Public Bank Bhd 304,937 Piiblic Bank Foreign shares 150,653 Quanla Computer 194,090 Rinker Group 105,473 Rio Tinto 1,326,857 5amsurg Elcctronic 4,451,275 Samsurg Sdi 700,953 Semiconductor ManufactLring 107,765 Sriiriseyde 646,085 Siar r Cement Public Company 244,701 Singapore Press Holdings 692,337 Singdpore Telecommtiriitation 693,001 5inopcc Corporation 102,756 Sinopec Zhenhai Refining 437,704 SK Telecom 161,360 Sky City Eritertairimerit Group 196,642 Sun Hung Kai Property 791,066 Synnex Technology Internetional 713,294 Taishin Financial Holding5 1,013,555 raiwan Cellular Corporation 468.471 Taiwan Semiconducter 92,587 Taiwan Semiconductors Mdnufdctiiririg 657,269 Teleconn Corporation of New Zealand 109,241 Telekom MdaySid Class '6 ' 442,425 TClFVisiOn Broadcast 371.357 Telstra Corporatiop 184,696 The Warphouse Group 1,935 Tong Yang Industry 69,072 United Micro Electronics 494,229 Ventur? Corporation 1 1 5,423 Wharf Holdings 886,999 Wing Hang Bank 540.783 WMC Resources 67,733 Vvoodside Petroleum 140,370 Woo1worths 354,434 Woori F,narcc Holdings 1,126,209 Yuanta Core Pacific Securities 61 0,192 Zhejiarg Express Class 'H' 97,920 Zyxel Communications 324,572
0 96 0 54 0 25 0 75 0 73 0 59 0 29 0 37 0 20 2 55 8 55 1 3 5 0 21 1 2 4 0 47 1 3 3 1 3 3 0 20 0 84 0 31 0 38 1 52 1 3 7 1 9 5 0 90 0 18
1 2 6 0 21 0 85 0 71 0 35
0 13 0 95 0 22 1 7 0 1 04 0 13 0 27 0 68 2 16 1 1 7 0 19 0 62
Investment Portfolio at Market Value 51 .I 87,425 98.34
Cash at bank Other assets Liabilities
228,649 0.44 757.543 1.46
(1 25,774) (0.24)
Total Net Assets 52,047,843 100.00
23

Aviva Funds - Asia-Pacific Equity Fund (cont i n ued)
Unaudited Report
Economic Division of Investments as at 30 June 2004
% of Net Assets
Geographic Division of Investments as at 30 June 2004
% of Net Assets
Au IoKoblles Chernicalj Computer 5ystems Conglomerates Cnristruttiorl & Bdilding Malerials Consumer Goods Electrical R Other Cngineering E lectro 11 i cs t inamal Institutions Food Health & Personal Cdre Industrial Insurance Leirure & HoLels Mdnuiachring Media Metals & Minerals hliscellanenus Oil & Ga5 Property Retail Services relecommunications Transportation Utilities
2.92 1.24 1.48 4.98 1.02 0.37 8.93 7.48
29.02 0.68 0.51 1.33 0.49 0.38 0.54 2 33 4 92 0 58 4.00 5 62 3.76 0.47
10.92 2.75 1.62
Investment Portfolio at Market Value
Cash at bank Other assets Liabilities
98.34
0.44 1.46
(0.24)
Australia China Indonesia Malaysia New Zealand Philippines Singapore South Korea Taiwan Thailand
6.81 21.91
1.95 6.15 1.10 0.47 9.63
23.87 17 68 5.77
Investment Portfolio at Market Value
Cash at bank Other assets Liabilities
98.34
0.44 1.46
(0.24)
Total Net Assets 100.00
Total Net Assets 100.00
24

Aviva Funds - European Equity Fund
Schedule of Investments as at 30 June 2004 (expressed in EUR)
Quantity Description of Securities Market % of Value Net Assets
Equities Traded on an Official Stock Exchange
118,254 25,000 63,723 2 1,241 2 1,902
102.462 60,000 27,380 27,735
143,532 79,166
127,447 1,258.301
1 10,000 590,993 335,975 37,286
104,074 105,724 76,981
1 14,462 35,000 57,000
162,441 1 17,330 175,000 48,733
309,669 45,739
114,020 148,632 233,483 115.000 267,062 139,257 229,526
53,103 35,000 35,234 33,390 43.3 18 /5,000 66,644
136,246 105,662 345,256 49,365 42.961 12,000 40,000 12,744 36.1 10 9.000
19.882 311,915
92,050 1 1,000 24,173 94,129 13,000
285,335 57,410
3,186 157,822 207,800
51,000
ABN-Arnro I loldinys Acc ona Aeyuri Air Liquidc Allianz Holding Altadis Anglo Irish Bdnk Assic Generali Atos Origin Autagrill Spa Aventis Axa B d n x Inlesd Ban:a Populare di Vcrona B a n x Bilbao Vi7caja Argentaria Banco Santander Centro Hispdrio Basf Bdyer Motoren Werk BNP Paribds Cap Gemini Carrefour Coca-Cola Hellenic Bottling Continental Credit Ayricole CRH Depfa Bank Deutscne Bdrlk Deutsche Tclekorn D m Nv Cva E.On Enagas Endesd Enel En, Equant Forts Frarce Telecom Gas Natural Gestevision Telecinco Groupc Danone Heidelberger Druckmaschinen Heineken H y p ~ Real Estate Holdings lberdrold lnditex ING Groep KBC Bankverzekerinq Lafarge Loreal Lottomatica Lvmh Moet Hennessy Micheliri Class 'B' Munchencr Ruckvers Neooost Nuk a Numico Perrod-Ricard Peugcot Philix Electric Pinault Printemps Redoute PortJgal Telerom Publicis Groupe Puma Rds Reed Elsevier Rcndult
2,139,806 1,290,625
640,735 2,917,452 1.968.990 7,614,318
77 1,900 609,890
1,460,2141 1,698,701 4,953.812 2,332.91 7 4,045.438 1,548,250 6,362,977 2,907.864 1,665.006 3,778,407 5,420.998
4,607,668
2,249,505 3,273,998 2,038,022 2,080,750 3,180.31 6 4,507,232 1,850,600 6,784,190 1,350,322 3,134,561 1.15S.875 4,391,835
867.57 1 4,184,259 1,143.042
699,475 433,378
7,403,245 1,173,918 2.028.3 7 5 1,598,123 2,363.868 2,045,616 6,758,386 2,318,180 3,169,448
791,100 814,800 759,861
1,635,602 814,320 963,581
3,735,182 2,433,802 1,159,400 1,097,938 7,097.194 1,087,125 2,512,375
665.6 19 2,358,650 2.430.22 1 3,220,650
2 ~ 9 8 . ~ 7 9
6i8.300
1,397,359
0.91 0 55 0.27 1 2 5 0 84 1.12 0.33 0.?6 0 62 0 73 2.12 1 .oo 1.73 0.66 2.81 1.24 0.71 1 6 2 2.32 I l l 1 9 7 0 29 0 96 1 4 0 0.87 0 89 1 3 6 1.93 0.79 2.90 0.58 1.60 0.49 1.88 0.37 1.79 0 49 0 30 0 19 1 0 3 0 50 0.87
1.01 0.87 2.59 0.39 1.36 0.34 0.35 0.32 0 70 0 35 0.41 1 .so 1.04 0 50 0 47 0.30 0 36 1 3 7 0 GO 0.28 1.01 1 04 1.38
0 . 6 ~
Unaudited Report
Quantity Description of Securities Market % of Value Net Assets
179,059 184.43 1
16,895 184,240 58.142 45,657 35,737 52,046 60.960 35,000 46,940 22.186 65.61 0 85.000
152,965 706,7021
1,504,710 411,518
73,984 150,000 64,981 65,587
375,000 33,786
180.42 1 123,770
Repsol Royal Dutch Petroleum RWE Neu Class 'A' Sampu Sanofi Synthelabo SAP Schering Schneider Electric Siemens Societe Gknerale Sogecdble Solvay St Gobain Ste National? Etude Constructions Moteurs Suez
Tciccom ltalia di Risp Te:efonica Teiekom Austria T-Online International Totdl LJCB Unicredito ltdlian U n ilcvcr Vivendi Universal Wolters Kluwer
T1.M.
3,220,329 1 3 8
651,302 0 28 1,487,738 0 64 3,053,909 1.31 6,264,140 2 68 1.727.884 0 74 1,905,468 1 2 4 3,621,024 1 5 5 2,464,875 1 0 5 1,541,275 0 66 1,480,916 0.63 2,709,365 1.16
1,361.700 0.58 1.12 2,608,818
3,303,865 1.41 2,749,858 1.18 5,043.1 53 2.16
0.40 1,400,250 0.60
IO, 198,768 4.36 2,491,321 1.07 1,535,624 0 66 1,908,064 0 82 4.1 34,347 177 1,833,653 0 78
7,821.71 9 3.34
925,910
Investment Portfolio at Market Value 233,427,018 99.80
Cash at bank 874.443 0.37 Other assets 123,324 0.05 Liabilities (525,379) (0.22)
Total Net Assets 233,899,406 100.00
25

Aviva Funds - European Equity Fund (continued)
Economic Division of Investments as at 30 June 2004
Geographic Division of Investments as at 30 June 2004
% of Net Assets
Au?orriobile> Bus,ncss Scrvices & Computer Software Chemicals Cornputer Systerris Coriglorrierdtes Coristructior: & Bddir ig Matprials Conkmer Goods Electr CJ! & Other Engineering Electronics Financial Institutions Food Hedlth & Personal Care Industrial Insuranrp Md:iufacturing Media Miscellar.eous Oil & Gas Pharrri,lc.eutical~ Retail Telet OrrirriilniCdtions Utili ties
5.13 3.69 3.37 1.73 0.32 3.39 3.41 2.29 0.90
19.45 4 85 0 34 0.58 6 62 1.55 4.85 2 12
10 95 3 12 2.06
10 80 8.28
Investment Portfolio at Market Value
Cash at bank Other assets Liabilities
Unaudited Report
99.80
0.37 0.05
(0.22)
Total Net Assets 100.00
% of Net Assets
Austria Belgium Finland France Germany Greece Ireland Italy Netherlands Portugal Spain
0.40 4.47 2.24
32.43 17.07 0.29 2.09
10.36 14.01
1.07 14.47
Investment Portfolio at Market Value
Cash at bank Other assets Liabilities
99.80
0.37 0.05
(0.22)
Total Net Assets 100.00
26
. . ..

Aviva Funds - French Equity Fund Unaudited Report
Schedule of investments as at 30 June 2004 (expressed in EUR)
Economic Division of Investments as at 30 June 2004
Quantity Description of Securities Market % of Value Net Assets
Equities Traded on an Official Stock Exchange
12.728 595
5,953 48.533 15,000 35.51 1 32,091 13,786 43.069
1 17,735 5.677
48.000 18.020 14,243 48.759
5.344 85,150
7.785 50.868 44.607 20,274
9,409 137,301
16,564 12,004 4,250
12,/22 7,461
35,682 24.973 14,093 9,709 8,650 8,532 6.488
11,353 5,990
13,786 ?1,805 26,918 17.293 25.139 28,270 47,046 30,000
72,258 8,406
16,000 22,503 29,500 66,205 18,652
Accor Air Liquide A r tic 1. ide A cael Aitadss Alten Arcelu. Assarance Clcnerale de Frarice Awi:is axa BenFteaL. BNP Parihas B o . J ~ ~ ~ J P ~ Cap Gemini CarrcfoJr Casico Ciuichac Permcnor Credir Agi.cole D a i d t 9p:ems D ~ x i d EAUS Europedn Aeroriadtir Defence
tssi13. t lerwt ior ia l Franre Telecoin Groupe Ddriorie lmerys Ipso5 LdfarqP L~qdrdere L'OfPdl Ls.rri.1 Moe: Hennessy k/Iichel,ri Class 'B' Nco3ost Nexans Norbert Dentressan Peinod-Ricdrd Ppiiqeot PinaulL Pririterrip? RedoLte Puhlicis Groupf Rendu:t Sanoti Syn:.heldtio Schneioer tlcct'ic Societe Generale St Gobain St k'icroelectionics SLe Nationill€ Etude ConstrucLions Mot?urs Suez Teleiwor Francaise TF1 Thaies Triornwp lo:a \/#vendi Universal Zodl-lr
Equdrit
443,889 81,723
81 7,645 b22.921 382,800 532.758 445,584 687,990
2,605,043 2,155,139
798, I84 2,461,100
502,938 480.844
1,942,666 395,322
1,716.1 98 302,642 695.1 1 1
1,027,184 126,307 500,324
2,955,404 1,192,194
5 i 0.9 7 lj 391,319 038,566 356,293
2,352,336 1.489.0 1 5
638.347 470,547 250.01 9 355,170 653,835 51 5,653 500,914
1,376,986 1.41 3,868
9b5.382 1,776,414 1 , I 67,410
83J.184
480,600 1,232,360
71 9,943 482,240 362.636
4,530,025 1,517,088
524,213
335,551
0 8/ c 16 1.60 122 0.75 1 .CJ 0.87 1 3 5 5.79 4 23 0 58 4.83 0.99 0.94 3.81 0.78 3.37 0 59 1 .?6 2 01 0.25 0.98 5.80 7 ?4 112 0 77 1 9.1 0 76 4 51 2.92 1 2 5 0 92 0 51 0 72 134 i . O i 0.98 0.66 2 /o 2.77 1 89 3 47 2.29 1.64
0 93 7 4) 0 33 0.95 0.71 Y.08 7 98 1 0 3
Investment Portfolio at Market Value 50,340,889 98.73
Cash at hank Other assets Liabilities
890.758 1.75 42,295 0.08
(285,492) (0.56)
Total Net Assets 50,988,450 100.00
% of Net Assets
Aerospace 3 99 Aulorriotiilr\ 4 96: BLSII'CSS Scrvices & Corriputer Software 1.51 C he-icr;ls 1 7 6 Cornpiiter Spterns 1.98 ConglomerdLej 2.92
2 80 Coriwner Goods
Flectronics 1 64 F r id ' i ( ir!l Iri5titutinns 13 04 Focd 6 93 Hcal:h t: Persondl Cdre 5.59 lrdustrial 0.94 Icsurance 5.58 Leisu,e & Hotels 1.45 bled a 5.60 Iv1e:d.s X ILlirierals 0 87 Ivliscellaneouj 5 29 0 I & Gas 9.08 Phdrrridcebt cals 2.77 Retail 0.98 TrIPc.ornrniipi~ations 7.27 Irans?ortaLion 0.72 U:ili:ies 2.42
Investment Portfolio at Market Value 98.73
ConstiJction & Buildira MaLeridlj 5.25
tlcc:rical & ot'ler Enyirneeririy 3.39
Cash at bank 1.75 Other assets 0.08 Liabilities (0.56)
Total Net Assets 100.00
27
. .. .. . . . . .

Aviva Funds - Global Equity Fund
Schedule of investments as a t 30 June 2004 (expressed in USD)
Quantity Description of Securities Market Yo of Value Net Assets
Equities Traded on an Official Stock Exchange
6,400 2.867
13.000 3,374 3,591
10,89/ 1 .?,o0o 20,000 10,000 3,500
13,000 1 1,000 6,700 2,100
15.90C 68.83 I 35,400
500,000 21.000 16.757 16.57:
1,300 70.501:
7.888 4,900
16,002 50,100 7,000 1,874 7,739
L0,000 n,ooc
42,000 37.500 3.760
38,000 40.686 12,000 6,923
2 1.000 45.01 0 20,000 16,305 3,138
23,000 15,000 10,348 14,200
1.200 2,234
14.000 40,000 41,000 40,000
3,669 6,500
50.800 187,000
50
1,157
65,000
200.000
3,300
62,500
3M C o f n ~ d . ~ y Aflac Alcoa AI-ria Group Ar-erican Express Awrican lntprnatinnal Group Arnyer' Astrazeneca A%s Copco Class A' Aventis Bayer Motorern LVerk Bwale ' Brdsran Class ' A C x o n Carnival Cisco Systems Ci:iqroup cnooc Coach Corporatioq Cub-Cold Comcast Corporation Class ' A Conoro Phillips Credi! SLisse tiroup Vel Veutsche Bank Veutscie Telekom Viageo V w C hem ica I Ecay Erdesa F r i E5tee LdJdCr Class 'A' Exxon Mohil Corporatiur: Frmt Locker France Teiecom General Electric Glaxosmithkline Harley Davidson Hewlett PacKard Honda Motor HSEC Holdings Hypo Real Estatp tioldirngs Ib?rdroL! IBM Intel Corporation lnterhrew Johnson &Johnson Kao Corporatiori Keyence Corporatior Kimberly-Lark hlarriott International Class ' A IMarui Corporatioi rLmtsL;shita tlectric Industries M b w Corporation Medxonlc klerck & Co h.1 icrosoft Mimbishi Electric Corporation Mitsuoishi Tokyo Fiqanrial Frrst Sectior Mu nchcncr Rdckvers Nestle N o w Noinura Holdings Nomura Topix Banks Exchacgf [Open pntjed Fund]
574,656 116,214 428,155 169,459 184,129 777,555 648,900 903,264 377,771 266,257 573,776 456,555 171,928 1 10,940 774,119
1,633,704 1,639,905
21 0,737 937,965 846,983 462.248 552,683 735.81 1 281,247
283,151 677,759 286,545 172,118 150,488 399,849 384,840
1,871,940 893,250
98,393 1,228,540
830,675 735,540 146,075
1,014,856 676,375 583,058 .343,916 277.1 64 634,225 474,859 576,849
274,414 147,154 699,370 540,228 583,492
1.03 1,000 179,432 307,775
1,446,530 920,886
463,971 127,268 885,890 946,283 927,368
5 18,178
388,755
343,i 18
1.01 0.20 0.75 0.30 0.32 1.37 1 1 4 1 5 9 0.67 0.47 1.01 0.80 0.30 0.20 1.36 2.88
0 37 1.65 1.49 0.81 0.97 1.30 0 50 0.68 3.50 1 1 9 0.50 0.30 0.27 0.70 0.68 3 30 1.57 0.17 2.16 1.46 1.30 0.26 1 7 9 1 1 9 1 0 3 0.61 0.49 1 1 2 0 84 102 0.60 0.48 0.26 1.23 0.95 1.03 1.82 0.32 0.54 2.55 1.62
0 82 0.22 1.56 1.67 1 6 3
0 91
2 89
Unaudited Report
Market % of Value Net Assets
Quantity Description of Securities
20,000 54
4,000 85,000 11,125 33,000 16,000 4,835
23.21 8 28,355 16,261 4,500 6,990
71,221 6,500
89,000 29,000
7,300 25,000
120,000 36.61 7
9,875 5,205
11,776 9,000 5,909
3 10.000 17,000 30,000
6,914
Novartis N T Docomo Oninicom roup Oracle Corporation Pepsico Petrol Brasileiros Adr Pfizer Philips Elpctric P'octer & Gamble Rio Tinto Royal Bank of Scotland Sano'i Synthelabo SAP Shell Transport & Twling Smt Corpordtion Smith & N c p k w Ste Narionaie Etude Constructions Moteurs SUFZ Telefonica Telenor GrOJp resco Texas Instruments Totdl UBS United Technologies Verizon Communications Vodafone Group Wa I - M a ft Stores Walt Disney Wells Faryo & Co
887,664 G6.745
304,420 1,000,875
597,524 805,365 549,440 130,962
1,273,739 678.3 13 474.723 287,350
1,165,906 525.61 1 704,685 966,185
564,798 151,359 372,465 836,608 176.867 2 37,543 993,148 837,141 814,904 212,900 683,041 883,660 765,000 396,449
1.56 0.17 0.54 1 7 6 1 c5 1 4 2 0 91 0.23 2.24 1.19 0.84 0.51 2.05 0.93 1 2 4 1 7 0
0.99 0.27 0.66 1.47 0.31 0 42 1 7 5 1 4 7 1 .L4 0.38 1.20 1.56 1.35 0 io
Investment Portfolio at Market Value 55,681,928 38.09
Cash at bank Other assets Liabilities
1.1 99.91 5 2.1 1 181,606 0.32
(298,567) (0.52)
Total Net Assets 56,764,882 100.00
28

Aviva Funds - Global Equity Fund (continued) Unaudited Report
Economic Division of Investments as at 30 June 2004
% of Net Assets
Geographic Division of Investments as at 30 June 2004
% of Net Assets
Aermpace Automobiles Business Services & Computer Software Chemicals Computer Systems Conglomerates Consumer Goods Electrical & Other Engineerirg Electronics Financial Institutions Food Health & Permnal Care Industrial Insurdri(.e Leisure & Hotels Manufacturing Medid Metals & Minerals Miscel;aneous Oil & Gas Faller & Packaging Pharmaceuticals Retail Telecommunications Utilities
1.44 2.80 6.86 1.53 1 2 5 I: 3c 6 53 3.53 2.25
14.69 1.87 1.96 0.99 1 /9 3 89 3 17 2.70 t .94 1.38 9.45 0.80 6.63 4 08 9.1 1 115
Investment Portfolio at Market Value
Cash at bank Other assets Liabilities
98.09
2.1 1 0.32
(0.52)
Brdzil Canada Cnina Firi land France Ge:nidriy Italy Japan Netherlands Norway Sliain Swede,) Switzeriand Uriited Kirigdorr USA
1 42 0 3c 0 37 1 6 7 4 16 5 40 0 70
1 1 45 0 23 1 4 7 1 54 0.67 5 89
13 81 48 92
Investment Portfolio at Market Value
Cash at bank Other assets Liabilities
98.09
2.11 0.32
(0.52)
Total Net Assets 100.00
Total Net Assets 100.00
29

Aviva Funds - Japanese Equity Fund
Schedule of Investments as a t 30 June 2004 (expressed in JPY)
Quantity Description of Securities Market % of Value Net Assets
Equities Traded on an Official Stock Exchange
8,490 16,200 20,000 26,000 74,000 89,000
155.000 25,000 33.000
7.70Q 72,000
1 20,000 32,100
203,000 2,220
24,000 69,000 90,000 43,000
143 1 18.000
15,600 79,100 61,300 80,OOC 10.000 27,000 30,000
100,000 95,000
130,000 155
1 1,400 9,200
65,000 306
14.400 12,000 25,000
242 44,400
170,000 2,000
18.000 32.200 95.000
6,000 1 14,000 38,600 20,000
1 15,000 91.000 19,400 35,000 42,000
9,500 57,000 23,000
130,000 8,300
197,000 &0,000 1 1,600 14,900 79,000
n.000
Acom Aeor Ma l l Aica Koqyo Aisin Seiki Ajinomoto Akebcno Brake Industry Armada AiTJno Corporation Acyava Trading Ar 5 i i W i J Mdriufdcluriny Corn0dn)J Asak,i Giass Asahi K a w Bmdai Company Bank ot Yokohama Bell System Rridypstorie Brother hdustries CdlS(Jnic Kansei Cdnon Centra Japon Railway Chiba Bank Cniyoda lntegred Chutiii Electric Power Chugai Pharrna C i x e n Watrb c o w DJI Nippon Printing Daiken Cor[iorc~tiur' Deini,iru DE,LVA House Indusvics Dr:i\*~ld Securities Grouo
Diamond LCJW Disco Corporation Dowa h4ining Fast lapari Rdilwdys Enplas Coraoratio? Fanuc Fast Reidiliny FUJ' Photo Film FJJI Televisior Network Fuisatvd Pharrrid Fi,lits,i Fii'idi Electric Global Mcdia Onlire HamJmJtSJ Photorics Hino Maim Hirnse Clectr c I litachi HlTJcnl Capital Hiiachi Hiyh Technologics H;tjchi bIetJ6 Hitachi Transport 8ys:em Hokuto Corporation Honda Motor Hosiden Hoya Corpwd1,on lries Corporation ltochu Techno-Science Itoham Foods Jaico Cornporatiori h [ J i l r i Airlines 1,lpan Aviation Electric J F i Holdiqgs JSP Corpordtson Kdn)iyumm
D w tW
60,1214,100 105,138,000 29,160,000 59.1 50.000 97 236.000 50,730,000
1 1 1,600,000 24,275,000 97.51 5,000 39,5/8.000 81,720,000 67,800,000 95,337,000
138,446,000 51,060,000 49,200,000 72,933,000 70,020,000
281,750,000 132,847,000 78,824,000 52,260,000
182,325,500 104,945,600 98,880,000 34,000,000 47,061,000 16,1 70,000 99,200,000
120,770,000 101,920,000 43,555,000 51,414,000 42 41 2.000 42,055.000
187 272,000 28,400,000 93,744,000
105 960,000 85 500,000 60 500,000
114,774,000 130,730,000 32,880,000 50,310,000 67,298,000 75,050,000 71,940,000 85,614,000 78,358.000 29,640.000 68,425,000 18,988,000 37,170,400
184,100,000 56,196,000
108,490,000 70,680,000
106,950,000 72,410,000 69,139,000 68,753,000
108,480,000 31,030.000 11,530,500 62,647,000
0 38 0 66 0 18 0 37 0 61 0 32 0 70 0 15 0 61 0 75 0 51 0 42 0 60 0 87 0 32 0 31 0 46 0 44 1 7 6 0 83 0 49 0 33 I 1 4 0 66 0 67 0 21 0 29 0 10 0 62 0 75 0 64 0 27 0 32 0 27 0 26 1 1 7 0 18 0 59 0 66 0 54 0 38 3 72 3 82 3 21 3 31 0 42 0 47 0 45 3 54 3 49 3 19 0 43 0 49 0 13 115 0 35 0 68 0 44 0 67 0 45 0 43 0 43 0 68 0 19 0 13 0 39
Quantity
/5,000 81,700 47,000
156 8 1.000
409,000 5,400
18,OOC 133,000 28,200 42,000
500 78,000 40,000
8.000 9,200
28.500 25,000
156,000 11,000
102 30,000 19,000 64,000
105,000 1 1 5,000 56,000
393
186,000 22,000 50,000
1?6,000 124,000
525 83
19,000 20,000 25,000
1.500 106,000 140,000 50,000
434,000 170,000
453 s0.000
234,600 54 000 4,500
76,000 6,000
120,000 2,010
189,000 50.000 9,100
30,000 10,000 17.000 41,000
141,000 /,500
13,000 2,300
Description of Securities
Kaneka Corporation Kanto ALto Work5 Kawasaki K i w i KA! Kddi CorporcJtion Kir i r i Brewery Kobe 5tecl Koci Co Koei Corporation Komatsu Korneri Corporat,on Koricr! Minolta Holdiqqs Kose Corpo*dt on Kubota Corporation K y w a Hakko Kogyo L c ~ ~ ~ , ~ ~ ~ ~ Maclllca Marul Corporatior Llatsui Securities Matsushsta Flectr c Indiustrips hleitec Corpo-ztiori M i l l ~ ~ i tioldinys Ibliinasu Semiconductor Misumi Corporation MitsiihiFhi Corpordtion Mitsuuiski ElectrIc Cormrat on MitsuhisJii EFtatP M:tsubish Securitics Mitsubishi Tolcyo F i r a i c al Fir5t Section Mirsui R Cornpariy Mltsal ru(jowl blitsu: Miriirig I: SM M i t w Osk Lines Mitsui Sumitomo Insurance Company Mizuho F nar.cial Group Net Orw 8ys;er:s Nyk Spark Plug Nichiroi Corpurdtion Nifco Nintendo Niapnn Oil Coruoralion Nippoi> Sanso Corporatioi Nippon Shcc: Glass Nippon Steel Corporatior N:ppon Synthetic Cnemicals Nippon Tpl R Tpl Niswn Chemical IndhSIrieS Nissan Motor Corporation Nisshir Seifun Gm:i;) Nittc: Denito Corporation Nomura Holdings Nnrn i~a Resedrch Institute NSK Corporation NTT Doenmo
Oji Paper Orix Cowparation Osg Corporation Park24 Plerius Ricoh Riken Rohm Ryohin Kcikaku Kyoshoku
ObayrJSh
Unaudited Report
Market % of Value Net Assets
-
77,475.000 99,183,800 25.897.000 97,344,000 87,399,000 66,667,000 13,932,000 46,440,000 87.91 3,000 82,344,000 63,252,000
2.1 c0.000 45,240,000 3 1,480,000 36,000,000 37.2C0.000 41,855,000 92,750,000
241,644,000 47,520,000
165,240,000 49.8C0.000 67,830,000 67,840,000 56.2s0.000
155,710.000 80.248.000
396,910,000 151,962,000 28,776,000 25,450,000 72,324,OOC
127,100,000 259,875,000
35,775,000 19,893,000 29,500,000 43,200,000 94,875,000 72,822,000 81.760.000 2 1,600,000 09,386,000 43,520,000
264,099,000 43,850,000
284,569,800 59,832,000 75.1 10,000
122,740,000 69,780,000 65,160.000
391.9s0.000 1 10,943,000 35,000,000
113,750,000 38,280,000 41,500,000 37,440,000 95,120,000 58,656,000 97.950.000 73,190,000
7,544,000
0.48 0.62 0.16 0.61 0.55 0 42 0 09 0 29 0.55 0.52 0.40 0.01 0.28 0.20 0 23 0 20 0 26 0 58 1 51 0.30 1.03 0.31 0 42 0 42 0 35 (1 97 0 50
2.48 0.95 0.18 0.16 0.45
0.80 1 6 3 0.22 0.12 0.18 0.27 0 5'3 0 46 0 51 0.14 0.62 0.27 1.65 0 ZI 1,78 0 37 0.16 0.77 0.44 0.41 2 45 0 69 0.27 0.71 0.24 0.26 0.23 0.60 0 37 0.61 0.46 0.05
30

Aviva Funds - Japanese Equity Fund (continued)
Schedule of Investments as at 30 June 2004 (expressed in JPY)
Quantity Description of Securities Market % of Value Net Assets
Equities Traded on an Official Stock Exchange (continued)
9,000 27,000 30,000 70,000 16.500 11,500
125,000 82,000 21,000 81,000
3,100 10.100
160,000 107,000 250,000
19,000 27,100
1 1 5,000 400
85,000 3,800
79,000 50,000 28,800 13,200
250,000
52,000 20,800 77,500 14,300
321,000 85,000
100,000 39,000
222,000 270,000
4,600 190,300 20,000 93.000
171 8,790
93 28,400 30,100 39,000
10,000
Saint-Marc Sdmmy Sanken Electric Sankyo Seiki Manufacturing Sawai Pharmat e h a l Secom Sekisui Chemical Senko Transport Seven-Eleven Jdpan Sharp Corporation Shimamura Shin-Etsu Chemical Shinsei Bank Shizuoka Bank Shcwa Denko Sof:bank Corporation Sur-y Corpuratiori Sumitomo Metal Mining Sumitomo Mitsui Financial GI Sumitomo Ruhher Suzuken .Talkisha Ta kashimaya Takeda Chemical Industries Tdk Corporation Teijin Tis Tokin Corporation Tokyo Broadcasting Tokyo Elfctric Power Tokyo Electronics Tukyu Gas Tonen Gcn Sekiyu Toshiba Tos:em lnax Holding Toy0 Tire I: Rubber Toyobo Toyoda Gosei Toyota Motor Trend Micro Tsumurd & Co UFJ Holding First Section USS Corporation Ydhoo Japari Yamada Denki Yamaha Yokogawa Electric
40,140,000 140,670,000 42,720,000 80.0 10,000 75,900,000 81,025,000
115,125,000 34,194,000 74,760,000
141,183,000 29,326,000 39,390,000
1 1 1,360,000 103,148,000 68,250,000 91,200,000
111,381,000 81,880,000
-oup 299,200,000 83.2 15,000 12,882,000
126,637,000 63,100,000
137,952,000 109,296,000 102,000,000 46,700,000 28,184,000 39,936,000
191 .81 2,500 87,516,000
124,227,000 79,475,000 43,900,000 91,845,000 74.1 48,000 73,980,000 1 1,845,000
841,126,000 96,800,000
143,406,000 82,422,000 82,538,100 98,580,000
1 15,588,000 53379,000 56,745,000
0 25 0 88 0.27 0 50 0.48 0.51 0.7) 0 21 0.47 0.88 0.18 0.25 0.70 0.65 0.43 0.57 0.70 0.51 1.87 0.52 0.08 0.79 0.39 0.86 0.68 0.64 0.29 0.18 0.25 1.20 0.55 0.78 0.50 0.27 0.57 0.46 0.46 0.07 5.26 0.61 0.90 0.52 0.52 0.62 0.72 0.34 0.36
Investment Portfol io at Market Value 15,736,872,300 98.49
Cash at bank 235.31 1,181 1.47 Other assets 50,377,525 0.32 Liabilities (44,955,830) (0.28)
Total Net Assets 15,977,605,176 100.00
Unaudited Report
Economic Division of Investments as at 30 June 2004
% of Net Assets
Aerospace Automobiles Business 5ervices & Computer Software C herriicdls Computcr Systems Construction & Building Materials Consumer Goods Electricdl & Other Engineering E I ect ion i cs Financial Institutions Food Health g Personal Care Insuidnce Lcisurc & Hotels Manufacturing Media Metals & Minerals Miscellaneous Oil & Ga5 Paper & Packaging Phdrmacel;ticals Property Retail Services Telecommunications Trdnsportation Utilities
0 68 12.54
5.2 1 3.23 3.14 2.69 3.43 8.24 5.70
14.03 1.43 0.69 1.83 0.88 2 05 0.90 2.59 0.09 0.96 0.32 3.90 181 9.03 1 5 5 4.71 3.74 3.12
Investment Portfol io at Market Value
Cash at bank Other assets Liabilities
98.49
1.47 0.32
(0.28)
Total Net Assets 100.00
31

Aviva Funds - Nordic Equity Fund
Schedule of Investments as at 30 June 2004 (expressed in NOK)
Quantity Description of Securities Market % of Value Net Assets
Equities Traded on an Official Stock Exchange
23 16,312 5,586 5 . v 7 .?, 199 1,450
19.964 39,667
3/6,095 ?1.308 15,671 13,672
22.116 1,139
68,824 71,718 9?,7?9 4,822 4,039
1 o . m
6,242 3.756: 4,406
15,8?7 7.3 17 7,285
20.61 1 60,807 22,530 2,589
16,879 15,571 22,787
5.1 79 13,078 18.726 4,532 3,6 1 G
42,912 41.430
7,141 13,697 10,908
AP Moller-hlaersk Class 'B' Assd Ab,oy New Class '0 ' Atlas Copco Class 'A' Auto!iv Sdr Carisberg Class 'B' Darii>c.o Dacske Bank DNB Norway Er csson Class 'B' Finiair Foreriinqssparhar ken C lass ' A Fo r t u IF
Hcnrcs 8 Mauritz Class 'B' Inv-stor Class 'A' Korw Corpo:dtiori Nera N o w Nodea Bank No:sk Iiydro No:ske Skoginduslrier Nodo Nordisk Class 'B' Nodozymes Class 'B' Orkla Sampo SanrJvik Securitas Class 'B' Skand tnskilda Hanken Class ' A Skandia lnsiirance Fnrsakrinq Skdnskd Ab Cldss 'E' SKF Class 'H' Statoil S w a E r i w Class 'R' Sxrebrand Class ' A Svcnska Cellulosa Ciass 'B' Svcnska Handclbankcn Class 'A' Swedish Match TDC T P I P ~ Class 'E' Telenor Group lcliasonera Tietoenator U p w Kymmene Volvo Class 'H'
1,1.?6,713 1,463,253 1,466,502 1,632,230 1,174,543
515.075 3,282,033 1,890,133 7,832,951 1,040,364 2,080,587 i ,224,400 1,9 14,248 1,557,499
375.1 82 1,166,567 7,205,277 4,707,614 ?,166.284
499,321 2,242,141 1,182,653
761,137 1,079,758 1,735,101
626,581 2,079,705 1,794,344 1,386,372
660.565 1,491,682 1,480,633 1,081,243 1,385,960 1,826,914 1,282,785 1,025.81 2 1,087,775 2,079,086 1,211,071 1.497.428 1 ,E1 6,235 2,642.055
1.43 1.86 1.86 2 07 1.49 0.65 4.17 2.40 9.95 1.32 2.64 1.55 2.43 1 9 8 0.60 1.48 5.15 5.98 2.75 G 63 2 85 150 0 97 1.37 2 20 0 80 2 64 2.28 1 7 6 0.84 1.89 1 8 8 1 3 7 1 7 6 2 32 1.63 1.30 1 3 8 2 ti4 1.54 1.90 2.31 3.36
Investment Portfolio at Market Value 77.a77.812 98.91
Cash at bank Other assets Liabilities
1,722,489 2.19 843,589 1.07
(1,704,253) (2.17)
Total Net Assets 78,739,637 100.00
Economic Division of Investments as at 30 June 2004
Unaudited Report
% of Net Assets
Autorriobi!ps Compum Systems Consumer Goods Electricdl & O t w r Engineering Financial Institutiorb Food Health & Persoial Care Insurance Manufacturing Oil & Gas Paper & Packaging Pharmaceuticals Retail Services Telecommunications Trarisporiation UtIIItIPS
5 43 1.90 3 12 6 42
23.51 1.62 1.50 3.65 2.71 4.63 6.58 2.85 2.43 0.80
27.43 2.75 1.55
Investment Portfolio at Market Value
Cash at bank Other assets Liabilities
98.91
2.19 1.07
(2.17)
Total Net Assets 100.00
Geographic Division of Investments as at 30 June 2004
% of Net Assets
Denmark Finland
Sweden Norwdy
13 40 70 09 14 13 51.29
Investment Portfolio at Market Value
Cash at bank Other assets Liabilities
98.91
2.19 1.07
(2.17)
Total Net Assets 100.00
32

Aviva Funds - UK Equity Fund Unaudited Report
Schedule of Investments as at 30 June 2004 (expressed in GBP)
Economic Division of Investments as at 30 June 2004
Quantity Description of Securities Market % of Yo of Value Net Assets Net Assets
Equities Traded on an Official Stock Exchange
145,000 140.000 756,094 165,000
1,250,000 7G.000
800,000 328,574 1 17,000 375,000 150,000 75,000 50,500
500,000 55,783
375,000 416,472 220,000 260,000 104,900 102,000 1 17,000
1,200.000 65,000
2,250,000 800.000
14.000 500,000 290,000 850,000
55,000 80.000
1,200,000 120,000 200,000
Abbey National Acarnhis AlliaricP Pharma Amvescdp ARC Internationdl Atkiris Blavod Exlrerrre Bockham Technology Bonts Group BP Brit sh Airways Brit sh American Tobacco Brilsh Sky Broadcast Cable &Wireless Capital Radio Caahone Warehouse Certaur Holdings Cer ter Parcs Dixons Group Easvnet Group Glaxosrnithkline HBOS HHG Horiewrve IGE Ltd Legal & General Man Group Mrro2 Newport Networks Protherics Royal Bank of Scotland Trinity Mirror Vodafone Group WPP Group Yell Group
753,456 487,550 124,756 G21,431 265,625 L59.990 276.000
807,008 1,837,969
642,000 3 16,509 646,875 244,120 557.81 3 343,589 208,450 430.300 222,186
1,149.54G 809,640 558,000 434,850 196,875 764,000 202,370 465,625 358.1 50 45/,937 886,324 51 8,800
1,459,500 676,500 685,000
I 67,573
42 1,125
3 52 2 28 0 58 2 90 1 2 4 2 15 1 2 9 0 78 3 77 8 58 : 97 3 00 1 4 8 3 02 1 1 4 2 GO 1 GO 0 97 2 01 1 04 5 37 3 78 2 60 2 03 0 92 3 57 0 54 2 17 167 2 14 4 14 2 42 6 81 3 16 3 20
Investment Portfolio at Market Value 19,457,436 90.81
Cash at bank 1.902.51 5 8.88 Other assets 102,904 0.48 Liabilities (36,787) (0.17)
Total Net Assets 21,426,068 100.00
Business Secvices & Computer Software 1.04 Consilmer tioods 4.29 tlcctionics 2.94 F i r a n m Institutiors 15 85 Iiealtk & Personal Care 2 14 Insurance 6.17 l.ewre & Hotels 0.97 Media 13.00 Oil & Gds 8.57 Pharmaceuricals 7.64 Retail 8.38 Services 4 18 Iclccommnications 13.66 Transportanon 1.97
Investment Portfolio at Market Value 90.81
Cash at bank Other assets Liabilities
8.88 0.48
(0.17)
Total Net Assets 100.00
33

Aviva Funds - Emerging Countries Equity UnauditedReport
Fund
Schedule of Investments as at 30 June 2004 (expressed in USD)
Quantity Description of Securities Market % of Quantity Description of Securities Market % of Value Net Assets Value Net Assets
Equities Traded on an Official Stock Exchange
33,210 2,770,300 3,463,623
1,591352,875 1,186,178,847
158.950 542,300
1.730.000 841,483,616
1.489.1 31 20 1,640
5,180,500 2,?06,000 3,160,800
202,364 134.560
1,499,886 2,207,590
49,429,316 69,200 54,300
2 14,400 244,300 189,500
208,589 741,200 148,790
12,380 8.777.000 4.1 29,100
16,078,000 6,062.61 5
?0,338,258 9.722.' 3 i
363,637 704,435
3,819,800 973,600,000
26,253,000 2,597,300
100.000 5,088,600
304.568
5,123,000 12,444,000
62,513 3,044.000
1,026,480.000 15i,500 381.617
70,000 3,621,900 3,726,180 5,463,116 2,387,000 3337,494
49,500 2,590,000 1,270,000
237,700 82,250
889.800
A F.P. Provida Spon Adr Advanced Info Serve African Rank Investmwts A kbari k Aksigorra Ambev C.a de Rebidas Ad. Amerira Movil Adr Class 'L' Ammb Holdirgs Anadolu Cam Sanayii Anglo Ampricari Anqloyolrj Ashanti Astrd Inlernational Ast:o All Asia Networks 4U Optronics Banco ltau Holding Adr Banco 5an:aide. Adr Bariykok Bank Bank Hapoa 1'71
Balk Mand,ri Bank Prze~r,yilowo-Handllowy Blakewy Iinvestors Sicav [Open-Ended Fund] Bra511 Distribution Pao Acu Adr Br&il Telecom Aor Britisl American Tobacco Cemex Adr Cencosud Adr Ce7 C7K Check Point Softmare Che,l Communications China Lfe Insufarce Chira Mobik Honq Kony China Oilfelt-l Services Chirid Steel Corpo:at:on Cliina Telecom Corporatiov IIK Cbina Trust Fina.icial Cid Smderurgica Nacional Cia Vale Kio Doce Acr Cimh Berbao Cimsa C,merito Sandyi Ve Ticaret Cnooc Conirrierte Asset Holdmg Cornpal Electronics Controladora Corrirriercial rJexl( ( I
Corporacion Geo Class 'E' Cosmos Bank Taiivari Daishiri Secufity Company D-Link Corporation [logan Yayin tio't-lirny Emhrder Aircvaft Adr Enipresa Nacional Electric Chile Adr Empresas Copec Eon Capiid! Evergreen McJrine Class 'C' F i rst rd r i d Formosa Chemical 8 Fibre Formosa Plastic Gedeon R:rhter Veg Grupo Finance Baiorte C l a s '0' Gruoo Imsa Grupo Ttlevisd \a Adr Har.a Bank
840.21 3 6.c)04.010 6,453,586 5,694,081 2,358,533 3,151,979
19,286,900 1.507.256
30,685,891 6,483.1 62 3,344,597 2,665,208 4,749,682 9,297,614 3,433,178 3,598.629 5,897,202 6.1 12,283 7,792,667
523,452 3,413,968 7,222.730 2,512,680 8,648,208 3,410,430 5,181,797 4,015,098 1,671,383 5.2 18,369
12,466,688 4.612.1 12 5.7 17,432
10,647,547 10,766,260
9,571,647 5,655,566
1.855.742 1 1,064,951 3,329,385
1,900.6ao
4 , 4 1 3 3 2
iox.223
5,611.371 6,535,558
707,364 3,551,178 3.11 1.493 4,296,600
4,600,393 509,201
4,404,447 3,127,868 8,898,023 3,728.262 4,689,086 5 021,832 8836,175 2.91 1,900
10,576,462 1.729.709
4,918,955
Hanwtidnk 7,474,855
0 08 0 61 0 65 1 0 58 0 29 0 32 1 9 5 0 15 0 19 3 10 0 65 0 31 0 27 0 48 0 94 0 35 0 36 0 60 0 62 0 79
0 05 0 35 0 73 0 25 0 87 0 34 0 52 0 41 0 17 0 53 1 2 6 0 47
1 08 1 09 0 45 0 97 0 57
0 19 1 12 0 34 0 01
0 57 0 66 0 50 0 07 0 36 0 31 0 43
0 46 0 05 0 44 0 32 0 90 0 38 0 47 0 51 3 89 3 29 1 0 7 3 17 0 76
o 58
3,925,875 2,456,442
,340,000,000 1 15,440 168,100 344,161 169,900 153,114 389.81 2
5,003,000 824,100
7,878,900 517,567
7 1,700 273.700
13,475,800 62,820
137,600 2.61 7,400 1,887,800 1,840,200 3,727,800 3.02 1,080 5,773,548
154,100 716,000
18,799.000 105,000
1.1 37,500 5.965
498,220 93,846
3,508,000 605,000 550,000
8,908,320
776,900 1,909,400
674,000 1,302,000
191,615 89.400
6,466,820 479,434 585,063
1 1,167,000 1 1,380
1,206,300 1 ,800,000
37,037 208,900
1,815,057 467,500
3,372,400
1 1.21 1,000 3,961,440
12,516.1 6 1
1,350,700 251.862 297,500
2,448,000 130.000 259.7 16
HM Sampoerna Hon Hai Precision Industry Hurriyer Gazetccilik Hyundai Department Store HyiJndai Mobis Hyundai Motor IDB Development Impala Platinum lniperial Holdings lndosat Industrial Bank of Korea Kasikorhank Kaokrriii? Bank Knrea Electric Power Korean Air Lines Land & Houses 1.q Elertroriits Lukoil Oil Company Spon Adr Malayan Banking Berhad . . Malaysia International Shippinq 6,037,334
2.1 13.329 9,073,579 3,634,280 2,853,780 7,455,769
13,231,831 4,305,181
11.284.550 4.257.155 2,135,362 4,774,868 9,956,854
16,068,862 1 ,I 55,703 3,547,092 3,200,298 2,981.985
14.31 0,400 6 923 873
Massmart Holdings Maxis Communications Mega Firiaricidl Holdings Nan Ya Plastic Natura Cosmeticos OTP Bank Petrochina HK Petrokazakhstdn Cldss 'A Petrol Braiileiros Adr Philip Morris Czk PMppinc Long Distance Posco Power( hip Semiconductor Premier Image 'Technology Proton Holdings Bhc Pt Telekomunikasi Indonesia Class B' PTT Exploration & Production Ptt Public Company Quanta Compdter Resorts World Bhd Samsung Electronic Samsung Sdr Sanlam Sappi Saso; Semiconductor Manufacturing Shiniegae Slam Cement Silirorhvare Precision SK Telccom SK Telecom Ad: Standard Bank Suryutneftegaz Adr Synnex Technology International Corpordtion Taishin Financial Holdings Taiwan Cellular Corporation Taiwan Semiconducrors Manufacturing Tanlong Malaysia Tele Centro Oeste Adr Telefonos De Mexico Adr Telekom Malaysia Class 'B' Telkom South Africa Tenaris Sa
9.467.2 12 8,610,189 1,981,379
2.400.286 14,598,612
2,740,500 27,760,688
3,629,950 10,186,279 12,081.01 9 2,809,690
732,673 1.1 54,533
7,581,723
a, 646.32 3
7,035,875 5,065,503 7.250.593 1,421,924
79,058,950 9,361,021 9,114.379 7.179.31 5 9,OE3,525 2,440,988 2,723,129 6,863,687 1,409,710
4.396.301 12,568.01 4 14,773,000
5,467,071 9.1 78,486 3.747.61 9
17,918,397 4,461,856 1,256,684 9,783,288 6,669,060
825,670
3,075,802
6,062.02a
1,646,508
0.21 0.92 0.37 0.29 0.75 1.34 0 44 1 1 4 0.43 0 22 0.48 1.01 1.62 0.12 0 36 0 32 0 30 1.45 0.70 0.61 0.96 0.87 0 20 0 77 0 24 1.47 0.87 0.28 2.80 0.37 1 0 3 122
0.07 0.12
0.71 0 51 0 73 0.14 0.31 7.99 0.95 0 92 0.73 0 92 0.25 0.28 0.69 0 14 0.61 0 44 1 2 7 1.49
0 55 0 93 0 38
1.81 0.45 0.23 0 99 0 67 0.17 0.08
o 28
34

Aviva Funds - Emerging Countries Equity UnauditedReport
F U n d (continued)
Schedule of Investments as at 30 June 2004 (expressed in USD)
Quantity Description of Securities Market % of Quantity Description of Securities Market % of Value Net Assets Value Net Assets
Equities Traded on an Official Stock Exchange (continued)
77,100 352,372
1,282,000 66;4,351,216 375,000,000
14,241,650 251.300
1,398,089,400 1,386,660 8,004,000 7,510,000 1,381,000
Terd'is Sa Adr Teva I'harma lndustrier Tong Yaqg Industry T.ir4 Ekoiomi Bankasi Turkcell lletiwn United Micro Electror'icL ilsiminas Usinas Sideruyicas de hllinas G e m Class ' K Vestel Clectronik Woori Firianre Holdings Yudntd Core Pacific Secur ties Zhcjiany Expres Class ' 1 1 ' 7yxel Cotnwnicatiois
Warrants Traded on an Official Stock Exchange
3,000 1 3 1,000
154,000
1 15,186
121,789
131,000
151,038
222,382
2,375
74,062
239,558
979,645
202,028
1,319,500
2,553.000
3,450,000
143,600
197,000
645,300
1,1 11,610
Benpres i lold nqs Viar:r;rts CitiSank Pa,: Certificd Hero Honda 19/01/2009 Ci!ibank Part Certificat Mahindrd R Mariindra Citibank Part Certificd! Ranbaxy Labs 17/01/2007 Cit bank Part Certificat Reliance F i e y y Citibdrik Part Certiiicat Ultratcch Cemo Golmann Part Ccrtificat Oil & Gas Corpora:ion HSBC Part Certifiact State Rank ot India 6/08/2004 HSBC Part Certificat ARB India 16/01/2006 HSBC Part Certificat Bhaat Hedvy CIPctr,c 6/08/2004 HWC Pdrt Certi'icat H d k 6/08/2004 HSRC Part Cert.ficat Rel,ance lridustry JP Morgan Part Ceritticat lnfosys JP Mofgan PJr: Certificat China Steel JP Morqar Part Certitica: China Trust Firidncial Holdings IP Morgan Part Ccm'icat Compdl Electronic5 JP Morgan Part Ce*tificat Ddishii Securities JP Mo'ym Par: Certificat Maruri Udyoy hlL Part Ccrtificat lcic Bank 16/07/2004 SSB Part Certificat Hindustan Lever 17/01/2007
2,439,830 11,907,350 2,059,298 1,835,290 4,52 1,648
10.521 , I 30
2,605,885 4,202.707 8,898,401 4,988,738 5,374364 2,749,904
4 8C
1,444,930
1,482,250
2,280,510
1,461,468
904,555
2,067,710
2,067.04'
35,019
805,054
2,679.456
9,096,004
12.1 17,639
1,171.71 6
3,038,070
4.278.000
1,639.48 1
1,724,735
3,460,486
3,079,150
0 25 1 2 0 0 71 0 19 0 46 1 0 6
0 26 0 42 0 90 0 50 0 54 0 28
0 15
0 15
0 ?3
0 15
0 09
0 71
0 21
0 08
0 27
0 92
122
c 12
0 31
0 43
0 17
0 17
0 35
0 31
Unlisted Warrants
239,545 ABN Part Certifica: Asian
143,000 JP Morgan Part Certilicat
350,000 I P Morqan Part Certi'icat
1,100,000 JP Morgan Part Certi'icat
163,750 5% Part Certificat Larsen
314.71 5
Pdints 11/08/2004 1,630,068
Hyundai Motors 16/09/2004 6,004,570
I n Steel 2,789,500
Qilanta Computcr 2,332.000
& Toubro 17/01/2007 2,487,l 17 SSB Part Certificat b:a Motors 17/01/2007 2,604,896
0.16
0.61
0.28
0 24
0.25
0 26
Total Unlisted Warrants 17,848,151
Investment Portfolio at Market Value 978.176.827 Cash at bank 11,101,321 Other assets 4.1 50,085 liabilities (3.539.1 IO)
1.80
98.82 1.12 0.42
(0.36)
Total Net Assets 989,889,123 100.00
Total listed Securities 960,328,676 97.02
35


Aviva Funds - European Convergence Equity Fund
Schedule of Investments as at 30 June 2004 (expressed in EUR)
Economic Division of Investments as at 30 June 2004
Unaudited Report
Quantity Description of Securities Market % of % of Value Net Assets Net Assets
Equities Traded on an Official Stock Exchange
262,000 60,000 20,200 40,000 37.000
340.000 202,000
87,000 161,700 54,000 22,000 83,000
571.000 199,000
17,000 13,550
370,000 88,400
234,000 3,190
286,000 1 14,700 20,500
2 15,000
AB Lietuvos Te1eko.v Gdr Bank Pekao Bank Przemyslowo-Handllo.~~ Bank Zxhodni Whk Cesky Telecorri Cez C z i Cyrrus Poaular Bank Eesti Telekom Gdr Eldorado THE Land Credit & Mortgage Gcdcon Richter Germanos H d r’ sa ba n k Kgl-m Polska M i d z Lassila & Tikanola LPP Matav RT Mol Hungarian Oil OTP Bani Pnil p blorris Czk Pkn Orlen Poisica Grupa Farmaceutyczna Telesvstem International Wireless Y it-Y htyma
1,406,208 1,637,759 1,871 ,109
765.395 373,393
1,955,202 396,100
1,271.?06 1,894,224 1,835,893 1,966,270 3,943,950 1,249,447
L48.715 1,573,970 1,209,807 2,865,014 3,924,480 1,596,793 1,884,364 1,480,961
161,204 3,595375
1,780,123
3 38 3 93 4 49 1 8.1 0 90 4 69 0 95 4 21 3 05 4 55 4 41 4 77 9 47 3 00 1 08 3 78 2 91 6 88 9 42 3 83 4 52 3 56 0 39 8 63
Investment Portfolio at Market Value 41,087,557 98.66
Cash at bank 1,058,008 2.54 Other assets 542,217 1.30 Liabilities (1,043,260) (2.50)
Total Net Assets 41,644,522 100.00
Consmer Goods Firndnt-ial Iristitutioris Food Industrial Metals & Minerals Oil & Gas Pharmaceuticals Retail Telecommunications UtllltlPs
7 61 34 65
3 05 1 0 8 3 00
1 1 41 7.97 4 72
20.48 4 69
Investment Portfolio at Market Value
Cash at bank Other assets Liabilities
98.66
2.54 1.30
(2.50)
Total Net Assets 100.00
Geographic Division of Investments as at 30 June 2004
% of Net Assets
Cyprus Czech R ~ p i i h l i ~ tstonia Hungary Ldtvla Poland
5.68 9.42
23.84 28.17
3 38 28.17
Investment Portfolio at Market Value
Cash at bank Other assets Liabilities
98.66
2.54 1.30
(2.50)
Total Net Assets 100.00
37

Aviva Funds - European Property Fund Unaudited Report
Schedule of Investments as a t 30 June 2004 (expressed in EUR)
Geographic Division of Investments as a t 30 June 2004
Quantity Description of Securities Market % of % of Value Net Assets Net Assets
Equities Traded on an Official Stock Exchange
414.G00 123,500
2,644,000 253,000
51,200 24.600 49,933 46,000
1 2L'.000 237,000
73,000 153,000 100.000 22,200
189,OOG 34,500 66.000 33,500 20.751
171,000 5,500
39,600 13 1,000
19.20G 24,825 62,000
Aedes Alvl Reni Stabili Rritisk Ldrid Ca>:e'luln Ueutsche Rank Furocom:nPrt-iaI Proprties Gec na Hamrrerson
1nmobil;aria Colonial Inmobiliaria Urbis IVG Irn-obilien Klepierre L a i d SecLirities Nieuwe 5:een Irivestrrerit> Pillar Properly Roclamco turope Sl l lC
SlGUg'l Fsta;es Siz.iis Prirrie Si!e Unibai Unite Group VCismed Retail Wcreldhave Wihlborgs Fastigheter
Irnmofinmz Irnrnobilieri
1,591,830 949.098
1,635,314
1,036369 2,617,378
854,400 1,225,855 2.956.650 1,241,444 1,574,865 1,538.1 10 1,396,175
1,242,645 3,271,229
9a4.500
572.a73 570,921
1.652,SSS 1.51 7,122 1,145,078
949,417 3,362.040
403,197 81 1.488
3.91 2.33 4.02 6.43 2.55 2 10 3 01 7 27 3 05
3 78 3 43 2 42 3.05
'.41 ' .40 4.06 3 73 2 81 2.33
0.99 199
3 a7
8.04
a 26
1,670,102 411 674,389 1 6 6
investment Portfolio a t Market Value 37,445,494 92.04
Cash a t bank Other assets Liabilities
2,855,878 7.02 519,756 1.28
(136.931) (0.34)
Total Net Assets 40,684,197 100.00
Economic Division of Investments as a t 30 June 2004
% of Net Assets
Property 92 04
investment Portfolio a t Market Value 92.04
ALSlrid F r a I I c e Germany
Netherlands Spai:) Swedei Swtzeriarid United Kingdom
Ital!/
3.87 22 32 4.57 7 94
1 G 92 7 21 4 21 2 , 3 3
22 72
Investment Portfolio a t Market Value 92.04
Cash a t bank 7.02 Other assets 1.28 l iabi l i t ies (0.34)
Total Net Assets 100.00
Open Forward Foreign Exchange Transactions as a t 30 June 2004
Purchase Sale Value date Unrealised 1055
EUR
EUR 909.618 CHF 1,400,000 4/08/2004 (9,9341 tUR 8,112.794 GBP 5,500,000 4/08/2004 (64.09 1) ELJR 1,540,246 SEK 14,100,000 4/08/2004 (1,303!
Total (75,328)
Ttw riet u.redli?d 'us5 d!trsuted !G :11ose trarls3ct'o:i: IS ,rcl,ideo I-, :hr 'h:) 117 c'," ard I- the Statenert 3f ape-at or5 $8 i i n w Iwd -rr.ilt wtil - t i ? t ' d r i w L I m s are &sed ',eie, to note 7 2 ;Bii
Cash a t bank Other assets Liabilities
7.02 1.28
(0.34)
Total Net Assets 100.00
38

Aviva Funds - European Smaller Companies Equity Fund
Schedule of Investments as at 30 June 2004 (expressed in EUR)
Quantity Description of Securities Market % of Value Net Assets
Equities Traded on an Official Stock Exchange
14,799 27.183 15,957 2,300 6,362
10,608 27,920 10,152 12,040 12,709 3,213
39,574 2,924
19,500 7,057
372,497 2.699 8,964
26,758 5,906
29,050 3,272
42,141 1 1
8,140 14,106 45,363
9,965 27,567
3,699 15,903
900 38,739 29,596
8,362 8,246 9,273
35,513 16,955 32,892
2,735 5,935 6,891
17,881 6,468 5,960
74,560 24 1
4,400
9,591 10,338 10,000 16,969 8,584 4,001
42,975 13,473 37.718
7,643 5,662 6,881
18.276 3,934
27,442 22,500
33,584
Aalberts Industries Alma Media Corporaoon Aten Amb Gencrali Holding Amplifor AndritL Anglo Irish Bank Asm International Assystem Brime Axa to Bacob Dalloz B a i r of Pirdeuj Barco New BC Semiconductor Industries Bennteau Ben Stabili B ipu Brigitte Modi Accessoires Boe,ve Systec Buhrmann Cairo Communications Caltagirone Editore Camaieu Corporacion Mapfrc Creyf's Vvpr Strips Cs Communication 12 Systems Ct5 Everitim Danieli & Co Dav de Carnpaii-Milano
E.Biscom Elise Corporation Class ' A Elrirgklinger Enagas Equant Eramet Euler Exdct Holrhig Finnair
Fondiaria di Riso Frwnet de Fuchs Petrolub Funkwerk G er in d rno5 Gifi Grenkeleasing Group Edition L'Espresso Heidelbergcement Vvpr Strip Heidelberger Druckmaschinen Huhtamdki Class 'I' Hunter Douglas Ids Scheer Iliad Ima Industria Macchinc Automatic Irriery5
leronimo Martins Jeroiimo Martins Kingspan tiroup Kori riklilke Barr Nbm Krones La55 la & Tikanop Lottomatica Mayr Mel iho f Kar t0 Mcr oni Elet?rorjornestici M o t x Oil Hellas
DCC
FoIII-FoIIIc
IPSO<
36?.797 190,961 240,073 141,715 186.025 419.889 359,191 172,635 192.580 205,568 196.073 377,140 214,914
92,430 370,669 230,389
356,319 220,754 181,16/ 185,484 238,207 426,046
187.790
160,585 402,038 398.343 166,473 174,694 89,325
35 1,944 184,383 393,474 363.484 196.727 196,032 448,799 362,305 193.91 2 355,269 213,793 423,601 335.204 192,299 x i . 2 0 8
2 1 19,240 354,479 383,160 168,199 19?,000 186,235 408,298 358,392 389.1 39 121,998
182,935 486,932 181,624 372,282 423,298 3138,869 168,750
1 8 ~ , 8 5 /
197,484
185,513
1 .56 0.82 1.03 0.61 0.80 1.85 1.55 0.74 0.83 0.89 0.84 1,61 0 93 0 4u 1.60 0 99 0 / Y 1 5 3 0 95 0 78 0.80 1.03 1 8 3
0.81 0.85 0.69 1.73 1.72 0.7? 0 75 0.38 1.52 0.79 1 69 1 5 7
0 84 1.93 1.56 0 84 1.53 0.91 1.82 1.44 0.53 1 5 8
0 51 1 5 3 1 6 5 0 72 0.83 0.80 1.76 1.59 1.68 0.53 0 YO 0 79 2 10 0 / 8 160 182 172 0.73
0 a5
Unaudited Report
Quantity Description of Securities Market % of Value Net Assets
4,17? 7,647 6,556 9,834 5.333 6.978 1,037 7,630 G.600 4,792 9.603
14,901 7,867
74.2 19 5,000
10,429 26,188
MPC Muerichmeyer Peterseri Cdpital Neopujt Nexans Norbert Dentresarn Pierre 12 Vacances PKC Group Puma Sbs Broadcasting Sodexho Alliance Siedim Techem Tietoenator llmicore United Drug Valeo Wendel InvestiFsement Yit-Yhtvma
21 0,623 370,612 197,073 420.895 396.642 177,241 21 6.650 183,120 141,999 260,086 200.704 369,844 410,067 207,442 171,825 414,709 437.994
0 91 1.60 0 85 181 171 0.76 0.93 0 79 0.61 1 1 2 0.86 1.59 1.77
0.74 1.79 1.89
0.89
Investment Portfolio at Market Value 21,987,975 94.69
Cash at bank Other assets Liabilities
596,005 2.57 686,027 2.95 (49,662) (0.21)
Total Net Assets 23,220,345 100.00
39

Aviva Funds - European Smaller Companies Equity Fund (continued)
Unaudited Report
Economic Division of Investments as at 30 June 2004
% of Net Assets
Geographic Division of Investments as at 30 June 2004
% of Net Assets
Autorriobilej 'dusiness Services g CompLiter Software Compuvr SvstPm5 Coiglornerdtes Coistrucvon 8 Building Materials Coisumer Goods Electrical & Other Engireering Electroiics hancia l lnsritutinns F o o d Health & Personal Carc Industrial Irsurance Leisure & Hotels hlanuracturing Media Metals & Mmerals Misccllancous Oil & Gas Paper & Packaging Pharmaceuticals Property RP'aiI
Services Teiecommunications Transportat~ori U:ili:ies
1.12 4.12 2.62 3.51 0.80 9.61 9.12 4.66 4.91 2.29 1.12 0.78 3.57 2.45 2 40 ti 36: 3.46 5 07 2 26 3.35 0 89 2 70 6.78 1 5 5 3 02 2.65 1 52
Investment Portfolio at Market Value
Cash at bank Other assets Liabilities
94.69
2.57 2.95
(0.21)
Austria Relqium Finland France Germany Greece Ireland Italy Netherlands Portugal Spain
3.67 2.70 7.07
23.49 20.17
6.10 4.96
13.77 7 73 1.68 3 35
Investment Portfolio at Market Value
Cash at bank Other assets Liabilities
94.69
2.57 2.95
(0.21)
Total Net Assets 100.00
Total Net Assets 100.00
40

Aviva Funds - European Socially Responsible Equity Fund
Unaudited Report
Schedule of Investments as at 30 June 2004 (expressed in EUR)
Quantity Description of Securities Market % of Value Net Assets
Economic Division of Investments as at 30 June 2004
% of Net Assets
Equities Traded on an Official Stock Exchange
34,000 2,675 8,000 5,000 9,500
17,976 4.750 6,900
20,700 3,920
10,000 94,000 15,900 85,000 4,000 7,500 3,311
41,400 2,500
12,300 17,700 18,000 10,400 29,500 19,400 8,100 5,500
68,210 1,150 7,000
17,000 15,400 4,850
21,500 1,800 5.000
28,500 90,000
101,523 40,000 31,500 22,800 64,050
9,700 237.824
14,000 6,465
36,250 14,100 82.200
3,700 14,700 9,875 6,000
Abengoa Air Liquide Asrn Holding Autoliv Sdr Axa Axa to Baii:o Popular Espana Ban< Austria Creditanstalt Ban< of Ireland Converiutn Holding Ekornes Electric de Portugal Elekta Class 'B' Ericsson Class 'B' Essilor Inlern,ltiorial Galen Holdings Ges:evision Telet irico Getinge Class 'B' Groupp Danone Grupo Ferrovial lberdrola ING Groep Kesko Class 'E' Koninklijke Wessanen Novartis Nov:) Nordisk Class 'B' Nomzymes Class 'R ' Portugal Telecorn Sgps P u r a Randstad Holdings Red Electrica de Espaiid Reed Elsevier Rot he Holdings Sampo SAP Schrieider Electric Skand Enskilda Bariken Class ' A Skandia Insurance Forsakring Snam Rete Gas Statoil Stor?brand Class ' A Svenska Handelbanken Class 'A T.1 M. Techem Telecom ltalia di Ri5p Telekom Austria Tietomator T-Orline lnterndtional UBS Unirredito Italian Unilever Vacon Viveidi Universal Vnu
247,180 367.41 1 1 12,680 1 14,774 173,898 290,762 222,799 339.860 226,251 166,502 161.269 21 6,670 295,489 209,531 212,700
17.81 3 40,725
405,626 179,938 424,227 307,095 352,350 168,532 351,493 708.252 344,381 204,979 600,589 240,258 158,830 237.575 180,103 396,345 173,613 246,960 279,125 340,379 314,347 359,899 418,412 176,913 376,986 299,433 232,730 434,622 175,210 160,460 338,394 824,496 336.609 208,958 162,141 226.286 143,490
1.53 2.27 0 70 1 0 8 1 0 8 1.80 1.38 2.10 1.40 1.03 1 .oo 1 3 4 1 83 1 3 0 1 3 2 0 48 0 25 2.51 1.11 2.63 1.90 2.18 1.04 2 18 4 38 2.13 1.27 3.72 1.49 0.98 1.47 1 1 1 2.45 137 1 5 3 1.73 2.1 1 1.95 2.23 2.59 1.10 2.33 155 1 2 6 2.59 1.08 0.99 2.09 5.10 2 08 1 2 9 1 0 0 1.40 0 89
Investment Portfolio at Market Value 14,996,356 92.84
Cash at bank Other assets Liabilities
998,719 6.18 192,688 1.19 (34,824) (0.21)
Automobiles Business Sewices & Cornputcr Software Chemicals Corriputer Systems Consumer Good5 Electrical & Other Engineering Clectronics Firndricial Iristitutioris Food Health & Pprxonal Care Insurance Media Miscellaneous Oil & Gas Pharrrixeuticals Services TelecorrirriiiriicationF Utilities
1 oe 3 62 2 27 0 99 2 49 6 89 1 9 6
17 58 5 63 6 94 7 35 3 40 2.05 2.59 9.44 0 98
10.64 6 94
Investment Portfolio at Market Value
Cash at bank Other assets Liabilities
92.84
6.18 1.19
(0.21)
Total Net Assets 100.00
Geographic Division of Investments as at 30 June 2004
% of Net Assets
AJstria Dermark F i n i a n o France Germdriy Irc!and Italy Netherlands Norway Portugal Spain Swden Switzerland Uriitpd Kingdom
3.18 3.40 4.10 8.91 8.42 1.40 8.85 9 34 4 69 5.07 8.92
13.12 12.96 0.48
Investment Portfolio at Market Value
Cash at bank Other assets Liabilities
92.84
6.18 1.19
(0.21)
Total Net Assets 16,152,939 100.00 Total Net Assets 100.00
41

Aviva Funds - European Value Equity Unaudited Report
Fund
Schedule of Investments as at 30 June 2004 (expressed in EUR)
Quantity Description of Securities Market % of Quantity Description of Securities Market % of Value Net Assets Value Net Assets
Equities Traded on an Official Stock Exchange
42,002 43,004 53.644
1,955 12,825
1,047 4,288
23,715 17,455 10,933
136.012 110,518 71,930 46,140
4,357 30.61 8 19,909 14,917 33,046 13,436 1 1,893 18.47 1
122,341 5,443
20,422 27,7521
8,339 40,848
5,696 74.051 57,034 1 1299 6,189
17.4// 19.890 52.605 48,648 47,989
150,981 43,341 1 1.944 36,269 36,807 31.791
130,697 1 1,345 28,037 14.82 1 23,490 45,785 22,165
6,384 101,612
4,705 27,892 10,575 4,476
70,168 7,109
1 16.934 81,813
8,903 54,978 2,011
19,183 2,970
ABN-Amro Holdings Aegon Awdd Air Liquide Akzo Nobel Allianz Holdioy AMR Generali Holding Arcelor ALstridil A,rlines Avcnts Banca Mesa Banca Nazionale Lavcro Banco Bilbao Vizcaja Argentarid Banco Santander Centro Hismano Barco New Bayw Ay Raycr Hypo Vereinshank Bayer Motoren Wpr4 BE Serriiconductor Industries RNP Parihas Bcss Hugo Cap tiemini Capitalia Carlsbprq Class '6' Carrefour Cr6d.t 5uissc Group CRH Danieli & Co Dcutsche Bank Deutsche Telekom DNR Norway Douglas Holding DSM Cva E.On Aq Elec:rolux Class 'R' Erdesa Fni Equdnt Ericsson Class 'B' Fiat Spa di Rmsp Foreningssparbankw Class 'A' Foms France Tplerorn Gas Ndlural Gc:ronics Heidelherger Druckrriax%nen Heinekeri lberdrola In'ineon Technologies ING Groep Irish Lifc & Permanent KBC Bankver7ekering KPN Linde Luftnansa Michelin Class 'B' h,lunchcner Ruckvers Nera As Nestle Nokia Nordea Bank Nor5k Hydro NOVaitiS Piiault Printerrips Redoute Ras Renault
760,026 432,405 347,345 268,519 388,726
94,125 264,205 329,283 21 1,816
437,279 210,813 798,783 399,342 320,240 725,800 292,961 541,562 156,638 688,931 2 2 0,9 7 2 623.581 31 5,334 236,542 822,088 819,565 144,848 144,602 371,721
1,077,856 321,671 267,786 250,407
1,039,882 314,738 841.41 7 800.0 16 298,971 372,190 203,486 187,695 661,547 792,271 635,343 294,722 307,450 758,261 257,144 261,914 896,241 277,395 299,793 632,535 2 13,842 317,272 478,995 404,988 140,774
1,569,792 1,400,285
486,3 15 473.41 2
2,007,129 168,170 286.690 187,556
684,132
1.51 0.86 0.69 0.53 0.77 0 19 0.52 0.65 0 42 1 3 6 0 87 0.42 1 5 9 0 79 0.64 1.44 0.58 1.08 0.31 137 0 44 1.24 0.63 0 47 1.63 1.63 0.29 0.29 0.74
43,062 8,107
48.535 40.533 1 1,370 7,808
16,026 20,436
7,468 83,016
136,529 4.319
18,475 17,549 38,463
3,905 188,071 332,924
48,379 8,160
16,725 18,489
121,469 16,047 11,893 14,254 11,901 44,22 1
5,582
Repsol Ypf Roche Holdirigs Royal Dutch Petrol Sampo San Paolo-lmi Sdnofi Syntheldbo Scheriqg 5ec:uritas Cld%s 'B' Siemens Skandia Insurance Forsakring Snam Rete Gas SocietP GenPraIe Sodexho Alliance S t Gobain Suez Swiss Life Holdings T.I.M. Telecorn ltalia di Risp Telefonica Total URS UCB Unicredito Italian Unilcver Valeo Vivendi Universal Volkswagen Wolters Kluwer Zurich Financial Services Group
776,623 662.508
2,058,369 327,304 113,984 410,115 774,857 208,045 443,599 289,954 483,995 3C4.166 3g7.490 724.686' 655.986 450,991 879,232 608,419 5G2.885
1.250.71 1 977.991 702,304 457.41 6 906,254 408,703 326.630 414,155 655,134 736,177
1 54 1.32 4.09 0.65 0.23 0.81 1 54 0.41 0 88 0 58 0 96 0.60 0 79 1.44 1.30 0.90 1.75 1.21 1.18 2.54 1 9 4 1 3 9 0 99 1.80 0 81 0.65 0.82 1.30 1.46
2.14 0 64 Investment Portfolio 0.53 at Market Value 50,306,818 99.91 0.50 2.07 Cash at bank 1,637,079 3.25 0.63 Other assets 46,601 0.09 1.67 Liabilities (1,639,392) (3.25) 1.59 0.59 Total Net Assets 50,351,106 100.00 0.74 0.40 3 37 131 1.57 1.26 0.59 0.61 151 3.51 3 52 1.78 3.55 0.60 1.26 0.42 0.63 0.95 0.80 0.28 3.12 2.78 0.97 0 94 3.99 0 33 0.57 0 37
42

Aviva Funds - European Value Equity F U n d (continued)
Unaudited Report
Economic Division of Investments as at 30 June 2004
% of Net Assets
Geographic Division of Investments as at 30 June 2004
% of Net Assets
htomnbi les Chemicals Curnputer Systems Coi?strbction & Buildirig blatprials Consuw, Goods Electrical I: Other Fngineering Electroric.; Financial 1nsii:utiorir Food Insurance Manufacthring hlpdia Meid!> & Minerals Oil & Gas Pharmaceuticals Rc:ail Services Tclecomrnurm dtions Transportation UtllltlPj
4 33 3.24 1 8 3 1 7 3 3.05 132 1 4 7
18 98 8 03 7 ti6 0 88 1.95 0.65
10.70 10.40 0.86 0.51
13 50 1 0 5 7.77
Investment Portfolio at Market Value 99.91
Cash at bank 3.25 Other assets 0.09 Liabilities (3.25)
Total Net Assets 100.00
Austria Bclgium Derm?r< Finlanc Fiarce GPrmanv IrelAnd
Neinerlands Nofvbdy Spain Svdeder Sw%darid
Italy
0.42 3.94 0.47 3.43
18.94 15.95 0.84 9.91
17.56 1.86 8 54 3.70
14 35
Investment Portfolio at Market Value
Cash at bank Other assets Liabilities
99.91
3.25 0.09
(3.25)
Total Net Assets 100.00
43

Aviva Funds - Global Socially Responsible Equity Fund
Schedule of Investments as at 30 June 2004 (expressed in USD)
Quantity Description of Securities Market 46 of Value Net Assets
Equities Traded on an Official Stock Exchange
3,408 7,625 2,833 3.670 3,319 4,496 1,671 4,242
65,000 3,730 2,822 4,120
68,373 2,486 5,855
56.000 6, 142
13,124 38,886
6,454 4.360 1,900 5,319 4,100
17,000 4,265
229,446 4,334 4,509
37.122 72
12,188 3.060
12,000 2,850
26,616 12,300 2,924
394,000 10,150 6,181
121,258 5.9 13
59.71 5 2,500 5,429
25,000 5,900
10,156 4,435
105,000 14,000 4,148 3,242
11,409 39,000 22,027 30,000 9,000 4,800 3,000
85 10,046 12,800 7,952
32,000
3M Company Acceriture Cldss ' A Air Products 8 Chemicals Alma American Express Americaq lnternatiorial Group Anthem Apache Corporatiori Arm Holdings Astrazeneca Bank of America Best Buy Compdny Biotrace International Black & Decker Bristol-Myers Squibb B 1 Group Rurlinqton Resogirte Cairn Energy Centaur Holdings
Clear Channel Communication Colgate-Palmolive Costco Wholesale CSX Corporatiori Daiwd Securiries Group Dell Dimension Data Holdings Encana Corporation First Data Corporation Firstyruup Fuji Television Network Getinyc Class 'B' Grainger Hang Seng Bank HCA Herald Investment lberdrola IBM I-Cable Communications ING Groep Intel Corporation lnvensys ltron ITi/ Johnson &Johnson Keyspan Corporatior Kingfisher Konin klil ke Wessanen Kroyer Marsh & Mclennan Mass Transit Matsushita Electric Industries Merck & Co Merrill Lynch & Co Microsoft Mitsubishi Electric Corporation Morgan Sindall N kko Cordial Corporation N ppon System Development Novartis Novozymes Class 'B' N n Ducorno Office Depot Oracle Corporation Pfirer Portugal Tdecom Sgps
Cltlyroup
306,004 206,866
120,871 170.1 82 320,812 146,087 182,024 142,335 168,459 238,699 208.966 156.069 152,603 144,384 202,519 218,532 339,989
58,118 298.982 158,268 1 1 1,350 2 18,850 135,035 122,452 152,069 130.41 5 183.666 201,440 162.720 165,376 145,174 174,726 154,231 1 16,765 152,367 259,440 258.262 150,307 241.546 170,441 38,168
135,969 125,894 133.363 196,910 132,586 85,463
183,367 133,575 159,182 199.241 196,408 175,133 324,871 192,056 169,592 145,806 196,797 213,039 135,925 152,284 180,476 150,720 273,072 342,540
147,599
1.98 1.34 0.96 0.78 1.10 2.08 0.95 1.18 0.92 1.09 1 5 5 1.35 101 0 39 0.93 1.31 1.41 2.20 0.38 1.94 1.02 0.72 1.42 0.87 0.79 0 98 0.84 1 1 9 1 3 0 1.05 1 0 7 0.34 1.13 1 .oo 0.76 0.99 1 .68 167 0 38 1.56 1.10 0.25 0.88 0.82 0.90 1.27 0.86 0 55 1 1 9 1.29 1.03 1.29 1.27 1.13 2.10 1.24 1.10 0 94 1 2 7 1.38 0.88 0.93 1.17 0.38 1.77 2.22
Unaudited Report
Quantity Description of Securities Market % of Value Net Assets
4,248 900
2,900 30,000
4,293 4,091
23,000 18,000 5,203
16,500 18,758 3.600
47,536 5,370 4,976 5,618
42,000 2,895
65,335
Royal Bank of Scotland SAP Schneider Electric Sekisui Chemical SLM Corporation S t P a l Statoil Asa Sun Hung Kai Property Sysco Corporation Taylcr Nplsun Soft Trojan Technologics UBS Uriicreditu ltdliari Verizon Communications Viaconi Class 'A' Vnu Vodafone Group Weightwatchers Interndtional Westport Innovations
124.016 150,117 136,815 253,852 174,776 165,563 292,485 147,404 186.267 63,108
1'0.991 255,920 236,652 193.481 178,240 163,338 92,541
1 14,946' 79,890
0.80 0 97 1 2 7 1.64 1.13 1.07 1.89 0.95 1 2 1 0.41 0.72 1.66 1.53 1.25 1:5 1.06 0.60 0.74 0.52
Investment Portfolio at Market Value 15,120,500 97.90
Cash at bank Other assets Liabilities
71.187 0.46 278,698 1 .80 (25,086) (0.16)
Total Net Assets 15,445,299 100.00
44
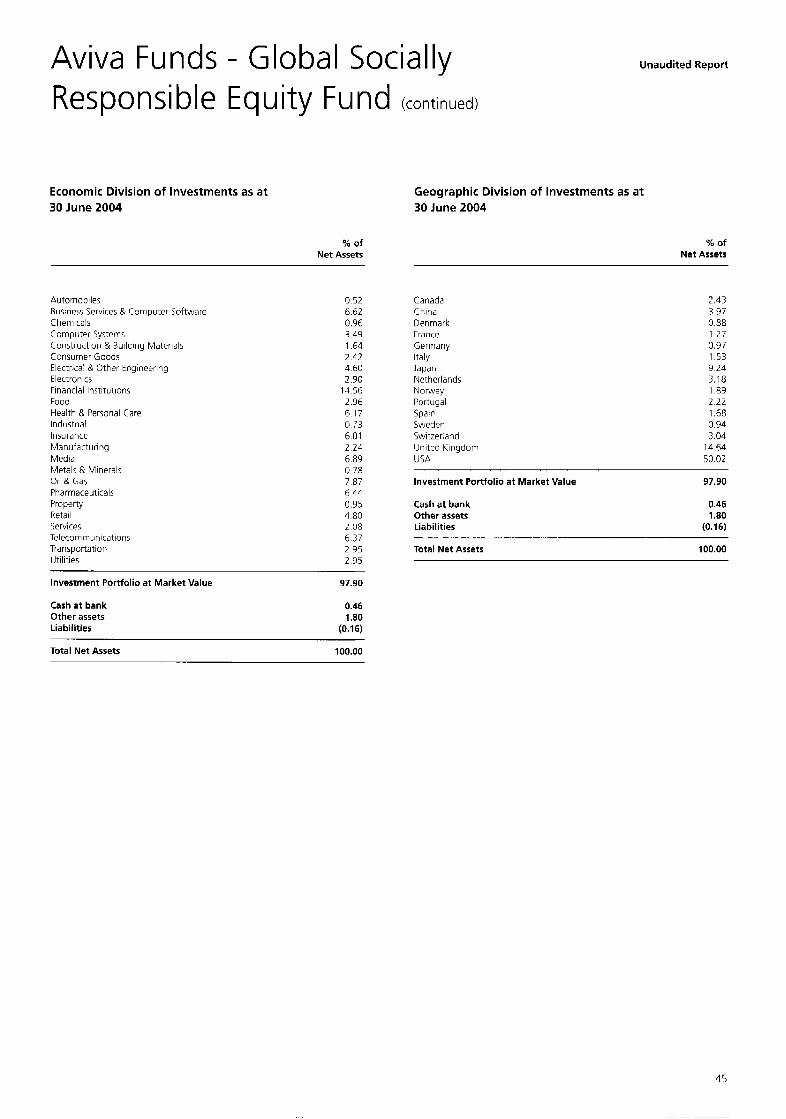
Aviva Funds - Global Socially Responsible Equity Fund (continued)
Unaudited Report
Economic Division of Investments as at 30 June 2004
% of Net Assets
Geographic Division of Investments as at 30 June 2004
% of Net Assets
Automobiles Business Services & Computer Software C heinicals Computer Systcrrs Construction & Builcing Materials Consurrier Goods Electrical & Other Ergineering Electronics Financial Institutions Food Health & Personal Care Industrial lnsurancc Manufacturing Media Metals S Minerals Oil & Gas Pharmaceuticals Property Retail Scrvices Telecommunications Transportatiori Utilities
0 52 6 62 0.96 3 49 1 64 2 42 4 60 2 90
14 56 2 96 6 17 0 73 6 01 2 24 6 89
7 87 6 44 0 95 4 80
6 37 2 95 2 95
o ?a
L oa
Investment Portfolio at Market Value
Cash at bank Other assets Liabilities
97.90
0.46 1.80
(0.16)
Total Net Assets 100.00
Canada Ckina Denmark rranre Germany Italy Japan Ncthcrlands Norway Portiiqdl Spair Sweden Switzer,aid United Kingdom USA
2 43 3 97 0 a8 1 2 7 0 97 1 5 3 9 24 3 18
2 22 1 6 8 0 94 3 04
14 64 50 02
1 a9
Investment Portfolio at Market Value 97.90
Cash at bank 0.46 Other assets 1.80 Liabilities (0.16)
Total Net Assets 100.00
45
. . .. .. -

Aviva Funds - Global Themes Equity Unaudited Report
Fund
Schedule of Investments as at 30 June 2004 (expressed in USD)
Quantity Description of Securities Market % of Quantity Description of Securities Market % of Value Net Assets Value Net Assets
Equities Traded on an Official Stock Exchange
8,00C 1 1 ,000 20,000 25,690
5,000 19.30G 5,000
22,000 53.200 31,260 16.000 21.699
9,000 30,000 6?,000 10,000 1 1,000 Li,aoo 41,000 12.500 17,000 45.00G 20,000 12,000 16,000 1 1.000
1,500 6,300
14,000 32,000 40,000 34,000 46,000
136,000 1 05
3,500 53,000 63,000
160,000
2 1,000 70,000 14,500 27,200
6,300
19,000 34,000 15,450 5,500 5,600 4.900
1 12,730 24,000
98,000 5,300
17,000 6,400
28G.000
moo
Ayerican lnrernational Group Anger Aitrdzerlecd Atlas Copco Class 'A Amltl5 b y e ' Motoreti Werk Brascai Class 'A' Carniba ci\ro systenir Ciligroup Coach Coiporatlon Corncast Corporatioi Class ' A Conocopkill,ps Credit Suisse Group Diaqeo Dow Chernic;ll Exxon Mobil Corporztion Foot I ocker Gldxusrriithklirle Harley Davdson Hmca Motor tiSBC Holdiriys Hypo Kcdl H a t e Holdings Interbrew Johnson & Joirson Kao Corporation KFyercP Corporat:or: MA( G r d ~ F: Hili MdrfioU International Class 'A Marul Corporation MatsLsliita Electric Industws Mbrla Corporatior. Mlc:osot: hlitsubishi Electric Corporation
570,840 594.825 903,264 967,094 380,367 851,836 138.652
1,071,109 1,262,702 1,448,120
714,640 605.294 681,390
1,076,796 838,744 409,350 490,270 643,140
766.1 88 821,550 676,225 583,058 379,887 891,920 265,796 343.01 7
699,370 432,182 569,260 876,350
1,309,850 669,735
837,086
482.958
Mitsdhhi Tokvo Firdncidl First Sectior 974 339 Nest!e Nokia Nornura Holdings Nornilra Topix Banks Exchange [Ope i ended Fundl Novarti5 Oracle Corporatior Pepsico Petrol Brasileiros Arlr Pfizcr Porsche Procter & Gdrrible R o T,nto Royal Dutch Petrol Saqofi Syr.8tt4dtio SAP Srnc COrpOrJtlOll S w t n 8, Nepkew S:e Nationale Ftude ConstrLdons Moteurs Tplpr;or Group Totdl u w Uni:Pc Tw hrioloyier Vmafonc G r o ~ p
939,581 771,585 934,787
414,542 932,047 824,250 778,795 663.81 6 2 16,342 540,751
1,042,340 813,354 796,579 351,205 934,059 53 1,224
1,223,473
40'7,419 683,230
' ,011,275 i.208.510
5 79,48 I 61 6,940
1.20 1 2 5 1 9 0 2.03 0 80 1 7 9 0.29 2 25 2.65 3 04 1.50 1,27 1.43 2 26 1.76 0.86 1.03 1.35 1.76 1.61 1.73 1.42 1.22 0.80 1.87 0.56 0 72 101 1.47 0 91 1 2 0 1 .84 2 75 141 2.05 1.97 1.62 1.9G
0.87 1.96 1 7 3 1 64 1 3 9 0 45 1 1 4 2.19 171 1 6 7 0.74 1.96 1.12 2.57
0.98 1 4 4 2 12 2 54 1 . 2 2 1 3 0
12,000 Wal-Mart Stores 30,000 Walt Disney
623,760 1.31 755.000 1.51
Investment Portfolio at Market Value 43,891,555 92.21
Cash at bank Other assets Liabilities
3,794,083 7.97 119,713 0.25
(204,226) (0.43)
Total Net Assets 47,601,125 100.00
46

Aviva Funds - Global Themes Equity F U n d (continued)
Economic Division of Investments as at 30 June 2004
% of Net Assets
Aerospace Automobiles Business Scrvicej & Computer Sottware Chernicals Conglomerdtej Consumer Goods Electrical & Other Erginecring Electronics F nancial Institutions Food Health & Persorial Cart. Industrial Insurance Leisure & Hotels Media Metals & Minerals Miscellaneous Oil & Gas Pldrrriaceuticals Retail Telecommunications
1.22 4 66 6.44 0.86 0.29 6.90 4.56 0 72
16 33 1 9 7 8 44 0.98 1.70 5 33 3 89 1.?1 1.67 7.64 6.81 3.57 IO1
Investment Portfolio at Market Value 92.21
Cash at bank 7.97 Other assets 0.25 Liabilities (0.43)
Total Net Assets 100.00
Geographic Division of Investments as at 30 June 2004
Unaudited Report
% of Net Assets
BraLil Canada Finldrid France GPrnany Japan Netherlands Norway Sweden Swi:zerland Uriitec Kirigdom USA
1 3 9 0.29 1 6 2 4.64 6 1 1
12 54 1 6 7 1.44 2.03 8.73
15 47 36 28
Investment Portfolio at Market Value
Cash at bank Other assets Liabilities
92.21
7.97 0.25
(0.43)
Total Net Assets 100.00
47

Statement of Net Assets As a t 30 June 2004
Notes
Inve~tment portfclio at cost Unrealised gain/(los!
Unaudited Report
European European EUR GBP USD AAA Bond AAA Bond Global AAA
Reserve Reserve +serve Fund Fund Bond Fund Fund Furid Long Term Short Term Fund EUR GBP USD EUR EUR USD
52,233,549 31,478,912 7,270,580 59,152,876 103,368,250 23,385,082 22,500 16,928 2.1 19 (380,569) (603.4881 34.81 6
Investment Portfolio at Market Value 2.2 52,256.049 31,495,840 7,272,699 58,772,307 102,764,762 23,419,898
Deposits Cash a: bank Other as&< Total dswts Liabili:ifs
9,900,000 6,700,000 2.C00.000 75,390 37,052 67,087 491,281 (874.041) 1,312,057
197,175 258,371 12,138 1,343,056 3,819,302 437,862 62,428,614 38,491,263 10,251,924 60,606,644 106,584,064 25,169,817
(54,374) il.O50,403) (9.287) (91,937) (141,352) (762,588)
Total Net Assets 62,374,240 37,440,860 10,242,637 60,514,707 105,568,671 24,407,229
Net Assets Comparative Total Net Assets 30 Juri? 2004 31 December 20C3 31 December 20C2
Net Asset Value per Private Class Accumulation shares 30 Juie 2004 31 Decembcr LOC3 31 December 20C2
Net Asset Value per Private Class Dividend shares 30 Junc 2004 31 December ?003 31 December 2002
Net Asset Value per Retail Class shares 30 June 2004 31 December 2003
Net Asset Value per Institutional Class shares 30 Junc 2004 31 December 2003
Shares Outstanding a t 30 June 2004 Private Class Accunluidtion ShdK'S
Piivaie Class Dividend shares Retail Class shares 1ns:itutional Clas5 shares
62,374,240 37,440,860 46.746.1 51 42,283,892 52,990,309 42,993,662
8 2555 2 2852 a 1974 2 2452 8.0444 2 1775
1.0178 1.0153 1.0149
10.6231 10.5614
102,9904 102.1383 68.1652
10,242,637 14,018,962 6,330,438
15.4117 15.391 3 15.31 65
10.0008
100.748? 100.4894
60,514,707 105,568.671 24,407,229 52,071,506 89,701,659 22.1 27,099
107,011,221 37,615,122 13,283,407
46 0525 12.2160 77 7888
44 1331 11 E620 70 a374 45,3857 12 1186 79.5164
10.6030 10.6440 10.6690
10.6809 10.5512 11.2588 10.5420 10.r.825 11.5262
103 9701 105,5239 109.4927 102,2661 102 6691 11 1.7072
7,15 1,341 16,228,903 502,050 1,016,329 7,203,787 349,O 15 - 1,104,274
198,944 630 591,814 390,670 11,871 24,803 71,070 16.454
253,662
183,075 23,874

Statement O f Net Assets (continued)
As a t 30 June 2004
1nvest::writ portfolio at cost Unrealiscd gain/(loss:
Emerging Mdrkpts
Bofld Notes Fund
USD
302.394.595 (7,648,626)
Furopean Cnrporxe
Bond h n d EUR
23,301,628 369,673
Investment Portfolio at Market Value 2.2 294,745,969 13,671,301
Unaudited Report
Global Glotial Arriericdn Asia-Pac,iic Balarccd Convcrtibles Lquity Eqbity
Fund Fund Fund Fund US0 USD US0 usu
30,612,674 402,205,963 114,772,772 50,076,522 2,099 366 20,443,589 9,209,877 1 , l 10,903
32,712,040 422.649.552 123,982,649 51,187,425
Deposits Cash at bank 61,805,325 751,731 4,660,249 7,447,351 4.1 13,920 228,649 Other assets 9,779,016 566,254 319,795 8,700,788 635,823 757,543 Total assets 366.330.31 0 24,991.21 6 37,692,084 438,797,691 128,732,392 52,368,145 Liabilities !2;150.304) (928.443) i688.137) !7,395.967) (21 2,238) (1 25,774)
Total Net Assets 363,880,006 24,060,843 37,003,947 431,401,724 128.520.1 54 52,047,843
Net Assets Comparative Total Net Assets 30 June 2004 31 December 2003 31 December 2002
Net Asset Value per Private Class Accumulation shares 30 June 2004 31 Dece:nber 2003 31 December 2002
Net Asset Value per Private Class Dividend shares 30 June 2004 31 December 2003 31 December 2002
Net Asset Value per Retail Class shares 30 June 2004 31 December 2003
Net Asset Value per Institutional Class shares 30 June 2004 31 December 2003
Shares Outstanding a t 30 June 2004 Private Class Accumulation shares Private Class Dividend shares Retail Class shares Institutional Class shares
363,880,006 24.060.843 37.003.947 431,401,724 128.520.1 54 52,047,843 373.849.1 78 19,030,383 36,687,109 356,139,939 81,522,087 41,310,798
- 14,295,156 30,061,434 273,103,069 52,289,215 16,997,396
48817 2 3365 5 E l l 2 6 1013 4 9920 2 6655 5 0581 2 2999 5 E786 5 9393 4 8948 2 8215
2 0526 4 801 5 4 7772 3 8856 19976
1.9721 2 0043 1 9103
9 9432 1 1 3796 1 1 8841 12 7654 12 8286 13 0657 1 1 2281 12 G568 12 4614 12 6102 13 8654
97 3606 112 3373 1168180 125 5025 127 5038 129 5629 1005789 1102152 1178444 121 7842 1246251 136 7093
12,202 4,596.1 74 572,299 10,552,339 18,402,940 13,474.1 62
6,000 57,345 26,433 97,042 208,268 1 1 1,094 3,736,220 40.910 286,587 2,914,523 266,511 113,312
- 4,093,740
49

Statement O f Net Assets (continued)
As a t 30 June 2004
Investment portfolio a: (mi Unredlised gain/(loss,
Unaudited Report
European F w c i Glooal Japanese Nordic UK Eqiiity Eqlllty Eq 1J iy)l Eql.lty Cqulty Equity
Noles Fund Func h i d Furd Fund Fund ELJR ELJR (JSD I PY UOK GBP
218,928,488 43.290.622 50,121,910 12,843,169,152 77,956,460 19,044,502 14,498,530 7,050,267 5,560,018 2,893,703,148 (78,548) 412,934
Investment Portfolio at Market Value 2 2 233.427.01 8 50,340,889 55,681,928 15,736,872,300 77,877 81 2 19,457,436
Deposits Cash at bank Other assets Totdl dssels Liabilitics
874.443 890.758 1,199,915 235,311.181 1,722,489 1,002,515 123,324 42,295 181,606 50,377,525 843 589 102.904
134,424,785 51,273,942 57,063,449 16,022,561,006 80.443.890 21,462,855 (525,379) (285.492) (298,5671 (44,955,830) (1,704,253) (36.787)
Total Net Assets 233,899,406 50,988,450 56,764,882 15,977,605,176 78,739,637 21,426,068
Net Assets Comparative Total Net Assets 30 June 2004 31 December 2003 31 Decerrrber 2002
Net Asset Value per Private Class Accumulation shares 30 June 2004 31 D ~ ~ ~ r r i U e r 2003 31 December 2001
Net Asset Value per Private Class Dividend shares 30 Juqe 2004 31 Dcccmber 2003 31 December 2002
Net Asset Value per Retail Class shares 30 JunP 2004 31 December 2003
Net Asset Value per Institutional Class shares 30 June 2004 31 DeccmUcr 2003
Shares Outstanding a t 30 June 2004 Prlvate Class Accdmulation shares Privatc Class Dividend shares R e m Cla5s shares Inslitutional Class shares
233.899.406 50,988,450 56,764,882 15,977.6C.5.176 78,739.637 2 1,426,068 160,778,468 59,582,653 60392,708 11,968,056,185 59,880.092 18,513.956 137.51 8,974 47,146,496 45,459,055 2,169,638,650 40,903.141 9,034,310
4.5995 2 9542 2 9362 01 2968 1 1 3480 2 0990 4 3929 2 7434 2 9493 81 7595 10 2580 2 0642 3 7572 2 3558 2 3302 68 7853 7 6847 16506
1 2 5072 102157 12 7589 2,168 4063 93 2025 8.7366 1 1 21750 12 8478 1.946 6814 84 4601 8 6144
101.9254 1278147 - 21.938.4666 86.2940 - 118.3192 - 19.588.0573 84 5941
49,427,186 ‘.034.312 19,253,874 38,942,852 6,076,327 7,010,087
249,177 4,200 18,094 55,327 104,994 84,020 33,761 374,683 560,763 69,271
50 -ie acccrnpaiy nq ~ G X S form an i n t r y a l :)art 31 :hese i i . ~ n c i a l statenents

Statement Of Net Assets (continued)
As a t 30 June 2004
IiwestrriPri? portfolio 3 t cost Unrealised ydin/(lossi
European Crwryiriy 3.roprari Smaller Countries Convergence Euwpean Compan es
tquitjr Eq~i ry Propertv Equity Notcs tknd Fund FJPd Fuid
USD EUR EUR EUR
809,409,478 31,889,629 32,556,574 19,993,028 168.i67.349 9.19/,928 4,888.920 1,994,947
Unaudited Report
European Socidllv European
Respons ble Value tqhlty Equsty Fund Fund EUR EUR
12,822,186 47,964,840 2,174,170 2,341,978
Investment Portfolio at Market Value 2 2 978,176,827 41,087,557 37,445,494 21,987,975 14,996,356 50,306.81 8
DPpmts C j s h a t b m k Otner asscts Total assets I labilities
11,101.321 1,058,008 2.855.878 596,005 998,719 1,637,079 4,150,085 542,217 519,756 686,027 192,688 46,601
994,032,236 4?,687,782 40.82 1,128 23,270,007 16,187,763 51,990,498 (3,539.: 10) I 1,043,260) ( 1 36.93 1 ) (49.662) (34,824) (1,639,392)
Total Net Assets 989,889,123 41,644,522 40,684,197 23,220,345 16,152,939 50,351,106
Net Assets Comparative Total Net Assets 30 June 2004 31 Decernbpr 2003 31 Deccmbe: 2002
Net Asset Value per Private Class Accumulation shares 30 lurie 2004 31 December 2003 31 Decrnihw 2001
Net Asset Value per Private Class Dividend shares 30 June 2004 31 December 2003 31 December 2002
Net Asset Value per Retail Class shares 30 June 2004 31 Decenikr 2003
Net Asset Value per Institutional Class shares 30 June 2004 31 December 2003
Shares Outstanding a t 30 June 2004 Private Class Accurriulation shares PrivatP Class Dividend shares Retail Class share5 In5tituiio~al Class shdres
989,889,173 41,644.522 40,684,197 23,220,345 16.1 52,939 50,351,106 933,533,259 31,342,199 23,244,908 33,651,509 14,274.793 20,962,342 525,651,963 8,891,976 - 4,882,845 11.91 1,616 9,108,292
1.6798 2.3477 6.8830 6.8932 3.8894 5.7691 1.7320 1.9425 6.1202 6.1086 3.5407 5.4766 1.1084 16?11 4.8392 3.2945 4.5540
14 9461 152125 14 1588 14 5920 10 1439 13 3757 15 4489 12 6189 12 6136 12 9635 12 1863
148 8821 149 8403 138 5077 144 5101 1 19.6363 125 9298 152 9037 123 5037 122 8479 127 5661 108 5239 119 0449
15,359,709 6,698,161 1,597,477 1,920,175 2,117,603 4,162,208
50.61 7 105.547 52,962 197.892 896 81,462 6,470,428 162,264 209.1 82 49,108 66,098 200,503
Ttw nrrompanyiiq rutes fmni a' i riley'd p.i.t nf tncre finarcial sxerrel-tr 51
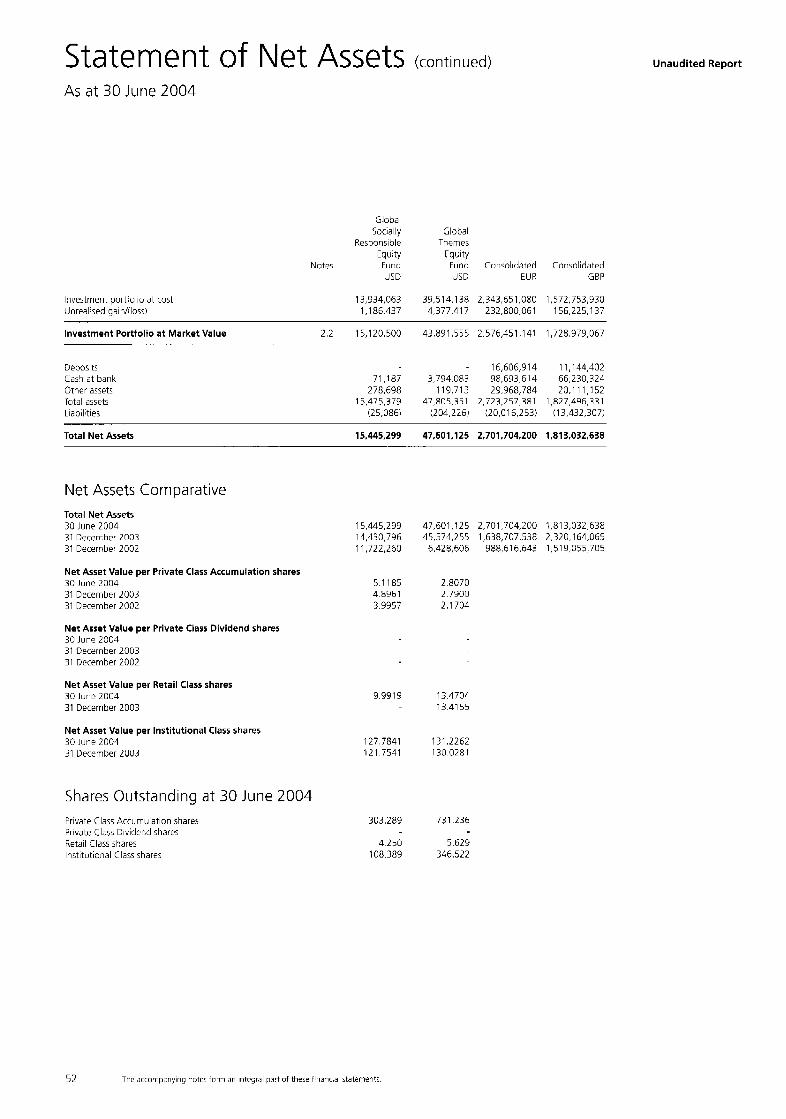
Statement of Net Assets (continued)
As a t 30 June 2004
Global Socially Global
Responsible Themes Equ:ty FqLity
Note5 Fund Fund Curisolidated Conxlidated USD USD EUR GBP
Investment portfolio at cost Unrealised gainliloss)
13,934,063 39,514,138 2,343,651,080 1,572,753,930 1,186,437 4.377.417 232,800,061 156,225,137
Investment Portfolio at Market Value 2.2 15,120,500 43,891,555 2 .576 , .~1 ,141 1,72a,9;9,067
Deposits Cash at bank Other assets lotal assets Liab4ties
- 16,606,914 1 1,144,402 71,187 3,794,083 98,693,614 66,230,324
278,698 119,713 29,968,784 20,111,152 15,475,379 47,805,351 2,723,257,381 1,827,496,331
(25,086; (204.226) (20,016,253) (13,432,307)
Total Net Assets 15,445,299 47,601,125 2,701,704,200 1,813,032,638
Net Assets Comparative Total Net Assets 30 June 2004 31 Decemher 2003 31 Decembe, 2002
Net Asset Value per Private Class Accumulation shares 30 June 2004 31 December 2003 31 December 2002
Net Asset Value per Private Class Dividend shares 30 June 2004 31 December 2003 31 December 2002
Net Asset Value per Retail Class shares 30 h i e 2004 31 December 2003
Net Asset Value per Institutional Class shares 30 June 2004 31 December 2003
Shares Outstanding a t 30 June 2004 Private Class Accumulation shares Private Class Dividecd shares Retail Class shares Institutional Class shares
15,445,299 47,601,125 2,701,704,200 1,813,032,638 14,430,796 45,574,255 1,638,707.538 2,320,164,065 11,722,260 6,428,606 988,616,643 1,519,055,705
5 1185 2.8070 4 8961 2.7900 3.9957 2.1704
9.9919 13.4704 13.4155
127.7841 131.2262 121.7541 130.0281
303,289 731,236
4,250 5,629 ioa.389 346,522
Unaudited Report
52 TPe ac:orlpznying rote: fo-m an IntesraI part of these fsria.ir,d 5tdterne'ltS

Statement of Changes Unaudited Report
in Shares Outstanding For the six months ended 30 June 2004
European European EdR GRP USD AAA Bond AAA Bond Global AAA
Reserve Reser:le Reserve Fund Fund Bond Furid Fund F.md Long Term Short Term FLnd
Private Class Accumulation shares Shares outstanding at beginning of the period 5.382.951 16,646,593 805,424 1,004,007 5,921,475 248.31 2 Shares isxed 3,367,073 2,955,519 2,256,991 165,088 2,469,244 21,277 Shares redeemed '1,598,683) (3,373,2091 (2,560,3653 (1 52,766) (1,186,932) (16,527)
Shares outstanding at the end of the period 7.1 51,341 16,228,903 502,050 1.01 6,329 7,203,787 253,662
Private Class Dividend shares Shares outstanding at beginriing of the period Shares issued Shares redeemed
37 1,384 - 1,103,358 10,971 916
:33,340)
Shares outstanding at the end of the period 349.01 5 - 1,104,274
Retail Class shares Shares outstanding a? beginning of :he period Shares issued Shares redeemed
187,269 427,940 430,084 76,475 276,766 630 164,338 27,473 107,342
(265,091) (464) (66,887) (742)
Shares outstanding at the end of the period 198,944 630 591,814 390,670 183,075
Institutional Class shares Shares outstanding a: begicning of the period 6,284 66,476 16,145 19,485 16,454 13,008 Shares issued 5,587 101 8.558 51,585 10.91 9 Shares redeemed (66.577) (53)
Shares outstanding at the end of the period 11,871 24,803 71,070 16,454 23,874
53
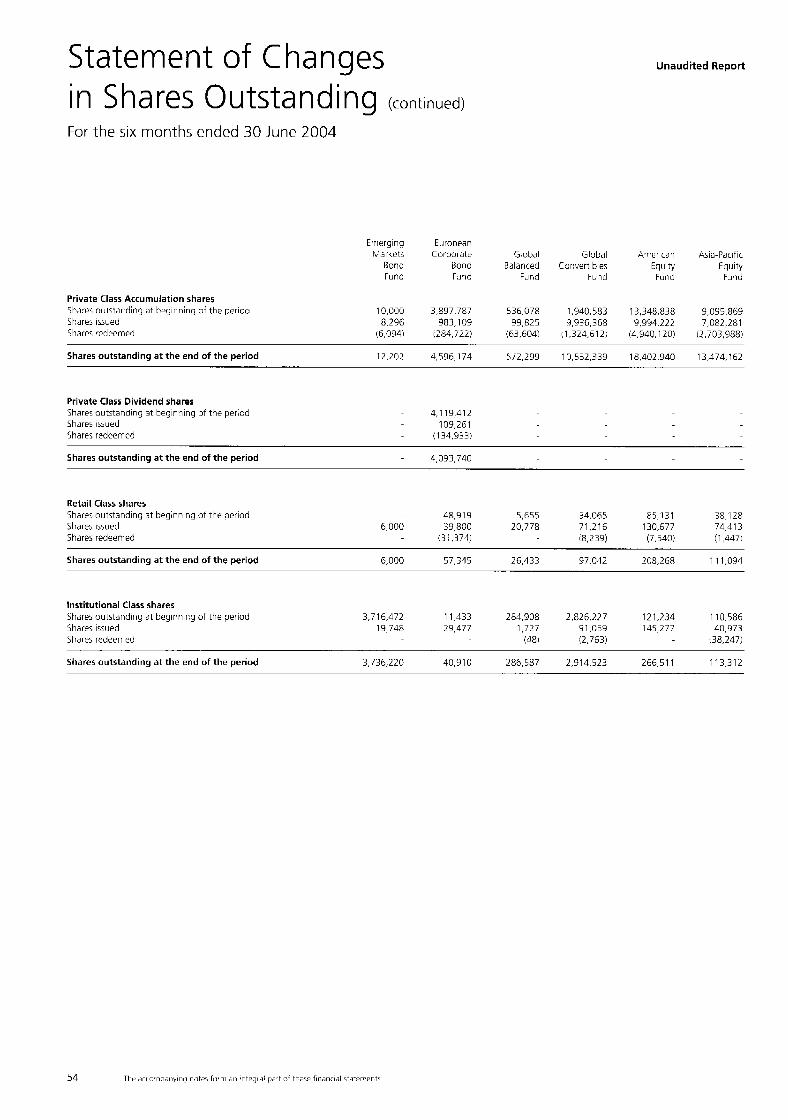
Statement of Changes in Shares Outstanding (continued)
Unaudited Report
For the six months ended 30 June 2004
Errieryiriq Eurooean Mdrcets Corpordte G obal Global A , v r C J ' ~ Ajiz-PacifiC
Furm F:lrid F J K d tund Fund F J ~ Ronu Bond Balanced Curwrt b k Fqu ty Equity
Private Class Accumulation shares S h e s oulstdrdiny dt bpgir:riiriq of the periou Shares issued Sharcs redeemed
10,000 3,897,787 536.078 1,940,583 13,348,838 9,095.869 8.296 983.109 99,825 9,936,368 9,994,222 7,082,281
(6,094) (284,122) (63.604) !1,324.612j i4.940.120) (2,703,9881
Shares outstanding at the end of the period 12,102 4,596,174 512,299 10.5J2.339 18,402,940 13,474,162
Private Class Dividend shares Shares outstanding at beginiing of the per,od - 4.1 19,412 Shdres issued 109,261 >hares rcdccrrcd - (134,933)
Shares outstanding at the end of the period - 4,093,740
Retail Class shares Shares outstanding at beginning ot t k aeriod Shares issued Shares redeemed
48.91 9 5,655 34,065 85,131 38,128 6,000 39.800 20,778 71,216 130,677 74.41 3
(31,374) 18.239) (7.540) (1,4471
Shares outstanding at the end of the period 6.000 57,345 26,433 97,042 208,268 1 1 1.094
Institutional Class shares Shdres outstanding Jt beginning of the period 3.71 6,472 1 1,433 284,908 2,826,117 121,234 110,586 Shares issued 19,748 29,477 1,727 91,059 145,277 40.973 Shares redeemed (481 :2.763) !38,247)
Shares outstanding at the end of the period 3,736,220 40,910 286,587 2,914.523 266.51 1 113,312
54

Statement of Changes in Shares Outstanding (continued)
Unaudited Report
For the six months ended 30 June 2004
Errieryiriy ELropcan trench G l o m Japanese Nordir UK Countries
EqLity :quit): Eq,ll?y Cql.ltv Equity Ecuity Equity r.lrd F ~ i i d Furiu Fdnd Fund iunc Furid
Private Class Accumulation shares Shares outstanding ai beginning of the period 36,326,567 1,182,384 20,538,266 23,416,835 5,345,136 6,603,376 11,565,039
501,537 21,120,451 Shares issued 14,802,209 256 3,674,207 29,522,536 2,083,623 Shares redeemed il,701,590) (148.328) (5.01 8.599) (1 3,996,519) (1,352,4371 (94,826) ( 1 7,325,781)
Shares outstanding at the end of the period 49,427,186 1,034,312 19,253,874 38,942,852 6,076,327 7,010,087 15,359,709
Private Class Dividend shares Shares outstandiny at beyinriiriy of the period Shares issued Shares redeemed
Shares outstanding at the end of the period
Retail Class shares Shares out5taidinq a- beginning of the period 100 318 1 1,047 19.398 59,791 17,960 22,812 Shares issued 150,967 4,200 7,047 35,951 46,972 66,060 27,800 Sharps redeemed (2,1081 22) (1,769)
Shares outstanding at the end of the period 249,177 4,200 18,094 55.327 104,994 84,020 50,612
Institutional Class shares Shares outstanding a: beginning of the period 476,160 511.319 55,893 5,972,058 Sha:es issued 37.2 10 5,020 86.967 22,813 1,140,047 Shares redeemed !3,449) i106.4971 (37,523) (9,435) (641,677)
69,271 6.470.428 Shares outstanding at the end of the period 33,761 374.683 560.763
55

Statement of Changes in Shares Outstanding (continued)
For the six months ended 30 June 2004
European Cunvergencc European
Eqbity Property Fmd
Private Class Accumulation shares Shares outsmding at beginning of thc pcriud 6,209,858 1,761,475 Shares issued 3,150,829 779,681 Share5 redeemed (2,662,426) (948,679)
F u ropea n Smdller
Companies Eqdity Fund
4,467,165 358.61 1
(2,905,601)
Europear Socially European
Equity Equity Fund Fund
Responsible VAlUt .
2.01 1,246 977,868 186,971 3,444,329 (80.614) (259.989)
Unaudited Report
Global 8cc:ally Global
Responsible Themes Equity Equity FLnd Fund
269,344 782,333 116,520 685,793 (82.575) 1736,890)
Shares outstanding at the end of the period 6,698,261 1,592,477 1,920,175 2,117,603 4,162,208 303,289 731,236
Private Class Dividend shares S h m s outstanding a: beginning of the period Shares isshed Shares redeemed
Shares outstanding at the end of the period
Retail Class shares
Sbares issued 137,436 49,708 187,348 896 56,642 4250 3,618 S h i e s redeemed (90.969) (773) (19,285)
Share5 outs'anding at beginning or the pprioo 59,080 4,027 10,544 44,105 2.01 1
Shares outstanding at the end of the period 105,547 52,962 197,892 896 81,462 4,250 5,629
Institutional Class shares Shares outstanding at beginning of the period 150,069 101,047 48.81 o 65,917 126,586 107.693 333,502 Shares issued 19,353 108,135 298 181 75,553 696 13,077 Sharps rerlperwcj (7.1 58) (1,636) (57)
Shares outstanding at the end of the period 162,264 209,182 49.1 08 66,098 200,503 108,389 346,522
56 The xcornpmy.rq notes form a i ntegra par: of tbcrr f i n a r m rater-ier.15

Statement of Operations Unaudited Report
For the six months ended 30 June 2004
European European EUK GBP USD AAA Bond AAA Bond Global AAA
Reserve Reserve Reserve Fund Fund Bond Notes Fund Fund Fund Long Term Short Term Fund
EUR GBP USD EUR EUR US0
Income Bank interest 123,891 91,724 18.901 1,676 Bold interest 537.552 701,759 47,500 1,207,859 2,550,580 370,560 Net dividends 333 Other income 13,710 3,558
Total Income 661,443 793,483 66,401 1.207.859 2,564,290 376.1 27
Expenses Administration & Domiciliary fees Audit fees Bank interest Custodiaq fees Investmeiit adviser fees Luxembourg tax Other exp~rses
3 46,116 37,462 12,040 137,682 246.1 88 59,035 2,614 2,150 675 3.093 4,642 1,126
588 1,728 3,502 2,425 770 61 5 7.794 3,293 642 4.457 7.672 1,751
4 127,241 96,701 75,960 193.297 346.1 18 78,741 5 2,512 2,023 570 13,053 24,129 5,355
14,497 12,826 3,710 25,495 45,814 10,674
Total Expenses 196,961 Jb, 1 ! 8 3 47.099 379,502 675,333 157,297
Net investment income/(loss)
Net profit/(loss) realised Investment oortfolio Foreign exchange and :u:urer
Net changes in unrealised result Investment portfolio Foreiqn exchange and futures
464,481 637,300 19,302 828.357 1,888,957 218,830
(121,968) 68,170 (8.134) 333,933 (397,092) 161.21 3 (32.124)
5,442 (437,357) (827.162) (1,068,533) 10,691 15,716 2 12,623
Result on operations 353,204 721,186 16.610 724,933 664,703 (507.991)
Net receipts from issue of shares 31.221.81 1 6,729,033 35,631,218 14,740,323 30,558,081 4.106.790 Net payments from redemption of shares (15,946,926) (12,287,569: (39,424,153) (7,022,055) (15,217,191~ (1,318,669) Dividecds paid 6 (5,682; - (138,581)
Change in Total Net Assets for the period 15,274,885 (5,564,218: 13,792,935) 7,718,268 15,202,309 2,788,121
Net Assets at beginning of the period 46,746.1 51 42,283,892 14.018.962 52,071,506 89,701,659 22,127,099 Foreign exchange valmtion moverrient
Total Net Assets 62,374,240 37,440,860 10,242,637 60,514,707 105,568,671 24,407,229
57

Statement of Operations and Changes in Net Assets (continued)
For the six months ended 30 June 2004
Notcs
Income Bank interest Borid interest Net dividends Other mnmP
Emergirg Mdrke:s
Bond FLnd 1150
29,787 10,240,252
European Corporate
Bonc Funu
E l J R
914 74,801
1,592
G l o m Global Balanced Corivertidej
Fu id Fund 115D USD
716 264 506,807 3,668,167 164,605 948,299
53,302
Unaudited Report
American As a-Pacific Equity Equity tLnd Funo lJSD USD
540,734 760,079 17,156
Total Income 10,270,039 77.307 672,128 4,670,032 540,734 777,235
Expenses Administration & Domiciliary fees Audit fpes Bank interest Custodian fees Investmerit ddvi5er fees Luxembourg tax Other expenses
3 1,020,212 57,396 102,799 1,069,430 272,194 142,050 19,142 999 1,902 I 8,876 4,379 2,145 30,115 242 13,222 4,517 2,102 1,340 18,713 1.61 6 2,414 22,308 3,048 1 1,739
4 1,203,851 122,895 129,785 1,359,447 558,239 265,895 5 18,531 4.7 18 2,500 25.81 5 20,533 9,058
152,294 9,567 17,517 177,879 43,290 27.31 9
Total Expenses 2,462,858 197,433 270,139 2,678,272 903,785 459,546
Net investment incorne/(loss)
Net profit/(loss) realised Investment pnrt'nlio Foreign exchanqe and futures
Net changes in unrealised result Investment portfolio Foreign exchdrige and futures
31 7,689 7,807,181 ( 1 20,1261 401,989 1,991,760 (363.051
(10,613,723) 868,358 2 252,761 29.1 15,957 3,059,896 1,784,489 57,398 (142.397) (16.41 5 )
(13,086,897) (217.531) (1,849,921) (20,937,326) (650,918) (5,628,253) 3,828,429 (85.536! (1,129,914)
Result on operations (12,007,612) 302,768 (341.500) 10,170,391 2,045,927 (3,526,075)
Net receipt5 from issue of shares 2,070,005 6,261,390 1,024,021 73,741,300 69,394,056 27,294,088 Net payrnents from redcmption of shares (31,565) (1,273,790) (365,683: (8,649,966) (24.441.91 6) ( 1 3,030,968) Dividends paid 6 - (259,908)
Change in Total Net Assets for the period 2,038,440 4,727,692 658,338 65,091,334 44,952,140 14.263.1 20
Net Assets at beginning of the period 373,849,178 19,030,383 36,687,109 356,139,999 81,522,087 41,310,798 Foreign exchange valuation movemen:
Total Net Assets 363,880,006 24,060,843 37,003,947 431,401,724 128,520,154 52,047,843
58 Tlie accorrpanynq 1o:es iorw an Integrzl nart of thrw % a n m hie'nents
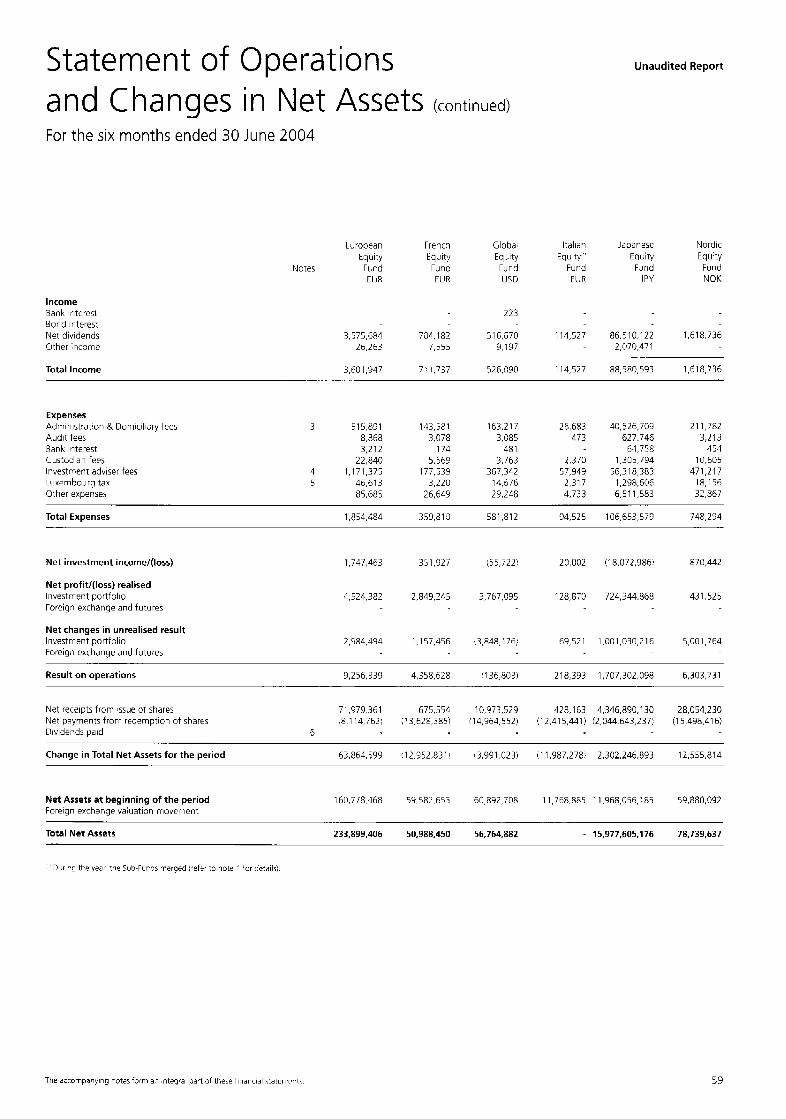
Statement of Operations and Changes in Net Assets (continued)
For the six months ended 30 June 2004
Income Bank interest Bond interes: Net dividends Other ncornc
turooean Frenci Globa; tquity EqJlt!/ EqLity
Notes Fi.rd Func Funt-l C l i R EUR US0
223
3,575,684 704,182 516.670 26,263 7,555 9,197
Unaudited Report
ltdlian Japanesc Nordic Equity EaLity Equ:ty
Fund FJnd Fund EUR J PY NOK
114,527 86,510,122 1,618,736 - 2,070,471
Total Income 3,601,947 7', 1,737 526,090 114,527 88,580,593 1,618.736
Expenses Administrat'on & Domiciliary tees Audit fees Bank interest Custodial feps Investment adviser fees Luxmbourq tax Other expenses
3 515.891 143,581 i 63.2 17 26,683 40,526,709 211,782 8,868 3,078 3.385 473 627.746 3,213 3,212 174 48 1 64,758 454
22,840 5.569 3,763 2,370 1,305,794 10,605 4 1,171,375 177,539 367,342 57,949 56,318,383 471,217 5 46.613 3,220 14,576 2,317 1.298.606 18,156
85.685 26,649 23,248 4,733 6.51 1,583 32,867
Total Expenses 1,854,484 359,810 581.812 94,525 106,653,579 748,294
Net investment income/(loss)
Net profit/(loss) realised Investment portfolio Forcign exchange and futures
Net changes in unrealised result Investment portfolio Foreign exchange and futures
1,747,463 351,927 (55,722) 20,002 (18,072,986! 870,442
4,524,382 2,849,245 3,767,095 128,870 724,344368 431,525
2,584,494 1.1 57,456 \3,848,176: 69,521 1,001,030,216 5,001,764
Result on operations 9,256,339 4,358,628 ( I 36,803) 218,393 1,707,302,098 6,303,731
Net receipts from .ssue of shares Net payments from redemption at shares Dividends paid
71,979.361 675.55L 10,973,529 428,163 4,346,890,130 28,054,230 ,8,1 14,762: ('3,628,385: (14,964,552) (1 2.41 5,441) (2,044,643,237: (1 5,498,416)
6
Change in Total Net Assets for the period 63,864,599 !12,952,831~ 13,991,0233 (,I 1,987,278i 2,302,246,893 12,555,814
Net Assets at beginning of the period Foreign exchange valuation movement
160.7/8.468 59.582.653 60,892,708 11,768385 11,968,056,185 59,880,092
Total Net Assets 233,893,406 50,988,450 56,764,882 - 15,977,605,176 78,739,637
59

S ta tern en t of 0 pe ra t ions and Changes in Net Assets (continued)
For the six months ended 30 June 2004
Notes
Income
Bond :nleresL Net dividcids Other income
Bd’lK I r l % T S t
Unaudited Report
Emerging European Spanish UK Courtries Coriverymce Eurcpean Equity’. Equity Equity Equity Property
Fund Fund Fund Fund tund EUR t i B P USD EUR EUR
1 1,400 3,999 703
43,071 22 1,294 12,594,341 750.722 826,566 145.973
European Smaller
Companies Equity Fund EUR
529,639 5,560
Total Income 43,071 232,694 12,744,313 760,722 827,269 535,199
Expenses Admiristratiori R Dorriicilia:y {PPS 3 10,848 55,033 2,665,790 105.743 81,738 86.975 Audit fccs 220 943 47,762 1,614 ’ ,267 1.61 1 Bank iiteres: 97 38 18,289 965 5.008 2,643 Custodiar. iees 846 180 280,679 30.61 3 2,342 7,934 lnvestmert advise, tces 4 22,005 108,290 3,732,827 204,662 152,684 209,924 Luxembourg :ax 5; 878 3,886 53,703 5,035 3,724 6.42 1 Other expenses 1,716 9,276 536,392 17,285 12.371 16.460
Total Expenses 36,610 177,646 7,335,442 365.91 7 259,134 331,968
Net investment incorne/(loss) 6,461 55,048 5,408,871 394,805 568.135 203,23 1
Net profit/(loss) realised lnvestmert portfolio Fore gn exchdnge and fJtdres
Net changes in unrealised result Iriwstrriert ~iortfolio Foreign exchange ano futures
383,955 1,280,099 88,007,659 841,695 581,333 5,097,423 ~ (179,437)
(245,8811 (1,023,353; (1 14,463,659) 5,864,328 2,977,360 (955,184) - (139,970)
Result on operations 144,535 31 1,794 :21,047,129) 7,100,828 3,807,421 4,345,470
Net receipts from issue of shares Net payrnent5 from redemption of shares Div dends paid
805,455 3,631,137 208,053,466 11,735,529 19,971,771 5,035,855 (5.1 63.433) i’,030,819) I1 30,650,473) (8,534,034) (6,339,903) (1 9.81 2,489)
6 (60)
Change in Total Net Assets for the period (4,358,038) 2,600,318 77,402,993 3,201,495 13,63’,868 (14,776,634)
Net Assets at beginning of the period Foreign exchange valuation moverrent
4,213,503 18,513,956 933,533,259 31,342,199 23.244308 33.651.509
Total Net Assets - 21,426,068 989,889,123 41,644,522 40,684,197 23,220,345
60 - l e accorrnm:Nng io:er fnr? an integral nx* of these f i iancial stater-ierit5

Statement of Operations Unaudited Report
For the six months ended 30 June 2004
Income Bank interest Bold interest Net dividends Other income
European
Respmsibie Equity
Notes Fund EUR
Socially
865
27 1,903 2,213
tilobal turopean Socia:ly
Value Responsible Equity Eqdity Fund t m d FUR USD
134
609,701 143,120
Global Themes
Equity Furd Consolidated Consolidated USD EUR GBP
180 326,008 2 18,774 - 17.61 7,959 1 1,822,884
365,044 21,799,622 14,629.072 261,062 175,191
Total Income 274,981 609,701 143,254 365.224 40,004,651 26,845,921
Expenses Administratior) & Domiriliary fees Audit fees Bank interest Custodidri fees Investment adviser lees Luxembourg tax Other expenses
3 43,576 84,901 42,770 129,723 6,728,692 4,515,423 75 1 1,232 751 2,330 124.21 1 83,354
670 73 5c.3 81,465 54,669 2.136 2,753 932 3,041 397,342 266,644
4 86,3 70 163,617 60,983 183,133 10,375,313 6,962,561 5 2,3: 0 4,076 1.01 3 2.779 266.890 179,102
7,068 10,954 6,909 21,768 1,209,113 81 1,399
343,277 19,183.026 12,873,152 Total Expenses 142.21; 268,173 1 13,431
Net investment income/(loss)
Net profit/(loss) realised 1nves:ment portfolio Foreign exchange and tutures
Net changes in unrealised result Investment portfoiiu Foreign exchange d'id futures
132,770 341,528 29.823 21,947 20,821,625 13,972,769
194,016 650,501 834,955 2,785,618 123,121,750 82,623,313 - (314,547) (21 1,083)
1 , l 15,349 609,766 ( 1 51,893) (2,389,803) ( 1 16,197,675) (77,976,774) - 2,169,113 1,455,627
Result on operations 1,442.1 35 1,601,795 71 2,885 41 7,762 29,600,266 19,863,852
Ne: receiots from issue of share5 Net pdyvients from redemption of shares Dividends paid
738,370 29,703,909 727,576 3,661,354 634,664,104 425,904,040 (302,3593 (1.91 6,9401 (425,958) (2,052,246) (346.41 8,127) (232.470.81 2)
G - (407.016) (273.136)
Change in Total Net Assets for the period 436.01 1 27,786,969 301.618 1,609,108 287,838,961 193,160.092
Net Assets at beginning of the period Foreign exchdnqe valLation rrovement
14,274,793 20,962,342 14,430,796 45,574,255 2,320,164,065 1,638,707,538 64,100,908 (38,698,844)
Total Net Assets 16,152,939 50,351,106 15,445,299 47,601,125 2.701.704.200 1,813,032,638
The drronpanying rote5 'om an integra ux: of thcre f i ia rc ia l n t e m e r t s 61

Notes to the Financial Statements As at 30 June 2004
Unaudited Report
1. Description of the Fund
Aviva Funds is a Variable Capital Investment Company (Societe d'lnvestisscment a Capital Variable. the "Fund") established in the Grand Duchy cf Luxembobrg under Par; I of the law ot 30 Marcli 1988. The Fund was iicorpo- rated in Ldxembourg on 16 January 1990 for an unlim.ted period
The Fund comprises 26 Sub-Funds, all opened io suxc,iptions. The Fund ooerates as an open-ended investment Fund Shares are issued in different share classes, the Private class (P class), the Retail class i R class) and the Institutional class (I class' The Retail class is only made available in ccr:ain jurisdictions by decision of the Board ot Directors and the lnstitutiorlal :lass is restricted to institutional investors, as this term may be deficed by guide- lines issued by Luxembourg supervisory authoritie5 !"Institutional Investurs"). Each dxcr ip t ion to ttie Fund is made to an individual Sub-fund Share Class and not to the Fund as a whole.
Sha'e Classes Retai Priva:e Irlstltutlorlal
Ic:drr,Llat 01 8har.s Dliidend SI-a,es ?1 Not nvailnhlp P' P2 I1 Nat abailzble
Following a decision of the Board of Directors, Italian Equity Fund and Spanish Equity Fund merqeo into European Equity Fund on 17 May 2004, As of that date, shares car1 be rio longer be subscribed or coriverted into Italian Equity Fund or Spanish Equity Fund, which ceased to exist on 17 May 2004
2. Summary of significant accounting policies
The accouritirig policies of the Fund are in accordance w t h Luxembourg regulations. The consolidated financial statements of Aviva Funds represent the sum of the fiqancial statements of each Sub-Furid of Vie Fund The conso- lidated financial statements die presented in Euro by translating the financial statements of each Sub-Fund using the exchange rates prevailing at :he balance sheet date.
The exchange differeice resu'ting from the :ransla:ion of net assets at the beginning of the year using :he year-end rates 1s recognised .n the coisoliaated statement o: chaiges in net assets uqder the caFtion 'Foreigq exchange valuation movemen:'.
2.1 Foreign currencies
The financial statements of eack Sub-Fund of the Fund are expressed in the currency of the Sub-Fund and its accounting records are maintained in that currency. Assets and liabilities in other currencies are translated iritu the currency ot the Sub-Fund using the exchange rate ir i effect at the balarice sheet date. Income and expenses in other currericies are translated into the currency of the Sub-Fund at the exchange rate in effeci 01 the date of the transaction.
The resulting excharige differences are recorded ir the statement of operations and changes in net a w t s
2.2 Valuation of assets
The value of the assets of the Fund is determined as follows:
(1) The value of any cash in hand or on deposit, bills and demarid riutes, accounts receivable, prepaid expenses, cash dividends and interest declared or accrued die deemed to be the full amount therecf. unless there is doubt about the full value to be received, in which case the value is arrived at after making s!irh dixount as the Board may consider appropriate to reflect the true value,
(2) The value of all securities, which are quoted or dealt in on any stork exchariye, is based on thc 30 June 2004 at 13:OO (CET) prices, which is the latest net asset ,value calculated dLring the period. If there is more than one stock exchange on which the 5ecurities are traded or admitted tor trading, the value of any such security will normally be determined from prices ascertained trom the stock exchaige which 15 the p-incipal stock exchange for such security:
(3) Short term investments having maturity of 4x months or less are valued at cost which. when combined with accrued interest included in the receivables, approximates to market value;
(4) The value of any securities or assets traded on avy other organised market is determined in the same manner as outlined in 2 2 (2);
(5) The value of securities which are not quoted or dealt in on any stock exchange or other organised market as determined by the Board or its authorised agent. is based on the reasonably foreseeable sale prices deterrriined prudently and in good faith by the Board:
62

Notes to the Financial Statements (continued) UnauditedReport
As at 30 lune 2004
(6) In circumstances where the Bodrd is of the view that the value of any securities quoted or dealt in on any stock exchange or dealt in on any organised rmrket ds deterrritried in 2.2 (2) does not reflect the fair value of such assets, the Board may by other means determine t:ie value;
(7) Futures contracts The Fund on behalt of a Sub-Fund may enter into financial futures coritrdct> as part of i ts investment strateyy. Upon eqtering into a futures contract, the Fund is required to deposit w t h a broker an amount i,'initial margin'j euudi tu a wrtain percentage of the purchase price indicated in the futures contract. Subsequent paymen:s ('variation margin') are made or received by the Fund each day, depending on the daily lluctudtiuns in the v a l w of the underlying futures contracts These subsequent paymerits are recorded for finan- cial reporting purposes as urirealised result by the Fund. When entering into a closing transaction, the Fund will redlise. for hook pu-poses, a gain or :os5 equal to the difference betweeri the value of the futures contract to sell and the fdtures contract to buy. Futures contracts are valued at the last sale price or, in the absence of a sale, the mean betmeen the closing bid and Asked quutdtiori or if no bid or asked prices are available. at the last bid price. Certain risks may arise upon enterirg imo futures contracts froni the contingency of imperfect market conditions
(8) Forward toreign cJrrency exchdnqe tmritracts All Sub-Funds in connection with the portfolio purchases and sales of securities denominated in a foreigri currency, may enter into forward 'oreign currency exchange contracts for the pdrposes ot hedging foreign curfency w h a n g e r,sks. Contracts are recorded at market value based on the exchange :ate cf ?he undcrlying currency o r the valuation day Certain risks may arise upon entering into these corltracts from the potential inab,lity of counter pdrties to meet the terms of their contracts. Realised gains or losses arisir:y from shch transactiors are included in net profiW(loss) redlised on foreign exchange
2.3 Treatment of interest income and dividends
The assets of each Sub-Fund include,
(1) All stock, stock dividends, cash dividends dnd rash distributions receivable by the Sub-Fund to the extent infor- mation thereon is reasonab!y available to the Fund;
(2) All interest accrued on any interest bearing securi!ies owried by the Fund except to the extent that it is included or reflected ir i the principal amount ot such security.
3. Administration and Domiciliary fees
The Fund pays to the Adm!nistrativc Agent d fee based on the aggregate net asset value of each Sub-Fund fur the administrative services provided. Each Sub-Fund pays :o the Corporate a i d Domiciliary Agent, Aviva Corpo- rate Services S.A a company wholly owried by Aviva Fund Services S.A , a fixed fee of EUR 3,OOC per annum The fees are calculated and accrued each dedliriy day and are payable monthly in arrears
4. Investment adviser fees
The Investmen: Adviser receives fro^ the Furc ij fee based or. the net asse: value, the fee is ca lchted and accrued eacti dezling day and '5 payable mon:kly in arrears.
h w t e C l a 5 0 50 3 70 I .25 1.25 1 5 0
Retail Class inrfitiitional Class 0 75 0.25 ; 00 0 35 1 7 5 0 6s 1 7 5 0 65 2 00 0 75
5. Taxation
Clds~ P1, Class P2 and Class R1 of eaLti Sub-Funds, except Reserve Funds, are liable in Luxembourg to a tax of 0.05% per annum of t k net assex attributable to these share classes. Class I1 shares of each Sub-Fund, and all share classes of the Reserve Funds, are liable in Luxembourg to a tax of 0.01 % per annum of the net assets attri- butable to these shares classes. Such tax is payable qudrterly and calculated on the total net asset value of each share class at the end of the releiant quarter.
Dividends, interest and rapital gains on invcstments Held by the Fund may be subject to non-recoverable tax and wthholding and Capital gains Ldxej in the country of origir.
63
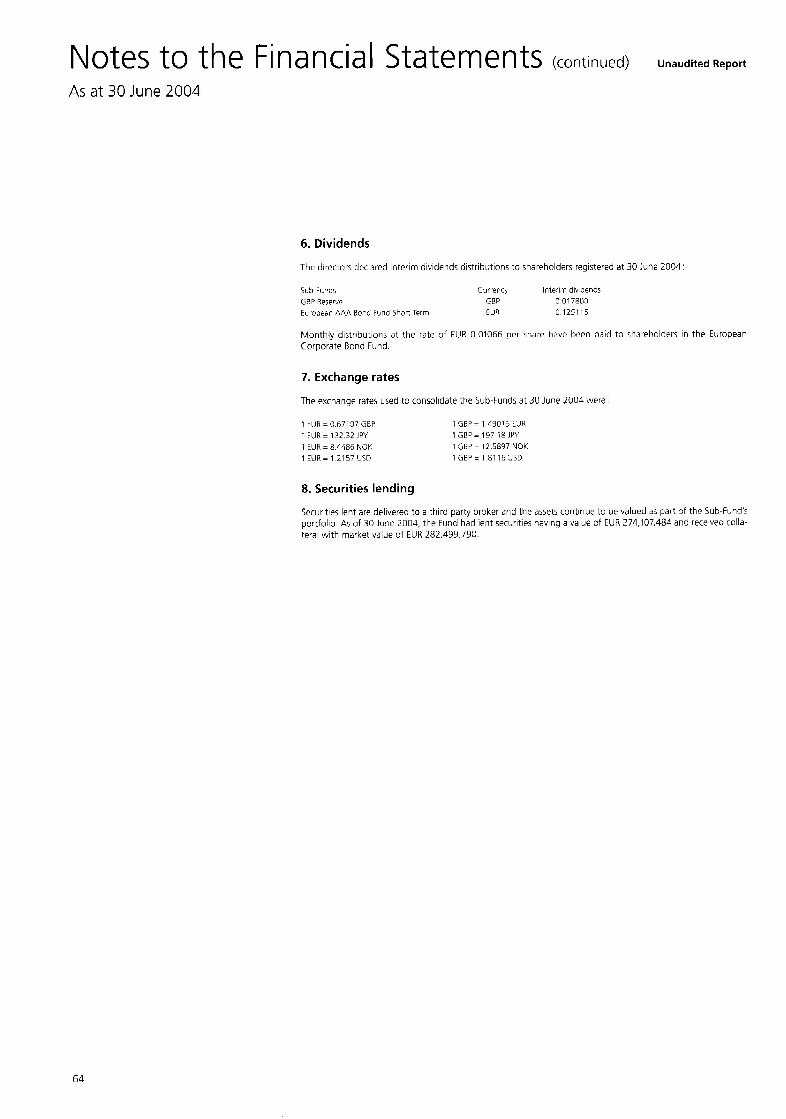
Notes to the Financial Statements (continued) UnauditedReport
As at 30 June 2004
6. Dividends
The directors declared Interim dividends distributions to shareholders registered at 30 June 2004'
Sua-Fwcs CJrrevcy 1nte:i.n div cfnds G R P Rerer';~ GBF 3 01 7803 European AAA Borc Furd Shor: Term ELI? 0 125115
Monthly distributions at :he rate of ElJR 0.01066 per share hdve been paid to shareholders in the European Corporate Bond Fund.
7. Exchange rates
The exchange rates used to consolidate the Sub-Funds at 30 June 2004 were
1 !Ill3 = 0 67107 GBP ' FlJR = 132 32 JPY 1 EUR = 8.4486 NOK 1 EUR = 1 2157 YSD
1 G6P= 1 490'5 L:JH 1 GBF= 191 1s JVY I S H Y = I2 5897 NOK 1 GBP = 1 61 1E JSD
8. Securities lending
Securities lent are delivered to a third party broker and the assets continue to be valued a i part of the Sub-Fund's portfolio As of 30 June 2004, t k Fund had ient securities having a value of EUR 274,107,484 and received colla- teral with mxket value of EUR 282,499,790.
64

Aviva Funds PO Box 1586, L-1015 Luxembourg Registered Address 34 a v w w de la Liberte, 4th floor, L-1930 Luxembourq Registwed in Luxembourg No 832640
www avivafunds com E-mail helpdesk8avivafunds.com Telephone + (352) 40 28 20 261