avner offer, rachel pechey and stanley ulijaszek · obesity under affluence varies by welfare...
TRANSCRIPT
OBESITY UNDER AFFLUENCE VARIES BY WELFARE REGIMES: THE EFFECT OF FAST FOOD, INSECURITY,
AND INEQUALITY
Avner Offer, Rachel Pechey and Stanley Ulijaszek
U N I V E R S I T Y O F O X F O R D
Discussion Papers in
Economic and Social History
Number 82, July 2010

1
OBESITY UNDER AFFLUENCE VARIES BY WELFARE REGIMES: THE EFFECT OF FAST FOOD, INSECURITY, AND INEQUALITY
Avner Offer a, Rachel Pechey b, Stanley Ulijaszek b
a All Souls College, University of Oxford, OX1 4AL, UK b Institute of Social and Cultural Anthropology, University of Oxford, OX2 6PE, UK
Email: [email protected]; [email protected];
Accepted for publication in Economics and Human Biology
Abstract
Among affluent countries, those with market-liberal welfare regimes (which are also English-speaking) tend to have the highest prevalence of obesity. The impact of cheap, accessible high-energy food is often invoked in explanation. An alternative approach is that overeating is a response to stress, and that competition, uncertainty and inequality make market-liberal societies more stressful. This ecological regression meta-study pools 96 body-weight surveys from 11 countries c. 1994-2004. The fast-food ‘shock’ impact is found to work most strongly in market liberal countries. Economic insecurity, measured in several different ways, was almost twice as powerful, while the impact of inequality was weak, and went in the opposite direction.
Acknowledgments
We are grateful for good comments to the Economics and Human Biology journal referees, to Michael Lipton, and to participants at the Obesity and Welfare Regimes conference at Oxford in November 2009, as well as at several other seminars and conferences. Financial support was provided by the BUPA Foundation and by a British Academy Conference Grant. The Economist generously provided Big Mac index data.
2
1. Introduction
Body-weights have risen substantially in affluent countries during the last three decades. In the United States by 2000, nearly two-thirds of the population were ‘overweight’ (BMI>25 kg/m2) and almost one-third were ‘obese’ (BMI>30 kg/m2) (Wang et al., 2008). Similar increases happened quite rapidly, at different levels and rates, in most affluent countries (International Obesity Task Force, 2010). Obesity is harmful to health. It is seen as unattractive and is known to be stigmatising (Latner et al., 2008; Puhl and Heuer, 2009). The literature on obesity is large and covers many disciplines, but there is little agreement about causes. Recently there were seven different models of population obesity (Ulijaszek, 2007). A British government consultation (the Foresight report) has produced causal diagrams of staggering complexity (Butland et al., 2007, figures 5.2-5.5).
Country rankings of obesity indicate that a cluster of wealthy English-speaking countries have a higher prevalence of obesity than other affluent countries with similar levels of income (e.g., Delpeuch et al., 2009, figure 1.3). We seek to confirm this observation, to provide an explanation, and to support it with data. The data we use consist of ninety-six body-weight surveys undertaken in eleven countries between 1994 and 2004. It is an ecological regression meta-study, which pools many surveys over a short period of time. These confirm that English-speaking countries form a cluster of their own with regard to obesity. There is separate evidence that over-eating may be a personal response to chronic life stress (Torres and Nowson, 2007). English-speaking countries have gone further in the direction of unregulated market liberalism than other affluent societies. Our hypothesis is that market-liberal countries have an environment of greater economic insecurity, and that this is the source of the stress that drives higher levels of obesity. The institutional structures that neoliberal societies put in place promote insecurity and inequality (Lazzarato, 2009), while work-related insecurity, including low income, poor job mobility and absence of union protection, elevates the likelihood of stress and ill-health (Scott-Marshall, 2010; Nakao, 2010). Responses to stress, in turn, include overeating (Greeno and Wing, 1994) and preferences for high energy-density foods (Oliver et al., 2000), both of which are implicated in the causation of obesity (Björntorp, 2001).
In this study, insecurity is a predictor for obesity. But the opposite may also be the case. Obesity can be measured objectively and is difficult to hide. Disorders like stress and anxiety are not easy to identify, diagnose, and observe. They are not often recognised as attributable to market liberalism. Richard Sennett has written of ‘the hidden injuries of class’ (Sennett and Cobb, 1972). If the link with stress and insecurity is established, then the epidemiology of obesity might be used as a diagnostic for these less visible disorders. That is one of the promises of this line of investigation.
The concept of welfare regimes comes from Esping-Andersen (1990) who made a distinction between the Nordic social democratic model of welfare, the continental European family-oriented model, and the English-speaking liberal model (also Goodin et
3
al., 1999). Since the 1980s, there has been a movement away from social democratic (or in the USA, ‘New Deal’) policy norms, towards more market-friendly policies. This matches the timing of the emergence of obesity as a mass social phenomenon (Ulijaszek and Lofink, 2006). Hall and Soskice (2001) distinguished two ‘varieties of capitalism’, on the one side six English-speaking ‘liberal market economies’ (the USA, Britain, Australia, Canada, New Zealand, Ireland), on the other ten ‘coordinated market economies’, Germany, Japan, Switzerland, the Netherlands, Belgium, Sweden, Norway, Denmark, Finland, and Austria (the Mediterranean countries Greece, Italy, France, Spain, Portugal, and Turkey were all more ambiguous). Our findings do not confirm Esping-Andersen’s threefold classification. We have not found that the Nordic countries form a statistically distinctive group. Our results are more consistent with the Hall and Soskice approach, which highlights the distinctiveness of the ‘liberal market economies’ from everyone else. It is this distinctiveness that we investigate.
In its basic form, our hypothesis is that economic uncertainty and unequal market and household experiences have increased stress, and that stress is conducive to weight gain; that market liberal reforms have stimulated competition in both labour and consumption markets, and that this has undermined personal stability and security. It has affected people more strongly lower down the social scale (Drewnowski and Darmon, 2005; Wang et al., 2008). Hence the more intensive the competitive and market orientation of welfare regimes, the higher the level of body weight, at both aggregate and personal levels. Support for this view also comes from market-liberal economists, who regard shifts in relative prices within markets as a plausible explanation of weight increase. Due to their commitment to the optimality of market outcomes, they are relatively untroubled about the rise in body weight, although its choice as a subject suggests an acknowledgement of concern (Cutler et al., 2003; Lakdawalla et al., 2005, Philipson and Posner, 2008). Obesity in their view is merely an unintended symptom of otherwise benign personal preferences and policy norms. Some stylized facts that support the hypothesis are that overweight is more common among the poor (McLaren, 2007), that weight has risen overall over time, and that there is a gradient in body weight, with the highest levels to be found under liberal welfare regimes in the English-speaking countries (Pickett et al., 2005).
These observations are consistent with two interpretations. We try to discriminate between them, and to estimate their impact. The first is the ‘food shock’ hypothesis. A supply shock was driven by the shift in provision of processed food from the home and into the market, where it has become much more accessible. The relative price of food fell, and high energy-density food, which is a staple of fast-food supply, is highly palatable (Offer, 2001, 2006; Cutler et al., 2003; Drewnowski and Darmon, 2005). One individual-level study of obesity in the USA has found that the strongest explanatory factor is the geographical concentration of fast-food outlets (Chou et al, 2004).1
1 The other variables were home food prices, fast-food prices, full-service restaurant prices, and cigarette prices.
At the

4
same time, the occupational transition from manufacturing to services, and increased motorization, have both reduced the opportunities for physical exercise (e.g., Philipson and Posner, 2003, 2008).
A second hypothesis arises from a physiological association that has been observed between stress and overeating (Björntorp, 2001; Dallman et al., 2003; Dallman et al., 2005; Drapeau et al., 2003). At the socio-economic level, two stress-inducing mechanisms have been invoked. One comes out of the ‘psychosocial’ hypothesis of socially differential morbidity and mortality in affluent societies (Marmot, 2004; Pickett et al., 2005; Wilkinson and Pickett, 2009). The source of stress is the experience of subordination, and a proxy indicator is income inequality. These authors report that higher income inequality at the national (or USA state) level is associated in the aggregate with higher body-weight (Pickett et al., 2005; Pickett and Wilkinson, 2007; Wilkinson and Pickett, 2009).
Smith (2009) and Smith et al. (2009) have proposed that the source of stress might be economic insecurity. Their point of departure is in the study of animal behaviour. Animals in the wild and in captivity respond to food uncertainty by putting on weight. Uncertainty gives rise to anxiety which prompts ‘self-medication’ by means of food. The notion of ‘comfort food’ is likewise familiar. In a similar way, feelings of uncertainty and anxiety encourage overeating. Smith speculates about the evolutionary basis and biochemical pathways of this mechanism.
Several writers have associated myopia (or time-inconsistency) with the rise in body weight (Offer, 2001; Cutler et al., 2003; Komlos et al., 2004). People whose long-term objective is a steady body weight nevertheless find it difficult to resist the temptations of weight-increasing foods. Myopic bias is a form of impatience, and hence implicated in anxiety. Myopia is exacerbated by the pace of market innovation in food provision (Offer, 2006, 144-8). The pursuit of materialism more broadly is associated with lower subjective well-being (Kasser, 2002; Kasser et al., 2004). Oswald and Powdthavee (2007, F443) have shown increasing levels of distress in the UK between 1991 and 2004. Twenge has found more than one-standard-deviation rises in anxiety levels in the USA since the 1950s, and an even larger increase in general psychopathology since the late 1930s (Twenge, 2000; Twenge et al., 2009). A large international survey of mental disorder in 2001-3 has shown prevalence in the USA at 26.3 percent, with the average for six ‘continental’ European countries at 11.9 percent – a mental-health gap even larger than the obesity gap (calculated from Demyttenaere et al., 2004).2
2 Including anxiety disorders (agoraphobia, generalized anxiety disorder, obsessive-compulsive disorder, panic disorder, posttraumatic stress disorder, social phobia, specific phobia), mood disorders (bipolar I and II disorders, dysthymia, major depressive disorder), disorders that share a feature of problems with impulse control (bulimia, intermittent explosive disorder, and adult persistence of 3 childhood- adolescent disorders—attention deficit/ hyperactivity disorder, conduct disorder, and oppositional-defiant disorder— among respondents in the 18- to 44-year age range), and substance disorders (alcohol and drug abuse and dependence).
A study of the relation between obesity and emotional disorder (using the same survey) suggests ‘modest
5
relationship between obesity (particularly severe obesity) and emotional disorders among women in the general population’ (Scott et al., 2008, 192).
Process food technologies have been available equally across the developed world. Their pace of deployment and their relative penetration provide a means of comparing and testing the supply-shock and welfare-regime approaches. Obesity levels differ among welfare regimes. It could be argued that some countries merely lag behind in exposure to the food shock. However, if the rates of growth in obesity differ between countries with different regimes, then that points towards a welfare-regime interpretation. If the rates of obesity growth are similar, then the ‘supply shock’ interpretation will appear more compelling.

6
2. Materials and Methods 2.1. Data
The surveys were identified through online databases (e.g., the WHO BMI database) and other relevant web-based searches (e.g., government statistical office websites). It was judged that for aggregated data of this type, a pooled Ordinary Least Squares (OLS) regression was the most reliable approach. This made it desirable to restrict the selection to a relatively short time frame, namely 1994-2004. This is preparatory to a panel study, which will use individual-level data in fewer countries. Many suitable surveys were conducted during 1994-2004, covering a range of countries (Australia, Canada, Finland, France, Germany, Italy, Norway, Spain, Sweden, the UK and the USA). The social investment in these surveys arose from a rising awareness of obesity as a social problem. Although measured obesity levels are preferable to self-reported weights and heights, the majority of the studies found relied on self-report. In order to create a sufficiently large dataset for analysis, both measured and self-reported data were included.
Surveys were included if: (i) They reported at least one obesity prevalence level (for males, females or both combined). Most surveys gave obesity prevalence estimates for males, females and in total, but 8 surveys only reported percentage obese for males and females combined, and a further 8 only reported for males and females separately; (ii) They had a sufficiently large sample (lowest n=979 [Finland]). Of the 96 surveys included, 27 had samples sizes up to 5,000, 22 had sample sizes of 5,000-10,000, 36 between 10,000-100,000, and 11 between 100,000-200,000 (mean sample = 28,467); (iii) They included participants with a range of ages. Minimum age generally varied from 15 to 25, although two 2001 surveys (in Finland and Norway) had a minimum age of 30, and one study in Italy in 1998 had a minimum of 35. The maximum age ranged from 64 to no limit; (iv) They were conducted over a period extending at most over two calendar years. If surveys were conducted over a period that did not tie in with one calendar year, they were categorised for analysis as being in the later year. While the majority of surveys were nationally representative, sufficiently large surveys were included even if they were only conducted in one or two towns/cities (n=8) or regions (n=6) of a country. The percentages reported as obese by these surveys are summarised by country in the
table below. The USA had the highest levels of obesity (with a mean of around 30% obese), whereas Italy, with the lowest prevalence, had almost half the levels (around 17%).
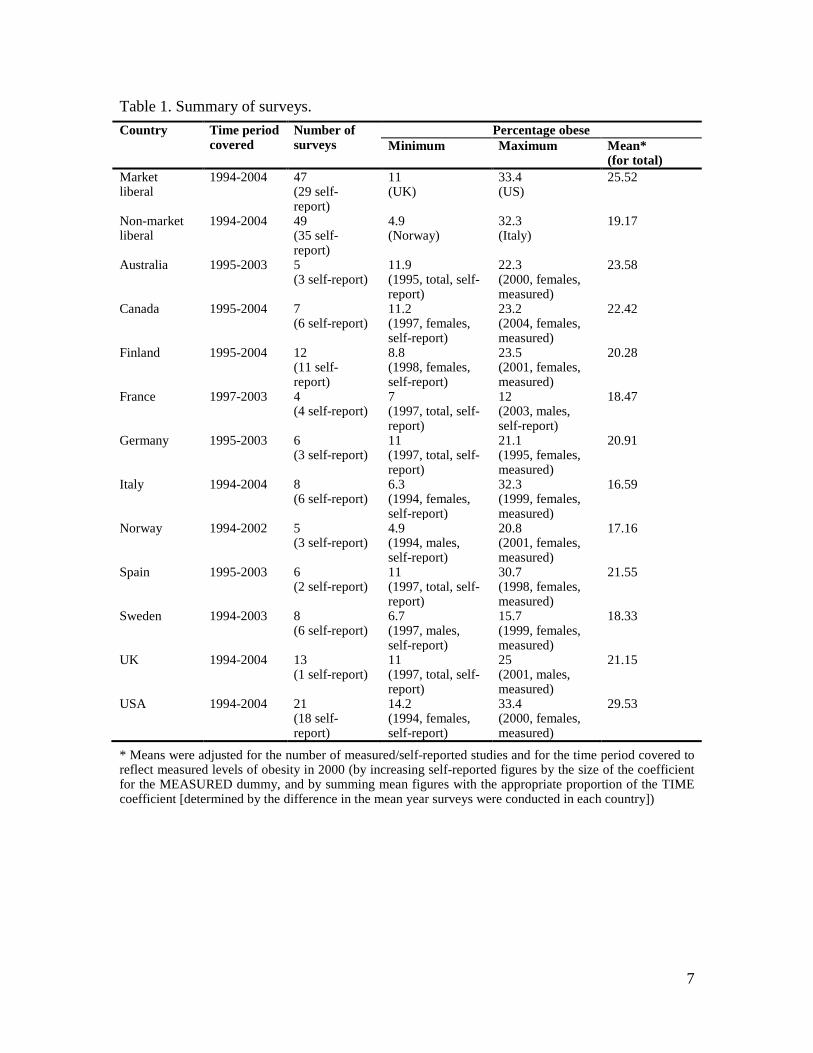
7
Table 1. Summary of surveys. Country Time period
covered Number of surveys
Percentage obese Minimum Maximum Mean*
(for total) Market liberal
1994-2004 47 (29 self-report)
11 (UK)
33.4 (US)
25.52
Non-market liberal
1994-2004 49 (35 self-report)
4.9 (Norway)
32.3 (Italy)
19.17
Australia 1995-2003 5 (3 self-report)
11.9 (1995, total, self-report)
22.3 (2000, females, measured)
23.58
Canada 1995-2004 7 (6 self-report)
11.2 (1997, females, self-report)
23.2 (2004, females, measured)
22.42
Finland 1995-2004 12 (11 self-report)
8.8 (1998, females, self-report)
23.5 (2001, females, measured)
20.28
France 1997-2003 4 (4 self-report)
7 (1997, total, self-report)
12 (2003, males, self-report)
18.47
Germany 1995-2003 6 (3 self-report)
11 (1997, total, self-report)
21.1 (1995, females, measured)
20.91
Italy 1994-2004 8 (6 self-report)
6.3 (1994, females, self-report)
32.3 (1999, females, measured)
16.59
Norway 1994-2002 5 (3 self-report)
4.9 (1994, males, self-report)
20.8 (2001, females, measured)
17.16
Spain 1995-2003 6 (2 self-report)
11 (1997, total, self-report)
30.7 (1998, females, measured)
21.55
Sweden 1994-2003 8 (6 self-report)
6.7 (1997, males, self-report)
15.7 (1999, females, measured)
18.33
UK 1994-2004 13 (1 self-report)
11 (1997, total, self-report)
25 (2001, males, measured)
21.15
USA 1994-2004 21 (18 self-report)
14.2 (1994, females, self-report)
33.4 (2000, females, measured)
29.53
* Means were adjusted for the number of measured/self-reported studies and for the time period covered to reflect measured levels of obesity in 2000 (by increasing self-reported figures by the size of the coefficient for the MEASURED dummy, and by summing mean figures with the appropriate proportion of the TIME coefficient [determined by the difference in the mean year surveys were conducted in each country])
8
2.2. Model
The basic model is (1) TOTAL_OBESEit = α + β1MEASUREDit+ β2 MARKET_LIBit + β3TIMEit + β4
ECON_SECURITYit + β5 ECON_EQUALITYit + εit The number of observations varies between countries, but each country is given the
same weight. The dependent variable is percentage prevalence of obesity (TOTAL_OBESE) for survey i at time t. Obesity is defined as BMI equal to or greater than 30. Gender-specific obesity is estimated as well (MALE_OBESE and FEMALE_OBESE). Thirty-two of the surveys used objective weight measurements, while sixty-four relied on self-reporting of body weights. MEASURED is a dummy for measured weights. MARKET_LIB is another dummy that specifies market-liberal countries in the sample (Australia, Canada, UK, USA). The TIME variable is incremented one unit per year, starting at 1 in 1994.
ECON_SECURITY and ECON_EQUALITY are continuous variables for economic security and equality respectively, taken from Lars Osberg's Index of Economic Well-Being (IEWB: Osberg, 2009). The IEWB is a multidimensional index addressing the consumption, wealth, economic equality and economic security of selected OECD countries, currently available for the years 1980-2007. Wherever possible, observed annual data are provided, and missing years are filled in by imputation. There is no reason to think that this biases the results, since change is slow. Designed to allow comparison across countries of a range of household socioeconomic indicators, each of the four major indices of the IEWB is in turn comprised of subcomponents. Two of these composite indices are of interest in the current study, economic equality and security.
The index of economic equality, derived from the Luxembourg Income Study, is comprised of the intensity of poverty, i.e., the poverty rate (percent) times the 'poverty gap' (the ratio of the gap between the poverty line and the mean equivalent income of those under the poverty line), and the inequality of income, measured using Gini coefficients (after-tax equivalised household incomes). These subcomponents are inversed, added and weighted to form the economic equality index (0.25 Gini coefficient + 0.75 times the poverty intensity scale). This index is used as our variable ECON_EQUALITY, which is scaled up from 0-1 to 0-100. One component of the economic equality index is also later investigated as an alternative specification of economic equality, namely the inversed Gini coefficient (variable INVERSE_GINI).
The index of economic security is a weighted composite of four sub-indices: security from unemployment, illness, single-parent poverty, and poverty in old age. Security from unemployment and from illness are derived from OECD statistics and security from single-parent poverty and from poverty in old age from the Luxembourg Income Study. Security from unemployment is constructed from the unemployment rate and the proportion of earnings that are replaced by unemployment benefits, and single-parent and old age poverty from the prevalence of these conditions and poverty intensity. Security
9
from ill health is represented by the share of private expenditure on healthcare in personal disposable income. These four components are weighted by the relative sizes of the populations subject to each risk, and together are aggregated to obtain the economic security index. For this study, this index is also scaled up to 0-100, forming our variable ECON_SECURITY. The economic security components are also investigated separately in a later analysis. Both variables derived from the IEWB are of comparable magnitudes (ECON_SECURITY ranges from 31 to 81, ECON_EQUALITY from 16 to 89). The observations are pooled, and the regression method used is OLS. Osberg indicates which data points are observed, and which are derived by imputation.

10
3. Results The main findings are reported in Table 2.
Table 2. Obesity and economic security and/or equality (1) (2) (3) (4) (5) (6) VARIABLES total_obese male_obese female_obese total_obese male_obese female_obese MEASURED 9.093** 7.965** 9.643** 9.144** 7.836** 9.497** t-statistic (6.849) (9.761) (8.993) (6.833) (9.629) (8.625) beta 0.646 0.670 0.687 0.650 0.659 0.676 MARKET_LIB 4.106** 3.101** 2.120 3.598* 2.672** 1.859 t-statistic (2.667) (2.745) (1.316) (2.511) (2.642) (1.292) beta 0.327 0.271 0.157 0.286 0.234 0.138 TIME 0.477** 0.539** 0.465** 0.523** 0.559** 0.460** t-statistic (4.133) (4.796) (3.349) (4.494) (5.215) (3.110) beta 0.222 0.279 0.204 0.243 0.290 0.202 ECON_SECURITY -0.279** -0.262** -0.262** -0.266** -0.244** -0.248** t-statistic (-8.995) (-7.857) (-6.904) (-8.623) (-8.500) (-7.235) beta -0.718 -0.742 -0.630 -0.685 -0.692 -0.595 ECON_EQUALITY 0.0726** 0.0434 0.0124 t-statistic (2.872) (1.376) (0.291) beta 0.261 0.170 0.0412 INVERSE_GINI 0.0528* 0.0226 -0.00304 t-statistic (2.575) (0.867) (-0.0859) beta 0.201 0.0946 -0.0108 CONSTANT 22.29** 22.95** 25.14** 22.92** 23.17** 25.12** t-statistic (6.935) (10.55) (8.185) (7.444) (10.94) (8.653) Observations 88 88 88 88 88 88 Adjusted R-squared 0.824 0.779 0.730 0.821 0.775 0.729
Robust t-statistics in parentheses ** p<0.01, * p<0.05
The relative strength of each variable is indicated by the standardized beta
coefficients, and that is the variable of interest. The regression coefficients are, however, intuitively meaningful, although not quite comparable to each other. TOTAL_OBESE, i.e., obesity prevalence, ranges from 5 to 32 percent of the adult population. MEASURED raises obesity prevalence by about a third over this range. MARKET_LIB raises obesity prevalence by four percentage points. The passage of TIME raises obesity prevalence by about four percentage points from start to finish.
Of all the variables ECON_SECURITY has the strongest effect, as measured by its beta. A rise in economic security from the bottom to the top of its range would account for about 14 percentage points, i.e., more than half the obesity prevalence amplitude. The result for economic equality (ECON_EQUALITY) is unexpected. Wilkinson and Pickett, using bi-variate analysis (Wilkinson, 2009 and Pickett et al., 2005), found a strong relation between inequality and obesity prevalence. But in a multivariate analysis, the effects observed here for inequality have the opposite sign. The beta is low, and in the
11
case of gendered observations, it is not significant. Similar results are obtained using the INVERSE_GINI variable instead (cols. 4-6), although ECON_EQUALITY and INVERSE_GINI are quite different. The first mostly (75%) measures poverty intensity, i.e., the ratio between income in poverty and the poverty line, while the other measures inequality overall among the households sampled. This finding does not completely invalidate inequality as a cause, as we shall discuss below. Finally, gender does not seem to have a large effect. It is worth investigating further, but not in this paper.

12
4. Discussion Three putative determinants of obesity are discussed in turn: fast food shock, security, and equality. 4.1. Time and the food shock
That obesity is a response to the ‘shock’ of ever cheaper and more accessible food is the most prevalent socio-economic interpretation (e.g., Delpeuch et al., 2009). If countries differ merely in the levels of obesity prevalence, it can be argued that latecomers to obesity merely lag behind in the diffusion of the food shock, and will eventually catch up with the leaders. Thus the pace of growth of obesity prevalence offers a test of the ‘food shock’ interpretation. This hypothesis implies that non-market-liberal countries should have similar rates of obesity growth to those of market liberal ones, despite having lower levels of obesity prevalence. The period we survey is a short one, but it coincides with strong obesity growth. In table 2 above, the TIME variable captures the pace of growth over time and is both strong and significant. The ‘food shock’ hypothesis would predict no difference in the rate of growth between market liberal and other countries. This is investigated in table 3.
In column (1) (market-liberal countries), the coefficient for TIME (and the beta too) is high and significant. In the other countries this variable is neither. This argues against a ‘fast-food shock lag’ interpretation of obesity levels. Using this indicator ‘food shock’ is not a distinctive factor outside market liberal countries, but quite a strong one within them. The US-only coefficient (at 0.87) is even higher. There is something about market liberal countries that causes obesity to increase faster than elsewhere. A reasonable interpretation of the TIME variable (which measures the rise of obesity prevalence over time, other things being equal) is that it captures some of the effect of the ‘food shock’. This possibility can be evaluated further with a variable for fast-food prices. This is provided here by the Big Mac index, published for every year in the Economist, and used by generous permission of the publishers (variable BIG_MAC). The index compares prices of the MacDonald’s ‘Big Mac’ hamburger (a standard commodity item) in different countries using local currency and US dollars at the official exchange rate. Two versions of the variable were tried, one using absolute prices, the other using relative ones, i.e., taking price as a fraction of income per head. The relative price version has more statistical power, and is the one we use.

13
Table 3. The impact of the fast-food shock (1) (2) (3) (4) (5) VARIABLES total_obese
(market-liberal) total_obese
(non-market- liberal)
total_obese
total_obese (market-liberal)
total_obese
MEASURED 7.357** 10.03** 8.761** 6.256** 9.246** t-statistic (10.50) (5.268) (7.247) (5.237) (7.663) beta 0.761 0.740 0.652 0.647 0.688 MARKET_LIB 3.867** t-statistic (3.137) beta 0.311 TIME 0.743** 0.276 -0.318 0.387* 0.576** t-statistic (7.804) (1.520) (-1.839) (2.065) (3.790) beta 0.464 0.167 -0.149 0.242 0.270 ECON_SECURITY -0.194** -0.192 -0.279** t-statistic (-10.11) (-1.863) (-8.153) beta -0.741 -0.207 -0.749 INVERSE_GINI 0.0648** t-statistic (2.961) beta 0.230 BIG_MAC -0.0821** -0.0668** 0.0100 t-statistic (-4.944) (-3.193) (0.722) beta -0.424 -0.393 0.0518 CONSTANT 22.85** 21.77** 22.71** 19.51** 21.83** t-statistic (17.50) (2.951) (8.870) (7.841) (7.724) Observations 47 41 81 47 81 Adjusted R-squared 0.852 0.699 0.601 0.563 0.811
Robust t-statistics in parentheses ** p<0.01, * p<0.05
In column (3) of table 3, the BIG_MAC variable pushes the TIME variable out of significance with a high beta as well, but less clearly in market-liberal countries (col. 4). This suggests that a substantial part of what the TIME variable captures is the ‘food shock’ of declining real fast food prices, but not all of it. Figure 1 shows that BIG_MAC prices were declining over TIME (correlation coefficient -0.645). The price of BIG_MAC was lowest in the highest-obesity countries, namely the USA, Canada, and Australia.

14
Figure 1. Big Mac relative price over time
But ‘food shock’ was not a matter of price alone: it also exposed people to intensive marketing, and saved them cooking and shopping time. Once ECON_SECURITY is reinstated, BIG_MAC is again dominated by TIME (col. 5). Comparing betas however, this food shock variable (TIME) has just over a third of the power of economic security (ECON_SECURITY).
4.2. Insecurity
The welfare regime hypothesis is that stress induces insecurity, and that insecurity induces over-eating. Trenton Smith (Smith, 2009) has shown that animals in the wild respond to stress by putting on weight. There is also evidence that people put on weight in response to stress, whether associated with subordinate status (Marmot, 2004), inequality (Wilkinson and Pickett, 2009), work insecurity (Hannerz et al., 2004) or financial insecurity (Gerace and George, 1996). In a recent study, Smith and his collaborators (Smith et al., 2009) have used the American National Longitudinal Study of Youth to show that insecurity, measured in several different ways, predicted a rise in body weight. In the United States, high levels of obesity are associated locally with high levels of food insecurity. The United States Department of Agriculture has stopped using the term ‘hunger’ in its reports, and uses ‘food insecurity’ instead (Dolnick, 2010).
FIN
SWE
AUS
USSPA
US
CAN
CAN
FINSWEFIN
SPA
SWE
FIN
FRA
ITA
FRA
CANUS
SWE
FIN
AUSUS
ITA
UK
CAN
GER
SWE
FRA
FINSWECAN
ITA
US US USAUS
FRA
US US USUSUS
USUS
US
CANITA GERUSUS
ITA
GERUS
NOR
ITA
US
UK
AUS
GER
NOR
UK
ITA
UKUK
UK
UK UK
US
SPA
SWE
SPAGER
UKITA
SPA
FIN
SPA
UK
UK
USCAN
GER
UK
UK
SWE
US
AUS
5010
015
020
0Bi
g M
ac re
lativ
e pr
ice
1994 1996 1998 2000 2002 2004Year
Observed Predicted

15
As we have seen, Osberg’s ECON_SECURITY variable is the strongest predictor of obesity prevalence (Table 2; also Table 3, col. 1). The United States was an outlier, with high levels of both economic insecurity and of obesity. Nevertheless, the effect of insecurity remains when the United States is taken out (table 4, cols. 1-2 for men and women; the composite variable was almost significant (p>0.052)).
Table 4. The contribution of the US and of individual security components
(1) (2) (3) (4) VARIABLES male_obese
excl. USA female_obese
excl. USA total_obese total_obese
MEASURED 7.487** 9.377** 8.853** 8.720** t-statistic (9.456) (8.277) (6.298) (5.946) beta 0.715 0.751 0.629 0.620 TIME 0.533** 0.440** 0.348* 0.507** t-statistic (3.867) (2.772) (2.369) (3.287) beta 0.306 0.212 0.162 0.236 MARKET_LIB 2.382** 1.932 3.105** t-statistic (3.077) (1.792) (3.082) beta 0.218 0.149 0.247 UNEMPLOYMENT_SECURITY 0.247* -0.253* t-statistic (2.078) (-2.276) beta 0.201 -0.206 HEALTH_SECURITY -0.221** t-statistic (-2.830) beta -0.498 SINGLE_PARENT_SECURITY -0.275 t-statistic (-0.995) beta -0.152 OLD_AGE_SECURITY 0.0867 t-statistic (0.485) beta 0.0453 ECON_SECURITY -0.272** -0.269* t-statistic (-3.208) (-2.276) beta -0.283 -0.234 CONSTANT 26.69** 26.67** 13.40** 14.38** t-statistic (4.545) (3.151) (4.819) (5.683) Observations 66 66 88 88 Adjusted R-squared 0.738 0.689 0.775 0.547
Robust t-statistics in parentheses ** p<0.01, * p<0.05
Figure 2 shows the relation between ECON_SECURITY (the Osberg variable) and obesity prevalence. It indicates that the United States was in a class of its own: economic security was low, and obesity was high. The difference is particularly marked in the measured surveys, and is smaller in the self-reported ones.
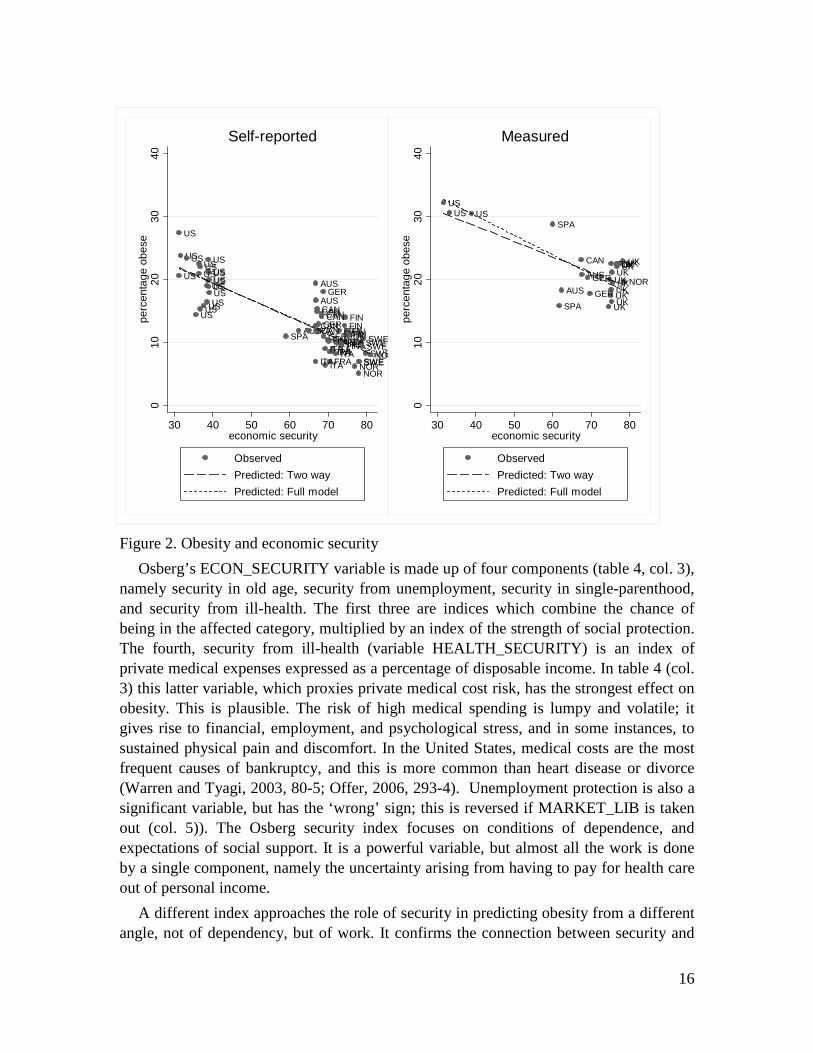
16
Figure 2. Obesity and economic security Osberg’s ECON_SECURITY variable is made up of four components (table 4, col. 3),
namely security in old age, security from unemployment, security in single-parenthood, and security from ill-health. The first three are indices which combine the chance of being in the affected category, multiplied by an index of the strength of social protection. The fourth, security from ill-health (variable HEALTH_SECURITY) is an index of private medical expenses expressed as a percentage of disposable income. In table 4 (col. 3) this latter variable, which proxies private medical cost risk, has the strongest effect on obesity. This is plausible. The risk of high medical spending is lumpy and volatile; it gives rise to financial, employment, and psychological stress, and in some instances, to sustained physical pain and discomfort. In the United States, medical costs are the most frequent causes of bankruptcy, and this is more common than heart disease or divorce (Warren and Tyagi, 2003, 80-5; Offer, 2006, 293-4). Unemployment protection is also a significant variable, but has the ‘wrong’ sign; this is reversed if MARKET_LIB is taken out (col. 5)). The Osberg security index focuses on conditions of dependence, and expectations of social support. It is a powerful variable, but almost all the work is done by a single component, namely the uncertainty arising from having to pay for health care out of personal income. A different index approaches the role of security in predicting obesity from a different angle, not of dependency, but of work. It confirms the connection between security and
FIN
SWE
AUS
US
FINSPA
US
CANCAN
FIN
SWE
FINSPASWEFIN
FRAITAFRA
CAN
US
SWEFIN
AUS
FIN
US
ITAUK
FINFIN
CAN
GERFIN
SWE
FRA
FIN
SWE
CAN
ITA
USUS
US
AUS
FRA
USUS
USUS
USUS
US
US
CAN
ITA
NOR
GERUSUS
ITA
GER
US
NORITA
NOR
US
010
2030
40pe
rcen
tage
obe
se
30 40 50 60 70 80economic security
ObservedPredicted: Two wayPredicted: Full model
Self-reported
UK
AUSNOR
UK
UKUKUK
UKUK
US
SPAGER
UK
SPA
FINUK
UK
US
CAN
GER
UK
UK
US
AUS
010
2030
40pe
rcen
tage
obe
se
30 40 50 60 70 80economic security
ObservedPredicted: Two wayPredicted: Full model
Measured

17
obesity by achieving similar results with different data and a different approach. This is the ILO Index of Economic Security (International Labour Organization, 2004). It is derived from various surveys between 1991 and 2003, i.e., the period covered by our sample (ILO, 2004), but is not available year by year, and only provides one data point for each country. Hence, it only measures differences in levels, not in trends. It is not entirely dissimilar in this respect to the Osberg ECON_SECURITY variable, where temporal variation is controlled for by the TIME variable.
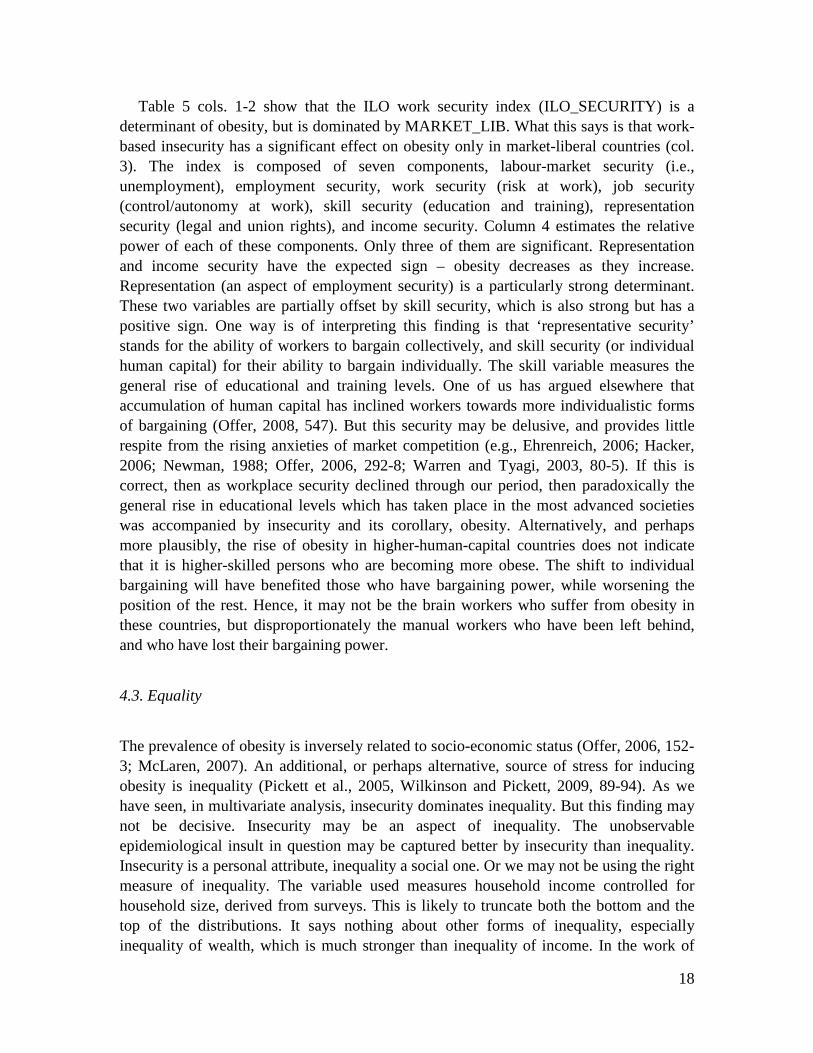
The effect of the ILO security variable are estimated in table 5, column 1. Table 5. Alternative specifications of economic security (1) (2) (3) (4) (5) VARIABLES total_obese total_obese total_obese
(market-liberal) total_obese total_obese
MEASURED 7.716** 8.424** 5.687** 8.050** 7.881** t-statistic (5.493) (7.017) (8.616) (6.005) (6.144) beta 0.548 0.599 0.588 0.572 0.560 TIME 0.458** 0.385* 0.729** 0.391** 0.408** t-statistic (3.382) (2.405) (7.489) (3.448) (4.064) beta 0.213 0.179 0.455 0.182 0.190 MARKET_LIB 4.112** t-statistic (3.006) beta 0.327 LABOUR_SECURITY -0.0606 t-statistic (-0.430) beta -0.0843 EMPLOYMENT_SECURITY 0.00396 t-statistic (0.0528) beta 0.00906 JOB_SECURITY 0.0271 t-statistic (0.422) beta 0.0388 SKILL_SECURITY 0.881** 0.768** t-statistic (5.087) (7.126) beta 0.723 0.631 WORK_SECURITY 0.0397 t-statistic (0.335) beta 0.0663 REPRESENTATION_SECURITY -0.306** -0.279** t-statistic (-4.072) (-11.64) beta -0.749 -0.683 INCOME_SECURITY -0.400** -0.360** t-statistic (-2.817) (-5.210) beta -0.437 -0.393 ILO _SECURITY -0.0943 -0.195** -0.399** t-statistic (-1.938) (-5.275) (-8.037) beta -0.188 -0.387 -0.593 CONSTANT 15.20** 24.95** 40.28** -5.922 -1.649 t-statistic (3.355) (7.832) (11.98) (-0.977) (-0.406) Observations 88 88 47 88 88 Adjusted R-squared 0.692 0.623 0.810 0.797 0.800
Robust t-statistics in parentheses ** p<0.01, * p<0.05
18
Table 5 cols. 1-2 show that the ILO work security index (ILO_SECURITY) is a determinant of obesity, but is dominated by MARKET_LIB. What this says is that work-based insecurity has a significant effect on obesity only in market-liberal countries (col. 3). The index is composed of seven components, labour-market security (i.e., unemployment), employment security, work security (risk at work), job security (control/autonomy at work), skill security (education and training), representation security (legal and union rights), and income security. Column 4 estimates the relative power of each of these components. Only three of them are significant. Representation and income security have the expected sign – obesity decreases as they increase. Representation (an aspect of employment security) is a particularly strong determinant. These two variables are partially offset by skill security, which is also strong but has a positive sign. One way is of interpreting this finding is that ‘representative security’ stands for the ability of workers to bargain collectively, and skill security (or individual human capital) for their ability to bargain individually. The skill variable measures the general rise of educational and training levels. One of us has argued elsewhere that accumulation of human capital has inclined workers towards more individualistic forms of bargaining (Offer, 2008, 547). But this security may be delusive, and provides little respite from the rising anxieties of market competition (e.g., Ehrenreich, 2006; Hacker, 2006; Newman, 1988; Offer, 2006, 292-8; Warren and Tyagi, 2003, 80-5). If this is correct, then as workplace security declined through our period, then paradoxically the general rise in educational levels which has taken place in the most advanced societies was accompanied by insecurity and its corollary, obesity. Alternatively, and perhaps more plausibly, the rise of obesity in higher-human-capital countries does not indicate that it is higher-skilled persons who are becoming more obese. The shift to individual bargaining will have benefited those who have bargaining power, while worsening the position of the rest. Hence, it may not be the brain workers who suffer from obesity in these countries, but disproportionately the manual workers who have been left behind, and who have lost their bargaining power.
4.3. Equality
The prevalence of obesity is inversely related to socio-economic status (Offer, 2006, 152-3; McLaren, 2007). An additional, or perhaps alternative, source of stress for inducing obesity is inequality (Pickett et al., 2005, Wilkinson and Pickett, 2009, 89-94). As we have seen, in multivariate analysis, insecurity dominates inequality. But this finding may not be decisive. Insecurity may be an aspect of inequality. The unobservable epidemiological insult in question may be captured better by insecurity than inequality. Insecurity is a personal attribute, inequality a social one. Or we may not be using the right measure of inequality. The variable used measures household income controlled for household size, derived from surveys. This is likely to truncate both the bottom and the top of the distributions. It says nothing about other forms of inequality, especially inequality of wealth, which is much stronger than inequality of income. In the work of

19
Marmot (2004) and of Wilkinson and Pickett (2009), the stress mechanism is assumed to be the burden of subordination. This mechanism is not captured by our statistical analysis. Atkinson and Brandolini (2001) stress how difficult it is to identify the appropriate inequality measure. The Osberg inequality measures are particularly turbulent and unstable for these years. Some countries were already reversing the steep rise of inequality of early market-liberalism during these years (Australia, Denmark, France, Netherlands, Spain, Sweden) while others were beginning their descent (Belgium, Norway, Italy). Others were stable (Canada, Germany, Italy) or moved both ways (UK). This makes it difficult to generalise about the role of inequality with a multi-country study for these years. One way in which the inequality hypothesis is manifest is in two-way correlations. Figure 3 shows the relation between obesity prevalence and economic equality. The trend is weaker than for economic security, but does replicate the findings of Wilkinson and Pickett (2009). The trend derived from the multivariate model diverges strongly from the two-way plot.
Figure 3. Obesity and inverse Gini
FIN
SWE
AUS
US
FIN
SPA
US
CAN
CAN
FIN
SWE
FINSPASWEFIN
FRAITAFRA
CAN
US
SWEFIN
AUS
FIN
US
ITA
UKFINFIN
CAN
GERFIN
SWE
FRA
FIN
SWE
CAN
ITA
US
US
US
AUS
FRA
USUS
USUS
US
US
US
US
CAN
ITA
NOR
GERUSUS
ITA
GER
US
NORITA
NOR
US
510
1520
2530
perc
enta
ge o
bese
0 20 40 60 80inverse_gini
ObservedPredicted: Two wayPredicted: Full model
Self-reported
UK
AUSNOR
UK
UK
UKUK
UKUK
US
SPA
GER
UK
SPA
FINUK
UK
US
CAN
GER
UK
UK
US
AUS
510
1520
2530
perc
enta
ge o
bese
0 20 40 60 80inverse_gini
ObservedPredicted: Two wayPredicted: Full model
Measured

20
5. Conclusion
This study is a snapshot of obesity in advanced countries at the end of the 20th century, and allows some preliminary conclusions. Market-liberal countries stand out as having high levels of obesity, and higher rates of obesity growth. The TIME variable is more powerful in market-liberal countries (table 3). The United States in particular is an outlier, ranking first on both levels and rates of growth of obesity, but market-liberal distinctiveness remains when the United States is left out (table 4, cols. 1-2). One reason is market freedoms: fast food prices, as proxied by the BIG_MAC variable, are considerably lower in market-liberal countries, due to lower levels of taxation and wages which prevail in market-liberal countries. In other words, the ‘fast food shock’ which is invoked in explanation of obesity, has acted more powerfully in market-liberal countries. The most powerful influence we have uncovered on levels of obesity is insecurity. This relation remains even after controlling for MARKET_LIB, which has a strong, significant, and positive effect in most regressions. We have measured insecurity in two ways, using an index of dependency (ECON_SECURITY) and another one of insecurity at work (ILO_SECURITY). Each of these independently has considerable explanatory power, but the former dominates the latter in regressions.3
3 t-statistics of -6.69 and 0.8 respectively, with MARKET_LIB omitted.
This is not decisive, since ECON_SECURITY has greater resolution: annual observations, versus a single observation for ILO_SECURITY. On the other hand, annual change is controlled for in the case of ECON_SECURITY by the TIME variable, so the security variables reflect levels, not trends. Breaking down the indices into their component parts, in the case of dependency insecurity, the only significant component is private medical expenditure. Using the ILO index of security at work, income security and workers’ rights are both associated with lower obesity prevalence. Education and skill might seem be associated with higher security, but in this study are found to be associated with higher obesity. In this case, the accumulation of human capital appears to act in an opposite direction to worker representation. Our tentative interpretation is that taken in the aggregate, the security provided by human capital encourages some workers to abandon unionisation and labour market protections, but that individual bargaining power is often delusive. It is the resulting insecurity which we associate here with obesity, especially for those with lower human capital. That is not to say, for example, that trade unionists have lower obesity prevalence, or that households that suffer medical adversity are prone to weight gain. The surveys tell us nothing about individuals—it could well be that the general climate of insecurity is what affects individuals, and not all of them in the same way. We intend to investigate this further at an individual level. The actual mechanisms suggested here for obesity growth are psychological. They are not detectable in the aggregate results of surveys. But they are consistent with the hypothesis that insecurity of competitive market societies is conducive to obesity.
21
Inequality is another contender. In multivariate analysis, equality is dominated by security. But that does not settle the matter -- insecurity may be a consequence of inequality, and the measure of inequality used may not be the best one. In bi-variate analysis, higher equality is inversely related to obesity prevalence, and that is also the case for unemployment protection, which likewise has the ‘wrong’ sign in the multi-variate model (table 4, col. 5)
The study is essentially cross-sectional, but it raises an historical question. If welfare regimes are such a critical determinant of obesity, where do such regimes themselves come from? Figure 2 shows the United States clustered at the high end, and the Scandinavian countries clustered at the low end. The market-liberal countries in our sample all share English as a common language. Norway and Sweden, at the low end of obesity and high end of security, both use variants of the same language, and share a common culture and religion, in addition to having similar welfare regimes. This suggests that welfare regimes have historical and cultural roots and that the search for causes needs to venture into the past; that a disposition for excess or moderation, for risk-taking or security, may be rooted in the respective cultures. On the other hand, culture may not be destiny. Social pathology can respond to experience and learning, and can moderate seemingly of its own accord. Out of several examples that could be chosen, smoking, the most salient, rose to majority use in the first half of the 20th century, and has declined ever since. The trajectory of obesity in the United States and the UK also appears to have flattened in the last few years (Flegal et al., 2010; Health and Social Care Information Centre, 2005).
Our conclusions are derived from aggregates. The actual mechanisms require investigation at the level of individuals. We have already begun to do so, and hope to replicate this study with a smaller number of countries using such datasets. The study is still in early days. The implications, however, are large. The association of insecurity and obesity has a bearing on larger policy norms. It suggests that the economic benefits of flexible and open markets, such as they are, may be offset by costs to personal and public health which are rarely taken into account. The controlled market economies (those we have defined here as not being ‘market-liberal’) all support successful and affluent societies. They also appear to perform better on this important dimension of personal and public health.
22
References
Atkinson, A.B., Brandolini, A., 2001. Promise and pitfalls in the use of "secondary" data-
sets: income inequality in OECD countries as a case study. Journal of Economic Literature 39, 771-799.
Björntorp, P., 2001. Do stress reactions cause abdominal obesity and comorbidities? Obesity Reviews 2, 73-86.
Butland, B., Jebb, S., Kopelman, P., McPherson, K., Thomas, S., Mardell, J., Parry, V., 2007. Foresight: Tackling Obesities: Future Choices -- Project Report, Great Britain, Government Office for Science, Foresight Programme.
Chou, S.Y., Grossman, M., Saffer, H., 2004. An economic analysis of adult obesity: results from the Behavioral Risk Factor Surveillance System. Journal of Health Economics 23, 565-587.
Cutler, D.M., Glaeser, E.L., Shapiro, J.M., 2003. Why have Americans become more obese? Journal of Economic Perspectives 17, 93-118.
Dallman, M.F., Pecoraro, N., Akana, S.F., La Fleur, S.E., Gomez, F., Houshyar, H., Bell, M.E., Bhatnagar, S., Laugero, K.D., Manalo, S., 2003. Chronic stress and obesity: a new view of "comfort food". Proc Natl Acad Sci U S A 100, 11696-11701.
Dallman, M.F., Pecoraro, N.C., la Fleur, S.E., 2005. Chronic stress and comfort foods: self-medication and abdominal obesity. Brain Behav Immun 19, 275-280.
Delpeuch, F., Maire, B., Monnier, E., Holdsworth, M., 2009. Globesity: A Planet out of Control? Earthscan, London.
Demyttenaere, K., Bruffaerts, R., Posada-Villa, J., Gasquet, I., Kovess, V., Lepine, J.P., Angermeyer, M.C., Bernert, S., de Girolamo, G., Morosini, P., Polidori, G., Kikkawa, T., Kawakami, N., Ono, Y., Takeshima, T., Uda, H., Karam, E.G., Fayyad, J.A., Karam, A.N., Mneimneh, Z.N., Medina-Mora, M.E., Borges, G., Lara, C., de Graaf, R., Ormel, J., Gureje, O., Shen, Y., Huang, Y., Zhang, M., Alonso, J., Haro, J.M., Vilagut, G., Bromet, E.J., Gluzman, S., Webb, C., Kessler, R.C., Merikangas, K.R., Anthony, J.C., Von Korff, M.R., Wang, P.S., Brugha, T.S., Aguilar-Gaxiola, S., Lee, S., Heeringa, S., Pennell, B.E., Zaslavsky, A.M., Ustun, T.B., Chatterji, S., 2004. Prevalence, severity, and unmet need for treatment of mental disorders in the World Health Organization World Mental Health Surveys. JAMA 291, 2581-2590.
Dolnick, S., 2010. The Obesity-Hunger Paradox, New York Times, New York. Drapeau, V., Therrien, F., Richard, D., Tremblay, A., 2003. Is visceral obesity a
physiological adaptation to stress? Panminerva Med 45, 189-195. Drewnowski, A., Darmon, N., 2005. Food choices and diet costs: an economic analysis. J
Nutr 135, 900-904.

23
Ehrenreich, B., 2006. Bait and Switch: The Futile Pursuit of the Corporate Dream. Granta, London.
Esping-Andersen, G., 1990. The Three Worlds of Welfare Capitalism. Polity, Cambridge. Flegal, K.M., Carroll, M.D., Ogden, C.L., Curtin, L.R., 2010. Prevalence and trends in
obesity among US adults, 1999-2008. JAMA 303, 235-241. Gerace, T.A., George, V.A., 1996. Predictors of weight increases over 7 years in fire fighters
and paramedics. Preventive Medicine 25, 593-600. Goodin, R.E., Headey, B., Muffels, R., Dirven, H.-J., 1999. The Real Worlds of Welfare
Capitalism. Cambridge University Press, Cambridge, UK. Greeno C. G. and Wing R. R. ,1994. Stress-induced eating. Psychological Bulletin 115 (3),
444-64. Hacker, Jacob S., 2006. The Great Risk Shift. Oxford University Press, New York. Hall, P.A., Soskice, D., 2001. Varieties of Capitalism. Oxford University Press, Oxford. Hannerz, H., Albertsen, K., Nielsen, M.L., Tuchsen, F., Burr, H., 2004. Occupational factors
and 5-year weight change among men in a Danish national cohort. Health Psychology 23, 283-288.
Health and Social Care Information Centre, 2005. Health Survey for England 2004. Updating of trend tables to include 2004 Data, Government Statistical Sevice, London.
International Labour Organization, 2004. Economic Security for a Better World. International Labour Organization, Geneva.
International Obesity Task Force, 2010. International Obesity Task Force Prevalence Data. Kasser, T., 2002. The High Price of Materialism. MIT Press, London. Kasser, T., Ryan, R.M., Couchman, C.E., Sheldon, K.M., 2004. Materialistic values: Their
causes and consequences. In: Kanner, A.D. (Ed.), Psychology and Consumer Culture: The Struggle for a Good Life in a Materialistic World, Washington, DC, pp. 11-28.
Komlos, J., Smith, P. K., Bogin, B., 2004. Obesity and the rate of time preference: is there a connection? Journal of Biosocial Science 36, 209-220
Lakdawalla, D., Philipson, T., Bhattacharya, J., 2005. Welfare-enhancing technological change and the growth of obesity. American Economic Review 95, 253-257.
Latner, J.D., O'Brien, K.S., Durso, L.E., Brinkman, L.A., MacDonald, T., 2008. Weighing obesity stigma: the relative strength of different forms of bias. International Journal of Obesity 32, 1145-1152.
Lazzarato, M., 2009. Neoliberalism in action. Inequality, insecurity and the reconstruction of the social. Theory, Culture and Society 26 (6), 109-133.
Marmot, M.G., 2004. Status Syndrome: How Your Social Standing Directly Affects Your Health and Life Expectancy. Bloomsbury Pub., London.

24
McLaren, L., 2007. Socioeconomic status and obesity. Epidemiologic Reviews 29, 29-48. Nakao, M. ,2010. Work-related stress and psychosomatic medicine. BioPsychoSocial
Medicine, 4:4 doi:10.1186/1751-0759-4-4. Newman, K.S., 1988. Falling from Grace: The Experience of Downward Mobility in the
American Middle Class. Free Press, New York. Offer, A., 2001. Body weight and self-control in the United States and Britain since the
1950s. Social History of Medicine 14, 79-106. Offer, A., 2006. The Challenge of Affluence: Self-control and Well-being in the United
States and Britain since 1950. Oxford University Press, Oxford. Offer, A., 2008. British manual workers: From producers to consumers, c. 1950-2000.
Contemporary British History 22, 537-571. Oliver G., Wardle J., Gibson E. L. 2000. Stress and food choice: a laboratory study.
Psychosomatic Medicine 62 (6), 853-65. Osberg, L., 2009. Measuring Economic Security and Insecure Times: New Perspectives,
New Events, and the Index of Economic Well-Being, Centre for the Study of Living Standards, Ottawa.
Oswald, A.J., Powdthavee, N., 2007. Obesity, unhappiness, and the challenge of affluence: Theory and evidence. Economic Journal 117, F441-F454.
Philipson, T.J., Posner, R.A., 2003. The long-run growth in obesity as a function of technological change. Perspectives in Biology and Medicine 46, S87-S107.
Philipson, T.J., Posner, R.A., 2008. Is the obesity epidemic a public health problem? A review of Zoltan J. Acs and Alan Lyles's obesity, business and public policy. Journal of Economic Literature 46, 974-982.
Pickett, K.E., Kelly, S., Brunner, E., Lobstein, T., Wilkinson, R.G., 2005. Wider income gaps, wider waistbands? An ecological study of obesity and income inequality. J Epidemiol Community Health 59, 670-674.
Pickett, K.E., Wilkinson, R.G., 2007. Child wellbeing and income inequality in rich societies: ecological cross sectional study. BMJ 335, 1080-1085.
Puhl, R.M., Heuer, C.A., 2009. The stigma of obesity: A review and update. Obesity 17, 941-964.
Scott, K.M., Bruffaerts, R., Simon, G.E., Alonso, J., Angermeyer, M., de Girolamo, G., Demyttenaere, K., Gasquet, I., Haro, J.M., Karam, E., Kessler, R.C., Levinson, D., Medina Mora, M.E., Oakley Browne, M.A., Ormel, J., Villa, J.P., Uda, H., Von Korff, M., 2008. Obesity and mental disorders in the general population: results from the world mental health surveys. Int J Obes (Lond) 32, 192-200.
Scott-Marshall H., 2010. The social patterning of work-related insecurity and its health consequences. Social Indicators Research 96, 313-337.
Sennett, R., Cobb, J., 1972. The Hidden Injuries of Class. Knopf, New York.

25
Smith, T., 2009. Reconciling psychology with economics - obesity, behavioral biology, and rational overeating. Journal of Bioeconomics 11, 249-282.
Smith, T., Stoddard, C., Barnes, M., 2009. Why the poor get fat: Weight gain and economic insecurity. Forum for Health Economics & Policy 12, Article 5.
Torres, S.J., Nowson, C.A., 2007. Relationship between stress, eating behavior, and obesity. Nutrition 23, 887-894.
Twenge, J.M., 2000. The age of anxiety? Birth cohort change in anxiety and neuroticism, 1952-1993. Journal of Personality and Social Psychology 79, 1007-1021.
Twenge, J.M., Gentile, B., DeWall, C.N., Ma, D., Lacefield, K., Schurtz, D.R., 2009. Birth cohort increases in psychopathology among young Americans, 1938–2007: A cross-temporal meta-analysis of the MMPI. Clinical Psychology Review 30, 145-154.
Ulijaszek, S.J., 2007. Frameworks of population obesity and the use of cultural consensus modeling in the study of environments contributing to obesity. Economics and Human Biology 5, 443-457.
Ulijaszek, S.J., Lofink, H., 2006. Obesity in biocultural perspective. Annual Review of Anthropology 35, 337-360.
Wang, Y.F., Beydoun, M.A., Liang, L., Caballero, B., Kumanyika, S.K., 2008. Will all Americans become overweight or obese? Estimating the progression and cost of the US obesity epidemic. Obesity 16, 2323-2330.
Warren, E., Tyagi, A.W., 2003. The Two-Income Trap: Why Families Went Broke When Mothers Went to Work. Basic Books, New York.
Wilkinson, R.G., Pickett, K., 2009. The Spirit Level: Why More Equal Societies Almost Always Do Better. Allen Lane, London.
University of Oxford Discussion Papers in Economic and Social History: Recent publications
67 Paul Sharp and Jacob Weisdorf, From Preventive to Permissive Checks: The Changing Nature of The Malthusian Relationship between Nuptiality and the Price of Provisions in the Nineteenth Century (November 2007)
68 Roman Studer, India and the Great Divergence: Assessing the Efficiency of Grain Markets in Eighteenth- and Nineteenth-Century India (November 2007)
69 Guillaume Daudin, Domestic Trade and Market Size in Late Eighteenth-Century France (April 2008)
70 Avner Offer, Charles Feinstein (1932–2005) and British Historical National Accounts (June 2008)
71 Sandra González-Bailón and Tommy Murphy, When Smaller Families Look Contagious: A Spatial Look at the French Fertility Decline Using an Agent-based Simulation Model (September 2008)
72 Luke Samy, The Building Society Promise: Building Societies and Home Ownership, c1880–1913 (October 2008)
73 Leigh A. Gardner, To Take or to Make? Contracting for Legitimacy in the Emerging States of Twelfth-Century Britain (November 2008)
74 Avner Offer, British Manual Workers: From Producers to Consumers, c.1950–2000 75 Pablo Astorga, A Century of Economic Growth in Latin America (January 2009)
76 Scott Andrew Urban: The Name of the Rose: Classifying 1930s Exchange-Rate Regimes (April 2009)
77 David Chacko: Medical Liability Litigation: An Historical Look at the Causes for Its Growth in the United Kingdom (April 2009)
78 Mark Koyama: The Price of Time and Labour Supply: From the Black Death to the Industrious Revolution (September 2009)
79 Cliff Bekar and Clyde Reed: Risk, Asset Markets, and Inequality: Evidence from Medieval England (October 2009)
80 Pablo Astorga, Mean Reversion in Long-Horizon Real Exchange Rates: Evidence from Latin America (January, 2010)
81 C. Knick Harley, Prices and Profits in Cotton Textiles during the Industrial Revolution (May, 2010)
82 Avner Offer, Rachel Pechey and Stanley Ulijaszek, Obesity under affluence varies by welfare regimes: the effect of fast food, insecurity, and inequality (July, 2010)
UNIVERSITY OF OXFORD DISCUSSION PAPERS IN ECONOMIC AND SOCIAL HISTORY
are edited by Rui Esteves (Brasenose College, Oxford, OX1 4AJ) Luke Samy (Nuffield College, Oxford, OX1 1NF)
Papers may be downloaded from
http://www.nuff.ox.ac.uk/Economics/History