avod briefing presentation overview 2020 · avod briefing presentation we combine our existing...
TRANSCRIPT

AVOD Briefing Presentation Overview
2020
AVOD Briefing Presentation
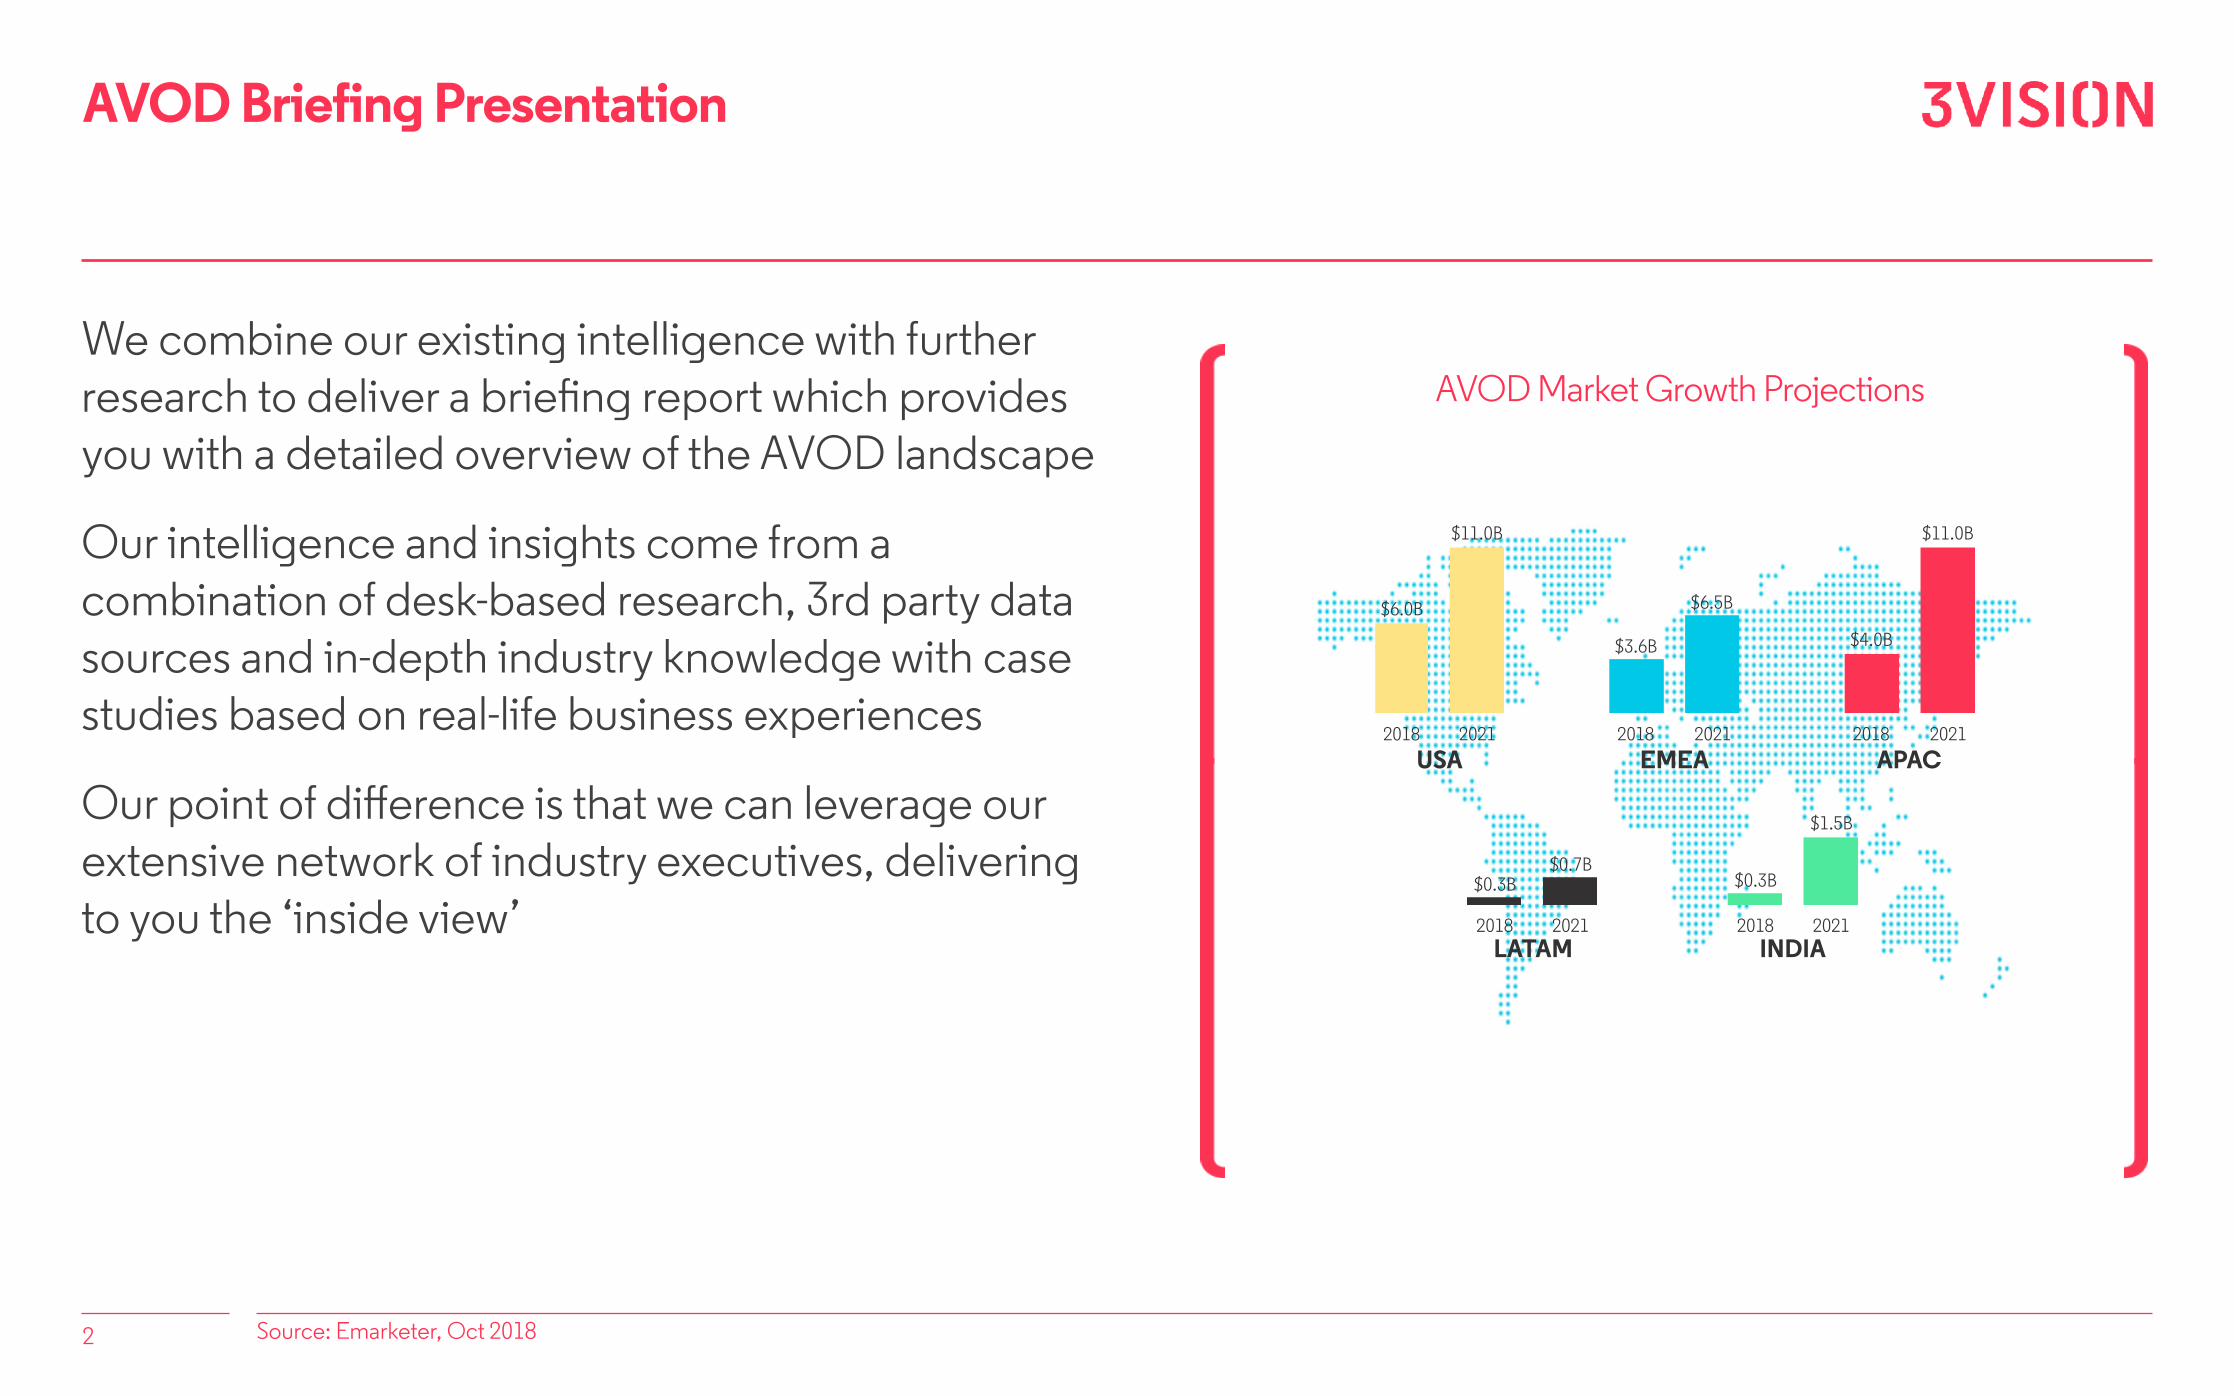
We combine our existing intelligence with further research to deliver a briefing report which provides you with a detailed overview of the AVOD landscape
Our intelligence and insights come from a combination of desk-based research, 3rd party data sources and in-depth industry knowledge with case studies based on real-life business experiences
Our point of difference is that we can leverage our extensive network of industry executives, delivering to you the ‘inside view’
2 Source: Emarketer, Oct 2018
USA EMEA
LATAM INDIA
APAC2018 2021
$11.0B
$6.0B
2018 2021
$11.0B
$4.0B
2018 2021
$6.5B
$3.6B
2018 2021
$0.7B$0.3B
2018 2021
$1.5B
$0.3B
AVOD Market Growth Projections
Report Content
3
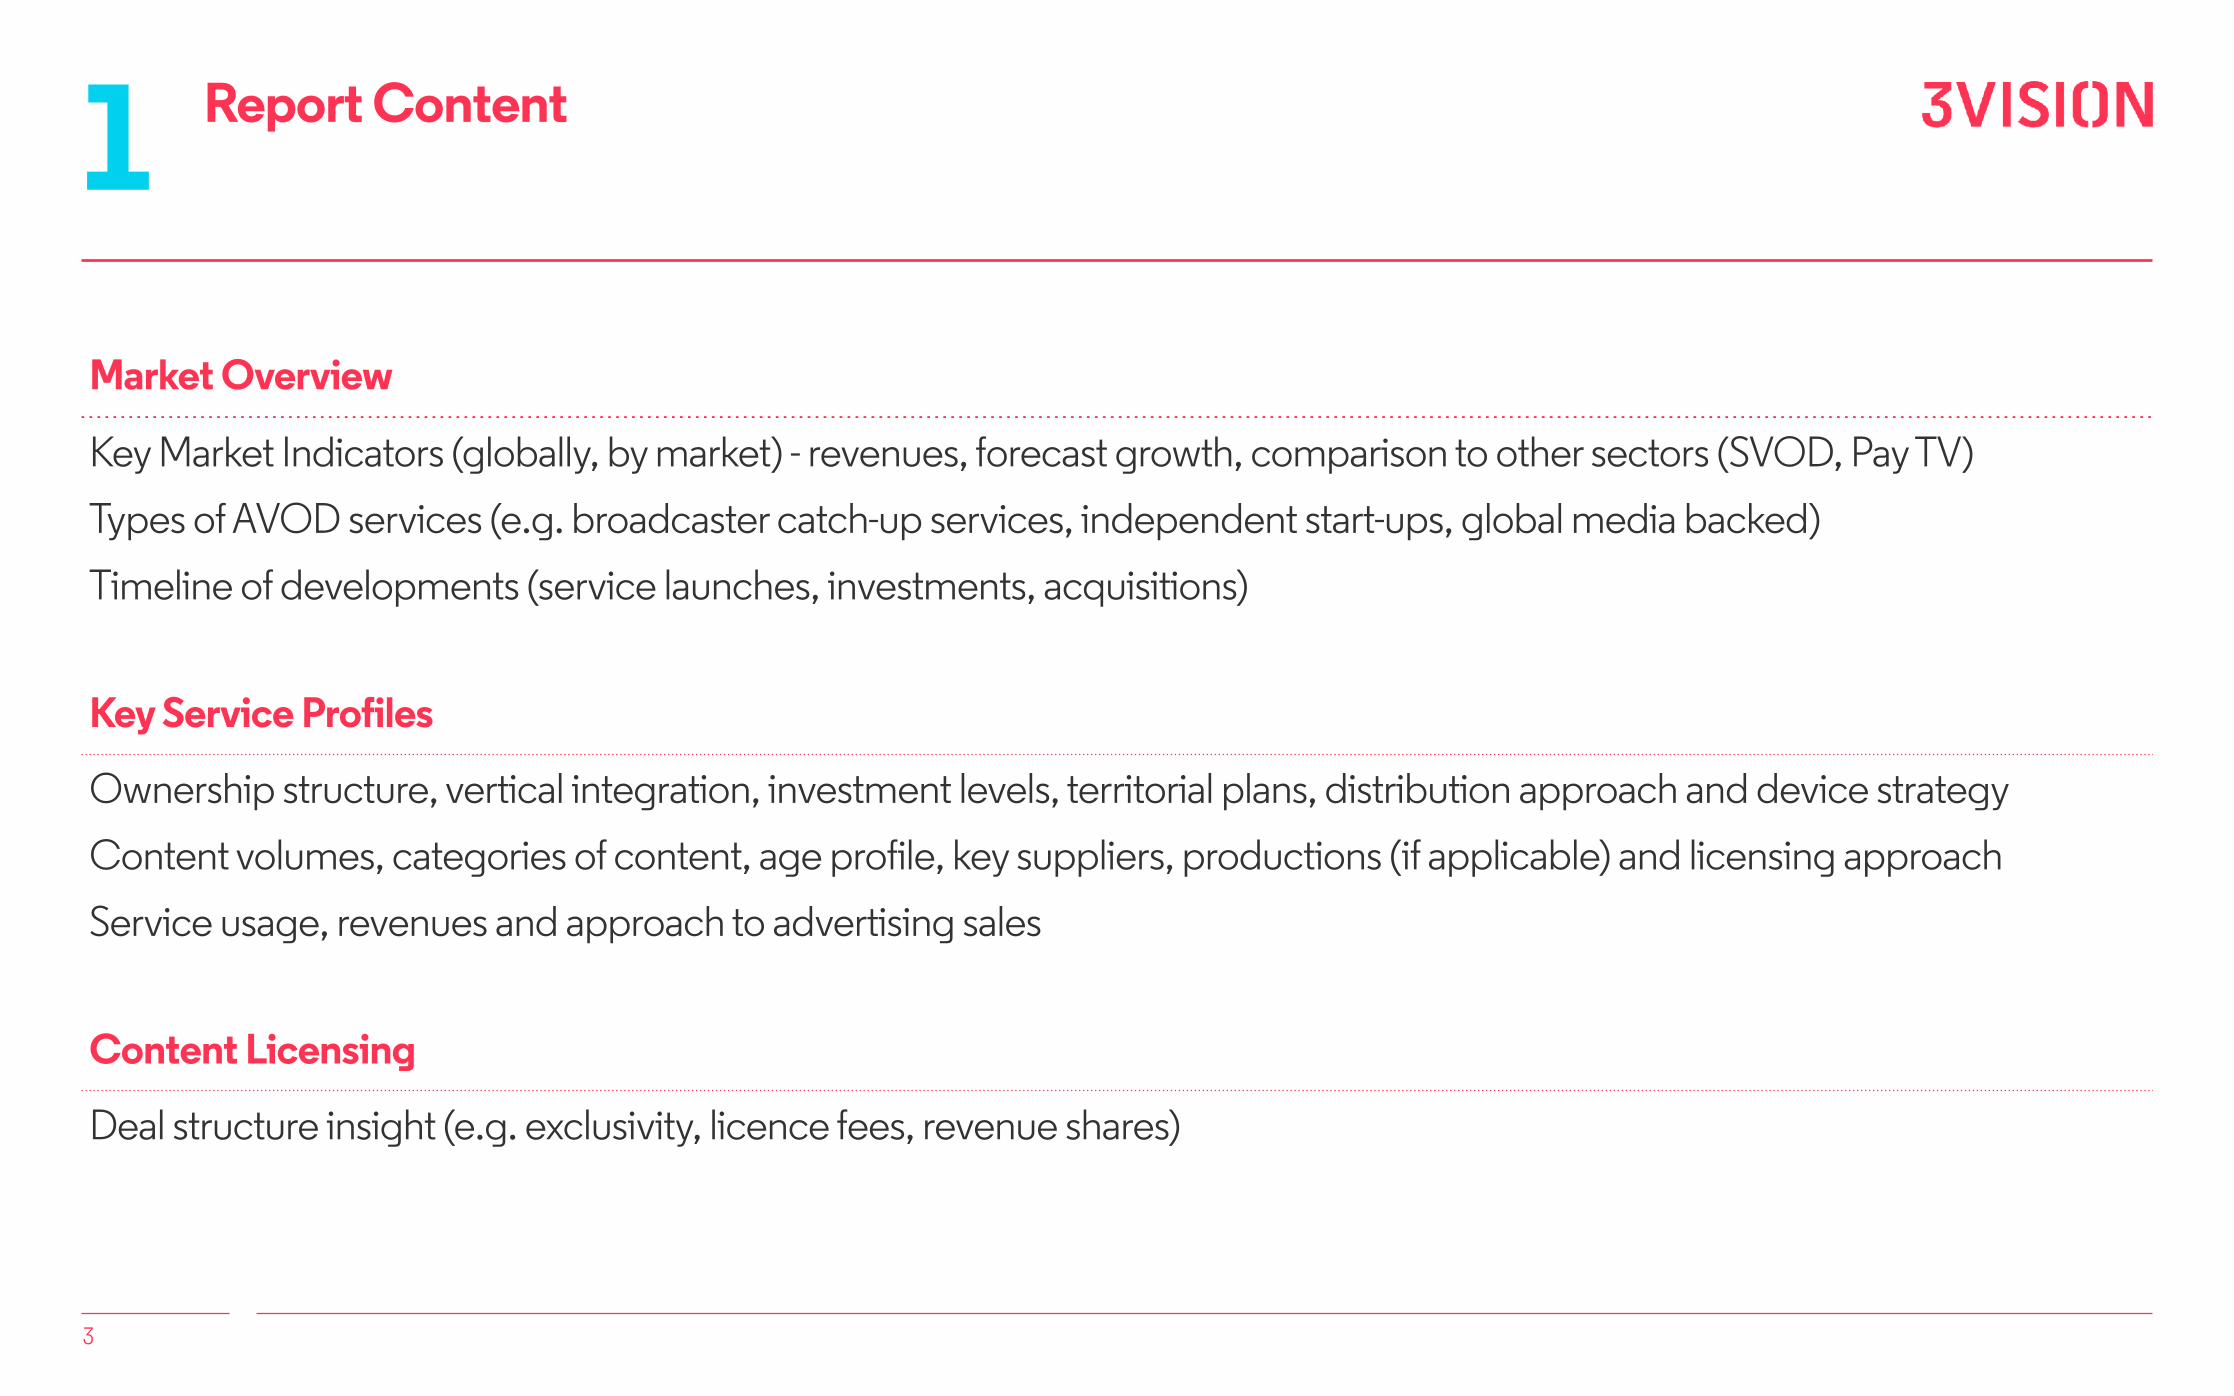
1Market Overview
Key Market Indicators (globally, by market) - revenues, forecast growth, comparison to other sectors (SVOD, Pay TV)
Types of AVOD services (e.g. broadcaster catch-up services, independent start-ups, global media backed)
Timeline of developments (service launches, investments, acquisitions)
Key Service Profiles
Ownership structure, vertical integration, investment levels, territorial plans, distribution approach and device strategy
Content volumes, categories of content, age profile, key suppliers, productions (if applicable) and licensing approach
Service usage, revenues and approach to advertising sales
Content Licensing
Deal structure insight (e.g. exclusivity, licence fees, revenue shares)

Delivery
We will provide both a broad perspective on the whole market in addition to detailed insight on key areas
4
2A briefing report presented to your executives with leave-behind copies
Understanding the complete ecosystem Content Licensing Trends
The Channel Role Market forecasts
50100150200250 Pay TV
SVODAVODDTO/R
50100150200250 TV
PrintInternetRadioOOH/Cin.
Video Revenues (US$B) Ad. Revenues (US$B)

AVOD Continuing developments
5

AVOD Roku
Roku continue to report rapid user growth, streaming and average revenue per user, with streaming hours up by 16.2B to 40.3B hours and monetised video ad impressions more than doubled in both 2018 and 2019
6 3Vision analysis of Roku quarterly financial reports, all numbers based on total device activity
Streaming Hours (billions)
Q4 16 Q1 17 Q2 17 Q3 17 Q4 17 Q1 18 Q2 18 Q3 18 Q4 18 Q1 19 Q2 19 Q3 19 Q4 19
11.7
10.39.4
8.9
7.36.2
5.55.14.3
3.83.53.32.8
Active Accounts Vs. Average Revenue Per User
Acco
unts
(Mill
ions
)
0
8
16
24
32
40
ARPU
(US$
)
0
8
16
24
32
40
Q4 16 Q1 17 Q2 17 Q3 17 Q4 17 Q1 18 Q2 18 Q3 18 Q4 18 Q1 19 Q2 19 Q3 19 Q4 19
ARPUActive Accounts

AVOD Roku Profit Focus
Profitability of the hardware side of Roku’s business varies quarter-to-quarter, but Roku’s ‘Platform Business’ (advertising, licensing and other non-hardware revenue streams) continues to grow, with a significant lift in Q4 2019 offsetting a minor loss from the ‘Player’ segment which Roku plans to operate at a gross margin close to zero to drive device sales and grow accounts
7 ‘Player’ refers to the sale of hardware, ‘Platform’ includes Roku’s ad business and revenue from deals with content owners appearing on their devices
Roku Player/Platform (Gross Profit US$)
Q4 16 Q1 17 Q2 17 Q3 17 Q4 17 Q1 18 Q2 18 Q3 18 Q4 18 Q1 19 Q2 19 Q3 19 Q4 19
161.7
118.4114.2100.9
112.3
7977.863.1
73.5
49.937.638.844.7
PlatformPlayer

Take the next step
8
We’re ready to help your business build success in the content world.
Just let us know your ambitions.
Toby Russell CEO+44 7713 511 966 [email protected]
Jonathan Nickell COO+44 7970 544 825 [email protected]
Jack Davison EVP+44 7712 837 263 [email protected]
Hayley Bull Director+44 7795 270 073 [email protected]