awareness of the age regulations and … equality... · i awareness of the age regulations and...
TRANSCRIPT

i
AWARENESS OF THE AGE REGULATIONS AND ATTITUDES OF THE GENERAL PUBLIC
IN NORTHERN IRELAND TOWARDS AGE-RELATED ISSUES
June 2008


Equality Commission (Research on Age-Related Issues and Attitudes - 2007)
iii
EXECUTIVE SUMMARY Introduction and Background
In March 2007, the Equality Commission appointed Social and Market
Research (SMR) to conduct a survey of the general public in Northern Ireland
regarding age-related issues and attitudes. The survey was in response to
the Equality Employment (Age) Regulations (Northern Ireland) 2006, which
came into effect on 1 October 2006.
The overall aim of the survey was to acquire baseline knowledge of age-
related issues in general and the Age Regulations in particular. Ultimately,
the project will assist the Commission and others in identifying areas and
groups where targeted interventions may be required to improve awareness,
not only of rights and responsibilities under the legislation, but also of the
services provided by the Commission.
The survey was conducted on a face-to-face basis across Northern Ireland
with a representative sample of 1000 adults aged 16+. Data analysis was
performed across the nine s.75 equality groupings, namely: age, sex, religion,
political affiliation, marital status, disability, those with or without dependents,
ethnicity and sexual orientation. Differences between groups are presented
only when they are statistically significant.
Awareness of Age Discrimination Legislation
� Just under half (46%) of respondents were aware that age
discrimination had become unlawful in October 2006, with 54%
unaware that the law had changed.
� Similarly, 44% were aware of the new Equality Employment (Age)
Regulations (NI) 2006, with 56% unaware of the new Regulations.
These figures broadly support the findings of an earlier Equality

Equality Commission (Research on Age-Related Issues and Attitudes - 2007)
iv
Commission survey (2006), which found higher levels of public
awareness for mature legislation, such as the Sex Discrimination (NI)
Order 1976 (84%), and lower levels of knowledge of more recent
legislation, such as the Sexual Orientation Regulations 2005 (33%).
� Of those who were aware that age discrimination had become
unlawful:
- 70% said they were aware which groups were protected under
the Regulations. However, when further probed it was found
that actual awareness varied: two-thirds (66%) correctly named
job applicants and employees, while fewer respondents correctly
cited contract workers (13%) and those using employment
agencies (10%).
- 51% knew that the Regulations protected them against direct
discrimination, while 14% were aware that indirect discrimination
and harassment were also covered.
- 56% said they were aware of the Default Retirement Age, as
cited in the Regulations. Of those who said they were aware,
71% gave the correct answer of 65 years. The most common
incorrect response was 60 years.
� 45% of respondents either strongly or moderately disagreed with the
exclusion of goods, facilities and services from coverage under the
Regulations. Nine percent agreed. Services provided by the Equality Commission in relation to Age Discrimination
� Respondents were asked (unprompted) to name the organisation they
should complain to if they thought they had been discriminated against
on the grounds of age. One in five (20%) correctly named the Equality
Commission, followed by the Citizens Advice Bureau (14%) and the
Labour Relations Agency (5%). This is similar to a finding obtained by
the Equality Awareness Survey (Equality Commission, 2006), where

Equality Commission (Research on Age-Related Issues and Attitudes - 2007)
v
19% of respondents identified the Commission as acting in an advisory
capacity to people who may have experienced discrimination. � Almost half (49%) of respondents did not know the name of the
appropriate body for processing their complaint. Awareness differed by
age, education, political opinion, geographical location, income and
social class.
� Of the 15% of respondents (n = 153) who were aware of the
Commission’s services relating to age, just over half (56%) identified
the Commission’s advisory function, while 14% were aware that the
Commission can also provide financial support to complainants to take
a case to tribunal.
� 85% of those surveyed did not know of any Commission services that
could assist them with age-discrimination, although there were
variations across a number of demographic variables. Attitudes towards Age-Related Issues
� Almost half (47%) of respondents perceived the main work-related
issue facing older people in Northern Ireland to be a difficulty in getting
a job, followed by being made redundant (24%) and job insecurity
(19%).
� For young people, the main work-related issues perceived by
respondents included a difficulty in getting a job (54%), followed by
meeting essential criteria when applying for a job (35%).
� A quarter (25%) named the National Minimum Wage as an important
issue facing younger people in Northern Ireland today.
� More than two-thirds of those surveyed (70%) thought that the differing
National Minimum Wage rates payable to younger people between the
ages of 16 and 22 years were unfair.
� Equal proportions (58%) perceived that younger and older people are
treated the same as others in the workplace on the basis of their age.
� When asked whether they would send a 30 year old or a 55 year old
man on a training course first, the majority of respondents (56%) gave

Equality Commission (Research on Age-Related Issues and Attitudes - 2007)
vi
an equivocal response saying “it depends”, while almost a quarter
(24%) indicated they would send the younger man first, and 12% opted
to send the older man first.
� There was considerable support for the statement that “people should
be allowed to retire when they want to”. Nearly two-thirds (62%) either
strongly or moderately agreed, with 10% disagreeing and 16%
undecided.
� The survey examined attitudes towards older and younger workers,
using stereotypical statements which may be in common usage:
- 61% agreed that “older workers need younger colleagues for
their fresh ideas and energy.”
- 62% agreed that “older workers are more loyal and dedicated”.
- 77% agreed that “younger people need older colleagues for their
advice and experience”.
- 48% agreed that “younger people are more involved in their
social life than in their work”.
� Respondents were asked for their perceptions on how middle-aged
people, and those approaching retirement, were treated by employers
when looking for work. 50% said that middle-aged people and those
approaching retirement, were treated the same as younger people,
compared with 15% who said they were treated worse, and 4% who
said they were treated better. Almost a third (30%) answered “Don’t
Know”.
� Over three-quarters (76%) of respondents said they did not care what
age their colleagues were, along with 72% who said they had no
preference as to the age of their manager.
Personal Experience of Age-related Discrimination
� 17% of respondents were of the view that there is substantial age
discrimination in the workplace, while 24% disagreed. Over half of
those surveyed (59%) said they didn’t know.

Equality Commission (Research on Age-Related Issues and Attitudes - 2007)
vii
� 4% of those respondents in employment (n = 655) perceived that their
own employer discriminated on the grounds of age.
� Overall, 6% of respondents felt they had personally experienced less
favourable treatment at the hands of an employer, on the grounds of
age. A large majority (90%) said no.
- Perceptions of age-related unfair treatment by the respondent’s
own employer were slightly more prevalent in the youngest age
band, 16 – 29 years (10%), compared with those aged 30 – 44
years (6%), 45 – 64 years (4%) or 65 years and over (5%).
� Respondents were asked if they had wished to apply for jobs in recent
years. Of those respondents who answered in the affirmative (n = 134),
59% reported being discouraged by the excessive amount of
experience required. Over a quarter (28%) had been put off applying
where the advert contained words such as ‘mature’, ‘young’ or
‘energetic’, while 23% were deterred by an upper or lower age limit
specified in the job advert.
- Younger respondents (16 – 29 years) were most likely to report
having been deterred from applying for a job because they
considered the amount of experience required to be excessive
(74%), compared with those aged 30 – 44 years (44%), or 45 –
64 years (65%).

Equality Commission (Research on Age-Related Issues and Attitudes - 2007)
viii

Equality Commission (Research on Age-Related Issues and Attitudes - 2007)
ix
TABLE OF CONTENTS 1 Introduction 11.1 Background to the Survey 11.2 Survey Aim 11.3 Research Objectives 21.4 Methodology 2 1.4.1 Sample Size and Selection (N=1000) 2 1.4.2 Sampling of Households and Individuals 3 1.4.3 Sampling Error and Confidence Intervals 3 1.4.4 Representativeness of the Sample 4 1.4.5 Notes on Tables 6 1.4.6 Statistical Significance 6 1.4.7 Notes on Socio-Demographic Analysis Variables 6 2 Knowledge of Equality Employment (Age) Regulations 2006 72.1 Public awareness of when Age Discrimination became unlawful 72.2 Awareness of the Equality Employment (Age) Regulations (NI) 2006 72.3 Sources of Information on Age Discrimination 82.4 Perceived awareness of protection afforded under the Regulations 92.5 Actual awareness of Groups protected by the Legislation 102.6 Protection afforded to either those in Work or seeking Work 112.7 The Default Retirement Age 122.8 The Provision of Goods, Facilities and Services 142.9 Organisation responsible for receiving complaints under the Age
Regulations 152.10 Services provided by the Equality Commission in relation to Age
Discrimination 17 3 Attitudes towards Age-Related Issues 213.1 Perceptions of Young, Middle aged and Older workers 213.2 Main work-related issues facing older people in Northern Ireland 223.3 Main work-related issues facing younger people in Northern Ireland 233.4 Attitudes towards National Minimum Wage Differentials 243.5 Treatment of Older Workers in Employment 253.6 Treatment of Younger Workers in Employment 273.7 Attitudes towards Age in the Workforce: a Training Course scenario 29 Training Course Preferences: why send the younger man first? 30 Training Course Preferences: why send the older man first? 313.8 Views on Flexible Retirement Age 313.9 Reasons why people should be allowed to retire when they want to 323.10 Preferred options concerning work and retirement 323.11 Main reason for currently working beyond the present retirement age or
wishing to carry on working beyond retirement 353.12 Attitudes towards Older Workers 353.13 Attitudes towards Younger Workers 373.14 Treatment of Job Applicants aged 40 – 59 years 393.15 Preference for Working with Persons of different Age Groups 413.16 Preference for being Line-managed by Persons of different Age Groups 42

Equality Commission (Research on Age-Related Issues and Attitudes - 2007)
x
4 Personal Experience of Age-Related Discrimination 434.1 Age Discrimination in the Workplace 434.2 Age Discrimination by Respondent’s own Employer 444.3 Personal Experience of Less Favourable Treatment on the Grounds of Age 454.4 Age-Related Criteria in Job Adverts 46 5 Conclusions 475.1 Awareness of Age Discrimination Legislation 475.2 Services for People Discriminated on the Basis of Age 485.3 Attitudes towards Age-Related Issues 485.4 Experience of Age-Related Discrimination 505.5 Concluding Comments 525.6 References 53 6 Appendices 55Appendix I Questionnaire 55Appendix II Tables 72

Equality Commission (Research on Age-Related Issues and Attitudes - 2007)
1
1. INTRODUCTION
In March 2007, the Equality Commission for Northern Ireland (“the Commission” or
“Equality Commission”) appointed Social and Market Research (SMR) to conduct a
survey of the general public in Northern Ireland regarding age-related issues and
attitudes. This document sets out the findings of that survey.
1.1 Background to the Survey
On 1 October 2006 the Equality Employment (Age) Regulations (Northern Ireland)
2006 (hereinafter referred to as the “Age Regulations” or “the Regulations”) came
into effect. This legislation covers the age provisions of the Framework
Employment Equality Directive 2000 (FEED) and represents a further extension of
equality law in Northern Ireland. The Regulations ensure that persons of all ages in
Northern Ireland are protected, and that all aspects of the employment relationship
are covered, including: recruitment and selection; promotion; redundancy;
dismissal; training; pensions and retirement. The Regulations also introduced a
national default retirement age of 65 years, and provide employees with a new right
to request working beyond this default retirement age. The provision of goods,
facilities and services are not covered under the legislation.
It was within the above context that the Commission appointed SMR to measure,
among other parameters, awareness of the Age Regulations, and attitudes towards
age-related issues. From this baseline, it is intended that the project will facilitate
the monitoring of change in awareness and attitudes over time. Ultimately the
research outcomes will assist the Commission and others in identifying areas and
groups where targeted interventions may be required to improve awareness, not
only of rights and responsibilities under the legislation, but also of the services
provided by the Commission.
1.2 Survey Aim
The overall aim of the survey was: ‘To acquire baseline knowledge of age-related
issues in general, and key information relating to the implementation of the Age
Regulations (Northern Ireland) 2006 in particular’.

Equality Commission (Research on Age-Related Issues and Attitudes - 2007)
2
1.3 Research Objectives
The purpose of the survey was to measure awareness of the legislation and
attitudes towards age-related issues amongst the general public in Northern
Ireland. The four key objectives addressed in the survey were as follows:
- to ascertain the degree of knowledge of the Equality Employment (Age)
Regulations 2006;
- to identify the level of awareness of the services which the Equality
Commission can provide on age-related equality issues;
- to capture attitudes towards age-related issues; and
- to probe experiences of age-related discrimination.
1.4 Methodology
The survey was conducted on a face-to-face basis with a representative sample of
1000 adults aged 16 years and over. Interviews were conducted in respondent’s
homes using Computer Assisted Personal Interviewing (CAPI). Given the
importance of the survey, it was imperative that the sampling methodology produce
results which are representative of the Northern Ireland adult population (aged 16
years and over). To ensure the sample was fully representative of the Northern
Ireland adult population (aged 16+); the survey was implemented as a stratified
random sample, with quotas set for age, sex, social class, religion and area of
residence. Fieldwork on the main survey commenced on 9 May 2007 and was
completed on 31 May 2007.
1.4.1 Sample Size and Selection (N=1000)
Defining a sample size is always a trade-off between the level of precision of
sample estimates and cost, and for the purposes of this survey + 3% was
considered an acceptable level of sampling error. As such the survey was
conduced amongst a sample of 1000 adults which in turn allowed sufficient
disaggregation of the survey data by, for example, age, sex and religion.

Equality Commission (Research on Age-Related Issues and Attitudes - 2007)
3
1.4.2 Sampling of Households and Individuals
The sample was stratified by Local Government District (LGD) on a proportionate
basis using Probability Proportionate to Size (PPS) which allows for data analysis
by the three main areas of Northern Ireland (Belfast; East of Northern Ireland; and
West of Northern Ireland)1. Within each LGD a number of electoral wards were
randomly selected to represent the LGD and, from within each electoral ward,
households were randomly selected to represent the electoral ward. Households
were randomly selected from the Royal Mail’s Postal Address File (PAF), which is
an established source for drawing samples for household-based surveys in
Northern Ireland.
1.4.3 Sampling Error and Confidence Intervals Table 1 sets out the quotas applied to the sample, which were based on the 2001
Northern Ireland Census of Population data. Table 1 also presents an overview of
the representativeness of the sample in terms of the key variables of age, sex and
religion, and shows that the sample estimates are consistent with the quotas that
were set.
Table 1: Quotas and Confidence Intervals for Key Variables
Quota %
Sample 95%
Confidence Interval 16-29 25 27 24.2 29.8 30-44 29 28 25.2 30.8 45-64 28 29 26.2 31.8
Age
65+ 17 16 13.7 18.3
Male 48 48 44.9 51.1 Sex Female 52 52 48.9 55.1
R Catholic 40 39 36.0 42.0 Protestant 46 45 41.9 48.1
Religion
Other / Refused
14 16 13.7 18.3
1 The three regions of Northern Ireland (Belfast, East of Northern Ireland, West of Northern Ireland) were based on the NUTS 3 categorisation of Northern Ireland, and follow the methodology used by NISRA in similar sample surveys.

Equality Commission (Research on Age-Related Issues and Attitudes - 2007)
4
Sampling errors and confidence intervals at the 95% confidence level are also presented.
The use of sampling errors and confidence intervals is best illustrated by means of an
example from the survey. The sample estimated that the proportion of 30 – 44 year olds
in the Northern Ireland population was 28% (see Table 1). The margin of error at the 95%
confidence level is ± 2.8%. This means we can be 95% confident that the true proportion
of 30 – 44 year olds in the Northern Ireland population (aged 16+) lies somewhere within
the range 25.2% to 30.8%.
Please note that all data presented in the text refers to the survey sample, not the
population of Northern Ireland, and that each parameter will have its own sampling error,
typically around ± 3%.
1.4.4 Representativeness of the Sample
Table 2 (on the following page) presents an overview of the sample profile by each
of the key equality groupings.

Equality Commission (Research on Age-Related Issues and Attitudes - 2007)
5
Table 2: Profile of sample (Base: All Respondents, unweighted, n=1000) Age 16-29 years old 26.5 30-44 years old 28.3 45-64 years old 28.8 65 or over years old 16.0 Refused 0.4 Sex Male 48.0 Female 52.0 Marital Status Single 32.0 Married / Cohabiting 52.1 Widowed / Separated / Divorced 15.4 Refused 0.9 Disability Yes 10.4 No 89.3 Refused 0.3 Dependents Yes 30.8 No 68.0 Refused 1.2 Ethnicity White 97.0 Indian 0.1 Refused 2.9 Sexual Orientation Heterosexual 87.7 Gay / Lesbian 0.7 Bisexual - Refused 11.6 Religion R Catholic 38.9 Protestant 45.4 None 4.0 Other 0.5 Refused 11.2 Political Affiliation Nationalist 20.2 Unionist 21.3 Refused 58.5

Equality Commission (Research on Age-Related Issues and Attitudes - 2007)
6
1.4.5 Notes on Tables
Due to rounding, row and column percentages within tables may not always sum to
100. Base totals may also change in tables. It should be noted that dash marks [-]
are used in some tables to indicate that the figure is less than 1%. The complete
set of tables utilised in the analysis is contained in Appendix 2.
1.4.6 Statistical Significance
In this report the following symbols have been used to denote statistical
significance in the tables: * statistically significant at the 95% confidence level; **
statistically significant at the 99% confidence level; and, *** statistically significant at
the 99.9% confidence level. Note also that differences alluded to in the text are statistically significant at the 95% level.
1.4.7 Notes on Socio-Demographic Analysis Variables
To identify statistically significant differences between different subgroups of the
sample, a number of derived variables were created. These variables include
education, social class, income, religion, political affiliation, disability and sexual
orientation. The education variable has three categories: no formal educational
qualifications; lower level (up to and including A-Level or equivalent); and, higher
level (degree level or higher). Social class has been categorised into two groups:
ABC1; and, C2DE. These categories are based on Market Research definitions for
specific groupings. Income has been derived from respondent’s household income
and has been recategorised into: lower income (<£10K per annum); middle income
(£10K - £19,999 per annum); and, higher income (£20K + per annum). Religion
has been derived from two Northern Ireland census questions (see questionnaire in
Appendix One) and has been recategorised into Roman Catholic and Protestant.
The disability variable is based on the Census 2001 definition (see questionnaire in
Appendix One). Political affiliation is based on a question asking respondents to
describe their political affiliation, which in turn was recategorised into either
Nationalist or Unionist. Finally, sexual orientation was recategorised into two
categories: heterosexual; and gay, lesbian or bisexual.

Equality Commission (Research on Age-Related Issues and Attitudes - 2007)
7
2. KNOWLEDGE OF EQUALITY EMPLOYMENT (AGE) REGULATIONS
2006
2.1 Public awareness of when Age Discrimination became unlawful
The first item in the survey sought to discover the extent of awareness among the
general public that age discrimination had became unlawful on 1 October 2006.
The survey revealed that just under half (46%) of respondents were aware that Age
discrimination had become unlawful in October 2006, with 54% unaware of the
change in legislation. Middle-aged respondents and those approaching retirement
(45 – 64 years), were most likely to be aware of legislative change (57%), while the
youngest group (16 – 29 years ) were the least likely to be aware (35%). Single
people (60%) were less likely to exhibit knowledge that the law had changed, than
either married (50%) or widowed, divorced or separated people (54%) (Table A1.1,
in Appendix Two).
Nearly two-thirds (62%) of those respondents with higher level qualifications were
aware that age discrimination had become unlawful, compared with just under half
(49%) of those with lower level qualifications, and a third (34%) of those with no
formal qualifications. Again, those respondents with a higher income (£20K+) were
more likely to be aware (70%) than those on a medium (47%) or low income (31%).
Awareness was also higher among the higher social classes (ABC1, 55%)
compared with the lower social classes (C2DE, 38%) (Table A1.1).
2.2. Awareness of the Equality Employment (Age) Regulations (NI) 2006
The survey also sought to ascertain the extent of public awareness of the Equality
Employment (Age) Regulations (NI) 2006.
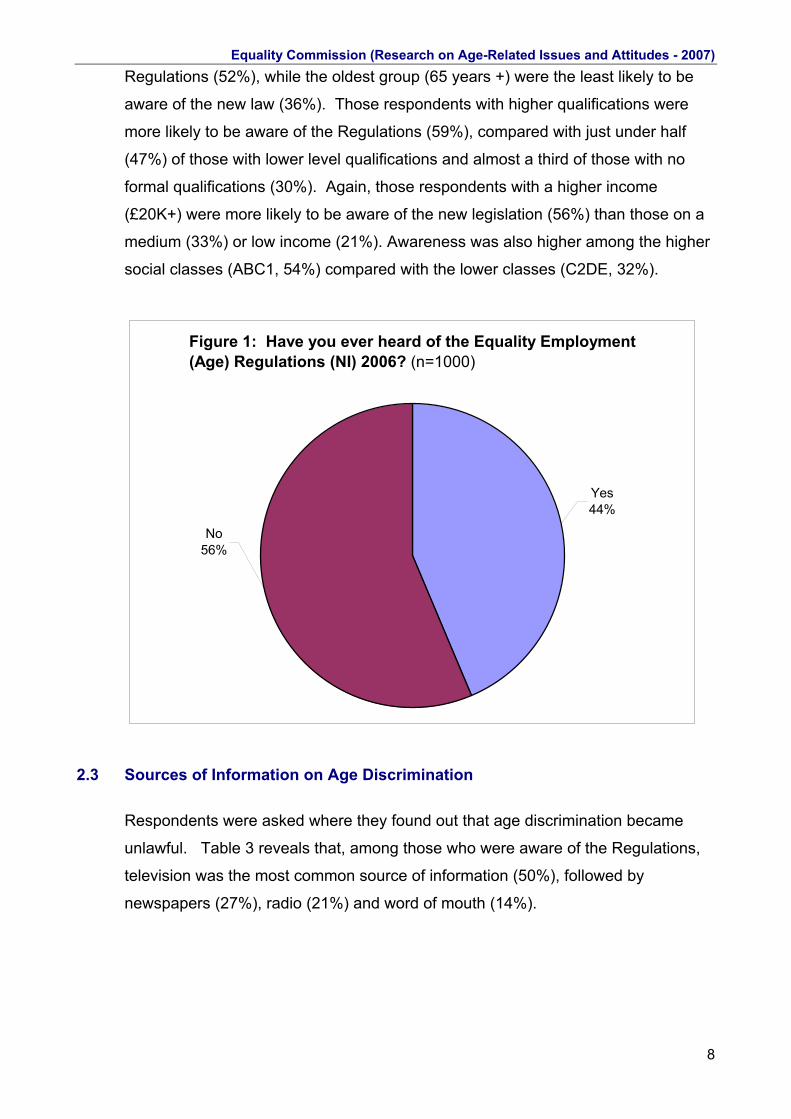
The findings revealed that 44% of respondents were aware of the existence of the
Regulations (see Figure 1). As before, there were significant variations by age,
education, income and social class (Table A2.1). Middle-aged respondents, and
those approaching retirement (45 – 64) were most likely to be aware of the
Equality Commission (Research on Age-Related Issues and Attitudes - 2007)
8
Regulations (52%), while the oldest group (65 years +) were the least likely to be
aware of the new law (36%). Those respondents with higher qualifications were
more likely to be aware of the Regulations (59%), compared with just under half
(47%) of those with lower level qualifications and almost a third of those with no
formal qualifications (30%). Again, those respondents with a higher income
(£20K+) were more likely to be aware of the new legislation (56%) than those on a
medium (33%) or low income (21%). Awareness was also higher among the higher
social classes (ABC1, 54%) compared with the lower classes (C2DE, 32%).
Figure 1: Have you ever heard of the Equality Employment (Age) Regulations (NI) 2006? (n=1000)
No56%
Yes44%
2.3 Sources of Information on Age Discrimination
Respondents were asked where they found out that age discrimination became
unlawful. Table 3 reveals that, among those who were aware of the Regulations,
television was the most common source of information (50%), followed by
newspapers (27%), radio (21%) and word of mouth (14%).

Equality Commission (Research on Age-Related Issues and Attitudes - 2007)
9
Table 3: Where did you find out that age discrimination became unlawful? (n=563)
% N Television 49.6 279 Newspapers / magazine articles 27.3 154 Radio (generally) 21.1 119 Word of mouth 13.9 78 Work-related training course 11.7 66 HR department (personnel) 8.0 45 Advertising on public transport and billboards 6.2 35 Citizens Advice Bureau 5.5 31 Community Groups 3.9 22 Trade Union 3.0 17 Equality Commission 2.8 16 Equality Commission leaflet or guide book 2.1 12 Labour Relations Agency 1.8 10 Law Centre 1.8 10 Poster or Billboard Advertisements 1.6 9 Equality Commission newsletter (Equality focus) 1.4 8 Special interest groups (e.g. LGB / racial-ethnic / disability / women ) 1.4 8 Human Rights Commission 1.1 6 Tribunal offices 0.7 4 Solicitor 0.0 0 Other 4.4 25 Refused 1.2 7
2.4 Perceived awareness of protection afforded under the Regulations The Age Regulations provide protection against direct and indirect age
discrimination and harassment for various groups in Northern Ireland, including
employees, job applicants, students, contract workers, and those using recruitment
agencies and trade organisations2.
Respondents were asked which groups are protected by the Regulations. Almost
three-quarters (70%) said they were aware who was protected (see Figure 2).
2 ECNI (2006) Age Discrimination in Northern Ireland: A Guide for Workers and Employees. Employment Equality (Age) Regulations (Northern Ireland) 2006 provides further details on the groups covered by the Regulations.

Equality Commission (Research on Age-Related Issues and Attitudes - 2007)
10
There was a geographical difference in perceived awareness levels, with people
living in Belfast (82%) more likely to be aware of who was protected, compared with
those living in the West of Northern Ireland (70%) or East of Northern Ireland (65%)
(Table A4.1).
Respondents with Higher level qualifications (81%) were more likely to state they
were aware, than those with lower level qualifications (73%), or with no
qualifications (53%). Similarly, respondents with higher incomes (£20K+, 80%)
were more likely to have a perceived awareness than either those on medium
(£10K - £19,999, 69%) or low incomes (<£10, 52%). Higher social classes (ABC1,
75%) were also more likely to state they were aware, compared with the lower
classes (C2DE, 64%) (Table A4.1).
Figure 2: Do you know who is protected from discrimination on the basis of age? (n=562)
Yes70%
No30%
2.5. Actual awareness of Groups protected by the Legislation
In a follow-up from the previous item, respondents where then directly asked to
name the groups protected under the Regulations (unprompted).
Among those who had earlier stated they were aware of who is protected by the
Regulations, two-thirds (66%) correctly named job applicants and employees, while

Equality Commission (Research on Age-Related Issues and Attitudes - 2007)
11
13% stated contract workers and 10% named persons using employment agencies
as being protected groups (see Figure 3).
Of those who chose ‘other’, almost half (48%) suggested that ‘everyone’ is
protected from discrimination on the basis of age.
15%
9%
9%
10%
13%
66%
66%
0 10 20 30 40 50 60 70
%
Job applicants
Employees
Contract Workers
Persons using employmentagencies
Persons in vocationaleducation
Students/potential studentsin further/higher education
Other
Figure 3: Perceptions of Categories covered by the Age Regulations (n=393)
2.6 Protection afforded to either those in Work or seeking Work
Along with direct age discrimination, the Age Regulations also cover age-related
indirect discrimination, victimisation, harassment and unfair treatment arising from a
failure to carry out an age-discriminatory instruction.
The survey probed respondents understanding of the types of discriminatory
behaviour outlawed by the Regulations.
Just over half (51%) knew that the Regulations protected them against direct
discrimination, compared with 14% who stated that indirect discrimination was also
included in the legislation. Thirteen percent of respondents were aware that the

Equality Commission (Research on Age-Related Issues and Attitudes - 2007)
12
Regulations protected workers against harassment on the grounds of age (Figure
4).
Respondents showed a low awareness level of the following types of protection
offered by the Regulations: procedures for retirement (7%), discriminatory
advertising (7%), pay, excluding the National Minimum Wage (5%) and special
provisions for employees about to retire (6%).
1.4%
27%4.6%5.9%
6.9%7.3%7.3%7.3%
10%10%12%13%
14%51%
0 10 20 30 40 50 60
%
Direct age discrimination (too old/young for job)
Indirect age discrimination (rules and procedures)
Harassment
Opportunity for promotion
Victimization
Recruitment and selection procedures
Training provision
Selection for Redundancy
Procedures for retirement
Discriminatory Advertising
Special Provision for staff about to retire
Pay (not NMW)
Don’t Know
Other
Figure 4: Can you tell me in what ways the Age Legislation can protect people either in work or when looking for work? (n=1000)
2.7 The Default Retirement Age
Respondents were asked if they knew the default retirement age as defined in the
Regulations. The National Default Retirement Age is specified as 65 years, and
will be reviewed in 2011.

Equality Commission (Research on Age-Related Issues and Attitudes - 2007)
13
Just over half of respondents (56%) said they were aware of the default retirement
age, while the remainder (44%) did not know what the specified age was (Figure 5).
Again, those who had higher level educational qualifications (66%) were more likely
to state they knew the default retirement age than those with lower level
qualifications (54%) or those with no qualifications (48%) (Table A7a.1).
Similarly, respondents living in the West of Northern Ireland (65%) were more likely
to know the default retirement age than those living in Belfast (61%) or those in the
East of Northern Ireland (47%) (Table A7a.1).
Figure 5: Do you know what the Default Retirement Age is? (n = 562)
Yes56%
No44%
As a follow-up, respondents were then asked to state what the correct default
retirement age actually was.
Of those who had earlier indicated they knew what the default retirement age was,
just over two-thirds (71%) gave the correct answer of 65 years (see Table 4). The
most common incorrect response was 60, as reported by just over a fifth (21%) of
respondents.

Equality Commission (Research on Age-Related Issues and Attitudes - 2007)
14
Table 4: What is the Default Retirement Age? (respondents who indicated they knew the default retirement age, n=311)
Age N % 50 2 0.6 55 2 0.6 60 64 20.6 61 1 0.3 65 222 71.4 67 8 2.6 68 4 1.3 70 8 2.6 N 311 100%
2.8. The Provision of Goods, Facilities and Services
The provision of goods, facilities and services, such as service in a shop or
restaurant, is specifically excluded from the scope of the legislation. Respondents
were asked to state whether they agreed with these exclusions.
Nearly half (45%) of respondents either strongly or moderately disagreed with the
exclusion of goods, facilities and services from legislative protection; while 9%
either strongly or moderately agreed. The remainder of the sample (46%) were
undecided or did not know (Figure 6).
Roman Catholics were slightly more likely to disagree with the exclusion of goods,
facilities and services (72%) than Protestants (68%). Similarly, respondents with
lower educational qualifications were more likely to disagree with the exclusion
(73%) than those with higher qualifications (56%) or no qualifications (73%).
Finally, residents in Belfast (79%) were more likely to disagree with the exclusion,
compared with those living in the West of Northern Ireland (75%) or those in the
East of Northern Ireland (55%) (Table A8.1).

Equality Commission (Research on Age-Related Issues and Attitudes - 2007)
15
34%
37%
8%
13%
4%
5%
0 5 10 15 20 25 30 35 40
%
Strongly agree
Moderately agree
Undecided
Moderately disagree
Strongly disagree
Don’t know
Figure 6: Currently Age Discrimination Legislation does not cover the provision of goods, facilities or services. Do you agree or disagree with this? (n=999)
2.9 Organisation responsible for receiving complaints under the Age Regulations
An important function of the Commission is to provide advice and guidance to the
general public and employers on areas of discrimination, including age
discrimination. Under certain circumstances, this may include advice and financial
support to enable complainants to pursue a case to an industrial tribunal.
Respondents were asked to name the organisation they should complain to
(unprompted) if they felt they were being discriminated against because of their
age.
One in five respondents (20%) correctly named the Equality Commission, followed
by the Citizens Advice Bureau (14%) and the Labour Relations Agency (5%). Other
responses included Age Concern and the respondent’s employer. Significantly,
almost half (49%) of respondents did not know the name of the appropriate body
for processing their complaint (Figure 7).

Equality Commission (Research on Age-Related Issues and Attitudes - 2007)
16
49%5.2%0.2%
0.31%
1%
1%1
2%
2%5%
14%
20%
0 5 10 15 20 25 30 35 40 45 50
%
Don’t Know
Other
The Northern Ireland Assembly
Disability Action
ACAS
Northern Ireland ombudsman
Northern Ireland Office
Office of the First Minister and Deputy First Minister
Northern Ireland Consumer Council
Human Rights Commission
Labour Relations Agency
Citizens Advice Bureau
Equality Commission for Northern Ireland
Figure 7: Can you tell me what you think is the name of the organisation you should complain to if you think you have been discriminated against because of your age? (n=1000)
Table B1.1 (in Appendix Two) shows that those aged 30 – 44 (24%) were more
likely than other age bands to correctly identify the Equality Commission as the
lead organisation for complaints, with those aged 16 – 29 years the least likely
(16%) to cite the Commission. Again, respondents with higher level qualifications
(34%) were considerably more likely than those with lower level qualifications
(20%), or those with no qualifications (9%) to identify the Commission. Similarly,
respondents with a Nationalist affiliation (18%) were twice as likely as those with a
Unionist affiliation (9%) to cite the Commission as the lead organisation for
complaints. Residents living in Belfast (26%) were also more likely to cite the
Equality Commission than those living in the West of Northern Ireland (22%) or in
the East of Northern Ireland (16%). Finally, those with a higher income were more
likely to correctly identify the Commission (24%), compared with other income
groups (<£10K, 9%; £10K - £19999, 13%).

Equality Commission (Research on Age-Related Issues and Attitudes - 2007)
17
Half (50%) of those who chose ‘other’ believed they should complain to Age
Concern or their employer if they had been discriminated against in relation to age
(Table 5).
Table 5: The name of the organisation you should complain to if you think you have been discriminated against because of your age (Other Responses, n=52)
% N Age Concern 25.0 13 Employer 25.0 13 Trade Union 13.5 7 Solicitor 7.7 4 Politician 5.8 3 Fair Employment Agency 5.8 3 Police 5.8 3 Tribunal 3.8 2 Citizen Advice 1.9 1 Ombudsman 1.9 1 Salvation Army 1.9 1 Trading Standards 1.9 1 N 52
2.10 Services provided by the Equality Commission in relation to Age Discrimination
The Commission provides a range of services pertaining to age discrimination.
These include information and guidance for employers and the general public on
the Age Regulations; advice and financial assistance for discrimination cases;
research on age-related issues, and anti-age discrimination information and training
seminars for employers.
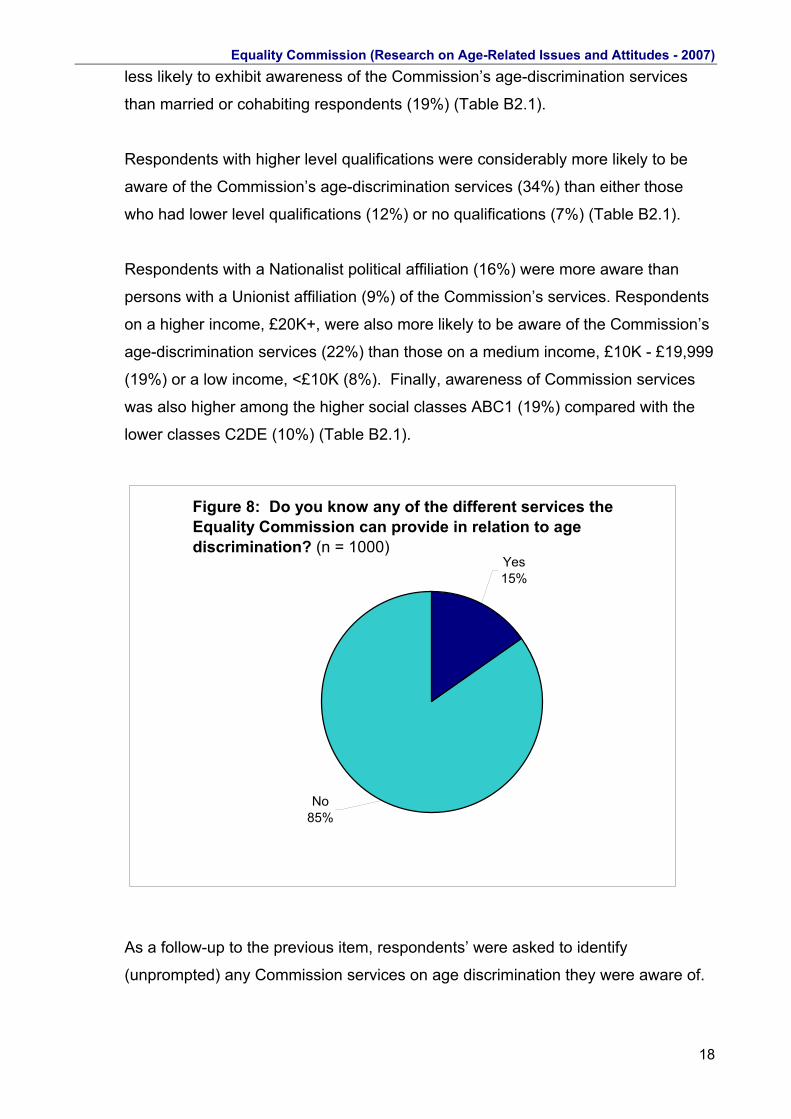
The survey sought to measure the level of unprompted awareness of any of the
services which the Equality Commission can provide in relation to age
discrimination. Fifteen percent said they were aware of the services provided by
the Commission in relation to age, while the remainder (85%) did not know of any
such services (Figure 9). Respondents aged 30 – 44 were most likely to be aware
of the age-discrimination services provided by the Commission (21%), compared to
the youngest group (16 – 29) who were the least likely to be aware (11%). Single
people (12%) and those who were widowed, separated or divorced (8%) were both
Equality Commission (Research on Age-Related Issues and Attitudes - 2007)
18
less likely to exhibit awareness of the Commission’s age-discrimination services
than married or cohabiting respondents (19%) (Table B2.1).
Respondents with higher level qualifications were considerably more likely to be
aware of the Commission’s age-discrimination services (34%) than either those
who had lower level qualifications (12%) or no qualifications (7%) (Table B2.1).
Respondents with a Nationalist political affiliation (16%) were more aware than
persons with a Unionist affiliation (9%) of the Commission’s services. Respondents
on a higher income, £20K+, were also more likely to be aware of the Commission’s
age-discrimination services (22%) than those on a medium income, £10K - £19,999
(19%) or a low income, <£10K (8%). Finally, awareness of Commission services
was also higher among the higher social classes ABC1 (19%) compared with the
lower classes C2DE (10%) (Table B2.1).
Figure 8: Do you know any of the different services the Equality Commission can provide in relation to age discrimination? (n = 1000)
No85%
Yes15%
As a follow-up to the previous item, respondents’ were asked to identify
(unprompted) any Commission services on age discrimination they were aware of.

Equality Commission (Research on Age-Related Issues and Attitudes - 2007)
19
Of those respondents who indicated they knew of services provided by the
Commission in relation to age (n = 153), just over half (56%) named “advising
people who may have experienced age discrimination”, while 40% were aware of
the Commission’s information and publications on age discrimination. A quarter
(25%) knew that the Commission provides information for employers on its website,
while 16% were aware that the Commission hosts training seminars and workshops
for employers (Table B3).
Fourteen percent were aware that the Commission can provide financial support to
enable those who may have experienced age discrimination to take a case to
tribunal (Table B3). Cell sizes were too small to permit any further analysis by
demographic variables.

Equality Commission (Research on Age-Related Issues and Attitudes - 2007)
20
Equality Commission (Research on Age-Related Issues and Attitudes - 2007)
21
3 ATTITUDES TOWARDS AGE-RELATED ISSUES
This section of the survey examined public attitudes towards a range of age-related
issues. 3.1 Perceptions of Young, Middle aged and Older workers
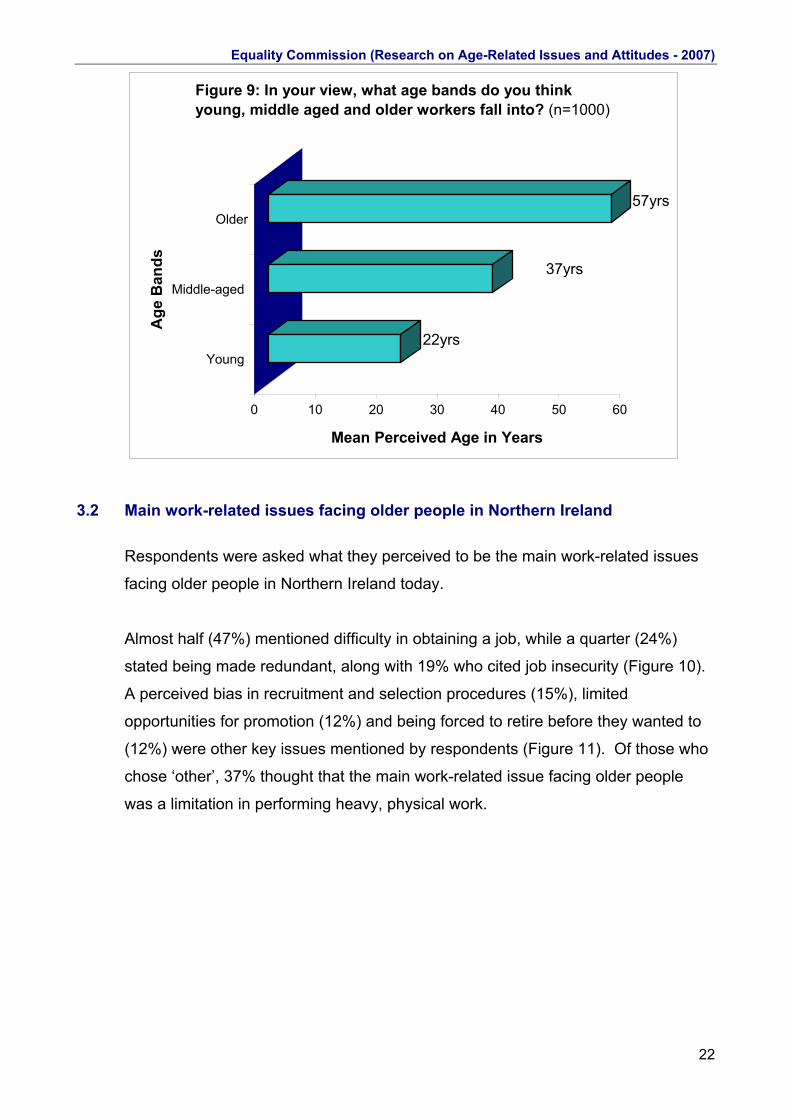
Respondents were asked their perception of what constitutes a young, middle-aged
and older worker (Figure 9).
For perceptions of what constitutes a “young worker” respondents gave a range of
17 – 27 years with a mean value of 22 years. Perceptions of what represents a
“middle-aged worker” elicited a range of 30 – 44 years with a mean value of 37
years. For “older workers” there was a range of 46 – 67 years with a mean value of
56 years (Table C1).
Analysis of the main demographic variables (e.g. age, marital status, religion,
disability, educational level and area of residence) produced only minor differences
in respondent’s perceptions of young, middle-aged and older workers (Tables C1.1,
C1.2, C1.3).
Equality Commission (Research on Age-Related Issues and Attitudes - 2007)
22
22yrs
37yrs
57yrs
0 10 20 30 40 50 60
Mean Perceived Age in Years
Young
Middle-aged
Older
Age
Ban
ds
Figure 9: In your view, what age bands do you think young, middle aged and older workers fall into? (n=1000)
3.2 Main work-related issues facing older people in Northern Ireland
Respondents were asked what they perceived to be the main work-related issues
facing older people in Northern Ireland today.
Almost half (47%) mentioned difficulty in obtaining a job, while a quarter (24%)
stated being made redundant, along with 19% who cited job insecurity (Figure 10).
A perceived bias in recruitment and selection procedures (15%), limited
opportunities for promotion (12%) and being forced to retire before they wanted to
(12%) were other key issues mentioned by respondents (Figure 11). Of those who
chose ‘other’, 37% thought that the main work-related issue facing older people
was a limitation in performing heavy, physical work.

Equality Commission (Research on Age-Related Issues and Attitudes - 2007)
23
21%
5%
4%
5%
12%
12%
15%
16%
19%
24%
47%
0 10 20 30 40 50
%
Difficulty in getting a job
Being made redundant
Job insecurity
Changing your job
Biased recruitment and selection procedures
Opportunities for promotion
Forced to retire before they want to
Access to training opportunities
Harassment by managers
Other
Don’t know
Figure 10: What do you think are the main work-related issues facing older people in NI today? (n=1000)
3.3 Main work-related issues facing younger people in Northern Ireland Respondents were then asked what they perceived to be the main work-related
issues facing younger people in Northern Ireland today.
Just over half (54%) of respondents mentioned difficulties in obtaining a job, while
35% stated that meeting essential criteria when applying for a job. A quarter (25%)
named the National Minimum Wage as an important issue facing younger people in
Northern Ireland today (Figure 11).
Amongst the ‘other’ responses (n = 46), “lack of experience” was mentioned by 19
respondents, while 12 said “attitude” and 3 mentioned either “poor pay”, “poor
treatment and exploitation” or “competition with foreign workers”.

Equality Commission (Research on Age-Related Issues and Attitudes - 2007)
24
18%
5%
4%
5%
11%
25%
35%
54%
0 10 20 30 40 50 60
%
Getting a job
Meeting the essential criteriawhen applying for a job
National Minimum Wagerates
Job insecurity
Access to trainingopportunities
Harassment by managers
Other
Don’t know
Figure 11: What do you think are the main work-related issues facing younger people in NI today? (n=1000)
3.4 Attitudes towards National Minimum Wage Differentials At the time the survey fieldwork was conducted (April 2007), the National Minimum
Wage (NMW) was £3.30 per hour for 16 – 17 year olds; £4.45 for 18 – 21 year
olds; and £5.35 for those aged 22 or over. Respondents were asked for their views
on the differential rates of the NMW.
A large majority (70%) stated that the different rates payable to young people
between the ages of 16 and 22 years were unfair, while a quarter (25%) said the
difference was fair (Figure 12).
Females (77%) were more likely than males (70%) to say that the different rates
payable to younger people between the ages of 16 and 22 years were unfair.
Similarly, respondents in the youngest age band (16 – 29 years old) were more

Equality Commission (Research on Age-Related Issues and Attitudes - 2007)
25
likely (80%) than older people to view the different rates as unfair: 30 – 44 years old
(74%), 45 – 64 years old (73%), and 65 or over years old (62%) (Table C4.1).
Respondents with dependents (80%) were more likely to view the different rates as
unfair compared with respondents with no dependents (71%). Respondents living
in the East of Northern Ireland were more likely to state that the different rates were
unfair (79%), compared with those living in Belfast (69%) or in the West of Northern
Ireland (70%) (Table C4.1).
3.5 Treatment of Older Workers in Employment The views of respondents were sought on how older people are treated in work.
More specifically, whether they received more or less favourable treatment than
their younger colleagues.
Just over half of those surveyed (58%) were of the view that older people in work
are, on the whole, treated “the same” as younger workers, compared with one tenth
of respondents (10%) who thought they were treated more favourably, and 6% who
thought they were treated “worse” (Figure 13).
There was an inverse relationship between perceptions of more favourable
treatment for older workers and the age of respondents: i.e. the younger the
Figure 12: The National Minimum Wage is different depending on the age of the employee. Do you think this difference is fair or unfair? (n=998)
Unfair70%
Don’t Know5%
Fair25%

Equality Commission (Research on Age-Related Issues and Attitudes - 2007)
26
respondent, the more likely they were to perceive favourable treatment toward their
older colleagues. It was found that, while 22% of those in the youngest age band
(16 – 29 years old) perceived that older people were treated better than younger
workers, this fell to 13% for 30 – 44 year olds, 12% for 45 – 64 year olds, and 4% of
those aged 65 or over (Table C5.1).
Single people were more likely to perceive that older workers were treated more
favourably than younger workers, compared with married / cohabiting (14%), and
widowed, separated and divorced respondents (5%) (Table C5.1).
Respondents with higher level qualifications were also more likely to perceive more
favourable treatment for older workers (20%) than those with lower level
qualifications (13%) or no qualifications (9%) (Table C5.1).
Those respondents who perceived older workers to be more favourably treated
were asked to state why they held this view. Just over a third of (36%) thought
older people are treated more favourably than younger people because they had
26%
58%
6%
10%
0 10 20 30 40 50 60
%
Better
Worse
Same
Don’t Know
Figure 13: Do you think that older people in work are, on the whole, treated better or worse than younger people in this country because of their age? (n=997)

Equality Commission (Research on Age-Related Issues and Attitudes - 2007)
27
“more experience”, compared with almost a quarter (24%) who said that older
people were entitled to “more respect” (Table C5a).
Similarly, those respondents who perceived older workers to be less favourably
treated were also given the opportunity to state why they held this view. A fifth
(20%) thought older people are treated less favourably [than younger people]
“because of their age”, compared with 17% who said that older people were
“downtrodden” or “taken advantage of” (Table C5b).
3.6 Treatment of Younger Workers in Employment Following the questions on older workers, respondents were then asked for their
views on young people in employment. Specifically, whether they thought that
younger workers were treated more or less favourably than older workers.
Over half of respondents (58%) believed that younger people in work are treated
“the same” as older people because of their age, compared with a tenth (10%) who
thought they were treated “worse” and 4% who thought they were treated “better”
(Figure 14).
Younger respondents, aged 16 – 29 years (19%), were more likely to say that
young people in work were treated less favourably than older people, compared
with those aged 30 – 44 (15%), 45 – 64 (11%) or those aged 65+ (6%) (Table
C6.1).

Equality Commission (Research on Age-Related Issues and Attitudes - 2007)
28
28%
58%
10%
4%
0 10 20 30 40 50 60
%
Better
Worse
Same
Don’t Know
Figure 14: Do you think that younger people in work are, on the whole, treated better or worse than younger people in this country because of their age? (n = 999)
Those respondents who perceived younger workers to be more favourably treated
than older workers were asked to state why they held this view. A quarter of
respondents (26%) thought younger people in work are treated better than older
people because work was “easier for them”, compared with 19% who said young
people had “more opportunities” and 17% who gave the reason “because they are
young” (Table C6a).
Similarly, those respondents who perceived younger workers to be less favourably
treated than older workers were also given the opportunity to state why they held
this view. Forty three percent of respondents said that younger people are treated
less favourably because “employers take advantage of younger workers”,
compared with 20% who said that young people “lack experience”. Six percent
explained the perceived differential treatment of young people as resulting from
young people being “younger and less mature”, or “lazy and lacking commitment”
(Table C6b).

Equality Commission (Research on Age-Related Issues and Attitudes - 2007)
29
3.7 Attitudes towards Age in the Workforce: a Training Course scenario At this point in the survey, respondents were presented with a theoretical scenario,
wherein two colleagues, a 30 year old and a 55 year old, have both applied for
management training and meet the eligibility criteria. Respondents were then
asked to imagine themselves as the line-manager and to decide which employee
should be sent on the course first.
More than half of respondents (56%) gave an equivocal response saying “it
depends”, while almost a quarter (24%) indicated they would send the younger
man first, and 12% said they would send the older man first (Figure 15). Other
responses included sending “the best person for the job”, or that the choice should
be “based on qualifications” and “experience”.
The equivocal response of “it depends” was the predominant choice for all
demographic groups (e.g. age, marital status, education, social class, area of
residence etc). Those within each group who had a definite preference generally
preferred to send the younger man first, with two exceptions, those on the lower
income and those aged 65 years and above. That is 25% of those on a low income
(<£10K) preferred to send the older man first, compared with 24% who said they
would send the younger man first; and respondents aged 65 years and older were
divided in their preference of trainee with 20% opting for each (Table C7.1).
When analysing the responses of those who declared they would send the younger
man first, it was found that the youngest respondents (16 – 29 years) were more
likely to hold this view (35%), compared with those aged 30 – 44 years (25%), 45 –
64 years (18%) or 65+ (20%). Single people (34%) were also more likely to say
they would send the younger man first than married or cohabiting persons (21%),
or those widowed, divorced or separated (19%). Similarly, those with no
qualifications and low level qualifications (both 27%) were more likely to support
this viewpoint than those respondents with higher level qualifications (21%) (Table
C7.1).
Respondents on a medium incomes, £10K - £19,999 (25%) were more likely to say
they would send the younger man first than those on a higher income, £20K+
(21%) or a low income, <£10K (24%). Again, respondents from the lower social

Equality Commission (Research on Age-Related Issues and Attitudes - 2007)
30
classes C2DE were more likely to support this view (29%) than those from the
higher social classes ABC1 (23%) (Table C7.1).
Finally, residents living in the West of Northern Ireland (31%) were more likely to
say they would send the younger man first than those living in Belfast (29%) or the
East of Northern Ireland (20%) (Table C7.1).
7%
2%
56%
12%
24%
0 10 20 30 40 50 60
%
Younger man first
Older man first
It depends
Other
Don’t Know
Figure 15: Suppose a 30 year old man and an older man of 55 years have both applied for management training and meet the eligibility criteria. If you were manager and had a choice, which man would you prefer to send on the course first? (n=998)
Training Course Preferences: why send the younger man first?
Those respondents, who declared they would prefer to send the younger man on
the Training Course first, were then asked to explain their choice.
Over half (55%) explained their choice by suggesting the younger man “would work
for longer”, while 9% said the younger man would be “easier to train”. A similar
proportion (8%) remarked that the younger man would be “healthier and fitter”
(Table C7a).

Equality Commission (Research on Age-Related Issues and Attitudes - 2007)
31
Training Course Preferences: why send the older man first?
Those respondents, who declared they would prefer to send the older man first,
were also asked to explain their choice.
Over two-thirds (69%) said that they would prefer to send the older man first
because he would have “more experience” while (22%) said the older man would
be more “mature, responsible and loyal” (Table C7b).
3.8 Views on Flexible Retirement Age There was considerable public support for the statement that “people should be
allowed to retire when they want to”. Nearly two-thirds (62%) either strongly or
moderately agreed, with 10% disagreeing and 16% undecided (Figure 16).
Similar proportions of Protestants and Roman Catholics (72%) agreed that people
should be allowed to retire when they want to, while residents living in Belfast
(85%) and the West of Northern Ireland (72%) were more likely to agree than those
living in the East of Northern Ireland (65%). Nationalists (73%) were more likely
than Unionists (67%) to agree with the statement (Table C8.1).

Equality Commission (Research on Age-Related Issues and Attitudes - 2007)
32
12%
5%
4%
16%
16%
46%
0 5 10 15 20 25 30 35 40 45 50
%
Strongly agree
Moderately agree
Undecided
Moderately disagree
Strongly disagree
Don’t know
Figure 16: It has been suggested that people should be allowed to retire when they want to. Do you agree or disagree? (n=996)
3.9 Reasons why people should be allowed to retire when they want to As a follow-up to the previous item, respondents were probed on the reasons why
they advocated a more flexible approach to retirement.
Of those respondents who agreed with a more flexible approach to retirement, just
over half (53%) said that being allowed to retire when they wanted to was important
because it provided “freedom of choice”. A further 16% remarked that flexible
retirement allowed people the choice to retire “if they can afford it”, while 11% said
people should be allowed to continue working “if they were fit and healthy”. Other
respondents noted that “some people wanted to continue working” but are currently
prevented from doing so (Table C9).
3.10 Preferred options concerning work and retirement Respondents were asked to reflect on their own present situation and indicate their
preferred choice regarding work and retirement.

Equality Commission (Research on Age-Related Issues and Attitudes - 2007)
33
One third (34%) agreed that their decision to retire would depend upon “my
situation at the time”, while the same proportion (34%) preferred to retire early.
Just over a tenth (13%) indicated they would prefer to work beyond the current
retirement age, with the same proportion (13%) saying they would like to retire at
the current retirement age. Two percent were already working beyond the
retirement age (Figure 17).
4%
2%
6%
6%
13%
34%
34%
0 5 10 15 20 25 30 35
%
It depends on my situation atthe time
I prefer to retire early
I prefer to retire at the currentretirement age
I prefer to work F/T beyond mycurrent retirement age
I prefer to work P/T beyond mycurrent retirement age
I currently work beyond thecurrent retirement age
Don’t know
Figure 17: Thinking about your own personal situation now, what would be your preferred option concerning work and
retirement? (n=683)
Analysis of Responses by Demographic Category
Basing the decision to retire on “my situation at the time” was the leading
preference for those aged 16 – 29 years, while a wish to retire early was the
preference for those aged 30 – 64 years. The preference for working beyond
retirement was directly associated with age: that is, the older the respondent, the
more likely they were to prefer working past the current retirement age. Thus, 61%
of those aged 65+ preferred to work beyond retirement age (or were continuing to

Equality Commission (Research on Age-Related Issues and Attitudes - 2007)
34
work), compared with 18% of those aged 45 – 64; 13% of those aged 30 – 44; and
9% of those aged 16 – 29 years (Table C11.1).
Again, basing the decision on “my current situation at the time” was the lead
preference for single persons (43%), followed by married and cohabiting
respondents (33%) and widowed, separated or divorced individuals (21%).
Widowed, separated or divorced respondents were more likely to have a
preference for working beyond retirement (30%) compared with married or
cohabiting (17%) or single (11%) respondents (Table C11.1).
Similarly, “my situation at the time” was the lead preference for those respondents
with either higher level qualification (36%) or no qualifications (30%), while those
with lower level qualifications preferred to retire early (42%) above all other
choices. Respondents with no qualifications (28%) were more likely to indicate a
preference for working beyond retirement, compared with those with higher (16%)
or lower (10%) qualifications (Table C11.1).
Marked differences emerged in retirement preferences for those on different
income levels. Respondents in the lowest income bracket, <£10K were much more
likely to base their decision on “my situation at the time” (61%), compared with just
over a third (37%) of those on middle range incomes, £10K - £19,999, and 23% of
those on the highest income band, £20K+. In contrast, those in the highest income
band where considerably more likely to prefer early retirement (49%) than those in
other income bands (Table C11.1).
Residents living in Belfast (45%) were more likely to agree their decision to retire
would “depend on my situation at the time” compared with those living in the West
of Northern Ireland (34%) or East of Northern Ireland (33%). Residents of Belfast
were also considerably less likely to express a desire to retire at the current
retirement age (5%) than those respondents living in the East of Northern Ireland
(15%) or West of Northern Ireland (16%) (Table C11.1).

Equality Commission (Research on Age-Related Issues and Attitudes - 2007)
35
3.11 Main reason for currently working beyond the present retirement age or wishing to carry on working beyond retirement
As a follow-up to the previous item, respondents who were either currently working
beyond the present retirement age (65 years), or wished to continue working past
retirement, were asked to indicate why they held this view.
Just over half (54%) agreed with the statement that “they needed/ would need the
money and could not afford to retire”, compared with a quarter (26%) who agreed
that work would provide an “opportunity for social interaction”. One in six (16%)
respondents agreed that they “enjoyed their current job and did not want to stop
working” (Figure 18).
0.6%
0.6%
0.6%
3%
16%
26%
54%
0 10 20 30 40 50 60
%
I need/would need the money and cannot/couldn’t afford toretire.
It gives me/would give me the opportunity for socialinteraction.
I really enjoy my current job and don’t want to stop working.
I want to build a bigger pension pot / keep saving.
Far better for you
Keep fit and healthy
Work advising/consultancy to keep active mentally
Figure 18: What is the main reason why you want to carry on working or are currently working beyond retirement age? (n =170)
3.12. Attitudes towards Older Workers
This item examined attitudes towards older workers, using stereotypical statements
that may be in common usage.
Equality Commission (Research on Age-Related Issues and Attitudes - 2007)
36
Sixty one percent of respondents agreed that “older workers need younger
colleagues for their fresh ideas and energy”, while a similar proportion (62%)
agreed that “older workers are more loyal and dedicated”. Twenty two percent
agreed with the statement that “older workers struggle with the demands of a
modern workplace”, while 17% agreed that “you can’t teach an old dog new tricks”.
Two percent of respondents agreed with the statement that “older workers should
only accept jobs such as working in a supermarket or shop”3 (Table 6).
Analysis of Responses by Demographic Category
Each of the above statements was then analysed by demographic variables, as
follows:
Older workers need younger colleagues for their fresh ideas and energy
Residents living in Belfast (79%) were more likely to agree with this statement than
residents living in the West of Northern Ireland (62%) or East of Northern Ireland
(59%) (Table C13.1).
Older workers are more loyal and dedicated
Younger respondents aged 16 – 29 years were less likely to agree with the
statement (46%) that “older workers are more loyal and dedicated” than persons
aged 30 – 44 years (64%), 45 – 64 (73%) or those aged 65+ (74%). Similarly,
single respondents (57%) were less likely to lend support to the statement than
those who were married or cohabiting (66%) or those who were widowed,
separated or divorced (72%). Those respondents with higher level qualifications
(51%) were less likely to agree than those with lower level qualifications (62%) or
those with no qualifications (77%). Respondents from higher social classes (59%)
were less likely to support the statement, compared with those from lower social
classes (71%). Finally, residents living in the West of Northern Ireland were less
likely to agree (59%) than those living in the East of Northern Ireland (64%) or
those living in Belfast (74%) (Table C13.2).
3 There were no significant differences by demographic variables.

Equality Commission (Research on Age-Related Issues and Attitudes - 2007)
37
Older workers struggle with the demands of a modern workplace
Young people aged 16 – 29 years (30%) were more likely to agree with this
statement than those aged 30 – 44 (21%), 45 – 64 (21%) or those 65 years or older
(22%). Single people were more likely to agree (32%) compared with those who
were married or cohabiting (20%) or those who were widowed, separated or
divorced (19%). Similarly, those respondents from a Roman Catholic background
(27%) were more likely to support the statement than those from a Protestant
background (21%). Finally residents from Belfast (31%) were more likely to lend
support to the statement than those living in the West of Northern Ireland (26%) or
those from the East of Northern Ireland (19%) (Table C13.3).
You can’t teach an old dog new tricks
Residents in Belfast were more likely to agree with this statement (22%) than those
living in the West of Northern Ireland (21%) or East of Northern Ireland (14%).
Similarly, single persons (23%) were more likely to express support for the
statement than widowed, separated or divorced persons (17%), or those married or
cohabiting (15%) (Table C13.4).
Table 6: Do you agree or disagree with the following statements?
Agree
Undecided
Disagree Don’t Know
% % % %
N
Older workers need younger colleagues for their fresh ideas and energy.
61.1 15.5 19.4 4.0 1000
Older workers are more loyal and dedicated.
62.1 17.7 17.7 2.5 1000
Older workers struggle with the demands of a modern workplace.
22.3 20.8 51.2 5.7 1000
“You can’t teach an old dog new tricks” is a sensible saying.
17.2 16.3 62.8 3.7 1000
Older workers should only accept jobs such as working in a supermarket or shop.
2.3 3.8 86.0 7.9 1000
3.13. Attitudes towards Younger Workers This item examined attitudes towards younger workers, using stereotypical
statements that may be in common usage.

Equality Commission (Research on Age-Related Issues and Attitudes - 2007)
38
A large majority (77%) of respondents agreed with the statement that “younger
people need older colleagues for their advice and experience”, while opinion was
divided over the statement “Younger people are less committed and responsible in
their attitude to work”: 41% agreed, 32% disagreed and 22% were undecided.
Again, when respondents were presented with the statement that “younger people
are more energetic workers than older people”, opinion was also divided: 32%
agreed, 42% disagreed and 21% were undecided. Finally, when respondents were
asked to signify their agreement that “younger people are more involved in their
social life than in their work”, just under half agreed (48%), a quarter (26%) were
undecided and a fifth (21%) disagreed (Table 7).
Analysis of Responses by Demographic Category
Each of the above statements was then analysed by demographic variables, as
follows:
Younger people need older colleagues for their advice and experience.
Residents living in Belfast (93%) were more likely to agree with this statement,
compared with those living East of Northern Ireland (77%) or those living in the
West of Northern Ireland (76%) (Table C14.1).
Younger people are less committed and responsible in their attitude to work.
Men (47%) were more likely to agree with the statement than women (39%), while
young people aged 16 – 29 were less likely to agree (26%) than those aged 30 –
44 (42%), 45 – 64 (52%) or those aged 65+ (55%). Respondents with no
qualifications (57%) were more likely to agree than those with lower level (37%) or
higher level qualifications (36%). Similarly, widowed, separated and divorced
respondents were more likely to agree (53%) than married/cohabiting persons
(45%) or single people (35%). Again, those respondents from a lower social class
were more likely to support the statement (49%) than those from a higher social
class (39%) (Table C14.2).
Younger people are more energetic workers than older people.
Young people aged 16 – 29 were more likely to lend their support to this statement
(43%) than those aged 30 – 44 (27%), 45 – 64 (30%) or those aged 65+ (35%).

Equality Commission (Research on Age-Related Issues and Attitudes - 2007)
39
Similarly, respondents with no qualifications were more likely (40%) to agree than
those with lower level qualifications (31%) or those with higher qualifications (28%)
(Table C14.3).
Younger people are more involved in their social life than in their work.
There was a direct, inverse relationship between agreement with the statement and
the age of respondents, i.e. the younger the respondent, the less likely they were to
agree. Thus, 39% of those aged 16 – 29 were in agreement, compared with 53%
of those aged 30 – 44, 56% of those aged 45 – 64 and 60% of those aged 65+
(Table C14.4).
Table 7: Do you agree or disagree with the following statements?
Agree
Undecided
Disagree Don’t Know
% % % %
N
Younger people need older colleagues for their advice and experience.
77.4 12.1 7.8 2.7 1000
Younger people are less committed and responsible in their attitude to work.
40.9 22.4 32.0 4.7 1000
Younger people are more energetic workers than older people.
32.0 21.2 42.2 4.6 1000
Younger people are more involved in their social life than in their work.
48.2 25.5 20.8 5.5 1000
3.14 Treatment of Job Applicants aged 40 – 59 years Respondents were asked for their perceptions on how middle-aged people, and
those approaching retirement (40 – 59 years), were treated by employers when
looking for work.
Half of respondents (50%) said that middle-aged people and those approaching
retirement, were treated the same as younger people by potential employers,
compared with 15% who said they were treated worse, and 4% who said they were
treated better. Almost a third (30%) answered “Don’t Know” (Figure 19).
Married and co-habiting respondents were more likely to express the view that
those aged 40 – 59 were treated worse by prospective employees (25%) than

Equality Commission (Research on Age-Related Issues and Attitudes - 2007)
40
single people (16%) or widowed, separated or divorced persons (24%) (Table
C15.1).
4%
15%
50%
30%
0
10
20
30
40
50
60
%
Better Worse Same Don’t Know
Figure 19: Do you think that people in their 40s and 50s who are looking for work are generally treated better or worse than younger people by prospective employers? (n=999)
As a follow-up to the previous item, respondents were then asked to explain why
they felt that middle-aged job applicants may be treated more or less favourably
than younger people when applying for a job.
Of those respondents who indicated that middle-aged applicants were treated more
favourably (n = 40), 55% suggested it was because they had “more experience”,
while 20% said it was because they got “more respect” from employers (Table
C15a).
Of those respondents who indicated that middle-aged applicants were treated less
favourably (n = 151), over a third (36%) suggested it was “because of their age or
discrimination”, compared with a fifth (21%) who said “employers prefer younger
workers and lower pay”, and 19% who remarked that “older people find it more
difficult to get a job” (Table C15b).
Equality Commission (Research on Age-Related Issues and Attitudes - 2007)
41
3.15 Preference for Working with Persons of different Age Groups
Respondents were then asked to indicate their preferences for working with
colleagues of different ages.
Over three-quarters of those surveyed (76%) said they did not care what age their
colleagues were, compared with 13% who preferred to work with people the same
age as themselves, 3% who preferred colleagues to be older than them, and 2%
who preferred colleagues younger than them (Figure 20).
A similar picture emerged when the analysis was performed by demographic
variables, such as age, religion, area of residence etc: a large majority of all groups
had no age-related preferences, and “didn’t care what age their colleagues were”.
There were some minor differences, however. For example, of those who indicated
a preference, respondents aged 16 – 29 years were more likely to favour
colleagues of their own age (19%) than older age bands (11 – 13%). Similarly,
residents from the West of Northern Ireland were more likely to favour colleagues
of their own age (18%) than residents of Belfast (7%) or those living in the East of
Northern Ireland (14%) (Table C16.1).
5%
76%
13%
3%
2%
0 10 20 30 40 50 60 70 80
%
Younger than you
Older than you
Same age as you
Don’t care what agethey are
Don’t know
Figure 20: Do you or would you prefer to work with people who are...? (n=999)

Equality Commission (Research on Age-Related Issues and Attitudes - 2007)
42
3.16 Preference for being Line-managed by Persons of different Age Groups Following on from the previous item, respondents were then asked to indicate their
preference for the age of their line-manager.
Nearly three-quarters (72%) of those surveyed said they did not care what age their
manager was, compared with 17% who stated a preference for an older manager,
and 7% who preferred a manager of their own age. One percent of respondents
preferred to be managed by someone younger than them (Figure 21).
When an analysis was performed by demographic grouping, it was found that
respondents aged 16 – 29 years were more likely to prefer an older manager (30%)
than those aged 30 – 44 years (20%), 45 – 64 years (10%) or those aged 65+
(7%). Single people (27%) were more likely to prefer an older manager compared
with those who are married or cohabiting (14%) or those who are widowed,
divorced or separated (11%). Thirty percent of respondents earning £10K -
£19,999 also stated a preference for an older manager, compared with (23%) of
those on the lowest earnings band (<£10K) and 20% of those on the highest band
(£20K +). Twelve percent of those with a limiting long-term illness preferred an
older manager, compared with 19% of those without a disability (Table C17.1).
4%
72%
7%
17%
1%
0 10 20 30 40 50 60 70 80
%
Younger than you
Older than you
Same age as you
Don’t care what age theyare
Don’t know
Figure 21: Do you or would you prefer to be managed by someone who is...? (n=999)
Equality Commission (Research on Age-Related Issues and Attitudes - 2007)
43
4. PERSONAL EXPERIENCE OF AGE-RELATED DISCRIMINATION
In the final section of the survey, respondents were presented with a series of
questions about age discrimination in general, and their own experiences in
particular.
4.1 Age Discrimination in the Workplace
Respondents were asked to signify their level of agreement with the statement that
“there is a lot of age discrimination in modern workplaces.” Seventeen percent
were of the view that there is substantial age discrimination in the workplace, while
24% disagreed with the statement. Over half of those surveyed (59%) said they
didn’t know (Figure 22).
Figure 22: Some people have said that there is a lot of age discrimination in modern workplaces. Do you agree with this or not? (n=995)
Don’t Know59%
Yes, I agree17%
No, I disagree24%
Respondents from the lower social class category (C2DE) were more likely to
perceive discrimination in the workplace (47%) than those from the higher ABC1
group (37%) [Table D1.1].

Equality Commission (Research on Age-Related Issues and Attitudes - 2007)
44
4.2 Age Discrimination by Respondent’s own Employer
Those respondents in employment (N = 655) were then asked for their opinion on
whether or not their own employer discriminated on the grounds of age.
Four percent of respondents were of the view that their employer did discriminate
on the grounds of age, while 89% said no (Figure 23).
Figure 23: Do you think your employer discriminates on the grounds of age? (n = 655)
Don’t Know7%
Yes4%
No89%
As a follow-up, those respondents who had answered in the affirmative to the
previous item were then asked if they thought their employer discriminated against
older workers, younger workers or both (n = 23).
Respondents were divided on the issue: while ten said their employer discriminated
against younger workers, nine indicated that their employer discriminated against
older workers. Four respondents were of the view that their employer discriminated
against both older and younger workers (Table D3).

Equality Commission (Research on Age-Related Issues and Attitudes - 2007)
45
4.3. Personal Experience of Less Favourable Treatment on the Grounds of Age Respondents were then asked if they felt they had personally experienced less
favourable treatment from their employer because of their age. Overall, six percent
of those surveyed felt they had been unfairly treated by an employer because of
their age, while a large majority (90%) disagreed (Figure 24).
Perceptions of age-related unfair treatment by their employer were slightly more
prevalent in the youngest age band, 16 – 29 (10%), compared with those aged 30 –
44 (6%), 45 – 64 (4%) or 65 years and over (5%). Similarly, respondents with a
disability were more likely to feel they had been treated unfairly (12%) on the
grounds of age, compared with 6% of those without a disability. Finally, those with
higher level qualifications were also more likely to perceive less favourable
treatment (11%) compared with those who had lower level qualifications (6%) or no
qualifications (4%) (Table D4.1).
Figure 24: Have you ever felt that you were not treated as well as you might have been by an employer because of your age? (n = 994)
No90%
Don’t Know4%
Yes6%
In a follow-up to the previous question, those respondents who felt they had been
unfairly treated by their employer due to age (n = 62), were then asked to provide
more information.

Equality Commission (Research on Age-Related Issues and Attitudes - 2007)
46
Twenty three respondents (37%) reported being refused a job, while ten (16%) felt
they had been harassed or bullied by their employer and eight (13%) felt they had
been denied a promotion. Other responses included “being forced to retire or being
made redundant”, or that their “employer had a bad attitude towards older people”.
A number of respondents were also of the view that their “employer preferred
younger workers” (Table D5).
4.4 Age-Related Criteria in Job Adverts Respondents were asked to reflect upon jobs they had applied for in recent years,
and whether they had been deterred from applying because (i) an upper or lower
age limit was stipulated; (ii) the job advert contained words such as “mature”,
“young” or “energetic”; or (iii) the amount of experience required was excessive.
A substantial proportion (59%) of those respondents who had been deterred from
applying for a particular job in recent years (n = 128 – 31) said it was because they
considered the amount of experience required to be excessive. Over a quarter
(28%) had been put off applying where the advert contained words such as
‘mature’, ‘young’ or ‘energetic’, while 23% felt discouraged by an upper or lower
age limit specified in the job advert (Table 8).
Younger respondents (16 – 29 years) were most likely to report having been
deterred from applying for jobs because they considered the amount of experience
required to be excessive (74%), compared with those aged 30 – 44 years (44%), or
45 – 64 years (65%) (Table D7.1).
Table 8: Thinking about any jobs you wanted to apply for in recent years, have you been put off applying for the post because the job advert contained any of the following?
Yes No Don’t Know
% % %
N
An upper or lower age-limit. 23.4 61.7 14.8 128 The advert contained words such as “mature”, “young” or “energetic”.
27.9 57.4 14.7 129
The amount of experience required was excessive.
58.8 32.8 8.4 131

Equality Commission (Research on Age-Related Issues and Attitudes - 2007)
47
5. CONCLUSIONS 5.1 Awareness of Age Discrimination Legislation
The survey found that just under half (46%) of the general public in Northern Ireland were
aware that age discrimination became unlawful in October 2006. A similar proportion (44%)
exhibited awareness of the Equality Employment (Age) Regulations (NI) 2006. These
figures broadly support the findings of an earlier survey (Equality Commission, 2006), which
found higher levels of public awareness for mature legislation, such as the Sex
Discrimination Order (NI) 1976, and lower levels of knowledge of more recent statutes,
such as the Sexual Orientation Regulations 2005. In a theme which occurs throughout the
Report, those with higher level qualifications and from a higher social class, exhibited
greater awareness of age discrimination.
There was a high level of awareness that job applicants and employees were covered by
the Regulations (66%), but a much lower understanding that contract workers and persons
using employment agencies were also protected (13% and 10% respectively). Similarly, a
considerably higher proportion of respondents were aware that direct discrimination was
covered (51%), compared with indirect discrimination (14%) and harassment (13%).
The survey found a mismatch between perceived knowledge of the Regulations and actual
knowledge. Not only was this evident in awareness of the protected groups and types of
discrimination outlawed (see above), but also in relation to the Default Retirement Age:
29% of those who declared they knew what the default retirement age was (65 years) gave
an incorrect answer. These findings highlight the importance of further probing
respondents in a survey, rather than simply reporting a “yes/no” response.
The provision of goods, facilities and services is specifically excluded from the scope of the
Regulations. The survey found strong disapproval of this limitation (45%), with only 9%
agreeing with the exclusion. In the Northern Ireland Life and Times survey (ARK, 2004),
which was conducted more than two years prior to the introduction of the legislation, 71%
were in favour of the provision of goods and services being covered by the Regulations.
Equality Commission (Research on Age-Related Issues and Attitudes - 2007)
48
5.2 Services for People Discriminated on the Basis of Age
One in five respondents (20%) named the Equality Commission as the organisation they
should complain to if they felt they were being discriminated against because of their age.
This is marginally higher than the finding obtained by the Equality Awareness Survey
(Equality Commission, 2006), where 19% of respondents said that the Commission acts in
an advisory capacity to people who may have experienced discrimination. It is also higher
than the 11% of respondents in the previous survey who identified the Commission as the
body with overall responsibility for anti-discrimination laws in Northern Ireland. However,
almost half (49%) of respondents in the present survey stated that they did not know the
name of the appropriate body for processing their age discrimination complaint.
In addition to a complaints service, the Commission provides a range of other services
relating to age discrimination. This includes information and guidance publications for the
general public and employers, web-based information, research and policy initiatives, and
training seminars for employers.
The survey found that, when asked unprompted, 15% indicated knowledge of Commission
services that could assist them, while 85% did not know of any age-related services
provided by the Commission. The evidence indicates that lack of awareness was more
prevalent in the youngest and oldest age groups; persons with a Unionist political affiliation;
medium or low income earners; and those from a lower social class. The report
demonstrates that the financial assistance facility of the Commission in particular is not
widely known.
5.3 Attitudes towards Age-Related Issues
The survey revealed that a difficulty in obtaining employment was perceived as the main
work-related issue facing both younger (54%) and older people (47%) in Northern Ireland.
For younger people there were two other salient issues, namely: meeting the essential
criteria when applying for a job (35%) and the National Minimum Wage (25%).
The finding that both younger and older people in the current survey cited a difficulty in
obtaining employment as a key issue was echoed in the NILT Survey (ARK, 2004).
Equality Commission (Research on Age-Related Issues and Attitudes - 2007)
49
Although the overall percentage of the NILT sample citing this difficulty (10%) was smaller
than the current survey4, the groups most affected by difficulties in getting a job were the 18
– 24, 25 – 44 and the 50 – 59 age bands.
With regard to the issue of older people gaining employment, it may be of some interest to
revisit this issue in subsequent years, by which time the Regulations will have been fully
embedded in society, and older persons and employers may thus be more aware of their
rights and responsibilities.
In relation to the National Minimum Wage (NMW), a substantial majority (70%) were of the
view that the different rates payable to young people between the ages of 16 – 22 years are
unfair.
The survey elicited respondents’ perceptions on the treatment of younger and older people
in work. An identical proportion (58%) thought that younger and older people were treated
“the same”, while one in ten (10%) said that younger people were treated “worse” than
older people. Six percent thought that older people in work are treated “worse” than their
younger colleagues. The Northern Ireland Life and Times survey (ARK, 2004) revealed
that 9% of respondents felt that a friend or family member had been subject to
“employment-related ageism”, including issues around promotion, redundancy/enforced
retirement and recruitment.
The survey also sought to discover respondents’ views on whether people aged 40 – 59
who are looking for work are treated better or worse than younger people by prospective
employers. Fifteen percent said they were treated worse. In the NILT survey, two-thirds
(66%) were of the view that people in their 50s and 60s are generally treated worse by
prospective employers when looking for work (ARK, 2004). The difference between the two
surveys may be partially accounted for by the way in which the question was asked: while
the NILT survey referred to people in their 50s and 60s, the current survey limited the age
cohort to 40 – 59 year olds.
4 The differing proportions in the current and NILT surveys who cited getting employment as a key issue can perhaps be explained by referring to the relevant item in the surveys. In the current survey, respondents were probed on work-related issues only, while the NILT survey asked respondents to identify the main problems facing older people in Northern Ireland today. The responses included fear of crime, loneliness, access to healthcare, employment, transport etc.

Equality Commission (Research on Age-Related Issues and Attitudes - 2007)
50
There was considerable public support for the concept of a flexible retirement age, with
nearly two-thirds of respondents (62%) agreeing with the statement that “people should be
allowed to retire when they want to”. This support for a flexible approach to retirement was
echoed in recent research commissioned by the Employers Forum on Age (2007) in GB: it
was found that 92% of people surveyed believed they should have the right to work for as
long as they like if they are able to do the job, regardless of their age.
In an attempt to uncover possible, latent age-related prejudice, respondents were asked to
indicate their preferences for working with, and being line-managed by, colleagues of
different ages. Approximately three-quarters of those surveyed said they had no
preference concerning the age of either their colleagues (76%), or their managers (72%). It
would be unwarranted to draw a robust inference from this single finding, but it does
suggest that the concept of age discrimination may be a complex one: less of an issue,
perhaps, for colleagues working together, while more of an issue in the employer-employee
relationship.
5.4 Experience of Age-Related Discrimination
In the final section of the survey, respondents were presented with a series of questions
about age discrimination in general, and their own experiences in particular.
Seventeen percent were of the view that a lot of age discrimination exists in the modern
workplace. However, only 4% thought their own employer discriminated on the grounds of
age and 6% felt they had personally experienced less favourable treatment from an
employer due to their age.
The above data contrasts sharply with findings from a survey conducted by the Employers
Forum on Age (2007) in GB wherein 59% of workers claimed to have witnessed ageist
behaviour in the workplace during the previous twelve months.
One possible interpretation of the relatively low rates of perceived, or reported, age
discrimination in employment is that the general public in Northern Ireland does not
perceive work-related age discrimination to be a widespread phenomenon. An alternative
explanation is that, as the survey was conducted just six months after the Age Regulations
Equality Commission (Research on Age-Related Issues and Attitudes - 2007)
51
were implemented in October 2006, awareness of what constitutes age discrimination may
still be relatively limited. Indeed, there is some support for this view in the report itself:
when unprompted a relatively small proportion of those surveyed were aware that age
discrimination may include indirect discrimination (14%), harassment (13%), recruitment
and selection procedures (10%) opportunities for promotion (12%), selection for
redundancy (7%) and training provision (7%).
In brief, should a person not realise that it is unlawful to be treated differently from others on
the basis of age, then they are unlikely to recognise any biased behaviour they may be
subjected to as discriminatory.
Results from the Employers Forum survey suggest that knowledge of the Age Regulations
is likely to grow over time (EFA, 2007). In October 2006, the EFA found that 51% of those
surveyed in GB knew it was illegal to discriminate on the grounds of age at work; a year
later this figure had risen to 86% (in the present survey only 46% knew that age
discrimination was unlawful after six months).
Internal data from the Equality Commission (2007) suggests that age is in fact becoming an
issue of some importance. During the first thirteen months of the Age Regulations (October
2006 – November 2007), the Commission received 277 enquiries relating to age
discrimination, or 9% of the total number of enquiries during that period.
The survey concluded by asking respondents to reflect upon jobs they had been deterred
from applying for in recent years. A substantial proportion (59%) of those who had been
discouraged from applying for a post said it was because they considered the amount of
experience required to be excessive. Younger respondents, 16 – 29 years, were most
likely to report having been deterred from applying for positions due to the experience
criteria (74%). As case law and precedents develop, it is likely that employers will
increasingly have to objectively justify the length of experience required for an advertised
position.
Equality Commission (Research on Age-Related Issues and Attitudes - 2007)
52
5.5 Concluding Comments
The present survey was designed to establish baseline data on topics including views on
age-related issues in general, awareness of the new Age Regulations, knowledge of the
Equality Commission, and personal experience of discrimination.
Among other findings, the survey revealed dissatisfaction with the exclusion of goods,
facilities and services from the scope of the Regulations, and the age gradient of National
Minimum Wage rates. The survey also found strong support for a flexible retirement age,
as opposed to the current Default Retirement Age of 65 years.
It was revealed that, six months after the introduction of the Age Regulations, just under
half of those surveyed knew that age discrimination was now unlawful. Although this is
encouraging when compared with knowledge of other anti-discrimination statutes such as
sexual orientation (33%) [Equality Commission 2006], further progress is still required.
In relation to age discrimination, knowledge of the services the Equality Commission can
provide is relatively low and varies considerably across demographic groups. However,
given that fieldwork for the survey was conducted only six months after the Regulations
were introduced; this lack of awareness is perhaps unsurprising.
Finally, the relatively small incidence of personal experiences of age discrimination reported
in the survey should be set against the growing number of age-related enquiries and
complaints being received by the Commission.

Equality Commission (Research on Age-Related Issues and Attitudes - 2007)
53
5.6 References
ARK (2004). Ageing Well? Research Update, No. 31, June 2004, Evason, E. Belfast: ARK (Northern Ireland) Social and Political Archive, http://www.ark.ac.uk.
Employers Forum on Age (2007). Increased awareness of age laws spells trouble for
employers, Press Release, 28 September 2007 Available at: http://www.efa.org.uk/press/notes026.asp.
Equality Commission (2006). Awareness of Equality Issues amongst the General Public. Belfast: Equality Commission for Northern Ireland.
Equality Commission (2007). Age statistics: number of enquiries between 1 October 2006 and 15 November 2007. Internal communication.

Equality Commission (Research on Age-Related Issues and Attitudes - 2007)
54

Equality Commission (Research on Age-Related Issues and Attitudes - 2007)
55
6. APPENDICES 6.1 Appendix I: Questionnaire
SECTION A: AWARENESS OF AGE DISCRIMINATION LEGISLATION A1. Age discrimination became unlawful (like race and sex discrimination) in October 2006. Are
you aware of this? (CODE ONE ONLY) Yes 1 No 2 Refused 9
A2. Have you ever heard of the Equality Employment (Age) Regulations (NI) 2006? (CODE
ONE ONLY) Yes 1 No 2 Refused 9
IF A1 EQ 1 GO TO A2; IF A1 EQ 2 AND A2 EQ 1 GO TO A3; IF A1 EQ 2 AND A2 NE 1 GO TO A8; IF A1 GT 2 AND A2 GT 1 GO TO A8
A3. Where did you find out that age discrimination became unlawful?
(Unprompted, code all mentioned)
Work-related training course 1 Newspapers / magazine articles 1 HR department (personnel) 1 Newspapers / magazine advertisements 1 Trade union 1 Television (generally) 1 Solicitor 1 Television (News) 1 Labour Relations Agency 1 Television Interviews 1 Human Rights Commission 1 Radio (generally) 1 Equality Commission 1 Radio News 1 Tribunal offices 1 Radio Interviews 1 Law Centre 1 Website – ECNI 1 Citizens Advice Bureau 1 Word of Mouth 1 Community Groups 1 Poster or Billboard Advertisements 1 Special interest groups (e.g. LGB / racial-ethnic / disability / women )
1
Equality Commission leaflet or guide book 1
Advertising on public transport and billboards
1 Equality Commission newsletter (Equality focus)
1
Other (specify) 1 REFUSED 1
Equality Commission (Research on Age-Related Issues and Attitudes - 2007)
56
A4. Do you know who is protected from discrimination on the basis of age? (CODE ONE
ONLY)
Yes 1 -> go to A5No 2 -> go to A6Refused 9 -> go to A6
A5. Who is protected from discrimination on the basis of age? (Unprompted, Code All
Mentioned) Job applicants 1 Employees 1 Contract Workers 1 Persons using employment agencies 1 Persons in vocational education 1 Students and potential students in further and higher education 1 Other (specify)
1
A6. Age discrimination legislation offers protection to people seeking work and those now in
employment up to and beyond retirement age. Can you tell me in what ways the legislation can protect people either in work or when looking for work? (Unprompted, Code All Mentioned)
Direct age discrimination (not giving someone a job because they are too old/young)
1
Indirect age discrimination (rules and procedures which discriminate against certain age-groups)
1
Harassment 1 Victimization 1 Special Provision for employees about to retire 1 Recruitment and selection procedures 1 Discriminatory Advertising 1 Training provision 1 Opportunity for promotion 1 Selection for Redundancy 1 Pay (not NMW) 1 Procedures for retirement 1 Other (specify) 1 Don’t Know 1 Refused 1

Equality Commission (Research on Age-Related Issues and Attitudes - 2007)
57
A7a. Age legislation refers to a default retirement age. Do you know what this age is? (CODE
ONE ONLY)
Yes 1 -> go to A7b No 2 -> go to A8 Don’t Know 3 -> go to A8 Refused 4 -> go to A8
A7b. What is the default retirement age?
A8. Currently age discrimination legislation does not cover the provision of goods, facilities or
services, such as service provided by a shop or restaurant. Do you agree or disagree with this? (CODE ONE ONLY)
Strongly agree 1 Moderately agree 2 Undecided 3 Moderately disagree 4 Strongly disagree 5 Don’t know 6 Refused 7
SECTION B: SERVICES PROVIDED BY THE EQUALITY COMMISSION IN RELATION TO AGE DISCRIMINATION
B1. Can you tell me what you think is the name of the organisation you should complain to if you think you have been discriminated against because of your age? (unprompted, code one only)
Equality Commission for Northern Ireland 1 Northern Ireland Consumer Council 2 Northern Ireland Office 3 Office of the First Minister and Deputy First Minister 4 Human Rights Commission 5 ACAS 6 The Northern Ireland Assembly 7 Northern Ireland ombudsman 8 Labour Relations Agency 9 Disability Action 10 Citizens Advice Bureau 11 Other 12 Don’t Know 13 Refused 14

Equality Commission (Research on Age-Related Issues and Attitudes - 2007)
58
B2. Thinking about the Equality Commission. Do you know any of the different services the
Commission can provide in relation to age discrimination? (CODE ONE ONLY)
Yes 1 -> go to B3 No 2 -> go to C1 Refused 9 -> go to C1
B3. What Commission services are you aware of?
(Do not prompt, code all mentioned)
Providing information and publications on the Age Regulations 1 Advising people who may have experienced age discrimination. 1 Financially supporting people who may have experienced age discrimination to take their case to tribunal.
1
Investigating and researching age-related issues. 1 Information for employers on Equality Commission website 1 Training for employers (seminars and workshops) 1 Employer-led networks (supported by Equality Commission) 1 Other (specify) 1 Don’t Know 1 Refused 1
SECTION C: ATTITUDES TOWARDS AGE-RELATED ISSUES
C1. In your view, what age bands do you think young, middle aged and older workers fall into? (INTERVIEWER RECORD RANGE)
Range
Low Value (Numeric) High Value (Numeric) Young Middle-aged Older
C2. What do you think are the main work-related issues facing older people in Northern Ireland
today? (unprompted, code all mentioned) Biased Recruitment And Selection Procedures. 1 Difficulty In Getting A Job. 1 Changing Your Job 1 Job Insecurity 1 Opportunities For Promotion 1 Access To Training Opportunities. 1 Harassment By Managers. 1 Being Made Redundant. 1 Forced To Retire Before They Want To. 1 Other (Specify) 1 Don’t Know 1 Refused 1

Equality Commission (Research on Age-Related Issues and Attitudes - 2007)
59
C3. What do you think are the main work-related issues facing younger people in Northern
Ireland today? (unprompted, code all mentioned)
Meeting The Essential Criteria When Applying For A Job. 1 Getting A Job 1 Job Insecurity 1 National Minimum Wage Rates 1 Access To Training Opportunities 1 Harassment By Managers. 1 Other (Specify) 1 Don’t Know 1 Refused 1
C4. The National Minimum Wage is different depending on the age of the employee. For 16 to
17 year olds it is £3.30 per hour, for 18-21 year olds its £4.45, and for those aged 22 or older its £5.35 per hour. Do you think this difference is fair or unfair? (CODE ONE ONLY)
Fair 1 Unfair 2 Don’t Know 3 REFUSED 4
C5. Do you think that older people in work are, on the whole, treated better or worse than
younger people in this country because of their age? (CODE ONE ONLY) Better 1 -> go to C5a Worse 2 -> go to C5b Same 3 -> go to C6 Don’t Know 4 -> go to C6 REFUSED 5 -> go to C6
C5a. Why do you think that older people in work are treated better than younger people?
C5b. Why do you think that older people in work are treated worse than younger people?

Equality Commission (Research on Age-Related Issues and Attitudes - 2007)
60
C6. Do you think that younger people in work are, on the whole, treated better or worse than older people in this country because of their age? (CODE ONE ONLY) Better 1 -> go to C6a Worse 2 -> go to C6b Same 3 -> go to C7 Don’t Know 4 -> go to C7 REFUSED 5 -> go to C7
C6a. Why do you think that younger people in work are treated better than older people?
(CODE ONE ONLY)
C6b. Why do you think that younger people in work are treated worse than older people?
(CODE ONE ONLY)
C7. Suppose a 30-year-old man and an older man of 55 have both applied for management
training, and meet the eligibility criteria. If you were the manager and had a choice, which man would you prefer to send on the course first? (CODE ONE ONLY) Younger man first 1 -> go to C7a Older man first 2 -> go to C7b It depends 3 Other (specify) 4
Don’t know 5 REFUSED 6
-> go to C8
C7a. Why would you prefer to send the younger man first?
C7b. Why would you prefer to send the older man first?

Equality Commission (Research on Age-Related Issues and Attitudes - 2007)
61
C8. It has been suggested that people should be allowed to retire when they want to. Do you agree or disagree? (CODE ONE ONLY)
Strongly agree 1 Moderately agree 2
-> go to c9
Undecided 3 Moderately disagree 4 Strongly disagree 5 Don’t know 6 Refused 7
-> go to c10
C9. Why do you think that people should be allowed to retire when they want to?
C10. Are you currently working? (CODE ONE ONLY)
Yes 1 -> go to C11 No 2 -> go to C12
C11. Thinking about your own personal situation now, what would be your preferred option
concerning work and retirement? (CODE ONE ONLY)
I prefer to work full-time beyond my current retirement age. 1 I prefer to work part-time beyond my current retirement age. 2 I currently work beyond the current retirement age. 3
-> go to C12
I prefer to retire at the current retirement age 4 I prefer to retire early 5 It depends on my situation at the time. 6 Don’t know 7 REFUSED. 8
-> go to C13
C12. What is the main reason why you want to carry on working / or are currently working
beyond the current retirement age? (CODE ONE ONLY)
I need/ would need the money and cannot/ couldn’t afford to retire. 1 I want to build a bigger pension pot or keep saving. 2 It gives me/ would give me the opportunity for social interaction. 3 I really enjoy my current job and don’t want to stop working. 4 Other (specify) 5 Don’t know. 6 REFUSED 7

Equality Commission (Research on Age-Related Issues and Attitudes - 2007)
62
C13. I am going to read out some statements regarding older workers, and I would like you to tell me which if any, you generally agree or disagree. (CODE FOR EACH)
Agree Undecided Disagree Don’t
Know Older workers need younger colleagues for their fresh ideas and energy
1 2 3 4
Older workers are more loyal and dedicated.
1 2 3 4
Older workers struggle with the demands of a modern workplace.
1 2 3 4
“You can’t teach an old dog new tricks” is a sensible saying.
1 2 3 4
Older workers should only accept jobs such as working in a supermarket or shop.
1 2 3 4
C14. And with regard to younger workers, do you agree or disagree with each of the following
statements? (NOTE THE SCALE CHANGE) (CODE FOR EACH)
Agree Undecided Disagree Don’t Know
Younger people need older colleagues for their advice and experience.
1 2 3 4
Younger people are less committed and responsible in their attitude to work.
1 2 3 4
Younger people are more energetic workers than older people.
1 2 3 4
Younger people are more involved in their social life than in their work.
1 2 3 4
C15. Do you think that people in their 40’s and 50’s who are looking for work are generally
treated better or worse than younger people by prospective employers? (CODE ONE ONLY)
Better 1Worse 2The same 3Don’t know 4REFUSED 5

Equality Commission (Research on Age-Related Issues and Attitudes - 2007)
63
C15A. What do you think is the main way people in their 40’s and 50’s who are looking for work are treated better than younger people by prospective employers?
C15B. What do you think is the main way people in their 40’s and 50’s who are looking for work
are treated worse than younger people by prospective employers?
C16. Do you or would you prefer to work with people who are: (CODE ONE ONLY)
younger than you 1 older than you 2 same age as you 3 don’t care what age they are 4 Don’t Know 5 REFUSED 6
C17. Do you or would you prefer to be managed at work by someone who is: (CODE ONE
ONLY) younger than you 1 older than you 2 same age as you 3 don’t care what age they are 4 Don’t Know 5 REFUSED 6
SECTION D: PERSONAL EXPERIENCE OF AGE-RELATED DISCRIMINATION D1. Some people have said that there is a lot of age discrimination in modern workplaces. Do
you agree with this, or not? (CODE ONE ONLY)
Yes, I agree 1No, I disagree 2Don’t Know 3Refused 4
D2. Do you think your employer discriminates on the grounds of age? (CODE ONE ONLY)
Yes 1 -> go to D3 No 2 Not employed 3 Don’t Know 4 Refused 5
-> go to D4

Equality Commission (Research on Age-Related Issues and Attitudes - 2007)
64
D3. Does your employer? (CODE ONE ONLY)
Discriminate against older workers 1 Discriminate against younger workers 2 Discriminate against both younger and older workers 3 REFUSED 4
D4. Have you ever felt that you were not treated as well as you might have been by an
employer because of your age? (CODE ONE ONLY) Yes 1 -> go to D5No 2 Don’t Know 3 Refused 9
Go to D6
D5. In what way were you not treated well by an employer? (CODE ONE ONLY) (IF MORE
THAN ONE IS MENTIONED INTERVIEWER TO PROBE FOR MOST IMPORTANT ISSUE)
Refused a job 1 Forced to retire / made redundant 2 Didn’t get promotion 3 Employers preferred younger workers 4 Didn’t get training 5 Employer had a bad attitude to older people 6 I was harassed or bullied on the grounds of age 7 Other (specify) 8 REFUSED 9
D6. Have you wanted to apply for any jobs in recent years? (CODE ONE ONLY)
Yes 1 -> go to D7 No 2 -> go to Section E Refused 9 -> go to Section E
D7. Thinking about any jobs you wanted to apply for in recent years, have you been put off
applying for the post because the job advert contained any of the following? (CODE FOR EACH) Yes No Don’t Know Refused An upper or lower age-limit. 1 2 3 4 The advert contained words such as “mature”, “young” or “energetic”.
1 2 3 4
The amount of experience required was excessive.
1 2 3 4

Equality Commission (Research on Age-Related Issues and Attitudes - 2007)
65
SECTION E: DEMOGRAPHIC PROFILE QUESTIONS E1. INTERVIEWER RECORD GENDER…(CODE ONE ONLY)
Male 1 Female 2
E2. Can you please tell me your age?
E3 And what is your marital status? (CODE ONE ONLY)
Single (never married) 1 Married 2 Living as married 3 Separated 4 Divorced 5 Widowed 6 REFUSED 7
E4. Do you have any a long-term illness, health problem or disability which limits your daily
activities or the work you can do? Include problems which are due to old age (CIRCLE ONE ONLY)
Yes 1 No 2 REFUSED 9
E5a. Do you regard yourself as belonging to any particular religion? (CODE ONE
ONLY)
Yes 1 -> go to E5b No 2 -> go to E5c

Equality Commission (Research on Age-Related Issues and Attitudes - 2007)
66
E5b. Which religion, religious denomination or body do you belong to?
No religion 1 Roman Catholic 2 Church of Ireland/Anglican/Episcopal 3 Baptist 4 Methodist 5 Presbyterian 6 Free Presbyterian 7 Brethren 8 United Reform Church (URC)/Congregational 9 Pentecostal 10 Church of Scotland 11 Elim Pentecostal 12 Reformed Presbyterian 13 Non-subscribing Presbyterian 14 Salvation Army 15 Church of Nazarene 16 Jehovah's Witness 17 Mormon 18 Protestant - no-denomination 19 Christian - no denomination 20 Hindu 21 Jewish 22 Islam/Muslim 23 Sikh 24 Buddhist 25 Other (WRITE IN) 26 (Don't know) 98 REFUSED 99

Equality Commission (Research on Age-Related Issues and Attitudes - 2007)
67
E5c. What religion, religious domination or body were you brought up in?
No religion 1 Roman Catholic 2 Church of Ireland/Anglican/Episcopal 3 Baptist 4 Methodist 5 Presbyterian 6 Free Presbyterian 7 Brethren 8 United Reform Church (URC)/Congregational 9 Pentecostal 10 Church of Scotland 11 Elim Pentecostal 12 Reformed Presbyterian 13 Non-subscribing Presbyterian 14 Salvation Army 15 Church of Nazarene 16 Jehovah's Witness 17 Mormon 18 Protestant - no-denomination 19 Christian - no denomination 20 Hindu 21 Jewish 22 Islam/Muslim 23 Sikh 24 Buddhist 25 Other (WRITE IN) 26 (Don't know) 98 REFUSED 99

Equality Commission (Research on Age-Related Issues and Attitudes - 2007)
68
E6. Which ethnic group do you consider you belong to? (CODE ONE ONLY)
White 1 -> go to E7 Chinese 2 Irish Traveller 3 Indian 4 Pakistani 5 Bangladeshi 6 Black Caribbean 7 Black African 8 Black Other 9 Mixed Ethnic (please specify) 10 Other (please specify) 11 REFUSED 99
-> go to E8
E7. What is your country of origin? (CODE ONE ONLY)
Northern Ireland 1 Great Britain (England, Scotland or Wales) 2 Republic of Ireland 3 Poland 4 Portugal 5 Czech Republic 6 Lithuania 7 Latvia 8 Estonia 9 Other (specify) 10
E8. Could you please tell me what your highest educational qualification is?
(CODE ONE ONLY) Degree Level or higher 1 BTEC (Higher), BEC (Higher), TEC (Higher), HNC,HND 2 GCE A’Level (including NVQ Level 3) 3 BTEC (National), BEC (National), TEC (National), ONC, OND 4 GCSE (including NVQ Level 2), GCE O’Level (including CSE Grade 1), Senior Certificate, BTEC (General), BEC (General) 5
CSE (Other than Grade 1) 6
Other (Please specify) 7 Go to E9 No formal qualification 8 Refused 9

Equality Commission (Research on Age-Related Issues and Attitudes - 2007)
69
E9. What is your other highest educational qualification?
E10. What is your employment status? (CODE ONE ONLY)
Self-employed 1 Working Full-time 2 Working Part-time 3
Go to E10d
Seeking work for the first time 4 Go to E10f Unemployed, i.e. not working but actively seeking work
5
Looking after home and family 6 Unable to work due to permanent illness or disability
7
Not actively seeking work but would like to work
8
Not working and not seeking work 9 On a government scheme 10 Retired 11 Student 12
Go to E10c
Other (Please specify) 13 Go to E10b Refused 99 Go to E10f
E10b. What is your ‘other’ employment status (then go to E10d)?
E10c. Have you ever had a paid job? (CODE ONE ONLY)
Yes 1 Go to E10dNo 2 Refused 9 Go to E10f
E10d What is / was your main occupation?
E10e Please describe briefly what this job involves?
Go to E11

Equality Commission (Research on Age-Related Issues and Attitudes - 2007)
70
E10f. What is the occupation of the Chief Wage Earner within your household?
E10g. Please describe briefly what this job involves?
E11. And what is the total income of your household from all sources before tax and national insurance contributions? (CODE ONE ONLY)
INCLUDE ALL INCOME FROM EMPLOYMENT AND BENEFITS
Under £3,000 per annum (less than £60 per week) 1 £3,000 - £3,999 per annum (£60 - £80 per week) 2 £4,000 - £6,999 per annum (£80 - £135 per week) 3 £7,000 - £9,999 per annum (£135 - £195 per week) 4 £10,000 - £14,999 per annum (£195 - £290 per week) 5 £15,000 - £19,999 per annum (£290 - £385 per week) 6 £20,000 - £25,999 per annum (£385 - £500 per week) 7 £26,000 - £29,999 per annum (£500 - £580 per week) 8 £30,000 - £39,999 per annum (£580 - £770 per week) 9 £40,000 + per annum (£770+ per week) 10 I DO NOT WISH TO ANSWER THIS QUESTION 11 (Don't know) 98 REFUSED 99
E12. How many dependent children do you have aged 18 or under?
(CODE ONE ONLY)
Refused 99
E13. What is the age of your youngest dependant child? (CODE ONE ONLY)
Refused 99
E14. Do you have any caring responsibilities other than childcare, by caring I mean do you
provide voluntary or unpaid help and support to anyone who has difficulties looking after themselves because of age, disability or long-standing illness? (CODE ONE ONLY)
Yes 1 Refused 99 No 2

Equality Commission (Research on Age-Related Issues and Attitudes - 2007)
71
E15. For our records can I have your Postcode?
Postcode (EXAMPLE B T 0 3 4 G Z POSTCODE
E16. In terms of political affiliation would you describe yourself as broadly….
(CODE ONE ONLY)
Nationalist 1 Unionist 2 Other (specify) 3 REFUSED 9
E17. If there were a general election tomorrow, in which only Northern Ireland parties were
standing, which political party do you think you would be most likely to support? (CODE ONE ONLY)
Alliance Party 1 Democratic Unionist Party (DUP) 2 Progressive Unionist Party (PUP) 3 Sinn Fein 4 Social Democratic and Labour Party (SDLP) 5 Ulster Unionist Party (UUP) 6 Other Party (write in) 7 None 8 Other answer (specify) 9 Don’t know 10 REFUSED 99
E18. And finally, can you tell me which of these best describes you?
Gay or lesbian (homosexual) 1 Heterosexual or straight 2 Bi-sexual 3 Other – write-in 4 I do not wish to answer this question (REFUSED) 9
THANK YOU FOR TAKING PART IN THIS RESEARCH WHICH IS BEING CONDUCTED ON BEHALF OF THE EQUALITY COMMISSION FOR NORTHERN IRELAND.
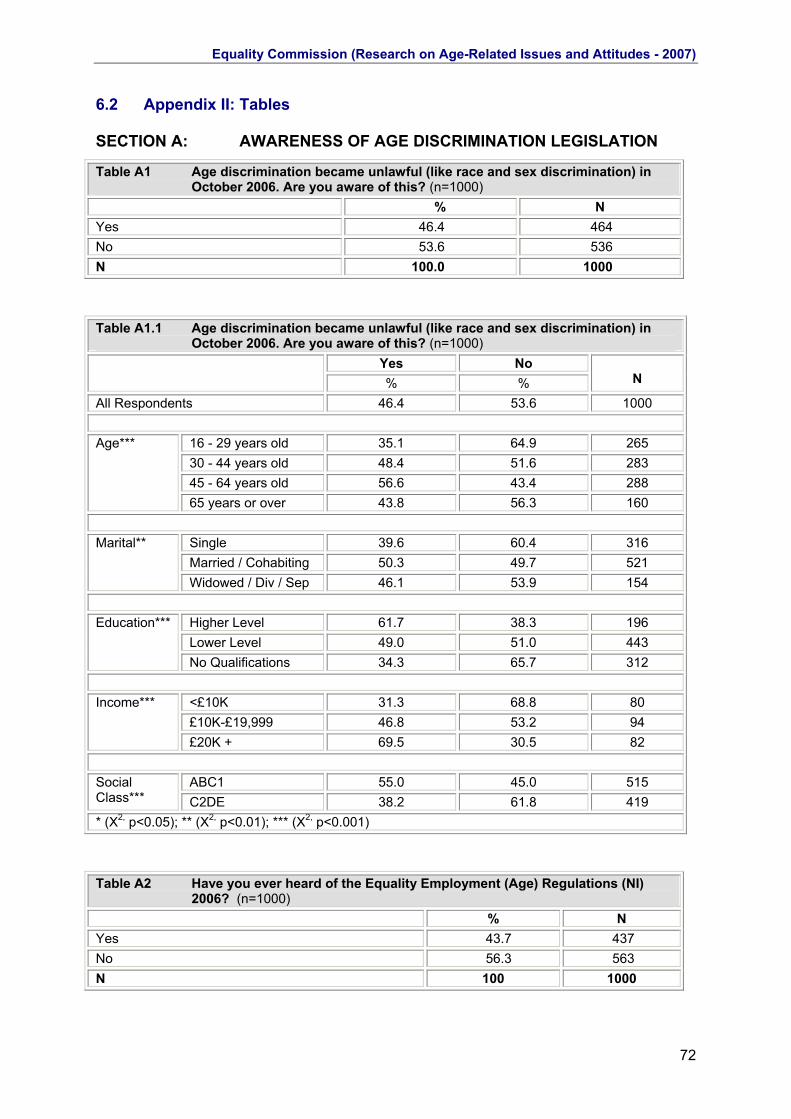
Equality Commission (Research on Age-Related Issues and Attitudes - 2007)
72
6.2 Appendix II: Tables SECTION A: AWARENESS OF AGE DISCRIMINATION LEGISLATION
Table A1 Age discrimination became unlawful (like race and sex discrimination) in October 2006. Are you aware of this? (n=1000)
% N Yes 46.4 464 No 53.6 536 N 100.0 1000 Table A1.1 Age discrimination became unlawful (like race and sex discrimination) in
October 2006. Are you aware of this? (n=1000) Yes No % %
N
All Respondents 46.4 53.6 1000
16 - 29 years old 35.1 64.9 265 30 - 44 years old 48.4 51.6 283 45 - 64 years old 56.6 43.4 288
Age***
65 years or over 43.8 56.3 160
Single 39.6 60.4 316 Married / Cohabiting 50.3 49.7 521
Marital**
Widowed / Div / Sep 46.1 53.9 154
Higher Level 61.7 38.3 196 Lower Level 49.0 51.0 443
Education***
No Qualifications 34.3 65.7 312
<£10K 31.3 68.8 80 £10K-£19,999 46.8 53.2 94
Income***
£20K + 69.5 30.5 82
ABC1 55.0 45.0 515 Social Class*** C2DE 38.2 61.8 419 * (X2, p<0.05); ** (X2, p<0.01); *** (X2, p<0.001)
Table A2 Have you ever heard of the Equality Employment (Age) Regulations (NI)
2006? (n=1000) % N Yes 43.7 437 No 56.3 563 N 100 1000

Equality Commission (Research on Age-Related Issues and Attitudes - 2007)
73
Table A2.1 Have you ever heard of the Equality Employment (Age) Regulations (NI)
2006? (n=1000) Yes No % %
N
All Respondents 43.7 56.3 1000
16 - 29 years old 38.5 61.5 265 30 - 44 years old 44.2 55.8 283 45 - 64 years old 52.1 47.9 288
Age**
65 years or over 36.3 63.8 160
Higher Level 58.7 41.3 196 Lower Level 46.7 53.3 443
Education***
No Qualifications 30.1 69.9 312
<£10K 21.3 78.8 80 £10K-£19,999 33.0 67.0 94
Income***
£20K + 56.1 43.9 82
ABC1 53.8 46.2 515 Social Class*** C2DE 32.2 67.8 419 * (X2, p<0.05); ** (X2, p<0.01); *** (X2, p<0.001);

Equality Commission (Research on Age-Related Issues and Attitudes - 2007)
74
Table A3 Where did you find out that age discrimination became unlawful? (n=563)
Unprompted % N Television (news) 26.3 148 Television (generally) 21.5 121 Newspapers / magazine articles 16.3 92 Word of mouth 13.9 78 Work-related training course 11.7 66 Newspapers / magazine advertisements 11.0 62 Radio (generally) 9.4 53 HR department (personnel) 8.0 45 Radio news 7.6 43 Advertising on public transport and billboards 6.2 35 Citizens Advice Bureau 5.5 31 Community groups 3.9 22 Radio interviews 3.6 20 Trade union 3.0 17 Equality Commission 2.8 16 Equality Commission leaflet or guide book 2.1 12 Labour Relations Agency 1.8 10 Law Centre 1.8 10 Television interviews 1.8 10 Poster or billboard advertisements 1.6 9 Equality commission newsletter (equality focus) 1.4 8 Special interest groups (e.g. LGB / racial-ethnic / disability / women ) 1.4 8 Human rights commission 1.1 6 Tribunal offices 0.7 4 Website – ECNI 0.5 3 Solicitor 0.0 0.0 Other 4.4 25 Refused 1.2 7
Table A4 Do you know who is protected from discrimination on the basis of age?
(n=562) % N Yes 69.8 392 No 30.2 170 N 100.0 562

Equality Commission (Research on Age-Related Issues and Attitudes - 2007)
75
Table A4.1 Do you know who is protected from discrimination on the basis of age?
(n=562) Yes No % %
N
All 69.8 30.2 562
Belfast 82.1 17.9 106 East of N.I. 64.9 35.1 259
Area**
West of N.I. 69.5 30.5 197
Higher Level 81.4 18.6 140 Lower Level 72.5 27.5 262
Education***
No Qualifications 52.9 47.1 136
<£10K 51.9 48.1 27 £10K-£19,999 69.4 30.6 49
Income*
£20K + 80.0 20.0 65
ABC1 74.5 25.5 337 Social Class* C2DE 64.1 35.9% 195 * (X2, p<0.05); ** (X2, p<0.01); *** (X2, p<0.001);
Table A5 Who is protected from discrimination on the basis of age? (n =393)
Unprompted % N Job applicants 65.9 259 Employees 66.4 261 Contract workers 12.5 49 Persons using employment agencies 10.4 41 Persons in vocational education 8.7 34 Students and potential students in further and higher education 8.9 35 Other 14.8 58

Equality Commission (Research on Age-Related Issues and Attitudes - 2007)
76
Table A6 Can you tell me in what ways the age discrimination legislation can protect
people either in work or when looking for work? (n=562) Unprompted % N Direct age discrimination (not giving someone a job because they are too old/young)
50.9 286
Indirect age discrimination (rules and procedures which discriminate against certain age-groups)
14.4 81
Harassment 12.6 71 Opportunity for promotion 11.7 66 Victimization 10.5 59 Recruitment and selection procedures 10.1 57 Training provision 7.3 41 Selection for redundancy 7.3 41 Procedures for retirement 7.3 41 Discriminatory advertising 6.9 39 Special provision for employees about to retire 5.9 33 Pay (not NMW) 4.6 26 Don’t know 26.9 151 Other 1.4 8
Table A7a Age legislation refers to a default retirement age. Do you know what this
age is? (n=562) % N Yes 55.9 314 No 44.1 248 N 100 562 Table A7a.1 Age legislation refers to a default retirement age. Do you know what this age
is? (n=562) Yes No % %
N
All Respondents 55.9 44.1 562
Higher Level 65.7 34.3 140 Lower Level 53.8 46.2 262
Education**
No Qualifications 47.8 52.2 136
Belfast 61.3 38.7 106 East of N.I. 46.7 53.3 259
Area***
West of N.I 65.0 35.0 197 * (X2, p<0.05); ** (X2, p<0.01); *** (X2, p<0.001);

Equality Commission (Research on Age-Related Issues and Attitudes - 2007)
77
Table A7.a2: What is the Default Retirement Age? (respondents who indicated
they knew the default retirement age, n=311) Age N % 50 2 0.6 55 2 0.6 60 64 20.6 61 1 0.3 65 222 71.4 67 8 2.6 68 4 1.3 70 8 2.6 N 311 100% Table A8 Currently age discrimination legislation does not cover the provision of
goods, facilities or services, such as service provided by a shop or restaurant. Do you agree or disagree with this? (n=999)
% N Strongly agree 4.6 46 Moderately agree 4.2 42 Undecided 12.7 127 Moderately disagree 7.5 75 Strongly disagree 37.3 373 Don’t know 33.6 336 N 100.0 999 Table A8.1 Currently age discrimination legislation does not cover the provision of
goods, facilities or services, such as service provided by a shop or restaurant. Do you agree or disagree with this? (n=663)
Agree Undecided Disagree % % %
N
All 13.3 19.2 67.6 663
Protestant 16.5 15.8 67.6 272 Religion* R Catholic 9.2 18.7 72.1 294
Higher Level 17.5 26.6 55.8 154 Lower Level 11.6 15.3 73.1 301
Education**
No Qualifications 10.5 17.0 72.5 171
Belfast 9.3 12.1 78.5 107 East of N.I. 17.6 27.2 55.2 261
Area***
West of N.I. 10.8 14.6 74.6 295 * (X2, p<0.05); ** (X2, p<0.01); *** (X2, p<0.001); NB: ‘Don’t Knows’ excluded from this analysis.
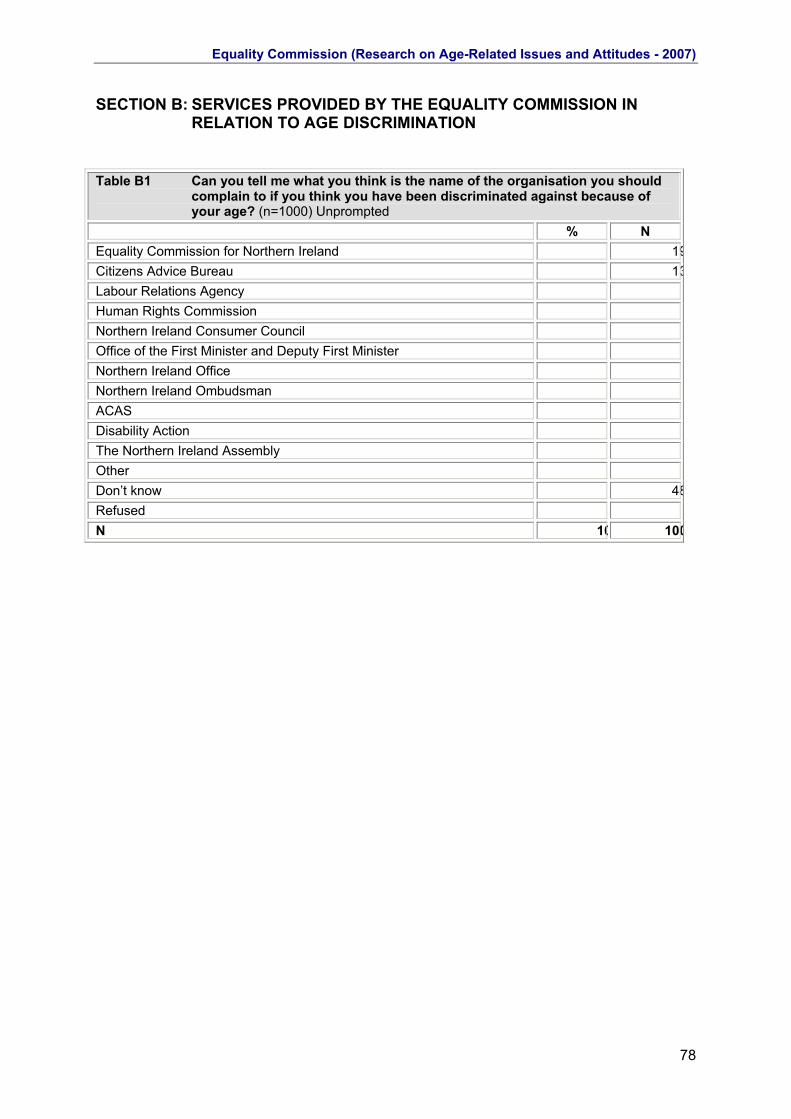
Equality Commission (Research on Age-Related Issues and Attitudes - 2007)
78
SECTION B: SERVICES PROVIDED BY THE EQUALITY COMMISSION IN RELATION TO AGE DISCRIMINATION
Table B1 Can you tell me what you think is the name of the organisation you should
complain to if you think you have been discriminated against because of your age? (n=1000) Unprompted
% N Equality Commission for Northern Ireland 19Citizens Advice Bureau 13Labour Relations Agency Human Rights Commission Northern Ireland Consumer Council Office of the First Minister and Deputy First Minister Northern Ireland Office Northern Ireland Ombudsman ACAS Disability Action The Northern Ireland Assembly Other Don’t know 4 48Refused N 10 100

Equality Commission (Research on Age-Related Issues and Attitudes - 2007)
79
Table B1.1 Can you tell me what you think is the name of the organisation you should
complain to if you think you have been discriminated against because of your age? (n=1000)
Yes No % %
N
All 9.8 90.2 1000
16 - 29 years old 15.8 84.2 265 30 - 44 years old 24.0 76.0 283 45 - 64 years old 20.6 79.4 287
Age
65 years or over 16.9 83.1 160
Belfast 25.8 74.2 178 East of N.I. 16.2 83.8 469
Area***
West of N.I. 21.6 78.4 352
Higher Level 34.2 65.8 196 Lower Level 19.6 80.4 443
Education***
No Qualifications 9.0 91.0 311
Nationalist 17.8 82.2 202 Political Affil Unionist 9.4 90.6 212
<£10K 8.8 91.2 80 £10K-£19,999 12.9 87.1 93
Income
£20K + 24.4 75.6 82
ABC1 26.8 73.2 515 Social Class** C2DE 13.2 86.8 418
* (X2, p<0.05); ** (X2, p<0.01); *** (X2, p<0.001);
Table B2 Thinking about the Equality Commission. Do you know any of the different
services the Commission can provide in relation to age discrimination? (n=1000)
% N Yes 15.3 153 No 84.7 847 N 100.0 1000

Equality Commission (Research on Age-Related Issues and Attitudes - 2007)
80
Table B2.1 Thinking about the Equality Commission. Do you know any of the different
services the Commission can provide in relation to age discrimination? Yes No % %
N
All 15.3 84.7 1000
16 - 29 years old 10.9 89.1 265 30 - 44 years old 21.2 78.8 283 45 - 64 years old 18.1 81.9 288
Age***
65 years or over 7.5 92.5 160
Single 12.3 87.7 316 Married/Cohabiting 19.2 80.8 521
Marital**
Wid/Sep/Div 7.8 92.2 154
Higher Level 34.2 65.8 196 Lower Level 12.4 87.6 443
Education***
No Qualifications 6.7 93.3 312
Nationalist 16.3 83.7 202 Political Affil* Unionist 8.9 91.1 213
<£10K 7.5 92.5 80 £10K-£19,999 19.1 80.9 94
Income*
£20K + 22.0 78.0 82
ABC1 18.6 81.4 515 Social Class*** C2DE 10.0 90.0 419
* (X2, p<0.05); ** (X2, p<0.01); *** (X2, p<0.001);

Equality Commission (Research on Age-Related Issues and Attitudes - 2007)
81
Table B3 What Commission services are you aware of? (n=153): Those who indicated
that they knew of Commission services provided in relation to age discrimination. Unprompted
% N Advising people who may have experienced age discrimination. 56.2 86 Providing information and publications on the age regulations 39.9 61 Information for employers on equality commission website 24.8 38 Investigating and researching age-related issues. 17.6 27 Training for employers (seminars and workshops) 16.3 25 Financially supporting people who may have experienced age discrimination to take their case to tribunal.
14.4 22
Employer-led networks (supported by Equality Commission) 10.5 16 Fair employment 0.5 1 Victimisation 0.5 1 Don’t know 1.3 2

Equality Commission (Research on Age-Related Issues and Attitudes - 2007)
82
SECTION C: ATTITUDES TOWARDS AGE-RELATED ISSUES Table C1 In your view, what age bands do you think young, middle aged and older
workers fall into? AGE Low Value
(Range) High Value
(Range) Low Mean High Mean Average
of High / Low
Mean Young 0-40 16-80 16.64 26.80 21.72 Middle-aged 16-60 18-80 30.19 43.58 36.81 Older 18-89 21-100 45.89 66.80 56.28
Table C1.1 Mean age of YOUNGER workers Young Worker
Mean Age
N
16 - 29 years old 21.05 264 30 - 44 years old 21.56 283 45 - 64 years old 22.03 288
Age**
65 years or over 22.55 160
Single 20.85 315 Married / Cohabiting 22.06 521
Marital***
Wid/Sep/Div 22.34 154
Yes 22.79 104 Limiting Long-Term Illness* No 21.58 892
Higher Level 21.85 196 Lower Level 20.97 443
Education***
No Qualifications 22.35 311
Belfast 20.32 178 East of N.I. 22.08 468
Area***
West of N.I. 21.96 353 * (X2, p<0.05); ** (X2, p<0.01); *** (X2, p<0.001);

Equality Commission (Research on Age-Related Issues and Attitudes - 2007)
83
Table C1.2 Mean age of MIDDLE AGED workers
Middle Aged Worker Mean Age N
16 - 29 years old 35.21 264 30 - 44 years old 36.23 283 45 - 64 years old 37.87 288
Age**
65 or over years old 38.83 159
Single 34.64 315 Married / Cohabiting 37.39 520
Marital***
Wid/Sep/Div 39.32 154
Yes 41.48 104 Limiting Long-Term Illness*** No 36.32 891
Protestant 37.20 453 Religion* R Catholic 35.51 389
Higher Level 37.27 196 Lower Level 34.61 443
Education***
No Qualifications 39.17 310
Belfast 34.01 178 East of N.I. 39.57 467
Area***
West of N.I. 34.76 353 * (X2, p<0.05); ** (X2, p<0.01); *** (X2, p<0.001);

Equality Commission (Research on Age-Related Issues and Attitudes - 2007)
84
Table C1.3 Mean age of OLDER workers
Older Aged Worker Mean Age N
16 - 29 years old 54.97 262 30 - 44 years old 55.69 278 45 - 64 years old 57.27 285
Age*
65 years or over 57.48 156
Single 54.15 313 Married / Cohabiting 56.89 511
Marital***
Wid/Sep/Div 58.24 153
Yes 61.24 102 Limiting Long-Term Illness*** No 55.69 880
Protestant 56.44 444 Religion* R Catholic 54.76 387
Higher Level 57.96 190 Lower Level 54.19 443
Education***
No Qualifications 57.60 304
Belfast 53.30 178 East of N.I. 59.11 457
Area***
West of N.I. 54.09 350 * (X2, p<0.05); ** (X2, p<0.01); *** (X2, p<0.001); Table C2 What do you think are the main work-related issues facing older people in
Northern Ireland today? Unprompted % N Difficulty in getting a job 46.9 469 Being made redundant 24.0 240 Job insecurity 18.5 185 Changing your job 16.1 161 Biased recruitment and selection procedures 15.0 150 Opportunities for promotion 12.4 124 Forced to retire before they want to 12.0 120 Access to training opportunities 5.4 54 Harassment by managers 4.1 41 Other 4.5 45 Don’t know 21.0 210

Equality Commission (Research on Age-Related Issues and Attitudes - 2007)
85
TableC3 What do you think are the main work-related issues facing younger people in
Northern Ireland today? Unprompted % N Getting a job 54.4 544 Meeting the essential criteria when applying for a job 35.2 352 National minimum wage rates 25.1 251 Job insecurity 10.6 106 Access to training opportunities 5.1 51 Harassment by managers 3.5 35 Other 4.7 47 Don’t know 17.7 177
Table C4 The National Minimum Wage is different depending on the age of the
employee. For 16 to 17 year olds it is £3.30 per hour, for 18-21 year olds its £4.45, and for those aged 22 or older its £5.35 per hour. Do you think this difference is fair or unfair? (n=998)
% N Fair 24.9 249 Unfair 69.6 695 Don’t Know 5.4 54 N 100.0 998

Equality Commission (Research on Age-Related Issues and Attitudes - 2007)
86
Table C4.1 The National Minimum Wage is different depending on the age of the employee.
For 16 to 17 year olds it is £3.30 per hour, for 18-21 year olds its £4.45, and for those aged 22 or older its £5.35 per hour. Do you think this difference is fair or unfair? (n=944)
Fair Unfair % %
N
All 26.4 73.6 944
Male 29.4 70.2 447 Sex* Female 23.5 76.5 497
16 - 29 years old 20.0 80.0 255 30 - 44 years old 26.3 73.7 270 45 - 64 years old 26.7 73.3 270
Age**
65 years or over 37.9 62.1 145
Yes 20.4 79.6 94 Dependants** No 29.2 70.8 638
Belfast 31.0 69.0 174 East of N.I. 21.2 78.8 425
Area**
West of N.I. 30.4 69.6 345
* (X2, p<0.05); ** (X2, p<0.01); *** (X2, p<0.001); NB: ‘Don’t Knows’ excluded from this analysis.
Table C5 Do you think that OLDER people in work are, on the whole, treated better or
worse than younger people in this country because of their age? (n=997) % N Better 10.1 101 Worse 6.4 64 Same 57.5 573 Don’t Know 26.0 259 N 100.0 997

Equality Commission (Research on Age-Related Issues and Attitudes - 2007)
87
Table C5.1 Do you think that OLDER people in work are, on the whole, treated better or
worse than younger people in this country because of their age? (n=738) Better Worse Same
% % %
N
All 13.7 8.7 77.6 738
16 - 29 years old 21.5 6.2 72.3 195 30 - 44 years old 13.3 6.6 80.1 226 45 - 64 years old 11.6 11.6 76.9 216
Age**
65 years or over 4.0 11.0 85.0 100
Single 17.8 5.7 76.5 230 Married / Cohabiting 13.7 9.9 76.4 394
Marital**
Wid/Sep/Div 4.7 11.3 84.0 106
Higher Level 20.0 6.5 73.5 155 Lower Level 13.0 7.7 79.3 338
Education*
No Qualifications 9.2 12.6 78.2 206 * (X2, p<0.05); ** (X2, p<0.01); *** (X2, p<0.001); NB: ‘Don’t Knows’ excluded from this analysis.
Table C5a Why do you think that OLDER people in work are treated BETTER than
younger people? (n=100) Unprompted % N More experience 36 36 More respect 24 24 Been there longer 9 9 More mature 7 7 Better wages and allowances 4 4 Know how to stick up for themselves 4 4 Age 3 3 Younger people treated poorly 3 3 No fear 1 1 Employers don’t take young people 1 1 Older people are expected to do more 1 1 Opinions sought 1 1 Worse paid 1 1 Young people think they’re smart 1 1 Don’t know 4 4 N 100 100

Equality Commission (Research on Age-Related Issues and Attitudes - 2007)
88
Table C5b Why do you think that OLDER people in work are treated WORSE than younger people? (n=64) Unprompted
% N Because of age 20.3 13 Downtrodden / taken advantage of 17.2 11 Companies prefer younger workers 9.4 6 Harder to get a job 9.4 6 Lack knowledge 9.4 6 Too timid 1.6 1 Experience not recognised 7.8 5 Younger people less committed 7.8 5 Experience taken for granted 3.1 2 Expected to do everything 3.1 2 Get more out of them 1.6 1 Their boss doesn't understand when they’re ill 1.6 1 They are not given the same opportunities as young 1.6 1 They don't want to upset younger ones 1.6 1 Threat of redundancy 1.6 1 Too demanding 1.6 1 Don’t know 1.6 1 N 100.0 64

Equality Commission (Research on Age-Related Issues and Attitudes - 2007)
89
Table C6 Do you think that YOUNGER people in work are, on the whole, treated better
or worse than older people in this country because of their age? (n=999) % N Better 4.3 43 Worse 10.0 100 Same 57.7 576 Don’t Know 28.0 280 N 100.0 999 Table C6.1 Do you think that YOUNGER people in work are, on the whole, treated better
or worse than older people in this country because of their age? (n=719) Better Worse Same
% % %
N
All 6.0 13.9 80.1 719
16 - 29 years old 5.2 19.2 75.6 193 30 - 44 years old 4.4 15.1 80.4 225 45 - 64 years old 7.9 11.3 80.8 203
Age*
65 years or over 6.2 6.2 87.6 97
* (X2, p<0.05); ** (X2, p<0.01); *** (X2, p<0.001); NB: ‘Don’t Knows’ excluded from this analysis.
Table C6a Why do you think that YOUNGER people in work are treated BETTER than older
people? (n=42) % N Easier for them 26.2 11 More opportunities 19.0 8 Because they are young 16.7 7 Better training 7.1 3 More enthusiastic 7.1 3 More rights 4.8 2 Feared 2.4 1 Given more freedom 2.4 1 Longer service 2.4 1 Not sure just are 2.4 1 Same reason 2.4 1 They accept lower wages 2.4 1 They have them longer 2.4 1 Young people haven’t much time for older people 2.4 1 N 100.0 42

Equality Commission (Research on Age-Related Issues and Attitudes - 2007)
90
Table C6b Why do you think that YOUNGER people in work are treated WORSE than
older people? (n=99) % N Employers take advantage of younger workers 43.4 43 Lack of experience 20.2 20 Lazy and lack commitment 6.1 6 Younger and less mature 6.1 6 Poor jobs and poor pay 3.0 3 Just starting out 2.0 2 Afraid to speak up 1.0 1 Better chances 1.0 1 Don’t know their rights 1.0 1 Harassment and bullying 1.0 1 Again when a member of the public sees a young person 1.0 1 Demanding 1.0 1 Higher expectations 1.0 1 I think more respect comes from older employees 1.0 1 Lack of government help 1.0 1 Older people don't like change 1.0 1 They just do what’s given to them 1.0 1 They need the money 1.0 1 They prefer older workers 1.0 1 Unknown 1.0 1 Why train someone that’s going to retire 1.0 1 Don’t know 4.0 4 N 100.0 99
Table C7 Suppose a 30 year old man and an older man of 55 years have both applied for
management training and meet the eligibility criteria. If you were the manager and had a choice, which man would you prefer to send on the course first? (n=998)
% N Younger man first 23.5 235 Older man first 12.4 124 It depends 55.5 554 Other 1.9 19 Don’t know 6.6 66 N 100.0 998

Equality Commission (Research on Age-Related Issues and Attitudes - 2007)
91
Table C7.1 Suppose a 30 year old man and an older man of 55 years have both applied
for management training, and meet the eligibility criteria. If you were the manager and had a choice, which man would you prefer to send on the course first? (n=932)
Younger Man First
Older Man First
It Depends
% % %
N
All 25.2 13.3 59.4 932
16 - 29 years old 35.3 7.2 56.6 249 30 - 44 years old 25.2 11.9 60.0 270 45 - 64 years old 17.8 17.1 62.1 269
Age***
65 years or over 20.0 20.0 59.3 140
Single 34.4 10.2 55.1 305 Married/Cohabiting 21.4 14.2 61.2 485
Marital***
Wid/Sep/Div 19.1 17.7 61.0 136
Higher Level 20.8 7.1 70.5 183 Lower Level 27.2 10.6 59.4 416
Education***
No Qualifications 27.0 20.6 51.4 286
<£10K 23.6 25.0 51.4 72 £10K-£19,999 24.7 13.5 58.4 89
Income**
£20K + 20.6 3.9 70.1 77
ABC1 22.7 11.3 62.7 490 Social Class** C2DE 28.8 16.0 54.1 386
Belfast 28.8 15.9 54.1 170 East of N.I. 19.9 10.1 68.0 437
Area***
West of N.I. 30.5 16.3 50.8 325 * (X2, p<0.05); ** (X2, p<0.01); *** (X2, p<0.001); NB: ‘Don’t Knows’ excluded from this analysis.

Equality Commission (Research on Age-Related Issues and Attitudes - 2007)
92
Table C7a Why would you prefer to send the younger man first? (n=234) % N Would work for longer 54.7 128 Easier to train 9.0 21 Healthier and fitter 8.1 19 Younger 8.1 19 More enthusiastic 4.3 10 Needs the opportunity 4.3 10 More loyal 2.1 5 Better value for money 1.7 4 Family commitments 0.9 2 Less sick leave 0.4 1 Because he would have to work on a building site 0.4 1 A better prospect 0.4 1 Can be employed cheaper so business can use young people 0.4 1 Doesn’t have as much life experience 0.4 1 In dentistry people retire in 50s 0.4 1 Maybe has as much experience as the older man 0.4 1 Not sure 0.4 1 Older man nearer retirement 0.4 1 The younger man would know what people want 0.4 1 Unimaginable that someone start training at 55 0.4 1 Don’t know 2.1 5 N 100.0 234
Table C7b Why would you prefer to send the older man first? (n=123) % N More experience 69.1 85 More mature, responsible and loyal 22.0 27 Will work / stay in job 3.3 4 Because I’m soft hearted 0.8 1 He's closer to my age bracket 0.8 1 He can provide just as much work as the younger man 0.8 1 He’s more going for him 0.8 1 I would prefer the company of somebody closer to my age 0.8 1 I’d give him a chance. Younger people are preferred nowadays 0.8 1 The younger can wait a while without too much effect 0.8 1 N 100.0 123
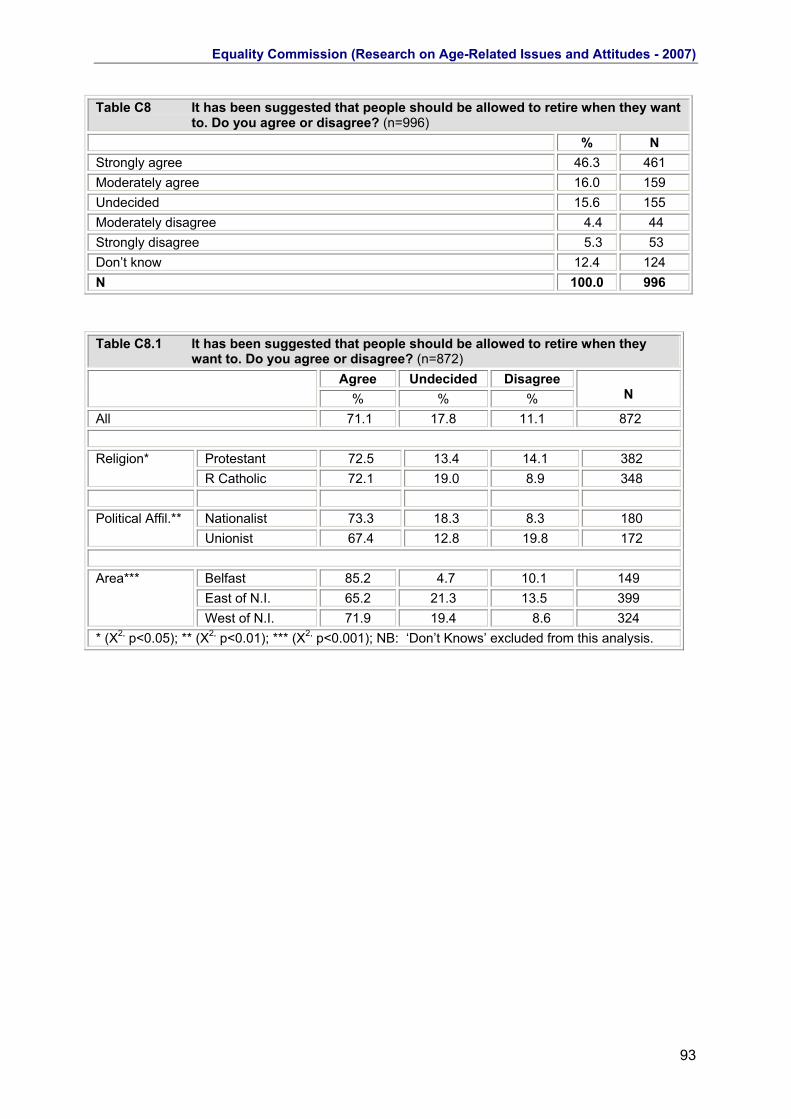
Equality Commission (Research on Age-Related Issues and Attitudes - 2007)
93
Table C8 It has been suggested that people should be allowed to retire when they want to. Do you agree or disagree? (n=996)
% N Strongly agree 46.3 461 Moderately agree 16.0 159 Undecided 15.6 155 Moderately disagree 4.4 44 Strongly disagree 5.3 53 Don’t know 12.4 124 N 100.0 996 Table C8.1 It has been suggested that people should be allowed to retire when they
want to. Do you agree or disagree? (n=872) Agree Undecided Disagree
% % %
N
All 71.1 17.8 11.1 872
Protestant 72.5 13.4 14.1 382 Religion* R Catholic 72.1 19.0 8.9 348
Nationalist 73.3 18.3 8.3 180 Political Affil.** Unionist 67.4 12.8 19.8 172
Belfast 85.2 4.7 10.1 149 East of N.I. 65.2 21.3 13.5 399
Area***
West of N.I. 71.9 19.4 8.6 324 * (X2, p<0.05); ** (X2, p<0.01); *** (X2, p<0.001); NB: ‘Don’t Knows’ excluded from this analysis.

Equality Commission (Research on Age-Related Issues and Attitudes - 2007)
94
Table C9 Why do you think that people should be allowed to retire when they want to?
(n=618) % N Freedom of choice 53.4 330 If they can afford it 16.2 100 If fit and healthy 11.2 69 Enjoy life - worked long enough 10.7 66 Some people want to continue working 1.9 12 Depends 1.1 7 I would like to retire early 1.1 7 Give younger people a chance 0.6 4 Too old 0.5 3 Everyone should retire when they can 0.2 1 From 60 only 0.2 1 If stuck in dead end job 0.2 1 In some jobs the employers do not want them beyond 0.2 1 Insurance policy 0.2 1 Lazy 0.2 1 More opportunities 0.2 1 Not everyone wants to work till they are 65 0.2 1 Pension service 0.2 1 Should be able to retire early 0.2 1 We can work too long 0.2 1 We pay our taxes 0.2 1 Work until you can’t enjoy retirement 0.2 1 Don’t know 1.1 7 N 100.0 618
Table C10 Are you currently working? (n=1000) % N Yes 68.4 684 No 31.6 316 N 100.0 1000

Equality Commission (Research on Age-Related Issues and Attitudes - 2007)
95
Table C11 Thinking about your own personal situation now, what would be your
preferred option concerning work and retirement? (n=683) % N It depends on my situation at the time 34.3 234 I prefer to retire early 33.8 231 I prefer to retire at the current retirement age 12.9 88 I prefer to work full-time beyond my current retirement age 6.4 44 I prefer to work part-time beyond my current retirement age 6.4 44 I currently work beyond the current retirement age 2.3 16 Don’t know 3.8 26 N 100.0 683 Table C11.1 Thinking about your own personal situation now, what would be your
preferred option concerning work and retirement? (n=657): Those who prefer to work beyond retirement, retire early, retire at current retirement age or depends on situation.
Prefer work / currently
work beyond
retirement
Prefer retire at current
retirement age
Prefer retire early
Depend at the time
N
% % % % All 15.8 13.4 35.2 35.6 657
16 - 29 years old 9.2 13.8 36.4 40.5 195 30 - 44 years old 12.7 12.7 38.2 36.4 228 45 - 64 years old 18.4 13.9 34.3 33.3 201
Age***
65 years or over 60.6 12.1 12.1 15.2 33
Single 10.9 12.7 33.6 42.8 229 Married/Cohabit 16.8 13.0 37.2 32.9 368
Marital**
Wid/Sep/Div 30.4 17.9 30.4 21.4 56
Higher Level 16.1 16.8 31.1 36.0 161 Lower Level 10.0 10.6 42.1 37.4 340
Education***
No Qualifications 27.7 16.9 25.4 30.0 130
<£10K 13.9 11.1 13.9 61.1 36 £10K-£19,999 14.3 17.1 31.4 37.1 70
Income**
£20K + 16.4 11.0 49.3 23.3 73
Belfast 14.2 4.7 36.2 44.9 127 East of N.I. 14.8 15.2 36.7 33.2 283
Area*
West of N.I. 17.8 15.8 32.8 33.6 247 * (X2, p<0.05); ** (X2, p<0.01); *** (X2, p<0.001); NB: ‘Don’t Knows’ excluded from this analysis.
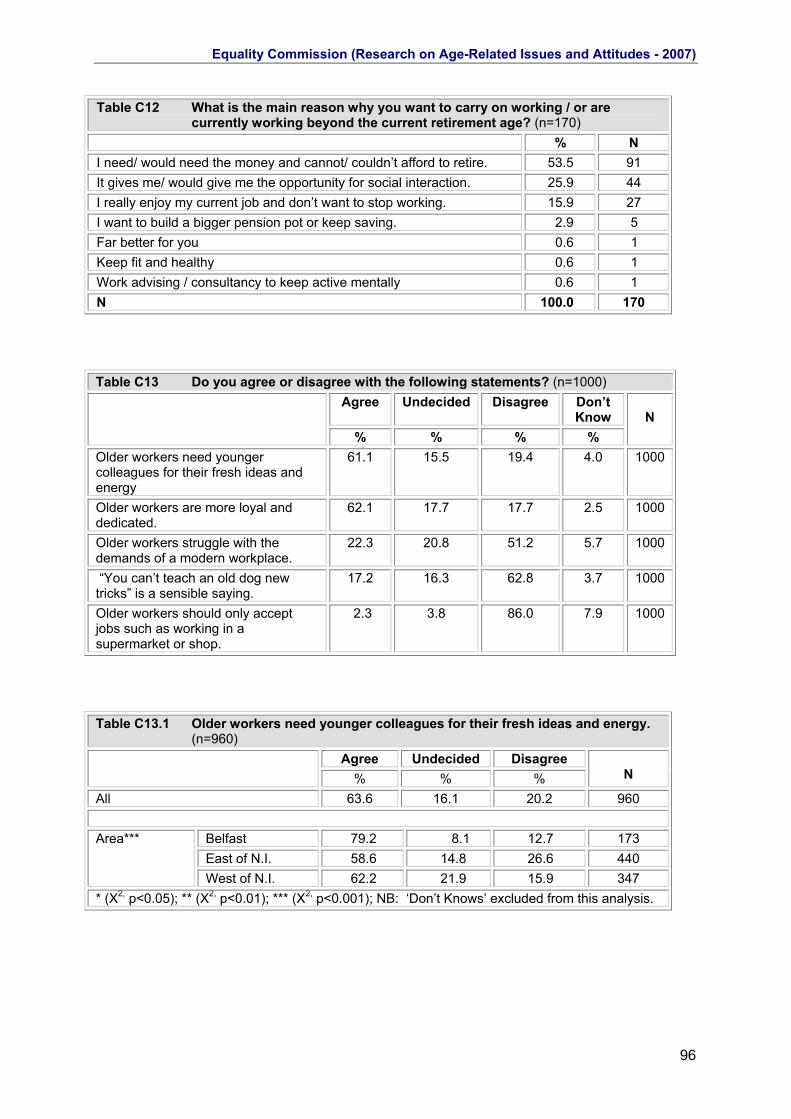
Equality Commission (Research on Age-Related Issues and Attitudes - 2007)
96
Table C12 What is the main reason why you want to carry on working / or are currently working beyond the current retirement age? (n=170)
% N I need/ would need the money and cannot/ couldn’t afford to retire. 53.5 91 It gives me/ would give me the opportunity for social interaction. 25.9 44 I really enjoy my current job and don’t want to stop working. 15.9 27 I want to build a bigger pension pot or keep saving. 2.9 5 Far better for you 0.6 1 Keep fit and healthy 0.6 1 Work advising / consultancy to keep active mentally 0.6 1 N 100.0 170 Table C13 Do you agree or disagree with the following statements? (n=1000)
Agree Undecided Disagree Don’t Know
% % % %
N
Older workers need younger colleagues for their fresh ideas and energy
61.1 15.5 19.4 4.0 1000
Older workers are more loyal and dedicated.
62.1 17.7 17.7 2.5 1000
Older workers struggle with the demands of a modern workplace.
22.3 20.8 51.2 5.7 1000
“You can’t teach an old dog new tricks” is a sensible saying.
17.2 16.3 62.8 3.7 1000
Older workers should only accept jobs such as working in a supermarket or shop.
2.3 3.8 86.0 7.9 1000
Table C13.1 Older workers need younger colleagues for their fresh ideas and energy.
(n=960) Agree Undecided Disagree
% % %
N
All 63.6 16.1 20.2 960
Belfast 79.2 8.1 12.7 173 East of N.I. 58.6 14.8 26.6 440
Area***
West of N.I. 62.2 21.9 15.9 347 * (X2, p<0.05); ** (X2, p<0.01); *** (X2, p<0.001); NB: ‘Don’t Knows’ excluded from this analysis.

Equality Commission (Research on Age-Related Issues and Attitudes - 2007)
97
Table C13.2 Older workers are more loyal and dedicated. (n=975)
Agree Undecided Disagree % % %
N
All 63.7 18.2 18.2 975
16 - 29 years old 46.0 22.0 32.0 250 30 - 44 years old 63.7 21.6 14.7 278 45 - 64 years old 73.4 14.0 12.6 286
Age***
65 years or over 73.9 13.4 12.7 157
Single 56.6 18.1 25.3 304 Married / Cohabiting 65.9 18.4 15.7 511
Marital**
Wid/Sep/Div 72.2 17.2 10.6 151
Higher Level 51.3 21.7 27.0 189 Lower Level 61.9 17.1 21.0 433
Education***
No Qualifications 76.6 15.5 7.9 304
ABC1 59.3 20.6 20.0 504 Social Class** C2DE 70.6 15.4 14.0 408
Belfast 73.8 11.0 15.1 172 East of N.I. 63.5 17.7 18.8 458
Area*
West of N.I. 58.8 22.3 18.8 345 * (X2, p<0.05); ** (X2, p<0.01); *** (X2, p<0.001); NB: ‘Don’t Knows’ excluded from this analysis.

Equality Commission (Research on Age-Related Issues and Attitudes - 2007)
98
Table C13.3 Older workers struggle with the demands of a modern workplace. (n=943)
Agree Undecided Disagree % % %
N
All 23.6 22.1 54.3 943
16 - 29 years old 30.0 25.8 44.2 240 30 - 44 years old 21.0 20.7 57.4 270 45 - 64 years old 20.8 20.4 58.8 279
Age*
65 years or over 22.0 20.7 57.3 150
Single 32.2 22.1 45.7 289 Married / Cohabiting 20.0 22.8 57.2 500
Marital**
Wid/Sep/Div 19.3 19.3 61.4 145
Protestant 21.4 24.8 53.8 435 Religion* R Catholic 26.6 17.3 56.0 364
Belfast 31.3 13.1 55.6 160 East of N.I. 19.3 26.1 54.5 440
Area**
West of N.I. 25.7 21.0 53.4 343 * (X2, p<0.05); ** (X2, p<0.01); *** (X2, p<0.001); NB: ‘Don’t Knows’ excluded from this analysis.

Equality Commission (Research on Age-Related Issues and Attitudes - 2007)
99
Table C13.4 “You can’t teach an old dog new tricks” is a sensible saying, do you
agree? (n=963) Agree Undecided Disagree
% % %
N
All 17.9 16.9 65.2 963
Single 22.8 19.0 58.2 294 Married / Cohabiting 15.4 15.6 69.0 507
Marital*
Wid/Sep/Div 17.0 17.0 66.0 153
Belfast 22.4 7.1 70.6 170 East of N.I. 14.0 20.0 65.9 449
Area***
West of N.I. 20.6 17.7 61.6 344 * (X2, p<0.05); ** (X2, p<0.01); *** (X2, p<0.001); NB: ‘Don’t Knows’ excluded from this analysis. Table C13.5 Older workers should only accept jobs such as working in a supermarket,
do you agree? (n=921) Agree Undecided Disagree
% % %
N
All 2.5 4.1 93.4 921
Table C14 Do you agree or disagree with the following statements? (n=1000)
Agree Undecided Disagree Don’t Know
% % % %
N
Younger people need older colleagues for their advice and experience.
77.4 12.1 7.8 2.7 1000
Younger people are less committed and responsible in their attitude to work.
40.9 22.4 32.0 4.7 1000
Younger people are more energetic workers than older people.
32.0 21.2 42.2 4.6 1000
Younger people are more involved in their social life than in their work.
48.2 25.5 20.8 5.5 1000

Equality Commission (Research on Age-Related Issues and Attitudes - 2007)
100
Table C14.1 Younger people need older colleagues for their advice and experience.
(n=973) Agree Undecided Disagree
% % %
N
All 79.5 12.4 8.0 973
Nationalist 79.1 13.8 7.1 196 Political Affil* Unionist 88.0 6.3 5.8 208
Belfast 93.1 4.6 2.3 174 East of N.I. 77.2 13.5 9.3 452
Area**
West of N.I. 75.8 15.0 9.2 347 * (X2, p<0.05); ** (X2, p<0.01); *** (X2, p<0.001); NB: ‘Don’t Knows’ excluded from this analysis.

Equality Commission (Research on Age-Related Issues and Attitudes - 2007)
101
Table C14.2 Younger people are less committed and responsible in their attitude to
work. (n=953) Agree Undecided Disagree
% % %
N
All 42.9 23.5 33.6 953
Male 47.2 22.3 30.5 453 Sex* Female 39.0 24.6 36.4 500
16 - 29 years old 26.0 23.6 50.4 250 30 - 44 years old 42.1 24.9 33.0 273 45 - 64 years old 52.0 22.2 25.8 275
Age***
65 years or over 55.3 23.0 21.7 152
Single 35.0 20.0 45.0 300 Married / Cohabiting 44.8 26.3 28.9 498
Marital***
Wid/Sep/Div 53.4 19.2 27.4 146
Yes 57.7 22.7 19.6 97 Long-term Illness** No 41.1 23.6 35.3 853
Higher Level 35.8 23.0 41.2 187 Lower Level 37.2 23.0 39.8 427
Education***
No Qualifications 56.5 21.8 21.8 294
ABC1 38.5 22.6 38.9 493 Social Class*** C2DE 49.0 24.5 26.5 403
Belfast 53.9 14.5 31.5 165 East of N.I. 35.0 29.6 35.4 443
Area***
West of N.I. 47.8 20.0 32.2 345 * (X2, p<0.05); ** (X2, p<0.01); *** (X2, p<0.001); NB: ‘Don’t Knows’ excluded from this analysis.

Equality Commission (Research on Age-Related Issues and Attitudes - 2007)
102
Table C14.3 Younger people are more energetic workers than older people. (n=954)
Agree Undecided Disagree % % %
N
All 33.5 22.2 44.2 954
16 - 29 years old 42.8 20.8 36.4 250 30 - 44 years old 27.0 23.7 49.3 274 45 - 64 years old 30.5 23.5 46.0 272
Age**
65 years or over 34.8 19.4 45.8 155
Higher Level 28.1 22.7 49.2 185 Lower Level 31.2 21.2 47.7 430
Education*
No Qualifications 39.5 23.1 37.4 294
Belfast 30.4 9.5 60.1 168 East of N.I. 30.4 27.2 42.5 438
Area***
West of N.I. 39.1 22.1 38.8 348 * (X2, p<0.05); ** (X2, p<0.01); *** (X2, p<0.001); NB: ‘Don’t Knows’ excluded from this analysis. Table C14.4 Younger people are more involved in their social life than in their work.
(n=945) Agree Undecided Disagree
% % %
N
All 51.0 27.0 22.0 945
ABC1 46.8 27.9 25.3 491 Social Class** C2DE 58.0 25.2 16.8 393
16 - 29 years old 38.6 27.2 34.1 246 30 - 44 years old 52.6 25.2 22.2 270 45 - 64 years old 56.0 26.7 17.3 277
Age***
65 years or over 59.5 29.7 10.8 148
Higher Level 41.5 30.9 27.7 188 Lower Level 48.7 23.9 27.4 419
Education***
No Qualifications 62.5 27.1 10.3 291
Belfast 70.1 16.8 13.2 167 East of N.I. 42.9 30.7 26.4 436
Area**
West of N.I. 52.0 27.2 20.8 342 * (X2, p<0.05); ** (X2, p<0.01); *** (X2, p<0.001); NB: ‘Don’t Knows’ excluded from this analysis.

Equality Commission (Research on Age-Related Issues and Attitudes - 2007)
103
Table C15 Do you think that people in their 40’s and 50’s who are looking for work are generally treated better or worse than younger people by prospective employers? (n=999)
% N Better 4.0 40 Worse 15.3 153 Same 50.3 502 Don’t Know 30.4 304 N 100.0 999 Table C15.1 Do you think that people in their 40’s and 50’s who are looking for work
are generally treated better or worse than younger people by prospective employers. (n=695)
Better Worse Same % % %
N
All 5.8 22.0 72.2 695
Single 8.5 15.5 76.0 200 Married / Cohabiting 4.7 25.1 70.2 383
Marital*
Wid/Sep/Div 4.8 23.8 71.4 105 * (X2, p<0.05); ** (X2, p<0.01); *** (X2, p<0.001); NB: ‘Don’t Knows’ excluded from this analysis.

Equality Commission (Research on Age-Related Issues and Attitudes - 2007)
104
Table C15a What do you think is the main way people in their 40’s and 50’s who are
looking for work are treated BETTER than younger people by prospective employers? (n=40)
% N More experience 55.0 22 More respect 20.0 8 Get more money / opportunities 7.5 3 Business people prefer older ones 2.5 1 Depends on Job 2.5 1 They bully younger ones 2.5 1 Don’t know 10.0 4 N 100.0 40
Table C15b What do you think is the main way people in their 40’s and 50’s who are
looking for work are treated WORSE than younger people by prospective employers? (n=151)
% N Because of age / discrimination 36.4 55 Employers prefer younger workers / lower pay 21.2 32 Find it more difficult to get a job 19.2 29 Little working life left 9.9 15 Will cost more 3.3 5 Lack of experience 1.3 2 Attitude 0.7 1 Forced to do things they don't want to do 0.7 1 It works both ways... Some employers reject older workers 0.7 1 Only when looking for new jobs 0.7 1 Referring to some of the points raised in previous 0.7 1 They are not as up to date with technology as younger workers 0.7 1 They couldn't get a manual job 0.7 1 They expect more of you 0.7 1 Don't know 3.3 5 N 100.0 151
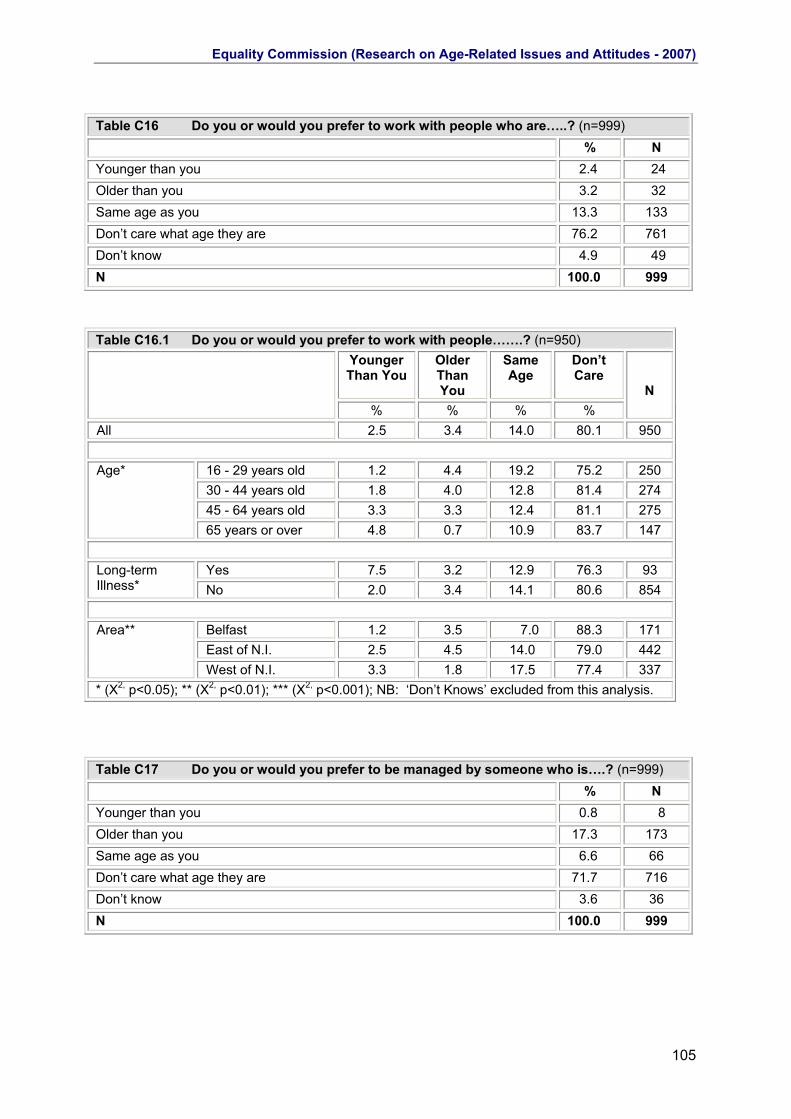
Equality Commission (Research on Age-Related Issues and Attitudes - 2007)
105
Table C16 Do you or would you prefer to work with people who are…..? (n=999) % N Younger than you 2.4 24 Older than you 3.2 32 Same age as you 13.3 133 Don’t care what age they are 76.2 761 Don’t know 4.9 49 N 100.0 999
Table C16.1 Do you or would you prefer to work with people…….? (n=950) Younger Than You
Older Than You
Same Age
Don’t Care
% % % %
N
All 2.5 3.4 14.0 80.1 950
16 - 29 years old 1.2 4.4 19.2 75.2 250 30 - 44 years old 1.8 4.0 12.8 81.4 274 45 - 64 years old 3.3 3.3 12.4 81.1 275
Age*
65 years or over 4.8 0.7 10.9 83.7 147
Yes 7.5 3.2 12.9 76.3 93 Long-term Illness* No 2.0 3.4 14.1 80.6 854
Belfast 1.2 3.5 7.0 88.3 171 East of N.I. 2.5 4.5 14.0 79.0 442
Area**
West of N.I. 3.3 1.8 17.5 77.4 337 * (X2, p<0.05); ** (X2, p<0.01); *** (X2, p<0.001); NB: ‘Don’t Knows’ excluded from this analysis.
Table C17 Do you or would you prefer to be managed by someone who is….? (n=999) % N Younger than you 0.8 8 Older than you 17.3 173 Same age as you 6.6 66 Don’t care what age they are 71.7 716 Don’t know 3.6 36 N 100.0 999

Equality Commission (Research on Age-Related Issues and Attitudes - 2007)
106
Table C17.1 Do you or would you prefer to be managed by someone who is…….?
(n=963) Younger Than You
Older Than You
Same Age
Don’t Care
N
% % % % All 0.8 18.0 6.9 74.4 963
16 - 29 years old 0.8 29.7 6.6 62.9 256 30 - 44 years old - 20.2 6.9 72.9 277 45 - 64 years old 0.4 10.1 7.9 81.6 277
Age***
65 years or over 3.4 7.4 5.4 83.9 149
Single 0.3 27.1 6.9 65.7 306 Married / Cohabiting 0.8 14.4 6.7 78.1 508
Marital***
Wid/Sep/Div 2.1 11.4 7.1 79.3 140
Yes 4.3 12.0 7.6 76.1 92 Long-term Illness** No 0.5 18.7 6.6 74.3 868
Yes 0.3 23.0 6.3 70.3 300 Dependants* No 1.1 16.0 6.8 76.2 651
<£10K 1.4 23.0 14.9 60.8 74 £10K-£19,999 4.3 30.4 8.7 56.5 92
Income*
£20K + - 20.3 3.8 75.9 79
* (X2, p<0.05); ** (X2, p<0.01); *** (X2, p<0.001); NB: ‘Don’t Knows’ excluded from this analysis.

Equality Commission (Research on Age-Related Issues and Attitudes - 2007)
107
SECTION D: PERSONAL EXPERIENCE OF AGE-RELATED DISCRIMINATION
Table D1 Some people have said that there is a lot of age discrimination in modern workplaces. Do you agree with this, or not? (n=995)
% N Yes, I agree 16.7 166 No, I disagree 24.1 240 Don’t know 59.2 589 N 100.0 995
Table D1.1 Some people have said that there is a lot of age discrimination in modern
workplaces. Do you agree with this, or not? (n=406) Yes No % %
N
All 40.9 59.1 406
Yes 59.2 40.8 49 Long-term** Illness No 38.2 61.8 356
ABC1 37.0 63.0 211 Social Class* C2DE 47.3 52.7 165
* (X2, p<0.05); ** (X2, p<0.01); *** (X2, p<0.001); ‘Don’t Knows’ excluded from this analysis.
Table D2 Do you think your employer discriminates on the grounds of age? (n=655) % N Yes 4.3 28 No 88.7 581 Don’t know 7.0 46 N 100.0 655 NB: Those ‘not employed’ excluded from analysis.
Table D3 Does your employer…? (n=23) % N Discriminate against older workers 39.1 9 Discriminate against younger workers 43.5 10 Discriminate against both younger and older workers 17.4 4 N 100.0 23 NB: Sample size too small to permit analysis by background variables
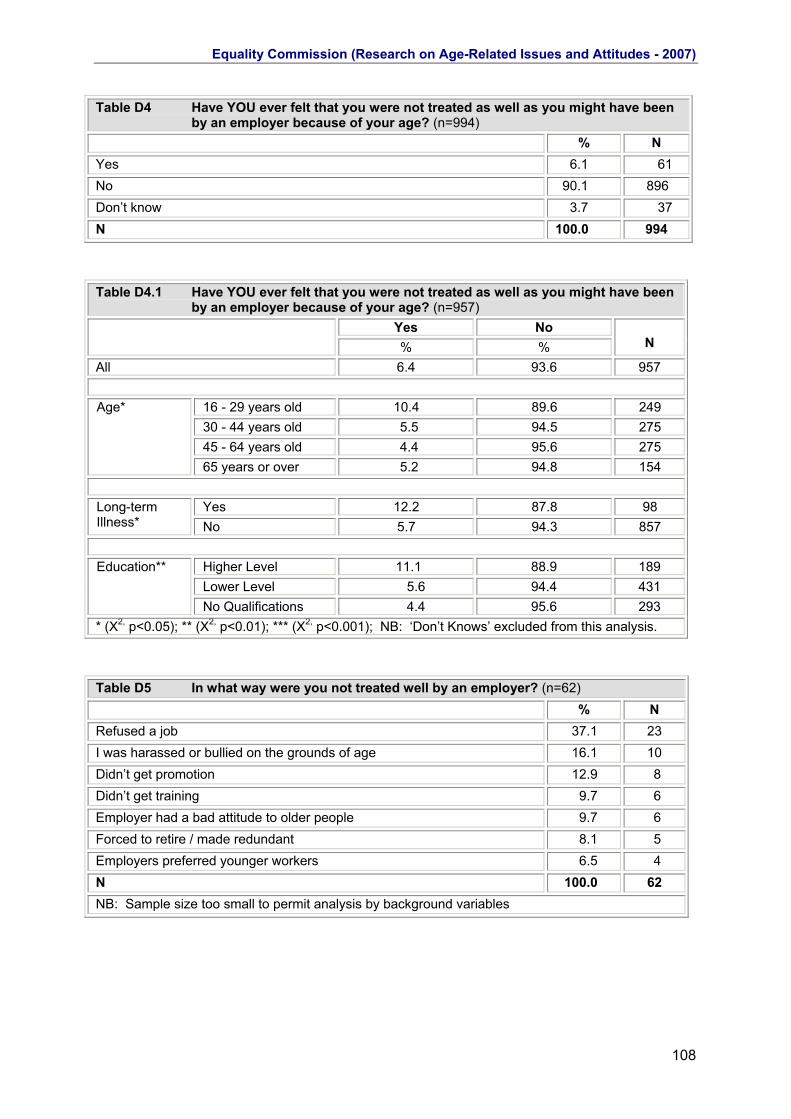
Equality Commission (Research on Age-Related Issues and Attitudes - 2007)
108
Table D4 Have YOU ever felt that you were not treated as well as you might have been by an employer because of your age? (n=994)
% N Yes 6.1 61 No 90.1 896 Don’t know 3.7 37 N 100.0 994
Table D4.1 Have YOU ever felt that you were not treated as well as you might have been
by an employer because of your age? (n=957) Yes No % %
N
All 6.4 93.6 957
16 - 29 years old 10.4 89.6 249 30 - 44 years old 5.5 94.5 275 45 - 64 years old 4.4 95.6 275
Age*
65 years or over 5.2 94.8 154
Yes 12.2 87.8 98 Long-term Illness* No 5.7 94.3 857
Higher Level 11.1 88.9 189 Lower Level 5.6 94.4 431
Education**
No Qualifications 4.4 95.6 293 * (X2, p<0.05); ** (X2, p<0.01); *** (X2, p<0.001); NB: ‘Don’t Knows’ excluded from this analysis.
Table D5 In what way were you not treated well by an employer? (n=62) % N Refused a job 37.1 23 I was harassed or bullied on the grounds of age 16.1 10 Didn’t get promotion 12.9 8 Didn’t get training 9.7 6 Employer had a bad attitude to older people 9.7 6 Forced to retire / made redundant 8.1 5 Employers preferred younger workers 6.5 4 N 100.0 62 NB: Sample size too small to permit analysis by background variables
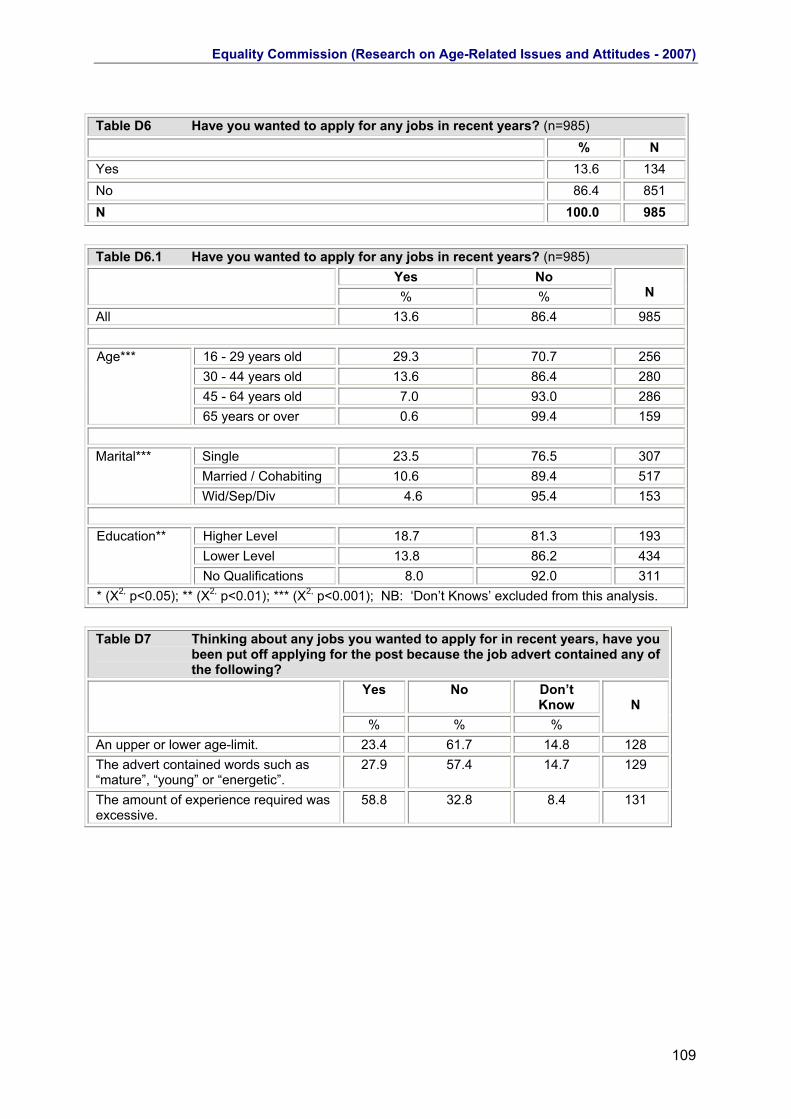
Equality Commission (Research on Age-Related Issues and Attitudes - 2007)
109
Table D6 Have you wanted to apply for any jobs in recent years? (n=985) % N Yes 13.6 134 No 86.4 851 N 100.0 985
Table D6.1 Have you wanted to apply for any jobs in recent years? (n=985)
Yes No % %
N
All 13.6 86.4 985
16 - 29 years old 29.3 70.7 256 30 - 44 years old 13.6 86.4 280 45 - 64 years old 7.0 93.0 286
Age***
65 years or over 0.6 99.4 159
Single 23.5 76.5 307 Married / Cohabiting 10.6 89.4 517
Marital***
Wid/Sep/Div 4.6 95.4 153
Higher Level 18.7 81.3 193 Lower Level 13.8 86.2 434
Education**
No Qualifications 8.0 92.0 311 * (X2, p<0.05); ** (X2, p<0.01); *** (X2, p<0.001); NB: ‘Don’t Knows’ excluded from this analysis.
Table D7 Thinking about any jobs you wanted to apply for in recent years, have you
been put off applying for the post because the job advert contained any of the following?
Yes No Don’t Know
% % %
N
An upper or lower age-limit. 23.4 61.7 14.8 128 The advert contained words such as “mature”, “young” or “energetic”.
27.9 57.4 14.7 129
The amount of experience required was excessive.
58.8 32.8 8.4 131

Equality Commission (Research on Age-Related Issues and Attitudes - 2007)
110
Table D7.1 Thinking about any jobs you wanted to apply for in recent years, have you
been put off applying for the post because the job advert contained any of the following: ‘The amount of experience required was excessive’? (n=120)
Yes No % %
N
All 64.2 35.8 120
16 - 29 years old 74.2 25.8 66 30 - 44 years old 44.4 55.6 36 45 - 64 years old 64.7 35.3 17
Age*
65 years or over 100.0 - 1 * (X2, p<0.05); ** (X2, p<0.01); *** (X2, p<0.001); NB: ‘Don’t Knows’ excluded from this analysis.