azerbaijan - fao.org · institution/address email tables desk study n/a n/a n/a n/a n/a n/a n/a ......
TRANSCRIPT

Azerbaijan
GLOBAL FOREST RESOURCES ASSESSMENT 2015
COUNTRY REPORT
Rome, 2014

FAO, at the request of its member countries, regularly monitors the world´s forests and theirmanagement and uses through the Global Forest Resources Assessment (FRA). This country reportis prepared as a contribution to the FAO publication, the Global Forest Resources Assessment 2015(FRA 2015).The content and the structure are in accordance with the recommendations and guidelines given byFAO in the document Guide for country reporting for FRA 2015 (http://www.fao.org/3/a-au190e.pdf).These reports were submitted to FAO as official government documents.
The content and the views expressed in this report are the responsibility of the entity submitting thereport to FAO. FAO may not be held responsible for the use which may be made of the informationcontained in this report.

FRA 2015 – Country Report, Azerbaijan
3
TABLE OF CONTENTSReport preparation and contact persons...............................................................................................................................41. What is the area of forest and other wooded land and how has it changed over time? ................................................. 52. What is the area of natural and planted forest and how has it changed over time? ..................................................... 153. What are the stocks and growth rates of the forests and how have they changed? .....................................................204. What is the status of forest production and how has it changed over time? .................................................................305. How much forest area is managed for protection of soil and water and ecosystem services? ..................................... 366. How much forest area is protected and designated for the conservation of biodiversity and how has it changed overtime? ................................................................................................................................................................................... 417. What is the area of forest affected by woody invasive species? .................................................................................. 458. How much forest area is damaged each year? ............................................................................................................ 489. What is the forest area with reduced canopy cover? ....................................................................................................5210. What forest policy and regulatory framework exists to support implementation of sustainable forest managementSFM? .................................................................................................................................................................................. 5311. Is there a national platform that promotes stakeholder participation in forest policy development? ............................ 5512. What is the forest area intended to be in permanent forest land use and how has it changed over time? .................. 5613. How does your country measure and report progress towards SFM at the national level? ........................................ 5914. What is the area of forest under a forest management plan and how is this monitored? ........................................... 6115. How are stakeholders involved in the management decision making for publicly owned forests? .............................. 6316. What is the area of forest under an independently verified forest certification scheme? .............................................6417. How much money do governments collect from and spend on forests? .....................................................................6618. Who owns and manages the forests and how has this changed? ..............................................................................6819. How many people are directly employed in forestry? ................................................................................................. 7320. What is the contribution of forestry to Gross Domestic Product (GDP)? .................................................................... 7521. What is forest area likely to be in the future ...............................................................................................................76

FRA 2015 – Country Report, Azerbaijan
4
Report preparation and contact personsContact personsThe present report was prepared by the following person(s)
Name (FAMILYNAME, first name)
Institution/address Email Tables
DESK STUDY N/A N/A N/A
N/A N/A N/A N/A
N/A N/A N/A N/A
N/A N/A N/A N/A
Introductory TextPlace an introductory text on the content of this report
No report has been received from the country. This report is the result of a desk study prepared by theFRA secretariat in Rome, which is based on the existing available information using the establishedformat for FRA 2015/CFRQ format
Desk Study?
Check "yes" if this survey is a Desk Study, "no" otherwise
Desk Study? yes

FRA 2015 – Country Report, Azerbaijan
5
1. What is the area of forest and other wooded land and how has it changed over time?Documents for this question:
• Guide for country reporting FRA 2015• FRA 2015 Terms and Definitions
1.1 Categories and definitions
Category Definition
Forest Land spanning more than 0.5 hectares with trees higher than 5 meters and a canopy cover of more than10 percent or trees able to reach these thresholds in situ. It does not include land that is predominantlyunder agricultural or urban land use.
Other wooded land Land not classified as "Forest" spanning more than 0.5 hectares with trees higher than 5 meters anda canopy cover of 5-10 percent or trees able to reach these thresholds ; or with a combined coverof shrubs bushes and trees above 10 percent. It does not include land that is predominantly underagricultural or urban land use.
Other land All land that is not classified as "Forest" or "Other wooded land".
...of which with tree cover(sub-category)
Land considered as "Other land", that is predominantly agricultural or urban lands use and has patchesof tree cover that span more than 0.5 hectares with a canopy cover of more than 10 percent of trees ableto reach a height of 5 meters at maturity. It includes bothe forest and non-forest tree species.
Inland water bodies Inland water bodies generally include major rivers, lakes and water reservoirs.
Forest expansion Expansion of forest on land that, until then, was not defined as forest.
...of which afforestation(sub-category)
Establishment of forest through planting and/or deliberate seeding on land that, until then, was notdefined as forest.
...of which naturalexpansion of forest (sub-category)
Expansion of forests through natural succession on land that, until then, was under another land use(e.g. forest succession on land previously used for agriculture).
Deforestation The conversion of forest to other land use or the longterm reduction of the tree canopy cover below theminimum 10 percent threshold.
...of which humaninduced (sub-category)
Human induced conversion of forest to other land use or the permanent reduction of the tree canopycover below the minimum 10 percent threshold.
Reforestation Natural regeneration or re-establishment of forest through planting and/or deliberate seeding on landalready in forest land use.
...of which artificialreforestation (sub-category)
Re-establishment of forest through planting and/or deliberate seeding on land already in forest land use.
1.2 National data
1.2.1 Data sources
References to sourcesof information
Variables Years Additional comments
1 UNECE/FAO, 2000. ForestResources of Europe, CIS,North America, Australia,Japan and New Zealand
(Forest, OWL) Forest, OWL,Other land
1983,1988 Secondary data source.

FRA 2015 – Country Report, Azerbaijan
6
2 FAO, 2001. Global ForestResources Assessment 2000.FAO Forestry Paper 140.
N/A 1990, 2000 Secondary data source.
3 FAOSTAT data, 2007. Total area, Land area All years N/A
4 UNECE environmentalperformance review,Azerbaijan, 2004,Environmental PerformanceReviews Series No.19. http://www.countryanalyticwork.net/CAW/Cawdoclib.nsf/0/7E8C14AF9756CDC485256FB00048D69F/$file/pdf+file+with+maps.pdf
Woodland area 1984,2001 Secondary data source.
5 State Land and CartographyCommittee of AzerbaijanRepublic, The StateStatistical Committee ofAzerbaijan Republic, http://www.azstat.org/statinfo/environment/en/010.shtml#s1
Wooded area 1990,2000, 2004 N/A
6 UNECE/FAO 2000 enquirydata, Manuscript, July 1999
Land reserved for Forestry,Forest, OWL,
1999 N/A
7 Salmanov, S. 2005.Azerbaijan Forest ResourcesAssessment for SustainableForest Managemen.UNECE/FAO Workshopon Capacity Building inSharing Forest and MarketInformation. 2005. http://www.unece.org/timber/docs/other_mtgs/2005krtiny/reports/aze_fra_e.pdf
Forest land, Forest N/A Secondary data source.
8 The State StatisticalCommittee of AzerbaijanRepublic, http://www.azstat.org/statinfo/environment/en/
Reforestation area 1999- 2003 Secondary data source.
9 Salmanov, S. 2005.Azerbaijan Forest ResourcesAssessment for SustainableForest Managemen.UNECE/FAO Workshopon Capacity Building inSharing Forest and MarketInformation. 2005. http://www.unece.org/timber/docs/other_mtgs/2005krtiny/reports/aze_fra_e.pdf
sapling and seedling, naturalregeneration
2003-2005 Secondary data source.

FRA 2015 – Country Report, Azerbaijan
7
10 UNECE environmentalperformance reviews,Azerbaijan, SecondReview, 2011. http://www.unece.org/fileadmin/DAM/env/epr/epr_studies/Synopsis/Azerbaijan%20ECE.CEP.158.synopsis%20english.pdf http://www.unece.org/fileadmin/DAM/env/epr/epr_studies/azerbaijan%20II.pdf
Forest area 2011 Secondary data source.
11 The State StatisticalCommittee of AzerbaijanRepublic, http://www.stat.gov.az/source/agriculture/indexen.php#007
Forest area 2000-2012 Secondary data source.
1.2.2 Classification and definitions
National class Definition
Forest area The classification and definitions used in the UNECE/FAO 2000report are the same as those being used by FRA 2010 and 2015.
N/A N/A
N/A N/A
N/A N/A
1.2.3 Original data
Forest area
Main indicators of forest funds
(at the end of year)
2000 2001 2002 2003 2004 2005 2006 2007 2008 2009 2010 2011

FRA 2015 – Country Report, Azerbaijan
8
Totalareaofthecountry, thsdha
8660 8660 8660 8660 8660 8660 8660 8660 8660 8660 8660 8660
Totalareaofforestfund lands,thsdha
1037.4 1037 1037.8 1037.8 1037.8 1037.8 1037.8 1038.8 1038.8 1039.9 1040.7 1040.8
theirshareincountry's area,percent
12.0 12.0 12.0 12.0 12.0 12.0 12.0 12.0 12.0 12.0 12.0 12.0
Drylandsfromtotalarea of thecountry,thsdha
8260.4 8261.8 8265.2 8267.2 8265 8263.7 8262.9 8262.7 8262.7 8262.7 8265.5 8265.8
Forestedarea,thsdha
871.8 872.5 873.1 874.2 876.1 877.2 879.1 989.3 996.5 1001.6 1008.3 1021.0
FRA 2015 – Country Report, Azerbaijan
9
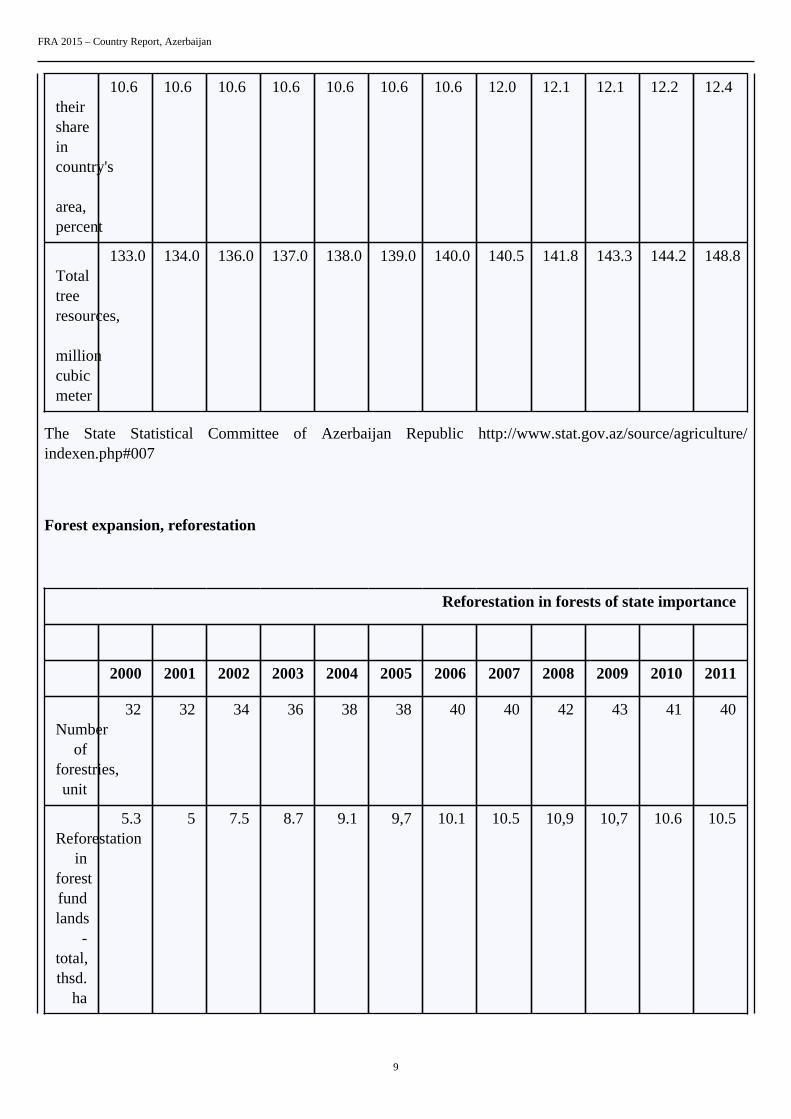
theirshareincountry's area,percent
10.6 10.6 10.6 10.6 10.6 10.6 10.6 12.0 12.1 12.1 12.2 12.4
Totaltreeresources, millioncubicmeter
133.0 134.0 136.0 137.0 138.0 139.0 140.0 140.5 141.8 143.3 144.2 148.8
The State Statistical Committee of Azerbaijan Republic http://www.stat.gov.az/source/agriculture/indexen.php#007
Forest expansion, reforestation
Reforestation in forests of state importance
2000 2001 2002 2003 2004 2005 2006 2007 2008 2009 2010 2011
Number
offorestries,unit
32 32 34 36 38 38 40 40 42 43 41 40
Reforestation
inforestfundlands
-total,thsd.
ha
5.3 5 7.5 8.7 9.1 9,7 10.1 10.5 10,9 10,7 10.6 10.5

FRA 2015 – Country Report, Azerbaijan
10
including:
sowing
andplanting
of forests
2.0 2.0 3.1 3.7 3.7 3.9 3.8 3.9 3,9 3,5 3.5 3.1
provision
ofsupport
tonaturalrenovation
offorests
3.3 3 4.4 5 5.4 5,9 6.3 6.6 7,1 7,2 7.2 7.4
Share
of forestplanting
andsowingareas
intotalarea
wherereforestationworkswerecarriedout, in
percent
37.7 40.0 41.3 42.5 40.7 40.2 37.6 37.1 35.8 32,7 33.0 29.5

FRA 2015 – Country Report, Azerbaijan
11
Planting
ofmanmade
forests
inravines,gorges
andother
uselessagriculturallands,
ha
265.0 113.0 132.0 147.0 164.0 65.0 66.0 5.0 284.0 984.0 434.0 516.0
Raising
ofyoungtrees
inforestfundlands
andmoving
themintothe
categoryof
forestedareas andgroves,thsd
ha
3.3 2.0 3.2 3.1 3.6 3.8 4.9 4.4 4.2 5.1 6.7 7.8
including:

FRA 2015 – Country Report, Azerbaijan
12
throughcreation
bymethod
of forestplanting
andsowing
0.8 0.6 1.0 0.9 1.3 0.9 1.5 1.5 1.5 2.0 2.5 2.9
The State Statistical Committee of Azerbaijan Republic http://www.stat.gov.az/source/agriculture/indexen.php#007
1.3 Analysis and processing of national data
1.3.1 Adjustment
Forest area
For the Inland water area, the FAOSTAT estimate (397.1) is applied. This calibration is applied to the Otherland category in the National reporting table.
Forest expansion, reforestation
The average of reforestation between 2000-2002 is used to report the year 2000 and the average of 2003-2007of reforestation is used to report the year 2005 and the average of reforestation between 2008-2011 is used toreport the year 2010.
1.3.2 Estimation and forecasting
Forest area
UNECE/FAO, 2000 reported that the forest area in Azerbaijan between 1987-1997 has been growing in average2000 hectars per year. This figure has been used to extrapolate the forest area for the year 1990 from year 2000figure. This differs quite a bit from the previous FRA estimates, but in the light of the new information it ismost likely closer to the actual forested area in 1990.

FRA 2015 – Country Report, Azerbaijan
13
1.3.3 Reclassification
Forest area
No further reclassification is needed, as the national data are already presented according to the FRA categories.
1.4 DataTable 1a
Area (000 hectares)Categories
1990 2000 2005 2010 2015
Forest 851.8 871.8 877.2 1008.3 1139.4
Other wooded land 0 0 0 0 0
Other land 7411.2 7388.7 7388.8 7257.3 7126.4
... of which with tree cover N/A N/A N/A N/A N/A
Inland water bodies 397 399.5 394 394.4 394.2
TOTAL 8660.00 8660.00 8660.00 8660.00 8660.00
Table 1bAnnual forest establishment /loss (000 hectares per year)
...of which of introducedspecies (000 hectares per year)
Categories
1990 2000 2005 2010 1990 2000 2005 2010
Forest expansion N/A N/A N/A N/A N/A N/A N/A N/A
... of which afforestation N/A N/A N/A N/A N/A N/A N/A N/A
... of which natural
expansion of forest
N/A N/A N/A N/A N/A N/A N/A N/A
Deforestation N/A N/A N/A N/A N/A N/A N/A N/A
... of which human induced N/A N/A N/A N/A N/A N/A N/A N/A
Reforestation N/A 5.9 9.6 10.7 N/A N/A N/A N/A
... of which artificial N/A 2.4 3.8 3.5 N/A N/A N/A N/A
Tiers
Category Tier for status Tier for reported trend
Forest Tier 1 Tier 1

FRA 2015 – Country Report, Azerbaijan
14
Other wooded land Tier 1 Tier 1
Forest expansion N/A N/A
Deforestation N/A N/A
Reforestation Tier 1 Tier 1
Tier criteria
Category Tier for status Tier for reported trend
• Forest• Other wooded land• Afforestation• Reforestation• Natural expansion of forest• Deforestation
Tier 3 : Data sources: Either recent(less than 10 years ago) National ForestInventory or remote sensing, with groundtruthing, or programme for repeatedcompatible NFIs Tier 2 : Data sources:Full cover mapping / remote sensing orold NFI (more than 10 years ago) Tier 1 :Other
Tier 3 : Estimate based on repeatedcompatible tiers 3 (tier for status) Tier 2 :Estimate based on repeated compatible tier2 or combination tier 3 and 2 or 1 (tier forstatus) Tier 1 : Other
1.5 Comments
CategoryComments related todata definitions etc
Comments on the reported trends
Forest N/A N/A
Other wooded land N/A N/A
Other land N/A N/A
Other land with tree cover N/A N/A
Inland water bodies N/A N/A
Forest expansion N/A N/A
Deforestation N/A N/A
Reforestation N/A N/A
Other general comments to the table
N/A

FRA 2015 – Country Report, Azerbaijan
15
2. What is the area of natural and planted forest and how has it changed over time?Documents for this question:
• Guide for country reporting FRA 2015• FRA 2015 Terms and Definitions
2.1 Categories and definitions
Term Definition
Naturally regeneratedforest
Forest predominantly composed of trees established through natural regeneration.
Naturalized introducedspecies
Other naturally regenerated forest where the tree species are predominantly non-native and do not needhuman help to reproduce/maintain populations over time.
Introduced species A species, subspecies or lower taxon occurring outside its natural range (past or present) and dispersalpotential (i.e. outside the range it occupies naturally or could occupy without direct or indirectintroduction or care by humans).
Category Definition
Primary forest Naturally regenerated forest of native species where there are no clearly visible indications of humanactivities and the ecological processes are not significantly disturbed.
Other naturallyregenerated forest
Naturally regenerated forest where there are clearly visible indications of human activities.
...of which of introducedspecies (sub-category)
Other naturally regenerated forest where the trees are predominantly of introduced species.
...of which naturalized(sub-sub category)
Other naturally regenerated forest where the trees are predominantly of naturalized introduced species.
Planted forest Forest predominantly composed of trees established through planting and/or deliberate seeding.
...of which of introducedspecies (sub-category)
Planted forest where the planted/seeded trees are predominantly of introduced species.
Mangroves Area of forest and other wooded land with mangrove vegetation.
...of which planted (sub-category)
Mangroves predominantly composed of trees established through planting.
2.2 National data
2.2.1 Data sources
References to sourcesof information
Variables Years Additional comments
1 UNECE/FAO, 2000. ForestResources of Europe, CIS,North America, Australia,Japan and New Zealand(TBFRA 2000)
Forest and other wooded landby categories of “naturalness”
1997 Secondary data source.

FRA 2015 – Country Report, Azerbaijan
16
2 The State StatisticalCommittee of AzerbaijanRepublic, http://www.azstat.org/statinfo/environment/en/
Reforestation area 1999- 2003 Secondary data source.
3 UNECE environmentalperformance reviews,Azerbaijan, SecondReview, 2011. http://www.unece.org/fileadmin/DAM/env/epr/epr_studies/Synopsis/Azerbaijan%20ECE.CEP.158.synopsis%20english.pdf http://www.unece.org/fileadmin/DAM/env/epr/epr_studies/azerbaijan%20II.pdf
Forest area 2011 Secondary data source.
4 The State StatisticalCommittee of AzerbaijanRepublic, http://www.stat.gov.az/source/agriculture/indexen.php#007
Forest area 2000-2012 Secondary data source.
5 The State StatisticalCommittee of AzerbaijanRepublic, http://www.azstat.org/statinfo/environment/en/
Reforestation area 1999- 2003 N/A
2.2.2 Classification and definitions
National class Definition
Undisturbed by man No human disturbance at all or disturbance so long ago thatnatural processes have been completely re-established.
Semi-natural forest/other wooded land Forest / Other wooded land that is neither “Forest / Otherwooded land undisturbed by man” nor “Plantation”.
Plantation(s) Forest stands established by planting or/and seeding in theprocess of afforestation or reforestation. They are either: • Ofintroduced species (all planted stands), or • Intensively managedstands of indigenous species which meet all the followingcriteria: one or two species at plantation, even age class, regularspacing.
N/A N/A
2.2.3 Original data
The reforestation by sowing and planting has been on average 3342 ha/y in Azerbaijan between 2000-2011 (Reestablishment of forests of state importance, The State Statistical Committee of Azerbaijan Republic).
2.3 Analysis and processing of national data

FRA 2015 – Country Report, Azerbaijan
17
2.3.1 Adjustment
2.3.2 Estimation and forecasting
Category 1990, Area(1000ha)
2000, Area(1000ha)
2005, Area(1000ha)
2010 Area (1000ha)
Forests 851.8 871.8 877.2 1008.3
Undisturbed byman
na na na na
Semi-natural
na na na na
Plantations
na na na na
Other woodedland
na na na na
Undisturbed byman
na na na na
Semi-natural
na na na na
2.3.3 Reclassification
Primary forest has been reclassified as primary forest in accordance with the FRA 2010 definition andplantations has been reclassified as planted forest. The difference between the total forest area, the primaryforest and the plantations, gives the area reported by UNECE/FAO 2000 as “semi-natural” forest and this areahas been assumed to correspond to the other naturally regenerated forest of FRA 2010. It should be notedthat since no information on the regeneration method was available, the previous assumptions may lead to anoverestimation of the other naturally regenerated forest, which may include a part of the planted forest.
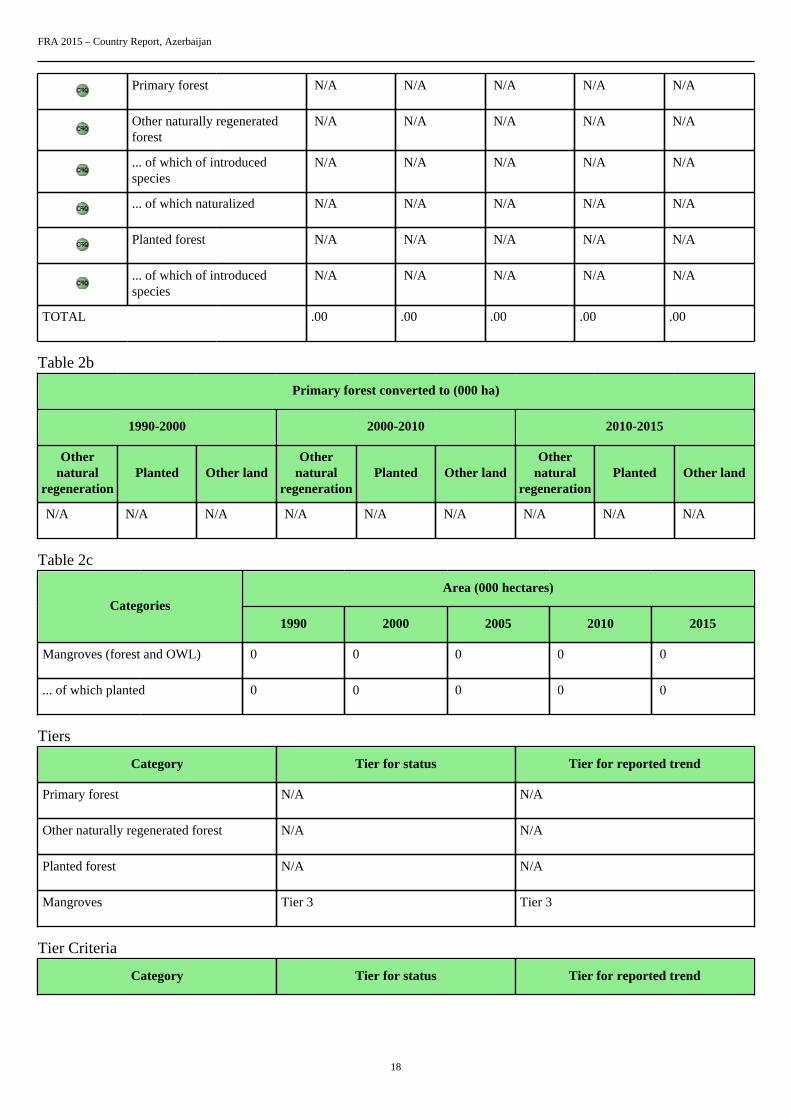
2.4 DataTable 2a
Forest area (000 hectares)Categories
1990 2000 2005 2010 2015
FRA 2015 – Country Report, Azerbaijan
18
Primary forest N/A N/A N/A N/A N/A
Other naturally regeneratedforest
N/A N/A N/A N/A N/A
... of which of introducedspecies
N/A N/A N/A N/A N/A
... of which naturalized N/A N/A N/A N/A N/A
Planted forest N/A N/A N/A N/A N/A
... of which of introducedspecies
N/A N/A N/A N/A N/A
TOTAL .00 .00 .00 .00 .00
Table 2b
Primary forest converted to (000 ha)
1990-2000 2000-2010 2010-2015
Othernatural
regenerationPlanted Other land
Othernatural
regenerationPlanted Other land
Othernatural
regenerationPlanted Other land
N/A N/A N/A N/A N/A N/A N/A N/A N/A
Table 2c
Area (000 hectares)Categories
1990 2000 2005 2010 2015
Mangroves (forest and OWL) 0 0 0 0 0
... of which planted 0 0 0 0 0
Tiers
Category Tier for status Tier for reported trend
Primary forest N/A N/A
Other naturally regenerated forest N/A N/A
Planted forest N/A N/A
Mangroves Tier 3 Tier 3
Tier Criteria
Category Tier for status Tier for reported trend

FRA 2015 – Country Report, Azerbaijan
19
Primary forest/Other naturally regeneratedforest/Planted forest
Tier 3 : Data sources: Recent (less than10 years) National Forest Inventory orremote sensing with ground truthing ordata provided by official agencies orprogramme for repeated compatible NFIsTier 2 : Data sources: Full cover mapping/remote sensing or old NFI (more than 10years) Tier 1 : Other
Tier 3 : Estimate based on repeatedcompatible tiers 3 (tier for status) Tier 2 :Estimate based on repeated compatible tier2 or combination tier 3 and 2 or 1 (tier forstatus) Tier 1 : Other
2.5 Comments
CategoryComments related todata definitions etc
Comments on reported trend
Primary forest N/A N/A
Other naturally regenerating forest N/A N/A
Planted forest N/A N/A
Mangroves N/A N/A
Other general comments to the table
N/A

FRA 2015 – Country Report, Azerbaijan
20
3. What are the stocks and growth rates of the forests and how have they changed?Documents for this question:
• Guide for country reporting FRA 2015• FRA 2015 Terms and Definitions
3.1 Categories and definitions
Category Definition
Growing stock Volume over bark of all living trees with a minimum diameter of 10 cm at breast height (or abovebuttress if these are higher). Includes the stem from ground level up to a top diameter of 0 cm,excluding branches.
Net Annual Increment(NAI)
Average annual volume of gross increment over the given reference period less that of natural losses onall trees, measured to minimum diameters as defined for "Growing stock".
Above-ground biomass All living biomass above the soil including stem stump branches bark seeds and foliage.
Below-ground biomass All biomass of live roots. Fine roots of less than 2 mm diameter are excluded because these often cannotbe distinguished empirically from soil organic matter or litter.
Dead wood All non-living woody biomass not contained in the litter either standing lying on the ground or in thesoil. Dead wood includes wood lying on the surface dead roots and stumps larger than or equal to 10 cmin diameter or any other diameter used by the country.
Carbon in above-groundbiomass
Carbon in all living biomass above the soil including stem stump branches bark seeds and foliage.
Carbon in below-groundbiomass
Carbon in all biomass of live roots. Fine roots of less than 2 mm diameter are excluded because theseoften cannot be distinguished empirically from soil organic matter or litter.
Carbon in dead wood Carbon in all non-living woody biomass not contained in the litter, either standing, lying on the ground,or in the soil. Dead wood includes wood lying on the surface, dead roots and stumps larger than or equalto 10 cm in diameter or any other diameter used by the country.
Carbon in litter Carbon in all non-living biomass with a diameter less than the minimum diameter for dead wood (e.g.10 cm ) lying dead in various states of decomposition above the mineral or organic soil.
Soil carbon Organic carbon in mineral and organic soils (including peat) to a soil depth of 30 cm.
3.2 National data
3.2.1 Data sources
References to sourcesof information
Variables Years Additional comments
1 UNECE/FAO, 2000. ForestResources of Europe, CIS,North America, Australia,Japan and New Zealand(TBFRA 2000)
growing stock Above stumpbiomass, Biomass of stumpsand roots
1983,1988 Secondary data source.
2 UNECE environmentalperformance review,Azerbaijan, 2004,Environmental PerformanceReviews Series No.19.
Forest area, fellings 2000,2003 Secondary data source.

FRA 2015 – Country Report, Azerbaijan
21
3 Ministry of Ecology andNatural Resources ofAzerbaijan Republic, WWW-pages, http://eco.gov.az/v2.1/en/forest/, date 18.3.2005.
Growing stock N/A Secondary data source.
4 Salmanov, S. 2005.Azerbaijan Forest ResourcesAssessment for SustainableForest Management.UNECE/FAO Workshopon Capacity Building inSharing Forest and MarketInformation. 2005. http://www.unece.org/timber/docs/other_mtgs/2005krtiny/reports/aze_fra_e.pdf
Growing stock, Growingstock by tree species
N/A Secondary data source.
5 National reporting tables onbiomass stock
Woody biomass: abovestump, stump and rootbiomass
N/A N/A
6 The State StatisticalCommittee of AzerbaijanRepublic, http://www.stat.gov.az/source/agriculture/indexen.php#007
Forest area, Growing stock 2000-2012 Secondary data source.
3.2.2 Classification and definitions
National class Definition
Growing stock The living tree component of the standing volume
Growing stock on forest available for wood supply GS on forest where legal, economic or specific environmentalrestrictions do not have any significant impact on the supply ofwood
Biomass stock The UNECE/FAO 2000 report distinguishes two categories ofbiomass: Above-stump biomass and Stump and root biomass.There is a small difference in the definitions of the biomassfractions as compared to FRA regarding the stump biomass. InUNECE/FAO 2000 the stump biomass is grouped together withthe root biomass, while in FRA the above-ground portion of thestump belongs to Above-ground biomass.
Carbon stock The UNECE/FAO 2000 reports on two categories: Carbon inabove-stump biomass and Carbon in stump and rood biomass.There is a small difference in the definitions of the biomassfractions as compared to FRA, regarding the stump biomass. InUNECE/FAO 2000 the stump biomass is grouped together withthe root biomass, while in FRA the above-ground portion of thestump belongs to Above-ground biomass.
3.2.3 Original data
Growing stock

FRA 2015 – Country Report, Azerbaijan
22
Category 2005 2011
Growing stock on Forest (1000m3)
139000 148800
...of which available for woodsupply (1000 m3)
na na
Growing stock on OWL (1000m3)
na na
Source: The State Statistical Committee of Azerbaijan Republic,
Distribution of major wood species by wood reserves and areas (Salmanov, 2005):
Covered with forest Total reserves of wood
Wood species Ths. ha From the wholearea, %
Million m 3 From totalreserves %
Coniferousincluding
13.7 100 0.35 100
Pine 2 14.6 0.1 28.6
Juniper 11.7 85.4 0.25 71.4
HardleavedTotal Including
848.3 100 119.89 100
Oak 323.39 36 30.17 24.4
Beech 326.98 36.4 64.3 52
Larch 229.07 25.5 28.19 22.8
Ashtree 8.08 0.9 0.26 0.2
Birch 2.6 0.3 0.49 0.4
Elm 0.99 0.1 0.03 0

FRA 2015 – Country Report, Azerbaijan
23
Locust 7.19 0.8 0.3 0.2
Softleaved Total 53.9 100 3.11 100
Birch 2.85 5.3 0.09 3
Poplar 8.53 15.9 0.49 15.5
Alder 17.31 32.8 1.25 40.1
Linden 2.26 4.2 0.18 5.9
Poplar 13.49 25.4 0.85 23.1
Willow 8.82 16.4 0.28 8.9
Other 53.3 6.2 3.77 3.1
Shrubs 20.1 2.2 0.32 0.3
Total 989.3 100 127.44 100
Biomass stock
The 1988 data presented in the following table has been obtained from UNECE/FAO 2000 and the originalquestionnaire received from Azerbaijan for UNECE/FAO 2000. The original data will then be as follows:
Category
1988, Tg biomass
(Oven dry weight)
Forest OWL & trees outside forest
Above stump biomass 98.58 ID
Stump and rootbiomass
17.25 ID
Proportion of Abovestump biomass of totalBM
0.8512 ID
Total woody biomass 115.83 ID
Source: UNECE/FAO 2000, reference year 1988.

FRA 2015 – Country Report, Azerbaijan
24
Note that one Teragram (Tg) is 1 x 10 12 g and equals one million metric tonne. The above data only refer toForest. No information on biomass of dead wood was found.
Carbon stock
Forest carbon data were estimated using biomass data multiplied by the default conversion factor of 0.47.
3.3 Analysis and processing of national data
3.3.1 Adjustment
Growing stock
No calibration was needed.
Biomass and carbon stock
No calibration was needed.
3.3.2 Estimation and forecasting
Growing stock
Quotation : The State is currently carrying out a system of sanitary cuttings, which is explained as the necessaryactions to maintain the forests in a healthy condition. The Ministry of Ecology and Natural Resources states thatfrom 50,000 to 60,000 m3 of forests are cut each year under this policy ( UNECE environmental performancereview 2011)
It was also roughly estimated that an additional 30,000-40,000 m3 per year is cut illegally.” ( UNECEenvironmental performance review 2004)

FRA 2015 – Country Report, Azerbaijan
25
Quotation : “Wood capacity in pistachio forests is 59,73 million cubic meters, oak forests is 27,97 million cubicmeters and hornbeam forests is 26,22 million cubic meters. The overall wood capacity of mountain forestsis 110,92 million cubic meters or 81,4 percent” ( Ministry of Ecology and Natural Resources of AzerbaijanRepublic).
Biomass stock
3.3.3 Reclassification
The estimate for 2015 was done by extrapolating the average annual growing stock growth between 2005-2010to year 2015.
3.4 DataTable 3a
Growing stock volume (million m 3 over bark)
Forest Other wooded landCategory
1990 2000 2005 2010 2015 1990 2000 2005 2010 2015
Totalgrowingstock
N/A 133 139 144.2 149.2 N/A N/A N/A N/A N/A
... ofwhichconiferous
N/A N/A N/A N/A N/A N/A N/A N/A N/A N/A
... ofwhichbroadleaved
N/A N/A N/A N/A N/A N/A N/A N/A N/A N/A
Table 3b
Category/Species name Growing stock in forest (million cubic meters)
Rank Scientific name Common name 1990 2000 2005 2010
1 st N/A N/A N/A N/A N/A N/A
2 nd N/A N/A N/A N/A N/A N/A
3 rd N/A N/A N/A N/A N/A N/A
4 th N/A N/A N/A N/A N/A N/A
5 th N/A N/A N/A N/A N/A N/A
6 th N/A N/A N/A N/A N/A N/A

FRA 2015 – Country Report, Azerbaijan
26
7 th N/A N/A N/A N/A N/A N/A
8 th N/A N/A N/A N/A N/A N/A
9 th N/A N/A N/A N/A N/A N/A
10 th N/A N/A N/A N/A N/A N/A
Remaining N/A N/A N/A N/A
TOTAL .00 .00 .00 .00
THE PRE-FILLED VALUES FOR GROWING STOCK REFER TO THE FOLLOWINGTHRESHOLD VALUES (SEE TABLE BELOW)
Item Value Complementary information
Minimum diameter (cm) at breast heightof trees included in growing stock (X)
n.a. N/A
Minimum diameter (cm) at the top end ofstem for calculation of growing stock (Y)
n.a. N/A
Minimum diameter (cm) of branchesincluded in growing stock (W)
n.a. N/A
Volume refers to above ground (AG) orabove stump (AS)
n.a. N/A
PLEASE NOTE THAT THE DEFINITION OF GROWING STOCK HAS CHANGED AND SHOULDBE REPORTED AS GROWING STOCK DBH 10 CM INCLUDING THE STEM FROM GROUNDLEVEL UP TO A DIAMETER OF 0 CM, EXCLUDING BRANCHES.
Table 3c
Net annual increment (m 3 per hectare and year)
ForestCategory
1990 2000 2005 2010 2015
Net annualincrement
N/A N/A N/A N/A N/A
... of whichconiferous
N/A N/A N/A N/A N/A
... of whichbroadleaved
N/A N/A N/A N/A N/A
Table 3d
Biomass (million metric tonnes oven-dry weight)
Forest Other wooded landCategory
1990 2000 2005 2010 2015 1990 2000 2005 2010 2015

FRA 2015 – Country Report, Azerbaijan
27
Abovegroundbiomass
N/A N/A N/A N/A N/A N/A N/A N/A N/A N/A
Belowgroundbiomass
N/A N/A N/A N/A N/A N/A N/A N/A N/A N/A
Deadwood
N/A N/A N/A N/A N/A N/A N/A N/A N/A N/A
TOTAL .00 .00 .00 .00 .00 .00 .00 .00 .00 .00
Table 3e
Carbon (Million metric tonnes)
Forest Other wooded landCategory
1990 2000 2005 2010 2015 1990 2000 2005 2010 2015
Carbonin abovegroundbiomass
N/A N/A N/A N/A N/A N/A N/A N/A N/A N/A
Carbonin belowgroundbiomass
N/A N/A N/A N/A N/A N/A N/A N/A N/A N/A
SubtotalLivingbiomass
N/A N/A N/A N/A N/A N/A N/A N/A N/A N/A
Carbonin deadwood
N/A N/A N/A N/A N/A N/A N/A N/A N/A N/A
Carbonin litter
N/A N/A N/A N/A N/A N/A N/A N/A N/A N/A
SubtotalDeadwoodand litter
N/A N/A N/A N/A N/A N/A N/A N/A N/A N/A
Soilcarbon
N/A N/A N/A N/A N/A N/A N/A N/A N/A N/A
TOTAL .00 .00 .00 .00 .00 .00 .00 .00 .00 .00
Tiers
Variable/category Tier for status Tier for trend
Total growing stock Tier 1 Tier 1
Net annual increment N/A N/A
Above ground biomass N/A N/A

FRA 2015 – Country Report, Azerbaijan
28
Below ground biomass N/A N/A
Dead wood N/A N/A
Carbon in above-ground biomass N/A N/A
Carbon in below ground biomass N/A N/A
Carbon in dead wood and litter N/A N/A
Soil carbon N/A N/A
Tier criteria
Category Tier for status Tier for reported trend
Total growing stock Tier 3: Data sources Recent 10 yearsNational Forest Inventory or remotesensing with ground truthing orprogramme for repeated compatible NFI10 years Domestic volume functions Tier2: Data sources/registers and statisticsmodelling or old NFI 10 years or partialfield inventory Tier 1: Other data sources
Tier 3: Estimate based on repeatedcompatible tiers 3 (tier for status)Domestic growth functions Tier 2:Estimate based on repeated compatible tier2 or combination tier 3 and 2 or 1 tier forstatus Tier 1: Other
Net annual increment Tier 3: Scientifically tested nationalvolume and growth functions Tier 2:Selection of volume and growth functionsas relevant as possible Tier 1: Other
Tier 3: Confirmation/adjustment offunctions used through scientific workTier 2: Review work done to seekalternative functions Tier: 1 Other
Biomass Tier 3: Country-specific national or sub-national biomass conversion expansionfactors applied or other domestic orotherwise nationally relevant biomassstudies Tier 2: Application of countryspecific national or sub-national biomassconversion factors from other countrywith similar climatic conditions and foresttypes Tier 1: International/regional defaultbiomass expansion factors applied
Tier 3 : Estimate based on repeatedcompatible tiers 3 (tier for status) Tier 2 :Estimate based on repeated compatible tier2 or combination tier 3 and 2 or 1 (tier forstatus) Tier 1 : Other
• Carbon in above ground biomass• Carbon in below ground biomass• Carbon in dead wood and litter• Soil carbon
Tier 3: Country-specific national or sub-national biomass conversion expansionfactors applied Tier 2: Applicationof country specific national or sub-national biomass conversion factorsform from other country with similarclimatic conditions and forest types Tier1: International/regional default biomassexpansion factors applied
Tier 3 : Estimate based on repeatedcompatible tiers 3 (tier for status) Tier 2 :Estimate based on repeated compatible tier2 or combination tier 3 and 2 or 1 (tier forstatus) Tier 1 : Other
3.5 Comments on growing stock biomass and carbon
CategoryComments related todata definitions etc
Comments on the reported trend
Total growing stock N/A N/A

FRA 2015 – Country Report, Azerbaijan
29
Growing stock of broadleaved coniferous N/A N/A
Growing stock composition N/A N/A
Net annual increment N/A N/A
Above-ground biomass N/A N/A
Below-ground biomass N/A N/A
Dead wood N/A N/A
Carbon in above-ground biomass N/A N/A
Carbon in below-ground biomass N/A N/A
Carbon in dead wood N/A N/A
Carbon in litter N/A N/A
Soil carbon N/A N/A
Other general comments to the table
The State Statistical Committee of Azerbaijan Republic gives updated information only on the total growing stock of forests. Thisinformation is not comparable to the information (Salmanov, S. 2005 and UNECE/FAO 2000, reference year 1988).used in the pastFRA assessments.

FRA 2015 – Country Report, Azerbaijan
30
4. What is the status of forest production and how has it changed over time?Documents for this question:
• Guide for country reporting FRA 2015• FRA 2015 Terms and Definitions
4.1 Categories and definitions
Term Definition
Primary designatedfunction
The primary function or management objective assigned to a management unit either by legalprescription documented decision of the landowner/manager or evidence provided by documentedstudies of forest management practices and customary use.
Non wood forest product(NWFP)
Goods derived from forests that are tangible and physical objects of biological origin other than wood.
Commercial value ofNWFP
For the purpose of this table, value is defined as the commercial market value at the forest gate.
Category Definition
Production forest Forest area designated primarily for production of wood, fibre, bio-energy and/or non-wood forestproducts.
Multiple use forest Forest area designated for more than one purpose and where none of these alone is considered as thepredominant designated function.
Total wood removals The total of industrial round wood removals and woodfuel removals.
...of which woodfuel The wood removed for energy production purposes, regardless whether for industrial, commercial ordomestic use.
4.2 National data
4.2.1 Data sources
References to sourcesof information
Variables Years Additional comments
1 UNECE/FAO, 2000. ForestResources of Europe, CIS,North America, Australia,Japan and New Zealand(TBFRA 2000)
Areas available for woodsupply, Areas not availablefor wood supply, IUCNprotected area categories, soilprotection management areas
1988 Secondary data source.
2 UNECE environmentalperformance review,Azerbaijan, 2004,Environmental PerformanceReviews Series No.19. http://www.countryanalyticwork.net/CAW/Cawdoclib.nsf/0/7E8C14AF9756CDC485256FB00048D69F/$file/ pdf+file+with+maps.pdf
Protected areas 2000, 2003 Secondary data source,contains data fromChemonics International/USAID's Bureau of Europeand NIS, BiodiversityAssessment, 2000. Ministryof Ecology and NaturalResources, 2003.

FRA 2015 – Country Report, Azerbaijan
31
3 Ministry of Ecology andNatural Resources ofAzerbaijan Republic, WWW-pages, http://eco.gov.az/v2.1/en/forest/, date 18.3.2005.
Soil protection managementareas
N/A N/A
4 N/A N/A N/A N/A
4.2.2 Classification and definitions
National class Definition
N/A The original data is assumed to follow the definitions ofUNECE/FAO 2000.
N/A N/A
N/A N/A
N/A N/A
4.2.3 Original data
Forest area available for wood supply.
UNECE/FAO 2000 reports that for 1988 151 000 ha out of the total area of forest, 934 000 ha, were availablefor wood supply and 15 000 ha of OWL of total 54 000 ha was available for wood supply. 63 300 ha of forestwas not available for wood supply due to conservation on the protection reasons.
4.3 Analysis and processing of national data
4.3.1 Adjustment
4.3.2 Estimation and forecasting
No estimation and forecasting have been done, since there is no reliable basis to do it. The UNECE/FAO(TBFRA 2000) 1988 figures are used for all the reporting years.
4.3.3 Reclassification
There is an overlap between the various functions and the total area is much larger than the total forest area inQuestion 1. The primary function has been estimated according to priorities presented in the following table.

FRA 2015 – Country Report, Azerbaijan
32
Forest Designated functions
TBFRA 2000 class FRA Designatedfunction
Priority in calculation Area
(1000 ha)
Forest managedprimarily for soilprotection
100% Protection of soiland water
2 nd
864
IUCN I & II classes 100% Conservation ofbiodiversity
1 st 72
Area available forwood supply
100 % Production 3 rd
0
Other 100% No or unknownfunction
4 th 0
4.4 DataTable 4a
Forest area (000 hectares)Categories
1990 2000 2005 2010 2015
Production forest N/A N/A N/A N/A N/A
Multiple useforest
N/A N/A N/A N/A N/A
Table 4b
Rank Name of product Key species
Commercial valueof NWFP removals
2010 (value 1000local currency)
NWFP category
1 st N/A N/A N/A N/A
2 nd N/A N/A N/A N/A
3 rd N/A N/A N/A N/A
4 th N/A N/A N/A N/A
5 th N/A N/A N/A N/A
6 th N/A N/A N/A N/A

FRA 2015 – Country Report, Azerbaijan
33
7 th N/A N/A N/A N/A
8 th N/A N/A N/A N/A
9 th N/A N/A N/A N/A
10 th N/A N/A N/A N/A
TOTAL .00
2010
Name of local currency N/A
Category
Plant products / raw material
1 Food
2 Fodder
3 Raw material for medicine and aromatic products
4 Raw material for colorants and dyes
5 Raw material for utensils handicrafts construction
6 Ornamental plants
7 Exudates
8 Other plant products
Animal products / raw material
9 Living animals
10 Hides skins and trophies
11 Wild honey and beewax
12 Wild meat
13 Raw material for medicine
14 Raw material for colorants
15 Other edible animal products

FRA 2015 – Country Report, Azerbaijan
34
16 Other non-edible animal products
Table 4c Pre-filled data from FAOSTAT
FRA 2015 category (1000 m 3 u.b.)Year
Total wood removals ...of which woodfuel
1990 6.5 3.2
1991 N/A N/A
1992 N/A N/A
1993 N/A N/A
1994 N/A N/A
1995 N/A N/A
1996 N/A N/A
1997 N/A N/A
1998 12.6 6.2
1999 12.6 6.2
2000 13.5 6.4
2001 13.5 6.4
2002 52.8 26.4
2003 6.5 3.2
2004 6.5 3.2
2005 6.5 3.2
2006 6.5 3.2
2007 6.5 3.2
2008 6.5 3.2
2009 6.5 3.2
2010 6.5 3.2
2011 6.5 3.2
Tiers

FRA 2015 – Country Report, Azerbaijan
35
Category Tier for status Tier for reported trend
Production forest N/A N/A
Multiple use forest N/A N/A
Tier Criteria
Category Tier for status Tier for reported trend
Production forest Multiple use forest Tier 3: Updated including fieldverifications national forest mapsincluding functions Tier 2: Forest mapsolder than 6 years including forestfunctions Tier 1: Other
Tier 3 : Estimate based on repeatedcompatible tiers 3 (tier for status) Tier 2 :Estimate based on repeated compatible tier2 or combination tier 3 and 2 or 1 (tier forstatus) Tier 1 : Other
4.5 Comments
CategoryComments related todata definitions etc
Comments on the reported trend
Production forest N/A N/A
Multiple use forest N/A N/A
Total wood removals N/A N/A
Commercial value of NWFP N/A N/A
Other general comments to the table
N/A

FRA 2015 – Country Report, Azerbaijan
36
5. How much forest area is managed for protection of soil and water and ecosystemservices?Documents for this question:
• Guide for country reporting FRA 2015• FRA 2015 Terms and Definitions
5.1 Categories and definitions
Category Definition
Protection of soil andwater
Forest area designated or managed for protection of soil and water
...of which productionof clean water (sub-category)
Forest area primarily designated or managed for water production, where most human uses are excludedor heavily modified to protect water quality.
...of which coastalstabilization (sub-category)
Forest area primarily designated or managed for coastal stabilization.
...of which desertificationcontrol (sub-category)
Forest area primarily designated or managed for desertification control.
...of which avalanchecontrol (sub-category)
Forest area primarily designated or managed to prevent the development or impact of avalanches onhuman life assets or infrastructure.
...of which erosion, floodprotection or reducingflood risk (sub-category)
Forest area primarily designated or managed for protecting communities or assets from the impacts oferosion riparian floods and landslides or for providing flood plain services.
...of which other (sub-category)
Forest area primarily designated or managed for other protective functions.
Ecosystem services,cultural or spiritual values
Forest area primarily designated or managed for selected ecosystem services or cultural or spiritualvalues.
...of which publicrecreation (sub-category)
Forest area designated or managed for public recreation.
...of which carbon storageor sequestration (sub-category)
Forest area designated or managed for carbon storage or sequestration.
...of which spiritual orcultural services (sub-category)
Forest area designated or managed for spiritual or cultural services.
...of which other (sub-category)
Forest area designated or managed for other ecosystem services.
5.2 National data
5.2.1 Data sources
References to sourcesof information
Variables Years Additional comments
1 N/A N/A N/A N/A
2 N/A N/A N/A N/A

FRA 2015 – Country Report, Azerbaijan
37
3 N/A N/A N/A N/A
4 N/A N/A N/A N/A
5.2.2 Classification and definitions
National class Definition
N/A N/A
N/A N/A
N/A N/A
N/A N/A
5.2.3 Original data
5.3 Analysis and processing of national data
5.3.1 Adjustment
5.3.2 Estimation and forecasting
5.3.3 Reclassification
5.4 DataTable 5a
Forest area (1000 hectares)Categories
1990 2000 2005 2010 2015
Protection of soiland water
N/A N/A N/A N/A N/A
... of whichproduction ofclean water
N/A N/A N/A N/A N/A
... of whichcoastalstabilization
N/A N/A N/A N/A N/A

FRA 2015 – Country Report, Azerbaijan
38
... of whichdesertificationcontrol
N/A N/A N/A N/A N/A
... of whichavalanchecontrol
N/A N/A N/A N/A N/A
... of whicherosion, floodprotection orreducing floodrisk
N/A N/A N/A N/A N/A
... of which other(please specifyin commentsbelow the table)
N/A N/A N/A N/A N/A
Other
N/A
Table 5b
Forest area (1000 hectares)Categories
1990 2000 2005 2010 2015
Ecosystem services,cultural or spiritualvalues
N/A N/A N/A N/A N/A
...of which publicrecreation
N/A N/A N/A N/A N/A
...of whichcarbon storage orsequestration
N/A N/A N/A N/A N/A
...of which spiritualor cultural services
N/A N/A N/A N/A N/A
...of which other(please specify incomments belowthe table)
N/A N/A N/A N/A N/A
Tiers
Category Tier for reported trend Tier for status
Protection of soil and water N/A N/A
Ecosystem services, cultural or spiritualvalues
N/A N/A
Tier criteria
Category Tier for status Tier for reported trend
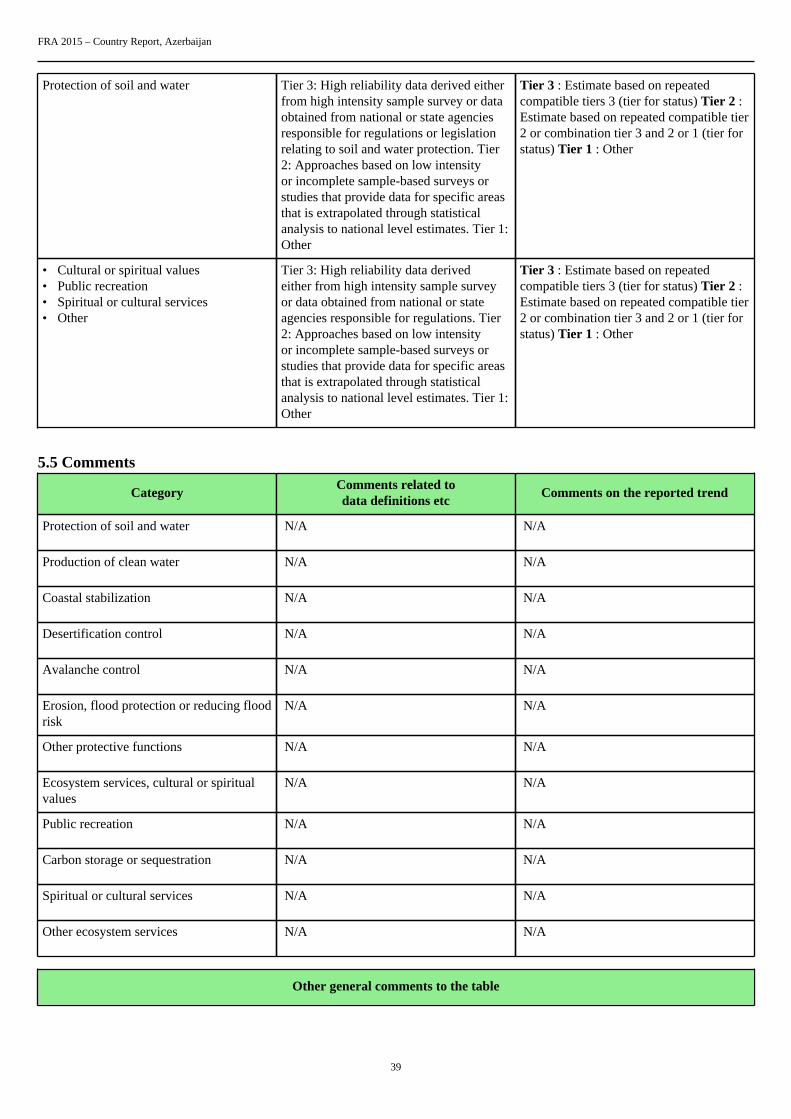
FRA 2015 – Country Report, Azerbaijan
39
Protection of soil and water Tier 3: High reliability data derived eitherfrom high intensity sample survey or dataobtained from national or state agenciesresponsible for regulations or legislationrelating to soil and water protection. Tier2: Approaches based on low intensityor incomplete sample-based surveys orstudies that provide data for specific areasthat is extrapolated through statisticalanalysis to national level estimates. Tier 1:Other
Tier 3 : Estimate based on repeatedcompatible tiers 3 (tier for status) Tier 2 :Estimate based on repeated compatible tier2 or combination tier 3 and 2 or 1 (tier forstatus) Tier 1 : Other
• Cultural or spiritual values• Public recreation• Spiritual or cultural services• Other
Tier 3: High reliability data derivedeither from high intensity sample surveyor data obtained from national or stateagencies responsible for regulations. Tier2: Approaches based on low intensityor incomplete sample-based surveys orstudies that provide data for specific areasthat is extrapolated through statisticalanalysis to national level estimates. Tier 1:Other
Tier 3 : Estimate based on repeatedcompatible tiers 3 (tier for status) Tier 2 :Estimate based on repeated compatible tier2 or combination tier 3 and 2 or 1 (tier forstatus) Tier 1 : Other
5.5 Comments
CategoryComments related todata definitions etc
Comments on the reported trend
Protection of soil and water N/A N/A
Production of clean water N/A N/A
Coastal stabilization N/A N/A
Desertification control N/A N/A
Avalanche control N/A N/A
Erosion, flood protection or reducing floodrisk
N/A N/A
Other protective functions N/A N/A
Ecosystem services, cultural or spiritualvalues
N/A N/A
Public recreation N/A N/A
Carbon storage or sequestration N/A N/A
Spiritual or cultural services N/A N/A
Other ecosystem services N/A N/A
Other general comments to the table

FRA 2015 – Country Report, Azerbaijan
40
N/A

FRA 2015 – Country Report, Azerbaijan
41
6. How much forest area is protected and designated for the conservation of biodiversityand how has it changed over time?Documents for this question:
• Guide for country reporting FRA 2015• FRA 2015 Terms and Definitions
6.1 Categories and definitions
Category Definition
Conservation ofbiodiversity
Forest area designated primarily for conservation of biological diversity. Includes but is not limited toareas designated for biodiversity conservation within the protected areas.
Forest area withinprotected areas
Forest area within formally established protected areas independently of the purpose for which theprotected areas were established.
6.2 National data
6.2.1 Data sources
References to sourcesof information
Variables Years Additional comments
1 UNECE/FAO, 2000. ForestResources of Europe, CIS,North America, Australia,Japan and New Zealand(TBFRA 2000)
Areas available for woodsupply, Areas not availablefor wood supply, IUCNprotected area categories, soilprotection management areas
1988 Secondary data source.
2 UNECE environmentalperformance review,Azerbaijan, 2004,Environmental PerformanceReviews Series No.19. http://www.countryanalyticwork.net/CAW/Cawdoclib.nsf/0/7E8C14AF9756CDC485256FB00048D69F/$file/ pdf+file+with+maps.pdf
Protected areas 2000, 2003 Secondary data source,contains data fromChemonics International/USAID's Bureau of Europeand NIS, BiodiversityAssessment, 2000. Ministryof Ecology and NaturalResources, 2003.
3 Ministry of Ecology andNatural Resources ofAzerbaijan Republic, WWW-pages, http://eco.gov.az/v2.1/en/forest/, date 18.3.2005.
Soil protection managementareas
N/A N/A
4 N/A N/A N/A N/A
6.2.2 Classification and definitions
National class Definition
N/A The original data is assumed to follow the definitions ofUNECE/FAO 2000.
N/A N/A
FRA 2015 – Country Report, Azerbaijan
42
N/A N/A
N/A N/A
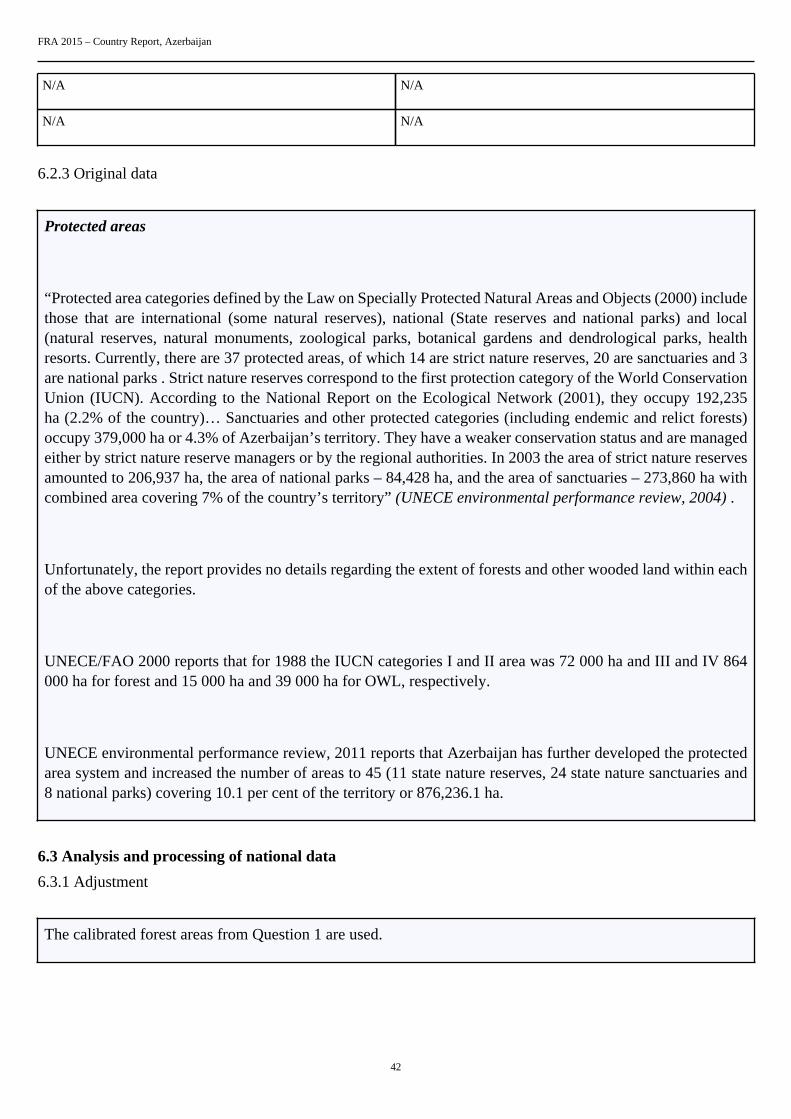
6.2.3 Original data
Protected areas
“Protected area categories defined by the Law on Specially Protected Natural Areas and Objects (2000) includethose that are international (some natural reserves), national (State reserves and national parks) and local(natural reserves, natural monuments, zoological parks, botanical gardens and dendrological parks, healthresorts. Currently, there are 37 protected areas, of which 14 are strict nature reserves, 20 are sanctuaries and 3are national parks . Strict nature reserves correspond to the first protection category of the World ConservationUnion (IUCN). According to the National Report on the Ecological Network (2001), they occupy 192,235ha (2.2% of the country)… Sanctuaries and other protected categories (including endemic and relict forests)occupy 379,000 ha or 4.3% of Azerbaijan’s territory. They have a weaker conservation status and are managedeither by strict nature reserve managers or by the regional authorities. In 2003 the area of strict nature reservesamounted to 206,937 ha, the area of national parks – 84,428 ha, and the area of sanctuaries – 273,860 ha withcombined area covering 7% of the country’s territory” (UNECE environmental performance review, 2004) .
Unfortunately, the report provides no details regarding the extent of forests and other wooded land within eachof the above categories.
UNECE/FAO 2000 reports that for 1988 the IUCN categories I and II area was 72 000 ha and III and IV 864000 ha for forest and 15 000 ha and 39 000 ha for OWL, respectively.
UNECE environmental performance review, 2011 reports that Azerbaijan has further developed the protectedarea system and increased the number of areas to 45 (11 state nature reserves, 24 state nature sanctuaries and8 national parks) covering 10.1 per cent of the territory or 876,236.1 ha.
6.3 Analysis and processing of national data
6.3.1 Adjustment
The calibrated forest areas from Question 1 are used.

FRA 2015 – Country Report, Azerbaijan
43
6.3.2 Estimation and forecasting
No estimation and forecasting have been done, since there is no reliable basis to do it
6.3.3 Reclassification
6.4 DataTable 6
Forest area (000 hectares)Categories
1990 2000 2005 2010 2015
Conservation ofbiodiversity
N/A N/A N/A N/A N/A
Forest areawithin protectedareas
N/A N/A N/A N/A N/A
Tiers
Category Tier for status Tier for reported trend
Conservation of biodiversity N/A N/A
Forest area within protected areas N/A N/A
Tier criteria
Category Tier for status Tier for reported trend
• Conservation of biodiversity• Forests within protected areas
Tier 3: Data obtained from national orstate agencies responsible for conservationand protected area or legislation relatingto area protection. Tier 2: Studies thatprovide data for specific areas that isextrapolated through statistical analysis tonational level estimates Tier 1 Other
Tier 3 : Estimate based on repeatedcompatible tiers 3 (tier for status) Tier 2 :Estimate based on repeated compatible tier2 or combination tier 3 and 2 or 1 (tier forstatus) Tier 1 : Other
6.5 Comments
CategoryComments related todata definitions etc
Comments on the reported trend
Conservation of biodiversity N/A N/A
Forest area within protected areas N/A N/A
Other general comments to the table

FRA 2015 – Country Report, Azerbaijan
44
N/A

FRA 2015 – Country Report, Azerbaijan
45
7. What is the area of forest affected by woody invasive species?Documents for this question:
• Guide for country reporting FRA 2015• FRA 2015 Terms and Definitions
7.1 Categories and definitions
Category Definition
Invasive species Species that are non-native to a particular ecosystem and whose introduction and spread cause, or arelikely to cause, socio-cultural, economic or environmental harm or harm to human health.
7.2 National data
7.2.1 Data sources
References to sourcesof information
Variables Years Additional comments
1 N/A N/A N/A N/A
2 N/A N/A N/A N/A
3 N/A N/A N/A N/A
4 N/A N/A N/A N/A
7.2.2 Classification and definitions
National class Definition
N/A N/A
N/A N/A
N/A N/A
N/A N/A
7.2.3 Original data
7.3 Analysis and processing of national data
7.3.1 Adjustment

FRA 2015 – Country Report, Azerbaijan
46
7.3.2 Estimation and forecasting
7.3.3 Reclassification
7.4 DataTable 7
Forest area affected (000 ha)Scientific name of
woody invasive species2005 2010
N/A N/A N/A
N/A N/A N/A
N/A N/A N/A
N/A N/A N/A
N/A N/A N/A
N/A N/A N/A
N/A N/A N/A
N/A N/A N/A
N/A N/A N/A
N/A N/A N/A
Total N/A N/A
Tiers
Category Tier for status Tier for reported trend
Invasive species N/A N/A
Tier Criteria
Category Tier for status Tier for reported trend

FRA 2015 – Country Report, Azerbaijan
47
Invasive species Tier 3: Systematic assessment in forestinventory or other survey (e.g. byconservation department) within the last5 years) Tier 2: Systematic assessment inforest inventory or other survey (e.g. byconservation department conducted morethan 5 years ago) Tier 1: Other
Tier 3 : Estimate based on repeatedcompatible tiers 3 (tier for status) Tier 2 :Estimate based on repeated compatible tier2 or combination tier 3 and 2 or 1 (tier forstatus) Tier 1 : Other
7.5 Comments
CategoryComments related todata definitions etc
Comments on the reported trend
Invasive species N/A N/A
Other general comments to the table
N/A

FRA 2015 – Country Report, Azerbaijan
48
8. How much forest area is damaged each year?Documents for this question:
• Guide for country reporting FRA 2015• FRA 2015 Terms and Definitions
8.1 Categories and definitions
Category Definition
Number of fires Number of fires per year
Burned area Area burned per year
Outbreaks of insects A detectable reduction in forest health caused by a sudden increase in numbers of harmful insects.
Outbreaks of diseases A detectable reduction in forest health caused by a sudden increase in numbers of harmful pathogens,such as bacteria, fungi, phytoplasma or virus.
Severe weather events Damage caused severe weather events, such as snow, storm, drought, etc.
8.2 National data
8.2.1 Data sources
References to sourcesof information
Variables Years Additional comments
1 N/A N/A N/A N/A
2 N/A N/A N/A N/A
3 N/A N/A N/A N/A
4 N/A N/A N/A N/A
8.2.2 Classification and definitions
National class Definition
N/A N/A
N/A N/A
N/A N/A
N/A N/A
8.2.3 Original data

FRA 2015 – Country Report, Azerbaijan
49
8.3 Analysis and processing of national data
8.3.1 Adjustment
8.3.2 Estimation and forecasting
8.3.3 Reclassification
8.4 DataTable 8a
000 ha, number of fires
2003 2004 2005 2006 2007Category
000 ha # 000 ha # 000 ha # 000 ha # 000 ha #
Totalland areaburned
246.82 N/A 277.61 N/A 88.18 N/A 307.85 N/A 129.3 N/A
... ofwhichforestareaburned
0.86 N/A 1.5 N/A 0.54 N/A 1.52 N/A 0.23 N/A
2008 2009 2010 2011 2012Category
000 ha # 000 ha # 000 ha # 000 ha # 000 ha #
Totalland areaburned
88.43 N/A 65.43 N/A 277.36 N/A 92.06 N/A 63.91 N/A
... ofwhichforestareaburned
0.54 N/A 0.25 N/A 2.32 N/A 0.12 N/A 0.31 N/A
Table 8b
Outbreak category Description/name Year(s) of latest outbreak Area damaged (000 hectares)
N/A N/A N/A N/A
N/A N/A N/A N/A

FRA 2015 – Country Report, Azerbaijan
50
N/A N/A N/A N/A
N/A N/A N/A N/A
N/A N/A N/A N/A
N/A N/A N/A N/A
N/A N/A N/A N/A
N/A N/A N/A N/A
N/A N/A N/A N/A
N/A N/A N/A N/A
Outbreak category
1 Insects
2 Diseases
3 Severe weather events
Tiers
Category Tier for status Tier for trend
Area affected by fire Tier 2 Tier 2
• Insects• Diseases• Severe weather events
N/A N/A
Tier criteria
Category Tier for status Tier for reported trend
Burned area Tier 3 : National fire monitoring routinesTier 2 : Remote sensing surveys Tier 1 :Other
Tier 3 : Estimate based on repeatedcompatible tiers 3 (tier for status) Tier 2 :Estimate based on repeated compatible tier2 or combination tier 3 and 2 or 1 (tier forstatus) Tier 1 : Other
• Insects• Diseases• Severe weather events
Tier 3 : Systematic survey (e.g. viainventory or aerial damage assessment)Tier 2 : Management records Tier 1 :Other
Tier 3 : Estimate based on repeatedcompatible tiers 3 (tier for status) Tier 2 :Estimate based on repeated compatible tier2 or combination tier 3 and 2 or 1 (tier forstatus) Tier 1 : Other
8.5 Comments
CategoryComments related todata definitions etc
Comments on the reported trend

FRA 2015 – Country Report, Azerbaijan
51
Burned area N/A N/A
Insects N/A N/A
Diseases N/A N/A
Severe weather events N/A N/A
Other general comments to the table
N/A

FRA 2015 – Country Report, Azerbaijan
52
9. What is the forest area with reduced canopy cover?Documents for this question:
• Guide for country reporting FRA 2015• FRA 2015 Terms and Definitions
Category Definition
Reduction in canopycover
Forest that has undergone a reduction of canopy cover of more than 20% between the years 2000 and2010 within the forest canopy cover range of 30-80% as detected by the MODIS VCF sensor.
Table 9
Category Area of forest with reduced canopy cover (000 ha)
Reduction in canopycover
31.71
Tiers
Category Tier for reported trend
Reduction in canopycover
Tier 2
Tier criteria
Category Tier for reported trend
Reduction in canopycover
Tier 3 : Remote sensing with ground truthing and/or Landsat imagery Tier 2 : Remote sensing usingModis (using pre-filled data provided by FAO) Tier 1 : Expert opinion
Comments
Category Comments related to data definitions etc
Reduction in canopycover
N/A
Other general comments

FRA 2015 – Country Report, Azerbaijan
53
10. What forest policy and regulatory framework exists to support implementation ofsustainable forest management SFM?Documents for this question:
• Guide for country reporting FRA 2015• FRA 2015 Terms and Definitions
10.1 Categories and definitions
Category Definition
Policies supportingsustainable forestmanagement
Policies or strategies that explicitly encourage sustainable forest management.
Legislation andregulations supportingsustainable forestmanagement
Legislation and regulations that govern and guide sustainable forest management, operations and use.
10.2 National data
10.2.1 Data sources
References to sourcesof information
Variables Years Additional comments
1 UNECE environmentalperformance reviews,Azerbaijan, Second Review
N/A 2011 N/A
2 N/A N/A N/A N/A
3 N/A N/A N/A N/A
4 N/A N/A N/A N/A
10.2.2 Classification and definitions
National class Definition
N/A N/A
N/A N/A
N/A N/A
N/A N/A
10.2.3 Original data

FRA 2015 – Country Report, Azerbaijan
54
10.3 DataTable 10
Sub-nationalCategoryNational
Regional Provincial/State Local
Policies supportingsustainable forestmanagement
no no no no
... of which, in publiclyowned forests
no no no no
... of which, in privatelyowned forests
no no no no
Legislation andregulations supportingsustainable forestmanagement
no no no no
... of which, in publiclyowned forests
no no no no
... of which, in privatelyowned forests
no no no no
10.4 Comments
Variable / category Comments related to data definitions etc
Policies supporting sustainable forest management The National Programme for the Restoration and Expansionof Forests has expired and Azerbaijan does not at presenthave a policy framework in which to operate with goals andobjectives for the sustainable management of its forests.Although Azerbaijan is a signatory to the Ministerial Conferencefor the Protection of Forests in Europe, now ForestEurope, andhas agreed on principles on sustainable forest management forthe pan-European region, it has not prepared a national forestprogramme. The countries participating in the pan Europeanforest process have agreed that a national forest programmeconstitutes a participatory, holistic, inter-sectoral and iterativeprocess of policy planning, implementation, monitoring andevaluation at the national and/or sub-national level necessaryfor the further improvement of sustainable forest management.UNECE environmental performance reviews, Azerbaijan,Second Review, 2011.
Legislation and regulations supporting sustainable forestmanagement
N/A
Other general comments

FRA 2015 – Country Report, Azerbaijan
55
11. Is there a national platform that promotes stakeholder participation in forest policydevelopment?Documents for this question:
• Guide for country reporting FRA 2015• FRA 2015 Terms and Definitions
11.1 Categories and definitions
Category Definition
National stakeholderplatform
A recognized procedure that a broad range of stakeholders can use to provide opinions, suggestions,analysis, recommendations and other input into the development of national forest policy.
11.2 National data
11.2.1 Data sources
References to sources of information Years Additional comments
1 UNECE environmental performancereviews, Azerbaijan, Second Review,2011.
2011 N/A
2 N/A N/A N/A
3 N/A N/A N/A
4 N/A N/A N/A
Table 11Is there a national platform that promotes or allows forstakeholder participation in forest policy development?
no
11.3 Comments
Category Comments related to data definitions etc
National stakeholder platform N/A
Other general comments
FRA 2015 – Country Report, Azerbaijan
56
12. What is the forest area intended to be in permanent forest land use and how has itchanged over time?Documents for this question:
• Guide for country reporting FRA 2015• FRA 2015 Terms and Definitions
12.1 Categories and definitions
Category Definition
Forest area intended to bein permanent forest landuse
Forest area that is designated or expected to be retained as forest and is highly unlikely to be convertedto other land use.
...of which permanentforest estate (sub-category)
Forest area that is designated by law or regulation to be retained as forest and may not be converted toother land use.
12.2 National data
12.2.1 Data sources
References to sourcesof information
Variables Years Additional comments
1 N/A N/A N/A N/A
2 N/A N/A N/A N/A
3 N/A N/A N/A N/A
4 N/A N/A N/A N/A
12.2.2 Classification and definitions
National class Definition
N/A N/A
N/A N/A
N/A N/A
N/A N/A
12.2.3 Original data
12.3 Analysis and processing of national data

FRA 2015 – Country Report, Azerbaijan
57
12.3.1 Adjustment
12.3.2 Estimation and forecasting
12.3.3 Reclassification
12.4 DataTable 12
Categories Forest area 2010 (000 ha)
Forest area intended to be in permanentforest land use
1008.3
... of which permanent forest estate 1008.3
Tiers
Category Tier for status
Forest area intended to be in permanent forest land use Tier 1
Permanent forest estate Tier 1
Tier Criteria
Category Tier for status
Forest area intended to be in permanent forest land use Tier 3 : National or sub-national land use plans strategydocuments or other reports within the past 10 years Tier 2 :National or sub-national land use plans strategy documents orother reports within the past 20 years Tier 1 : Other
Permanent forest estate Tier 3 : National or sub-national land use plans strategydocuments or other reports within the past 10 years Tier 2 :National or sub-national land use plans strategy documents orother reports within the past 20 years Tier 1 : Other
12.5 Comments
Category Comments related to data definitions etc
Forest area intended to be in permanent forest land use N/A
Permanent forest estate N/A

FRA 2015 – Country Report, Azerbaijan
58
Other general comments
FRA 2015 – Country Report, Azerbaijan
59
13. How does your country measure and report progress towards SFM at the nationallevel?Documents for this question:
• Guide for country reporting FRA 2015• FRA 2015 Terms and Definitions
13.1 Categories and definitions
Category Definition
Forest area monitoredunder a national forestmonitoring framework
Forest area monitored by a national monitoring framework or systems that provide measurement basedperiodic monitoring of forest extent and quality.
Forest reporting atnational scale
National reporting of forest extent and characteristics that includes some measure of progress towardsustainable forest management.
13.2 National data
13.2.1 Data sources
References to sourcesof information
Variables Years Additional comments
1 UNECE environmentalperformance reviews,Azerbaijan, Second Review
N/A 2011 Azerbaijan does not have anational forest programme,forest management plans, or anational forest inventory.
2 N/A N/A N/A N/A
3 N/A N/A N/A N/A
4 N/A N/A N/A N/A
13.2.2 Classification and definitions
National class Definition
N/A N/A
N/A N/A
N/A N/A
N/A N/A
13.3 DataTable 13a

FRA 2015 – Country Report, Azerbaijan
60
Check all boxes that apply
Category% of totalforest area
Mostrecent year
Continuous PeriodicPermanent
groundplots
Temporaryground
plots
Aerial/remotesensingsamplebased
Aerial/remote
sensing fullcoverage
Forestinventory
N/A N/A
Other fieldassessments
N/A N/A
Updatesto othersources
N/A N/A
Expertestimate
100 2013
Table 13b
Type of forest reporting used at national scale Check boxes that apply
1 Criteria and Indicators reporting no
2 Periodic national state of the forest report no
3 Other (please document) no
4 None yes
Other type of forest reporting
N/A
13.4 Comments
Category Comments
N/A Azerbaijan does not have a national forest programme, forestmanagement plans, or a national forest inventory.
N/A N/A
N/A N/A
Other general comments

FRA 2015 – Country Report, Azerbaijan
61
14. What is the area of forest under a forest management plan and how is this monitored?Documents for this question:
• Guide for country reporting FRA 2015• FRA 2015 Terms and Definitions
14.1 Categories and definitions
Category Definition
Forest area withmanagement plan
Forest area that has a long-term documented management plan, aiming at defined management goalswhich is periodically revised
...of which for production(sub-category)
Forest management plan mainly focused on production
...of which forconservation (sub-category)
Forest management plan mainly focused on conservation
Monitoring of forestmanagement plans
Government monitoring of forest management plan implementation conducted through field visits oraudits of forest management plan performance
14.2 National data
14.2.1 Data sources
References to sourcesof information
Variables Years Additional comments
1 UNECE environmentalperformance reviews,Azerbaijan, Second Review,2011.
N/A 2011 Azerbaijan does not have anational forest programme,forest management plans, or anational forest inventory
2 N/A N/A N/A N/A
3 N/A N/A N/A N/A
4 N/A N/A N/A N/A
14.3 DataTable 14a
Forest plan type Forest area 2010 (000 ha)
Forest area with management plan 0
... of which for production N/A
... of which for conservation N/A
Table 14b
Indicate which (if any) of the following are required in forest management plans in your country

FRA 2015 – Country Report, Azerbaijan
62
1 Soil and water management no
2 High conservation value forest delineation no
3 Social considerations community involvement no
Table 14c
Percent of area under forest management plan that is monitored annually 0
Tiers
Category Tier for status
Forest area with management plan Tier 1
Percent of area under forest management plan that is monitoredannually
Tier 1
Tier criteria
Category Tier for status
Forest area with management plan Tier 3 : Reports that describe national records 5 years old or lessthat contain long-term forest monitoring plans Tier 2 : Industryor other records indicating the presence of a long-term forestmanagement plan Tier 1 : Other
Percent of area under forest management plan that is monitoredannually
Tier 3 : Government documentation of monitoring extent Tier 2: Reports from forest managers or other documental sources Tier1 : Other
14.4 Comments
Category Comments
N/A N/A
N/A N/A
N/A N/A
Other general comments

FRA 2015 – Country Report, Azerbaijan
63
15. How are stakeholders involved in the management decision making for publiclyowned forests?Documents for this question:
• Guide for country reporting FRA 2015• FRA 2015 Terms and Definitions
15.1 Categories and definitions
Category Definition
Stakeholder involvement Stakeholder involvement is defined as significant inputs into at least one aspect of forest management atthe operational scale
Table 15
Please indicate the type of stakeholder involvement in forest management decision making required in your country
1. Planning phase no
2. Operations phase no
3. Review of operations no
Tiers
Category Tier for status
Type of stakeholder inputs Tier 1
Tier criteria
Category Tier for status
Type of stakeholder inputs Tier 3 : Government (national or sub-national) documentation ofstakeholder inputs Tier 2 : Government (national or subnational)requirement but stakeholder inputs not documented Tier 1 :Other
15.2 Comments
Category Comments
N/A N/A
N/A N/A
N/A N/A
Other general comments

FRA 2015 – Country Report, Azerbaijan
64
16. What is the area of forest under an independently verified forest certification scheme?Documents for this question:
• Guide for country reporting FRA 2015• FRA 2015 Terms and Definitions
16.1 Categories and definitions
Category Definition
FSC certification Forest area certified under the Forest Stewardship Council certification scheme
PEFC certification Forest area certified under the Programme for the Endorsement of Forest Certification scheme
Other international forestmanagement certification
Forest area certified under an international forest management certification scheme with publishedstandards and is independently verified by a third-party, excluding FSC and PEFC certification.
Certified forest areausing a domestic forestmanagement certificationscheme
Area certified under a forest management certification scheme with published standards that arenationally recognized and independently verified by a thirdparty
16.2 DataTable 16a
Forest area (000 ha)International forest
management certification2000 2001 2002 2003 2004 2005 2006
FSC 0 0 0 0 0 0 0
PEFC 0 0 0 0 0 0 0
Other 0 0 0 0 0 0 0
2007 2008 2009 2010 2011 2012
FSC 0 0 0 0 0 0
PEFC 0 0 0 0 0 0
Other 0 0 0 0 0 0
Table 16b
Forest area (000 ha)Domestic forest
management certification2000 2001 2002 2003 2004 2005 2006
N/A 0 0 0 0 0 0 0
N/A 0 0 0 0 0 0 0
N/A 0 0 0 0 0 0 0

FRA 2015 – Country Report, Azerbaijan
65
2007 2008 2009 2010 2011 2012
0 0 0 0 0 0
0 0 0 0 0 0
0 0 0 0 0 0
Tier criteria
Category Tier for status
International forest management certification Tier 3: International forest management scheme recordsmaintained by the certifying organization for the reporting yearTier 2: International forest management scheme records reportedby the certifying organization for a period 2 years prior to thereporting year Tier: 1 Other
Domestic forest management certification Tier 3: National registry reports for domestic forest managementcertification maintained by the certifying organization for thereporting year Tier 2: Domestic forest management schemerecords reported by the certifying organization for a period 2years prior to the reporting year Tier: 1 Other
Tiers
Category Tier for status
International forest management certification Tier 3
Domestic forest management certification N/A
16.3 Comments
Category Comments related to data definitions etc
Certified forest area using an international forest managementcertification scheme
N/A
Domestic forest management certification N/A
Other general comments

FRA 2015 – Country Report, Azerbaijan
66
17. How much money do governments collect from and spend on forests?Documents for this question:
• Guide for country reporting FRA 2015• FRA 2015 Terms and Definitions
17.1 Categories and definitions
Category Definition
Forest revenue All government revenue collected from the domestic production and trade of forest products andservices. For this purpose revenue include:• Goods : roundwood; sawnwood; biomass; woodbased panels; pulp and paper and non-wood forest
products.• Services : including concession fees and royalties, stumpage payments, public timber sales revenue
taxes and charges based on forest area or yield, taxes on domestic trade and export of forest products,special levies on forestry activities and payments into forest related funds, other miscellaneousinspection, licence and administrative fees levied by forest administrations, permit and licence feesfor recreation and other forest related activities.
Public expenditure onforestry
All government expenditure on forest related activities.
17.2 National data
17.2.1 Data sources
References to sourcesof information
Variables Years Additional comments
1 UNECE environmentalperformance reviews,Azerbaijan, SecondReview, 2011. http://www.unece.org/fileadmin/DAM/env/epr/epr_studies/Synopsis/Azerbaijan%20ECE.CEP.158.synopsis%20english.pdf
N/A N/A N/A
2 N/A N/A N/A N/A
3 N/A N/A N/A N/A
4 N/A N/A N/A N/A
17.3 DataTable 17
Revenues / expenditures (000 local currency)Category
2000 2005 2010
Forest revenue N/A N/A N/A

FRA 2015 – Country Report, Azerbaijan
67
Public expenditure on forestry N/A 30900 N/A
2000 2005 2010
Name of Local Currency manat manat manat
17.4 Comments
Category Comments related to data definitions etc
Forest revenue N/A
Public expenditure on forestry 2005 expenditure is the average annual expenditure (Budget-funded environmental spending by Ministry of Ecology andNatural Resources) between 2003-2007.
Other general comments N/A
Other general comments

FRA 2015 – Country Report, Azerbaijan
68
18. Who owns and manages the forests and how has this changed?Documents for this question:
• Guide for country reporting FRA 2015• FRA 2015 Terms and Definitions
18.1 Categories and definitions
Category Definition
Public ownership Forest owned by the State or administrative units of the public administration or by institutions orcorporations owned by the public administration.
...of which owned by thestate at national scale(sub-category)
Forest owned by the State at the national scale or administrative units of the public administration or byinstitutions or corporations owned by the public administration.
...of which owned by thestate at the sub-nationalgovernment scale (sub-category)
Forest owned by the State at the sub-national government scale or administrative units of the publicadministration or by institutions or corporations owned by the public administration.
Private ownership Forest owned by individuals, families, communities, private cooperatives corporations and otherbusiness entities, private, religious and educational institutions, pension or investment funds, NGOs,nature conservation associations and other private institutions.
...of which individuals(sub-category)
Forest owned by individuals and families.
...of which privatebusiness entities andinstitutions (sub-category)
Forest owned by private corporations cooperatives companies and other business entities as well asprivate nonprofit organizations such as NGOs nature conservation associations, and private religiousand educational institutions etc.
...of which local tribal andindigenous communities(sub-category)
Forest owned by a group of individuals belonging to the same community residing within or in thevicinity of a forest area or forest owned by communities of indigenous or tribal people The communitymembers are coowners that share exclusive rights and duties and benefits contribute to the communitydevelopment.
Unknown ownership Forest area where ownership is unknown includes areas where ownership is unclear or disputed.
Categories related tomanagement rights
of public forestsDefinition
Public Administration The Public Administration (or institutions or corporations owned by the Public Administration) retainsmanagement rights and responsibilities within the limits specified by the legislation.
Individuals households Forest management rights and responsibilities are transferred from the Public Administration toindividuals or households through long-term leases or management agreements.
Private companies Forest management rights and responsibilities are transferred from the Public Administration tocorporations, other business entities private cooperatives, private nonprofit institutions and associations,etc., through long-term leases or management agreements.
Communities Forest management rights and responsibilities are transferred from the Public Administration to localcommunities (including indigenous and tribal communities) through long-term leases or managementagreements.
Other form ofmanagement rights
Forests for which the transfer of management rights does not belong to any of the categories mentionedabove.
18.2 National data

FRA 2015 – Country Report, Azerbaijan
69
18.2.1 Data sources
References to sourcesof information
Variables Years Additional comments
1 UNECE/FAO, 2000. ForestResources of Europe, CIS,North America, Australia,Japan and New Zealand(TBFRA 2000)
Ownership (forest, OWL) 1988 Secondary data source.
2 Salmanov, S. 2005.Azerbaijan Forest ResourcesAssessment for SustainableForest Managemen.UNECE/FAO Workshopon Capacity Building inSharing Forest and MarketInformation. 2005. http://www.unece.org/timber/docs/other_mtgs/2005krtiny/reports/aze_fra_e.pdf
Forest land, Forest N/A Secondary data source.
3 N/A N/A N/A N/A
4 N/A N/A N/A N/A
18.2.2 Classification and definitions
National class Definition
N/A The definitions of public and private ownership according toUNECE/FAO 2000 are the same as those being used by FRA2005.
N/A N/A
N/A N/A
N/A N/A
18.2.3 Original data
Management rights
“The forests of Azerbaijan are state protected. Forest management is carried out on the principles of the ForestCode and the Law on Environmental Protection. In the republic of Azerbaijan use of the forest reserves isrealized on the basis of legislatively approved contracts. There are 3 forms of the rent of forest lands: recreation,short term agricultural use and long term rent with an indispensable condition of planting forest saplings on20 % of the territory rented. It also includes tending the planted trees until they cover the whole territory withwood.” (Salmanov, 2005)

FRA 2015 – Country Report, Azerbaijan
70
18.3 Analysis and processing of national data
18.3.1 Adjustment
18.3.2 Estimation and forecasting
18.3.3 Reclassification
The ownership percentage for the year 1988 in UNECE/FAO 2000 is applied to all the reporting years.
18.4 DataTable 18a
Forest area (1000 hectares)Categories
1990 2000 2005 2010
Public ownership 851.8 871.8 877.2 1008.3
... of which ownedby the state atnational scale
N/A N/A N/A N/A
... of which ownedby the state atthe sub-nationalgovernment scale
N/A N/A N/A N/A
Private ownership 0 0 0 0
... of which ownedby individuals
0 0 0 0
... of which ownedby private businessentities andinstitutions
0 0 0 0
... of which ownedby local, tribaland indigenouscommunities
0 0 0 0
Unknownownership
0 0 0 0
TOTAL 851.80 871.80 877.20 1008.30
Tiers
Category Tier for status Tier for reported trend

FRA 2015 – Country Report, Azerbaijan
71
Public ownership Tier 1 Tier 1
Private ownership Tier 1 Tier 1
Unknown ownership Tier 1 Tier 1
Tier criteria
Category Tier for status Tier for reported trend
Ownership Tier 3: National forestry statistics registersof land titles or maps on land ownershipor all forest area under one ownershipcategory that is five years old or less. Tier2:National forestry statistics registers ofland titles or maps on land ownership orquestionnaires that are more than fiveyears old. Tier 1: Other
Tier 3 : Estimate based on repeatedcompatible tiers 3 (tier for status) Tier 2 :Estimate based on repeated compatible tier2 or combination tier 3 and 2 or 1 (tier forstatus) Tier 1 : Other
Table 18b - Holder of management rights of public forests
Forest area (000 hectares)Categories
1990 2000 2005 2010
Public Administration N/A N/A N/A N/A
Individuals N/A N/A N/A N/A
Private companies N/A N/A N/A N/A
Communities N/A N/A N/A N/A
Other N/A N/A N/A N/A
TOTAL .00 .00 .00 .00
Category Tier for reported trend Tier for status
Public Administration N/A N/A
Individuals N/A N/A
Private companies N/A N/A
Communities N/A N/A
Other N/A N/A
18.5 Comments
CategoryComments related todata definitions etc
Comments on the reported trend

FRA 2015 – Country Report, Azerbaijan
72
Public ownership N/A N/A
Private ownership N/A N/A
Unknown ownership N/A N/A
Management rights No data available for reporting on thistable.
N/A
Other general comments to the table
As the changes in the economies of countries in transition are going on rapidly, the information in this table, which is based on1988 data, may not accurately reflect the current situation with regard to the ownership of Forest in Azerbaijan.

FRA 2015 – Country Report, Azerbaijan
73
19. How many people are directly employed in forestry?Documents for this question:
• Guide for country reporting FRA 2015• FRA 2015 Terms and Definitions
19.1 Categories and definitions
Category Definition
Full-time equivalents(FTE)
A measurement equal to one person working full-time during a specified reference period.
Employment in forestry Employment in activities related to production of goods derived from forests. This category correspondsto the ISIC/NACE Rev. 4 activity A02 (Forestry and logging).
19.2 National data
19.2.1 Data sources
References to sourcesof information
Variables Years Additional comments
1 NOTE to 19.2: Data aretaken from from Lebedys(2008). The year 2000 and2005 figures in Lebedys(2008) are estimated fromroundwood production data,by taking employment percubic metre of roundwoodproduction in the years wheredata is available and usingthe production data in themissing years to estimate thelikely level of employment.
N/A N/A N/A
2 N/A N/A N/A N/A
3 N/A N/A N/A N/A
4 N/A N/A N/A N/A
19.2.2 Classification and definitions
National class Definition
N/A N/A
N/A N/A
N/A N/A
N/A N/A

FRA 2015 – Country Report, Azerbaijan
74
19.2.3 Original data
19.3 DataTable 19
Employment (000 years FTE)Category
1990 2000 2005 2010
Employment inforestry
5 4 2 N/A
... of which female N/A N/A N/A N/A
19.4 Comments
CategoryComments related todata definitions etc
Comments on the reported trend
Employment in forestry N/A N/A
Other general comments to the table
N/A

FRA 2015 – Country Report, Azerbaijan
75
20. What is the contribution of forestry to Gross Domestic Product (GDP)?Documents for this question:
• Guide for country reporting FRA 2015• FRA 2015 Terms and Definitions
20.1 Categories and definitions
Category Definition
Gross value added fromforestry (at basic prices)
This category corresponds to the ISIC/NACE Rev. 4 activity A02 (Forestry and logging).
20.2 DataTable 20 (Pre-filled data from UNdata/EUROSTAT)
Category Million CurrencyYear for latest
available information
Gross value added fromforestry (at basic prices)
N/A N/A N/A
20.3 Comments
Category Comments
Gross value added from forestry (at basic prices) N/A
Other general comments

FRA 2015 – Country Report, Azerbaijan
76
21. What is forest area likely to be in the futureDocuments for this question:
• Guide for country reporting FRA 2015• FRA 2015 Terms and Definitions
21.1 Categories and definitions
Category Definition
Government target/aspiration for forest area
Government target/aspiration for forest area for a specific year.
Forests earmarked forconversion
Forest area that is allocated/classified or scheduled to be converted into non-forest uses.
21.2 National data
21.2.1 Data sources
References to sourcesof information
Variables Years Additional comments
1 N/A N/A N/A N/A
2 N/A N/A N/A N/A
3 N/A N/A N/A N/A
4 N/A N/A N/A N/A
21.3 DataTable 21a
Forest area (000 ha)Category
2020 2030
Government target/aspiration for forestarea
N/A N/A
Table 21b
Forest area (000 ha)Category
2013
Forests earmarked for conversion N/A
21.4 Comments
Category Comments
Government target/aspiration for forest area N/A

FRA 2015 – Country Report, Azerbaijan
77
Forests earmarked for conversion N/A
Other general comments