bachelor's thesis
TRANSCRIPT
Université Pierre-Mendès-France (Grenoble II)UFR Sciences de l’Homme et de la Société
Laboratoire de Psychologie et NeurocognitionMaster 1 de Psychologie Cognitive et Sociale
Can We Get a Boosted Bounce?
Spatial Frequencies Play a Role in the Attentional Blink.
Perrier MickaëlResearch directed by Pr. Mermillod Martial
Jointly directed by Beffara Brice, Ph.D. studentJune 2015
Acknowledgements
I would like to thank:
Cédric Batailler for his remarks in the writing of this paper and his help in statistical analyses.
3D4Medical, Dublin, for their authorization in using their brain textures in the Figure 3.
Martial Mermillod for his trust, his good mood, and for the autonomy he gave me.
Brice Beffara for his patience, his availability, his support, and his comments.
Louise Kauffmann for allowing us to use these stimuli and for her help.
And because nothing is worthy without a quote within:
« Consider an adult human brain (with the rest of the adult human attached in the usual way)
in a visual neuroscience laboratory. Visual stimuli are presented on a computer screen and
the resulting eye movements are recorded. Simple stimuli, like a bright spot, can evoke
an extremely rapid saccade. More complex stimuli, like landscapes or faces, lead to
slower responses. What is happening in between to produce these differences? »
— Kathleen Taylor, Brainwashing: The science of thought control, p. 170
Running Head: CAN WE GET A BOOSTED BOUNCE? !3
Abstract 4
Introduction 5
The Bounced Target: An Attentional Blink Phenomenon 5
Prediction in Visual Perception: The Predictive Brain Hypothesis 7
Is Anticipation the Root of Consciousness? 10
Method 11
Participants and design 11
Apparatus 11
Stimuli 12
Procedure 13
Data analysis 15
Results 17
Discussion 18
References 22
Appendices 28
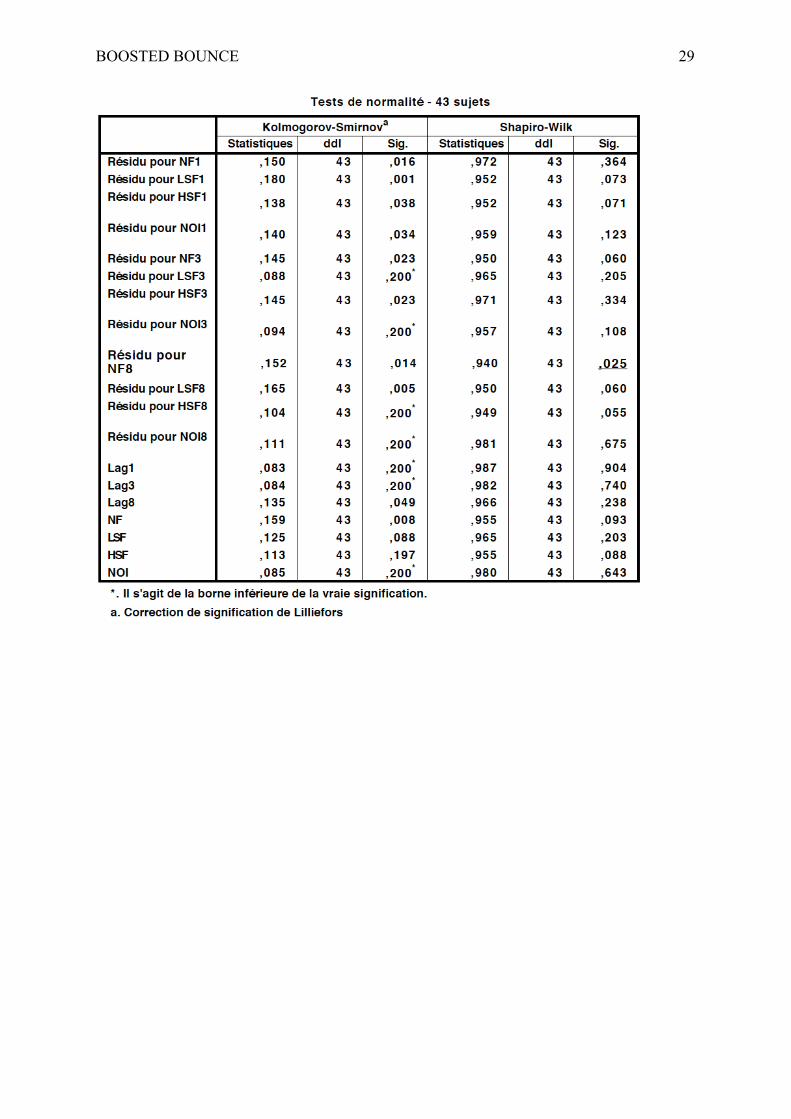
Appendix 1. Normality tests 28
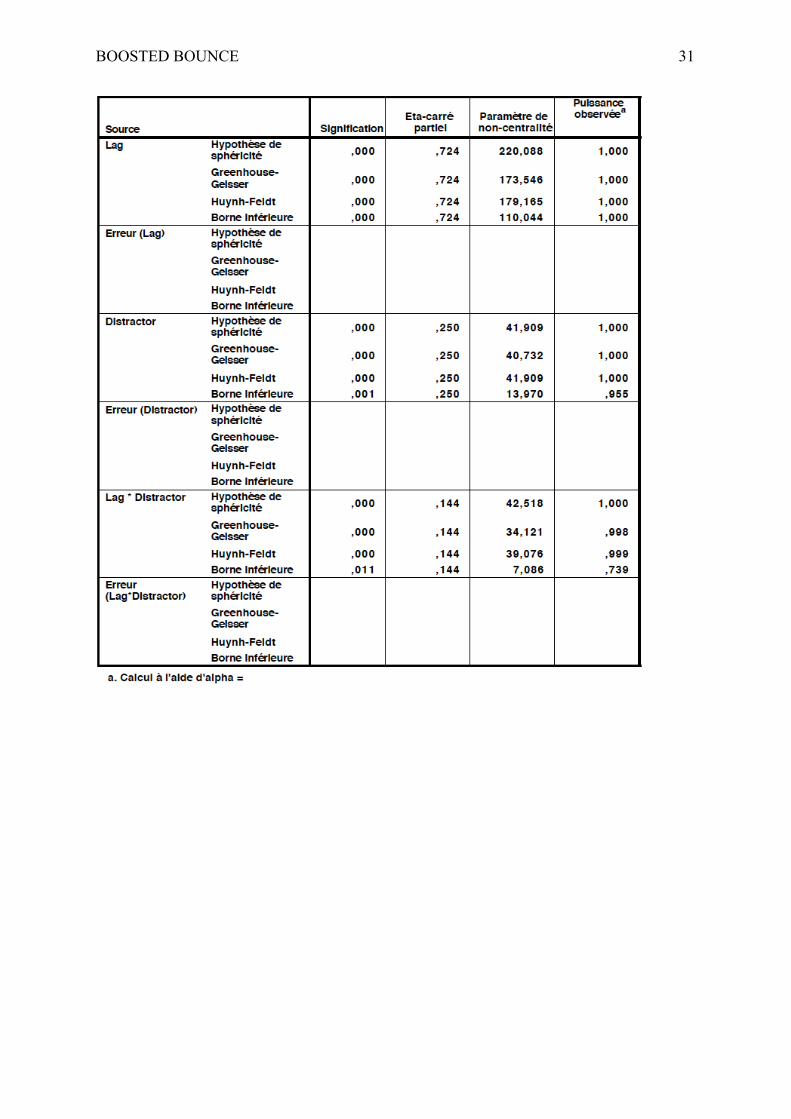
Appendix 2. Analysis of variance (ANOVA) 30
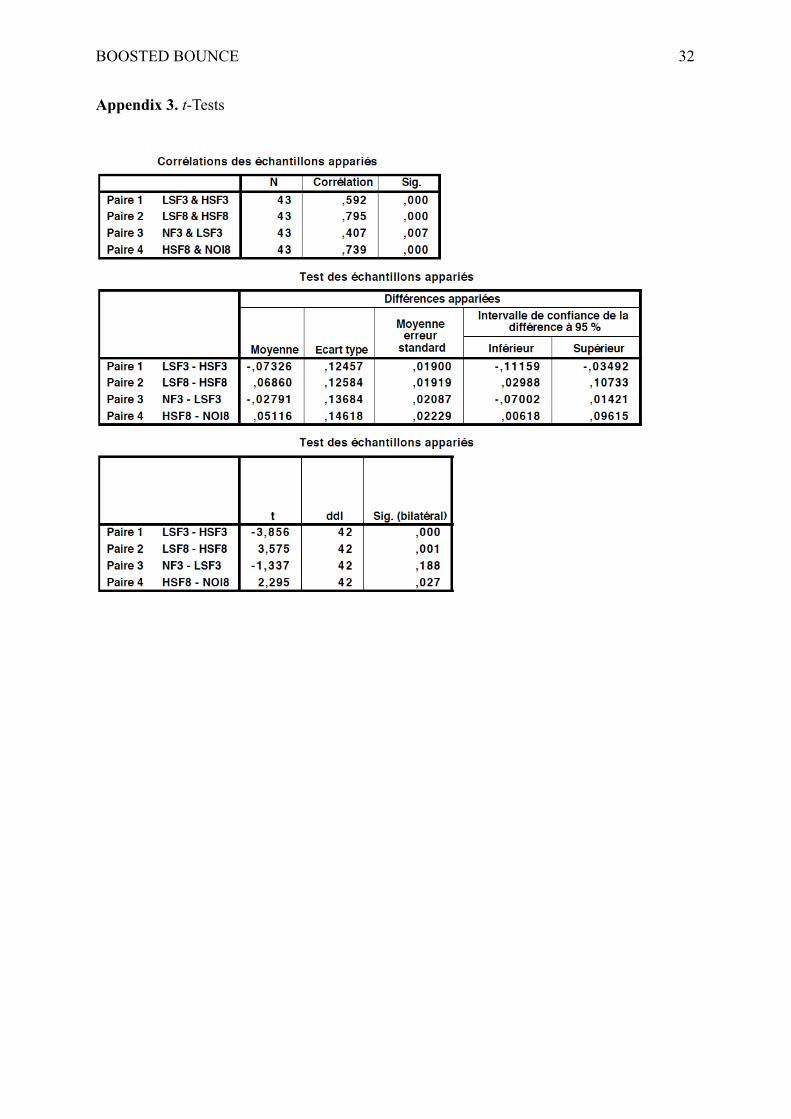
Appendix 3. t-Tests 32
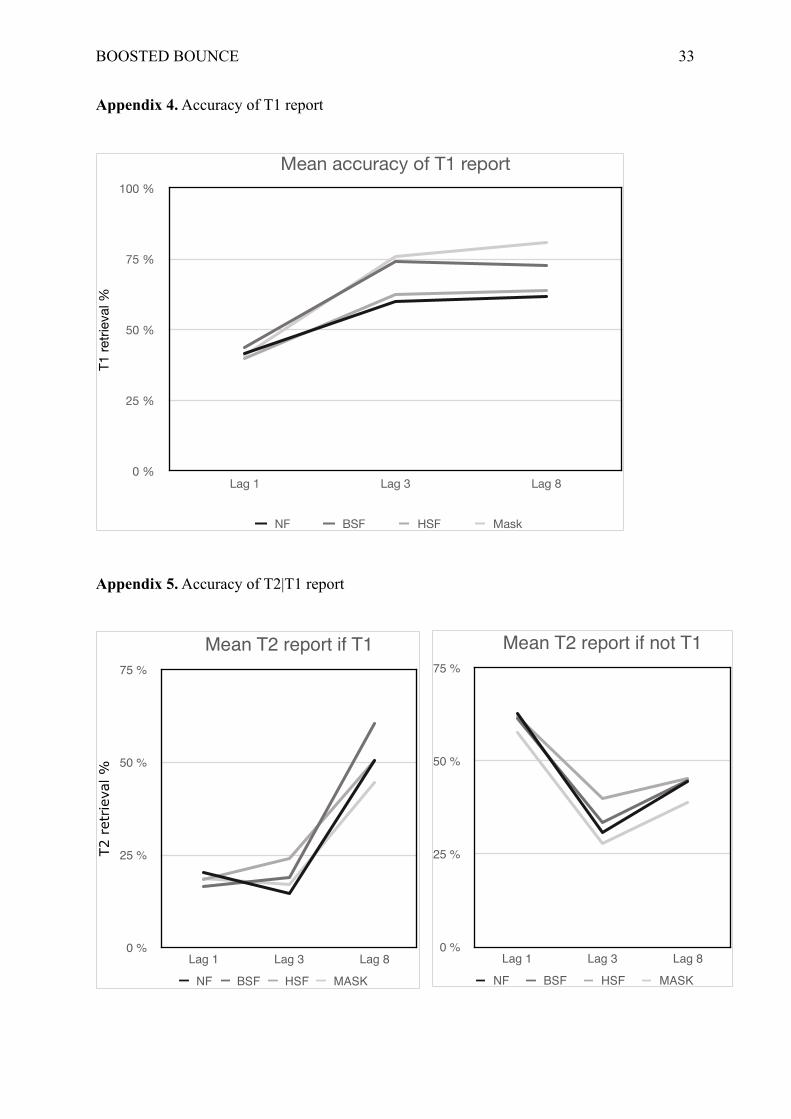
Appendix 4. Accuracy of T1 report 33
Appendix 5. Accuracy of T2|T1 report 33

BOOSTED BOUNCE !4
Abstract
During a rapid serial visual presentation (RSVP), when a second target is presented between
200 ms and 500 ms after a first target, the second is often to be missed: a phenomenon called
‘attention blink’. Coarse-to-fine models of vision suppose that vision begins with a first wave
of fast but coarse information which could enhance further visual processing. In order to test
if such anticipation of the visual world can modulate the emergence or the collapse of
consciousness, forty-four undergraduate students were recruited to participate in our
experiment in which they had to detect and report two indoor scenes presented among
outdoor scenes (all presented for 83 ms) during an RSVP. The second target could appear
either at lag 1, lag 3, or lag 8, and the distractors presented between the targets were either
non-filtered scenes (NF), low-spatial frequency scenes (LSF), high-spatial frequency scenes
(HSF), or masks. As expected, HSF distractors produced a lesser blink than NF or LSF
distractors on lag 3, indicating that the precocious modulation of the visuo-attentional system
by the LSFs plays a role in the emergence of consciousness. Such results are explained in
light of the boost and bounce theory (Olivers & Meeter, 2008), and a mechanism underlying
the direction of attention by working memory is proposed.
Keywords: attentional blink, spatial frequencies, visual attention, visual working memory
consciousness

BOOSTED BOUNCE !5
Introduction
Because of the quanta of information the human eye receives every single second and
because of information-processing limitations, the brain has to select which datum is relevant
and which is not in accordance with the purposes of the organism. The attentional blink (AB)
phenomenon could be the witness of such limitations. This effect—first described by
Broadbent and Broadbent (1987) and later termed the ‘attentional blink’ by Raymond,
Shapiro, and Arnell (1992)—can be observed during a rapid serial visual presentation
(RSVP). In this paradigm the participant is presented with a bunch of images streaming
sequentially at rates of about 10 items per second (i.e., 100 ms/item), the task being to detect
and report one or more targets per trial. The fact is that when a first target (T1) is consciously
perceived, the second target (T2), depending on the interval between the two (approximately
200-500 ms) and on the distractors between them (Martens & Valchev, 2009), is likely to be
processed without reaching conscious report (Luck, Vogel, & Shapiro, 1996). Explanations
about the processes underlying such a failure of the visual system still abound, going on with
this paper. Our study investigated the role of spatial frequencies in visuo-attentional
mechanisms and how consciousness could emerge from anticipatory mechanisms.
The Bounced Target: An Attentional Blink Phenomenon
A major model accounting for the blink is the boost and bounce theory (Olivers &
Meeter, 2008), which has been proposed to diverge from the previous models as it is not
relying on capacity limitations to explain the phenomenon (for reviews see Dux & Marois,
2009; Martens & Wyble, 2010). This model asserts that the template (also called ‘attentional
set’ or ‘gating’) stored in working memory—and defining ‘the representations involved in the
selection of task-relevant stimuli’ (Corbetta & Schulman, 2002, p. 202)—modulates the
bottom-up visual input through top-down reentrant connections according to the relevance of
the visual information. For example, if the visual representation being processed matches the
template, this low-level representation will be boosted through excitatory feedbacks, whereas
in case it is irrelevant the representation shall be bounced via inhibitory feedbacks. Olivers
and Meeter (2008) assumed that the bulk of this feedback activity would be reached around
BOOSTED BOUNCE !6
100 ms after the stimulus onset. This delay implies firstly that the stimulus may be long gone
when this peak is reached, and secondly, that the following stimuli could be modulated by
this very activity.
During the RSVP task until a target is presented only distractors are encountered,
hence, the system remains in a ‘stable inhibitory state’. Once a target (T1) is captured by the
visual system, as it matches the template, this one would trigger excitatory feedbacks from
the gate neurons in working memory back to the sensory stages in which it is processed,
enhancing its identification. With a stimulus onset asynchrony (SOA) of 100 ms, which is the
putative time necessary for the feedback activity to reach its apogee, the distractor following
T1 would profit the boost engendered by this latter. Consequently, the bounce (i.e., inhibitory
feedback) of the distractor, due to its irrelevancy, would be boosted since higher areas would
receive a strong signal from sensory areas that does not fit the template. Exactly the same
thing would occur when T2 appears: A strong inhibitory feedback generated by the boosted
bounce of the distractor would hit the early visuals areas, resulting in an insufficient
activation from T2 to the higher levels. To sum up, the attentional blink relies, according to
this theory, on temporal dynamics of excitatory and inhibitory feedbacks; it is mostly time-
based, and in fact, distractors are necessary for the occurrence of this phenomenon (see
Olivers & Meeter, 2008).
Whereas the authors declare the attentional blink is not occurring because of
processing limitations, this phenomenon still relies on the limitations of our brain (statement
that is not denied by Olivers and Meeter). Without these limitations, there wouldn’t be any
need to enhance information through visual attention as each information could be processed
equivalently. The relevant information could not be ignored and visual attention would be
unnecessary. Studies conducted through event-related potentials (ERPs) paradigms brought
out that spatial attention freezes during the attentional blink (Dell’Acqua, Sessa, Jolicœur, &
Robitaille, 2006), and that this freeze corresponds to the failure of attentional allocation to
targets (Pomerleau, et al., 2014). These results fit entirely the boost and bounce theory. Still,
this model needs to be compared to neuro-functional evidences about visual attention, visual
working memory, or visual perception more generally, to consider it as being a plausible
theory of temporal attention and to determine the mechanisms underlying conscious access.
BOOSTED BOUNCE !7
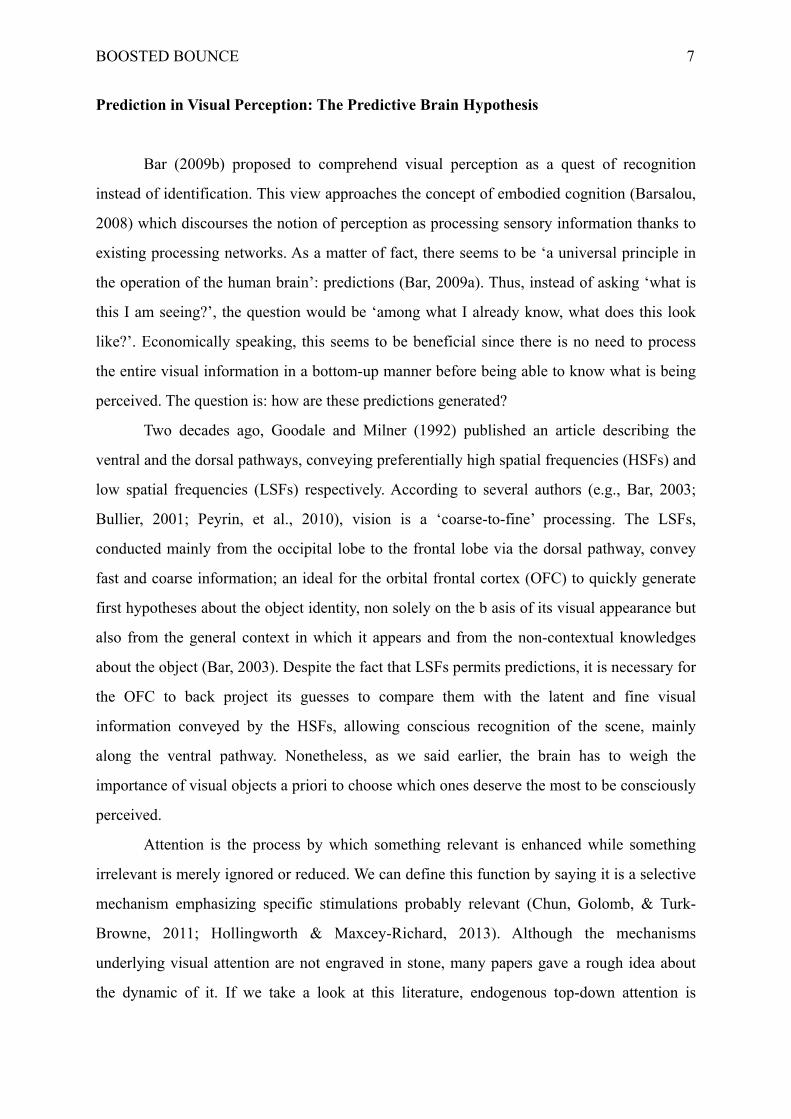
Prediction in Visual Perception: The Predictive Brain Hypothesis
Bar (2009b) proposed to comprehend visual perception as a quest of recognition
instead of identification. This view approaches the concept of embodied cognition (Barsalou,
2008) which discourses the notion of perception as processing sensory information thanks to
existing processing networks. As a matter of fact, there seems to be ‘a universal principle in
the operation of the human brain’: predictions (Bar, 2009a). Thus, instead of asking ‘what is
this I am seeing?’, the question would be ‘among what I already know, what does this look
like?’. Economically speaking, this seems to be beneficial since there is no need to process
the entire visual information in a bottom-up manner before being able to know what is being
perceived. The question is: how are these predictions generated?
Two decades ago, Goodale and Milner (1992) published an article describing the
ventral and the dorsal pathways, conveying preferentially high spatial frequencies (HSFs) and
low spatial frequencies (LSFs) respectively. According to several authors (e.g., Bar, 2003;
Bullier, 2001; Peyrin, et al., 2010), vision is a ‘coarse-to-fine’ processing. The LSFs,
conducted mainly from the occipital lobe to the frontal lobe via the dorsal pathway, convey
fast and coarse information; an ideal for the orbital frontal cortex (OFC) to quickly generate
first hypotheses about the object identity, non solely on the b asis of its visual appearance but
also from the general context in which it appears and from the non-contextual knowledges
about the object (Bar, 2003). Despite the fact that LSFs permits predictions, it is necessary for
the OFC to back project its guesses to compare them with the latent and fine visual
information conveyed by the HSFs, allowing conscious recognition of the scene, mainly
along the ventral pathway. Nonetheless, as we said earlier, the brain has to weigh the
importance of visual objects a priori to choose which ones deserve the most to be consciously
perceived.
Attention is the process by which something relevant is enhanced while something
irrelevant is merely ignored or reduced. We can define this function by saying it is a selective
mechanism emphasizing specific stimulations probably relevant (Chun, Golomb, & Turk-
Browne, 2011; Hollingworth & Maxcey-Richard, 2013). Although the mechanisms
underlying visual attention are not engraved in stone, many papers gave a rough idea about
the dynamic of it. If we take a look at this literature, endogenous top-down attention is
BOOSTED BOUNCE !8
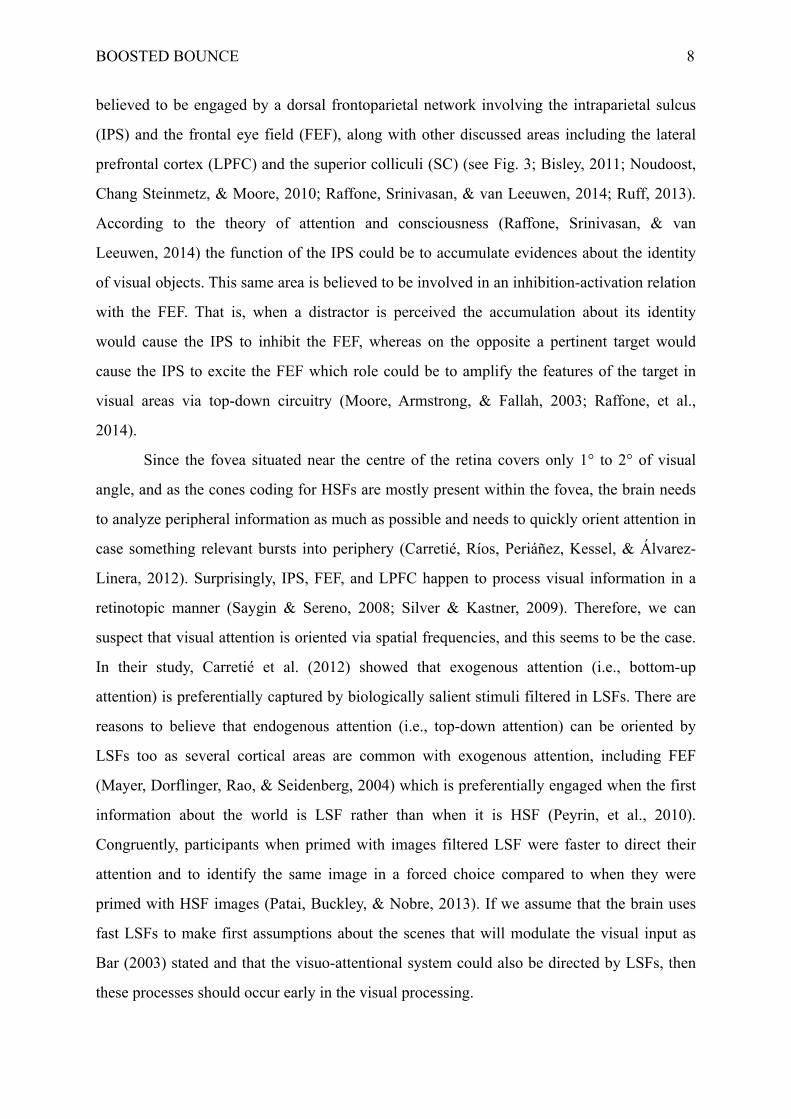
believed to be engaged by a dorsal frontoparietal network involving the intraparietal sulcus
(IPS) and the frontal eye field (FEF), along with other discussed areas including the lateral
prefrontal cortex (LPFC) and the superior colliculi (SC) (see Fig. 3; Bisley, 2011; Noudoost,
Chang Steinmetz, & Moore, 2010; Raffone, Srinivasan, & van Leeuwen, 2014; Ruff, 2013).
According to the theory of attention and consciousness (Raffone, Srinivasan, & van
Leeuwen, 2014) the function of the IPS could be to accumulate evidences about the identity
of visual objects. This same area is believed to be involved in an inhibition-activation relation
with the FEF. That is, when a distractor is perceived the accumulation about its identity
would cause the IPS to inhibit the FEF, whereas on the opposite a pertinent target would
cause the IPS to excite the FEF which role could be to amplify the features of the target in
visual areas via top-down circuitry (Moore, Armstrong, & Fallah, 2003; Raffone, et al.,
2014).
Since the fovea situated near the centre of the retina covers only 1° to 2° of visual
angle, and as the cones coding for HSFs are mostly present within the fovea, the brain needs
to analyze peripheral information as much as possible and needs to quickly orient attention in
case something relevant bursts into periphery (Carretié, Ríos, Periáñez, Kessel, & Álvarez-
Linera, 2012). Surprisingly, IPS, FEF, and LPFC happen to process visual information in a
retinotopic manner (Saygin & Sereno, 2008; Silver & Kastner, 2009). Therefore, we can
suspect that visual attention is oriented via spatial frequencies, and this seems to be the case.
In their study, Carretié et al. (2012) showed that exogenous attention (i.e., bottom-up
attention) is preferentially captured by biologically salient stimuli filtered in LSFs. There are
reasons to believe that endogenous attention (i.e., top-down attention) can be oriented by
LSFs too as several cortical areas are common with exogenous attention, including FEF
(Mayer, Dorflinger, Rao, & Seidenberg, 2004) which is preferentially engaged when the first
information about the world is LSF rather than when it is HSF (Peyrin, et al., 2010).
Congruently, participants when primed with images filtered LSF were faster to direct their
attention and to identify the same image in a forced choice compared to when they were
primed with HSF images (Patai, Buckley, & Nobre, 2013). If we assume that the brain uses
fast LSFs to make first assumptions about the scenes that will modulate the visual input as
Bar (2003) stated and that the visuo-attentional system could also be directed by LSFs, then
these processes should occur early in the visual processing.
BOOSTED BOUNCE !9
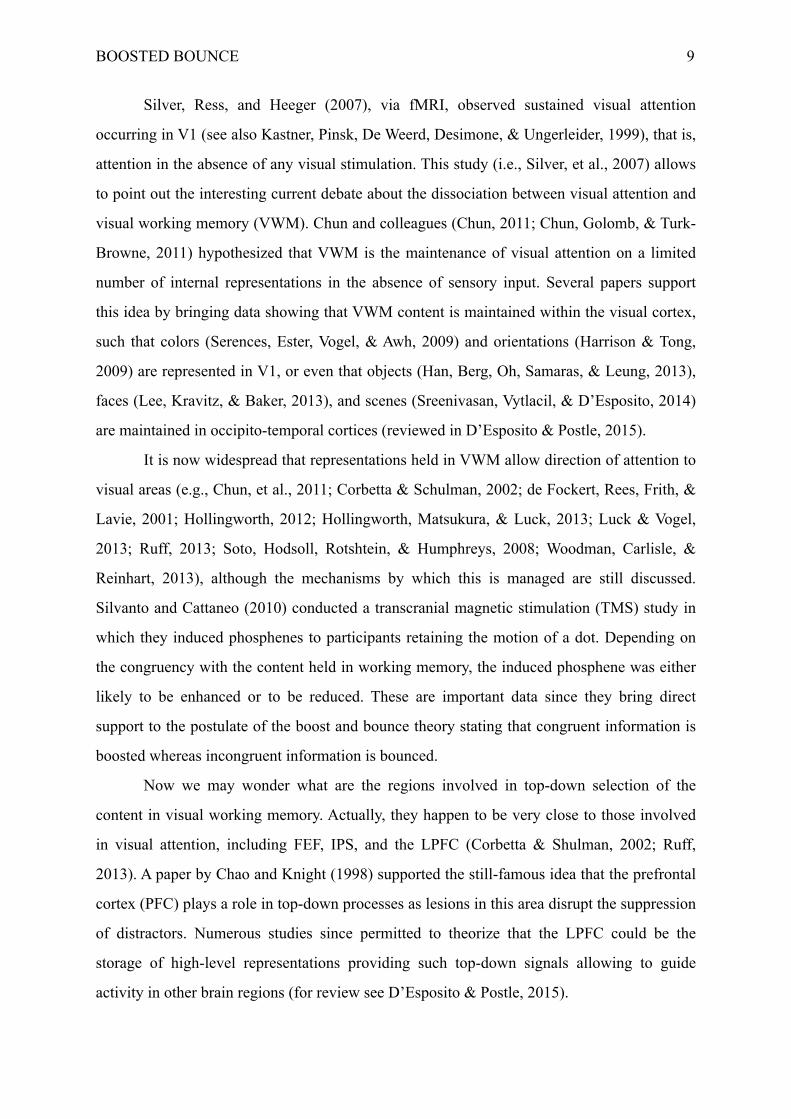
Silver, Ress, and Heeger (2007), via fMRI, observed sustained visual attention
occurring in V1 (see also Kastner, Pinsk, De Weerd, Desimone, & Ungerleider, 1999), that is,
attention in the absence of any visual stimulation. This study (i.e., Silver, et al., 2007) allows
to point out the interesting current debate about the dissociation between visual attention and
visual working memory (VWM). Chun and colleagues (Chun, 2011; Chun, Golomb, & Turk-
Browne, 2011) hypothesized that VWM is the maintenance of visual attention on a limited
number of internal representations in the absence of sensory input. Several papers support
this idea by bringing data showing that VWM content is maintained within the visual cortex,
such that colors (Serences, Ester, Vogel, & Awh, 2009) and orientations (Harrison & Tong,
2009) are represented in V1, or even that objects (Han, Berg, Oh, Samaras, & Leung, 2013),
faces (Lee, Kravitz, & Baker, 2013), and scenes (Sreenivasan, Vytlacil, & D’Esposito, 2014)
are maintained in occipito-temporal cortices (reviewed in D’Esposito & Postle, 2015).
It is now widespread that representations held in VWM allow direction of attention to
visual areas (e.g., Chun, et al., 2011; Corbetta & Schulman, 2002; de Fockert, Rees, Frith, &
Lavie, 2001; Hollingworth, 2012; Hollingworth, Matsukura, & Luck, 2013; Luck & Vogel,
2013; Ruff, 2013; Soto, Hodsoll, Rotshtein, & Humphreys, 2008; Woodman, Carlisle, &
Reinhart, 2013), although the mechanisms by which this is managed are still discussed.
Silvanto and Cattaneo (2010) conducted a transcranial magnetic stimulation (TMS) study in
which they induced phosphenes to participants retaining the motion of a dot. Depending on
the congruency with the content held in working memory, the induced phosphene was either
likely to be enhanced or to be reduced. These are important data since they bring direct
support to the postulate of the boost and bounce theory stating that congruent information is
boosted whereas incongruent information is bounced.
Now we may wonder what are the regions involved in top-down selection of the
content in visual working memory. Actually, they happen to be very close to those involved
in visual attention, including FEF, IPS, and the LPFC (Corbetta & Shulman, 2002; Ruff,
2013). A paper by Chao and Knight (1998) supported the still-famous idea that the prefrontal
cortex (PFC) plays a role in top-down processes as lesions in this area disrupt the suppression
of distractors. Numerous studies since permitted to theorize that the LPFC could be the
storage of high-level representations providing such top-down signals allowing to guide
activity in other brain regions (for review see D’Esposito & Postle, 2015).
BOOSTED BOUNCE !10
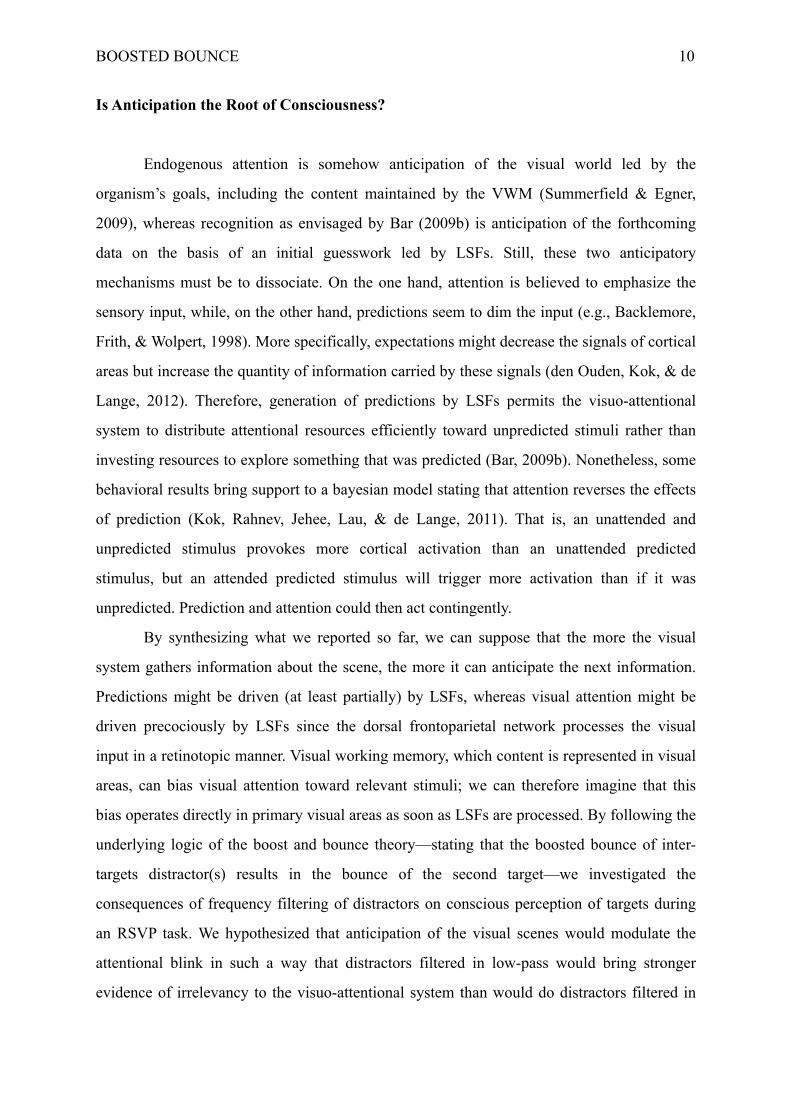
Is Anticipation the Root of Consciousness?
Endogenous attention is somehow anticipation of the visual world led by the
organism’s goals, including the content maintained by the VWM (Summerfield & Egner,
2009), whereas recognition as envisaged by Bar (2009b) is anticipation of the forthcoming
data on the basis of an initial guesswork led by LSFs. Still, these two anticipatory
mechanisms must be to dissociate. On the one hand, attention is believed to emphasize the
sensory input, while, on the other hand, predictions seem to dim the input (e.g., Backlemore,
Frith, & Wolpert, 1998). More specifically, expectations might decrease the signals of cortical
areas but increase the quantity of information carried by these signals (den Ouden, Kok, & de
Lange, 2012). Therefore, generation of predictions by LSFs permits the visuo-attentional
system to distribute attentional resources efficiently toward unpredicted stimuli rather than
investing resources to explore something that was predicted (Bar, 2009b). Nonetheless, some
behavioral results bring support to a bayesian model stating that attention reverses the effects
of prediction (Kok, Rahnev, Jehee, Lau, & de Lange, 2011). That is, an unattended and
unpredicted stimulus provokes more cortical activation than an unattended predicted
stimulus, but an attended predicted stimulus will trigger more activation than if it was
unpredicted. Prediction and attention could then act contingently.
By synthesizing what we reported so far, we can suppose that the more the visual
system gathers information about the scene, the more it can anticipate the next information.
Predictions might be driven (at least partially) by LSFs, whereas visual attention might be
driven precociously by LSFs since the dorsal frontoparietal network processes the visual
input in a retinotopic manner. Visual working memory, which content is represented in visual
areas, can bias visual attention toward relevant stimuli; we can therefore imagine that this
bias operates directly in primary visual areas as soon as LSFs are processed. By following the
underlying logic of the boost and bounce theory—stating that the boosted bounce of inter-
targets distractor(s) results in the bounce of the second target—we investigated the
consequences of frequency filtering of distractors on conscious perception of targets during
an RSVP task. We hypothesized that anticipation of the visual scenes would modulate the
attentional blink in such a way that distractors filtered in low-pass would bring stronger
evidence of irrelevancy to the visuo-attentional system than would do distractors filtered in
BOOSTED BOUNCE !11
high-pass. Consequently, we predicted a deeper blink with LSF than with HSF at lag 3—as
the intensity of the bounce depends on the dissimilarity between the distractors and on the
template (Müsch, Engel, & Schneider, 2012; Raymond, Shapiro, & Arnell, 1995)—in case
visual perception and visual attention are directed by LSFs. This hypothesis also led us to
predict that there would not be any difference between the NF and the LSF conditions at any
lag. Nevertheless, we did not expect any difference between the conditions at lag 8 as T2
report is usually back to normal at this stage. The mask condition was expected to produce
the highest accuracy of T2 report, that is, equal or higher than HSF at lag 3 and 8. Finally, no
difference was meant to be found at lag 1 since there was no distractors between the targets.
Method
Participants and design
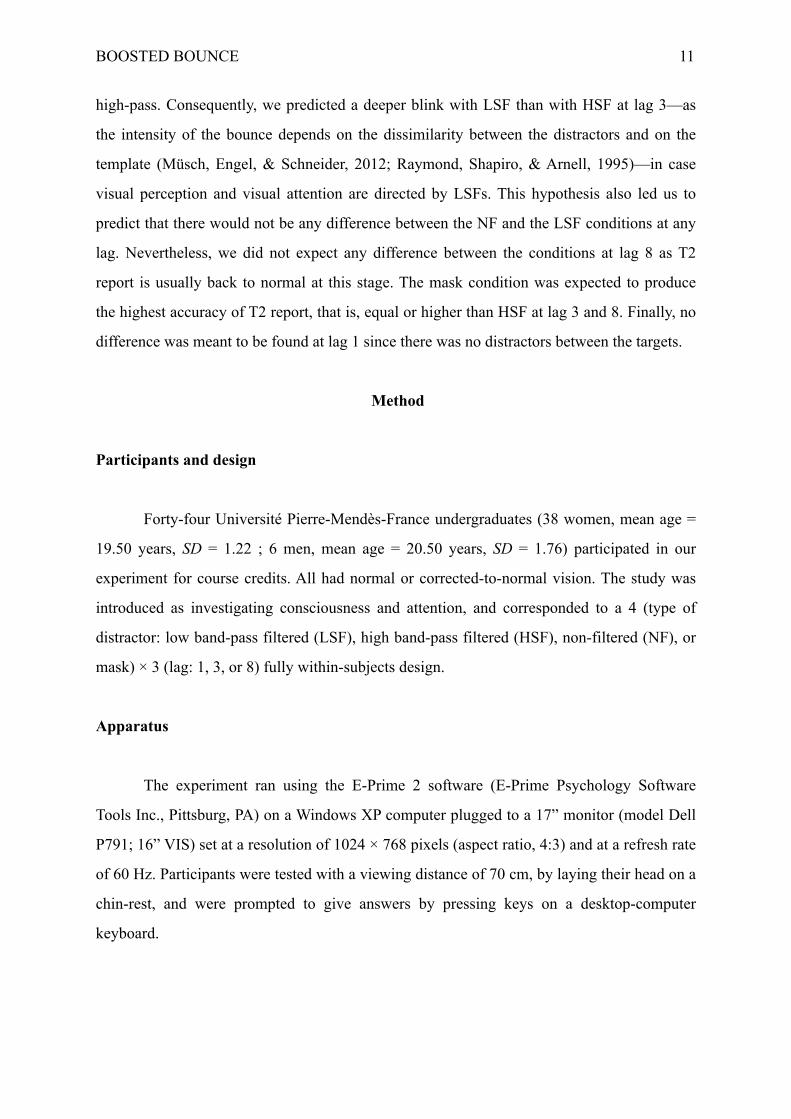
Forty-four Université Pierre-Mendès-France undergraduates (38 women, mean age =
19.50 years, SD = 1.22 ; 6 men, mean age = 20.50 years, SD = 1.76) participated in our
experiment for course credits. All had normal or corrected-to-normal vision. The study was
introduced as investigating consciousness and attention, and corresponded to a 4 (type of
distractor: low band-pass filtered (LSF), high band-pass filtered (HSF), non-filtered (NF), or
mask) × 3 (lag: 1, 3, or 8) fully within-subjects design.
Apparatus
The experiment ran using the E-Prime 2 software (E-Prime Psychology Software
Tools Inc., Pittsburg, PA) on a Windows XP computer plugged to a 17” monitor (model Dell
P791; 16” VIS) set at a resolution of 1024 × 768 pixels (aspect ratio, 4:3) and at a refresh rate
of 60 Hz. Participants were tested with a viewing distance of 70 cm, by laying their head on a
chin-rest, and were prompted to give answers by pressing keys on a desktop-computer
keyboard.
BOOSTED BOUNCE !12
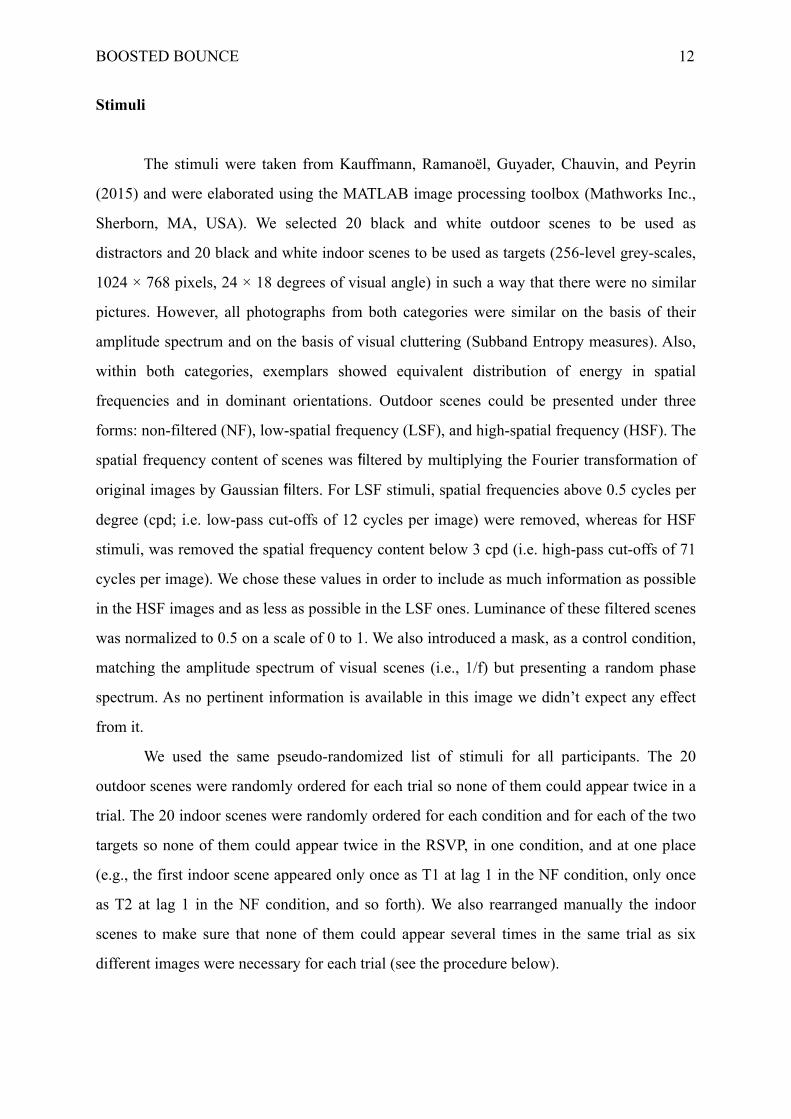
Stimuli
The stimuli were taken from Kauffmann, Ramanoël, Guyader, Chauvin, and Peyrin
(2015) and were elaborated using the MATLAB image processing toolbox (Mathworks Inc.,
Sherborn, MA, USA). We selected 20 black and white outdoor scenes to be used as
distractors and 20 black and white indoor scenes to be used as targets (256-level grey-scales,
1024 × 768 pixels, 24 × 18 degrees of visual angle) in such a way that there were no similar
pictures. However, all photographs from both categories were similar on the basis of their
amplitude spectrum and on the basis of visual cluttering (Subband Entropy measures). Also,
within both categories, exemplars showed equivalent distribution of energy in spatial
frequencies and in dominant orientations. Outdoor scenes could be presented under three
forms: non-filtered (NF), low-spatial frequency (LSF), and high-spatial frequency (HSF). The
spatial frequency content of scenes was filtered by multiplying the Fourier transformation of
original images by Gaussian filters. For LSF stimuli, spatial frequencies above 0.5 cycles per
degree (cpd; i.e. low-pass cut-offs of 12 cycles per image) were removed, whereas for HSF
stimuli, was removed the spatial frequency content below 3 cpd (i.e. high-pass cut-offs of 71
cycles per image). We chose these values in order to include as much information as possible
in the HSF images and as less as possible in the LSF ones. Luminance of these filtered scenes
was normalized to 0.5 on a scale of 0 to 1. We also introduced a mask, as a control condition,
matching the amplitude spectrum of visual scenes (i.e., 1/f) but presenting a random phase
spectrum. As no pertinent information is available in this image we didn’t expect any effect
from it.
We used the same pseudo-randomized list of stimuli for all participants. The 20
outdoor scenes were randomly ordered for each trial so none of them could appear twice in a
trial. The 20 indoor scenes were randomly ordered for each condition and for each of the two
targets so none of them could appear twice in the RSVP, in one condition, and at one place
(e.g., the first indoor scene appeared only once as T1 at lag 1 in the NF condition, only once
as T2 at lag 1 in the NF condition, and so forth). We also rearranged manually the indoor
scenes to make sure that none of them could appear several times in the same trial as six
different images were necessary for each trial (see the procedure below).

BOOSTED BOUNCE !13
Procedure
Participants were tested individually in a darkened experimental box for 20-minutes
sessions and wore a noise-canceling headset. They were instructed orally and by reading to
detect two indoor scenes (targets) among outdoor scenes (distractors) presented sequentially
at quick pace. The experiment started with a training session during which the experimenter
remained in the room. The training phase consisted of 10 trials split in two conditions absent
from the experimental session: a ‘no-T2-and-no-distractors’ condition and a ‘lag-7-with-
mask-distractors’ condition. In this session the participants were trained to give their answers
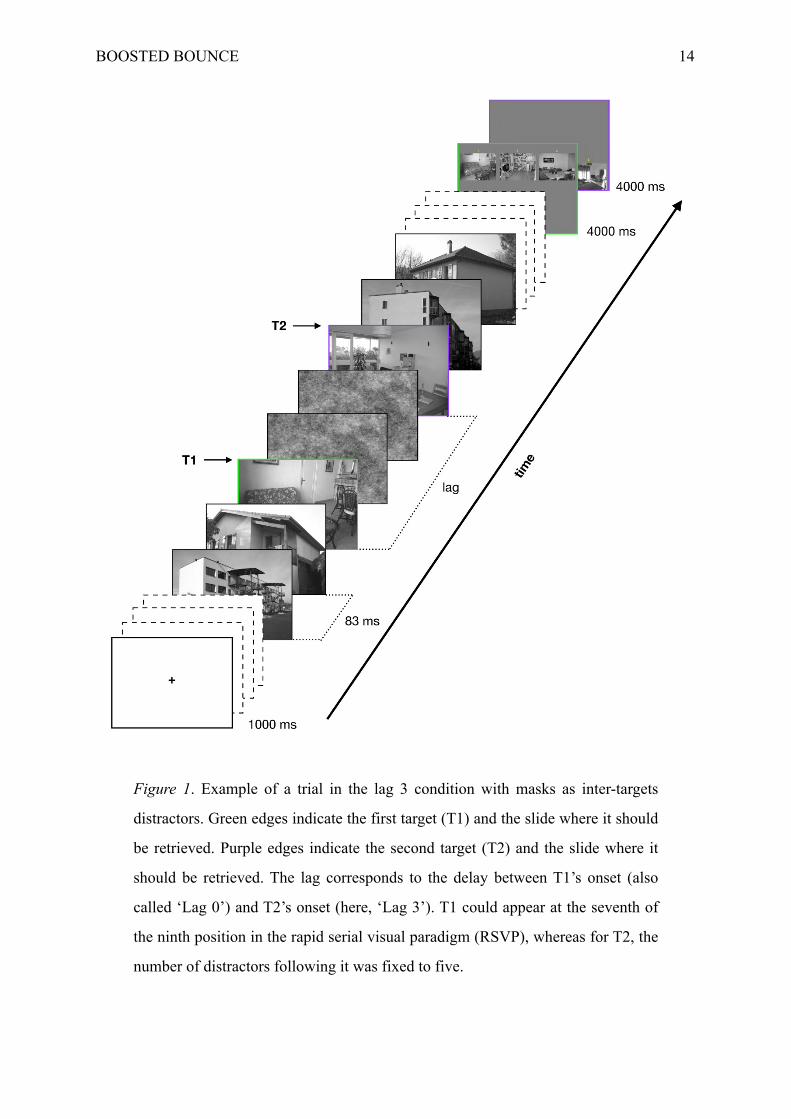
properly (see the instructions below). Each trial started with a fixation cross lasting 1000 ms
followed by a 13- to 22-images-long RSVP presented at a rate of about ~12 Hz (image
duration: 83 ms)(see Fig. 1). T1 was presented after four or six non-filtered distractors, then,
there could be nought, two, or seven distractors between the targets (corresponding to lag 1,
3, and 8 respectively). All distractors within each trial belonged to the same type (i.e., NF,
LSF, HSF, mask). Once T2 appeared, the number of distractors left in the RSVP was fixed to
five in order to diminish the variance in the degradation of working memory before T2
retrieval.
At the end of each trial, participants were first prompted to identify T1 presented
among two other possible targets by pressing key ‘1’, ‘2’, or ‘3’ (Bach, Schmidt-Daffy, &
Dolan, 2014). These three potential targets were displayed horizontally at the top of the
screen with a digit above each of them indicating the corresponding key to press. A similar
screen was displayed for the retrieval of T2, however this time the targets were presented at
the bottom of the screen, still with a digit above them. This was established to ensure that
participants would notice the screen had changed in case no response would have been
registered and that screen change had occurred during an eye saccade. Indeed, participants
were given 4 sec to give their answer on both of the answer screens. In case no target was
perceived or recognized participants were instructed to press the ‘space’ key instead of
answering hazardously as we were not interested in unconscious perception by the dorsal
pathway or in any knowledge that it could retrieve (Goodale, 2008).
BOOSTED BOUNCE !14
!
Figure 1. Example of a trial in the lag 3 condition with masks as inter-targets
distractors. Green edges indicate the first target (T1) and the slide where it should
be retrieved. Purple edges indicate the second target (T2) and the slide where it
should be retrieved. The lag corresponds to the delay between T1’s onset (also
called ‘Lag 0’) and T2’s onset (here, ‘Lag 3’). T1 could appear at the seventh of
the ninth position in the rapid serial visual paradigm (RSVP), whereas for T2, the
number of distractors following it was fixed to five.
BOOSTED BOUNCE !15
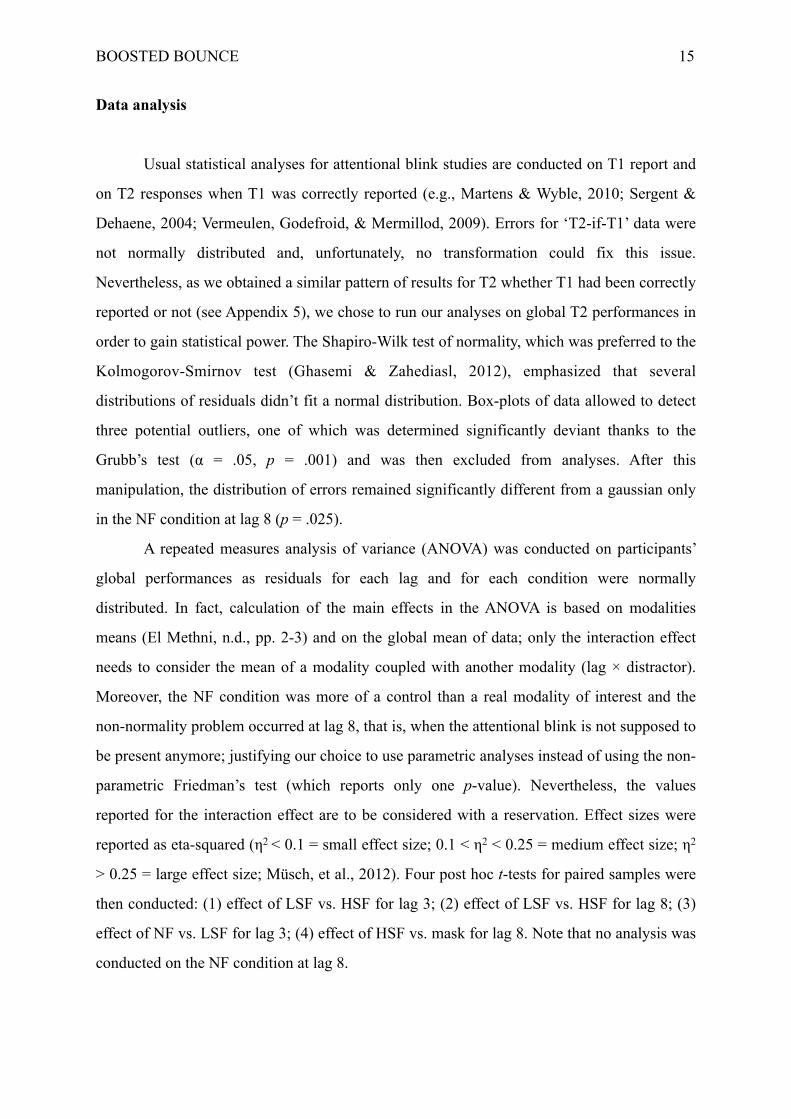
Data analysis
Usual statistical analyses for attentional blink studies are conducted on T1 report and
on T2 responses when T1 was correctly reported (e.g., Martens & Wyble, 2010; Sergent &
Dehaene, 2004; Vermeulen, Godefroid, & Mermillod, 2009). Errors for ‘T2-if-T1’ data were
not normally distributed and, unfortunately, no transformation could fix this issue.
Nevertheless, as we obtained a similar pattern of results for T2 whether T1 had been correctly
reported or not (see Appendix 5), we chose to run our analyses on global T2 performances in
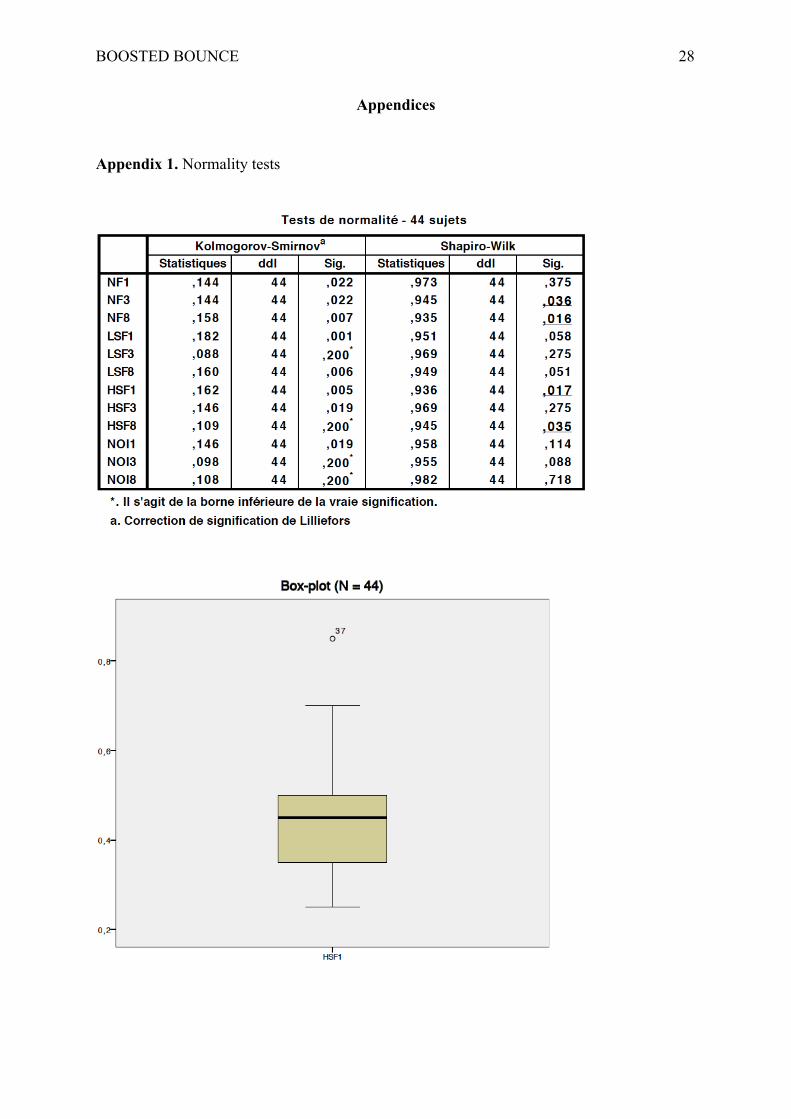
order to gain statistical power. The Shapiro-Wilk test of normality, which was preferred to the
Kolmogorov-Smirnov test (Ghasemi & Zahediasl, 2012), emphasized that several
distributions of residuals didn’t fit a normal distribution. Box-plots of data allowed to detect
three potential outliers, one of which was determined significantly deviant thanks to the
Grubb’s test (α = .05, p = .001) and was then excluded from analyses. After this
manipulation, the distribution of errors remained significantly different from a gaussian only
in the NF condition at lag 8 (p = .025).
A repeated measures analysis of variance (ANOVA) was conducted on participants’
global performances as residuals for each lag and for each condition were normally
distributed. In fact, calculation of the main effects in the ANOVA is based on modalities
means (El Methni, n.d., pp. 2-3) and on the global mean of data; only the interaction effect
needs to consider the mean of a modality coupled with another modality (lag × distractor).
Moreover, the NF condition was more of a control than a real modality of interest and the
non-normality problem occurred at lag 8, that is, when the attentional blink is not supposed to
be present anymore; justifying our choice to use parametric analyses instead of using the non-
parametric Friedman’s test (which reports only one p-value). Nevertheless, the values
reported for the interaction effect are to be considered with a reservation. Effect sizes were
reported as eta-squared (η2 < 0.1 = small effect size; 0.1 < η2 < 0.25 = medium effect size; η2
> 0.25 = large effect size; Müsch, et al., 2012). Four post hoc t-tests for paired samples were
then conducted: (1) effect of LSF vs. HSF for lag 3; (2) effect of LSF vs. HSF for lag 8; (3)
effect of NF vs. LSF for lag 3; (4) effect of HSF vs. mask for lag 8. Note that no analysis was
conducted on the NF condition at lag 8.
BOOSTED BOUNCE !16
!
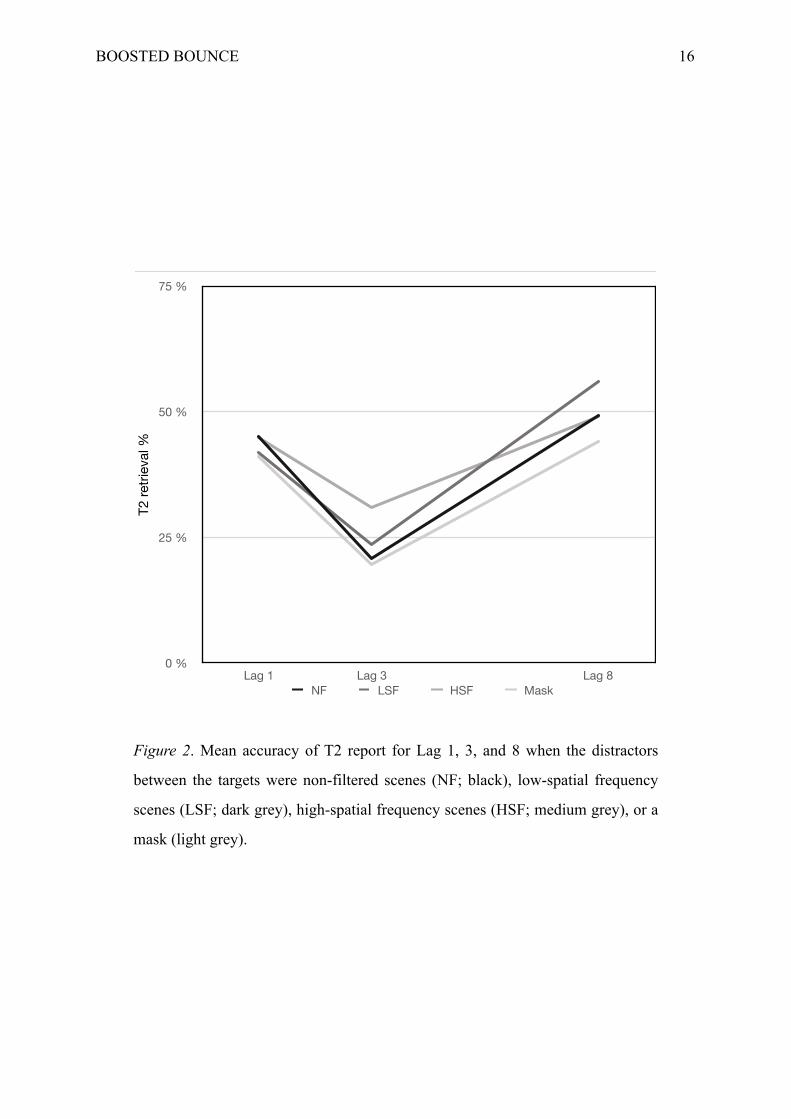
Figure 2. Mean accuracy of T2 report for Lag 1, 3, and 8 when the distractors
between the targets were non-filtered scenes (NF; black), low-spatial frequency
scenes (LSF; dark grey), high-spatial frequency scenes (HSF; medium grey), or a
mask (light grey).
T2 re
triev
al %
0 %
25 %
50 %
75 %
Lag 1 Lag 3 Lag 8NF LSF HSF Mask
BOOSTED BOUNCE !17
Results
First of all, a lag-1 sparing effect couldn’t be observed since T2 report (M = .43; SD
= .11) didn’t exceed that of T1 (M = .41; SD = .13) at lag 1. Overall accuracy of T2 report
(Fig. 2; M = .24; SD = .14) seemed inferior to T1 report (M = .68; SD = .16) at lag 3, but also
at lag 8 (T2: M = .50; SD = .19; T1: M = .70; SD = .17). Mauchly’s test indicated that the
assumption of sphericity was violated for the lag effect, χ2(2) = 12.8, p = .002, ε = .814,
therefore we applied the Huynh-Feldt’s correction over the degrees of freedom since ε > .75
(see Girden, 1992). An ANOVA with repeated measures was conducted and showed a main
effect of the lag, F(1.63, 68.38) = 110.04, p < .001, η2 = .724, 1−β = 1.0, confirming an
attentional blink, a main effect of distractors was also obtained, F(3, 126) = 13.97, p < .001,
η2 = .25, 1−β = 1.0, and an interaction effect was reported, F(6, 252) = 7.09, p < .001, η2 = .
144, 1−β = 1.0. In an effort to explore the effects of distractors and to test our original
assumptions, we performed four paired samples t-tests. The first means comparison reported
a significant difference between the LSF and the HSF conditions at lag 3 [T2 report with
LSF: 23%; T2 report with HSF: 31%; t(42) = −3.85, p < .001], confirming that LSF produced
a stronger blink than HSF did. The second paired samples t-test indicated that LSF
engendered a better report of T2 than HSF at lag 8 [T2 report with LSF: 56%; T2 report with
HSF: 49%; t(42) = 3.57, p < .001]. The third t-test demonstrated that there was no significant
difference between NF and LSF at lag 3 [T2 report with NF: 21%; T2 report with LSF: 23%;
t(42) = −1.34, p = .19]. Finally, the fourth paired samples t-test reported a significant
difference between the mask and the HSF conditions at lag 8 [T2 report with mask: 44%; T2
report with HSF: 49%; t(42) = 2.29, p = .027], indicating a weaker report of T2 in the mask
condition than in the HSF condition.
BOOSTED BOUNCE !18
Discussion
Consistent with previous studies (e.g, Bach, Schmidt-Daffy, & Dolan, 2014; Sergent
& Dehaene, 2004) an AB was elicited on T2 at lag 3, as shown on Figure 1 and as indicated
by the ANOVA. Our main hypothesis was confirmed since T2 retrieval in the LSF condition
was significantly lower than in the HSF condition at lag 3, plus, no difference was observed
between the LSF and the NF conditions. This can be explained conjointly by a predictive
brain hypothesis (Bar, 2009b) and the boost and bounce theory (Olivers & Meeter, 2008).
Assuming that visual perception begins with the processing of rapid coarse information—via
the magnocellular pathway up to the frontal lobe in which an (unconscious) initial guess that
will settle a top-down control over the visual input is created—then a first possibility
accounting for our results is that LSFs could trigger the template-matching of working
memory in the frontal lobe (as formulated by Olivers & Meeter, 2008) earlier and stronger
than HSFs could do it, boosting or bouncing the visual input in a precocious way. This
hypothesis follows very closely the boost and bounce model and juxtaposes only the idea of a
coarse-to-fine visual processing. If we seek to enrich this model and to take account of the
numerous data from the fields of visual attention and working memory as reviewed in the
introduction, we can propose another hypothesis accounting for these results. We can
speculate that VWM—which content is represented in the areas processing the visual
information during perception and which is mainly controlled by the PFC, but also by the
FEF and the LIP—could filter the visual input as soon as during the bottom-up wave of
information, that is, as soon as the visual input reaches the visual areas. Visual information
would pass to the higher levels anyway, but in case it is incongruent, it would be delayed and
diminished (see Gazzaley, Cooney, McEvoy, Knight, and D’Esposito, 2005). The LIP and the
FEF would then be recruited and serve as an attentional top-down modulation of the visual
input (Bisley, 2011). Finally, prefrontal regions, namely the LPFC (D’Esposito & Postle,
2015; Noudoost, et al., 2010) and the OFC (Bar, 2009b), would trigger top-down signals to
occipito-temporal regions processing the visual representations (see Fig. 3). Since LSFs
travel faster than HSFs, it seems logical that the attentional dorsal prefrontal network would
be fed with information issued from LSFs in the first place, and then later by HSFs, after this
information had been gated by the content in VWM. There would still be a delay between the
BOOSTED BOUNCE !19
moment the visual input reaches the low-level visual areas during the bottom-up wave and
the moment it reaches the low-level visual areas but originating from the higher areas (a
delay putatively accounting for the blink). This proposition only suggests that VWM plays a
precocious role of modulation instead of a late top-down control responsible for the blink,
and that this blink is due instead to a late attentional modulation of the information. Although
the way VWM modulates visual processing is still quite undocumented, if templates are
represented in visual areas this sustained activity is susceptible to play a role in modulating
oncoming input. Note that this is only speculation and that nothing in our data challenges this
hypothesis.
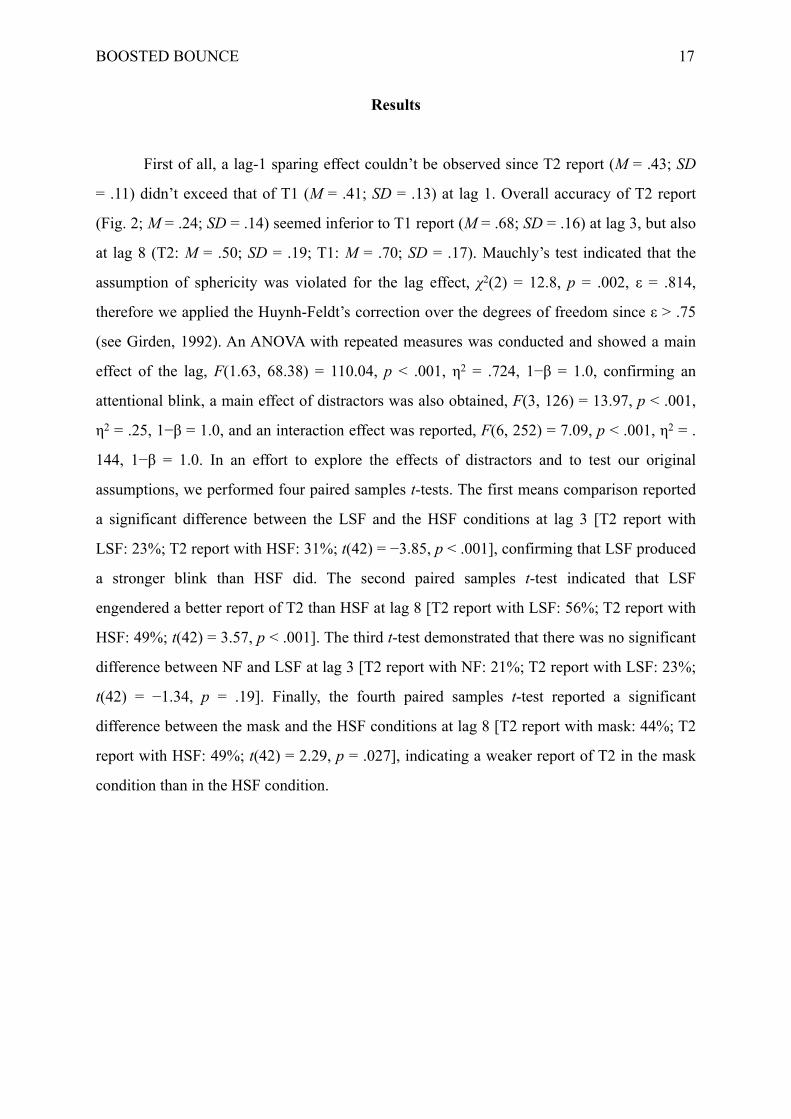
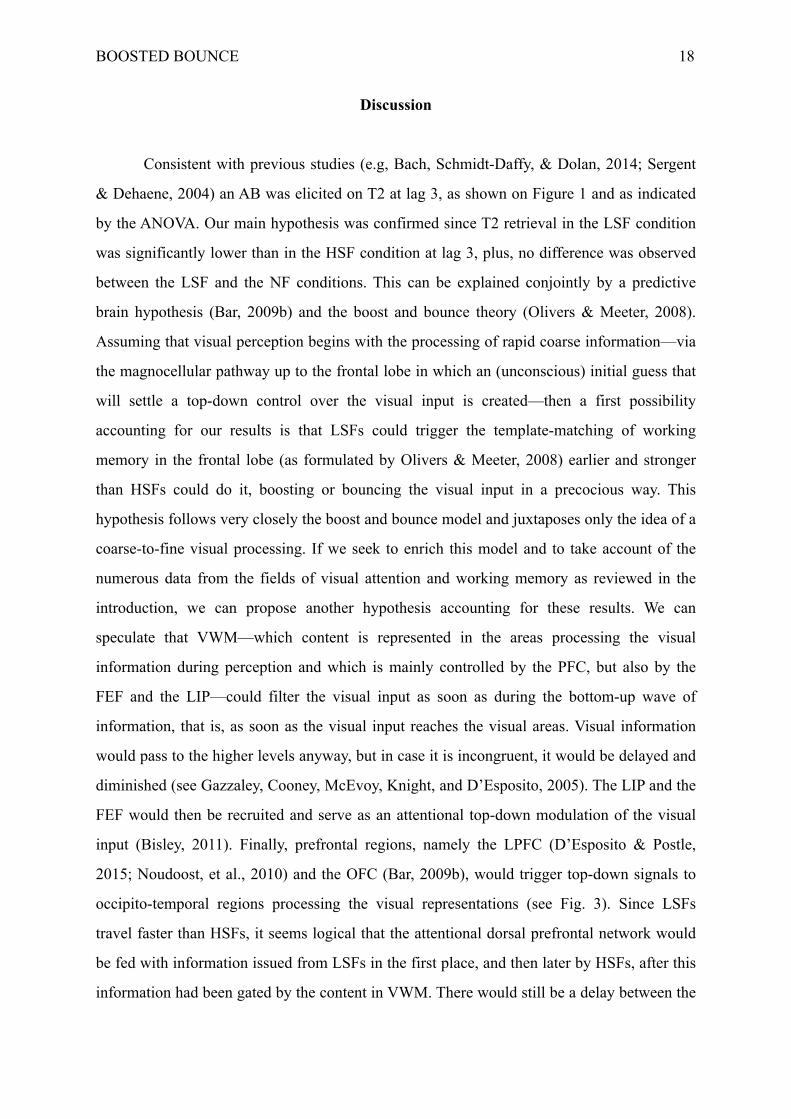
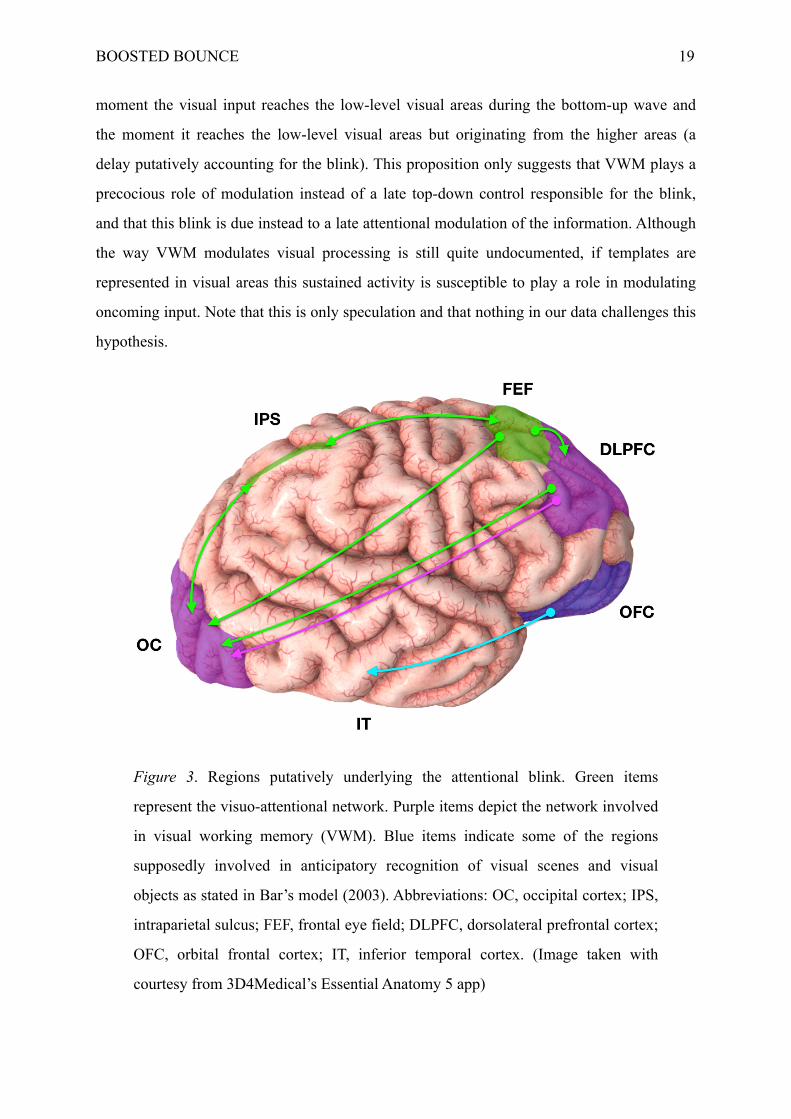
Figure 3. Regions putatively underlying the attentional blink. Green items
represent the visuo-attentional network. Purple items depict the network involved
in visual working memory (VWM). Blue items indicate some of the regions
supposedly involved in anticipatory recognition of visual scenes and visual
objects as stated in Bar’s model (2003). Abbreviations: OC, occipital cortex; IPS,
intraparietal sulcus; FEF, frontal eye field; DLPFC, dorsolateral prefrontal cortex;
OFC, orbital frontal cortex; IT, inferior temporal cortex. (Image taken with
courtesy from 3D4Medical’s Essential Anatomy 5 app)
BOOSTED BOUNCE !20
Unintended results are to be reported though. Indeed, at lag 8, T2 report in the LSF
condition overwhelms the one in the HSF condition (and maybe also the one in the NF
condition). This pattern could be explained by the temporal dynamic of spatial-frequency
processing. In fact, Schyns and Oliva (1994) gathered data during a scene recognition task
with hybrid images, composed of a highway low-pass filtered (LSF) and of a city high-pass
filtered (HSF) for instance, indicating that scenes were likely to be categorized according to
the LSF content of the images when they were presented with short durations (30 ms) and
that categorization was more based on HSFs when presented with long durations (150 ms).
We can suppose that the visuo-attentional system not only uses LSF information, but also
uses HSFs in later stages. Therefore, the attentional blink could occur later when distractors
are high-passed than when they are low-passed since the time necessary for the HSFs to reach
the visual system is longer than for the LSFs. This hypothesis cannot be verified here as not
enough lags were used, still, this can account for the fact that HSF exceeds LSF at lag 3 and
for the fact that LSF exceeds both HSF and NF at lag 8. In non-filtered images all frequencies
are available, hence, we can suspect that NF equals LSF at lag 3 since scene recognition is
preferentially guided coarse information with short SOAs, and that NF equals HSF at lag 8
since scene recognition is more based on fine information with longer SOAs. Nonetheless,
this assumption is to consider with caution as the data obtained in the NF condition at lag 8
were not normally distributed.
Another unexpected result is that T2 report in the mask condition was the lowest of all
conditions. We didn’t expect this as no frequency information is available in the mask we
used. Nevertheless, this image respects the amplitude spectrum of natural scenes. It is
plausible that this amplitude influenced the top-down control of visual processes since
categorization seems to be amplitude-based (Guyader, Chauvin, Peyrin, Hérault, &
Marendaz, 2004). This mask may have provided ambiguous information, disrupting the
categorization process, and resulting in a stronger blink.
Several methodological problems encountered in this study are to be noticed. Firstly,
it would be advised in further experiments to increase the number of participants and to
decrease the difficulty of the task in order to avoid non-normality problems. In fact, the
global accuracy is relatively low compared to other studies (e.g., Vermeulen, Godefroid, &
Mermillod, 2009) and performances of T2-if-T1 report tended most of the time toward zero;

BOOSTED BOUNCE !21
although, in most of the experiments the participants were asked to answer even if they did
not perceive either of the targets. In this situation they could at least approach the chance
level. Secondly, we used only one mask. During the RSVP, when multiple distractors were
placed between the targets, the mask was displayed multiple times for 166 ms (lag 3) or 581
ms (lag 8). This could have given an impression of disruption in the rhythm of the RSVP.
Several masks should be used and chosen with care in light of the characteristics of the
images used in the paradigm. Finally, participants reported they had seen grey images that
were actually HSF images perceived grey because of the luminance normalization and of the
fine information barely visible at such speed. Whereas we can argue that spatial frequency
processing is an automatic process, this argument is lessened if participants notice that we are
manipulating the type of image. The lesser participants are aware of, the better. It could be
interesting to use images from which we subtracted the spatial frequencies of interest in order
to minimize such effect of normalization.
This study shows that the attentional blink can be modulated by frequency
information carried by the distractors, emphasizing again their importance in the production
of the blink. The results bring support to the idea that anticipatory processes play a role in the
emergence of consciousness. Moreover, we formulated a hypothesized role of the VWM
describing how this function could contribute to the modulation of the visual input. Our next
experiments should investigate the possibility of a shifted blink in the HSF condition by
including more lags. Besides this, in order to test explanations (e.g., Raffone, et al., 2014)
based on the neuronal global workspace (Dehaene, Sergent, & Changeux, 2003; but see
Dehaene, Kerzberg, & Changeux, 1998), future experiments could investigate the possibility
of a cross-modal attentional blink. In other words: Is an auditory target to be blinked after a
visual target? Indeed, global workspace theories state that the inability to report T2 is due to a
monopolization of the system by T1. If this is true, we should be able not only to suppress a
peripheral visual target appearing at the onset of T2 after T1 being presented in central vision,
but also should us be able to conceal an auditory T2 after a visual T1.
BOOSTED BOUNCE !22
References
Bach, D. R., Schmidt-Daffy, M., & Dolan, R. J. (2014). Facial expressions influences face
identity recognition during the attentional blink. Emotion, 14(6), 1007-1013.
Backlemore, S. J., Wolpert, D. M., & Frith, C. D. (1998). central cancellation of self-
produced tickle sensation. Nature Neuroscience, 1(7), 635-640.
Bar, M. (2003). A cortical mechanism for triggering top-down facilitation in visual object
recognition. Journal of Cognitive Neuroscience, 15(4), 600-609.
Bar, M. (2009a). Predictions: a universal principle in the operation of the human brain.
Philosophical Transactions of The Royal Society B, 364, 1181-1182.
Bar, M. (2009b). The proactive brain: memory for predictions. Philosophical Transactions of
The Royal Society B, 364, 1235-1243.
Barsalou, L. (2008). Grounded cognition. Annual Review of Psychology, 59, 617-645.
Bisley, J. W. (2011). The neural basis of visual attention. The Journal of physiology, 589(1),
49-57.
Bisley, J. W., & Goldberg, M. E. (2010). Attention, intention, and priority in the parietal lobe.
Annual Review of Neurosciences, 33, 1–21.
Broadbent, D. E., & Broadbent, M. H. P. (1987). From detection to identification: Response
to multiple targets in rapid serial visual presentation. Perception & Psychophysics, 42,
105–113.
Bullier, J. (2001). Integrated model of visual processing. Brain Research Reviews, 36(2),
96-107.
Carretié, L., Ríos, M., Periáñez, J. A., Kessel, D., & Álvarez-Linera, J. (2012). The role of
low and high spatial frequencies in exogenous attention to biologically salient stimuli.
PloS one, 7(5), e37082.
Carrasco, M. (2011). Visual attention: The past 25 years. Vision Research, 51, 1484-1525.
Chao, L. L., & Knight, R. T. (1998). Contribution of human prefrontal cortex to delay
performance. Journal of Cognitive Neuroscience, 10, 167–177.
Chun, M. M. (2011). Visual working memory as visual attention sustained internally over
time. Neuropsychologia, 49, 1407-1409.
BOOSTED BOUNCE !23
Chun, M. M., Golomb, J. D., & Turk-Browne, N. B. (2011). A taxonomy of external and
internal attention. Annual Review of Psychology, 62, 73-101.
Corbetta, M., & Shulman, G. L. (2002). Control of goal-directed and stimulus-driven
attention in the brain. Nature reviews neuroscience, 3(3), 201-215.
de Fockert, J. W., Rees, G., Frith, C. D., & Lavie, N. (2001). The role of working memory in
visual selective attention. Science, 291(5509), 1803-1806.
Dehaene, S., Kerszberg, M., & Changeux, J.-P. (1998). A neuronal model of a global
workspace in effortful cognitive tasks. Proceedings of the National Academy of
Sciences, 95(24), 14529-14534.
Dehaene, S., Sergent, C., & Changeux, J.-P. (2003). A neuronal network model linking
subjective reports and objective physiological data during conscious perception.
Proceedings of the National Academy of Sciences, 100(14), 8520-8525.
Dell'Acqua, R., Sessa, P., Jolicœur, P., & Robitaille, N. (2006). Spatial attention freezes
during the attention blink. Psychophysiology, 43(4), 394-400.
den Ouden, H. E., Kok, P., & de Lange, F. P. (2012). How predictions errors shape
perception, attention, and motivation. Frontiers in Psychology, 3.
D'Esposito, M., & Postle, B. R. (2015). The Cognitive Neuroscience of Working Memory.
Annual Review in Psychology, 66(1), 115-143.
Dux, P. E., & Marois, R. (2009). The attentional blink: A review of data and theory. Attention,
Perception, & Psychophysics, 71(8), 1683-1700.
El Methni, M. (n.d.). Chapitre V: Analyse du plan S×A×B. Retrieved from http://imss-
www.upmf-grenoble.fr/prevert/MathSHS/PSY3/ANOVA/Cours/Chap5.pdf, available
on June, the 10th of 2015.
Gazzaley, A., Cooney, J. W., McEvoy, K., Knight, R. T., & D'Esposito, M. (2005). Top-down
enhancement and suppression of the magnitude and speed of neural activity. Journal
of cognitive neuroscience, 17(3), 507-517.
Ghasemi, A., & Zahediasl, S. (2012). Normality tests for statistical analysis: A guide for non-
statisticians. International Journal of Endocrinology and Metabolism, 10(2), 486-489.
Girden, E. (1992). ANOVA:repeated mesures. Newbury Park, CA: Sage.
BOOSTED BOUNCE !24
Godijn, R., & Theeuwes, J. (2004). The relationship between inhibition of return and saccade
trajectory deviations. Journal of Experimental Psychology: Human Perception and
Performance, 30(3), 538.
Goodale, M. A. (2008). Action without perception in human vision. Cognitive
Neuropsychology, 25(7-8), 891-919.
Goodale, M. A., & Milner, A. D. (1992). Separate visual pathways for perception and action.
Trends in neurosciences, 15(1), 20-25.
Guyader, N., Chauvin, A., Peyrin, C., Hérault, J., & Marendaz, C. (2004). Image phase or
amplitude? Rapid scene categorization is an amplitude-based process. Comptes
Rendus Biologies, 327(4), 313-318.
Han, X., Berg, A. C., Oh, H., Samaras, D., & Leung, H. C. (2013). Multi-voxel pattern
analysis of selective representation of visual working memory in ventral temporal and
occipital regions. NeuroImage, 73, 8–15.
Harrison, S. A., & Tong, F. (2009). Decoding reveals the contents of visual working memory
in early visual areas. Nature, 458, 632–635.
Hollingworth, A. (2012). Guidance of visual search by memory and knowledge. In M. D.
Dodd & J. H. Flowers (Eds.), The influence of attention, learning, and motivation on
visual search (pp. 63-89). Springer New York.
Hollingworth, A., Matsukura, M., & Luck, S. J. (2013). Visual working memory modulates
rapid eye movements to simple onset targets. Psychological Science, 24(5), 790-796.
Hollingworth, A., & Maxcey-Richard, A. M. (2013). Selective maintenance in visual working
memory does not require sustained visual attention. Journal of Experimental
Psychology: Human Perception and Performance, 39(4), 1047-1058.
Kastner, S., Pinsk, M. A., De Weerd, P., Desimone, R., & Ungerleider, L. G. (1999).
Increased activity in human visual cortex during directed attention in the absence of
visual stimulation. Neuron, 22(4), 751-761.
Kauffmann, L., Ramanoël, S., Guyader, N., Chauvin, A., & Peyrin, C. (2015). Spatial
frequency processing in scene-selective cortical regions. NeuroImage, 112, 86-95.
Kok, P., Rahnev, D., Jehee, J. F., Lau, H. C., & de Lange, F. P. (2011). Attention reverse the
effect of prediction in silencing sensory signals. Cerebral Cortex, bhr310.
BOOSTED BOUNCE !25
Lee, S. H., Kravitz, D. J., & Baker, C. I. (2013). Goal-dependent dissociation of visual and
prefrontal cortices during working memory. Nature neuroscience, 16(8), 997-999.
Luck, S. J. & Vogel, E. K. (2013). Visual working memory capacity: from psychophysics and
neurobiology to individual differences. Trends in cognitive sciences, 17(8), 391-400.
Luck, S. J., Vogel, E. K., & Shapiro, K. (1996, October 17). Word meanings can be accessed
but not reported during the attentional blink. Nature, 383, 616–618.
Martens, S., & Valchev, N. (2009). Individual differences in the attentional blink: The
important role of irrelevant information. Experimental Psychology, 56(1), 18.
Martens, S., & Wyble, B. (2010). The attentional blink: Past, present, and future of a blind
spot in perceptual awareness. Neuroscience & Biobehavioral Reviews, 34(6),
947-957.
Mayer, A. R., Dorflinger, J.M., Rao, S.M., & Seidenberg, M. (2004). Neural networks
underlying endogenous and exogenous visual–spatial orienting. Neuroimage, 23(2),
534-541.
Moore, T., Armstrong, K. M., & Fallah, M. (2003). Visuomotor origins of covert spatial
attention. Neuron, 40(4), 671-683.
Müsch, K., Engel, A. K., & Schneider, T. R. (2012). On the blink: The importance of target-
distractor similarity in eliciting an attentional Blink with faces. PloS one, 7(7),
e41257.
Noudoost, B., Chang, M. H., Steinmetz, N. A., & Moore, T. (2010). Top-down control of
visual attention. Current opinion in neurobiology, 20(2), 183-190.
Olivers, C. N. L., & Meeter, M. (2008). A Boost and bounce theory of temporal attention.
Psychological Review, 115(4), 836-863.
Patai, E. Z., Buckley, A., & Nobre, A. C. (2013). Is attention based on spatial contextual
memory preferentially guided by low spatial frequency signals?. PloS one, 8(6),
e65601.
Pomerleau, V. J., Fortier-Gauthier, U., Corriveau, I., McDonald, J. J., Dell’Acqua, R., &
Jolicœur, P. (2014). The attentional blink freezes spatial attention allocation to targets,
not distractors: Evidence from human electrophysiology. Brain research, 1559, 33-45.
Raffone, A., Srinivasan, N., & van Leeuwen, C. (2014). The interplay of attention and
consciousness in visual search, attentional blink and working memory consolidation.
BOOSTED BOUNCE !26
Philosophical Transactions of the Royal Society B: Biological Sciences, 369(1641),
20130215.
Raymond, J. E., Shapiro, K. L., & Arnell, K. M. (1992). Temporary suppression of visual
processing in an RSVP task: An attentional blink? Journal of Experimental
Psychology: Human Perception and Performance, 18(3), 849-860.
Raymond, J. E., Shapiro, K. L., & Arnell, K. M. (1995). Similarity determines the attentional
blink. Journal of Experimental psychology: Human perception and performance,
21(3), 653.
Rowe, J. B., Toni, I., Josephs, O., Frackowiak, R. S., & Passingham, R. E. (2000). The
prefrontal cortex: response selection or maintenance within working memory?.
Science, 288(5471), 1656-1660.
Ruff, C. C. (2013). Sensory processing: who's in (top-down) control?. Annals of the New
York Academy of Sciences, 1296(1), 88-107.
Saygin, A. P., & Sereno, M. I. (2008). Retinotopy and attention in human occipital, temporal,
parietal, and frontal cortex. Cerebral Cortex, 18(9), 2158-2168.
Schyns, P. G. & Oliva, A. (1994). From blobs to boundary edges: Evidence for time- and
spatial-dependent scene recognition. Psychological Science, 5(4), 195-200.
Serences, J. T., Ester, E. F., Vogel, E. K., & Awh, E. (2009). Stimulus-specific delay activity
in human primary visual cortex. Psychological Science, 20, 207–214.
Sergent, C., & Dehaene, S. (2004). Is consciousness a gradual phenomenon? Evidence for an
all-or-none bifurcation during the attentional blink. Psychological Science, 15(11),
720-728.
Silvanto, J., & Cattaneo, Z. (2010). Transcranial magnetic stimulation reveals the content of
visual short-term memory in the visual cortex. NeuroImage, 50(4), 1683-1689.
Silver, M. A., & Kastner, S. (2009). Topographic maps in human frontal and parietal cortex.
Trends in cognitive sciences, 13(11), 488-495.
Silver, M. A., Ress, D., & Heeger, D. J. (2007). Neural correlates of sustained spatial
attention in human early visual cortex. Journal of Neurophysiology, 97(1), 229-237.
Soto, D., Hodsoll, J., Rotshtein, P., & Humphreys, G. W. (2008). Automatic guidance of
attention from working memory. Trends in cognitive sciences, 12(9), 342-348.
BOOSTED BOUNCE !27
Sreenivasan, K. K., Vytlacil, J., & D’Esposito, M. (2014). Distributed and dynamic storage of
working memory stimulus information in extrastriate cortex. Journal of Cognitive
Neuroscience, 26, 1141–1153.
Summerfield, C., & Egner, T. (2009). Expectation (and attention) in visual cognition. Trends
in cognitive sciences, 13(9), 403-409.
Vermeulen, N., Godefroid, J., & Mermillod, M. (2009). Emotional modulation of attention:
fear increases but disgust reduces the attentional blink. PLoS One, 4(11), e7924.
Woodman, G. F., Carlisle, N. B., & Reinhart, R. M. G. (2013). Where do we store the
memory representations that guide attention? Journal of Vision, 13(3):1, 1-17.
BOOSTED BOUNCE !28
Appendices
Appendix 1. Normality tests
!
!
BOOSTED BOUNCE !29
!

BOOSTED BOUNCE !30
Appendix 2. Analysis of variance (ANOVA)
!
BOOSTED BOUNCE !31
!
BOOSTED BOUNCE !32
Appendix 3. t-Tests
!
BOOSTED BOUNCE !33
Appendix 4. Accuracy of T1 report
!
Appendix 5. Accuracy of T2|T1 report
!
Mean accuracy of T1 report
T1 re
triev
al %
0 %
25 %
50 %
75 %
100 %
Lag 1 Lag 3 Lag 8
NF BSF HSF Mask
Mean T2 report if T1
T2 r
etriev
al %
0 %
25 %
50 %
75 %
Lag 1 Lag 3 Lag 8
NF BSF HSF MASK
Mean T2 report if not T1
0 %
25 %
50 %
75 %
Lag 1 Lag 3 Lag 8
NF BSF HSF MASK