balance of payment bop bop is virtually an accounting identity, as a sources and uses of funds....
TRANSCRIPT

Balance of Payment BOP
BOP is virtually an accounting identity, as a sources and uses of funds.
Sources of funds are those transactions increasing the purchasing power of a nation such as export of goods, services and capital.
Uses of funds are those transactions reducing the purchasing power of a country such as import of goods, services and capital.
The Export of goods, services and capital generate demand for the currency of the exporting country and supply of foreign currency.
The import of goods, services and capital generate supply of currency of the importer and demand for foreign currency in order to settle transactions.

Comparative Advantage
refers to specialization as a key for producing goods at a minimum average cost and trading these goods for other products in which trading partner can produce more efficiently.
The ratio of productivity over wage (comparative advantage) dictates why a country such as U.S. with very high wages and high productivity in high tech trades with a country such as Mexico with low wages (absolute advantage) and low productivity.
Absolute Advantage in wage or productivity alone is a necessary but not a sufficient condition for producing goods at a minimum average cost.

COMPONENTS OF BALANCE OF PAYMENTS
Current Account Capital Account Official Foreign Exchange Reserve Statistical Error and Omissions

Economics and Current Account
The factors inducing change in current account can be summarized as follows:
-Exchange Rate ratio of two prices -Income -Government -Expectations Consumer Confidence

United States BOP
United States Balance of Payments, 2001 in billions.
Merchandise Trade: -$426.515
Balance on Service: +$78.803
Balance on Investment Income: -$19.114
Balance on Net Transfer: -$50.501
Current Account = -$417.427
Foreign Direct Investment In U.S: $157.934
Portfolio Investment in U.S: $514.212
U.S. Direct Investment Overseas: -$156.018
U.S. Portfolio Investment overseas: -$97.661
The capital account excluding reserves = +$418.467
The capital account including reserves +$455.895
Statistical Discrepancy -$39.196
+
+
+
+
+
+
-
-
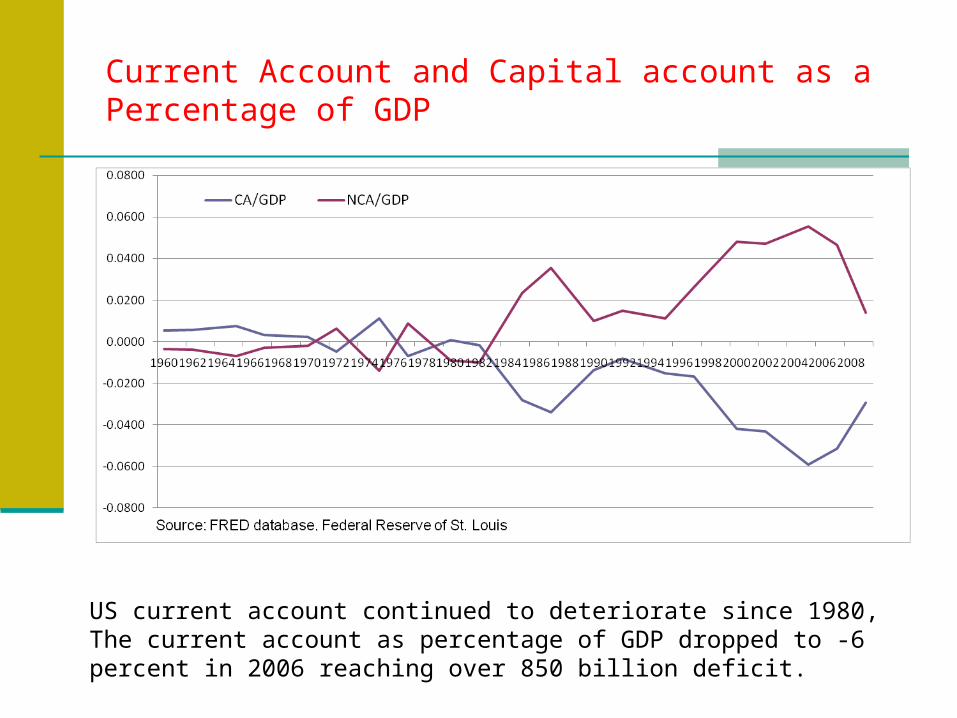
Current Account and Capital account as a Percentage of GDP
US current account continued to deteriorate since 1980, The current account as percentage of GDP dropped to -6 percent in 2006 reaching over 850 billion deficit.
Exchange Rate Pass-through Exchange Rate: As the dollar weakens against foreign currencies,
requiring more dollars to acquire foreign currency, the goods and services made in the U.S. becomes relatively more attractive to foreign buyers.
The exports in this scenario are expected to improve as the domestic goods become cheaper for foreigners to acquire and
Imports are expected to fall as foreign goods and services tend to be more expensive, thus creating an increase and improvement in the current account balance.
The above simplistic analysis assumes among other things that the pass-through from the exchange rate to prices of goods and services in the exports and imports sector of the economy is complete and simultaneous.
In a complete pass-through a currency appreciation/depreciation i.e., say 5 percent causes export price/import price to go up/down simultaneously by 5 percent.

Capital Account, Expectation and Interest Rate
The capital account tends to be interest rate and yield sensitive. Expectation also plays a major role for making foreign direct
investment and portfolio investment by U.S. individual and institutions overseas as well as their foreign counterparts in the U.S. markets.
Investors seeking far better return overseas are usually attracted to emerging economies with a promise of expected high yield.
Particularly the short-term capital account is highly sensitive to interest rate and the yield in the emerging markets stocks and bonds markets.
The so called “hot” capital in pursuit of high returns moves swiftly from one country to another and retreats at the sign of any weakness and financial crises creating substantial exposure to users and providers of capital

Exposure Related to Capital Account
The exposure in the capital account is related to the foreign direct investment and portfolio investment overseas.
The return of the original capital as well as The capital gain or loss, royalties, and Interest income are exposed to foreign exchange risk
as well as interest rate and market risk, creating opportunities for a windfall gain as a result of favorable exchange rate movements and falling interest rates or losses stemming from unfavorable exchange rate and rising interest rates.

Example: Return
Example: Suppose a U.S. money manager invests in one year par bonds denominated in British
pounds promising 8 percent interest rate, assume the pound appreciates by 5% during the year,
the return to the U.S. investor as defined in equation 2.1 is: 13.40 percent.
The returns realized by the U.S. investors investing in foreign assets (i.e., stocks, bonds, bills and
other long term instruments) are related to:
+/-
(1+ Return in $) = (1+Return in Pound) (1+ % change in exchange rate) 2.1
(1+ Return in $) = (1+.08) (1+.05) = 1.1340 Return in $ = 1.1340-1 Return in $ =.1340
Interest, dividend, capital gains (losses) Foreign exchange gains/losses

%Foreign exchange gain (loss)= (S t –S t-1)/ S t-1
Where S t and S t-1 are the exchange rates prevailing at time t and t-1 in direct
quote ($/foreign currency).
(S t-1– S t )/ S t = %Foreign exchange gain (loss) in indirect quote foreign currency per $ (f/$)

Example
Korean Won was KW900/$ on July 1997, in November the exchange rate devalued to KW1100/$. Korean Won devalued by how much from July to November?
(900-1100)/1100 = -18.2 %

Example
Strong hedge fund invested in a one year Yankee bond promising 8 percent interest rate and the Euro is currently at $1.10/€.. Estimate the return realized by the U.S. based hedge fund assuming the Euro appreciates to $1.21/€ by the end of the year.
Foreign exchange gain (loss) = (1.21 -1.10)/(1.10) = .10 (1+ return $) = (1+.08) (1+.10) = 1.188 Return $ = .1880

Risk
Ignoring the co-variation of the return in foreign currency and percentage change in dollar value of pound, the rate of return in dollars will be simply equal to 13% the sums of 8% interest and windfall gain due to favorable exchange rate movement of 5%.
The risk as measured by the variance of Equation 2.1 will be:
Volatility in $ = volatility in £ + volatility of percentage change in $/£ exchange rate

Brazil
The turbulence involving emerging market economies in general, and Brazil in particular, deeply affected country’s access to international capital markets.
The magnitude of change can been seen in the widening spreads for sovereign bonds.
In June 1997, the Brazil Treasury issued a global, thirty-year bond with a 395 basis point spread over U.S. Treasury; two years later, a global, ten-year bond was bearing an 850 basis point spread.

Brazil Current Account/GDP
After the implementation of Real Plan that pegged the Brazilian Real to US dollar at exchange rate of 1 to 1 in 1994, Brazil continued to have current account deficit as Brazilian goods for export became very expensive. Once Brazil abandoned the parity and Real devalued by 67 percent, current account as percentage of GDP turned positive in 2003.
Before and Aftermath of Real Plan
Export is very expensive aftermath of Real Plan that pegged Real to one US dollar per/Real.
After severe devaluation current account/GDP turns into surplus; as Brazilian goods (export) become very competitive

Percentage Change in Brazilian Real

Ownership of Dollar Denominated Time Deposits By Argentineans
Year Dollar Denominated Time Deposit as a percentage of Total
1992 .61 1993 .58 1994 .61 1995 .65 1996 .72 1997 .72 1998 .70 1999 .72
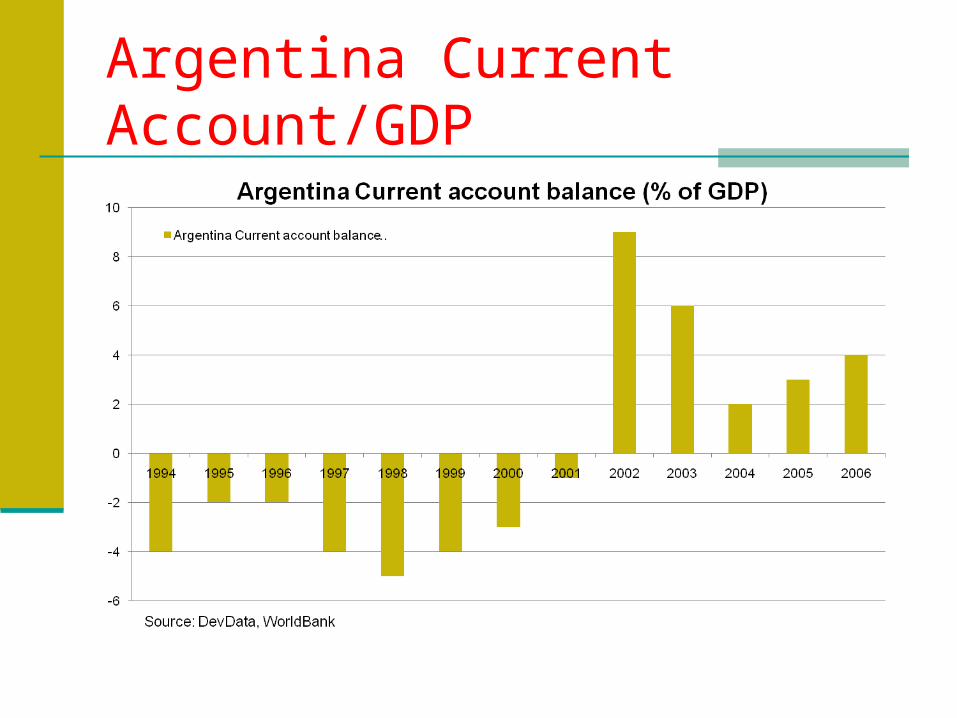
Argentina Current Account/GDP

Tale of Argentina Dollarization
As seen in the previous graph, Argentina experiences deficit in current account following dollarization that pegged Peso per dollar in 1994-200.
Argentina goods became fairly very expensive, making export uncompetitive.
After severe devaluation current account/GDP turns positive, as goods made in Argentina becomes fairly inexpensive.

Real Interest Rate Differentials: Argentina & USA

Argentina Retail and Wholesale Inflation

When the imbalance is financed primarily with large capital inflows and short-term credit from large foreign banks at times of economic growth, the return on investment is usually greater than the cost of capital.
However, as the boom ends and local currency devalues and as the cost of servicing foreign currency denominated loans skyrocket, bankruptcies mount, putting solvency of local banks in doubts due to currency and banking crises

Asian Financial Crisis
CA/GDP and the Percentage Changes in Exchange Rates
CA/GDP Exchange Rate Change country (1996)______(1996-97) Korea -4.82% -52.6% Indonesia -3.3 -49.6 Malaysia -3.73 -35.2 Philippines -4.67 -34.4 Thailand -8.51 -44.4 China 0.52 0.0 Hong Kong -2.43 0.0 Singapore 16.23 -16.1 Taiwan 4.67 -15.9 Source: Corsetti, G, P. Pesenti, and N. Roubini. 1998. "What Caused the Asian Currency and
Financial Crisis?" Japan and the World Economy, October 1999, pp. 305-73.

Causes of Financial crises S E Asia
Rigid exchange rate mechanism Moral hazard associated with financial
intermediaries Lack of transparency Lax regulation Capital account liberalization

The effects
Widening current account deficit Asset price inflation (bubble in equity and real
estate prices Appreciation of real exchange rate Rising roll-over risk Export slow down Mismatch of revenue & cost (unhedged
exposure to currency risk) Interest rate risk

Short Term Foreign Liabilities/ International Reserves Indonesia Malaysia Philippines South Korea Thailand June 1990 2.21 .22 3.18 1.06 .59 June 1994 1.73 .25 .41 1.61 .99 June 1997 1.70 .61 .85 2.o6 1.45 Source: Bank for International Settlement, International Monetary Fund
• Roll over risk refers also to the availability risk as major international banks refuse to extend credit to a borrower at a prevailing market interest rate on a maturing debt or demand and require good collateral and or substantial increase in interest rate.

Table 1 Current/ GDP
Average 1994-2001 % Exchange Rate 2002
Brazil -8.90% -35.1% Argentina -3.33% -45.6% Chile -23.47% -6.7%

Table 2 Parameter Estimates Variable DF Parameter
Estimate Standard
Error t Value Pr > |t|
Intercept 1 -0.02057 0.00253 -8.12 <.0001 Forward Interest Rate 1 0.00000335 7.507583E-7 4.46 <.0001
Forward Exchange Rate 1 0.00555 0.00148 3.76 0.0003