balance of payments - indiabudget.gov.in · 6.3 as per the balance of payment manual (fifth...
TRANSCRIPT
Balance of Payments CHAPTER
6
No country in today’s globalized world can be fully insulated from what happens
in the global economy and India is no exception to the rule. As the country is
increasingly integrated into the world, it cannot remain impervious to developments
abroad. The unfolding of the euro zone crisis and uncertainty surrounding the global
economy have impacted the Indian economy causing drop in growth, higher current
account deficit (CAD) and declining capital inflows. As in 2008, the transmission
of the crisis has been mainly through the balance-of-payments (BoP) channel. Export
growth has decelerated in the third quarter of fiscal 2011-12, while imports have
remained high, partly because of continued high international oil prices. At the
same time, foreign institutional investment flows have declined, straining the capital
account and the rupee exchange rate that touched an all-time low of ` 54.23 per
US dollar on 15 December 2011.
6.2 The situation, however, is showing signs ofimprovement in 2012. The rupee has appreciatedby 2.6 per cent in January 2012 due to ReserveBank of India (RBI) intervention, measures toaugment supply of foreign exchange in the domesticmarket, steps to curb speculative activities, andgeneral improvement in India's economic outlook.FII inflows have resumed, lending support to thebalance of payments and exchange rate. The globaloutlook, however, remains uncertain with thesituation in Greece teetering on the brink andincreasing risk that the contagion will spread to thePortuguese economy. Such a scenario could haveserious repercussions for the Indian economy.
BALANCE OF PAYMENT (BOP)6.3 As per the Balance of Payment Manual (FifthEdition), BoP comprises current account, capitalaccount, errors and omissions, and change in foreignexchange reserves. Under current account of theBoP, transactions are classified into merchandise(exports and imports) and invisibles. Invisible
transactions are further classified into threecategories. The first component is Servicescomprising travel, transportation, insurance,government not included elsewhere (GNIE), andmiscellaneous. Miscellaneous services includecommunication, construction, financial, software,news agency, royalties, management, and businessservices. The second component of invisibles isincome. Transfers (grants, gifts, remittances, etc.)which do not have any quid pro quo form the thirdcategory of invisibles.
6.4 Under capital account, capital inflows can beclassified by instrument (debt or equity) and maturity(short- or long-term). The main components ofcapital account include foreign investment, loans,and banking capital. Foreign investment comprisingforeign direct investment (FDI) and portfolioinvestment consisting of foreign institutionalinvestor (FIIs) investment and American depositoryreceipts /global depository receipts (ADRs/GDRs)represents non-debt liabilities. Loans (externalassistance, external commercial borrowings [ECB],
http://indiabudget.nic.in
132 Economic Survey 2011-12
and trade credit) and banking capital including non-resident Indian (NRI) deposits are debt liabilities.
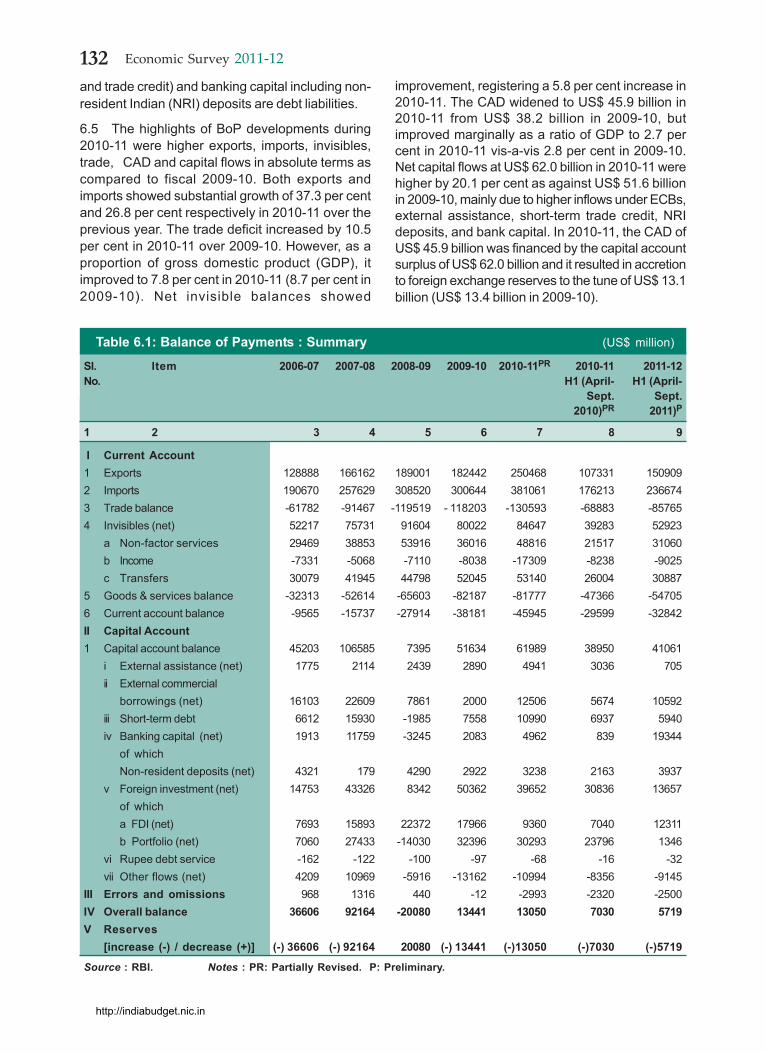
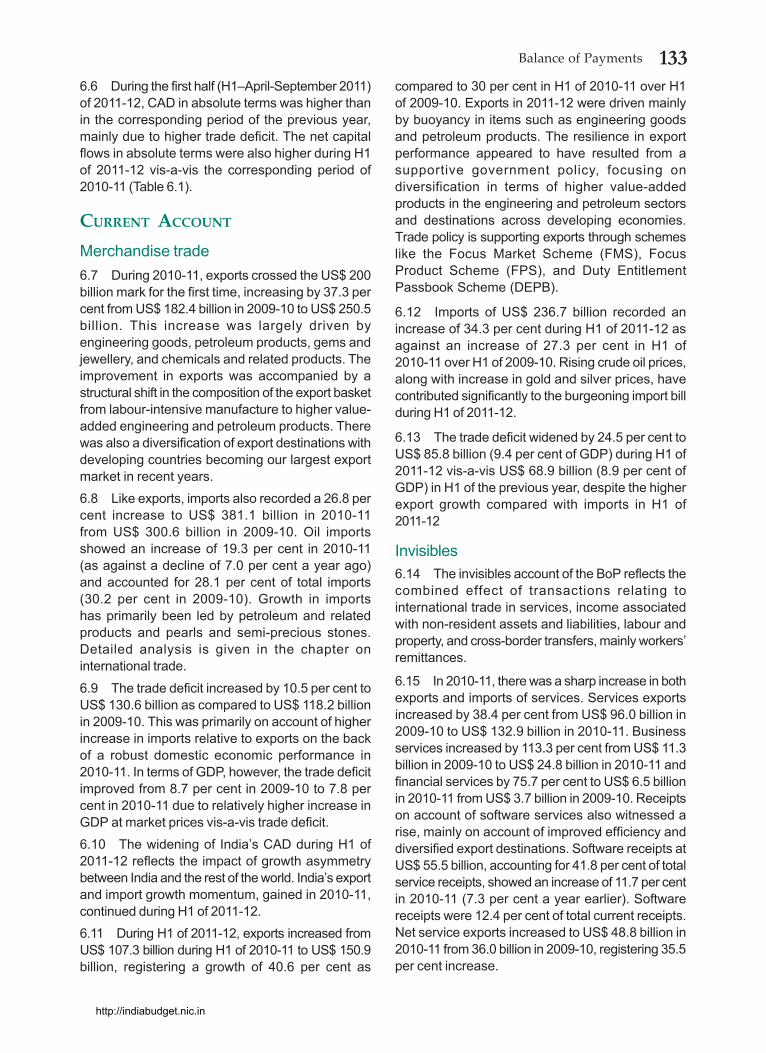
6.5 The highlights of BoP developments during2010-11 were higher exports, imports, invisibles,trade, CAD and capital flows in absolute terms ascompared to fiscal 2009-10. Both exports andimports showed substantial growth of 37.3 per centand 26.8 per cent respectively in 2010-11 over theprevious year. The trade deficit increased by 10.5per cent in 2010-11 over 2009-10. However, as aproportion of gross domestic product (GDP), itimproved to 7.8 per cent in 2010-11 (8.7 per cent in2009-10). Net invisible balances showed
improvement, registering a 5.8 per cent increase in2010-11. The CAD widened to US$ 45.9 billion in2010-11 from US$ 38.2 billion in 2009-10, butimproved marginally as a ratio of GDP to 2.7 percent in 2010-11 vis-a-vis 2.8 per cent in 2009-10.Net capital flows at US$ 62.0 billion in 2010-11 werehigher by 20.1 per cent as against US$ 51.6 billionin 2009-10, mainly due to higher inflows under ECBs,external assistance, short-term trade credit, NRIdeposits, and bank capital. In 2010-11, the CAD ofUS$ 45.9 billion was financed by the capital accountsurplus of US$ 62.0 billion and it resulted in accretionto foreign exchange reserves to the tune of US$ 13.1billion (US$ 13.4 billion in 2009-10).
Table 6.1: Balance of Payments : Summary (US$ million)
Sl. Item 2006-07 2007-08 2008-09 2009-10 2010-11PR 2010-11 2011-12No. H1 (April- H1 (April-
Sept. Sept.2010)PR 2011)P
1 2 3 4 5 6 7 8 9
I Current Account1 Exports 128888 166162 189001 182442 250468 107331 1509092 Imports 190670 257629 308520 300644 381061 176213 2366743 Trade balance -61782 -91467 -119519 - 118203 -130593 -68883 -857654 Invisibles (net) 52217 75731 91604 80022 84647 39283 52923
a Non-factor services 29469 38853 53916 36016 48816 21517 31060b Income -7331 -5068 -7110 -8038 -17309 -8238 -9025c Transfers 30079 41945 44798 52045 53140 26004 30887
5 Goods & services balance -32313 -52614 -65603 -82187 -81777 -47366 -547056 Current account balance -9565 -15737 -27914 -38181 -45945 -29599 -32842II Capital Account1 Capital account balance 45203 106585 7395 51634 61989 38950 41061
i External assistance (net) 1775 2114 2439 2890 4941 3036 705ii External commercial
borrowings (net) 16103 22609 7861 2000 12506 5674 10592iii Short-term debt 6612 15930 -1985 7558 10990 6937 5940iv Banking capital (net) 1913 11759 -3245 2083 4962 839 19344
of whichNon-resident deposits (net) 4321 179 4290 2922 3238 2163 3937
v Foreign investment (net) 14753 43326 8342 50362 39652 30836 13657of whicha FDI (net) 7693 15893 22372 17966 9360 7040 12311b Portfolio (net) 7060 27433 -14030 32396 30293 23796 1346
vi Rupee debt service -162 -122 -100 -97 -68 -16 -32vii Other flows (net) 4209 10969 -5916 -13162 -10994 -8356 -9145
III Errors and omissions 968 1316 440 -12 -2993 -2320 -2500IV Overall balance 36606 92164 -20080 13441 13050 7030 5719V Reserves
[increase (-) / decrease (+)] (-) 36606 (-) 92164 20080 (-) 13441 (-)13050 (-)7030 (-)5719
Source : RBI. Notes : PR: Partially Revised. P: Preliminary.
http://indiabudget.nic.in
133Balance of Payments
6.6 During the first half (H1–April-September 2011)of 2011-12, CAD in absolute terms was higher thanin the corresponding period of the previous year,mainly due to higher trade deficit. The net capitalflows in absolute terms were also higher during H1of 2011-12 vis-a-vis the corresponding period of2010-11 (Table 6.1).
CURRENT ACCOUNT
Merchandise trade6.7 During 2010-11, exports crossed the US$ 200billion mark for the first time, increasing by 37.3 percent from US$ 182.4 billion in 2009-10 to US$ 250.5billion. This increase was largely driven byengineering goods, petroleum products, gems andjewellery, and chemicals and related products. Theimprovement in exports was accompanied by astructural shift in the composition of the export basketfrom labour-intensive manufacture to higher value-added engineering and petroleum products. Therewas also a diversification of export destinations withdeveloping countries becoming our largest exportmarket in recent years.6.8 Like exports, imports also recorded a 26.8 percent increase to US$ 381.1 billion in 2010-11from US$ 300.6 billion in 2009-10. Oil importsshowed an increase of 19.3 per cent in 2010-11(as against a decline of 7.0 per cent a year ago)and accounted for 28.1 per cent of total imports(30.2 per cent in 2009-10). Growth in importshas primarily been led by petroleum and relatedproducts and pearls and semi-precious stones.Detailed analysis is given in the chapter oninternational trade.
6.9 The trade deficit increased by 10.5 per cent toUS$ 130.6 billion as compared to US$ 118.2 billionin 2009-10. This was primarily on account of higherincrease in imports relative to exports on the backof a robust domestic economic performance in2010-11. In terms of GDP, however, the trade deficitimproved from 8.7 per cent in 2009-10 to 7.8 percent in 2010-11 due to relatively higher increase inGDP at market prices vis-a-vis trade deficit.6.10 The widening of India’s CAD during H1 of2011-12 reflects the impact of growth asymmetrybetween India and the rest of the world. India’s exportand import growth momentum, gained in 2010-11,continued during H1 of 2011-12.6.11 During H1 of 2011-12, exports increased fromUS$ 107.3 billion during H1 of 2010-11 to US$ 150.9billion, registering a growth of 40.6 per cent as
compared to 30 per cent in H1 of 2010-11 over H1of 2009-10. Exports in 2011-12 were driven mainlyby buoyancy in items such as engineering goodsand petroleum products. The resilience in exportperformance appeared to have resulted from asupportive government policy, focusing ondiversification in terms of higher value-addedproducts in the engineering and petroleum sectorsand destinations across developing economies.Trade policy is supporting exports through schemeslike the Focus Market Scheme (FMS), FocusProduct Scheme (FPS), and Duty EntitlementPassbook Scheme (DEPB).
6.12 Imports of US$ 236.7 billion recorded anincrease of 34.3 per cent during H1 of 2011-12 asagainst an increase of 27.3 per cent in H1 of2010-11 over H1 of 2009-10. Rising crude oil prices,along with increase in gold and silver prices, havecontributed significantly to the burgeoning import billduring H1 of 2011-12.
6.13 The trade deficit widened by 24.5 per cent toUS$ 85.8 billion (9.4 per cent of GDP) during H1 of2011-12 vis-a-vis US$ 68.9 billion (8.9 per cent ofGDP) in H1 of the previous year, despite the higherexport growth compared with imports in H1 of2011-12
Invisibles6.14 The invisibles account of the BoP reflects thecombined effect of transactions relating tointernational trade in services, income associatedwith non-resident assets and liabilities, labour andproperty, and cross-border transfers, mainly workers’remittances.
6.15 In 2010-11, there was a sharp increase in bothexports and imports of services. Services exportsincreased by 38.4 per cent from US$ 96.0 billion in2009-10 to US$ 132.9 billion in 2010-11. Businessservices increased by 113.3 per cent from US$ 11.3billion in 2009-10 to US$ 24.8 billion in 2010-11 andfinancial services by 75.7 per cent to US$ 6.5 billionin 2010-11 from US$ 3.7 billion in 2009-10. Receiptson account of software services also witnessed arise, mainly on account of improved efficiency anddiversified export destinations. Software receipts atUS$ 55.5 billion, accounting for 41.8 per cent of totalservice receipts, showed an increase of 11.7 per centin 2010-11 (7.3 per cent a year earlier). Softwarereceipts were 12.4 per cent of total current receipts.Net service exports increased to US$ 48.8 billion in2010-11 from 36.0 billion in 2009-10, registering 35.5per cent increase.
http://indiabudget.nic.in
134 Economic Survey 2011-12
6.16 Private transfer receipts, comprising mainlyremittances from Indians working overseas, alsoincreased by 3.7 per cent to US$ 55.6 billion in2010-11 from US$ 53.6 billion in the previous year.Private transfer receipts constituted 12.4 per cent ofcurrent receipts (15.5 per cent in 2009-10). A modestincrease was observed in other categories of receipts(transportation, insurance, communication, andGNIE).
6.17 Invisible payments increased by 36.2 per centfrom US$ 83.4 billion in 2009-10 to US$ 113.6 billionin 2010-11. The growth of 36.2 per cent in invisiblepayments outstripped the 21.3 per cent growthrecorded in 2010-11. Increase in invisible paymentswas mainly attributed to business services, financialservices, travel, and investment income. Even though
the surplus on account of service-sector exports wassignificantly higher in 2010-11, growth in net receiptson account of transfers was moderate and net outflowof investment income increased during the sameperiod. As a result, the net invisible balance (receiptsminus payments) posted an increase of 5.5 per centto US$ 84.6 billion in 2010-11 as against US$ 80.0billion in 2009-10. As a proportion of GDP, netinvisible balance declined from 5.9 per centin 2009-10 to 5.0 per cent in 2010-11. At this level,the invisible surplus financed 64.8 per cent of tradedeficit as against 67.7 per cent during 2009-10.
6.18 During H1 of 2011-12, invisible receiptsrecorded an increase of 17.4 per cent to US$ 106.0billion vis-a-vis US$ 90.3 billion during thecorresponding period of 2010-11. All broad categories
Table 6.2 : Selected Indicators of the External SectorSl. Item 2006-07 2007-08 2008-09 2009-10 2010-11PR 2010-11 2011-12No. H1 (April- H1 (April-
Sept. 2010)PR Sept. 2011)P
1 2 3 4 5 6 7 8 91 Growth of exports – BoP (%) 22.6 28.9 13.7 -3.5 37.3 30.0 40.6
2 Growth of imports – BoP (%) 21.4 35.1 19.8 -2.6 26.7 27.3 34.3
3 Growth of non-factor services
(credit) (%) 28.0 22.4 17.3 -9.4 38.4 32.7 17.1
4 Growth of non-factor services
(debit) (%) 28.5 16.2 1.1 15.3 40.0 48.3 1.0
5 Exports/imports-BoP (%) 67.6 64.5 61.3 60.7 65.7 60.9 63.8
6 Exports/imports of goods and
services (%) 86.2 83.0 81.8 77.2 82.4 77.7 80.0
7 Import cover of FER (No. of months) 12.5 14.4 9.8 11.1 9.6 10.0 7.9
8 External assistance (net)/ TC (%) 3.9 2.0 33.0 5.6 8.0 7.8 1.7
9 ECB (net)/TC (%) 35.6 21.2 106.3 3.9 20.2 14.6 25.8
10 NRI deposits / TC (%) 9.6 0.2 58.0 5.7 5.2 5.6 9.6
As per cent of GDP mp
11 Exports 13.6 13.4 15.2 13.4 14.8 13.9 16.5
12 Imports 20.1 20.8 25.0 22.0 22.6 22.8 25.8
13 Trade balance -6.5 -7.4 -9.7 -8.7 -7.8 -8.9 -9.4
14 Invisible balance 5.5 6.1 7.5 5.9 5.0 5.1 5.8
15 Goods and services balance -3.4 -4.2 -5.3 -6.0 -4.9 -6.1 -6.0
16 Current account balance -1.0 -1.3 -2.3 -2.8 -2.7 -3.8 -3.6
17 ECBs 1.7 1.8 0.6 0.1 0.7 0.7 1.2
18 FDI (net) 0.8 1.3 1.8 1.3 0.6 0.9 1.3
19 Portfolio investment (net) 0.7 2.2 -1.2 2.4 1.8 3.1 0.1
20 Total capital account (net) 4.7 8.6 0.5 3.8 3.7 5.0 4.5
Source : RBI. PR: Partially Revised. P: Preliminary.Notes: FER: Foreign Exchange Reserves; TC: Total Capital Flow (net); GDPmp: Gross Domestic Product at current market prices.
http://indiabudget.nic.in
135Balance of Payments
-12
-10
-8
-6
-4
-2
0
2
4
6
8
10
2006-07 2007-08 2008-09
As
per
cent
of
GD
P
Currentaccountbalance
Current account balance, goods and services balance, trade balance,invisibles balance and net capital inflows as a per cent of GDP during2006-07 to 2010-11
Figure 6.1
Year
2009-10
Goods &servicesbalance
Tradebalance
Invisiblesbalance
Net capitalinflows
2010-11
-6.5-7.4
-9.7-8.7
-7.8
5.5 6.17.5
5.95.0
8.6
-1.0 -1.3-2.3 -2.8 -2.7
-3.4 -4.2-5.3 -6.0
-4.9
4.7
0.5
3.8 3.7
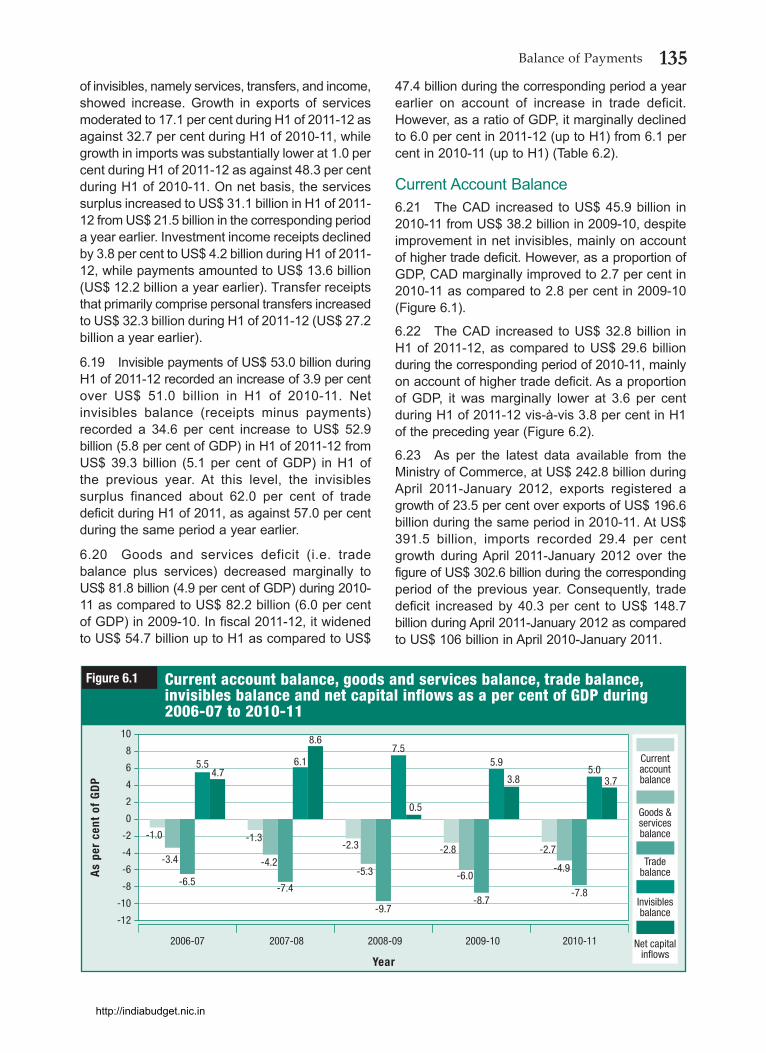
of invisibles, namely services, transfers, and income,showed increase. Growth in exports of servicesmoderated to 17.1 per cent during H1 of 2011-12 asagainst 32.7 per cent during H1 of 2010-11, whilegrowth in imports was substantially lower at 1.0 percent during H1 of 2011-12 as against 48.3 per centduring H1 of 2010-11. On net basis, the servicessurplus increased to US$ 31.1 billion in H1 of 2011-12 from US$ 21.5 billion in the corresponding perioda year earlier. Investment income receipts declinedby 3.8 per cent to US$ 4.2 billion during H1 of 2011-12, while payments amounted to US$ 13.6 billion(US$ 12.2 billion a year earlier). Transfer receiptsthat primarily comprise personal transfers increasedto US$ 32.3 billion during H1 of 2011-12 (US$ 27.2billion a year earlier).
6.19 Invisible payments of US$ 53.0 billion duringH1 of 2011-12 recorded an increase of 3.9 per centover US$ 51.0 billion in H1 of 2010-11. Netinvisibles balance (receipts minus payments)recorded a 34.6 per cent increase to US$ 52.9billion (5.8 per cent of GDP) in H1 of 2011-12 fromUS$ 39.3 billion (5.1 per cent of GDP) in H1 ofthe previous year. At this level, the invisiblessurplus financed about 62.0 per cent of tradedeficit during H1 of 2011, as against 57.0 per centduring the same period a year earlier.
6.20 Goods and services deficit (i.e. tradebalance plus services) decreased marginally toUS$ 81.8 billion (4.9 per cent of GDP) during 2010-11 as compared to US$ 82.2 billion (6.0 per centof GDP) in 2009-10. In fiscal 2011-12, it widenedto US$ 54.7 billion up to H1 as compared to US$
47.4 billion during the corresponding period a yearearlier on account of increase in trade deficit.However, as a ratio of GDP, it marginally declinedto 6.0 per cent in 2011-12 (up to H1) from 6.1 percent in 2010-11 (up to H1) (Table 6.2).
Current Account Balance6.21 The CAD increased to US$ 45.9 billion in2010-11 from US$ 38.2 billion in 2009-10, despiteimprovement in net invisibles, mainly on accountof higher trade deficit. However, as a proportion ofGDP, CAD marginally improved to 2.7 per cent in2010-11 as compared to 2.8 per cent in 2009-10(Figure 6.1).
6.22 The CAD increased to US$ 32.8 billion inH1 of 2011-12, as compared to US$ 29.6 billionduring the corresponding period of 2010-11, mainlyon account of higher trade deficit. As a proportionof GDP, it was marginally lower at 3.6 per centduring H1 of 2011-12 vis-à-vis 3.8 per cent in H1of the preceding year (Figure 6.2).
6.23 As per the latest data available from theMinistry of Commerce, at US$ 242.8 billion duringApril 2011-January 2012, exports registered agrowth of 23.5 per cent over exports of US$ 196.6billion during the same period in 2010-11. At US$391.5 billion, imports recorded 29.4 per centgrowth during April 2011-January 2012 over thefigure of US$ 302.6 billion during the correspondingperiod of the previous year. Consequently, tradedeficit increased by 40.3 per cent to US$ 148.7billion during April 2011-January 2012 as comparedto US$ 106 billion in April 2010-January 2011.
http://indiabudget.nic.in

136 Economic Survey 2011-12
CAPITAL ACCOUNT
6.24 Capital inflows can be classified by instrument(debt or equity) and maturity (short-term or long-term). The main components of capital accountinclude foreign investment, loans, and bankingcapital. Foreign investment comprising FDI andportfolio investment represents non-debt liabilities,while loans (external assistance, ECBs, and tradecredit) and banking capital including NRI depositsare debt liabilities. In India, FDI is preferred overportfolio flows as the FDI flows tend to be morestable than portfolio and other forms of capital flows.Rupee-denominated debt is preferred over foreigncurrency debt and medium- and long-term debt ispreferred over short-term.6.25 Push and pull factors explain internationalcapital flows. Push factors are external to aneconomy and inter alia include parameters like lowinterest rates, abundant liquidity, slow growth, orlack of investment opportunities in advancedeconomies. Pull factors like robust economicperformance and improved investment climate as aresult of economic reforms in emerging economiesare internal to an economy.
6.26 In 2010-11, both gross inflows of US$ 499.4billion and outflows of US$ 437.4 billion under thecapital account were higher than gross inflows ofUS$ 345.8 billion and outflows of US$ 294.1 billionin the preceding year. In net terms, capital inflowsincreased by 20.2 per cent to US$ 62.0 billion (3.7per cent of GDP) in 2010-11 vis-a-vis US$ 51.6 billion(3.8 per cent of GDP) in 2009-10 mainly on accountof trade credit and loans (ECBs and banking capital).
6.27 The Non-debt flows or foreign investmentcomprising FDI and portfolio investment (ADRs/GDRsand FIIs) on net basis decreased by 21.4 per centfrom US$ 50.4 billion in 2009-10 to US$ 39.7 billionin 2010-11. Decline in foreign investment was offsetby the debt flows component of loans and bankingcapital which increased by 130.3 per cent from US$14.5 billion in 2009-10 to US$ 33.4 billion in 2010-11.
6.28 Inward FDI showed a declining trend whileoutward FDI showed an increasing trend in 2010-11vis-a-vis 2009-10. Inward FDI declined from US$33.1 billion in 2009-10 to US$ 25.9 billion in 2010-11. Sector-wise, deceleration during 2010-11 wasmainly on account of lower FDI inflows undermanufacturing, financial services, electricity, andconstruction. Country-wise, investment routedthrough Mauritius remained the largest componentof FDI inflows to India in 2010-11 followed bySingapore and the Netherlands. Outward FDIincreased from US$ 15.1 billion in 2009-10 to US$16.5 billion in 2010-11. With lower inward FDI andrise in outward FDI, net FDI (inward minus outward)to India stood considerably lower at US$ 9.4 billionduring 2010-11 (US$ 18.0 billion a year earlier).
6.29 Net portfolio investment flow witnessedmarginal decline to US$ 30.3 billion during 2010-11as against US$ 32.4 billion in 2009-10. This wasdue to decline in ADRs/GDRs to US$ 2.0 billion in2010-11 from US$ 3.3 billion in 2009-10, even thoughFII inflows showed marginal increase to US$ 29.4billion in 2010-11 from US$ 29.0 billion in 2009-10.
6.30 Other categories of capital flows, namelydebt flows of ECBs, banking capital, and short-
-12
-10
-8
-6
-4
-2
0
2
4
6
8
10
2010-11 H1 (Apr - Sep 2010)
As
per
cent
of
GD
PCurrent account balance, goods and services balance, trade balance,invisibles balance and net capital inflows as a per cent of GDP during H1of 2010-11 and 2011-12
Figure 6.2
Year
2011-12 H1 (Apr - Sep 2011)
Currentaccountbalance
Goods &servicesbalance
Tradebalance
Invisiblesbalance
Net capitalinflows
-3.8 -3.6
-6.1 -6.0
-8.9 -9.4
5.1 5.85.0 4.5
http://indiabudget.nic.in
137Balance of Payments
term credit recorded a significant increase in 2010-11. Net ECB inflow increased significantly to US$12.5 billion in 2010-11 as against US$ 2.0 billion in2009-10. Similarly, short-term trade credit increasedfrom US$ 7.6 billion in 2009-10 to US$ 11 billion in2010-11, indicating strong domestic economicperformance. Further, external assistance increasedfrom US$ 2.9 billion in 2009-10 to US$ 4.9 billionin 2010-11.
6.31 The capital account surplus improved by20.1 per cent to US$ 62.0 billion during 2010-11from US$ 51.6 billion in 2009-10. However, as aproportion of GDP, it declined marginally to 3.7per cent in 2010-11 from 3.8 per cent in 2009-10.
6.32 Net accretion to reserves (on BoP basis) in2010-11, at US$ 13.1 billion, remained at more orless the same level as in 2009-10 (US$ 13.4 billion).
6.33 In fiscal 2011-12 (up to H1), under the capitalaccount both gross inflows of US$ 244.2 billion andoutflows of US$ 203.1 billion were higher than thegross inflows of US$ 207.5 billion and outflows ofUS$ 168.5 billion during the same period a yearago. In net terms, capital inflows increasedmoderately to US$ 41.1 billion in H1 of 2011-12 asagainst US$ 39.0 billion in H1 of 2010-11. While netFDI was higher at US$ 12.3 billion in H1 of 2011-12as against US$ 7 billion in H1 of 2010-11, net portfolioinvestment substantially declined from US$ 23.8billion to US$ 1.3 billion during the same period.This was on account of a major decline in FII flowsto US$ 0.9 billion in 2011-12 (up to H1) from US$22.3 billion in H1 of 2010-11. Other capital flows,including ECBs and banking capital, alsosubstantially increased. Net capital inflow as aproportion of GDP has shown moderation from 5.0per cent in H1 of 2010-11 to 4.5 per cent in H1 of2011-12.
6.34 Net accretion to reserves (on BoP basis)during H1 of 2011-12 was lower at US$ 5.7 billionas compared to US$ 7 billion in H1 of the previousyear mainly due to widening of the CAD.
6.35 As per the latest available information oncapital inflows, FDI inflows were US$ 35.3 billionduring April-December 2011 (US$ 16.0 billion in thecorresponding period of the preceding year).Portfolio inflows fell sharply to US$ 3.3 billionduring April-December 2011 from US$ 31.3 billiona year earlier mainly reflecting uncertainty and riskin the global economy on account of the euro zonecrisis.
FOREIGN EXCHANGE RESERVES6.36 India’s foreign exchange reserves compriseforeign currency assets (FCA), gold, special drawingrights (SDRs), and reserve tranche position (RTP) inthe International Monetary Fund (IMF). The level offoreign exchange reserves is largely the outcome ofthe RBI’s intervention in the foreign exchange marketto smoothen exchange rate volatility and valuationchanges due to movement of the US dollar againstother major currencies of the world. Foreignexchange reserves are accumulated when there isabsorption of the excess foreign exchange flows bythe RBI through intervention in the foreign exchangemarket, aid receipts, and interest receipts andfunding from the International Bank forReconstruction and Development (IBRD), AsianDevelopment Bank (ADB), International DevelopmentAssociation (IDA), etc.
6.37 FCAs are maintained in major currencies likethe US dollar, euro, pound sterling, Australian dollar,and Japanese yen. Both the US dollar and euro areintervention currencies; however, reserves aredenominated and expressed in the US dollar only,which is the international numeraire for the purpose.The movement of the US dollar against othercurrencies in which FCAs are held therefore impactsthe level of reserves in US dollar terms. The level ofreserves declines when the US dollar appreciatesagainst major international currencies and vice versa.The twin objectives of safety and liquidity have beenthe guiding principles of foreign exchange reservesmanagement in India with return optimization beingembedded strategy within this framework.
India’s foreign exchange reserves6.38 Beginning from a low level of US$ 5.8 billionat end March 1991, India’s foreign exchange reservesgradually increased to US$ 25.2 billion by end March1995, US$ 38.0 billion by end March 2000, US$ 113.0billion by end March 2004, and US$ 199.2 billion byend March 2007. The reserves stood at US$ 314.6billion at end May 2008, before declining to US$252.0 billion at the end of March 2009. The declinein reserves in 2008-09 was inter alia a fallout of theglobal crisis and strengthening of the US dollar vis-à-vis other international currencies. During 2009-10,the level of foreign exchange reserves increased toUS$ 279.1 billion at end March 2010, mainly onaccount of valuation gain as the US dollardepreciated against most of the major internationalcurrencies. In fiscal 2010-11, foreign exchangereserves have shown an increasing trend and reached
http://indiabudget.nic.in
138 Economic Survey 2011-12
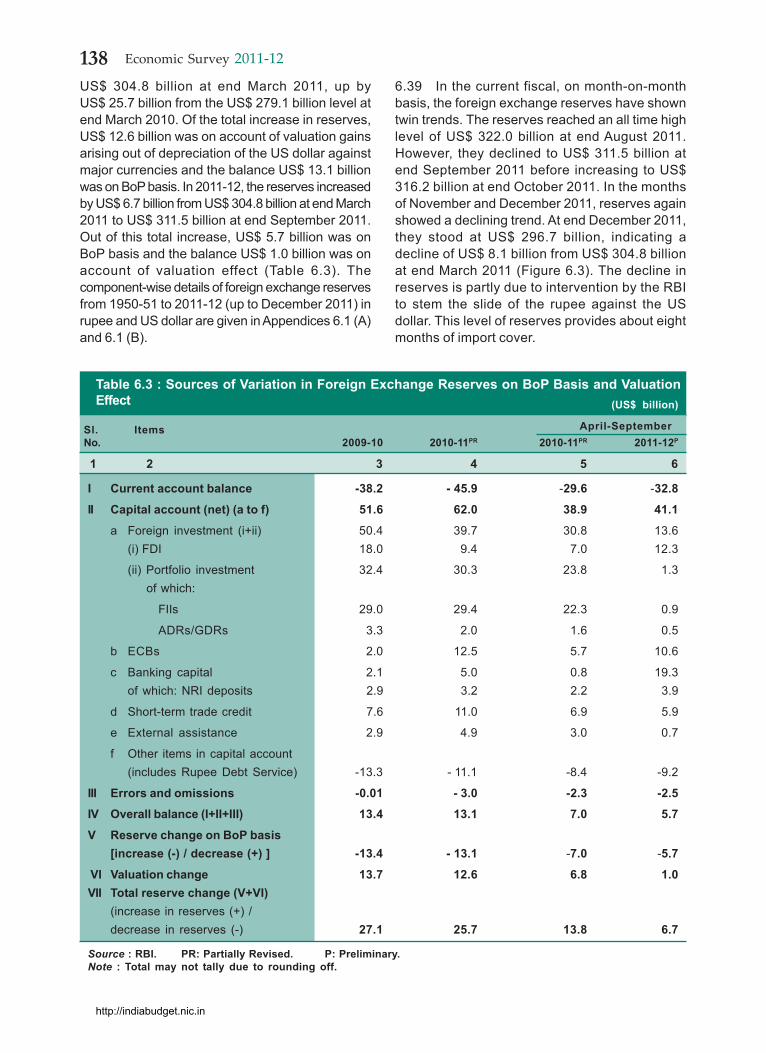
US$ 304.8 billion at end March 2011, up byUS$ 25.7 billion from the US$ 279.1 billion level atend March 2010. Of the total increase in reserves,US$ 12.6 billion was on account of valuation gainsarising out of depreciation of the US dollar againstmajor currencies and the balance US$ 13.1 billionwas on BoP basis. In 2011-12, the reserves increasedby US$ 6.7 billion from US$ 304.8 billion at end March2011 to US$ 311.5 billion at end September 2011.Out of this total increase, US$ 5.7 billion was onBoP basis and the balance US$ 1.0 billion was onaccount of valuation effect (Table 6.3). Thecomponent-wise details of foreign exchange reservesfrom 1950-51 to 2011-12 (up to December 2011) inrupee and US dollar are given in Appendices 6.1 (A)and 6.1 (B).
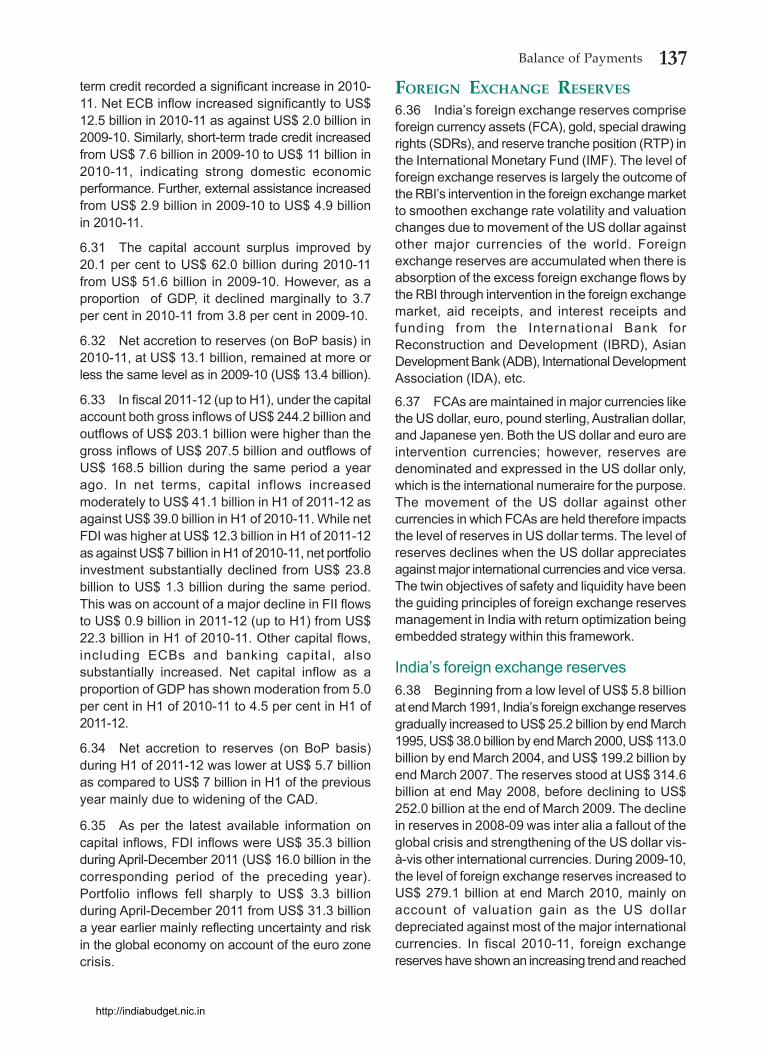
6.39 In the current fiscal, on month-on-monthbasis, the foreign exchange reserves have showntwin trends. The reserves reached an all time highlevel of US$ 322.0 billion at end August 2011.However, they declined to US$ 311.5 billion atend September 2011 before increasing to US$316.2 billion at end October 2011. In the monthsof November and December 2011, reserves againshowed a declining trend. At end December 2011,they stood at US$ 296.7 billion, indicating adecline of US$ 8.1 billion from US$ 304.8 billionat end March 2011 (Figure 6.3). The decline inreserves is partly due to intervention by the RBIto stem the slide of the rupee against the USdollar. This level of reserves provides about eightmonths of import cover.
Table 6.3 : Sources of Variation in Foreign Exchange Reserves on BoP Basis and ValuationEffect (US$ billion)
Sl. Items April-SeptemberNo. 2009-10 2010-11PR 2010-11PR 2011-12P
1 2 3 4 5 6
I Current account balance -38.2 - 45.9 -29.6 -32.8
II Capital account (net) (a to f) 51.6 62.0 38.9 41.1
a Foreign investment (i+ii) 50.4 39.7 30.8 13.6(i) FDI 18.0 9.4 7.0 12.3
(ii) Portfolio investment 32.4 30.3 23.8 1.3of which:
FIIs 29.0 29.4 22.3 0.9
ADRs/GDRs 3.3 2.0 1.6 0.5
b ECBs 2.0 12.5 5.7 10.6
c Banking capital 2.1 5.0 0.8 19.3of which: NRI deposits 2.9 3.2 2.2 3.9
d Short-term trade credit 7.6 11.0 6.9 5.9
e External assistance 2.9 4.9 3.0 0.7
f Other items in capital account(includes Rupee Debt Service) -13.3 - 11.1 -8.4 -9.2
III Errors and omissions -0.01 - 3.0 -2.3 -2.5
IV Overall balance (I+II+III) 13.4 13.1 7.0 5.7
V Reserve change on BoP basis[increase (-) / decrease (+) ] -13.4 - 13.1 -7.0 -5.7
VI Valuation change 13.7 12.6 6.8 1.0VII Total reserve change (V+VI)
(increase in reserves (+) /decrease in reserves (-) 27.1 25.7 13.8 6.7
Source : RBI. PR: Partially Revised. P: Preliminary.Note : Total may not tally due to rounding off.
http://indiabudget.nic.in
139Balance of Payments
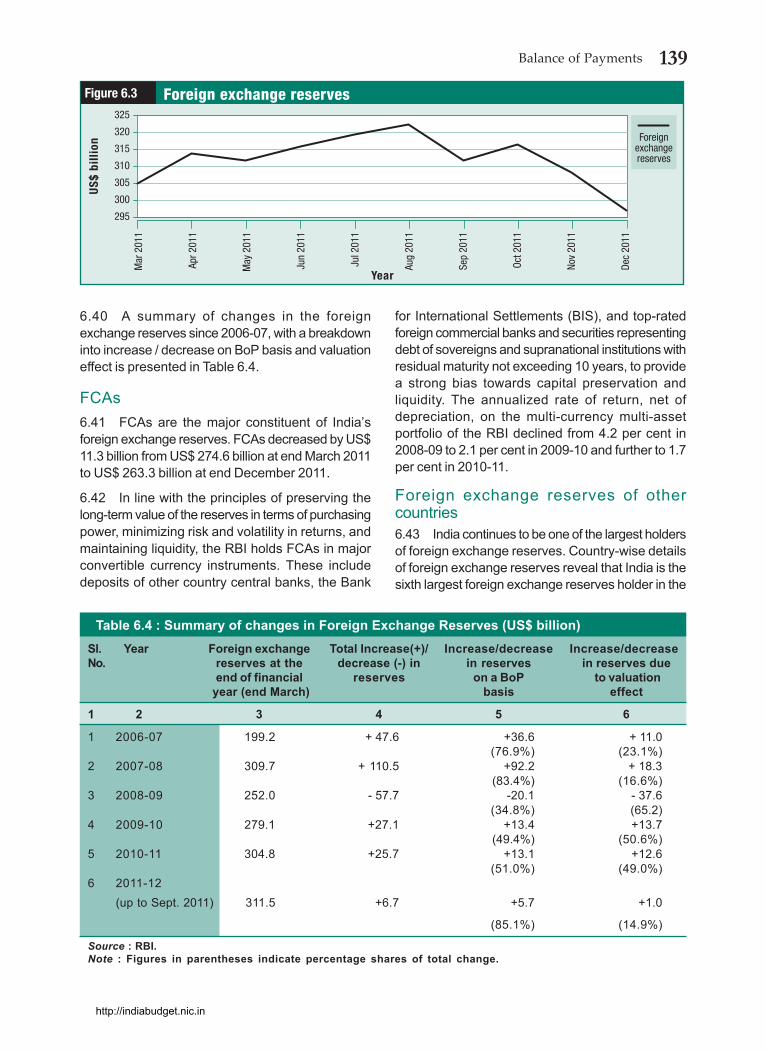
6.40 A summary of changes in the foreignexchange reserves since 2006-07, with a breakdowninto increase / decrease on BoP basis and valuationeffect is presented in Table 6.4.
FCAs6.41 FCAs are the major constituent of India’sforeign exchange reserves. FCAs decreased by US$11.3 billion from US$ 274.6 billion at end March 2011to US$ 263.3 billion at end December 2011.
6.42 In line with the principles of preserving thelong-term value of the reserves in terms of purchasingpower, minimizing risk and volatility in returns, andmaintaining liquidity, the RBI holds FCAs in majorconvertible currency instruments. These includedeposits of other country central banks, the Bank
for International Settlements (BIS), and top-ratedforeign commercial banks and securities representingdebt of sovereigns and supranational institutions withresidual maturity not exceeding 10 years, to providea strong bias towards capital preservation andliquidity. The annualized rate of return, net ofdepreciation, on the multi-currency multi-assetportfolio of the RBI declined from 4.2 per cent in2008-09 to 2.1 per cent in 2009-10 and further to 1.7per cent in 2010-11.
Foreign exchange reserves of othercountries6.43 India continues to be one of the largest holdersof foreign exchange reserves. Country-wise detailsof foreign exchange reserves reveal that India is thesixth largest foreign exchange reserves holder in the
Table 6.4 : Summary of changes in Foreign Exchange Reserves (US$ billion)Sl. Year Foreign exchange Total Increase(+)/ Increase/decrease Increase/decreaseNo. reserves at the decrease (-) in in reserves in reserves due
end of financial reserves on a BoP to valuation year (end March) basis effect
1 2 3 4 5 6
1 2006-07 199.2 + 47.6 +36.6 + 11.0(76.9%) (23.1%)
2 2007-08 309.7 + 110.5 +92.2 + 18.3 (83.4%) (16.6%)
3 2008-09 252.0 - 57.7 -20.1 - 37.6(34.8%) (65.2)
4 2009-10 279.1 +27.1 +13.4 +13.7 (49.4%) (50.6%)
5 2010-11 304.8 +25.7 +13.1 +12.6(51.0%) (49.0%)
6 2011-12(up to Sept. 2011) 311.5 +6.7 +5.7 +1.0
(85.1%) (14.9%)
Source : RBI.Note : Figures in parentheses indicate percentage shares of total change.
300
305
310
315
320
325
295
US$
billi
onForeign exchange reservesFigure 6.3
Foreignexchangereserves
Year
Mar
201
1
Apr 2
011
May
201
1
Jun
2011
Jul 2
011
Aug
2011
Sep
2011
Oct 2
011
Nov
2011
Dec
2011
http://indiabudget.nic.in
140 Economic Survey 2011-12
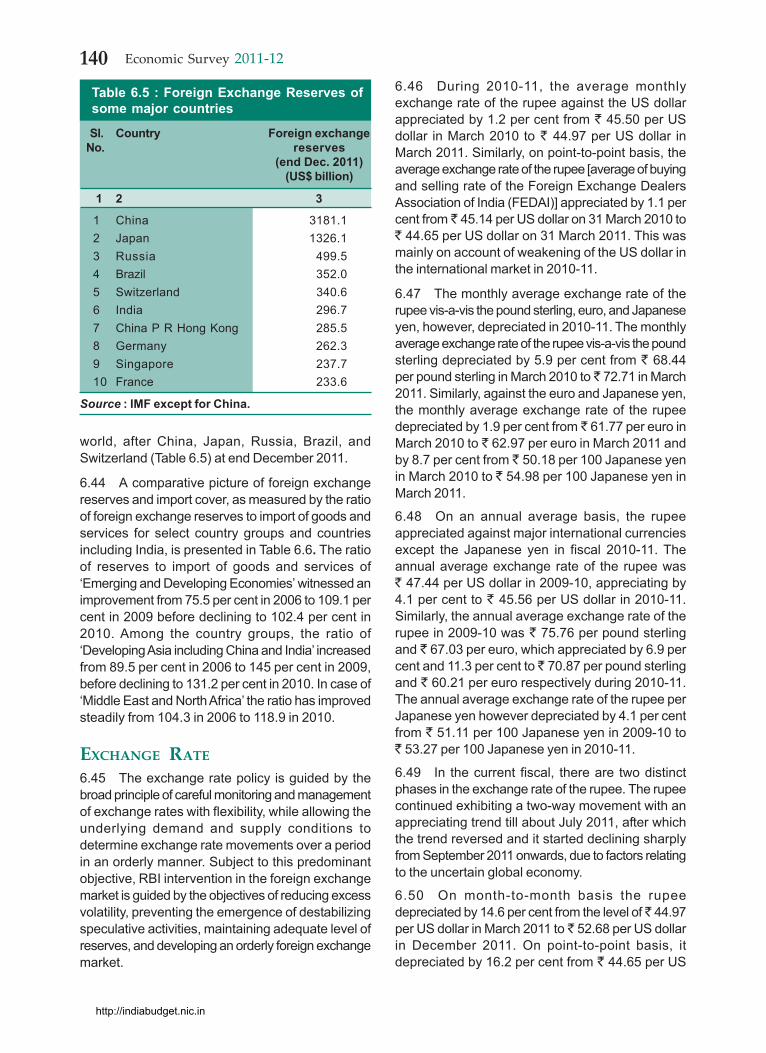
world, after China, Japan, Russia, Brazil, andSwitzerland (Table 6.5) at end December 2011.
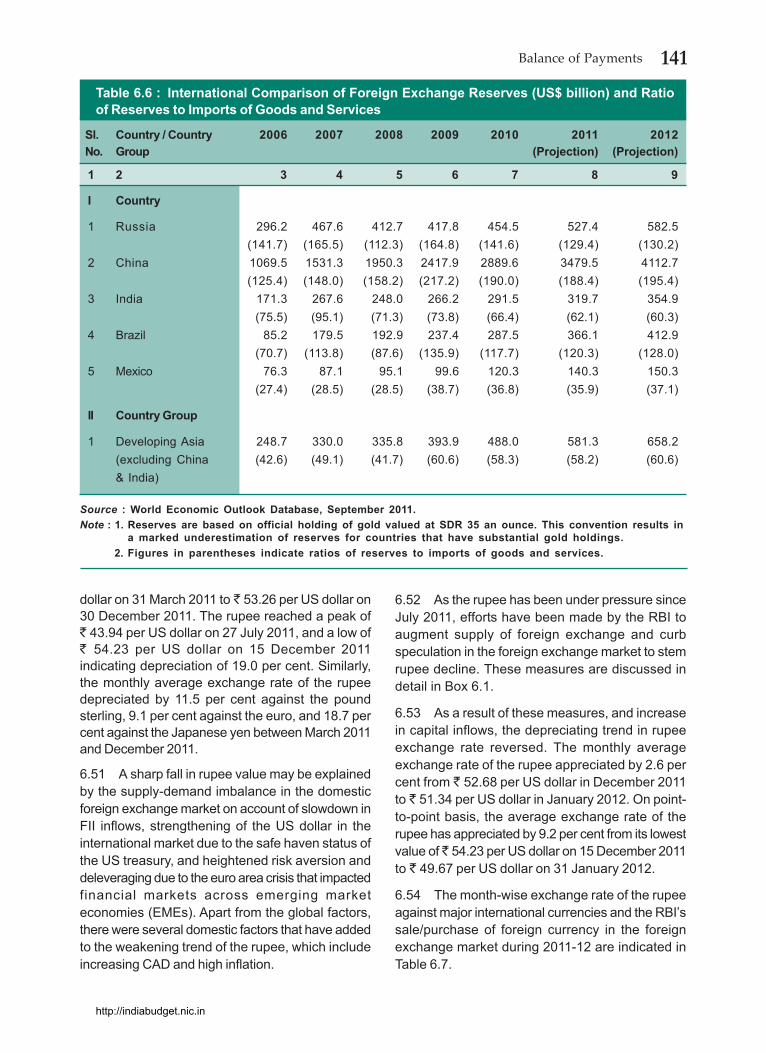
6.44 A comparative picture of foreign exchangereserves and import cover, as measured by the ratioof foreign exchange reserves to import of goods andservices for select country groups and countriesincluding India, is presented in Table 6.6. The ratioof reserves to import of goods and services of‘Emerging and Developing Economies’ witnessed animprovement from 75.5 per cent in 2006 to 109.1 percent in 2009 before declining to 102.4 per cent in2010. Among the country groups, the ratio of‘Developing Asia including China and India’ increasedfrom 89.5 per cent in 2006 to 145 per cent in 2009,before declining to 131.2 per cent in 2010. In case of‘Middle East and North Africa’ the ratio has improvedsteadily from 104.3 in 2006 to 118.9 in 2010.
EXCHANGE RATE
6.45 The exchange rate policy is guided by thebroad principle of careful monitoring and managementof exchange rates with flexibility, while allowing theunderlying demand and supply conditions todetermine exchange rate movements over a periodin an orderly manner. Subject to this predominantobjective, RBI intervention in the foreign exchangemarket is guided by the objectives of reducing excessvolatility, preventing the emergence of destabilizingspeculative activities, maintaining adequate level ofreserves, and developing an orderly foreign exchangemarket.
6.46 During 2010-11, the average monthlyexchange rate of the rupee against the US dollarappreciated by 1.2 per cent from ` 45.50 per USdollar in March 2010 to ` 44.97 per US dollar inMarch 2011. Similarly, on point-to-point basis, theaverage exchange rate of the rupee [average of buyingand selling rate of the Foreign Exchange DealersAssociation of India (FEDAI)] appreciated by 1.1 percent from ̀ 45.14 per US dollar on 31 March 2010 to` 44.65 per US dollar on 31 March 2011. This wasmainly on account of weakening of the US dollar inthe international market in 2010-11.
6.47 The monthly average exchange rate of therupee vis-a-vis the pound sterling, euro, and Japaneseyen, however, depreciated in 2010-11. The monthlyaverage exchange rate of the rupee vis-a-vis the poundsterling depreciated by 5.9 per cent from ` 68.44per pound sterling in March 2010 to ̀ 72.71 in March2011. Similarly, against the euro and Japanese yen,the monthly average exchange rate of the rupeedepreciated by 1.9 per cent from ̀ 61.77 per euro inMarch 2010 to ̀ 62.97 per euro in March 2011 andby 8.7 per cent from ̀ 50.18 per 100 Japanese yenin March 2010 to ` 54.98 per 100 Japanese yen inMarch 2011.
6.48 On an annual average basis, the rupeeappreciated against major international currenciesexcept the Japanese yen in fiscal 2010-11. Theannual average exchange rate of the rupee was` 47.44 per US dollar in 2009-10, appreciating by4.1 per cent to ` 45.56 per US dollar in 2010-11.Similarly, the annual average exchange rate of therupee in 2009-10 was ` 75.76 per pound sterlingand ̀ 67.03 per euro, which appreciated by 6.9 percent and 11.3 per cent to ̀ 70.87 per pound sterlingand ` 60.21 per euro respectively during 2010-11.The annual average exchange rate of the rupee perJapanese yen however depreciated by 4.1 per centfrom ` 51.11 per 100 Japanese yen in 2009-10 to` 53.27 per 100 Japanese yen in 2010-11.
6.49 In the current fiscal, there are two distinctphases in the exchange rate of the rupee. The rupeecontinued exhibiting a two-way movement with anappreciating trend till about July 2011, after whichthe trend reversed and it started declining sharplyfrom September 2011 onwards, due to factors relatingto the uncertain global economy.
6.50 On month-to-month basis the rupeedepreciated by 14.6 per cent from the level of ̀ 44.97per US dollar in March 2011 to ̀ 52.68 per US dollarin December 2011. On point-to-point basis, itdepreciated by 16.2 per cent from ` 44.65 per US
Table 6.5 : Foreign Exchange Reserves ofsome major countries
Sl. Country Foreign exchange No. reserves
(end Dec. 2011)(US$ billion)
1 2 3
1 China 3181.12 Japan 1326.13 Russia 499.54 Brazil 352.05 Switzerland 340.66 India 296.77 China P R Hong Kong 285.58 Germany 262.39 Singapore 237.710 France 233.6
Source : IMF except for China.
http://indiabudget.nic.in
141Balance of Payments
dollar on 31 March 2011 to ̀ 53.26 per US dollar on30 December 2011. The rupee reached a peak of` 43.94 per US dollar on 27 July 2011, and a low of` 54.23 per US dollar on 15 December 2011indicating depreciation of 19.0 per cent. Similarly,the monthly average exchange rate of the rupeedepreciated by 11.5 per cent against the poundsterling, 9.1 per cent against the euro, and 18.7 percent against the Japanese yen between March 2011and December 2011.
6.51 A sharp fall in rupee value may be explainedby the supply-demand imbalance in the domesticforeign exchange market on account of slowdown inFII inflows, strengthening of the US dollar in theinternational market due to the safe haven status ofthe US treasury, and heightened risk aversion anddeleveraging due to the euro area crisis that impactedfinancial markets across emerging marketeconomies (EMEs). Apart from the global factors,there were several domestic factors that have addedto the weakening trend of the rupee, which includeincreasing CAD and high inflation.
6.52 As the rupee has been under pressure sinceJuly 2011, efforts have been made by the RBI toaugment supply of foreign exchange and curbspeculation in the foreign exchange market to stemrupee decline. These measures are discussed indetail in Box 6.1.
6.53 As a result of these measures, and increasein capital inflows, the depreciating trend in rupeeexchange rate reversed. The monthly averageexchange rate of the rupee appreciated by 2.6 percent from ̀ 52.68 per US dollar in December 2011to ̀ 51.34 per US dollar in January 2012. On point-to-point basis, the average exchange rate of therupee has appreciated by 9.2 per cent from its lowestvalue of ̀ 54.23 per US dollar on 15 December 2011to ̀ 49.67 per US dollar on 31 January 2012.
6.54 The month-wise exchange rate of the rupeeagainst major international currencies and the RBI’ssale/purchase of foreign currency in the foreignexchange market during 2011-12 are indicated inTable 6.7.
Table 6.6 : International Comparison of Foreign Exchange Reserves (US$ billion) and Ratioof Reserves to Imports of Goods and Services
Sl. Country / Country 2006 2007 2008 2009 2010 2011 2012No. Group (Projection) (Projection)
1 2 3 4 5 6 7 8 9
I Country
1 Russia 296.2 467.6 412.7 417.8 454.5 527.4 582.5(141.7) (165.5) (112.3) (164.8) (141.6) (129.4) (130.2)
2 China 1069.5 1531.3 1950.3 2417.9 2889.6 3479.5 4112.7(125.4) (148.0) (158.2) (217.2) (190.0) (188.4) (195.4)
3 India 171.3 267.6 248.0 266.2 291.5 319.7 354.9(75.5) (95.1) (71.3) (73.8) (66.4) (62.1) (60.3)
4 Brazil 85.2 179.5 192.9 237.4 287.5 366.1 412.9(70.7) (113.8) (87.6) (135.9) (117.7) (120.3) (128.0)
5 Mexico 76.3 87.1 95.1 99.6 120.3 140.3 150.3(27.4) (28.5) (28.5) (38.7) (36.8) (35.9) (37.1)
II Country Group
1 Developing Asia 248.7 330.0 335.8 393.9 488.0 581.3 658.2(excluding China (42.6) (49.1) (41.7) (60.6) (58.3) (58.2) (60.6)& India)
Source : World Economic Outlook Database, September 2011.Note : 1. Reserves are based on official holding of gold valued at SDR 35 an ounce. This convention results in
a marked underestimation of reserves for countries that have substantial gold holdings.2. Figures in parentheses indicate ratios of reserves to imports of goods and services.
http://indiabudget.nic.in

142 Economic Survey 2011-12
Box 6.1 : Recent Policy Initiatives to Stem Slide in Rupee Exchange RateA number of steps have been taken recently to stimulate capital inflows and curb speculation in foreign exchange market tostabilize the value of the rupee. Key details are as follows:
I Measures to increase supply of foreign exchange
Trade Credit
All-in-cost ceiling for trade credit has been increased from 6 months Libor + 200 basis points (bps) to 6 months Libor+ 350 bps.
ECBs
The existing ECB limit under automatic approval route has been enhanced from US$ 500 million to US$ 750 millionfor eligible corporates. For borrowers in the services sector, the limit was enhanced from US$ 100 million to US$ 200million.
All-in-cost ceiling for ECB was revised as under:
Average maturity period All-in-cost over 6 months LIBOR*
Existing Revised3 years and up to 5 years 300 bps 350 bpsMore than 5 years 500 bps 500 bps
* for the respective currency of credit or applicable benchmark
The change in the all-in-cost ceiling came into force with effect from 23 November 2011 and is applicable up to31 March 2012, subject to review thereafter.
The proceeds of ECBs raised abroad for rupee expenditure in India should be brought immediately. In other words,ECB proceeds meant only for foreign currency expenditure can be retained abroad pending utilization. The rupeefunds however will not be permitted to be used for investment in capital marketsor real estate or for inter-corporatelending.
FII Investment
The FII limit for investment in government securities and corporate bonds has been increased by US$ 5 billion each toUS$ 15 billion and US $ 20 billion respectively, from earlier limits of US$ 10 billion and US$ 15 billion. The investmentlimit in long-term infrastructure corporate bonds, however, has been kept unchanged at US$ 25 billion. With this,overall limit for FII investment in corporate bonds and government securities now stands at US$ 60 billion.
NRI Deposits
With effect from close of business on 23 November 2011, interest rates on fresh non-resident (external) rupee (NRE)term deposits for one to three years maturity increased to Libor/SWAP + 275 bps. The interest rates will also beapplicable to deposits with maturity period exceeding three years and to deposits renewed after their present maturityperiod. Interest rate on Foreign Currency Non Resident Bank Deposit [FCNR (B)] deposits of all maturities contractedeffective from the close of business in India as on 23 November 2011, will be within the ceiling rate of Libor/SWAPrates plus 125 bps for the respective currency/corresponding maturities.
II Major administrative measures as per RBI Press Release dated 15 December 2011.
i. Forward contracts involving the rupee as one of the currencies, booked by residents irrespective of the type and tenorof the underlying exposure, once cancelled, cannot be rebooked.
ii. All cash/tom/spot transactions by authorized dealers on behalf of clients will be undertaken for actual remittances/delivery only and cannot be cancelled / cash settled.
iii. Forward contracts booked by FIIs, once cancelled, cannot be rebooked. They may, however, be rolled over on or beforematurity.
iv. The Board of Directors of Authorized Dealers was allowed to fix suitable limits for various treasury functions with netovernight open exchange position and aggregate gap limits required to be approved by the RBI.
a. Net overnight open position limit (NOOPL) of authorized dealers would be reduced across the board and revisedlimits in respect of individual banks are being advised to the authorized dealers separately.
b. Intra-day open position / daylight limit of authorized eealers should not exceed existing NOOPL approved by theRBI.
Source : RBI
http://indiabudget.nic.in

143Balance of Payments
Table 6.7 : Exchange Rates of Rupee per Foreign Currency and RBI’s Sale/Purchase ofUS Dollar in the Exchange Market during 2010-11 and 2011-12
Average exchange rates ( `̀̀̀̀ per foreign currency)*
Month US dollar Pound Euro Japanese RBI Net sale (-) /sterling yen** purchase (+)
(US$ million)
1 2 3 4 5 6
2010-11(annual average) 45.56 70.87 60.21 53.27 (+)1690
(4.1) (6.9) (11.3) (-4.1)March-2011 44.97 72.71 62.97 54.98
(1.0) (0.8) (-1.4) (0.1)
2011-12(monthly average)April-2011 44.37 72.72 64.25 53.31 -
(1.4) (-0.02) (-2.0) (3.1)May-2011 44.90 73.41 64.48 55.32 -
(-1.2) (-0.9) (-0.4) (-3.6)June-2011 44.83 72.79 64.52 55.65 -
(0.2) (0.9) (-0.1) (-0.6)July-2011 44.42 71.65 63.46 55.91 -
(0.9) (1.6) (1.7) (-0.5)August-2011 45.25 74.11 64.94 58.68 -
(-1.8) (-3.3) (-2.3) (-4.7)September-2011 47.63 75.12 65.47 62.03 (-) 845.0
(-5.0) (-1.3) (-0.8) (-5.4)October-2011 49.26 77.49 67.45 64.11 (-) 943.0
(-3.3) (-3.1) (-2.9) (-3.2)November-2011 50.86 80.25 68.91 65.60 (-) 2,918.0
(- 3.1) (- 3.4) (- 2.1) (- 2.3)December-2011 52.68 82.13 69.29 67.63 (-)7809.0
(- 3.5) (- 2.3) (- 0.6) (- 3.0)
Source : RBI.Notes : * FEDAI indicative rate; ** Per 100 yen; Figures in parentheses indicate percentage appreciation (+) anddepreciation (-) over the previous month / year. Some percentage figures may not tally due to rounding off.
6.55 The monthly average exchange rate of therupee per US dollar and its appreciation /depreciation during 2011-12 are depicted in Figure6.4 .
Exchange Rate of Other EmergingEconomies6.56 Currency depreciation during 2011-12 was notspecific to India. The currencies of other emerging
40
44
48
-6
-4
-2
052
56
Monthlyaverage
exchange rate(�/US Dollar)
- LHS
Appreciation(+) /
Depreciation(-)
- RHS
� /
US d
olla
r
Monthly average exchange rate (�/US dollar) during March 2011 to December2011 and appreciation/depreciation over the previous month
Figure 6.4
Appreciation(+
)/D
epreciation(-)
Mar Apr
May Jun
Jul
Aug
Sep
Oct
Nov
Dec
2011
-5
-3
-1
1
2
42
46
50
54
http://indiabudget.nic.in
144 Economic Survey 2011-12
economies, such as the Brazilian real, Mexicanpeso, Russian rouble, South Korean won, and SouthAfrican rand, also depreciated against the US dollar,reflecting the increased demand for the US dollar asa safe haven asset in the wake of the sovereign debtcrisis in the euro zone. Between July and November2011, the Brazilian real has depreciated by 11.9 percent, Russian rouble by 9.3 per cent, South Koreanwon by 6.2 per cent, and South African rand by 17.63per cent.
6.57 The exchange rates of the rupee vis-à-visselect international currencies since 1991-92, year-wise, and during 2011-12, month-wise, are given inAppendix 6.5.
Nominal Effective Exchange Rate (NEER) andReal Effective Exchange Rate (REER)
The NEER and REER indices are used as indicatorsof external competitiveness of the country over aperiod of time. NEER is the weighted average ofbilateral nominal exchange rates of the homecurrency in terms of foreign currencies, while REERis defined as a weighted average of nominal exchangerates, adjusted for home and foreign country relativeprice differentials. REER captures movements in
cross-currency exchange rates as well as inflationdifferentials between India and its major tradingpartners. The RBI has been constructing six-currency(US dollar, euro for euro zone, pound sterling,Japanese yen, Chinese renminbi, and Hong Kongdollar) and 36-currency NEER and REER indices.
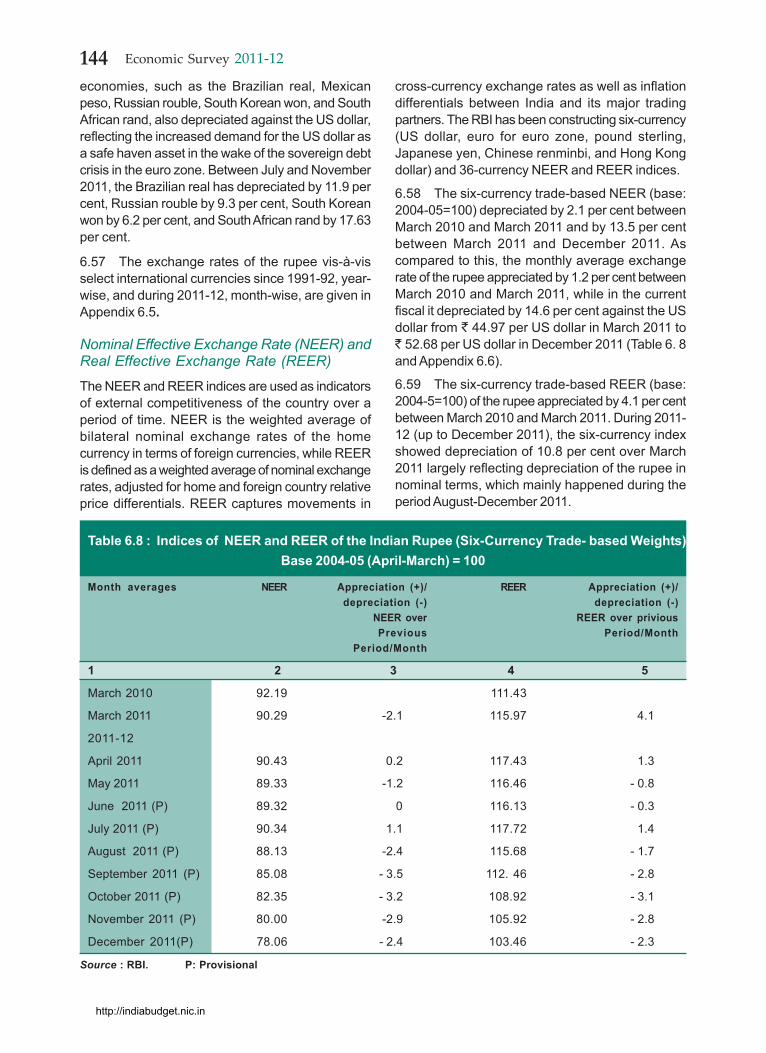
6.58 The six-currency trade-based NEER (base:2004-05=100) depreciated by 2.1 per cent betweenMarch 2010 and March 2011 and by 13.5 per centbetween March 2011 and December 2011. Ascompared to this, the monthly average exchangerate of the rupee appreciated by 1.2 per cent betweenMarch 2010 and March 2011, while in the currentfiscal it depreciated by 14.6 per cent against the USdollar from ` 44.97 per US dollar in March 2011 to` 52.68 per US dollar in December 2011 (Table 6. 8and Appendix 6.6).
6.59 The six-currency trade-based REER (base:2004-5=100) of the rupee appreciated by 4.1 per centbetween March 2010 and March 2011. During 2011-12 (up to December 2011), the six-currency indexshowed depreciation of 10.8 per cent over March2011 largely reflecting depreciation of the rupee innominal terms, which mainly happened during theperiod August-December 2011.
Table 6.8 : Indices of NEER and REER of the Indian Rupee (Six-Currency Trade- based Weights)Base 2004-05 (April-March) = 100
Month averages NEER Appreciation (+)/ REER Appreciation (+)/depreciation (-) depreciation (-)
NEER over REER over priviousPrevious Period/Month
Period/Month
1 2 3 4 5
March 2010 92.19 111.43
March 2011 90.29 -2.1 115.97 4.1
2011-12
April 2011 90.43 0.2 117.43 1.3
May 2011 89.33 -1.2 116.46 - 0.8
June 2011 (P) 89.32 0 116.13 - 0.3
July 2011 (P) 90.34 1.1 117.72 1.4
August 2011 (P) 88.13 -2.4 115.68 - 1.7
September 2011 (P) 85.08 - 3.5 112. 46 - 2.8
October 2011 (P) 82.35 - 3.2 108.92 - 3.1
November 2011 (P) 80.00 -2.9 105.92 - 2.8
December 2011(P) 78.06 - 2.4 103.46 - 2.3
Source : RBI. P: Provisional
http://indiabudget.nic.in
145Balance of Payments
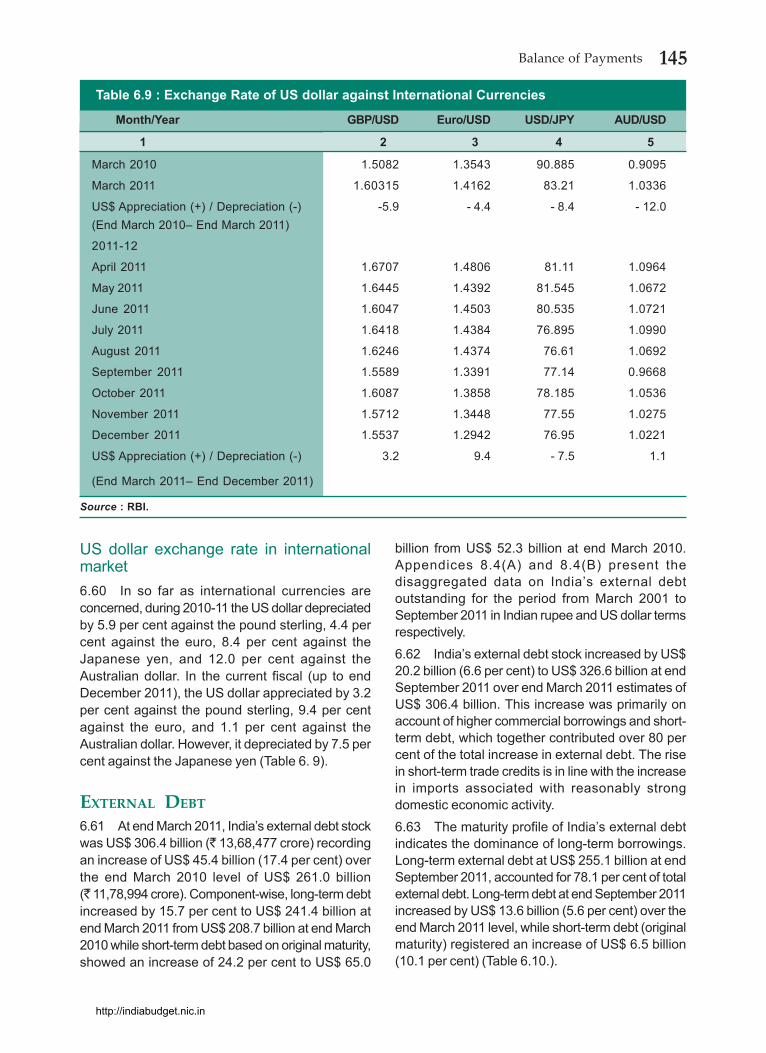
US dollar exchange rate in internationalmarket6.60 In so far as international currencies areconcerned, during 2010-11 the US dollar depreciatedby 5.9 per cent against the pound sterling, 4.4 percent against the euro, 8.4 per cent against theJapanese yen, and 12.0 per cent against theAustralian dollar. In the current fiscal (up to endDecember 2011), the US dollar appreciated by 3.2per cent against the pound sterling, 9.4 per centagainst the euro, and 1.1 per cent against theAustralian dollar. However, it depreciated by 7.5 percent against the Japanese yen (Table 6. 9).
EXTERNAL DEBT
6.61 At end March 2011, India’s external debt stockwas US$ 306.4 billion (` 13,68,477 crore) recordingan increase of US$ 45.4 billion (17.4 per cent) overthe end March 2010 level of US$ 261.0 billion(` 11,78,994 crore). Component-wise, long-term debtincreased by 15.7 per cent to US$ 241.4 billion atend March 2011 from US$ 208.7 billion at end March2010 while short-term debt based on original maturity,showed an increase of 24.2 per cent to US$ 65.0
billion from US$ 52.3 billion at end March 2010.Appendices 8.4(A) and 8.4(B) present thedisaggregated data on India’s external debtoutstanding for the period from March 2001 toSeptember 2011 in Indian rupee and US dollar termsrespectively.6.62 India’s external debt stock increased by US$20.2 billion (6.6 per cent) to US$ 326.6 billion at endSeptember 2011 over end March 2011 estimates ofUS$ 306.4 billion. This increase was primarily onaccount of higher commercial borrowings and short-term debt, which together contributed over 80 percent of the total increase in external debt. The risein short-term trade credits is in line with the increasein imports associated with reasonably strongdomestic economic activity.6.63 The maturity profile of India’s external debtindicates the dominance of long-term borrowings.Long-term external debt at US$ 255.1 billion at endSeptember 2011, accounted for 78.1 per cent of totalexternal debt. Long-term debt at end September 2011increased by US$ 13.6 billion (5.6 per cent) over theend March 2011 level, while short-term debt (originalmaturity) registered an increase of US$ 6.5 billion(10.1 per cent) (Table 6.10.).
Table 6.9 : Exchange Rate of US dollar against International Currencies
Month/Year GBP/USD Euro/USD USD/JPY AUD/USD
1 2 3 4 5
March 2010 1.5082 1.3543 90.885 0.9095
March 2011 1.60315 1.4162 83.21 1.0336
US$ Appreciation (+) / Depreciation (-) -5.9 - 4.4 - 8.4 - 12.0(End March 2010– End March 2011)
2011-12
April 2011 1.6707 1.4806 81.11 1.0964
May 2011 1.6445 1.4392 81.545 1.0672
June 2011 1.6047 1.4503 80.535 1.0721
July 2011 1.6418 1.4384 76.895 1.0990
August 2011 1.6246 1.4374 76.61 1.0692
September 2011 1.5589 1.3391 77.14 0.9668
October 2011 1.6087 1.3858 78.185 1.0536
November 2011 1.5712 1.3448 77.55 1.0275
December 2011 1.5537 1.2942 76.95 1.0221
US$ Appreciation (+) / Depreciation (-) 3.2 9.4 - 7.5 1.1
(End March 2011– End December 2011)
Source : RBI.
http://indiabudget.nic.in

146 Economic Survey 2011-12
6.64 Under long-term debt, components such ascommercial borrowings, NRI deposits, andmultilateral borrowings taken together accounted for61.3 per cent of total external debt at the end ofSeptember 2011 while other long-term debtcomponents (bilateral borrowings, export credit,IMF, and rupee debt) accounted for 16.8 per cent.Thus long-term debt, taking into account all thecomponents, accounted for 78.1 per cent of totalexternal debt, while the remaining (21.9 per cent)was short-term debt at end September 2011 (Table6.11.).
6.65 The currency composition of India’s totalexternal debt shows that the share of US dollardenominated debt was the highest in external debtstock at 55.8 per cent at end September 2011,followed by Indian rupee (18.2 per cent), Japaneseyen (12.1 per cent), SDR (9.1 per cent), and euro(3.5 per cent). The currency composition ofgovernment (sovereign) debt indicates predominanceof SDR denominated debt (37.3 per cent), which isattributable to borrowing from the IDA, i.e. the softloan window of the World Bank under the multilateralagencies, and SDR allocations by the IMF. The share
Table 6.10 : India’s External Debt Stock
At end-March In US$ million In ` crore
Long-term Short-term Total Long-term Short-term Total
1 2 3 4 5 6 7
2005 116279 17723 134002 508777 77528 586305
2006 119575 19539 139114 533367 87155 620522
2007 144230 28130 172360 628771 122631 751402
2008 178669 45738 224407 714409 182881 897290
2009 181185 43313 224498 921469 220656 1142125
2010 208685 52329 261014 942806 236188 1178994
2011PR 241448 64990 306438 1078330 290147 1368477
2011 (end-June) PR 249010 68474 317484 1116205 306248 1422453
2011 (end-Sept.) QE 255071 71530 326601 1247863 349889 1597752
Source : Ministry of Finance and RBINote : PR : Partially Revised QE : Quick Estimates.
Table 6.11 : Composition of External Debt (per cent of total external debt)
Sl. Component March March June SeptemberNo. 2010 PR 2011 PR 2011 PR 2011 QE
1 2 3 4 5 6
1 Multilateral 16.4 15.8 15.6 15.0
2 Bilateral 8.7 8.4 8.3 8.43 IMF 2.3 2.1 2.0 2.04 Export credit 6.5 6.1 5.9 6.05 Commercial borrowings 27.1 29.0 29.5 30.36 NRI deposits 18.3 16.9 16.6 16.07 Rupee debt 0.6 0.5 0.5 0.48 Long-term debt (1 to 7) 79.9 78.8 78.4 78.19 Short-term debt 20.1 21.2 21.6 21.9
10 Total external debt (8+9) 100.0 100.0 100.0 100.0
Source : Ministry of Finance and RBI. PR : Partially Revised. QE : Quick Estimates.
http://indiabudget.nic.in
147Balance of Payments
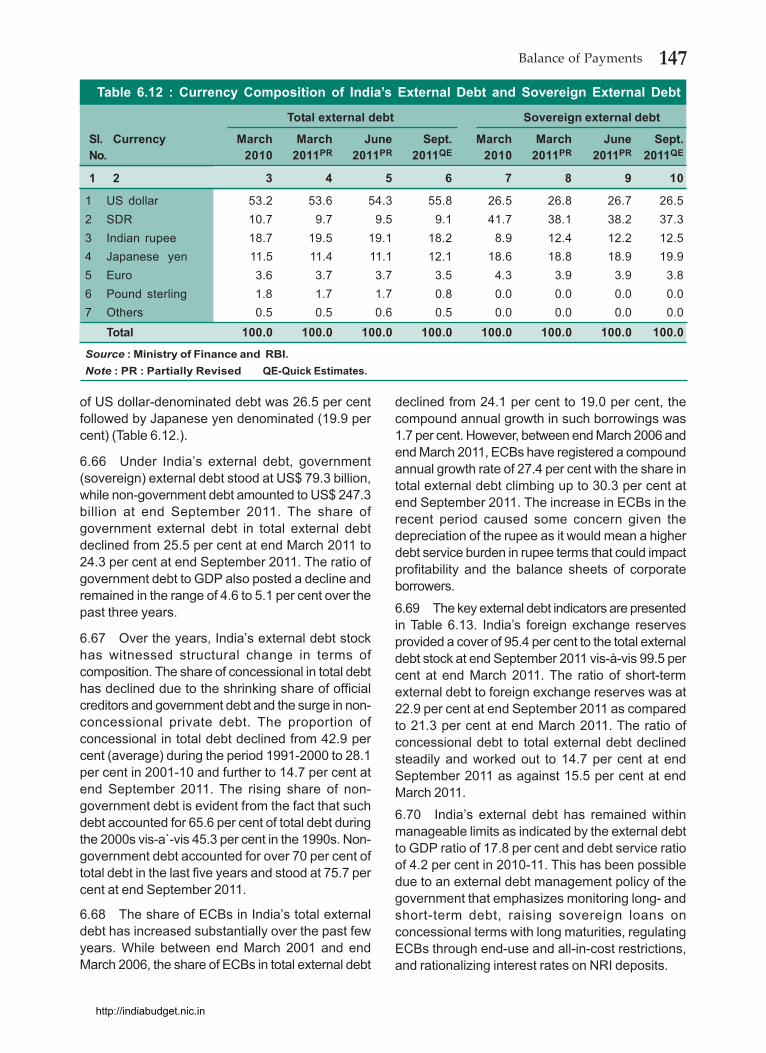
of US dollar-denominated debt was 26.5 per centfollowed by Japanese yen denominated (19.9 percent) (Table 6.12.).
6.66 Under India’s external debt, government(sovereign) external debt stood at US$ 79.3 billion,while non-government debt amounted to US$ 247.3billion at end September 2011. The share ofgovernment external debt in total external debtdeclined from 25.5 per cent at end March 2011 to24.3 per cent at end September 2011. The ratio ofgovernment debt to GDP also posted a decline andremained in the range of 4.6 to 5.1 per cent over thepast three years.
6.67 Over the years, India’s external debt stockhas witnessed structural change in terms ofcomposition. The share of concessional in total debthas declined due to the shrinking share of officialcreditors and government debt and the surge in non-concessional private debt. The proportion ofconcessional in total debt declined from 42.9 percent (average) during the period 1991-2000 to 28.1per cent in 2001-10 and further to 14.7 per cent atend September 2011. The rising share of non-government debt is evident from the fact that suchdebt accounted for 65.6 per cent of total debt duringthe 2000s vis-a`-vis 45.3 per cent in the 1990s. Non-government debt accounted for over 70 per cent oftotal debt in the last five years and stood at 75.7 percent at end September 2011.
6.68 The share of ECBs in India’s total externaldebt has increased substantially over the past fewyears. While between end March 2001 and endMarch 2006, the share of ECBs in total external debt
declined from 24.1 per cent to 19.0 per cent, thecompound annual growth in such borrowings was1.7 per cent. However, between end March 2006 andend March 2011, ECBs have registered a compoundannual growth rate of 27.4 per cent with the share intotal external debt climbing up to 30.3 per cent atend September 2011. The increase in ECBs in therecent period caused some concern given thedepreciation of the rupee as it would mean a higherdebt service burden in rupee terms that could impactprofitability and the balance sheets of corporateborrowers.
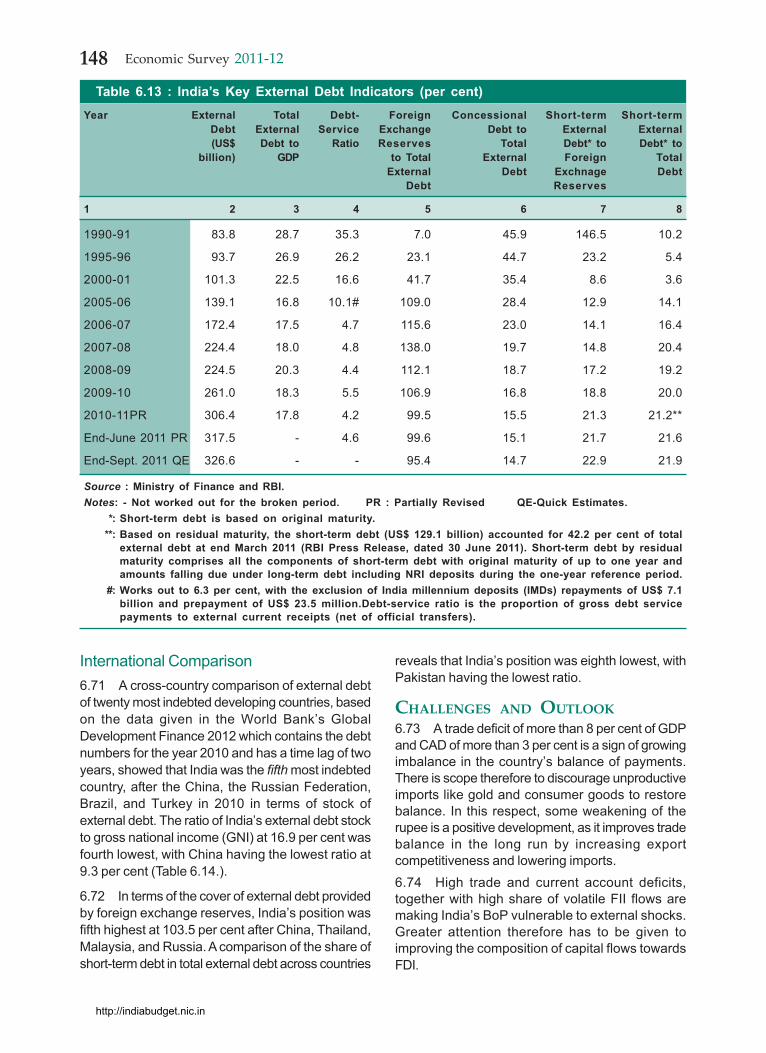
6.69 The key external debt indicators are presentedin Table 6.13. India’s foreign exchange reservesprovided a cover of 95.4 per cent to the total externaldebt stock at end September 2011 vis-à-vis 99.5 percent at end March 2011. The ratio of short-termexternal debt to foreign exchange reserves was at22.9 per cent at end September 2011 as comparedto 21.3 per cent at end March 2011. The ratio ofconcessional debt to total external debt declinedsteadily and worked out to 14.7 per cent at endSeptember 2011 as against 15.5 per cent at endMarch 2011.6.70 India’s external debt has remained withinmanageable limits as indicated by the external debtto GDP ratio of 17.8 per cent and debt service ratioof 4.2 per cent in 2010-11. This has been possibledue to an external debt management policy of thegovernment that emphasizes monitoring long- andshort-term debt, raising sovereign loans onconcessional terms with long maturities, regulatingECBs through end-use and all-in-cost restrictions,and rationalizing interest rates on NRI deposits.
Table 6.12 : Currency Composition of India’s External Debt and Sovereign External Debt
Total external debt Sovereign external debt
Sl. Currency March March June Sept. March March June Sept.No. 2010 2011PR 2011PR 2011QE 2010 2011PR 2011PR 2011QE
1 2 3 4 5 6 7 8 9 10
1 US dollar 53.2 53.6 54.3 55.8 26.5 26.8 26.7 26.52 SDR 10.7 9.7 9.5 9.1 41.7 38.1 38.2 37.33 Indian rupee 18.7 19.5 19.1 18.2 8.9 12.4 12.2 12.54 Japanese yen 11.5 11.4 11.1 12.1 18.6 18.8 18.9 19.95 Euro 3.6 3.7 3.7 3.5 4.3 3.9 3.9 3.86 Pound sterling 1.8 1.7 1.7 0.8 0.0 0.0 0.0 0.07 Others 0.5 0.5 0.6 0.5 0.0 0.0 0.0 0.0
Total 100.0 100.0 100.0 100.0 100.0 100.0 100.0 100.0
Source : Ministry of Finance and RBI.Note : PR : Partially Revised QE-Quick Estimates.
http://indiabudget.nic.in
148 Economic Survey 2011-12
International Comparison6.71 A cross-country comparison of external debtof twenty most indebted developing countries, basedon the data given in the World Bank’s GlobalDevelopment Finance 2012 which contains the debtnumbers for the year 2010 and has a time lag of twoyears, showed that India was the fifth most indebtedcountry, after the China, the Russian Federation,Brazil, and Turkey in 2010 in terms of stock ofexternal debt. The ratio of India’s external debt stockto gross national income (GNI) at 16.9 per cent wasfourth lowest, with China having the lowest ratio at9.3 per cent (Table 6.14.).
6.72 In terms of the cover of external debt providedby foreign exchange reserves, India’s position wasfifth highest at 103.5 per cent after China, Thailand,Malaysia, and Russia. A comparison of the share ofshort-term debt in total external debt across countries
reveals that India’s position was eighth lowest, withPakistan having the lowest ratio.
CHALLENGES AND OUTLOOK6.73 A trade deficit of more than 8 per cent of GDPand CAD of more than 3 per cent is a sign of growingimbalance in the country’s balance of payments.There is scope therefore to discourage unproductiveimports like gold and consumer goods to restorebalance. In this respect, some weakening of therupee is a positive development, as it improves tradebalance in the long run by increasing exportcompetitiveness and lowering imports.6.74 High trade and current account deficits,together with high share of volatile FII flows aremaking India’s BoP vulnerable to external shocks.Greater attention therefore has to be given toimproving the composition of capital flows towardsFDI.
Table 6.13 : India’s Key External Debt Indicators (per cent)Year External Total Debt- Foreign Concessional Short-term Short-term
Debt External Service Exchange Debt to External External(US$ Debt to Ratio Reserves Total Debt* to Debt* to
billion) GDP to Total External Foreign TotalExternal Debt Exchnage Debt
Debt Reserves
1 2 3 4 5 6 7 8
1990-91 83.8 28.7 35.3 7.0 45.9 146.5 10.2
1995-96 93.7 26.9 26.2 23.1 44.7 23.2 5.4
2000-01 101.3 22.5 16.6 41.7 35.4 8.6 3.6
2005-06 139.1 16.8 10.1# 109.0 28.4 12.9 14.1
2006-07 172.4 17.5 4.7 115.6 23.0 14.1 16.4
2007-08 224.4 18.0 4.8 138.0 19.7 14.8 20.4
2008-09 224.5 20.3 4.4 112.1 18.7 17.2 19.2
2009-10 261.0 18.3 5.5 106.9 16.8 18.8 20.0
2010-11PR 306.4 17.8 4.2 99.5 15.5 21.3 21.2**
End-June 2011 PR 317.5 - 4.6 99.6 15.1 21.7 21.6
End-Sept. 2011 QE 326.6 - - 95.4 14.7 22.9 21.9
Source : Ministry of Finance and RBI.Notes: - Not worked out for the broken period. PR : Partially Revised QE-Quick Estimates.
*: Short-term debt is based on original maturity.**: Based on residual maturity, the short-term debt (US$ 129.1 billion) accounted for 42.2 per cent of total
external debt at end March 2011 (RBI Press Release, dated 30 June 2011). Short-term debt by residualmaturity comprises all the components of short-term debt with original maturity of up to one year andamounts falling due under long-term debt including NRI deposits during the one-year reference period.
#: Works out to 6.3 per cent, with the exclusion of India millennium deposits (IMDs) repayments of US$ 7.1billion and prepayment of US$ 23.5 million.Debt-service ratio is the proportion of gross debt servicepayments to external current receipts (net of official transfers).
http://indiabudget.nic.in

149Balance of Payments
Table 6.14 : International Comparison of Top Twenty Developing Debtor Countries, 2010Total Total Debt to Short-term Foreign
Sl Countries External GNI to Total ExchangeDebt Stock (per cent) External Reserves to
(US$ million) Debt Total Debt(per cent) (per cent)
1 2 3 4 5 6
1 China 548551 9.3 63.4 531.2
2 Russian Federation 384740 26.9 10.1 124.6
3 Brazil 346978 16.9 18.9 83.2
4 Turkey 293872 40.4 26.6 29.3
5 India 290282 16.9 19.4 103.5
6 Mexico 200081 19.5 19.5 60.3
7 Indonesia 179064 26.1 17.5 53.7
8 Argentina 127849 36.1 27.4 40.8
9 Romania 121505 76.4 20.6 39.5
10 Kazakhstan 118723 94.3 7.6 23.8
11 Ukraine 116808 85.9 22.7 29.6
12 Chile 86349 45.9 30 32.2
13 Malaysia 81497 35.4 43 130.7
14 Philippines 72337 36.2 8.7 86.2
15 Thailand 71263 23.4 54 241.4
16 Colombia 63064 22.8 13 44.5
17 Pakistan 56773 31.3 4 30.4
18 Venezuela 55572 14.3 27.8 53.4
19 Bulgaria 48077 104.8 32 35.8
20 South Africa 45165 12.7 27.2 97
Source : World Bank, Global Development Finance 2012.Note : Countries are arranged based on the magnitude of debt presented in Column 3 in the Table.
6.75 The rupee has experienced high volatility inthe last few years. Such volatility impairs investorconfidence and has implications for corporatebalance sheets and profitability in case of highexposure to ECBs when currency is depreciating.A more aggressive stance to check rupee volatilityis therefore necessary.
6.76 The size of foreign exchange reserves couldbe a constraining factor in checking depreciation oflocal currency in the event of external shock andreversal of capital. It is therefore imperative thatduring times of surge in capital flows, when currencyis under pressure to appreciate, measures are takento build up reserve levels.
http://indiabudget.nic.in