balancing consumption and availability in a multiple … · a mi hermana a la que me une un lazo...
TRANSCRIPT
BALANCING CONSUMPTION AND AVAILABILITY IN A
MULTIPLE USES OF WATER SYSTEM
By
ISABEL CRISTINA DOMINGUEZ RIVERA
A research project report submitted in partial fulfilment
of the requirements for the award of the degree of
Master of Science
of Loughborough University
AUGUST 2010
Supervisor: I.K. Smout
BA Cantab., MSc Reading, CEng, FICE, MIAgrE, MCIWEM
Water, Engineering and Development Centre
Department of Civil and Building Engineering
WEDC Postgraduate Programmes
i
Dedicatoria
A Dios por esta vida, llena de cosas mágicas, lindas, dolorosas, pero todas valiosas; por
darme fuerza cada día y por las personas que ha puesto a mi lado para que me acompañen
en este camino
A Ricardo mi compañero del alma
A mis padres que me educaron con los valores de la responsabilidad y el trabajo duro y que
me dieron todo para convertirme en quien soy
A mi hermana a la que me une un lazo más poderoso que la sangre
A mis abuelas, mis tías y mi primo, por ser la mejor familia que podía tener
A Alejandro por la luz que irradia en mi vida

ii
Acknowledgements
I want to express my gratitude to Ines Restrepo, who has been my teacher, my colleague, my
friend and a model to me. Her generosity helped me crystallize my goal of studying at WEDC;
for introducing me to the topic of water and poverty, for which I feel a passion that I was not
aware until the time of writing these lines. I fall short in expressing my appreciation for
everything she has done for me, and everything that she has inspired me.
I also want to thank the members of the Multiple Uses of Water group (musgroup), Barbara
van Koppen, Stef Smits, Ian Smout and John Butterworth, for their support to carry out my
studies at WEDC, especially Ian Smout, who supervised this research within WEDC, and who
was always ready to offer his guidance, and listen to my concerns; also to John Butterworth
who has helped me to make possible many of the important things in my short professional
life, and to whom I have all my respect and affection.
I want to make recognition to Mr. Vitelio Nieto and other members of La Palma Tres Puertas
Water Committee for having entire disposition to allow Cinara´s students to conduct research
in this system. Most especially to Mr. Florentino Urrego, caretaker of the water supply system,
for his kindness, and openness to share his knowledge with me. In general, to all users of the
system that opened the doors of their homes and attended the survey, and most particularly to
the women who responsibly and thoroughly filled the Water Diaries. Similarly, the family that
allowed me to stay at their premises recording water consumption.
To Dr. Hector Fabio Cuellar and Jorge Lizarazo from the Committee of Coffee Growers, Cali,
for providing the accommodation in Restrepo at the Coffee Complex Facilities during the
fieldwork; to Dr. Fernando Gast, Cenicafé Director, to authorize access to climatic information
from Julio Fernandez station and to Mr. Alvaro Jaramillo who provided it. Also to the people
who work on the Coffee Complex for their attention and kindness.
To my colleagues from Cinara, for their support and for making the work at Cinara an
everyday learning experience, especially to Silvia, for her patience all these years. My
gratitude to Luisa and Isabel for helping me to carried out the surveys and to Marie Luneau for
their assistance with the fieldwork and the digitization of the data from the survey. To Viviana
Vargas for her patient explanations on sampling.
Especially to my husband, Ricardo, who has encouraged me and supported me through this
process, and who read this document and made valuable contributions towards its
improvement.

iii
Certificate of authorship
I certify that:
(i) I am responsible for the work submitted in this project report, and that the original
work is my own except as specified below.
(ii) I have not submitted this work to any other institution for the award of a degree
(iii) All field work and computer programming has been carried out by me with no
outside assistance except as noted below:
I received assistance from Isabel Bolaños, Luisa Fernanda Suarez, Erick Brand,
Danny Rendón and Arley Portilla to conduct interviews to the locals of La Palma
Tres Puertas
I received assistance from Marie Luneau to transfer data from the
questionnaires to an Excel spreadsheet
I received assistance from Marie Luneau to undertake domestic water
consumption observations
I received assistance from Florentino Urrego to measure the water flow at the
inlet of La Palma Tres Puertas storage tank
(iv) All information (including diagrams and tables) or other information which is
copied from, or based on, the work of others has its source clearly acknowledged
in the text at the place where it appears.
Signed:
Date:

iv
Individual project access form
Location: WEDC Resources Centre, Loughborough University
Author: ……………………………………………………
Title: …………………………………………………………………………………
…………………………………………………………………………………
Status of access: OPEN
Author‘s declaration:
I agree to the following conditions:
OPEN This project report shall be made available within the WEDC Resource
Centre, and may be borrowed by WEDC staff and students. Pages
may be copied, subject to copyright regulations. It may also be copied
by the British Library for supply to requesting libraries and individuals,
subject to a written assurance that it will not be published in part or in
full.
Author‘s signature: …………………………….. Date: ………………………
Conditions of access approved by: ……..………………………………………..
(Supervisor‘s name)
Supervisor‘s signature: ……..………………………………………..

v
Table of contents
1 INTRODUCTION ......................................................................................................................... 1
1.1 CONTEXT ................................................................................................................................ 1
1.2 BACKGROUND ......................................................................................................................... 4
1.3 RESEARCH AIMS AND OBJECTIVES ............................................................................................ 7
1.4 RESEARCH QUESTIONS ............................................................................................................ 7
1.5 RESEARCH METHODOLOGY ...................................................................................................... 7
1.6 SCOPE .................................................................................................................................... 9
1.7 INTENDED READERS ..............................................................................................................10
1.8 STRUCTURE OF THE REPORT..................................................................................................10
2 LITERATURE REVIEW ............................................................................................................ 12
2.1 METHODOLOGY .....................................................................................................................12
2.2 STRUCTURE ..........................................................................................................................14
2.3 POVERTY AND ACCESS TO WATER IN RURAL AREAS .................................................................14
2.4 POVERTY REDUCTION, SUSTAINABLE LIVELIHOODS APPROACH AND DEMAND RESPONSIVE
APPROACH ......................................................................................................................................15
2.5 MULTIPLE USES OF WATER (MUS) ........................................................................................17
2.5.1 Conflicting ideas of MUS .............................................................................................19
2.5.2 Premises ......................................................................................................................21
2.6 PLANNING RURAL WATER SUPPLY SYSTEMS UNDER A MUS APPROACH ....................................21
2.6.1 Water uses and consumption ......................................................................................22
2.6.2 Water availability ..........................................................................................................29
2.6.3 Water balances and water budgets .............................................................................30
2.7 METHODOLOGIES USED TO RESEARCH ON MUS AND ITS INTERLINKED SUBJECTS .....................35
2.7.1 Methodologies to research on water uses and consumption ......................................35
2.7.2 Methodologies to research on water availability and water balances .........................38
2.8 GAPS IN RESEARCH ...............................................................................................................40
2.9 SUMMARY .............................................................................................................................41
3 THE CASE STUDY AREA ........................................................................................................ 42
3.1 LOCATION .............................................................................................................................42
3.2 CLIMATE ...............................................................................................................................42
3.3 SURFACE SOURCES ...............................................................................................................43
3.4 GEOLOGY .............................................................................................................................43
3.5 SOILS AND LAND USE .............................................................................................................44
3.6 POPULATION .........................................................................................................................45
3.7 INFRASTRUCTURE .................................................................................................................45
3.8 THE WATER SUPPLY SYSTEM ..................................................................................................45

vi
3.8.1 System description ......................................................................................................45
3.8.2 Management issues.....................................................................................................46
3.8.3 Uses of water ...............................................................................................................46
4 METHODS ................................................................................................................................ 49
4.1 CHARACTERIZATION OF GROUPS OF HOUSEHOLDS WITHIN A MUS SYSTEM ACCORDING TO
ASPECTS RELATED TO POVERTY, PRODUCTIVE ACTIVITIES, LIVELIHOODS AND ACCESS TO WATER ..........49
4.2 MEASUREMENT OF DIFFERENT COMPONENTS OF DOMESTIC WATER PER CAPITA CONSUMPTION IN
HOUSEHOLDS WITHIN A MUS SYSTEM ...............................................................................................56
4.3 PROPOSAL OF BALANCES AT THE SYSTEM AND HOUSEHOLD LEVEL INCLUDING WATER DEMAND
FOR MULTIPLE USES AND WATER INPUTS, CONSIDERING BLUE WATER AND GREEN WATER ....................60
5 RESULTS AND DISCUSSION ................................................................................................. 73
5.1 CHARACTERISTICS OF HOUSEHOLDS WITHIN A MUS SYSTEM, ACCORDING TO POVERTY,
LIVELIHOODS AND ACCESS TO WATER ................................................................................................73
5.1.1 Poverty and water consumption ..................................................................................73
5.1.2 Livelihoods, productive activities and water consumption ...........................................78
5.1.3 Access to water and water consumption .....................................................................81
5.2 DOMESTIC WATER PER CAPITA CONSUMPTION IN HOUSEHOLDS WITHIN A MUS SYSTEM ............85
5.3 WATER BALANCES AT THE SYSTEM AND HOUSEHOLD LEVEL, INCLUDING WATER DEMAND FOR
MULTIPLE USES, AND WATER INPUTS CONSIDERING BLUE WATER AND GREEN WATER ...........................93
5.3.1 Water balance domain .................................................................................................93
5.3.2 Water balance estimation ............................................................................................95
6 CONCLUSIONS AND RECOMMENDATIONS ...................................................................... 110
REFERENCES ............................................................................................................................116
APPENDIX A HOUSEHOLD SURVEY QUESTIONNAIRE .......................................................... 127
APPENDIX B PROCESSED INFORMATION FROM WATER DIARIES...................................... 131
APPENDIX C WATER BALANCE SPREADSHEET .................................................................... 131

vii
List of Figures
Figure 1-1 Colombia and its location Source: World Bank (2010) .................................................... 1
Figure 2-1 Relations between concepts approached on the Literature Review .............................. 13
Figure 2-2 Sustainable Livelihoods Approach (Ashley & Carney, 1999) ......................................... 16
Figure 2-3 Main determinants of demand (Deverill et al., 2002) ...................................................... 17
Figure 2-4 Average water use per person per day (Shen, 2010 based on UNDP 2006) ................ 23
Figure 2-5 Multiple-use water ladder (van Koppen et al. 2009; van Koppen et al., 2010). .............. 28
Figure 2-6 Schematic representation of river basin processes (Mckinney et al, 1999) ................... 31
Figure 2-7 Schematic flow diagram of a water balance (Perry, 1996) ............................................. 32
Figure 2-8 Water Balance Model (Ratnaweera et al., 2006) ............................................................ 33
Figure 2-9 Domestic water re-use model (Ratnaweera et al., 2006) ............................................... 33
Figure 3-1 Location of the study area (Ospina, 2009) ..................................................................... 43
Figure 3-2 Landscape of the study area .......................................................................................... 44
Figure 3-3 Farmers carrying their harvest ........................................................................................ 45
Figure 3-4 Productive activities ........................................................................................................ 47
Figure 3-5 Storage units at the household level ............................................................................... 47
Figure 4-1 Fieldwork team member interviewing a local woman ..................................................... 54
Figure 4-2 Housewife in one of the monitored households .............................................................. 59
Figure 4-3 Initial proposed sketch for the water balance ................................................................. 60
Figure 4-4 Julio Fernandez Climatic Station .................................................................................... 61
Figure 5-1 Household area (103 m
2) and water consumption .......................................................... 74
Figure 5-2 Household tenure and water consumption ..................................................................... 75
Figure 5-3 Household size and water consumption ......................................................................... 75
Figure 5-4 Household head occupation and water consumption ..................................................... 76
Figure 5-5 Household monthly income (US$) and water consumption............................................ 77
Figure 5-6 Animal husbandry and water consumption ..................................................................... 79
Figure 5-7 Areas planted (103 m
2) with major crops and water consumption .................................. 80
Figure 5-8 Location and water consumption .................................................................................... 81
Figure 5-9 Frequency of service provision and water consumption................................................. 82
Figure 5-10 Storage capacity (m3) and water consumption ............................................................. 83
Figure 5-11 Perception about the impact of water intermittence ..................................................... 83
Figure 5-12 Water per capita consumption for personal hygiene and sanitation ............................. 87
Figure 5-13 Water consumption for uses related to the house ........................................................ 88
Figure 5-14 Domestic per capita consumption in the six monitored households ............................. 89
Figure 5-15 Distribution of the domestic water per capita consumption among uses ..................... 90
Figure 5-16 Map of the study area ................................................................................................... 94
Figure 5-17 System boundaries for the water balance .................................................................... 95
Figure 5-18 Inflow from the water supply system (inter-basin transfer) ........................................... 96
Figure 5-19 Daily rainfall data for the analysis period ...................................................................... 97

viii
Figure 5-20 Monthly historical data and monthly data for the analysis period ................................. 98
Figure 5-21 Global distribution of inflows according to categories of use ...................................... 104
Figure 5-22 Distribution of inflows according to categories of use and stratum. ........................... 105
Figure 5-23 Water balance at the household level......................................................................... 107
List of Tables
Table 2-1 Water quantities for most common domestic uses according to different authors .......... 24
Table 2-2 Typical water consumption figures for livestock .............................................................. 25
Table 2-3 Water consumption for MUS systems according to different authors .............................. 28
Table 2-4. Main components of some water balance models .......................................................... 34
Table 3-1 Coverage and current land use ........................................................................................ 44
Table 4-1 Data cleaning process...................................................................................................... 50
Table 4-2 Descriptive measurements for the stratified population ................................................... 51
Table 4-3 Sensitivity analysis for sample size for the strata ............................................................ 51
Table 4-4 Estimated parameters and sample size for the strata ..................................................... 52
Table 4-5 Final parameters and sample size for the strata .............................................................. 55
Table 4-6 Potential households to conduct the water usage monitoring ......................................... 56
Table 4-7 Factors used to estimate fumigation water demand ....................................................... 64
Table 4-8 Equations, factors and variables to estimate water consumption for MUS ..................... 65
Table 4-9 ―Validated‖ equation, factors and variables to estimate water consumption for MUS ..... 68
Table 5-1 Household characteristics affecting domestic demand .................................................... 85
Table 5-2 Categories of domestic uses measured and number of data .......................................... 86
Table 5-3 Descriptive statistics for per capita water domestic consumption data ........................... 90
Table 5-4 Comparison between the collected data and the Literature Review ............................... 91
Table 5-5 Comparison between average consumption from two methods of estimation ................ 92
Table 5-6 Water inflow from rainfall................................................................................................. 98
Table 5-7 Domestic consumption ..................................................................................................... 99
Table 5-8 Livestock consumption ..................................................................................................... 99
Table 5-9 Coffee processing consumption ..................................................................................... 100
Table 5-10 Other uses consumption .............................................................................................. 100
Table 5-11 Blue water consumption by crops ................................................................................ 101
Table 5-12 Green water consumption by crops ............................................................................. 102
Table 5-13 Other water balance components ................................................................................ 102
Table 5-14 Summary of Water Balance Components* .................................................................. 103
Table 5-15 Figure for water quantities for MUS systems according to different authors ............... 108

ix
Abbreviations and Acronyms
ACRU Agricultural Catchments Research Unit
AQUASTAT FAO's global information system on water and agriculture
BFP Basin Focal Project
B-teeth Brush teeth
CBWC Crops Blue Water Consumption
Cenicafé Centro Nacional de Investigaciones del Café
CFC Crop Fumigation Consumption
CGIAR Consultive Group on International Agricultural Research
CGWC Crop Green Water Consumption
Cinara Instituto de Investigación y Desarrollo en Agua Potable, Saneamiento Básico
y Conservación de Recursos Hídricos, Colombia
COL$ Colombian Pesos
CPC Coffee Processing Consumption
CPWF Challenge Program on Water and Food
CPWF-MUS Challenge Program on Water and Food – Multiple Use Water Services
Project CP28
CROPWAT FAO's model for deficit irrigation scheduling
DANE Departamento Administrativo Nacional de Estadística de Colombia
DC Domestic consumption
DFID Department for International Development, UK
DNP Departamento Nacional de Planeación, Colombia
DRA Demand Responsive Approach
FAO Food and Agriculture Organization
GDP Gross Domestic Product
GIS Geographic Information System
HH Household
HYLUC Hydrology Land Use Change Model
IDE International Development Enterprises
IDEAM Instituto de Hidrología, Meteorología y Estudios Ambientales, Colombia
IRC International Water and Sanitation Centre, The Netherlands
IWMI International Water Management Institute, Sri Lanka
kc Crop coefficient
kg Kilogram
Km Kilometer
Kv Volcanic outcrop
l Liter
x
l/day/hh Liter per day per household
l/He*month Liter per Hectare per month
l/head*day Liter per head per day
LANDSATTM Landsat Thematic Mapper or Earth observation satellite with seven bands at
30m spatial resolution
lpcd liter per capita per day
m meter
m/period meter per period
m2 square meter
m3 cubic meter
m3/KgPC cubic meter per kilogram of parchment coffee
m3/m
2*period cubic meter per square meter per period
MDGs Millennium Development Goals
mm millimeter
mm/yr millimeter per year
MUS Multiple-uses of water
PAAR Programa de Abastecimiento de Agua Rural, Colombia
PFL Pour Flush Latrine
UNDP United Nations Development Program
RAS Reglamento Técnico del Sector Agua Potable y Saneamiento Básico de
Colombia
SLA Sustainable Livelihoods Approach
SPC Swimming Pool Consumption
ST Septic Tank
SV Sevilla Association
SWAP Model for improving water productivity
UN United Nations
UNEP United Nations Environment Program
UNICEF United Nations Children‘s Fund
US$ American Dollar
WEDC Water, Engineering and Development Centre
W-hands Washing-hands
WHO World Health Organization

__________________________________________________________________________________________________________
Balancing consumption and availability in a multiple uses of water system 1
1 INTRODUCTION
1.1 Context
Colombia is located in the northwestern part of South America. The country occupies an area
of 1,141,748 km2, administratively divided into 32 departments and 3 special districts
(AQUASTAT, 2000), and geographically divided in 5 main regions with strong different
characteristics (Meisel, 2007). Figure 1-1 shows a map of Colombia and its location.
Figure 1-1 Colombia and its location Source: World Bank (2010)
Colombia has a total population estimated for 2010 as approximately 45 million (DANE, 2010).
This population is diverse: some 60% are mixed Spanish/indigenous, 20% claim direct
European descent, 18% are Afro-Colombian, and 2% are Indigenous. Population is unevenly
distributed in space, 74% of the total population live in the Andean region occupying
approximately 8% of the country area (Meisel, 2007). The Andean region contains the four
main urban centres and some rural areas where over the past century the coffee economy
had its peak (Murad, 2003).
Approximately, 33% of the country's area is mountainous; climate is mainly tropical with
uniform temperatures, except for differences in altitude, which break this uniformity, leading to
a hot (up to 1000 m), temperate (1000 - 2000 m) and cold climate (above 2000 m)
(AQUASTAT, 2000). The geographical location, varied topography and climate regime has

__________________________________________________________________________________________________________
Balancing consumption and availability in a multiple uses of water system 2
characterized Colombia as one of the territories with major water availability in the world.
However, this availability is not homogeneously distributed between the different regions;
some areas have large surpluses and others suffer deficits. Deficits occur where most
population is concentrated and water yields present low values. The average annual per
capita water supply for the driest year condition, and accounting for quality alteration is
estimated at 26700 m3. Water demand for 2006 was distributed as follows: agricultural sector
61%, domestic sector 21%, industrial sector 9%, livestock 3% and services 1% (IDEAM,
2008).
Colombia is classified as a middle-income country. Its main exports are petroleum, coffee,
coal, emeralds, flowers and bananas (World Bank, 2010). Colombia estimated Gross
Domestic Product at Purchasing Power Parity (GDP PPP) for 2007 was 8,587 US$ per capita
(UNDP, 2009). Agriculture is a main activity within the economy due to its inclusion in
agribusiness, foreign trade, employment generation and quality of life. However, the
Agricultural GDP decreased from 25% in 1970 to 8.5% in 2008 (Gutiérrez, 2009). The Gini
coefficient has remained stable from 2003 to 2009 by 0.59 (DNP, 2009). Therefore, inequality
is high in Colombia and is one of the highest in Latin America (UNDP, 2009). Poverty and
inequality are issues that remain as some of the country‘s main challenges (World Bank,
2010).
Rural Colombia
In Colombia, the rural population comprises small, medium and some large landowners,
fishermen, artisans, those engaged in mining, Indians and many of the Afro-Colombian
communities (Murad, 2003). While the rural population has declined in percentage terms from
33% in 1985 to 24% in 2010, the number of inhabitants in rural areas is still significant,
estimated at about 11 million (DANE, 2010).
The most representative activities of the rural population are agriculture and livestock, despite
the drop on the growth rates of the agricultural sector, particularly, the strongest decline in
1990 due to economic opening and the substantial reduction in coffee production due to the
breakdown of the International Coffee Agreement and phytosanitary problems with this crop
(Forero, J., 2010).
The agricultural sector crisis, the purchase of large areas of land by drug dealers, violence and
forced displacement and the lack of investment in the sector have led to an unequal
distribution of land - the Gini coefficient for land ownership in Colombia is 0.77 (Rodriguez,
2005). For example, in 1995, 47% of farms were under 5 Hectares and occupied 3.2% of the
area, while 3% of farms over 200 hectares occupied 40% of the area. Many of these large

__________________________________________________________________________________________________________
Balancing consumption and availability in a multiple uses of water system 3
farms are dedicated to extensive livestock, changing the previous rural economy and the
traditional annual crops (Pérez & Pérez, 2002). As result, from 9 million hectares suitable for
agriculture, only 5 million are used. On the contrary, from 19 million eligible for livestock, 40
million are used (Murad, 2003).
Rural areas in Colombia have much higher poverty than urban areas. While urban poverty
was 30,7% and indigence 6,8% in the cities, for the same period, in rural areas poverty was
65,2% and indigence 32,6% (DANE & DNP; 2009). In terms of income, the richest 10% of the
rural population receives 30 times the income of the poorest 10% and about 79% of the rural
people do not get sufficient income for a minimal basket of satisfaction (Pérez & Pérez, 2002).
Water service provision in Colombia rural area
Along with the unequal distribution of land and income, access to water service is uneven in
the rural area compared to the urban area. Since 1994, Colombia adopted a model of
decentralization in the provision of public services, allowing private sector participation.
However, ensuring service provision remains as State responsibility. The private sector
operates especially in cities (Foster, V., 2005) while in the rural areas the service is provided
by local communal organizations, since this market is usually not attractive for private
providers. Consequently, rural services commonly present weak operational and financial
indicators, and provide water of deficient quality. Hence, while in 2004 access to water was
93% in urban areas, in rural areas it was 71% (World Bank, 2004). This figure includes non-
conventional options and does not take into account quality and continuity, thus, it is expected
that the actual coverage is lower (Rojas, 2008).
Although, as discussed previously, smallholding occupies a minor part of the rural area, it
remains important since in this small area most of the rural population is concentrated and
have their livelihoods; about 73,4% of the rural homesteads in Colombia have agriculture or
livestock activities (DANE, 2005). Those activities depend on the access to water. However,
poor rural families have been traditionally excluded from land improvement programs and
there is no agency responsible for providing water for those uses. The domestic sector is
concentrated in drinking water supply and the land improvement sector has been weak and
subject to various reforms in the past 20 years. Most investments in irrigation have been made
by the private sector (AQUASTAT, 2000). Thus, Colombia contributes less than 3% of the
irrigated land area in Latin America and this area corresponds to large landholdings, located
on the flat areas and with soils of good quality that are destined for the cultivation of cash
crops (Urrutia, 2006). In consequence, poor farmers that lives on sloping areas and develop
subsistence agriculture rely mostly on water supply systems designed for domestic purposes.

__________________________________________________________________________________________________________
Balancing consumption and availability in a multiple uses of water system 4
The lack of recognition of the small scale productive uses within the mandates of the agencies
that make up the water institutions in the country, domestic or irrigation sector, leads to ignore
these uses in the planning process of water systems. It makes difficult for families to get their
livelihoods and improve their food security.
The current practice for designing water supply systems in Colombia is established under the
Basic Regulation for the Drinking Water and Sanitation Sector RAS – 2000 (Mindesarrollo,
2000), which indicates that in drinking water projects for ―human consumption‖, the net
allocation to satisfy ―the basic water needs for one person‖, is based on the number of
inhabitants in the settlement. It is lower for communities less than 2500 people (100 – 150
lpcd) and there is no upper limit for communities with more than 12500 people. These
guidelines, although formulated for urban areas, have been traditionally used for rural
communities. In 2007 a rural RAS was proposed (Minambiente et al., 2007), but it adopted the
same criteria for the allocation and retains the purpose of systems for only human and
domestic use (Dominguez et al., 2008).
This rigid regulation results in planning and practice that ignores real peoples´ needs. For
instance, the PAAR - Phase I, a Rural Water Supply Program1 developed from 2003 – 2006 to
built water supply systems for rural areas in Valle del Cauca Department, worked in 128
communities, benefiting 138,000 people. This program had a level of recognition of the
linkages between access to water and livelihoods, although, analysis on 92 interventions
highlighted that small-scale productive activities at the household level were identified in 100%
of the project sites (agriculture and livestock). However, 60% of designs were based still on
the RAS - 2000 criteria and just 5% of the agreed Statutes for system management allowed to
use water from the water supply system for productive uses (Cinara, 2007a). This case is an
example of the lack of recognition of people´s livelihoods at all levels of the water institutions,
with the long-term implications this may have on the sustainability of the systems and
eventually on the perpetuation of rural poverty.
1.2 Background
The UN in 2000 established the Millennium Development Goals (MDGs). Three of them are
significant to the water sector: ―to eradicate extreme poverty and hunger; to promote gender
equality and empower woman; and to ensure environmental sustainability‖ (UN 2006). On the
other hand, in 2002, at the Johannesburg Declaration on Sustainable Development,
participant countries agreed to speedily increase access to basic requirements including
among others, clean water, sanitation, food security and protection of biodiversity (UN, 2002).
1 Programa de Abastecimiento de Agua Rural for its Spanish accronym
__________________________________________________________________________________________________________
Balancing consumption and availability in a multiple uses of water system 5
Now, access to water for poor people is an important issue on the international agenda. After
the Johannesburg Declaration, the concept of Multiple Uses of Water Systems (MUS)
emerged as a strategy to introduce water access that responds to the full range of people
needs: both domestic and productive, contributing to poverty alleviation and equity (MUS
group, n.d.). In Colombia, dialogue between academics and water sector professionals began
around the topic in 2003 at the International Conference: ―Multiple uses of water for life and
development‖ (Peña et al., 2006) and later in 2004 through the E – Conference on Multiple
Uses of Water (IRC & Cinara, 2005). These spaces gave visibility to the issue of productive
use of water, especially for rural water supply systems.
Following international trends on poverty reduction and access to water, the Colombian
government proposed a strategy to reduce poverty and inequity (DNP, 2005), which includes
various programs. Within this strategy, in 2007, the Ministry of Agriculture started a program to
construct irrigation schemes in communities that have farmers associated in organizations
incorporated to productive chains. However, people with small scale productive activities did
not satisfy the requirements to get access to this program and in contrast, in 2009 it was
strongly criticized, considered as a Policy to favour the rich instead to favour the poor (Cambio
2009; Semana 2009; Semanario Voz; 2009). Additionally, in 2007 the government launched
the Policy of ―Water Departamental Plans‖ which aimed to increase coverage and to improve
the quality of drinking water services (DNP, 2007). While these Plans have as guidelines the
effective inter-institutional coordination, and the need for integral approaches, these integral
coordination and approaches are inside the traditional institutional water and sanitation sector,
including just water for domestic demands, wastewater collection and treatment, and waste
management. Thus, the agricultural and other important productive sectors for some rural
areas, like Trade and Tourism, were out of the picture, and then the approach was again to
look at the rural areas with the same criteria for the urban.
Between 2004 and 2009, funding by the Challenge Program on Water and Food (CPWF), an
international research project was carried out focused on develop tools to promote MUS
(CPWF-MUS project). Activities were carried out by a consortium consisted of the International
Water Management Institute (IWMI), International Water and Sanitation Centre (IRC), and
International Development Enterprises (IDE), and a wide range of national partners in 8
countries: Bolivia, Colombia, India, Nepal, South Africa, Zimbabwe, Thailand and Ethiopia.
Fieldwork took place in 30 rural and peri-urban communities, districts or regions; and learning
alliances2 were forged for scaling up MUS. The national experiences were disseminated and
discussed in global networks and forums (van Koppen & Smits, 2010).
2 Defined by Lundy et al (2008) as follows: ―Process undertaken jointly by research organizations, donor and development agencies, policymakers and private businesses, which involves identifying, sharing and adapting good practices in research and development in specific contexts. These can then be used to strengthen

__________________________________________________________________________________________________________
Balancing consumption and availability in a multiple uses of water system 6
Cinara undertook the research in Colombia where the focus was to create awareness about
the importance of multiple uses of water for poor rural families, analyze legal and institutional
frameworks for water provision, and formulate proposals to change those frameworks. These
activities were developed following the same strategies of the international project.
Despite the progress made during CPWF-MUS on the conceptual understanding of the
approach, it has been acknowledged the need to investigate how MUS can be applied in
practice, and especially how multiple use services can be developed in an effective and
sustainable manner (Smits et al., 2010). In the specific case of Colombia, with a particular
context, in many ways different from other countries participating in the CPWF – MUS, it is
required to identify, understand, evaluate and convert water needs of rural people in water
demands for multiple needs, looking strategies for equity and poverty reduction. A substantial
advance would be understanding demand for multiple purposes, since in Colombia, the extra
quantities that is believed are required to supply water for both domestic and productive uses
(Moriarty et al., 2004; van Koppen, et al., 2006), are perhaps one of the most conflicting issues
between professionals from Agricultural and Health sector. This issue may be one of the
―bottlenecks‖ for scaling up MUS in this country.
Hence, In Colombia, like in many other countries, water supply systems in rural areas are
used by people to meet their multiple water needs. People use water from these systems for
both domestic and productive activities, like micro – enterprises, keeping livestock, or crops.
These activities support their livelihoods. Despite this reality, the legal and institutional
frameworks that regulates water supply, provides water for drinking or irrigation purposes,
separately. Small-scale productive uses of water – important for poor families‘ food security
and income – are neglected for all sectors. As a result, rural water users engaged in small-
scale activities do not fit into the legal and institutional structure, and their needs are often not
meet, leading to poverty, food insecurity and people migration to the cities. Besides, as
inhabitants of rural areas have different characteristics, including economic levels, those
differences may be reflected on how different households within these systems benefit from
the service levels provided.
Therefore, the intellectual problem I may help to solve through this research is:
The current design standard for rural water supply systems in Colombia allowing for 100 -150
lpcd for communities under 12,500 inhabitants is insufficient to satisfy sustainable and
equitable water requirements for domestic use and production of different households within a
rural water supply system.
capacities, generate and document development outcomes, identify future research needs or areas for collaboration, and inform public and private sector policy decisions‖

__________________________________________________________________________________________________________
Balancing consumption and availability in a multiple uses of water system 7
This research will determine through a case study, using the concept of water balance, the
water requirements for domestic and productive uses, by different categories of households
within a MUS system. These results will contribute to gain understanding on water demand
and water availability in domestic rural water supply systems utilized for multiple uses,
addressing issues of poverty, livelihoods, equity and sustainability, which could possibly be in
the future an input or evidence to make policy changes needed in the water sector in
Colombia.
1.3 Research aims and objectives
This research is intended to gain understanding on water demand and water availability in a
domestic rural water supply system utilized for multiple uses addressing issues of poverty,
livelihoods and equity.
This research has the following objectives:
Objective 1: To characterize groups of households within a MUS system according to aspects
related to poverty, productive activities, livelihoods and access to water
Objective 2: To measure different components of the domestic water per capita consumption
in households within a MUS system
Objective 3: To propose balances at the system and household level, including water demand
for multiple uses and water availability, considering blue water and green water.
1.4 Research questions
This study is intended to answer primarily five questions:
How different groups of households within a multiple uses of water service are
characterized in relation to poverty, livelihoods and access to water?
How these characteristics are related to water use and consumption?
How much water is used in households in a multiple uses of water system exclusively
for domestic purposes?
How much water is used in a multiple uses of water system for productive activities?
How blue water and green water are integrated to supply demands in a multiple uses
system?
1.5 Research methodology
This research follows the case study methodology. This methodology has been extensively
used in multiple uses of water research, especially within the CPWF-MUS (van Koppen &
Smits, 2010). Four studies on MUS relevant to this research have been carried out, using the

__________________________________________________________________________________________________________
Balancing consumption and availability in a multiple uses of water system 8
case study approach: Perez de Mendiguren Castresana (2003) in South Africa, Mikhail (2010)
in Nepal; and in South American countries Smits et al. (2010) in Honduras and Roa & Brown
(2009) in Colombia.
This method is selected because as stated by Yin (2003) is appropriate when ―how‖ or ―why‖
questions are being formulated, the investigator has little control over events, and the focus is
on contemporary phenomenon within real life context. This method also contributes to the
knowledge of individual, group, organizational, social, political and related phenomena, and
allows combining a full variety of qualitative and quantitative evidence.
The research was divided in 3 phases: desk study, fieldwork; data analysis and report writing.
During the desk study period, a systematic review on the relevant literature regarding MUS
concepts and interlinked subjects was accomplished, together with the selection of the case
study area and the review of the existing information relevant to the study regarding this place.
In addition, a preliminary analysis of water consumption records of the households in the
selected system was carried out. During this period, literature review and methodology draft
chapters were the main outcomes and the establishment of contacts and logistic
arrangements for the fieldwork.
The fieldwork period took place in Colombia from June 14th to July 16
th 2010 and specifically
from June 28th to July 9
th 2010 in the selected system ―La Palma Tres Puertas‖. The main
methods used during this period were questionnaire survey, direct observations, water diaries,
unstructured interviews, and flow measurements3. Information on people assets, productive
activities, livelihoods, uses and access to water were elicited from the household survey; water
consumption for domestic uses was established from a mix of strategies: interviews,
observations, direct measurement, meters records and water diaries. Water consumption for
productive uses was estimated applying the water balance approach, using the information
provided from the household survey, household monitoring, meter records and climatic data.
Water availability was estimated through direct measurements and the use of climatic
information.
134 household surveys were applied in the study area, 6 households were monitored for
domestic water consumption; 5 measurements were carried out on the water entering the
system storage tank, and climatic information was compiled from the existing station in the
area. One meeting was held with representatives of the system Water Committee and three
meetings were carried out with the system caretaker.
3 Further discussion on the data collection methods appear in chapter 4 of this document

__________________________________________________________________________________________________________
Balancing consumption and availability in a multiple uses of water system 9
After the fieldwork period, collected data was described, analyzed and discussed. Quantitative
and qualitative data were analyzed and descriptive statistics were computed for several of the
different aspects studied. These analyses were carried out with help of the Excel software.
Results were presented in figures, tables and diagrams and discussed in light of what was
learned from the literature review and looking to answer the research questions posed. Finally,
conclusions were prepared keeping in mind the proposed objectives.
1.6 Scope
This research uses water balance concepts to understand water consumption and water
availability in a multiple uses of water system. Within the scope of this research, water
consumption is restricted to domestic use and productive uses in rural households of
developing countries. Domestic uses include those traditionally studied by the domestic
sector, and productive uses primarily comprise agriculture and animal husbandry, identified as
the most important in rural Colombia. Water availability includes the green water (water in the
soil available for plants) and blue water (fresh water), available to be used by households for
domestic and productive activities. Both blue water and green water are general approached,
given the scale of the available information. For example, the availability of groundwater is not
considered in detail, since this is not the most exploited water resource by the hillside
communities in Colombia, who generally rely on streams.
The unit of analysis on which this research concentrates is the household and the system. The
household is understood as the home and its immediately surrounding land used by the
family(s) living there. The system is understood as the set of households that are beneficiaries
of the water provided by the water supply system. The system has administrative boundaries.
The catchment area is not analyzed, although, it is a point of reference.
The water supply system is restricted here to collective systems delivering water through
household connections. Non-centralized systems, or arrangements where people have to
fetch water are not common in Colombia, especially in mountain areas. Water supply systems
for irrigation are also out of this research, because as discussed in the introductory chapter, in
Colombia there is a small area under irrigation and investments in such infrastructure are
mainly made by the private sector. Water quality issues have been deliberately taken out as
well, to reduce complexity to the analysis.
One of the limitations in this study is that a significant proportion of the reviewed information
has been written manly by the promoters of the MUS concept framed in the CPWF – MUS
project, since those are who have published almost what is available on the subject. However,
this limitation was somewhat counterbalanced by the review of other documents about the
__________________________________________________________________________________________________________
Balancing consumption and availability in a multiple uses of water system 10
aspects interconnected to the MUS concept, such as water consumption and water
availability, written by other researchers and organizations or in other fields of application.
Besides omitting all the aspects above, no attempt was made to include issues related to
technology for accessing water, management or financial aspects of water supply systems for
MUS.
1.7 Intended readers
This document is intended for practitioners, researchers, implementers, policy makers, service
providers, and community leaders of rural water supply systems, whether in the domestic or
agricultural sector, especially in Colombia. To all those who want to move a little outside from
the models or patterns of their professional training or field of performance and willing to
increase their understanding, through this case, on the water demands of rural people, and
how they are related to productive activities and livelihoods. This is a rather obvious
relationship to the beneficiaries of the systems, yet quite unknown at other levels.
Also the same group of people, but not performing in the water sector; instead, fostering
policies, programs or projects for poverty reduction, strengthening of production chains,
promoting rural tourism, etc., All seeking to improve living conditions of people, but sometimes
ignoring that water is required to undertake in a successful and sustainable manner, these
strategies.
Finally, professionals from various disciplines interested in working together, especially those
from the health and agricultural sector, trying to agree on service levels, to be sustainable,
equitable, and appropriate to the needs of people, especially the poorest.
1.8 Structure of the report
The present document has been structured as follows:
Chapter 1 contains the introduction where the context is outlined, including relevant
information about Colombia, and a background on the multiple uses of water topic leading to
the problem definition and the questions to be solved. The methodological basis for the
research and the methods used are listed briefly. Finally, the scope of work and a list of
intended readers are presented.
Chapter 2 reviews the literature significant for the research; contains an overview to the
linkages of poverty, productive activities, livelihoods and access to water, followed by the
__________________________________________________________________________________________________________
Balancing consumption and availability in a multiple uses of water system 11
multiple uses of water concept and its current state, findings, challenges and research gaps. A
section on planning of rural water supply systems under a MUS approach, and methods used
to study some of the topics reviewed appear are the end of the chapter.
Chapter 3 is an overview to the study area, includes general aspects, water uses, water
supply system, and review previous work on multiple uses of water previously developed in
the area.
Chapter 4 describes the methodology addressed to research on the objectives. It includes
besides the methods and instruments applied, the activities developed, aspects of data
management, data analysis and limitations.
Chapter 5 presents and discuss the findings from the research activities carried in relation to
the information on the literature review and the research questions formulated. It contains
relations between categories of households based on water consumption and poverty,
livelihoods and access to water; water consumption for domestic purposes in households
within a multiple uses of water system; water consumption for productive activities; water
availability and interaction between blue and green water to supply people´s demands.
Conclusions are presented in Chapter 6 regarding to the objectives drawn, the
appropriateness of the methods used, and recommendations for further studies
At the end of the document, there is a list of references containing publications in English and
in Spanish.

__________________________________________________________________________________________________________
Balancing consumption and availability in a multiple uses of water system 12
2 LITERATURE REVIEW
This chapter provides a review of the existing published literature on the MUS topic and on
interlinked subjects central to it. It also describes the methodology used and the structure of
the review. The chapter presents and discusses aspects such as poverty and access to water
in rural areas; poverty reduction, Sustainable Livelihoods Approach, Demand Responsive
Approach; MUS concept, water consumption for multiple purposes, water availability, water
balances and budgets, and methodologies to research on the latter issues. At the end of the
chapter, a section summarizing the core aspects of the literature review is drawn.
2.1 Methodology
The review started with the consultation of the available literature published by researchers
and organizations that promote the MUS concept in order to acquire a general understanding
of the subject. Researchers like van Koppen, Moriarty, Butterworth, Smits, Bolee and
organizations such as IWMI, IRC and GWP were initially consulted. The literature available
from these sources was in the form of books, conference papers, brochures and some few
articles in academic journals. From this initial review, key concepts related to the topic and the
particular purpose of this research were identified, broadening the review strategy to look for
documents from other organizations and with a strongest focus on academic journals to
identify the most recent findings related to the interest topic and concepts.
Information was obtained from the World Wide Web, and the Metalib database. Ideas object to
review were water and poverty, Demand Responsive Approaches, Livelihoods Approach and
Multiple Uses of Water. Terms and phrases searched were: water consumption, water
demand, water availability, multiple uses of water, productive uses of water, water and poverty
reduction, water and poverty alleviation, water sources, multiple sources, water supply
systems for multiple uses, water availability, rural water supply, water use(s), domestic
use/consumption, livestock use/consumption, agricultural use/consumption, water balances,
on farm water balance, green water, blue water, water use in rural areas, household level,
system level, farm level, micro-scale, meso-scale, domestic use, rural livelihoods, hydrological
cycle, and water accounting, to name some. Boolean operators (AND, OR, NOT) were used to
refine the search.
The review boundaries, broad category of concepts reviewed and how they relate according to
the author, and as they are presented in this document are shown in Figure 2-1.

__________________________________________________________________________________________________________
Balancing consumption and availability in a multiple uses of water system 13
Figure 2-1 Relations between concepts approached on the Literature Review
Within the Metalib, databases such as Aquabase, Article First, Water Resources Abstracts,
Illumina, Geobase, Science Direct, Greenfile EBSCO and Ingenta Connect were the preferred
sources to carry out the search for the terms. The journals where the most relevant
information was found were:
Agricultural water management
Agriculture and human values
Irrigation and drainage
Hydrology and earth systems science
Journal of hydrology
Consumer studies and human
economics
Land use policy
Technovation
Human ecology
Physics and chemistry of the earth
Water and environmental journal
Water international
Water resources development
Water resources
Waterlines
The Journal Physics and Chemistry of the Earth had the bulk of the most useful papers
according to the purposes of this review. The information from journal articles was
administered by using Refworks, where all the references were stored in folders according to
the topics. A ―snowball‖ method (UNC, n.d.) was followed in order to find relevant journal
articles and the main authors on a specific topic. Available tools in some Databases like
―Related articles‖, ―Cited by‖, ―Relevant terms from this article‖ and links to other articles
referenced were helpful. Besides Metalib, Google scholar was also an important source of
information.
Along with databases, information on websites from different groups and organizations such
as musgroup, IWMI, FAO (Food and Agriculture Organization), HR Wallingford, WEDC and

__________________________________________________________________________________________________________
Balancing consumption and availability in a multiple uses of water system 14
GWP (Global Water Partnership) provide information to gain understanding on the concepts
subject to review. Conference papers and journal articles were important to know about the
methodologies, conclusions and state of the research in the topic.
2.2 Structure
This review has been divided into 6 sections. The first three sections are a sort of conceptual
framework that has been divided on: poverty and access to water in rural areas; poverty
reduction, Sustainable Livelihoods Approach, Demand Responsive Approach, and Multiple
Uses of Water. The latter includes the main ideas of the concept, its conflicting issues and
premises. Fourth section is about planning rural water supply systems under a MUS approach,
and is intended to bring together different aspects of water demand and water availability,
which are usually addressed separately by different sectors. Thus, a review on water use and
consumption for domestic uses, livestock, agriculture, and the integration of the three is
included. It also introduces a section on water availability, making a differentiation between
blue and green water. Finally, water balances and water budgets concepts, models and
frameworks are included. The fifth section reviews the methodologies that have been used to
research on the MUS concept and its interlinked subjects: water use and consumption, water
availability and water balances. At the end of the chapter, the core aspects of the literature
review are summarized.
2.3 Poverty and access to water in rural areas
Poverty can be defined as a pronounced deprivation in people´s ability to obtain certain
consumption goods or to function in society, and this is manifested through the limited
circumstances of poor regarding aspects like income, education, health, security, self-
confidence, power or rights. Poverty can be understood at different levels and correlated to
different causes, among them: geographical isolation, low resource base and low rainfall. In
rural areas, isolation leads to weak public services, communication and infrastructure, being
the latter, one of the most important determinants of poverty at community level. At the
household and individual level, poverty can be described through indicators such as
household size, number of family members not in labour force to those in the labour force,
gender of the household head, household employment, property and other assets. The
human, physical, natural, financial, and social assets that poor people have allow them to
escape from poverty. Some of those physical assets are land, cultivated areas, livestock,
agricultural equipment, etc. Liquid assets and savings are financial assets. The availability and
use of drinking water is often used as a social indicator of poverty (Haughton & Khandker,
2009).
__________________________________________________________________________________________________________
Balancing consumption and availability in a multiple uses of water system 15
International Agencies indicate that one billion people live on less than US$1 a day, and rural
areas account for three quarters of these people and a for a similar proportion suffering from
malnutrition. At least 1.1 billion do not have access to safe water, again with a more
pronounced disparity between rural and urban areas in developing countries: while 92% of the
urban population have access to water in urban centres, only 72% is covered in rural areas. It
makes evident the correlations between access to adequate water and sanitation with
differences on income and poverty (UNDP, 2003; UNDP, 2006; UNDP, 2007)
The statistics show that poor people are more vulnerable than the non-poor to lack of water
supply and sanitation services, or to receive these services with lower quality or reliability
(Yang et al., 2006; Hansen & Bhatia, 2004). In contrast, in high-income areas, people have
significant higher levels of service provided at lower prices by public utilities, where 85% of the
wealthiest 20% households have access to piped water through household connections
compared to the 25% for the poorest 20% (UNDP, 2006).
Most poor people living in rural areas of developing countries, depend on agricultural
production for their income and for them, lack of access to affordable infrastructure services,
including intermittent or no water supply affect their possibilities to develop productive
activities (World Bank, 2009). For these people, access to ―improved‖ water sources which
encompasses: quality, proximity and quantity are a key factor to support their livelihoods and
to help them to escape from poverty, making possible to increase productivity, employment,
reduce the risks associated with drought, diversify their income sources, and increase their
security to undertake investments into higher value production chains. It explains the links
between rural livelihoods, access to water and poverty reduction efforts (UNDP, 2006).
2.4 Poverty reduction, Sustainable Livelihoods Approach and Demand Responsive
Approach
The call for actions which satisfy people needs and especially that target the poor have led to
the formulation of concepts and tools to support interventions across the development sector.
One of those ―movements‖, the Sustainable Livelihoods Approach (SLA) was developed by
DFID (Department for International Development) and suggests that interventions require a
comprehensive analysis, people-centred (Moriarty & Butterworth, 2003) which includes an
investigation of people´s assets, vulnerability context, institutions and policies, livelihood
strategies and outcomes (Ashley & Carney, 1999).
SLA considers that people require a range of assets to achieve positive livelihood outcomes.
Assets are divided into natural, social, human, physical and financial. Basic infrastructure, like
water supply and sanitation (of adequate quantity and quality) is part of the physical assets,

__________________________________________________________________________________________________________
Balancing consumption and availability in a multiple uses of water system 16
and lack of particular types of infrastructure is considered a core dimension of poverty
(Moriarty & Butterworth, 2003). The framework introduces a ―vulnerability context‖ related to
the external environment in which people exist, including the trends and shocks that affect
people´s livelihoods. It also involves ―Transforming structures and process‖ understood as the
institutions, organizations, policies and legislation that define livelihoods. Livelihood outcomes
are the output of livelihood strategies, which are divided on more income, increased well
being, reduced vulnerability, improved food security, and more sustainable use of the natural
resource base (Ashley & Carney, 1999). All these elements are shown on the sketch in Figure
2-2.
Figure 2-2 Sustainable Livelihoods Approach (Ashley & Carney, 1999)
From the water perspective, SLA focuses on providing access to appropriate infrastructure
that enables people to achieve their livelihoods objectives (Ashley & Carney, 1999; Nicol,
2000) by recognizing that most people develop a range of activities to fulfil their needs and
aspirations and that they have a variety of clear strategies to achieve them (Moriarty &
Butterworth, 2003). As suggested by Nicol (2000) to apply the SLA to water supply
interventions, it is required to analyse water resource use, through ―unpacking‖ the
components of demand at the household level.
The SLA is aligned with the Demand Responsive Approach (DRA). DRA states that provision
of a particular service in order to be sustainable should be an ―informed expression of what
people desire, together with the investments people are prepared to make, over the lifetime of
the service to sustain it‖ (Deverill et al. 2002). In water supply projects adopting a DRA imply
that engineers and technicians need to assess demand according to people livelihood
strategies, which in most cases, for rural areas, comprises needs such as garden irrigation,
livestock watering, building blocks manufacturing, etc. Therefore, a more flexible approach is
__________________________________________________________________________________________________________
Balancing consumption and availability in a multiple uses of water system 17
required allowing for interventions to consider those needs in conjunction with domestic
needs, as long as people are willing to assume the costs of increased levels of service
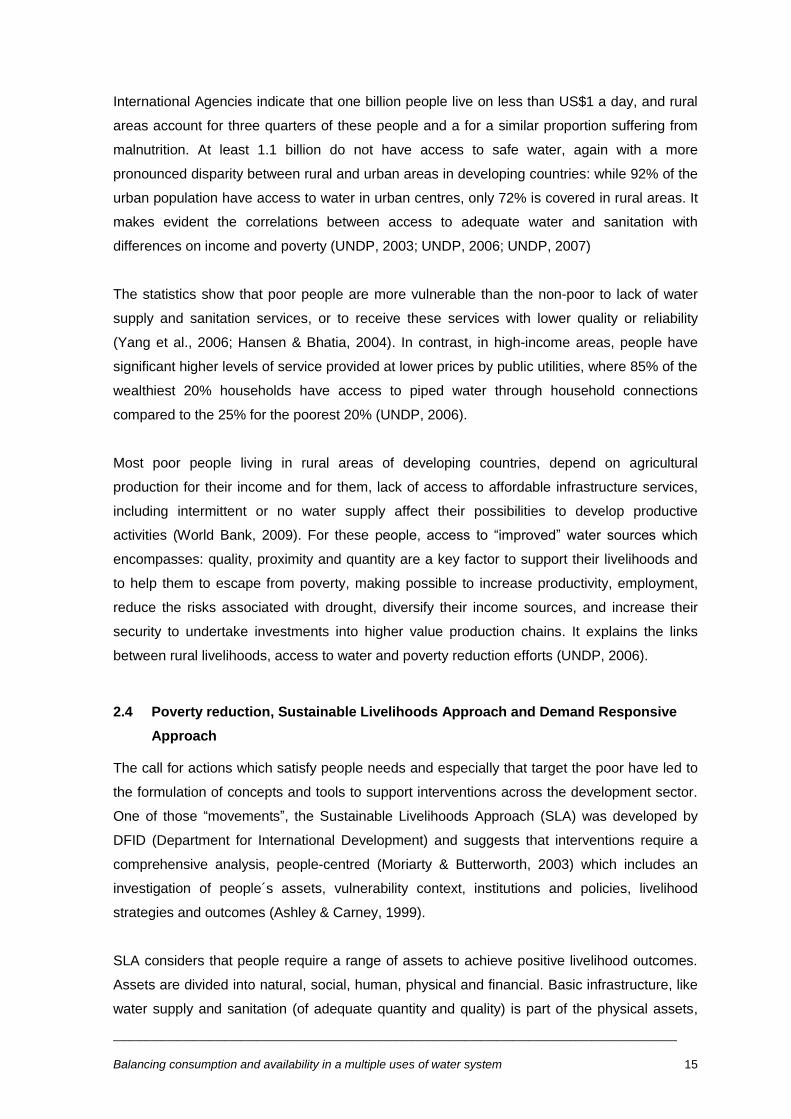
(Deverill et al. 2002; Moriarty & Butterworth, 2003). Figure 2-3 is a representation on the main
determinants of water demand under the DRA.
Figure 2-3 Main determinants of demand (Deverill et al., 2002)
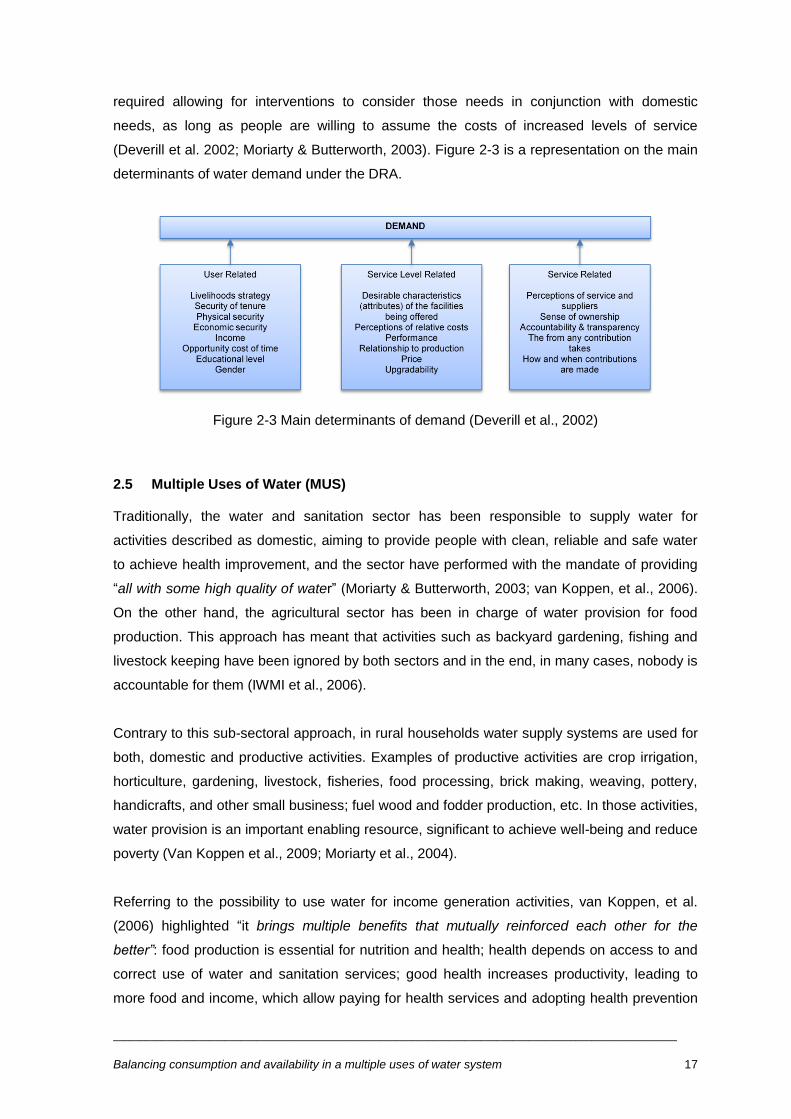
2.5 Multiple Uses of Water (MUS)
Traditionally, the water and sanitation sector has been responsible to supply water for
activities described as domestic, aiming to provide people with clean, reliable and safe water
to achieve health improvement, and the sector have performed with the mandate of providing
―all with some high quality of water‖ (Moriarty & Butterworth, 2003; van Koppen, et al., 2006).
On the other hand, the agricultural sector has been in charge of water provision for food
production. This approach has meant that activities such as backyard gardening, fishing and
livestock keeping have been ignored by both sectors and in the end, in many cases, nobody is
accountable for them (IWMI et al., 2006).
Contrary to this sub-sectoral approach, in rural households water supply systems are used for
both, domestic and productive activities. Examples of productive activities are crop irrigation,
horticulture, gardening, livestock, fisheries, food processing, brick making, weaving, pottery,
handicrafts, and other small business; fuel wood and fodder production, etc. In those activities,
water provision is an important enabling resource, significant to achieve well-being and reduce
poverty (Van Koppen et al., 2009; Moriarty et al., 2004).
Referring to the possibility to use water for income generation activities, van Koppen, et al.
(2006) highlighted ―it brings multiple benefits that mutually reinforced each other for the
better‖: food production is essential for nutrition and health; health depends on access to and
correct use of water and sanitation services; good health increases productivity, leading to
more food and income, which allow paying for health services and adopting health prevention

__________________________________________________________________________________________________________
Balancing consumption and availability in a multiple uses of water system 18
measurements; better nutrition decreases susceptibility to disease, reduce drudgery, frees up
time for productive activities, domestic child care or schooling.
Despite the potential benefits of multiple uses of water, especially for poor people, these
small-scale uses are normally ignored in formal planning process done by the different
subsectors involved. In the domestic sector, the accepted definition of basic needs leads to
design norms that frequently are insufficient to provide the quantities of water required to
develop home-based activities, limiting the livelihood possibilities of poor people (Moriarty &
Butterworth, 2003). In general, international, national norms and guidelines used for planning,
account for basic needs or basic human rights having into account quantities required only for
drinking, cooking and personal hygiene, in a range of 25-40 lpcd (van Koppen, et al., 2006). In
opposition to this ―paradigm‖ conclusions from the international symposium on ―Productive
uses of water at the household level‖ in South Africa in 2003, indicated that quantities of water
in the range of 50 - 200 lpcd were adequate for meeting multiple basic human needs
(Butterworth et al. 2003). The latter range is similar to the quantities supplied exclusively for
domestic uses to urban people in developed countries (van Koppen, et al., 2006).
Due to planning practices such as designing for a lifespan, allowance for losses and other
engineering considerations, sometimes unplanned uses can be absorbed by the system (van
Koppen et al., 2009), at least during the first years of infrastructure operation. Although, when
the extra amount of water required to support people livelihoods is not provided, a variety of
problems can threaten the sustainable provision of the services, resulting in interventions that
are not sustainable or insufficient for real people needs. Generally, these failures have more
impact on the poorest, which are less capable to cope with them (Moriarty & Butterworth,
2003). Some of the reported failures are damage to infrastructure, disruption of allocation
schedules, deprivation of tail-enders and increase of conflict (van Koppen et al., 2006;
Moriarty et al. 2004). A widespread solution adopted to minimize these problems is the
formulation of national and local regulations to ban productive uses in domestic schemes,
although, these solutions usually fail and just contribute to exacerbate conflicts (van Koppen et
al., 2006).
The MUS concept has emerged in response to these challenges. van Koppen et al. (2006)
define it as an approach that ―looks to acknowledge people multiple water needs and their full
participation from the outset on water projects to really meet people water demands as an
strategy to enhance people livelihoods, contribute to poverty alleviation and achieve
sustainability of water systems, without deprivation of the supporting water resources and the
environment‖.
__________________________________________________________________________________________________________
Balancing consumption and availability in a multiple uses of water system 19
In relation to the environmental sustainability, the approach recognizes that for meeting their
water demand, in most cases, people use multiple sources at homestead scale to augment
the available water supply, allowing households to employ water of different qualities for
different purposes (Scheelbeek, 2005). The extent to which multiple sources are used varies
from case to case. Experiences in Thailand showed that people combine up to nine water
sources to supply different needs as result of a National Policy that promotes intensive
production and recycling of water and nutrients at the homestead level (van Koppen & Smits,
2010). In contrast, some regions in Colombia are at the other extreme, where piped systems
are the main source of water for all uses (van Koppen et al., 2009).
The promotion of various water sources is considered within this concept as a promissory
alternative to enhance the total quantities required, stimulate water reuse and increase the
resilience to water availability (van Koppen et al., 2009).
The range of potential uses and sources that can be included under MUS requires for
implementers to offer a variety of options to each community for their selection that has to be
the result of an understanding of the local context in relation to water uses, water resources
and available technology. To do this, a call is made to take into account that different
communities have different priorities, preferences and availability of water resources and this
situation is extended to the different households and population groups within communities
(Mikhail, M., 2010).
2.5.1 Conflicting ideas of MUS
Water quantity: To allow small-scale productive activities at the household level, it is required
to supply bigger quantities of water compared to those required just for domestic needs. This
is a major issue, especially in water supply systems for domestic uses, where productive uses
occur (van Koppen, et al., 2006). At all levels, from policy makers to users, voices have been
heard arguing that this major quantities could threaten sustainability and that is better to
supply small quantities of good water quality. MUS advocates for provision of a household
supply for both basic needs and productive uses where water needs are anticipated and
planned during the designing stage. It involves as a precondition assuring that enough water is
available according to people requirements, but at the same time, that allocations are
sustainable to avoid infrastructure or environmental damage, conflicts with prevailing users,
and ensuring financial sustainability of service provision (Moriarty et al., 2004). To achieve
this, some proposed alternatives are increasing capacity of abstraction, storage and delivery
infrastructure, and considering multiple sources for multiple uses (van Koppen, et al., 2006).

__________________________________________________________________________________________________________
Balancing consumption and availability in a multiple uses of water system 20
Water quality: In systems supplying treated water, it is considered a waste to use this water
for productive activities like irrigation or cleaning piggeries (Moriarty and Butterworth 2003; van
Koppen, et al., 2006; Moriarty et al., 2004). In systems that supply untreated water, there are
issues related to health, when this water is used for drinking purposes (van Koppen, et al.,
2006). MUS promoters argue that, providing better access to larger quantities of water,
together with household treatment technologies and hygiene promotion, may improve health
more effectively than often ineffective measures to ensure that high water quality is supplied
(IWMI et al., 2006). This is an important argument in the case of rural areas in developing
countries where, regardless of presence or absence of centralized water treatment, in
practice, for several reasons, households do not receive drinking water quality. Reasons to
support this argument include that systems and treatment infrastructure are not properly
operated, technology have not being adequately transferred, lack of inputs, lack of skilled
personal, pollution of the treated water during transmission, distribution or household storage,
etc. (Moriarty et al., 2004). Besides, in many situations the sources exploited, groundwater or
streams, can deliver water quality acceptable for domestic uses, sometimes even for drinking
(van Koppen, et al., 2006).
There is still debate to come up with appropriate alternatives to harmonize the different
people´s water needs in terms of quantity and quality for the different uses in a sustainable,
efficient, safe and cost – effective way. A combination of treatment at the point of use and
hygiene promotion looks a promising alternative to achieve these purposes (Nath et al., 2006).
Equity: the orientation of the water sector that has been discussed, to provide some water of
good quality for all, giving priority to increase coverage, is a concern since it is believed that
MUS services require more water resources and are more expensive (van Koppen, et al.,
2006). Currently, part of the research agenda on MUS is oriented to develop cost-benefit
studies in order to probe the validity of this hypothesis. There is also concern with regard to
the way benefits of MUS services are distributed across different population sectors, since
there is a risk that the interventions on MUS allow rich people to exploit the opportunities of
the highest levels of service to the detriment of the poorest (Mikhail, 2010). For instance, in
rural Honduras Smits (2010) found within water supply systems for multiple purposes that
water consumption varies according to user categories, defined based on household head
occupation. In this study, people in the labourer category have negligible water consumption
for productive uses (2.7 lpcd) compared to those on the large-farmer category, with
consumptions around 480 lpcd. Another study by Hadjer (2005) addressing levels of
consumption according to social status, found that the rich consumed up to 50% more water
compare to poor households. MUS promoters suggest setting operational rules and financial

__________________________________________________________________________________________________________
Balancing consumption and availability in a multiple uses of water system 21
incentives to avoid inequality (van Koppen, et al., 2006). Equity aspects require to be further
studied and there are still many questions to formulate and solve.
2.5.2 Premises
Some of the main arguments to defend the MUS concept, stated by the main researchers (van
Koppen, Moriarty, Bolee, Smits, Butterworth and their organizations (i.e. IWMI and IRC) are
listed below
Water quantities required for small scale productive activities, which support people
livelihoods are minor, if not negligible, being the issue to provide the poor with financial,
technical and institutional resources that allow them to have access to the required
infrastructure to satisfy their water needs
Planning and design of services need to be responsive to, and based upon, a thorough
understanding of people’s livelihoods taking as the starting point for planning, people
multiple water needs at preferred sites
Planning and design of services using naturally available water resources need to be
efficient, equitable and sustainable. Water from multiple and conjunctive sources should
be used and reused to meet multiple needs. The knowledge of communities and service
providers should be increased to monitor water resources and the relevant
interconnections between different parts of the hydrological system, sites and periods of
competition for the available sources. Conflict resolution abilities are required to negotiate
the protection of basic human, domestic and productive needs and the already prevailing
users.
A multiple use approach involves: (1) assessing the range of water needs in collaboration
with end users, ensuring that women’s and men’s multiple water needs are equally
articulated, translated into ―water demand characteristics‖ such as: quantity, quality, site,
timing/period, and incorporated into the design; (2) examining the water sources
available— from rainwater to wastewater; and (3) matching water supplies to needs
based on the quantity, quality and reliability required for various purposes
2.6 Planning rural water supply systems under a MUS approach
As previously mentioned the MUS concept looks for the consideration of the small-scale
productive uses of water in conjunction with domestic uses from the planning stage of rural
water supply systems and its extension to the project cycle life, aiming for poverty reduction,
support of people livelihoods and sustainability. For planning systems under these purposes,
demand for water should be based on the range of people uses and an integral consideration
of the potential sources available, since the required water quantities may be higher than

__________________________________________________________________________________________________________
Balancing consumption and availability in a multiple uses of water system 22
those traditionally supplied by the domestic water sector. Therefore, the way to come up to
water use, consumption, and water availability on the water sub-sectors (i.e. domestic and
agriculture) should be revaluated. An attempt to integrate the concepts necessary for this is
developed in the subsequent sections:
2.6.1 Water uses and consumption
In rural communities homesteads generally comprises the house where people have shelter
and relatively extensive areas to develop agriculture activities that provide their livelihoods. In
these homesteads, besides domestic uses, water uses are related to irrigation for growing
vegetables, staple food, wood for fuel, fruit and trees; livestock watering, coffee processing,
and small business such as beer brewing, ice-making, catering, pottery, hair salons, laundry,
car washing, etc. In these contexts, production is diversified, and each water use is an
important factor to produce livelihood outcomes such as household income and food security
(Van Koppen et al., 2009). Some of the most representative categories of water uses at rural
homesteads are described below:
Water for domestic uses: Norms by international organizations suggest a minimum
requirement of 20 l/day from a water source within 1 Km of the household, as a quantity
sufficient for drinking, basic personal hygiene and for physical well-being and dignity. This
quantity increases to 50 lpcd when bathing and laundry needs are included (UNDP, 2006).
In different countries there are different basic needs figures used for planning purposes, for
instance for South Africa those are 25 lpcd, 55 lpcd in India (Moriarty et al., 2004), 60 lpcd in
Zimbabwe and 40 lpcd in Swaziland (HR Wallingford, 2003). Sometimes those targets are
smaller for rural areas in comparison to targets for urban areas as in the case of Colombia,
where the target for areas less than 2500 inhabitants is from 100 - 150 lpcd and for
communities with population higher than 125000 there are not superior limit for water provision
specified on the designing guidelines RAS – 2000 (Mindesarrollo, 2000).
Figure 2-4 presents the average water use per person per day for developing and developed
countries prepared by Shen (2010) with data from the United Nations Human Development
Report 2006. This Graph shows the differences on water use between developed and
developing countries going from negligible quantities in Mozambique to levels inferior to those
promoted by International Agencies as minimum requirements (50 lpcd) for countries such as
Rwanda, Uganda, Ethiopia; to the other extreme of United States and Australia, where the per
capita consumption exceed 450 lpcd. In the case of developed countries, the average water
use of European people is more than 200 lpcd (UNDP, 2006), and UK appears as the
developed country with the lowest per capita consumption in the Graph, with about 150 l.
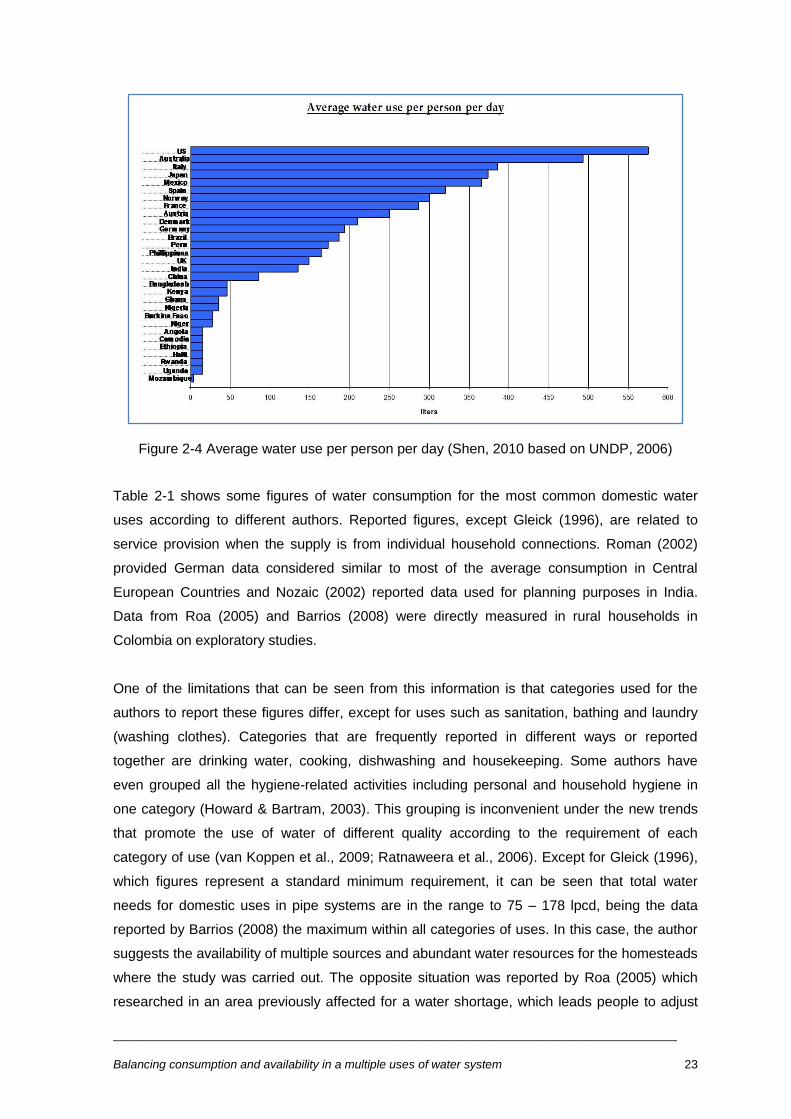
__________________________________________________________________________________________________________
Balancing consumption and availability in a multiple uses of water system 23
Figure 2-4 Average water use per person per day (Shen, 2010 based on UNDP, 2006)
Table 2-1 shows some figures of water consumption for the most common domestic water
uses according to different authors. Reported figures, except Gleick (1996), are related to
service provision when the supply is from individual household connections. Roman (2002)
provided German data considered similar to most of the average consumption in Central
European Countries and Nozaic (2002) reported data used for planning purposes in India.
Data from Roa (2005) and Barrios (2008) were directly measured in rural households in
Colombia on exploratory studies.
One of the limitations that can be seen from this information is that categories used for the
authors to report these figures differ, except for uses such as sanitation, bathing and laundry
(washing clothes). Categories that are frequently reported in different ways or reported
together are drinking water, cooking, dishwashing and housekeeping. Some authors have
even grouped all the hygiene-related activities including personal and household hygiene in
one category (Howard & Bartram, 2003). This grouping is inconvenient under the new trends
that promote the use of water of different quality according to the requirement of each
category of use (van Koppen et al., 2009; Ratnaweera et al., 2006). Except for Gleick (1996),
which figures represent a standard minimum requirement, it can be seen that total water
needs for domestic uses in pipe systems are in the range to 75 – 178 lpcd, being the data
reported by Barrios (2008) the maximum within all categories of uses. In this case, the author
suggests the availability of multiple sources and abundant water resources for the homesteads
where the study was carried out. The opposite situation was reported by Roa (2005) which
researched in an area previously affected for a water shortage, which leads people to adjust

__________________________________________________________________________________________________________
Balancing consumption and availability in a multiple uses of water system 24
their consumption practices. Drinking and food preparation is the category with the narrow
range of consumption for all authors, as can be expected, since this is the priority use, which
consumption is less affected by aspects such as water availability, access or price.
Table 2-1 Water quantities for most common domestic uses according to different authors
Domestic water uses
Gleick
(1996)
Roman
(2002)a
Nozaic
(2002)b
Roa
(2005)c
Barrios
(2008)d
Range
Drinking water (lpcd) 5 5 5
Sanitation(lpcd) 20 35 18 13 41 13 – 41
Bathing (lpcd) 15 46 20 12 21 12 – 46
Cooking and kitchen (lpcd) 10 10
Drinking and food preparation (lpcd) 5 4 4 4 – 5
Dish washing (lpcd) 8 15 11 28 8 – 28
Laundry (lpcd) 16 20 27 79 16 – 79
Cooking (lpcd) 3 3
Other (lpcd) 8 8
Housekeeping (lpcd) 5 5
Brush teeth and hand washing (lpcd) 3 5 3 – 5
Total (lpcd) 50 118 81 75 178 50 – 178
a German data, considered similar for water consumption to those in Central European countries, Roman quoted Globus, statistische Angaben: Bundesverband der Deutschen Gas und Wasserwirtschaft. b Indian data Nozaic quoted the Design Manual for water supply and treatment (1991). c Households within a catchment in a rural area of Valle del Cauca Department in Colombia. Values are the rounded average of reported Max and Min values for each consumption category. d Three households in Quindío Department in Colombia. Values are the rounded average of the three reported data
Water for livestock: Livestock production systems support about 4 billion people,
constituting the livelihoods of at least 70% of the world´s rural poor. About 20 million km2 in
Central and South America are dedicated to this purpose and from those, 70% accounts for
non-irrigated or rangeland systems. Livestock are an important source for family income
providing products as milk or meat, manure, farm power, etc. and are a vital strategy to
enhance income and cope with unexpected family expenses or shocks (Peden et al., 2007).
For livestock production systems, even at small scale, the benefits derived depend on
adequate water provision. In reference to the concerns expressed by different authors in
relation to the impact of livestock production systems over water resources at global and local
scales, specially the large volumes ―thought‖ necessary to produce human food for livestock,
Peden et al. (2007) bring out, how for more poor regions in developing countries, livestock
keepers feed their animals mostly with crop residues, suggesting that water requirements are
not as great as is thought.
There is not much literature related to water consumption by animals and even the most
recent sources refer to a report by Pallas (1986) ―Water for animals‖. According to this report,

__________________________________________________________________________________________________________
Balancing consumption and availability in a multiple uses of water system 25
livestock water consumption is influenced by food intake, quality of the food, air and water
temperature. In relation to the demand for food, it varies according to the type and class of
animal and life stages such as pregnancy, lactation or fattened. Other aspect is the content of
water in the forage, which depends on the season, i.e. during the wet season grass may
contain as much as 80 percent water. Content of salts on the forage is another factor i.e.
major content of salt in plants used as forage in semi arid areas increase water demand. The
water requirement also increases with air temperature.
Pallas (1986) also defines ―voluntary water intake‖ by livestock as the quantity of water which
cannot be provided by the moisture content of the forage. This is the amount of water to
consider, when water supply systems will allow for livestock demands. Table 2-2 presents
some data regarding water demand for livestock reported by different literature sources.
Table 2-2 Typical water consumption figures for livestock
Type of livestock
Water consumption (litres per head per day)
Nozaic a
(2002)
HR
Wallingford
(2003)
Ospina
(2009)
Roab
(2005)
Peden
(2007)
Barriosd
(2008) Range
Beef cattle 25 - 45
25 - 45 25
8 - 14 40 – 45 c 9 8 - 45
Dairy cattle 40 - 60 70 – 85 c 54 40 - 85
Horses 20 - 35 30 - 45 20 10 10 - 45
Pigs 10 - 15 10 - 20 15 7 - 10 14 10 - 20
Chicken, litres per
100 birds per day 15 - 25 30 - 40 20 15 - 37 15 - 40
a Data reported for Indian cattle.
b Households within a catchment in a rural area of Valle del Cauca
Department in Colombia. Values were rounded c Data reported for Canadian cows.
d Three households in
Quindío Department in Colombia. Values are the rounded average of the three reported data
Table above shows those differences stated by Pallas (1986), regarding the disparity in water
consumption according to the purpose of the animal, in the case of cattle (dairy or beef). This
difference can be considered in order to decide livelihoods strategies in water stress areas.
Data from Roa (2005) and Barrios (2008) are minor since those correspond to the defined
voluntary intake.
Water for agriculture: Worldwide, agriculture is the largest user of water, accounting with
70% of the total consumption (UNEP, 2007). This water share is very much higher in some
developing countries like Pakistan (97%), India (93%), China (87%), and Egypt (86%). In
Colombia, this proportion is 61% (IDEAM, 2008).
Agriculture uses water through evapotranspiration, transpiration by plants and evaporation
from soils. In recent years there has increased the interest to make a distinction between the
water withdrawal for agricultural purposes from rivers, reservoirs, lakes and aquifers, from the

__________________________________________________________________________________________________________
Balancing consumption and availability in a multiple uses of water system 26
rainwater stored in the soil and directly used by the plants. The first one has been called ―blue
water‖ and the latter ―green water‖ (Molden et al., 2007). Agriculture which uses only green
water is called rainfed. Irrigation is required when the water requirements of the plants cannot
be satisfied only with the rain and thus, blue water need to be added to maintain adequate soil
moisture levels for crops to achieve their potential yields. Globally, around 80% of agriculture
evapotranspiration is directly from green water (Molden et al., 2007; Rockstrom et al. 2007). In
Latin America, the percentage of cultivated land under rainfed systems is almost 90%,
supporting both permanent crops such as rubber, coffee, and annual crops such as wheat,
maize and rice (Molden et al., 2007). It makes important to understand this branch of the
hydrological cycle for livelihoods and food production.
Irrigation water accounts for the majority of crop water use in areas subject to dry season or in
arid areas. However, many production systems classified as rainfed involve applications of
supplemental water to alleviate plant stress in special stages of their production cycle and to
reduce vulnerability of farmers during short term dry spells (two or three weeks) or seasonal
drought (Sulser et al., 2009).
Estimation of water demands for agriculture, depending on the purpose of the assessment,
may require extensive data such as cropped area, crop growth periods, crop
evapotranspiration coefficients by crop growth stages, reference evapotranspiration, cropping
patterns, water use efficiency, effective rainfall, soil and water quality (salinity), water
infrastructure type, water management, etc. (Rosengrat et al., 2002). FAO have developed
procedures, guidance and tools that allow making crop water requirement estimations by
using the mentioned information. Procedures for detailed estimations are extensively
described in Allen et al. (1998) and Brouwer et al. (1992).
Water for other agricultural uses - coffee processing: The quantity of water required for
coffee processing depends mainly on three factors: cropped area, productivity and processing
system (Ospina, 2009).
Coffee can be processed in two ways - dry processing and wet processing. Wet processing is
regarded as producing a higher quality product and therefore, is the most widespread method
in productive regions in the world (Practical Action, n.d). In Colombia, the wet process is
developed under three main systems described by Ospina (2009):
Traditional system, where all cleaning processes involve water use; its water
requirements are 40 l/kgPC (litres per kilogram parchment coffee)

__________________________________________________________________________________________________________
Balancing consumption and availability in a multiple uses of water system 27
System bath-tank, which combines dry and wet processes and the use of by-products.
It is suited for small and medium growers and the water requirements are 4.2 l/kgPC
Belcosub system, developed to promote sustainability in the use of water and
wastewater management on the coffee processing practice. It requires 1 l/kgPC. The
main difficulty for its implementation is its high costs, therefore it is mainly used by
large producers
As can be seen from these factors, water requirement for processing directly depends on
coffee production. Several characteristics affect productivity in coffee plantations, i.e. soil,
climate, density, age, type of coffee, light, altitude, latitude. Smallholders in productive regions
more commonly practice the ―shaded coffee‖ system, which uses trees to provide different
levels of dark. This is mainly used in areas with limitations for proper development of the crop,
soil or climate conditions. In Colombia reported productivity in these systems is around 500 -
1000 kg PC/He (Parchment Coffee per Hectare) (Cenicafé, 2006)
Water for multiple uses: A household water supply in the range of 50 – 200 lpcd was
identified for those present at the Johannesburg Symposium on 'Water, Poverty and
Productive Uses of Water at the Household Level' in 2003, as an adequate quantity for
multiple needs and the sustainable use of the water sources. Compare to survival norms of
some countries, this quantity is large, although is similar to quantities provided in urban
supplies (Moriarty et al., 2004).
In rural areas, as has been discussed, as most of the income-generating activities depend on
water, these uses may account for significant proportions of the water demand. Within this
type of communities, demand estimation may require greater depth of analysis of household
livelihoods, potential uses, required quantities and their daily, weekly, monthly and seasonal
variations for a more informed decision about the required service level (Nicol, 2000). The
analysis should be extent to effective alternatives to meet those demands (Moriarty et al.,
2006) that maybe requires for the Engineers to investigate options with which they are not
familiar (Deverill et al., 2002).
Findings regarding level of service for MUS are summarized on the MUS ladder proposed by
van Koppen et al. (2009), which appears in Figure 2-5. The figure indicates that when water is
available on or around the households from one or more sources, most users, use water for
productive activities, even when the quantity provided is below 20 lpcd. When service level is
in the range of 50-100 lpcd, productive uses are more substantial and from 100 – 200 lpcd all
domestic needs and several different productive activities can be developed. The ladder
representation aims to establish a comparison with the ladder proposed in the water sector

__________________________________________________________________________________________________________
Balancing consumption and availability in a multiple uses of water system 28
(Howard and Bartram, 2003), which suggests that at each service level from 20 to 100 lpcd, all
uses are exclusively domestic.
Figure 2-5 Multiple-use water ladder (van Koppen et al. 2009; van Koppen et al., 2010).
Table 2-3 summarizes quantities of water used for people in MUS systems, either designed for
MUS or planned for single uses, but used for multiple purposes (Van Koppen et al., 2006). All
the cases correspond to household connections. It can be seen from these figures how
domestic uses are less variable, and productive uses appear in a more wide range. In the
case of South Africa, the proportion of water used for domestic activities is related to the Basic
Needs policy existent in this country. Domestic values from South American Countries,
Colombia and Honduras, are similar; and it is interesting that the 45 lpcd used for planning
purposes in Nepal includes livestock use as part of this allowance.
Table 2-3 Water consumption for MUS systems according to different authors
Source
Perez de
Mendiguren
Castresana (2003)
Roa & Brown
(2009)
Smits et al.
(2010)
Mikhail
(2010)
Country South Africa Colombia Honduras Nepal
Domestic 25 lpcd 67 lpcd 64 lpcd 45 lpcda
Domestic +
productive 65 lpcd 250 lpcd 123 lpcd 400 – 800 l/day/hh
b
a This figure include an allowance for livestock considered as part of domestic use.
b hh: Household
Relating to productive uses, the reported values are more variable. In Nepal, this range can be
associated to household´s economic capacity. Mikhail (2010) mentioned, well off people have
been able to have more access to some irrigation technologies that has been promoted, while
the poor have had less access and this range may be linked to that situation. Something
__________________________________________________________________________________________________________
Balancing consumption and availability in a multiple uses of water system 29
similar has been reported by Smits et al. (2010), where the value of 123 lpcd is the average
consumption of different population groups (farmers, labourers, ranchers, etc.) where some
categories use far more water in productive activities than other. In their paper, Roa & Brown
(2009) also make differences on the water quantities required in this area when people have
different productive activities, which can be linked to assets as well. Therefore, the productive
use of water may depend on several factors, not only level of service and quantity provided.
2.6.2 Water availability
Globally, from the total precipitation over the continents only a third becomes runoff in rivers
and recharge aquifers (blue water) and the remaining two thirds infiltrate into the soil (green
water) to supply the plant cover and returns to the atmosphere as vapour flow (Falkenmark &
Molden, 2008). Thus, blue water is the measured and managed freshwater resource, in its
liquid form available to be withdrawn for different uses to satisfy the demands from the
domestic, industrial, hydropower, livestock and irrigated-agriculture users, and also to sustain
ecosystems in rivers and lakes (UN 2006b; Molden 2007; Rockström et al., 2003; Hoff et al.,
2009).
The understanding of the hydrologic cycle, with its different components and the balance of
available water flows and the needs of agricultural, industrial and domestic sectors,
contributes to the sustainability of the quantity and quality of water resources (DFID, 2001).
However, people traditionally have had more interaction with the blue water, due to
abstractions for different purposes through a wide variety of infrastructure, and in a less
evident way, by modifying vegetation and causing alteration of soils and water flows
(Falkenmark, 2003).
Because human interactions have been more related to blue water, it has been more widely
studied. However, in recent years due to the increased pressure on this resource, much
attention has turned to the green water, especially taking into account the need to feed a
rapidly growing world population, being agriculture the largest user of water at global scale
(Rockström et al., 2003).
In the particular case of agriculture, irrigated areas uses blue and green water, while rainfed
areas receives only green water (Hoff et al., 2009). According to Rockstrom et al. (2003)
within the on-farm water balance, soil evaporation is generally 30-50% of rainfall and it can be
even greater in cultivated areas of semiarid regions, while surface runoff is reported as 10-
25%. These figures make evapotranspiration, the productive green water flow, just 15 to 30%.
The motivation for increasing that proportion of productive green water flow for food production
has generated a new ―paradigm‖, oriented to the management of precipitation as a key

__________________________________________________________________________________________________________
Balancing consumption and availability in a multiple uses of water system 30
resource that enables food production allowing for less blue water abstractions (Falkenmark et
al., 2004). For this, some of the proposed alternatives are rainwater harvesting and
supplementary irrigation. Clearly, those can be adopted in places where there is sufficient
average rainfall during the crop season, so that farmers can collect and store surplus water
and use it in critical periods (Molden & Fraiture, 2004; Hoff et al., 2009; Rockström et al.,
2003).
In order to evaluate water resource or to balance its availability against different demands,
information regarding the components of the hydrological cycle and its associated human and
natural ecosystems is required. GWP (2000) highlights the importance to acquire knowledge
about the water resources that integrate the occurrence on space and time of blue water, its
quantities and qualities together with green water flows to estimate the water necessities for
any proposed development. In order to do this, water balances and budgets are important
tools to be explored.
2.6.3 Water balances and water budgets
Water budgets are tools for effective managing and planning of water resources (Healy et al.,
2007). These budgets quantify the components of the hydrological cycle based on water
balance concepts. Water balances consider water inflows and outflows at different levels from
global scale to small units such as a plant. The first step to perform a water balance is to
define a domain and its spatial and temporal boundaries, since the conservation of mass
principle requires that over the period of interest, inflows are equal to outflows plus any
change of storage within the domain (Molden, 1997). This is represented by Equation 2-1.
Flow In – Flow Out = Change In Storage
Equation 2-1
Equation 2-1 can be adapted according to the goals and scale of a particular study. Most
hydrologic computer-simulation models are based on the water balance equation and thus,
are water-budget models. Simple models may provide a rough overview of a domain, but
insight on the process that describe water movement within the domain can be achieved using
more complex models that are generally more expensive (Healy et al., 2007).
Water budgets have been more widely used in the irrigation sector. Molden (1997) suggests
that water budgets can be applied at field, service and basin level with different aims,
depending on the scale. At the field level, looking to increase productivity per unit of land and
conserving water; at the service level focusing on the analysis of irrigation services; and at the
basin level, aiming to investigate agricultural and non-agricultural water uses. In a broad
sense, basin level models can include the water supply system, the delivery system, the water

__________________________________________________________________________________________________________
Balancing consumption and availability in a multiple uses of water system 31
users system (agricultural, municipal, industrial), drainage collection system and basin
hydrological characteristics. Additionally, besides the natural and physical processes, the
physical projects (hardware) and management policies (software) should be taken into
account on the modelling (McKinney et al. 1999). Figure 2-6 shows the schematic
representation of a river basin modelling based on water balances, including only the natural
and physical process.
Figure 2-6 Schematic representation of river basin processes (McKinney et al, 1999)
Since water is managed in more areas according to governmental boundaries, water budgets
can also be applied having political units as domains, for addressing issues as the available
quantity of water, water demands, and the rates to which supplies are replenished. In these
cases, there are significant uncertainties regarding measurement of surface and groundwater
flows across the boundaries of the analysis unit (Healy et al., 2007).
Some models based on water balance and water budget principles at different scales are
described below:
Impact water model (Rosengrat et al., 2002): This model is used to investigate the impact of
water availability on food supply, demand and prices at various scales over a 30-year horizon
from river basins to global level. It includes water demands as irrigation, and non-irrigation
(domestic, industrial and livestock). Irrigation demand is projected based on irrigated area,
crop, soil, climatic parameters and water use efficiency. Livestock water demand is assessed
based on livestock production, water price, water consumptive use per unit of livestock

__________________________________________________________________________________________________________
Balancing consumption and availability in a multiple uses of water system 32
production, including different species. Industrial water demand depends on income (GDP per
capita), water use technology improvements and water prices. Domestic water demand is
estimated based on projections of population, income growth and water prices. Water flow for
environmental, ecological, political purposes and other uses such as recreation, hydropower
generation and navigation are also considered.
In terms of the hydrological cycle components, the model takes into account: precipitation,
runoff, evapotranspiration, and inflow from transboundary basins; for storage, it considers
reservoir and soil storage. The model makes estimations on renewable water, total water
availability, maximum allowable water withdrawal, effective water supply for irrigation and
irrigation water supply reliability. Generated projections are based on changes in water supply
infrastructure and water allocation and management policy.
IWMI Water Balance Framework (Perry, 1996): This framework has been developed for the
irrigation sector. It can be applied at field level or service level. Inflows of water are canal
delivered supplies and rainfall, and the outflows are crop evapotranspiration, non-beneficial
evaporation/ evapotranspiration, drainage runoff and net flows to groundwater. The model
links those elements through seepage from channels and irrigated fields, runoff, infiltration,
evaporation and transfers through pumping from groundwater and pumping from drains.
Figure 2-7 shows a schematic flow diagram from an application of the model.
Figure 2-7 Schematic flow diagram of a water balance (Perry, 1996)
Water Balance Model at Community Level (Ratnaweera et al., 2006): This model considers
water available at sub-basin level. Inflows are rainfall, surface, and subsurface flows. The
outflows are surface, subsurface outflows, and evaporation. It takes into account storage
within the system, both surface and subsurface, comprising surface storage, soil moisture, re-
used water, and percolation. Pollution is also included as a negative component of storage.
The model is presented as a box with inflows and outflows on the sketch shown in Figure 2-8.
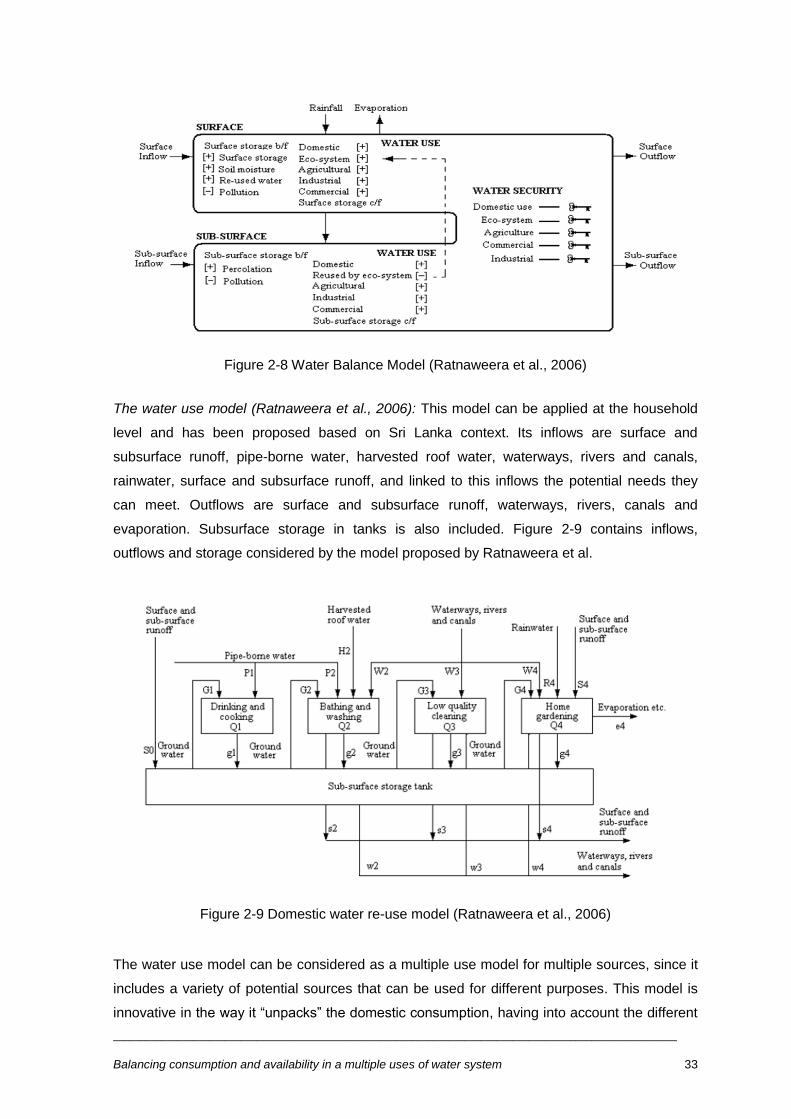
__________________________________________________________________________________________________________
Balancing consumption and availability in a multiple uses of water system 33
Figure 2-8 Water Balance Model (Ratnaweera et al., 2006)
The water use model (Ratnaweera et al., 2006): This model can be applied at the household
level and has been proposed based on Sri Lanka context. Its inflows are surface and
subsurface runoff, pipe-borne water, harvested roof water, waterways, rivers and canals,
rainwater, surface and subsurface runoff, and linked to this inflows the potential needs they
can meet. Outflows are surface and subsurface runoff, waterways, rivers, canals and
evaporation. Subsurface storage in tanks is also included. Figure 2-9 contains inflows,
outflows and storage considered by the model proposed by Ratnaweera et al.
Figure 2-9 Domestic water re-use model (Ratnaweera et al., 2006)
The water use model can be considered as a multiple use model for multiple sources, since it
includes a variety of potential sources that can be used for different purposes. This model is
innovative in the way it ―unpacks‖ the domestic consumption, having into account the different
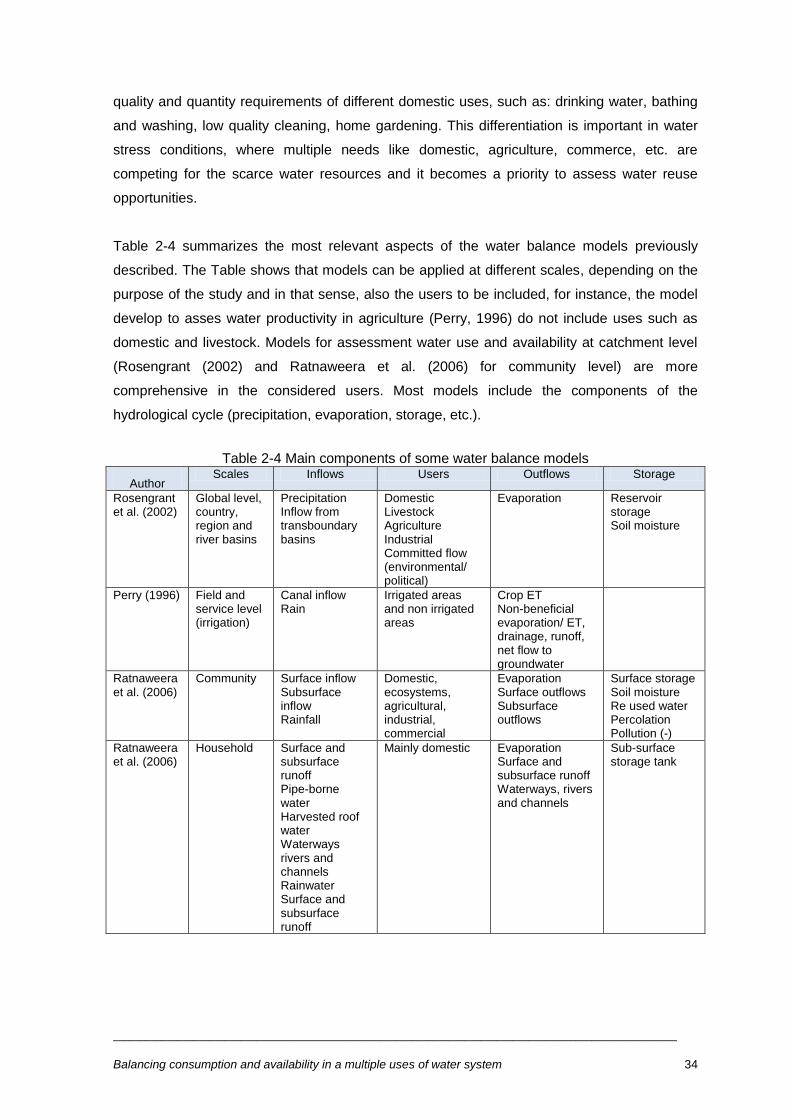
__________________________________________________________________________________________________________
Balancing consumption and availability in a multiple uses of water system 34
quality and quantity requirements of different domestic uses, such as: drinking water, bathing
and washing, low quality cleaning, home gardening. This differentiation is important in water
stress conditions, where multiple needs like domestic, agriculture, commerce, etc. are
competing for the scarce water resources and it becomes a priority to assess water reuse
opportunities.
Table 2-4 summarizes the most relevant aspects of the water balance models previously
described. The Table shows that models can be applied at different scales, depending on the
purpose of the study and in that sense, also the users to be included, for instance, the model
develop to asses water productivity in agriculture (Perry, 1996) do not include uses such as
domestic and livestock. Models for assessment water use and availability at catchment level
(Rosengrant (2002) and Ratnaweera et al. (2006) for community level) are more
comprehensive in the considered users. Most models include the components of the
hydrological cycle (precipitation, evaporation, storage, etc.).
Table 2-4 Main components of some water balance models
Author Scales Inflows Users Outflows Storage
Rosengrant et al. (2002)
Global level, country, region and river basins
Precipitation Inflow from transboundary basins
Domestic Livestock Agriculture Industrial Committed flow (environmental/ political)
Evaporation Reservoir storage Soil moisture
Perry (1996) Field and service level (irrigation)
Canal inflow Rain
Irrigated areas and non irrigated areas
Crop ET Non-beneficial evaporation/ ET, drainage, runoff, net flow to groundwater
Ratnaweera et al. (2006)
Community Surface inflow Subsurface inflow Rainfall
Domestic, ecosystems, agricultural, industrial, commercial
Evaporation Surface outflows Subsurface outflows
Surface storage Soil moisture Re used water Percolation Pollution (-)
Ratnaweera et al. (2006)
Household Surface and subsurface runoff Pipe-borne water Harvested roof water Waterways rivers and channels Rainwater Surface and subsurface runoff
Mainly domestic Evaporation Surface and subsurface runoff Waterways, rivers and channels
Sub-surface storage tank
__________________________________________________________________________________________________________
Balancing consumption and availability in a multiple uses of water system 35
2.7 Methodologies used to research on MUS and its interlinked subjects
This section presents some methodologies that have been used to investigate about aspects
such as water use and consumption, water availability and water balances, whether or not
taking into account the principles of MUS, especially in the case of water availability and water
balances, since these concepts have not been studied in depth yet in MUS research. A review
is carried out on the work developed, research methods, aspects regarding to data
processing, analysis, sampling and limitations of the methodologies used.
2.7.1 Methodologies to research on water uses and consumption
Specific studies on water consumption for multiple uses of water were conducted by Perez
Mendiguren Castresana (2003) who carried out a comparative village-case-study to look
relations between livelihood activities, water consumption and performance of the water
supply. Upadhyay (2005) researched on water use for domestic and productive uses and its
relation with gender, income and empowerment. Katsi (2007) investigated on the impact of
water-related livelihoods and efficient, equitable and sustainable use of water resources at
household level in Zimbabwe. Senzanje (2008) studied main uses, water consumption per use
and water productivity of different uses of small dams in a basin in Zimbabwe. Roa & Brown
(2009) investigated the water needs of rural families for both, domestic and productive
purposes, and water availability in relation to use in a Colombian basin. Smits et al. (2010)
undertook a study on practices of multiple use of water and its impacts on the livelihoods of
users, as well as on the sustainability of rural water supply services in Honduras.
There are several studies following the case study methodology, which address issues of
water uses for multiple purposes and consumption. These studies were carried out under the
CPWF - MUS project and are not available as journal articles, although the findings are
summarized on the ―Multiple Use Water Ladder‖ by Van Koppen et al. (2009) commented on
section 2.6.1 and also in several conference papers from events such as the International
Symposium on Multiple-Use Water Services (2008) (Butterworth et al, 2008).
There are a significant amount of studies focusing on water consumption itself, some of the
most referenced were developed in the 1990s in African cities, and in context without
household connections, especially those undertook by Whittington et al. (1990; 1991) from an
economic perspective.
Most recent studies, generally analyze water consumption regarding the factors that influence
it. These studies have been developed in rural and urban areas; places with different level of
access to water, from household connections to fetching water; meter and unmetered
households. Studies estimated consumptions directly and indirectly and water consumption

__________________________________________________________________________________________________________
Balancing consumption and availability in a multiple uses of water system 36
has been related to a broad range of variables. Gazzinelli et al. (1998) investigated the
domestic water use in a rural village in Brazil, emphasizing on the use of multiple sources by
individual households, preferences and predominance of socioeconomic factors in water use,
role of multiple sources in meeting water requirements of households for different uses.
Bramfit et al., (1997) studied the impact of metering on water consumptions levels in
Manchester. Nyong & Kanaroglou (1999) researched on the variation of daily household water
consumption for rainy season and dry season in a Village in Nigeria. Trigg (2000) established
peak hour factor, per capita water consumption and user´s preferences according to level of
service in rural Guatemala. Adekalu et al. (2002) investigated on water-use practices, water
supply alternatives and water demand in four Nigerian cities. Manzungu & Machiridza (2005)
analyzed water consumption in relation to income and population density in Zimbabwe. Hadjer
(2005) studied water uses, consumption and sources, and its relation to seasonality and social
structure in Benin. Keshavarzia et al. (2006) established the relationships between water
consumption, comparing the behaviour of low, medium and high water consumers, and
established factors affecting water consumption in rural households in Iran. Mazvimavi &
Mmopelwa (2006) assessed gazetted and un-gazetted rural settlements in Botswana. Lu &
Smout (2008) researched about domestic water consumption in China and its relation to
appliances that have the major water consumption within the household. Fox et al. (2009)
studied the influence on characteristics such as number of bedrooms, architectural type, and
garden presence on water consumption to assess the feasibility to use these characteristics
for water demand forecasting.
The studies done under the MUS approach involved a combination of methods to estimate
water consumption. Senzanje et al. (2008) used a questionnaire and data from literature to
quantify volumes of water used for livestock, irrigation, domestic uses, and brick making. The
data were crosschecked by observing daily activities during the study period. Smits et al.
(2010) used participatory tools such as community mapping, wealth classification and focus
group discussions, in combination with a household survey, consumption measurements and
technical reviews of the systems to establish water consumption from a number of domestic
and productive uses. Finally, Roa & Brown (2009) conducted a farm survey relevant to local
farming practices and carried out direct measurements of water domestic consumption in 30%
of the houses in a micro-watershed in a nine months period. They established disaggregated
water consumption for activities such as toilets, personal hygiene, cooking and drinking,
dishwashing, laundry, and household chores. Water use for productive activities such as crop
irrigation, stable cleaning and coffee processing was measured in selected - representative
households of the dominant crop and livestock types within the micro-watershed.
__________________________________________________________________________________________________________
Balancing consumption and availability in a multiple uses of water system 37
For general studies on water consumption, different methods have been used. Household
surveys with semi-structured questionnaires were used by Manzungu & Machiridza (2005) and
Nyong & Kanaroglou (1999). Nyong & Kanaroglou (1999) asked about water availability and
water use in two household surveys, one during rainy season, and the other during dry
season, using differentiated questionnaires by gender. Perez Mendiguren Castresana (2003)
and Katsi (2007) combined semi-structured household interviews with group discussions.
Hadjer (2005) used observation during a six months period, where selected households were
visited once every month from 6 a.m. to 9 p.m., and all water-related activities were recorded
with time of day, person, purpose, etc. Adekalu et al. (2002) combined questionnaires, in-
depth interviews and personal observations, while Ezeji & Smout (2009) used questionnaires
together with focus groups and observations. Upadhyay (2005) adopted the same approach
that Ezeji & Smout (2009), but included measurements of daily water use for livestock in
drinking, bathing, and cleaning.
Gazzinelli, et al., (1998) recorded water contact activities observed at 24 communal sites for 7
consecutive days between 7:30 a.m. and 5:30 p.m. Households with their own water supply
were interviewed twice a day during the 7-day study about the quantity of water they had used
during the day for different activities. In addition, the female heads of 4 households were
asked to record on forms the quantity of all water used for individual activities carried out in a
3-day period. Focus group discussions, unstructured interviews with key informants and a
household survey complemented the study.
Fox et al. (2009) used data from daily household demand covering a period of 2 years and
established relations with household physical characteristics. Keshavarzia (2006) used daily
water consumption data for a 5-year period, complemented with a questionnaire addressing
domestic water use patterns, and individual household characteristics. Bramfit et al., (1997)
used a self-administered questionnaire followed by water usage monitoring over 7 consecutive
days and use water usage diaries where frequencies of use, time of use and water flows were
recorded to quantify consumption for different uses.
In relation to the sampling strategy adopted, in some studies, especially those including
estimations through direct measurements the households were those that show willingness to
participate as in the case of Lu & Smout (2008) who surveyed households of family and
friends, and Bramfit et al. (1997) who contacted people which belong to different
organizations. In most studies, households were selected under a simple random sampling
(Manzungu & Machiridza, 2005; Keshavarzia et al., 2006; Katsi, L., 2007). In comparative
village case studies, as those from Perez Mendiguren Castresana (2003) and Smits et al.
(2010), villages were purposive selected according to the objectives of the study, but in the
__________________________________________________________________________________________________________
Balancing consumption and availability in a multiple uses of water system 38
selected villages, household questionnaires were conducted in randomly selected households.
The study of Nyong & Kanaroglou (1999) adopted a stratified random sampling and Roa &
Brown (2009) selected participant households under an equally distribution in the micro-
watershed as upper, mid, and lower section. They conducted the questionnaires in 30% of the
households. The sample of Senzanje et al. (2008) constituted 7.5%, 6%, 10% and 7% of the
households served by 4 dams.
From the papers analyzed, 7 commented on the data analysis and from those, 4 highlighted
the use of the Statistical Package for Social Sciences (SPSS) for this purpose (Bramfit et al.,
1997; Manzungu & Machiridza, 2005; Keshavarzia et al., 2006; Senzanje et al. 2008). The
studies that collected data from meters used uni- and multi-variate analysis to find statistically
significant relations (Fox et al., 2009). Other statistics cited were frequency, percentage,
means, standard deviation, one-way analysis of variance, Pearson correlation coefficient and
discriminant function analysis (Keshavarzia, A. et al., 2006); multiple linear regression
(Gazzinelli, A. et al., 1998) and one-way analysis of variance (Senzanje et al., 2008)
Some limitations stated on the studies are the necessity to accompany studies based on
meters records with household surveys in order to enrich information and prepare better
correlations (Fox et al., 2009); and the need to establish relations between water consumption,
climatic variations (seasons), and socioeconomic aspects (Hadjer, 2005). Others highlighted
problems to achieve the targeted number of consumption data due to the limited availability of
records and problems with the targeted interviews because some respondents did not return
questionnaires or were not available during the study visits (Manzungu & Machiridza, 2005).
Lu & Smout (2008) also discussed limitations on the sampling method and small sampling
size. Other authors explained the need for more interdisciplinary approaches that combine
hydrological, climatological, economic and anthropological findings (Hadjer, 2005; Senzanje et
al., 2008). Senzanje et al. (2008) considered important on MUS studies not only research
focused on the demand side of water for various uses, but also to look at the supply side, and
on how to match supply with demand.
2.7.2 Methodologies to research on water availability and water balances
Water availability on MUS research has been studied mostly through qualitative methods such
as household surveys alone (Nyong & Kanaroglou, 1999; Adekalu et al., 2002; Perez de
Mendiguren, 2003; Machingambi & Manzungu, 2003; Mazvimavi & Mmopelwa, 2006), or
combined with focal groups or in-depth interviews (Upadhyay, 2005; Gazzinelli et al., 1998;
Kusiluka et al., 2004), asking about people´s perceptions on aspects such as available
sources, reliability, access and quality. Sometimes comparisons have been carried out in
relation to seasonal changes (Mazvimavi & Mmopelwa, 2006); Gazzinelli et al., 1998; Nyong &

__________________________________________________________________________________________________________
Balancing consumption and availability in a multiple uses of water system 39
Kanaroglou, 1999), gender (Upadhyay, 2005), socioeconomic status (Hadjer, K., 2005) and
accessibility (Machingambi & Manzungu, 2003; Perez de Mendiguren Castresana, 2003;
Kusiluka et al., 2004; Upadhyay, 2005). Sometimes these perceptions were combined with
technical inspections, which involved measurements at the storage tanks (Smits et al., 2010).
Few studies have adopted a quantitative approach such as Roa & Brown (2009) which
measured the quantity of water from the primary source of water for the micro-watershed
studied, taken 55 dates during 4 months, and combined it with precipitation and downstream
flow. Other approach was adopted by Harrington et al. (2009) who used water accounting
tools to establish how water availability, access and quality, affect rural livelihoods, doing a
comparison between large basins: Ganges, Indus, Karkheh Limpopo, Mekong, Nile, São
Francisco, Volta and Yellow.
Studies from the agriculture sector and water management at catchment level have been
focused on improving water productivity (Droogers et al., 2000; Mutiro, 2006; Vazifedoust et
al., 2007; Ahmad et al., 2009), or gain a better understanding on the hydrological cycle and
partitioning process (Jewitt et al., 2004; Hope et al., 2004; Makurira et al., 2007). In some of
the studies, models such as SWAP (Droogers et al., 2000; Vazifedoust et al., 2007), ACRU
(Jewitt et al., 2004; Hope et al., 2004) and HYLUC (Jewitt et al., 2004) have been used. In
other studies, different components of the hydrological cycle have been measured
(Vazifedoust et al., 2007; Mutiro, 2006). In the studies where models or field measurements
have been carried out, estimations have been based on water balance concepts.
The different studies adopted different approaches to acquire the information required for the
water balance equation dependent on the research objectives. When components of water
balance were measured, studies were at field scale. Precipitation data was obtained from
climatic stations (Ahmad et al., 2009; Jewitt et al., 2004; Vazifedoust et al., 2007) or directly by
installing rain gauges (Mutiro, 2006; Droogers et al., 2000; Makurira et al., 2007).
Evapotranspiration was generally calculated from equations that use climatic data (Droogers
et al., 2000; Jewitt et al., 2004). In other cases, evaporation was measured from the soil by
use of lysimeters constructed on site (Makurira et al., 2007). Mutiro (2006) measured
transpiration using a sap flow meter. Flow measuring devices were used to estimate runoff
(Makurira et al., 2007). Soil data was obtained from existent soil maps (Droogers et al., 2000)
or soil maps and land use maps were prepared with information from questionnaire surveys
(Ahmad et al., 2009). Soil properties were obtained from laboratory analysis (Vazifedoust et
al., 2007; Mutiro, 2006) or LANDSATTM remotely sensed images (Jewitt et al., 2004) and GIS
software (Jewitt et al., 2004). Crop patterns have been obtained from questionnaire surveys
(Ahmad et al., 2009) and existent databases (Droogers et al., 2000). Infiltration was usually
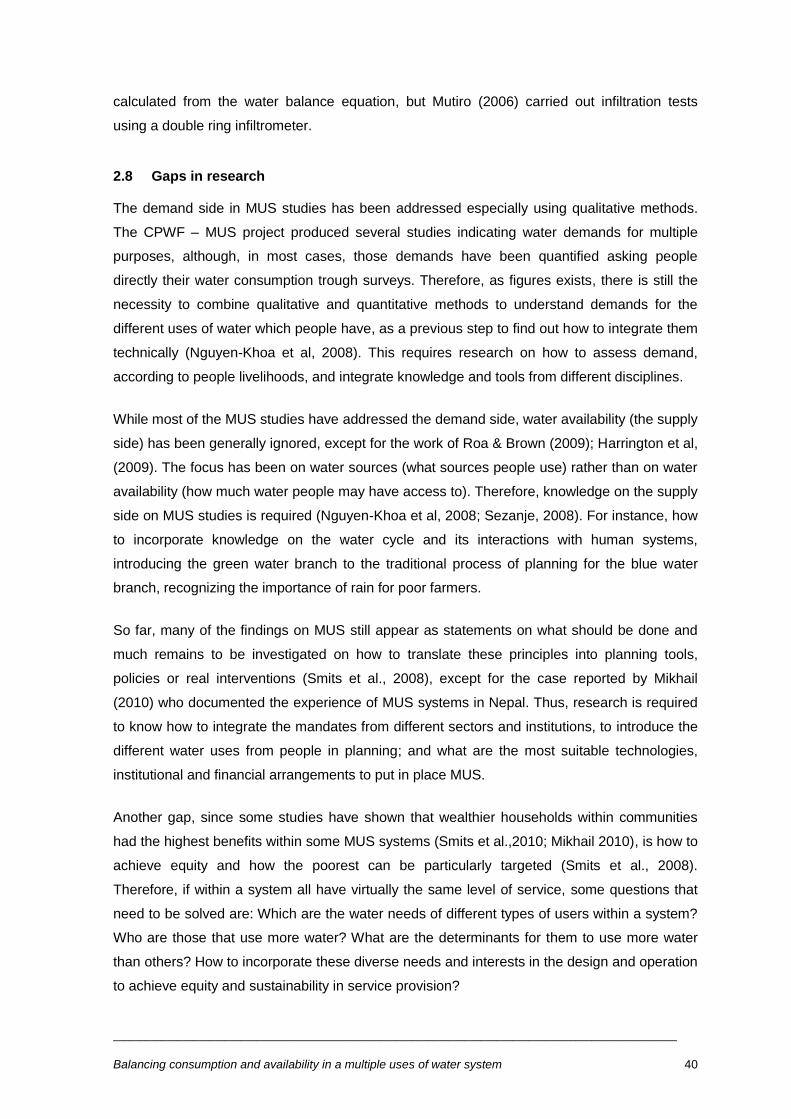
__________________________________________________________________________________________________________
Balancing consumption and availability in a multiple uses of water system 40
calculated from the water balance equation, but Mutiro (2006) carried out infiltration tests
using a double ring infiltrometer.
2.8 Gaps in research
The demand side in MUS studies has been addressed especially using qualitative methods.
The CPWF – MUS project produced several studies indicating water demands for multiple
purposes, although, in most cases, those demands have been quantified asking people
directly their water consumption trough surveys. Therefore, as figures exists, there is still the
necessity to combine qualitative and quantitative methods to understand demands for the
different uses of water which people have, as a previous step to find out how to integrate them
technically (Nguyen-Khoa et al, 2008). This requires research on how to assess demand,
according to people livelihoods, and integrate knowledge and tools from different disciplines.
While most of the MUS studies have addressed the demand side, water availability (the supply
side) has been generally ignored, except for the work of Roa & Brown (2009); Harrington et al,
(2009). The focus has been on water sources (what sources people use) rather than on water
availability (how much water people may have access to). Therefore, knowledge on the supply
side on MUS studies is required (Nguyen-Khoa et al, 2008; Sezanje, 2008). For instance, how
to incorporate knowledge on the water cycle and its interactions with human systems,
introducing the green water branch to the traditional process of planning for the blue water
branch, recognizing the importance of rain for poor farmers.
So far, many of the findings on MUS still appear as statements on what should be done and
much remains to be investigated on how to translate these principles into planning tools,
policies or real interventions (Smits et al., 2008), except for the case reported by Mikhail
(2010) who documented the experience of MUS systems in Nepal. Thus, research is required
to know how to integrate the mandates from different sectors and institutions, to introduce the
different water uses from people in planning; and what are the most suitable technologies,
institutional and financial arrangements to put in place MUS.
Another gap, since some studies have shown that wealthier households within communities
had the highest benefits within some MUS systems (Smits et al.,2010; Mikhail 2010), is how to
achieve equity and how the poorest can be particularly targeted (Smits et al., 2008).
Therefore, if within a system all have virtually the same level of service, some questions that
need to be solved are: Which are the water needs of different types of users within a system?
Who are those that use more water? What are the determinants for them to use more water
than others? How to incorporate these diverse needs and interests in the design and operation
to achieve equity and sustainability in service provision?

__________________________________________________________________________________________________________
Balancing consumption and availability in a multiple uses of water system 41
In general, despite all the available literature, abundant or scarce, in each of the aspects
above, the South American context, and the Colombian context, have not been sufficiently
documented. This context has different features on the demand and supply sides, where
surface gravity fed systems with household connections, rainfed agriculture, higher per capita
demand for domestic uses, and different technological alternatives to secure access, may
represent different demand characteristics that need to be researched.
Hence, this study seeks to fill some of these gaps in the documentation of the demand and
supply of water, in terms of green water and blue water in a MUS system in Colombia,
combining the use of quantitative and qualitative research methods. Issues of equity are
addressed as well, aimed at looking to households which different consumption levels.
2.9 Summary
This literature review has addressed some of the topics underlying the concept of Multiple
Uses of Water, such as poverty and its determinants, productive activities and livelihoods and
the relationship of all these with access to water. Approaches in response to the challenges of
poverty reduction and lack of water universal coverage, which have been proposed, looking
for interventions that meet more effectively the needs of individuals, ensuring sustainability,
has been also studied here (SLA and DRA).
The review has shown how the concept of Multiple Uses of Water emerges from these ideas,
but also, the challenges it posses to integrate knowledge from various disciplines and efforts
of various sectors, so that its implementation requires from professionals to develop and
implement innovative approaches for which they may have not received training. Therefore,
the review focused on understanding multiple demands on water (i.e. domestic, agricultural,
livestock) traditionally addressed separately by the various actors in development and
included the supply side, with the study of blue water and green water; the latter, a new
"paradigm" for water resource management. This review was done looking for an
understanding on the hydrological cycle in their interactions with the human system.
The need to integrate supply and demand, led to look into the concepts of water balance and
water budgets as tools to understand and quantify these interactions. Principles and
applications of these tools in particular contexts were reviewed, showing its flexibility to be
used in accordance with the level of analysis, research objectives and available information.
Finally, it was identified how the above topics have been studied in the past, not only from the
perspective of MUS, but also from other approaches and disciplines. Such a review was a key
element to formulate the methodology of this particular investigation, taking into account the
strengths and limitations included in previous studies.

__________________________________________________________________________________________________________
Balancing consumption and availability in a multiple uses of water system 42
3 THE CASE STUDY AREA
The introduction to this document presented general aspects of Colombia and its rural area,
people´s productive activities, livelihoods, water services provision, and the poverty situation
that exists, which together with inequality are major challenges for the country (World Bank,
2010). That presentation was intended to place the reader in the general context in which this
research has been proposed, and the relevance of the Multiple Uses of Water supply systems
for rural Colombia.
This chapter presents an overview of the specific area selected as a case study, the villages of
La Palma, Tres Puertas and Buenvivir, and the system that provides water to them, La Palma
Tres Puertas water supply system. In addition to general aspects, this chapter includes
information directly related to the issue of Multiple Uses of Water in this region, since in this
place, two studies relevant to this investigation were conducted previously (Cinara, 2006;
Ospina, 2009). The results from these studies and the literature review were the basis to
decide on the approach for this research.
3.1 Location
The water supply system of La Palma Tres Puertas serves the villages of La Palma, Tres
Puertas and Buenvivir, located in the municipality of Restrepo in Valle del Cauca Department
(Colombia). The territory is mainly mountainous with small valleys in between, to the eastern
slope of the western Andes Range (Ospina, 2009). The villages are characterized by a
dispersed settlement pattern with low population density, occupying an area of 15.5 km2
(Alcaldía de Restrepo, 2004), that covers the settlements of Chontaduro, Tres Puertas,
Buenvivir, La Palma, Ventaquemada, Colegurre, Monteredondo and El Agrado. The
settlements belong to the villages. The general location is shown in Figure 3-1.
3.2 Climate
Climatic station Julio Fernandez is located within the study area (Altitude 1381 m, North
Latitude 3° 49´ and West Longitude 76° 32´). This station is managed by the Centro
Internacional de Investigaciones del Café (Cenicafé), which operates a Weather Service to
study and determine the climate of each of the coffee regions in Colombia. In La Palma Tres
Puertas, temperatures range from an average minimum about 17°C and a maximum of about
25°C, median temperatures are about 20°C. The precipitation has a bimodal behaviour, with
two rainy and two dry seasons, and annual precipitation ranges between 880 and 1392 mm /
year. Sunlight oscillates from 130 – 180 hours per month, and humidity varies from 80 to 85%
(Cenicafé, 2010).

__________________________________________________________________________________________________________
Balancing consumption and availability in a multiple uses of water system 43
Figure 3-1 Location of the study area (Ospina, 2009)
3.3 Surface sources
The study area is part of Dagua watershed, basin of Rio Grande, sub-basin of Aguamona
stream. The water system is supplied by two smaller streams that converge on Sabaletas sub-
basin. Those are locally known as La Tobón and Sinaí. The surrounding area of La Tobón, is
protected and covered by natural vegetation, but around Sinaí, there are extensive crops of
commercial forest on species such as Pine and Eucalyptus (Cinara, 2006).
The water from the two streams according to analysis undertaken at the storage tank and the
distribution network, presents quality problems due to the presence of significant levels of
Total and Faecal Coliforms and high levels of Colour and Iron, higher than the values
recommended for drinking water by the World Health Organization (WHO) (Ospina, 2009)
3.4 Geology
The villages are located on a volcanic outcrop (Kv), which includes diabasas with ophite
structure, plagioclase crystals in augite and thin layers of ―chert‖. The horizon A is made from
laterite, with thicknesses ranging from 1 to 30 m, and in some cases reaching up to 50 meters.
Horizon B is several meters thick, made from hard soil, ―red earth‖, from reddish yellow to
cream, silty-clay-sandy with bowls of different sizes made from diabase; in the structure,
spheroidal weathering is well developed. Horizon C is composed of relatively fresh rock,
massive, very hard, dense, sometimes broken, badly broken or even as tectonic gap (Alcaldía
de Restrepo, 2004). There is no evidence of groundwater use by people in the region.
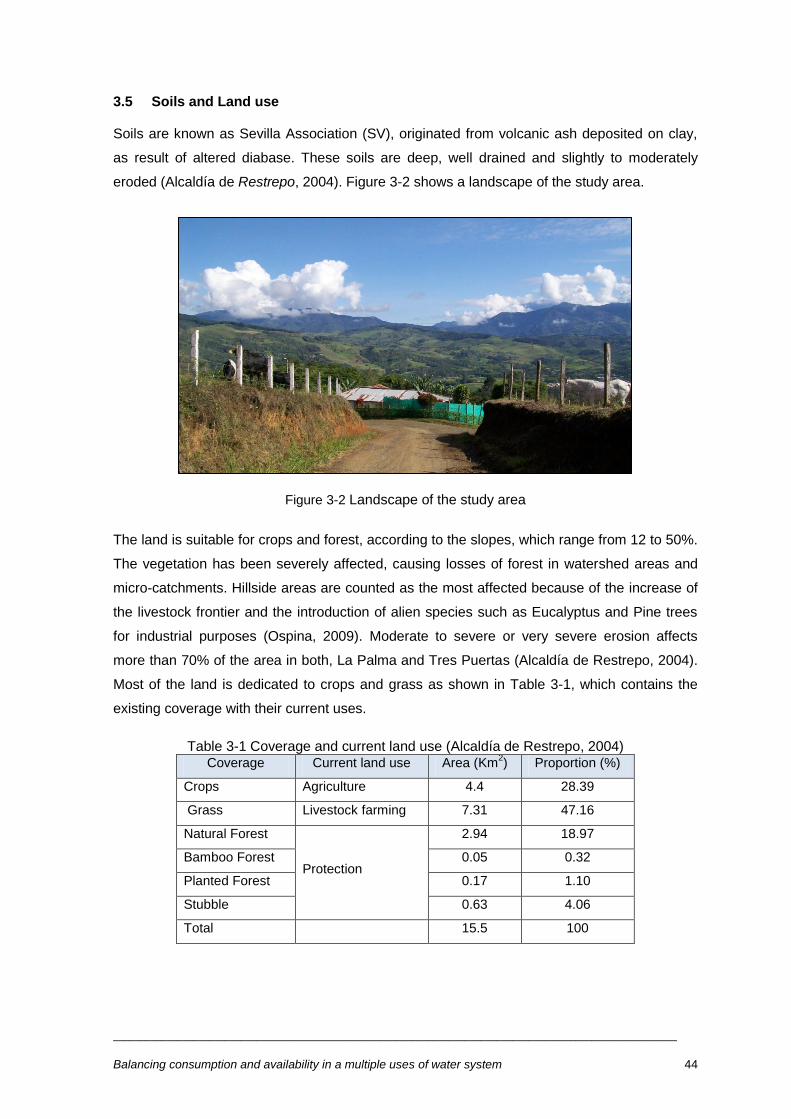
__________________________________________________________________________________________________________
Balancing consumption and availability in a multiple uses of water system 44
3.5 Soils and Land use
Soils are known as Sevilla Association (SV), originated from volcanic ash deposited on clay,
as result of altered diabase. These soils are deep, well drained and slightly to moderately
eroded (Alcaldía de Restrepo, 2004). Figure 3-2 shows a landscape of the study area.
Figure 3-2 Landscape of the study area
The land is suitable for crops and forest, according to the slopes, which range from 12 to 50%.
The vegetation has been severely affected, causing losses of forest in watershed areas and
micro-catchments. Hillside areas are counted as the most affected because of the increase of
the livestock frontier and the introduction of alien species such as Eucalyptus and Pine trees
for industrial purposes (Ospina, 2009). Moderate to severe or very severe erosion affects
more than 70% of the area in both, La Palma and Tres Puertas (Alcaldía de Restrepo, 2004).
Most of the land is dedicated to crops and grass as shown in Table 3-1, which contains the
existing coverage with their current uses.
Table 3-1 Coverage and current land use (Alcaldía de Restrepo, 2004) Coverage Current land use Area (Km
2) Proportion (%)
Crops Agriculture 4.4 28.39
Grass Livestock farming 7.31 47.16
Natural Forest
Protection
2.94 18.97
Bamboo Forest 0.05 0.32
Planted Forest 0.17 1.10
Stubble 0.63 4.06
Total
15.5 100

__________________________________________________________________________________________________________
Balancing consumption and availability in a multiple uses of water system 45
3.6 Population
The population of the villages supplied by the water supply system is about 1800 inhabitants,
with an average household size of 4. In most cases, the family income depends on the head of
the family. People livelihoods are related to livestock and animal husbandry. By 2005, 37% of
household heads were day-labourers and 22% farmers, the rest were employees, retired,
merchants or self-employed. The
employees included people who
administered some bigger farms. 40% of
people had income levels from US$
90/month to US$180/month. Day-
labourers had one of the lowest income
levels and property managers earned the
higher revenues (Cinara, 2006). Figure 3-3
presents some local farmers of La Palma
carrying their pineapple harvest.
Figure 3-3 Farmers carrying their harvest
3.7 Infrastructure
Water service has 100% coverage. There is no sewerage, streams and small surface water
sources receive wastewater discharges from households, although it is estimated that about
40% of the households have septic tanks. The electricity service has nearly 100% coverage.
Most of the houses have cell phones. There is no solid waste collection service, leading
people to manage solid waste at their homesteads. Each village have a school, communal
house and there is a primary health care centre for the three villages.
3.8 The water supply system
3.8.1 System description
The Committee of Coffee Growers4 built the supply system about 35 years ago. It was
designed to serve 150 users from La Tobón. Presumably, the increase in population during
the years of operation and lack of investment in the system led to an insufficient capacity. In
2003, the 400 existing users received water two times a week. In 2004, with funding from the
PAAR Program, an intake, a transmission pipe from another stream, the Sinaí, and a new
storage tank to receive water, now from the two streams were built. It was expected to have
4 The Colombian Coffee Growers‘ Federation is a farmers‘ organization, established in 1927, responsible for the social well-being of Colombian coffee growers. Over the years, the Federation has established a number of subsidiary institutions, including a research institute (Cenicafé), a capital fund and a merchant marine fleet (Bentley & Baker, 2000).

__________________________________________________________________________________________________________
Balancing consumption and availability in a multiple uses of water system 46
permanent continuity of service. However, the problems persisted and continuity only
increased to four times a week. The PAAR team felt that the level of service did not improve,
as the community ―wasted water on crops and pigs‖ (Cinara, 2006).
Today, the service is received for the 437 households on average once a week, which leads to
a complex operation of valves and shifts and thus, families have implemented different
adaptation strategies.
The water supply systems consists of two intakes and settle tanks that bring water from La
Tobón and Sinaí to a centralized tank of about 160 m3 capacity. There is no metering for the
total water delivered. The distribution network is PVC pipe and consists of nine main branches
in pipes of diameters ranging from 3 "to ¾". Households have micrometers, whose readings
are carried out every two months by the caretaker. During the fieldwork period for this
research, a packaged drinking water plant was being installed, intended to provide drinking
water for the first time to this community.
3.8.2 Management issues
The water supply system is operated by an administrative board legally constituted under
Colombian law, consisting of representatives elected by Community Action Boards of the
beneficiary villages. The Board is composed of Chairman, Treasurer, Fiscal, Secretary, and
Vowels for each of the villages. The Board hires a caretaker, who is in charge of the operation
and maintenance of the system. The bulk of the households have low participation in the
management of the system, there is a low attendance of people to Assemblies. The system
has no manager. The General Assembly of Delegates practically does not exist, the Board do
not hold meetings as is required by the Statutes, and the Chairman also holds the majority of
the administrative tasks (Cinara, 2006). The Board must be renewed every two years, but this
does not happen due to lack of meetings of the General Assembly of Delegates and Members.
Since 2007 there is differentiated tariff according to water consumption. People pay 2,5 US$
for 25m3 every two months and beyond that volume, each m
3 has a charge of 0,16 US$. No
investigation was made to elicit the criterion for the establishment of these values.
3.8.3 Uses of water
According to Cinara (2006b) about 80% of people in La Palma Tres Puertas developed at
least one productive activity, animal husbandry, agriculture or both. Most important crops are
coffee, pineapple, beans, maize and some vegetables. People raise mostly chickens, pigs,
and cows. Figure 3-4 shows some examples of the productive activities developed in the area.
To the left, a plot with maize, and to the right a local woman milking a cow.
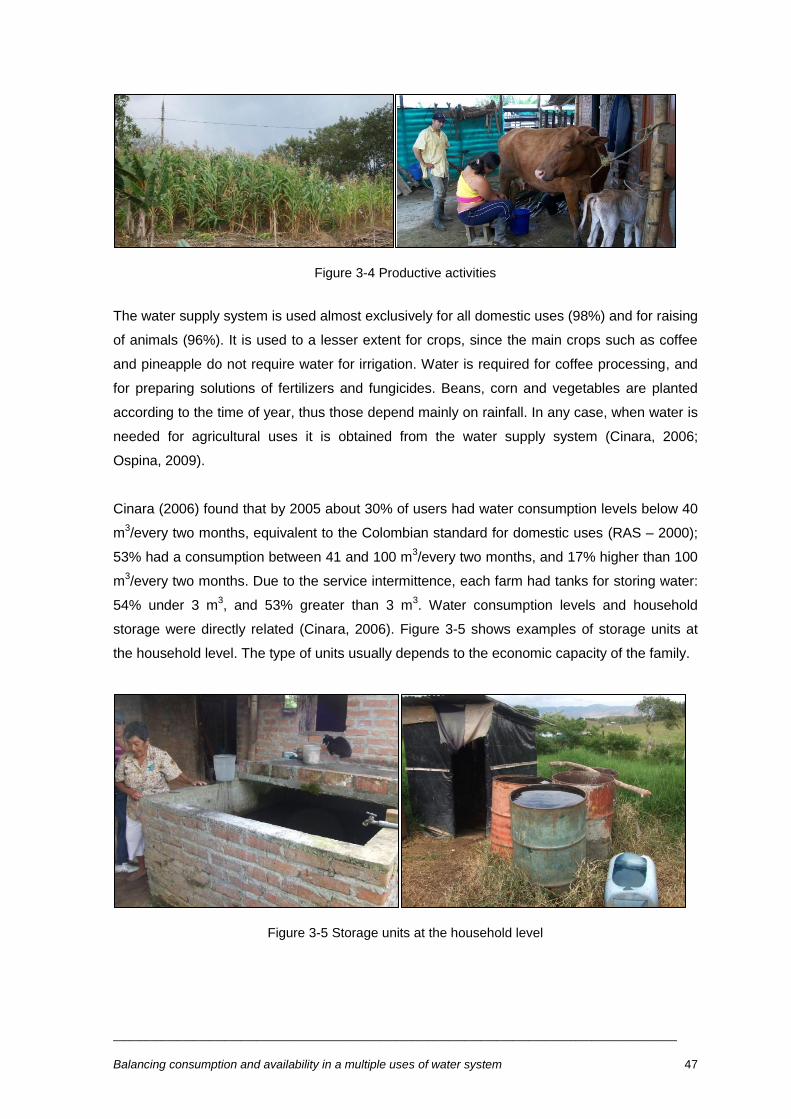
__________________________________________________________________________________________________________
Balancing consumption and availability in a multiple uses of water system 47
Figure 3-4 Productive activities
The water supply system is used almost exclusively for all domestic uses (98%) and for raising
of animals (96%). It is used to a lesser extent for crops, since the main crops such as coffee
and pineapple do not require water for irrigation. Water is required for coffee processing, and
for preparing solutions of fertilizers and fungicides. Beans, corn and vegetables are planted
according to the time of year, thus those depend mainly on rainfall. In any case, when water is
needed for agricultural uses it is obtained from the water supply system (Cinara, 2006;
Ospina, 2009).
Cinara (2006) found that by 2005 about 30% of users had water consumption levels below 40
m3/every two months, equivalent to the Colombian standard for domestic uses (RAS – 2000);
53% had a consumption between 41 and 100 m3/every two months, and 17% higher than 100
m3/every two months. Due to the service intermittence, each farm had tanks for storing water:
54% under 3 m3, and 53% greater than 3 m
3. Water consumption levels and household
storage were directly related (Cinara, 2006). Figure 3-5 shows examples of storage units at
the household level. The type of units usually depends to the economic capacity of the family.
Figure 3-5 Storage units at the household level
__________________________________________________________________________________________________________
Balancing consumption and availability in a multiple uses of water system 48
A study by Ospina in 2009, where 62 houses were surveyed, corresponding to 39% of the
population surveyed in 2005 (154), which have both, livestock and crops, provided the results
listed below:
In this segment of the population 54% of the planted areas were under 3200 m2 and 21%
were under 6400 m2. Coffee and pineapple were 51% and 12.6% of planted areas
respectively. These crops were grown throughout the year. Crops which require irrigation
such as beans and maize were present in many homesteads, but none exceeds 1 hectare;
71% of respondents did not irrigate, 18% used hose or bucket and 5% back pump. The
months with higher consumption of water were the dry season June, July and August;
51% of households had chickens and 23% pigs. 9.5% of respondents had commercial
farms;
estimations of water demand for this segment of population, taking into account domestic
and productive activities based on survey information, conclude that water demand for
crops that require supplemental irrigation was 7.57 l/s, for the critical month, June;
pesticide application was negligible, as well as coffee processing assuming the ―tank-bath‖
system. For livestock, the total demand was 0,09 l/s. For domestic activities the demand
was 0.49 l/s, using the 150 lpcd, suggested by RAS - 2000
The purpose of the study above was to estimate the water demand of small-scale agricultural
activities in terms of a per capita allocation for the design of supply systems. This study was
focused only on the demand side and did not take into account water availability. Due to its
particular objectives, the sample was not randomly selected and did not include the whole
spectrum of categories of households within the system.
__________________________________________________________________________________________________________
Balancing consumption and availability in a multiple uses of water system 49
4 METHODS
After presenting the literature review and the relevant aspects of the study area, this chapter
describes how this research was conducted. It includes the methods used to collect the data
required to develop the three proposed objectives:
To characterize groups of households within a MUS system according to aspects related
to poverty, productive activities, livelihoods and access to water
To measure different components of the domestic water per capita consumption in
households within a MUS system
To propose balances at the system and household level, including water demand for
multiple uses and water availability, considering blue water and green water.
Aspects of data management, data analysis, and the limitations of the methods used are also
addressed. The chapter is structured according to the order of the objectives and for each
objective, the methods have been described according to the chronological order in which they
were applied.
4.1 Characterization of groups of households within a MUS system according to
aspects related to poverty, productive activities, livelihoods and access to water
This objective was addressed by using two sources of information. In one hand, household´s
average water consumption, and on the other hand, water use related characteristics of the
households based on information from a survey.
Household´s average water consumption: average water consumptions of households
were obtained from readings of the household´s meters installed by the Water Committee. The
caretaker undertakes water consumption measurements every two months for the customers
of the water supply system. Within the system, 430 customers are domestic and 7 are
institutional. Water consumption records for the domestic customers in m3 from January 2009
to December 2009 (6 records – 1 record every two months) were provided to the author in
hard copy by the Water Committee. This information was transferred to an Excel spreadsheet.
Average water consumption for each household was calculated from available valid records
for the year 2009. For this purpose, the data were cleaned to remove households who had
records with anomalies. Households with 3 or more valid records from the possible 6 records
were kept within the group to perform the analysis. A sensitivity analysis indicated that in this
case, to use potential methods to complete missing data (Useche & Mesa, 2006) will distort

__________________________________________________________________________________________________________
Balancing consumption and availability in a multiple uses of water system 50
the average water consumption or otherwise will not provide any benefit for the water
consumption average calculation. Invalid records were considered as no reported value,
reported values from 0 to 3 m3 or a reported negative value. From this cleaning process, 117
households were taken out from the group of analysis as shown in Table 4-1 since their
average water consumption was not possible to be calculated under the criteria set.
Table 4-1 Data cleaning process
Category of households Number of households
Households who lack of the full six records 86
Households who lack 5 records 14
Households who lack 4 records 17
Total households which lack more than 3 records 117
According to the caretaker, this situation occurs when farms have been abandoned and also
where meters are not working and people take time to replace them. The cleaning process
resulted in a group of analysis of 313 households. For this group, mean bimonthly water
consumption, standard deviation and standard error were calculated for each household.
These descriptive measurements were calculated for the complete data set as well.
Household survey about household water use characteristics:
Sample frame and sample size: The group of analysis previously defined was the sample
frame for the household survey. It represented 73% of the served population and included
households from all the 8 villages covered by the system in a wide range of water
consumption, ranging from an average of 8 to 755 m3/ every two months.
From the sample frame, a stratified sample was defined. The population was divided into
―average bimonthly household water consumption‖ strata. The range of water consumption of
each stratum was defined based on previous studies developed in Colombia (Cinara, 2006,
Cinara, 2007a; Cinara, 2007b). The author defined these strata assuming that in the first
stratum (4 – 20 m3/every two months) households use water from the system only for
domestic uses. In the second stratum (20 – 80 m3/every two months) households develop
small-scale productive activities that contribute to family income; and in the third stratum (> 80
m3/every two months) households develop commercial activities that depend on water. It is
important to keep in mind this differentiation, since the results, discussion and conclusions
were prepared in terms of these strata.
This type of sample, the stratified sample, was selected due to it enhances the likelihood of
the proper representation of strata in the sample (Bryman & Cramer, 2001).
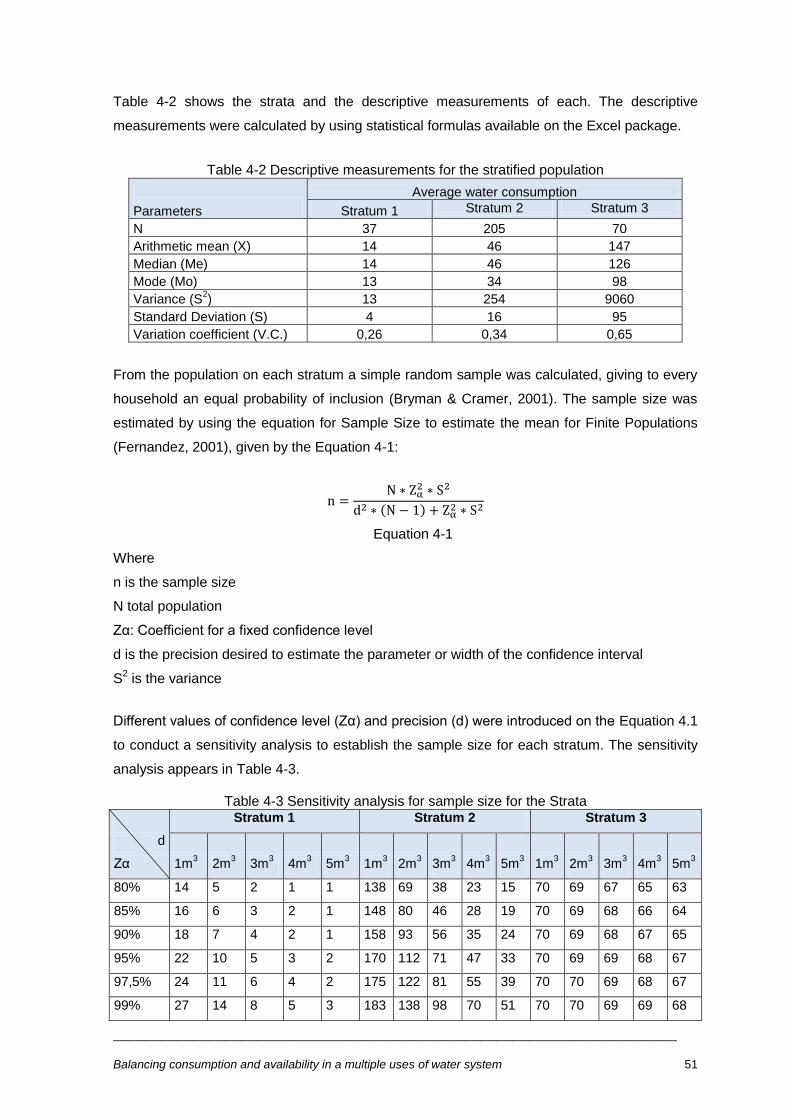
__________________________________________________________________________________________________________
Balancing consumption and availability in a multiple uses of water system 51
Table 4-2 shows the strata and the descriptive measurements of each. The descriptive
measurements were calculated by using statistical formulas available on the Excel package.
Table 4-2 Descriptive measurements for the stratified population
Parameters
Average water consumption
Stratum 1 Stratum 2 Stratum 3
N 37 205 70
Arithmetic mean (X) 14 46 147
Median (Me) 14 46 126
Mode (Mo) 13 34 98
Variance (S2) 13 254 9060
Standard Deviation (S) 4 16 95
Variation coefficient (V.C.) 0,26 0,34 0,65
From the population on each stratum a simple random sample was calculated, giving to every
household an equal probability of inclusion (Bryman & Cramer, 2001). The sample size was
estimated by using the equation for Sample Size to estimate the mean for Finite Populations
(Fernandez, 2001), given by the Equation 4-1:
Equation 4-1
Where
n is the sample size
N total population
Zα: Coefficient for a fixed confidence level
d is the precision desired to estimate the parameter or width of the confidence interval
S2 is the variance
Different values of confidence level (Zα) and precision (d) were introduced on the Equation 4.1
to conduct a sensitivity analysis to establish the sample size for each stratum. The sensitivity
analysis appears in Table 4-3.
Table 4-3 Sensitivity analysis for sample size for the Strata
d
Zα
Stratum 1 Stratum 2 Stratum 3
1m3 2m
3 3m
3 4m
3 5m
3 1m
3 2m
3 3m
3 4m
3 5m
3 1m
3 2m
3 3m
3 4m
3 5m
3
80% 14 5 2 1 1 138 69 38 23 15 70 69 67 65 63
85% 16 6 3 2 1 148 80 46 28 19 70 69 68 66 64
90% 18 7 4 2 1 158 93 56 35 24 70 69 68 67 65
95% 22 10 5 3 2 170 112 71 47 33 70 69 69 68 67
97,5% 24 11 6 4 2 175 122 81 55 39 70 70 69 68 67
99% 27 14 8 5 3 183 138 98 70 51 70 70 69 69 68

__________________________________________________________________________________________________________
Balancing consumption and availability in a multiple uses of water system 52
From the information on Table 4-3 the sample size was chosen having into consideration a
value that allow for firm conclusions, but at the same time considered the resources available
to conduct the fieldwork. The sample size chosen include a confidence level of 95%,
considered acceptable for the bulk of social research (Bryman & Cramer, 2001). A precision of
2 m3 was also selected. Table 4-4 presents a summary of the sample size selected criteria to
conduct the survey.
Table 4-4 Estimated parameters and sample size for the strata Parameters Stratum 1 Stratum 2 Stratum 3
N (sample frame) 37 205 70
Variance (S2) 13 254 9060
Zα (Confidence level) 95% 95% 95%
d (precision) 2 m3 2 m
3 2 m
3
n (sample size) 10 112 69
With the obtained sample size, a random process was conducted for household selection to
reduce the possibility of bias in the selection procedure (Bryman & Cramer, 2001). In this
case, as the sample frame was part of the Water Committee customer list, it was organized
according to villages and location of households within the villages, the random process was
adopted to eliminate the inherent ordering on the list to avoid distortions. Excel random tool
was used to obtain random numbers to select from the list of customers.
For the randomly selected households, a test was conducted to check if the mean of the
household‘s water consumption on each stratum was within the confidence interval of the
population (X ± 2 m3). The test was positive for all the stratum, confirming that the sample size
was representative of the population for the selected confidence interval (95%) and precision
(2 m3). 35 additional households were randomly selected and included within the list of
households to be surveyed, allowing for replacement, in case there was no people at the
households, people refuses to answer or any other situation at the moment of the team visit.
Household survey: To characterize households according to aspects related to poverty,
access to water and livelihoods in a MUS system, a household survey was formulated. A
questionnaire was designed including factors which affect water consumption in La Palma
Tres Puertas, informed by findings from the two preliminary studies carried out in the locality
(Cinara, 2006 and Ospina, 2009), and the literature reviewed on the topic. Those factors are
listed below:
Household size Type of sanitation system
Total area of the household Cropped area by type of main crops

__________________________________________________________________________________________________________
Balancing consumption and availability in a multiple uses of water system 53
The questionnaire also included questions to be used by two more research studies in La
Palma Tres Puertas conducted by undergraduate students. The undergraduate research
projects were also regarding MUS. One study was undertaken by one undergraduate student
in Economics about willingness to pay for improving the service continuity. The second study
was addressed by two Topographic Engineering students about changes in water and land
use in the area in a period of 5 years. Students formulated their own questions and the author
compiled a final version of the questionnaire including the questions required for the three
studies. This version was checked by the students and from professionals of the Integrated
Water Resource Management (IWRM) at Cinara, Universidad del Valle, organization funding
the research. Appendix A includes the questionnaire used.
Selected households were located on a water supply map provided by the Coffee Growers
Association. The fieldwork team consisted of the four students developing research projects,
two more undergraduate students and one junior professional from Cinara. Based on the
sample frame and the resources available, a 3 days fieldwork was planned. Before going to
the field, the author conducted a meeting with the team members to explain the objectives of
the three research projects, show the study area, the survey plan, review, practice and adjust
the questionnaire, discuss logistic issues, etc.
The survey was carried out for three days from 8:00 to 20:00, covering the 3 villages and its
sectors. The schedule of interviews was up to 20:00 due to security reasons. Household
members more than 18 years old were targeted as respondents for the interviews. The
objectives of the interview were explained in simple language to the interviewees and informed
consent was asked. Respondents were aware about their right to refuse to answer questions
or withdraw from the interview at any time, and about the confidentiality of the information.
Figure 4-1 presents one of the members of the fieldwork team interviewing a housewife in La
Palma village.
Data management: Every day after the fieldwork finished, the author checked the surveys
conducted for each team member, looking that all questions were answered and that answers
were understandable. Records regarding households where the survey could not be carried
out for different reasons were kept. An Excel spreadsheet was prepared to transfer the
collected data. Codebooks with full variable and value labels were created to process the
outcomes from the questionnaire (University of Edinburgh, 2010). A new version of the dataset
Number of animals per species Frequency of supply
Storage capacity Occupation of household head
Sale of products from the farm Monthly income level

__________________________________________________________________________________________________________
Balancing consumption and availability in a multiple uses of water system 54
was created everyday with the correspondent date and backups with the information were
prepared on data traveller disks. The number of filled questionnaires by stratum was checked
every day to find out the progress to achieve the sample size.
Figure 4-1 Fieldwork team member interviewing a local woman
Data analysis: Statistics were used to describe the basic features of the data in the study.
Tables and graphics were prepared to characterize households of the water supply system
according to the variables of the survey, having into account the strata defined by average
bimonthly household water consumption. Based on the literature review, strata were
characterized on ten variables grouped in three categories:
Poverty: household size, total area of the homestead, occupation of household head,
income level
Productive activities and livelihoods: cropped area and livestock
Access to water: location, frequency of supply, storage tank capacity and perception of
impact due to service intermittence
Results were discussed in terms of the literature review and the research questions,
establishing principles, relations, generalizations; commenting on correlation faults and
comparing this information to previous work developed by other authors in relation to these
topics.
Limitations
People which do not have more than three valid meter records were not part of the
sample frame, therefore there was people receiving water from the water supply system
that due to problems with the meter could not be included within the study
Bimonthly records were available instead monthly records. This situation limited a more
detailed analysis; for instance, between wet and dry season consumption, since the

__________________________________________________________________________________________________________
Balancing consumption and availability in a multiple uses of water system 55
bimonthly periods of readings do not match strictly with the bimodal climatic behaviour in
the study area
It is possible people may not have provided accurate information. Many interviewees were
afraid of the purposes of the survey, despite the team were keen to explain the academic
aim of the activity and the confidentiality of the information. People were very suspicious
since the questionnaire included questions about people assets (land, livestock), income
levels and willingness to pay for improvements on the water service5, etc. Various
interviewees also remembered that during 2005, other students developed similar
interviews, and according to them, after those studies, tariffs were increased.
At the end of the fieldwork, a smaller number of households were interviewed on stratum
2 and 3 in relation to the calculated sample. It reduced the precision of the information on
these strata. The main causes for this situation were that some households were
abandoned, households were used for recreation purposes and habited just on
weekends; at the moment of the visit inhabitants were working out; households could not
be found by the team members, or the access was very difficult. Other two situations that
limited to achieve the sample size were that some people refused to answer the
questionnaire due to fear of the purposes of the information; and in other cases, some
people recommended the team members not to visit some households, due to the risk to
find aggressive people.
The situation described above, was more critical for the third stratum, since the sample
size (69) was almost equal to the population (70) and just 32 people were interviewed.
These problems appear on more than the 35 spare households selected within the
sample, and since the stratification did not match with the location of the households and
the scattered of the area, it would be complicated and costly to find out a way to replace
the households to achieve the sample within the available time to conduct the fieldwork.
The final sample size per stratum and their statistical parameters appear in Table 4-5.
Table 4-5 Final parameters and sample size for the strata Parameters Stratum 1 Stratum 2 Stratum 3
N (sample frame) 37 205 69
Variance (S2) 13 254 9060
Zα (Confidence level) 95% 95% 95%
d (precision) 2 m3 2 m
3 2 m
3
n (sample size) 10 112 69
nR (real sample size) 17 84 33
dR (real precision) 1 m3 3 m
3 24 m
3
5 For the purpose of the undergraduate researches
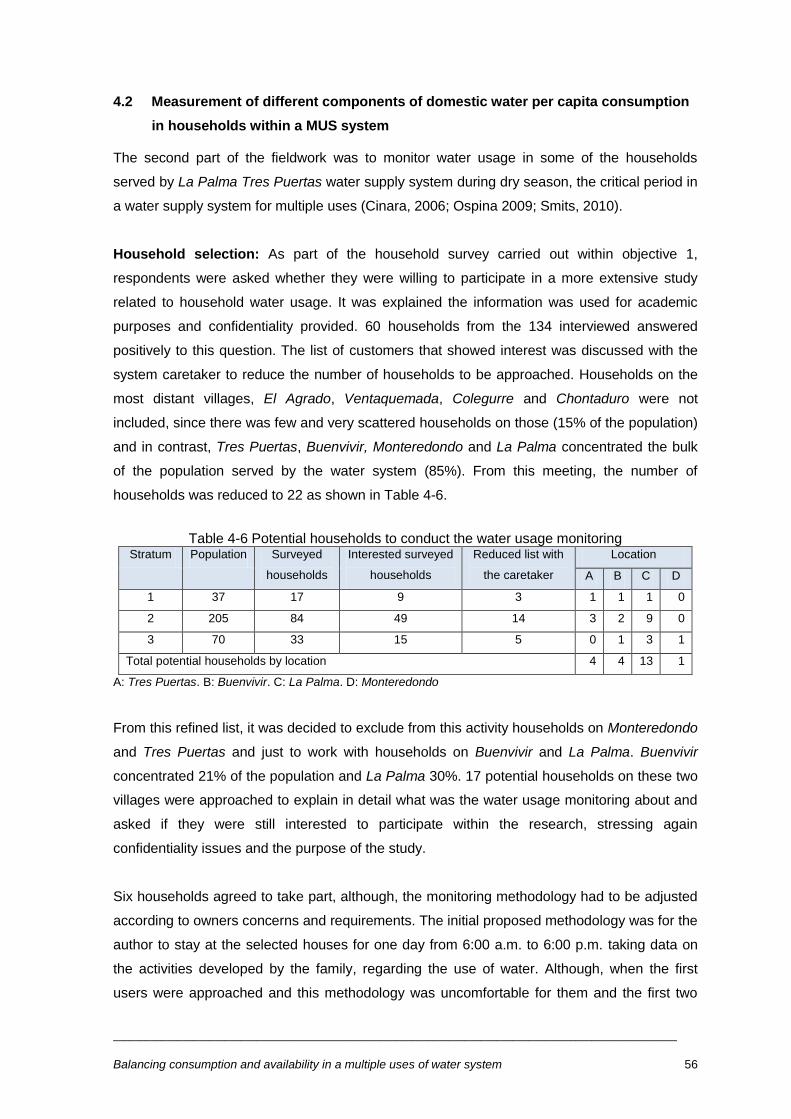
__________________________________________________________________________________________________________
Balancing consumption and availability in a multiple uses of water system 56
4.2 Measurement of different components of domestic water per capita consumption
in households within a MUS system
The second part of the fieldwork was to monitor water usage in some of the households
served by La Palma Tres Puertas water supply system during dry season, the critical period in
a water supply system for multiple uses (Cinara, 2006; Ospina 2009; Smits, 2010).
Household selection: As part of the household survey carried out within objective 1,
respondents were asked whether they were willing to participate in a more extensive study
related to household water usage. It was explained the information was used for academic
purposes and confidentiality provided. 60 households from the 134 interviewed answered
positively to this question. The list of customers that showed interest was discussed with the
system caretaker to reduce the number of households to be approached. Households on the
most distant villages, El Agrado, Ventaquemada, Colegurre and Chontaduro were not
included, since there was few and very scattered households on those (15% of the population)
and in contrast, Tres Puertas, Buenvivir, Monteredondo and La Palma concentrated the bulk
of the population served by the water system (85%). From this meeting, the number of
households was reduced to 22 as shown in Table 4-6.
Table 4-6 Potential households to conduct the water usage monitoring Stratum Population Surveyed
households
Interested surveyed
households
Reduced list with
the caretaker
Location
A B C D
1 37 17 9 3 1 1 1 0
2 205 84 49 14 3 2 9 0
3 70 33 15 5 0 1 3 1
Total potential households by location 4 4 13 1
A: Tres Puertas. B: Buenvivir. C: La Palma. D: Monteredondo
From this refined list, it was decided to exclude from this activity households on Monteredondo
and Tres Puertas and just to work with households on Buenvivir and La Palma. Buenvivir
concentrated 21% of the population and La Palma 30%. 17 potential households on these two
villages were approached to explain in detail what was the water usage monitoring about and
asked if they were still interested to participate within the research, stressing again
confidentiality issues and the purpose of the study.
Six households agreed to take part, although, the monitoring methodology had to be adjusted
according to owners concerns and requirements. The initial proposed methodology was for the
author to stay at the selected houses for one day from 6:00 a.m. to 6:00 p.m. taking data on
the activities developed by the family, regarding the use of water. Although, when the first
users were approached and this methodology was uncomfortable for them and the first two
__________________________________________________________________________________________________________
Balancing consumption and availability in a multiple uses of water system 57
houses refuses, the author took the decision to propose two options to participate. The first
one was to do it in the initial way and the second was for a household member who knows
how to read and write to fill a water diary for one day. Most of the time, housewives received
this information and took the decision to participate, since they were at home, while men were
working at the fields. In this way, seven households agreed to participate on the study. Five
housewives chose to fill the diaries and two chose allow the author to stay at the premises,
although, one of them agreed to start the monitoring after 11:00 a.m. which was not really
useful, therefore, this house was rejected. The participant houses were distributed one on the
stratum 1, two on the stratum 2, and three on the stratum 3. All the people who decided to fill
the diaries were young-adult housewives. In these households, appointments were set to
explain to woman how to fill the diaries, train them on the measurement devices and to
conduct flow and volume measurements for the water abstraction devices.
Women training and water abstraction devices measurements: Women were visited at their
premises to deliver the diaries and explain how to fill them. The activity started with a semi-
structured interview to review the household water uses, make an inventory of water
abstraction devices for every water use, water storage units, meters, etc. Women were also
asked about activities not developed every day. After that, the diary was explained. The diary
consisted on three sections; one for the use of the toilet, one for bathing, hand washing and
brush teeth, and the last one for the activities that occur in other areas of the house. The
sections included five basic questions:
What time was the water use? In this question respondents had to write hour and
minute when activities related to water were carried out.
What was the water use for? In this question respondents had to write the activities
developed that involved the use of water. i.e. to prepare coffee, to wash body, etc.
What was used to take the water? In this box respondents had to include the device
used to extract the water. i.e. kitchen tap, white container, shower tap.
What quantity of water was used? In this box respondents had to write the time during
which tap was opened or the number of times they used a container to extract water
for the activity developed
Who use the water? this box had to be filled with the name of the household member
who use the water for the activity
Observations: Any comments respondents want to include.
The form for the toilet use was almost the same, but just included the time, if it was cleaned by
a flush or with water poured with a container, the number of flushes or containers used, and
observations.

__________________________________________________________________________________________________________
Balancing consumption and availability in a multiple uses of water system 58
It was detailed explained to woman and other family members how to fill the diary and a watch
with chronometer was delivered in every household. Women were told that they could keep
the watch after the monitoring, which was a good strategy to motivate them. It was
emphasized and practiced how to record water quantities.
After remembering the household water uses and explaining the diary, an inspection was
carried out to recognize the water points used for each activity and to take flow measurements
on the water taps and volume measurement of the containers used for the activities. The flow
was measured in all water household taps, asking people to open the taps in the degree they
normally used. The volume of the containers people use to extract water, i.e. in the lavadero6
was also measured. People actively participated in these measurements. Basically, four
methods were adopted based on those reported by Roa & Brown (2009):
Water flows from taps were collected with containers suitable to the space and volume
delivered and the stopwatch. Then the collected volume was measured with a
graduated cylinder of 500 ml.
In the case where water was taken from storage tanks trough containers, the volumes
of these were measured also with the graduated cylinder of 500 ml. Women were
asked to fill the containers at the level they normally used and also during the
monitoring to try to use the water at the same level.
The volume discharged by flush toilets was measured with the tank´s geometry, taking
into account their surface area and the drop level in the tank after the flush.
For pour flush toilets, the volume of the container normally used for cleaning was also
measured.
It was agreed with the housewives to fill the diary during the day following the explanation. In
the household that chose that the author stay and observe the water use, the activity started at
6:00 a.m. and finished at 4:30 p.m. The author and a trained assistant recorded all the water
related activities carried out by the family members and conducted flow and volume
measurements at times where water was not in use. Family members listed the activities they
usually conduct for the rest of the period and since those were the same than those developed
previously during the day, estimations were done to complete the 24 hours period. Figure 4-2
shows one woman who filled the diary in one of the participant households next to her
lavadero.
6 Place outside the home where people use to wash clothes by hand, and even for other purposes at the
homestead, i.e. washing dishes, brush teeth, etc. In La Palma – Tres Puertas lavaderos are provided with
relatively large tanks to store water.

__________________________________________________________________________________________________________
Balancing consumption and availability in a multiple uses of water system 59
Figure 4-2 Housewife in one of the monitored households
Data management: Data from each household and for categories of use was transferred after
the monitoring day to individual record sheets and water consumption was calculated based
on frequency, time, flow and volume measurements.
Data analysis: Data from the measurements was computed using Excel spreadsheets. The
distribution of domestic water consumption which correspond to uses such teeth brushing,
hand washing, cooking, bathing, washing dishes, washing clothes, sanitation, housekeeping
and garden irrigation were obtained from this information. The total water daily domestic
consumption and per capita domestic water consumption was also calculated. Averages of the
six households for all these parameters were also computed.
As for Objective 1, results were discuss in terms of the literature review and the research
questions, establishing principles, relations, generalizations, commenting on correlation faults
and comparing this information to previous work developed by other authors in relation to
these topics.
Limitations:
As noted by Bramfit et al. (1997) the time limit of 1 day precluded the research from
covering weekly variations in water usage, as well as seasonal variations
Despite that, the initial purpose of this activity was to conduct measurements for both
domestic and productive uses, since women agreed to fill the diaries; the collected
information was restricted to domestic uses.
As for the household survey, despite informed consent, most people did not feel
comfortable with household observations, especially on issues related to water
service, leading to a low participation

__________________________________________________________________________________________________________
Balancing consumption and availability in a multiple uses of water system 60
In some households, people could reduce their normal water consumption since they
could think they did not want to be seen as people who waste water.
4.3 Proposal of balances at the system and household level including water demand
for multiple uses and water inputs, considering blue water and green water
Water accounting tools together with information from the meter records, household survey,
household monitoring, climatic information and storage tank flow measurements were used to
produce the water balances.
The water balance analysis covered households served by the water supply system
(respondents to household survey) for the period of May and June 2010, as most of the
information required for the balance was available for this period. According to historical data
(Cenicafé, 2010) these months represents dry season conditions. An initial draft of the water
balance was prepared based on the available information for the area (Cinara, 2006; Ospina,
2009), literature about water supply and multiple uses of water in Colombia, and literature
about water balances, cited in this document (Perry, 1996; Molden, 1997; McKinney et al,
1999; Rosegrant et al., 2002; Ratnaweera et al., 2006; Healy et al., 2007). The sketch appears
in Figure 4-3. The boundaries of the system were defined according to the research purposes
and the information that was feasible to acquire for this region.
Based on the sketch the information needed to describe the balance was collected during the
fieldwork period as described below:
Figure 4-3 Initial proposed sketch for the water balance
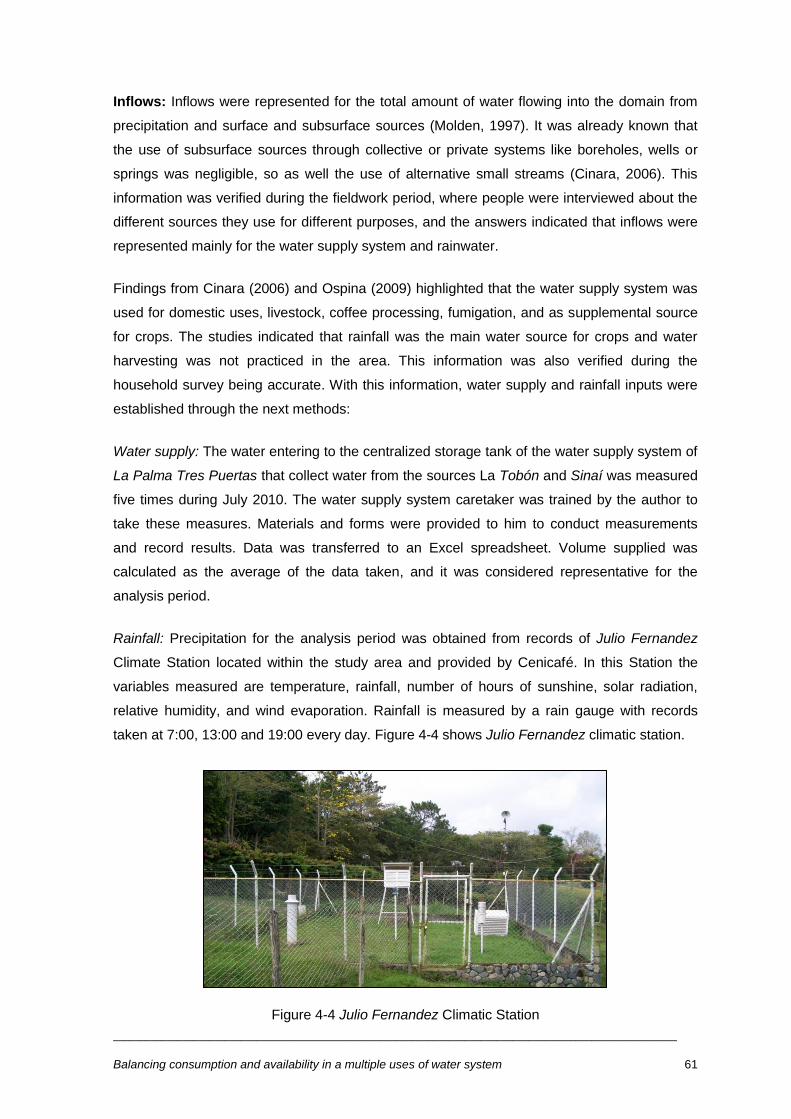
__________________________________________________________________________________________________________
Balancing consumption and availability in a multiple uses of water system 61
Inflows: Inflows were represented for the total amount of water flowing into the domain from
precipitation and surface and subsurface sources (Molden, 1997). It was already known that
the use of subsurface sources through collective or private systems like boreholes, wells or
springs was negligible, so as well the use of alternative small streams (Cinara, 2006). This
information was verified during the fieldwork period, where people were interviewed about the
different sources they use for different purposes, and the answers indicated that inflows were
represented mainly for the water supply system and rainwater.
Findings from Cinara (2006) and Ospina (2009) highlighted that the water supply system was
used for domestic uses, livestock, coffee processing, fumigation, and as supplemental source
for crops. The studies indicated that rainfall was the main water source for crops and water
harvesting was not practiced in the area. This information was also verified during the
household survey being accurate. With this information, water supply and rainfall inputs were
established through the next methods:
Water supply: The water entering to the centralized storage tank of the water supply system of
La Palma Tres Puertas that collect water from the sources La Tobón and Sinaí was measured
five times during July 2010. The water supply system caretaker was trained by the author to
take these measures. Materials and forms were provided to him to conduct measurements
and record results. Data was transferred to an Excel spreadsheet. Volume supplied was
calculated as the average of the data taken, and it was considered representative for the
analysis period.
Rainfall: Precipitation for the analysis period was obtained from records of Julio Fernandez
Climate Station located within the study area and provided by Cenicafé. In this Station the
variables measured are temperature, rainfall, number of hours of sunshine, solar radiation,
relative humidity, and wind evaporation. Rainfall is measured by a rain gauge with records
taken at 7:00, 13:00 and 19:00 every day. Figure 4-4 shows Julio Fernandez climatic station.
Figure 4-4 Julio Fernandez Climatic Station

__________________________________________________________________________________________________________
Balancing consumption and availability in a multiple uses of water system 62
Outflows: Outflows were divided in six major categories:
Domestic consumption: Comprises uses such as drinking, food preparation, bathing,
sanitation, washing clothes, brushing teeth, hand washing and garden irrigation (ornamental
plants). It was estimated from the household survey using the household size, understood as
the number of people within a household and a factor for domestic per capita water
consumption. This factor was informed by literature review and the household monitoring
conducted for the Objective 2.
Livestock consumption: Comprises water consumption for the livestock that people kept at the
household. From the household survey it was identified those animals were: chickens, pigs,
cows, horses and in a minor scale rabbits and guinea pigs. The survey also provided the
number of animals per species. The quantity of animals was multiplied for a water
consumption factor selected according to the reference values provided by literature sources
(Roa, 2005; Barrios, 2008; Ospina, 2009) and having into account the conditions of La Palma
Tres Puertas, information from local people and observation. The factors included the required
amount of water for drinking and cleaning purposes.
Coffee processing: It was estimated as suggested by Ospina (2009) taking into account the
coffee productivity per hectare for the region, the specific water consumption per pound of
produced coffee, according to different processing systems, and the cropped area of each
household. The most common coffee production system in La Palma Tres Puertas is coffee
with shadow, which productivity of 1398.5 kgPC/He*year (Ospina, 2009). In this region (3° - 4°
North Latitude), the harvest occurs two times a year: the main runs from September to
December and a lower harvest from April to June called ―Traviesa‖. ―Traviesa‖ productivity is
approximately 40% of the total annual productivity (Cenicafé, 2006). Thus coffee productivity
was considered approximately the 25% of the total productivity (0,35 KgPC/m2) in order to
reduce the April production since this month was not part of the analysis period. On the other
hand, three water consumption factors for coffee processing were considered according to the
main processing systems (Ospina, 2009): Traditional 0,04 m3/KgPC, Tank-Tube 0,0042
m3/KgPC and Belcosub 0,001 m
3/KgPC. The water consumption for coffee processing per
each household was obtained by multiplying these factors for the area planted informed by the
household survey.
Small Business: It was identified a small amount of stores (3). In these stores, usually people
just run the business and in some cases, owners lived there and in some other cases they did
not. In any of these cases crops, livestock or other water related uses were developed. Thus,

__________________________________________________________________________________________________________
Balancing consumption and availability in a multiple uses of water system 63
the consumption in this category was estimated by subtracting the domestic water
consumption if they had, to the total water consumption.
Crop consumption - irrigation: Crop type and cropped area per homestead for the analysis
period were obtained from the household survey; crop water requirements were estimated
according to the methodology suggested on the Guidelines for Computing Crop Water
Requirements, FAO Irrigation and Drainage Paper vol. 56 (Allen et al., 1998). To apply this
methodology the following information was obtained:
Climatic information:
Crop reference evapotranspiration (ETo): Obtained using the CROPWAT software which
uses the FAO Penman-Monteith method and which computes this parameter from climatic
data such as Mean Maximum and Mean Minimum Temperature, Air Humidity, Wind Speed
and Daily Sunshine for the period of analysis, available parameters at Julio Fernandez
Station. Information related to the Altitude, Latitude and Longitude of the station is also
required to use this software.
Effective precipitation (Pe): was obtained through CROPWAT by providing Total rainfall in
mm/month for the study area. This software computes effective precipitation using the Soil
Conservation Service - SCS method. Precipitation was obtained from Julio Fernandez
Station.
Crop information:
The total crop growing period was obtained from the Agronomic Guide for the representative
crops of Valle del Cauca department (Gobernación del Valle del Cauca, n.d.). The total period
was divided in initial, development, media and final stage by adapting the length of the stages
proposed by Allen et al. (1998) to the total crop growing period for the local conditions. From
this information crop calendars were prepared as suggested by Brouwer et al. (1992) having
into account cropping patterns for the region informed by FAO (2006), and observations during
the field work and informal interviews to local people. Crop coefficients (kc) were selected for
each crop and development stage from the literature review (Allen et al., 1998; Ospina, 2009).
Crop water use was calculated as suggested by Brouwer & Heibloem (1986) Equation 4-2:
Equation 4 – 2
with
ETc = Total crop water need (mm/month)
Kc = crop factor

__________________________________________________________________________________________________________
Balancing consumption and availability in a multiple uses of water system 64
ETo = reference evapotranspiration (mm/month)
Crop water use from the rain (Crops green water consumption – CGWC) was equal to the
minimum value between Etc and Pe (mm/day) and Crop water need from the water supply
system (Crops blue water consumption – CBWC) was calculated using Equation 4-3:
Equation 4-2
Where:
ETC is Total crop water need (mm/month)
Pe is Effective precipitation given (mm/month)
Calculations were developed separately for May and June 2010, then added to account for the
total crop water requirement of the analysis period, and converted to m/period.
Crop consumption - fumigation: It was estimated accounting for the insecticides, fungicides
and herbicides dosage, number of applications in the period for each crop and cropped area.
Ospina (2009) used this methodology and specifies the main parameters for conditions in La
Palma – Tres Puertas, where crops are developed at small-scale and applications are made
with a back pump (20 litres capacity). Some local farmers also informed about the quantity of
water used to fumigate some of the crops and this information was used in the case of guava
and pitaya. Table 4-7 shows the selected factors for this use.
These factors were multiplied by the cropped area for each crop informed by the household
survey to obtain the crop requirement for fumigation.
Table 4-7 Factors used to estimate fumigation water demand Crop Dose (l/He*month) Factor (m
3/m
2*period)
Vegetables 2121 0,000042
Beans 2831 0,000057
Pineapple 501 0,000010
Guava 1302 0,000026
Pitaya 3002 0,000060
Maize 1501 0,000030
Cain 751 0,000015
Lulo 901 0,000018
1 Ospina (2009)
;
2Local farmers

__________________________________________________________________________________________________________
Balancing consumption and availability in a multiple uses of water system 65
Swimming pools consumption: Information from the household survey indicated the presence
of swimming pools in three farms. The water consumption required for this purpose was
obtained from the difference between total water consumption of the household and the
remaining uses the household had.
Equations, factors and variables used to estimate water consumptions for the different
purposes are summarized in Table 4-8.
Table 4-8 Equations, factors and variables to estimate water consumption for MUS Water Use Formula Variable Factor
Domestic
consumption
(DC)
Household size
Domestic per capita
consumption (lpcd) 75 l/capita*day
Livestock
consumption
(LC)
Number of cows 40 l/head*day
Number of chickens 0,15 l/head*day
Number of pigs 20 l/head*day
Number of horses 20 l/head*day
Number of rabbits 0,5l/head*day
Number of guinea pigs 0,5 l/head*day
Number of ducks 0,3 l/head*day
Coffee
processing
consumption
(CPC)
Water consumption
system factor
0,04 00 m3/KgPC
0,0042 m3/KgPC
0,0010 m3/KgPC
Productivity factor 0,035 KgPC/m2
Cropped area (m2)
Small business
consumption
(SBC)
Total water
consumption
Domestic consumption
Crop green
water
consumption
(CGWC)
Cropped area with
coffee 0,1465 m/period
Cropped area
pineapple 0,0465 m/period
Cropped area beans 0,0705 m/period
Cropped area maize 0,1465 m/period
Cropped area
vegetables 0,1465 m/period
Cropped area pitaya 0,0837 m/period
Cropped area lulo 0,1465 m/period
Cropped area plantain 0,1465 m/period
Cropped area cassava 0,1465 m/period
Cropped area citrus 0,1209 m/period
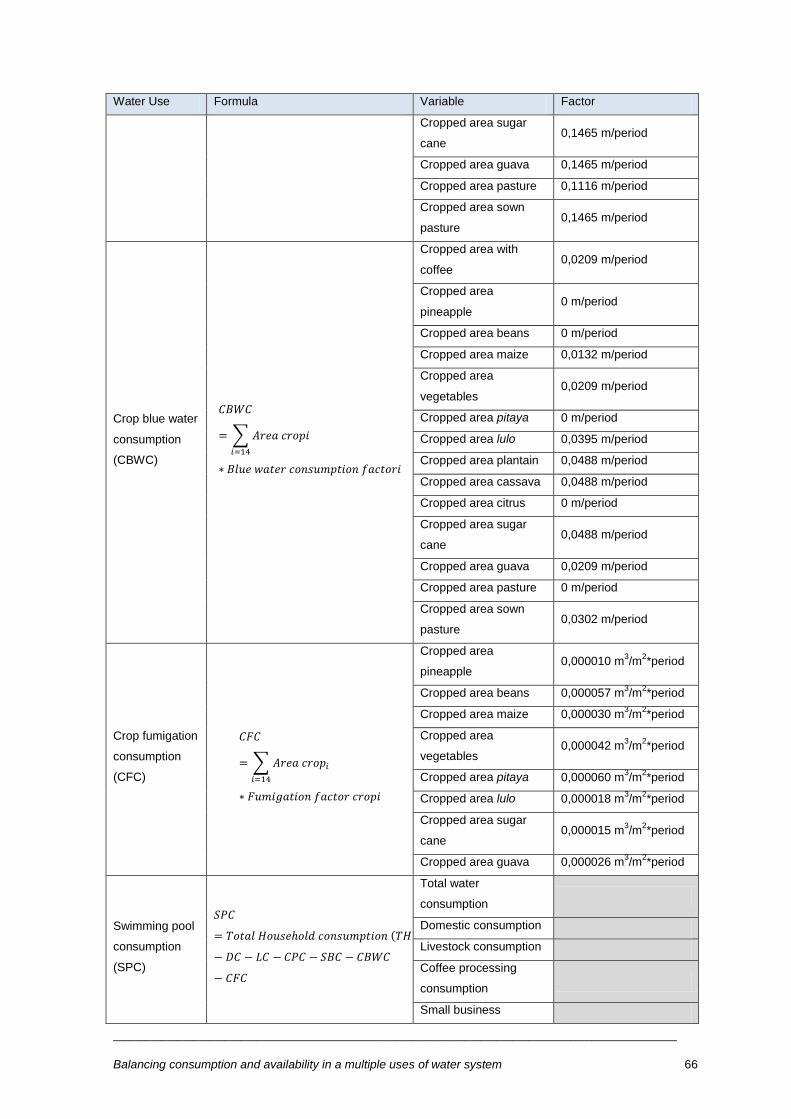
__________________________________________________________________________________________________________
Balancing consumption and availability in a multiple uses of water system 66
Water Use Formula Variable Factor
Cropped area sugar
cane 0,1465 m/period
Cropped area guava 0,1465 m/period
Cropped area pasture 0,1116 m/period
Cropped area sown
pasture 0,1465 m/period
Crop blue water
consumption
(CBWC)
Cropped area with
coffee 0,0209 m/period
Cropped area
pineapple 0 m/period
Cropped area beans 0 m/period
Cropped area maize 0,0132 m/period
Cropped area
vegetables 0,0209 m/period
Cropped area pitaya 0 m/period
Cropped area lulo 0,0395 m/period
Cropped area plantain 0,0488 m/period
Cropped area cassava 0,0488 m/period
Cropped area citrus 0 m/period
Cropped area sugar
cane 0,0488 m/period
Cropped area guava 0,0209 m/period
Cropped area pasture 0 m/period
Cropped area sown
pasture 0,0302 m/period
Crop fumigation
consumption
(CFC)
Cropped area
pineapple 0,000010 m
3/m
2*period
Cropped area beans 0,000057 m3/m
2*period
Cropped area maize 0,000030 m3/m
2*period
Cropped area
vegetables 0,000042 m
3/m
2*period
Cropped area pitaya 0,000060 m3/m
2*period
Cropped area lulo 0,000018 m3/m
2*period
Cropped area sugar
cane 0,000015 m
3/m
2*period
Cropped area guava 0,000026 m3/m
2*period
Swimming pool
consumption
(SPC)
Total water
consumption
Domestic consumption
Livestock consumption
Coffee processing
consumption
Small business

__________________________________________________________________________________________________________
Balancing consumption and availability in a multiple uses of water system 67
Water Use Formula Variable Factor
Consumption
Crop blue water
consumption
Crop fumigation
consumption
Balance Adjustment: After defining the components, variables and factors for the water
balance, a spreadsheet was prepared on Excel including all the information provided in Table
4-8. A formula for the water balance was included to check that for every household the total
amount of water taken for the analysis period (meter record) was equal to the addition of the
different estimated components described before. The Formula appears on Equation 4-3:
Equation 4-3
Where:
THC = Total Household Consumption provided for meters records
DC = Domestic Consumption
LC = Livestock Consumption
CPC = Coffee Processing Consumption
SBC = Small Business Consumption
CBWC = Crop Blue Water Consumption
CFC = Crop Fumigation Consumption
From Equation 4-4 the ―validity‖ of the previous assumptions was tested. For instance, a
consumption factor was initially included for domestic uses as 75 lpcd according to the results
of the household water monitoring (Objective 2). This factor was checked with the water
balance equation for the households that have exclusively domestic uses and it was decided
to make it variable to be able to balance the equation. The same process was performed to
check the factors for animal species, coffee processing and fumigation. After that, crop water
requirements to the water supply system were included. By doing this, all the balances were
negative in big proportions for the households with crops, which require irrigation. Thus, it was
decided to check individually the survey to find in people answers if they irrigate the crops and
it was found that most responses to this question were negative for most of the crops, in most
of the cases, except for some households who grow vegetables, maize, guava and lulo. Few
people (11) which grow plantain, cassava and sugar cane, despite having ―no‖ answers about
irrigation had surplus that cannot be associated to other uses, and since these crops require
irrigation, the surplus was assigned to this category of consumption. Therefore, it was decided

__________________________________________________________________________________________________________
Balancing consumption and availability in a multiple uses of water system 68
to take the crop water requirement as the surplus obtained from subtracting the domestic
consumption, coffee processing and livestock consumption to the total household water
consumption. It was carried out just for households that have crops, which require
supplemental irrigation, according to the previously calculated needs with FAO methodologies
(Allen et al., 1998; Brouwer et al., 1992).
Adjustments were done checking the information from each household in order to make the
addition of the estimated consumptions equal to the total water consumption indicated by the
meter records. After this process, ―validated‖ equation, variables and factors were obtained
and appear in Table 4-9.
Table 4-9 ―Validated‖ equation, factors and variables to estimate water consumption for MUS Water Use Formula Variable Factor
Domestic
consumption
(DC)
Household size
Domestic per capita
consumption (lpcd)
Livestock
consumption
(LC)
Number of cows
40 l/head*day
Number of chickens 0,15 l/head*day
Number of pigs 20 l/head*day
Number of horses 20 l/head*day
Number of rabbits 0,5l/head*day
Number of guinea pigs 0,5 l/head*day
Number of ducks 0,3 l/head*day
Coffee
processing
consumption
(CPC)
Water consumption
system factor 0,0042 m
3/KgPC
Productivity factor 0,035 KgPC/m2
Cropped area (m2)
Small business
consumption
(SBC)
Total water
consumption
Domestic consumption
Crop green
water
consumption
(CGWC)
Cropped area with
coffee 0,1465 m/period
Cropped area
pineapple 0,0465 m/period
Cropped area beans 0,0705 m/period
Cropped area maize 0,1465 m/period
Cropped area
vegetables 0,1465 m/period
Cropped area pitaya 0,0837 m/period

__________________________________________________________________________________________________________
Balancing consumption and availability in a multiple uses of water system 69
Water Use Formula Variable Factor
Cropped area lulo 0,1465 m/period
Cropped area plantain 0,1465 m/period
Cropped area cassava 0,1465 m/period
Cropped area citrus 0,1209 m/period
Cropped area sugar
cane 0,1465 m/period
Cropped area guava 0,1465 m/period
Cropped area pasture 0,1116 m/period
Cropped area sown
pasture 0,1465 m/period
Crop fumigation
consumption
(CFC)
Cropped area
pineapple 0,000010 m
3/m
2*period
Cropped area beans 0,000057 m3/m
2*period
Cropped area maize 0,000030 m3/m
2*period
Cropped area
vegetables 0,000042 m
3/m
2*period
Cropped area pitaya 0,000060 m3/m
2*period
Cropped area lulo 0,000018 m3/m
2*period
Cropped area sugar
cane 0,000015 m
3/m
2*period
Cropped area guava 0,000026 m3/m
2*period
Crop blue water
consumption
(CBWC)
Cropped area maize
Cropped area
vegetables
Cropped area lulo
Cropped area plantain
Cropped area cassava
Cropped area sugar
cane
Cropped area guava
Swimming pool
consumption
(SPC)
Total water
consumption
Domestic consumption
Livestock consumption
Coffee processing
consumption
Small business
Consumption
Crop blue water
consumption
Crop fumigation
consumption

__________________________________________________________________________________________________________
Balancing consumption and availability in a multiple uses of water system 70
Cleaning of the database: households whose water use and estimated demands showed
significant differences (positive or negative) in the total water consumption indicated by the
meter records were removed from the database. Therefore, from the initial list of 134
households a more reliable database with 106 registers was obtained.
Other water balance components estimation:
Return flows: return flows comprises the uses of water at farm level that become wastewater,
such as water used for sanitation, shower, hand washing, clothes washing and brushing teeth.
The use of water for washing pig sheds and processing of coffee was also considered. This
flow of water was calculated using Equation 4-4:
Equation 4-4
Where:
DC = Domestic Consumption (m3)
LCPigs = Pigs Consumption (m3)
CPC = Coffee Processing Consumption (m3)
0,80 factor which account for the proportion of the total water used for domestic purposes
which become wastewater, informed by results from household water use monitoring
(Objective 2)
0,6 factor which account for the proportion of the total water used for pigs which become
wastewater, informed by (Roa, 2005; Barrios, 2008) and some field observations
In this system, however, since there is no collective wastewater collection and transport
system and these flows are handled at site, most of this water flow eventually infiltrates into
the ground.
Runoff (R): Excess flow from rain that flows over the land
Equation 4-5
Where:
PT = Total rainfall for the period (mm)
PE = Effective precipitation for the period (mm)
Area = total area of the homesteads in m2 provided by the household survey
Downstream + Groundwater (DW + GW): Considered as the amount of water that falls from
rainfall, is not harvested or used by crops. It was estimated by Equation 4-6:

__________________________________________________________________________________________________________
Balancing consumption and availability in a multiple uses of water system 71
Equation 4-6
Where:
PT = Total rainfall for the period (m3)
R = Runoff (m3)
CWGC = Crop Green Water Consumption (m3)
The information below was calculated as well:
Per household:
Total daily per capita consumption
Domestic daily per capita consumption
Productive daily per capita consumption (total and according to categories of
productive use)
Per stratum:
Average total daily per capita consumption
Average domestic daily per capita consumption
Average daily productive per capita consumption (total and according to categories of
productive use)
Average daily per capita green water used by crops
Average daily per capita return flows
Average daily per capita downstream and groundwater flows
At system level
Volume of domestic water consumed per period7
Volume of productive water consumed (total and according to categories of productive
use)
Volume of green water used by crops
Volume of return flows
Volume of downstream and groundwater flows
Distribution of the water supply inflow according to categories of use, and according to
stratum
Distribution of the rainfall inflow according to categories of use
7 The period refers to the two months on May and June 2010, that represents dry season conditions

__________________________________________________________________________________________________________
Balancing consumption and availability in a multiple uses of water system 72
Results were discussed regarding concepts presented on the literature review and to the light
of the research questions formulated.
Limitations:
The water balance developed was indicative, based on rough information and several
assumptions
A big proportion of the meters in this system were broken, some of them have been in this
condition for more than three years, and therefore it was not possible to include these
households within this study
The effect of the household storage tanks was not included on the analysis performed,
which may have an impact, specially in the case of few (2) households which storage
capacities about 100 m3
Livestock consumption factors represent a significant uncertainty since aspects such as
age or status of animals (significant for cattle and pigs) and type of cattle (i.e. Dairy or
Beef cattle) which are important for water demand estimations were not included on the
household survey
Coffee processing consumption estimations can be inaccurate since annual coffee
productivity for the region varies significantly in the different literature sources. It would be
better to ask on the household survey the coffee processing system to avoid make this
assumption and in contrary, to have data on this aspect
Regarding to crop water requirements information of crop coefficients for some of the
species grown on the area are not reported in the available literature
Areas of the homesteads provided by people may be not accurate
Some of those interviewed could report a smaller amount of assets (area planted, number
of livestock) of interest to the water consumption estimations for fear to be charge by
taxes, etc.

__________________________________________________________________________________________________________
Balancing consumption and availability in a multiple uses of water system 73
5 RESULTS AND DISCUSSION
This chapter presents and discuss the findings from the research activities carried out, in
relation to the literature review and the research questions posed. Section 5.1 presents and
discuss findings, making relations between categories of households based on water
consumption (strata), and poverty, productive activities, livelihoods and access to water;
Section 5.2 presents and discuss results related to water consumption for domestic purposes,
according to different categories of domestic use, obtained from the household monitoring in
six participant households. Section 5.3 includes results and discussion on water consumption
for productive activities; water availability, and interaction between blue and green water to
supply demands, developed using the water balance approach. Most results are presented
and discussed in terms of the strata defined on the methods chapter.
5.1 Characteristics of households within a MUS system, according to poverty,
livelihoods and access to water
This section presents and discusses the results of the activities undertaken to address
Objective 1: To characterize groups of households within a MUS system, according to aspects
related to poverty, productive activities, livelihoods and access to water.
5.1.1 Poverty and water consumption
From the literature reviewed on poverty and sustainable livelihoods (Haughton & Khandker,
2009; UNDP, 2003; UNDP, 2006; UNDP, 2007; World Bank, 2009; Ashley & Carney, 1999
and Nicol, 2000) it was possible to identify some aspects or indicators that help to describe
when people are poor or are more likely to be. Some of these aspects considered for this
project were: location, amount of land that is available, property of the land, the number of
people living in a house (household size), the occupation of the household head, and finally,
the monthly income a family can acquire from the activities carried out for their survival. These
indicators were related to water consumption.
As expressed in section 1.6 Scope, in this research, a household is considered as the building
where people have shelter and its surrounding areas, in most cases owned by the family, in
which people may develop income-generating activities.
Figure 5-1 presents household area in relation to water consumption. 39% of the people which
had water consumption less than 20 m3/every two months (stratum 1) had households with
areas less than 500 m2, while in strata 2 (20 – 80 m
3/every two months) and 3 (> 80 m
3/every
two months) this proportion was just 8% and 4% respectively. People with household areas

__________________________________________________________________________________________________________
Balancing consumption and availability in a multiple uses of water system 74
higher than 10 Hectare (100000 m2) did not have a low water consumption (< 20 m
3/every two
months). Most of the people served by this system were smallholders, with household areas
less than 5 Hectares.
Figure 5-1 Household area (103 m
2) and water consumption
Figure 5-1 presents a significant relation between household area and water consumption.
The Figure shows how people with less area used less water and the opposite. In the case of
rural areas and multiple uses of water services, this may be related to the possibilities that
people with more land available have to develop productive activities that depend on water to
ensure their livelihoods. However, Figure shows the presence of users with high consumption
of water and few available land. These cases were from people with productive activities that
depended on water, but did not require large areas (i.e. raising one or two pigs); or people
who grew crops that were less water demanding compared to other crops in the region. The
graph also shows large-area households with low water consumption. This is due to two main
reasons, large household areas where land was not productive or when the household size
was 2 or less people.
Figure 5-2 presents the relation between household tenure and water consumption. It shows
that users in all ranges of consumption were primarily homeowners, over 70% users in every
stratum. In less than 10% in strata 1 and 2, houses were borrowed, and shared houses
accounted for 5% in strata 2 and 17% on stratum 3.
The 70% of people in all strata who were homeowners, may have the ability to decide on the
use of its assets, such as land and water, which may not occur in households in the category
of borrowed and rented in stratum 1, where none of them (4/4) developed productive activities.
There was a special case in 48% of the households which appear as own in stratum 3. These
households belonged to people who did not live at those, and there was a proprietor‘s house
and another house for caretakers and their families. Caretakers lived permanently on the site,
0%
20%
40%
60%
80%
100%
< 20 m3/2 months
20 - 80 m3/ 2 months
> 80 m3 / 2 months
Pe
rce
nta
gee
of
ho
use
ho
lds
Stratum
100,0 - 1000,0
50,0 - 100,0
10,0 - 50,0
6,4 - 10,
0,5 - 6,4
≤ 0,5

__________________________________________________________________________________________________________
Balancing consumption and availability in a multiple uses of water system 75
but the homeowners, for example, were only there for the weekend. In all these households a
variety of productive activities was developed.
Figure 5-2 Household tenure and water consumption
Figure 5-3 presents the relation between household size and water consumption. 74% of
households in stratum 1 were less than three members. Most families in stratum 2 and 3 were
comprised of between 4 and 6 members. At all strata, less than 10% of families had more than
7 members.
Figure 5-3 Household size and water consumption
The graph shows a relation between household size and water consumption, where
households in stratum 1 had a significant proportion of less than three members and in strata
with higher water consumption, the proportion of larger household size increases. Household
size appears in some of the literature reviewed as a determinant variable for water
consumption (Keshavarzi, 2006; Bramfit et al., 1997). Although, in this case, as productive
activities are involved, this variable may influence mainly household consumption on strata 1
and 2, where, productive uses that depends on water are negligible (stratum 1) or moderate
(stratum 2), but for stratum 3, where productive uses may have a bigger weight on water
consumption, household size may not be a determinant variable.
0%
20%
40%
60%
80%
100%
< 20 m3/2 months
20 - 80 m3/ 2 months
> 80 m3 / 2 months
Pe
rce
nta
gee
of
ho
use
ho
lds
Stratum
100,0 - 1000,0
50,0 - 100,0
10,0 - 50,0
6,4 - 10,
0,5 - 6,4
≤ 0,5
0%
20%
40%
60%
80%
100%
< 20 m3/2 months 20 - 80 m3/ 2 months
> 80 m3 / 2 months
Pe
rce
nta
ge o
f h
ou
seh
old
s
Stratum
7 - 10
4 - 6
0 - 3

__________________________________________________________________________________________________________
Balancing consumption and availability in a multiple uses of water system 76
The relation between household head occupation and water consumption is shown in Figure
5-4. There were significant proportions of farmers in stratum 2 and 3 (53% and 63%)
compared to 13% of farmers in Stratum 1. The opposite occurs with day-labourers which
proportion decreased when water consumption increased. Those were 30% for household
heads in stratum 1 and 8% for household heads in stratum 3. Something similar applies to the
unemployed, who were 35% of users in stratum 1 compared with 7% in stratum 2 and 13% in
stratum 3.
Figure 5-4 Household head occupation and water consumption
The relation between livelihoods and water consumption is clear from Figure 5-4. Livelihoods
of people who work on strata 1 do not depend directly on the water they consume at their
households. In this stratum, 52% of the household heads were day-labourer, independent,
employees or retired. The proportion of unemployed people in stratum 1 was significant, 35%,
although, 75% from this 35% had small quantities of pigs, or small areas with crops. The same
happens in strata 2 and 3 with those that appear as unemployed, but the amount of animals or
cropped land they had was bigger. This may be evidence of the importance of water for
productive activities, to reduce vulnerability to external shocks (Moriarty & Butterworth, 2003),
such as unemployment, which is significant in rural areas in Colombia.
Farmers were important proportions in strata 2 and 3, 53% and 63% respectively. It means
that for these people, income generating activities depended on water. In the case of stratum
3, for those households where homeowners hired caretakers and did not live there, probably
income did not depend solely on agricultural activities, but also on other activities in their
places of permanent housing. However, in these cases, as in all homesteads agricultural
activities were carried out, at least for the caretakers, all their income depended on access to
water at the household.
Figure 5-5 describes the relation between income and water consumption. It indicates that
around 20% of people in stratum 1 and 2 earned less than half the minimum wage in
0%
20%
40%
60%
80%
100%
< 20 m3/2 months 20 - 80 m3/ 2 months
> 80 m3 / 2 months
Pe
rce
nta
ge o
f h
ou
seh
old
s
Stratum
Unemployed
Retired
Independent
Employee
Farmer
Day-labourer

__________________________________________________________________________________________________________
Balancing consumption and availability in a multiple uses of water system 77
Colombia (141 US$8) and there were no people on stratum 3 earning at this low level of
income. In the three strata, between 45% and 59% earned between half and the country's
minimum wage (141 - 278 US$) and this was the lowest income level for those in stratum 3.
The largest percentage of people with higher income levels (more than 586 US$) were in
stratum 3 (18%) compared with only 5% and 2% reported for stratum 1 and 2 respectively.
Figure 5-5 Household monthly income (US$) and water consumption
Taking into account the household size of both strata, those who earned less than 141 US$
per month lived with less than 2 US$/ day. Therefore, they would be the poorest people
served by the water supply system. Although, looking at the behaviour of other variables for
these people, in stratum 2, 78% of the 21% who earned less than 2 US$/day were day-
labourers or farmers, and all of them did some kind of productive activity at their homesteads.
This indicates that these activities were not enough to generate the revenue necessary for a
better quality of life, situation very common in rural areas in Colombia (Pérez & Pérez, 2002).
However, within these group of people, there were 4 cases where the household size was 2
(income per capita raises), and also there were 2 cases where incomes were lower than
reported expenses, or where people had 10 cows, or more than 5 hectares. It shows that it is
not easy to get accurate information related to people´s income and, the need to get this data
through various methods (triangulation), especially, when interventions are looking to target
the poorest of the poor.
In this way, it seems that the poorest in La Palma Tres Puertas were the 20% who earned less
than 2 US$/day in stratum 1, did not have animals or crops, and were day-labourers, which
means they did not work every day to get a better income level, and did not have other income
sources.
8 1 US$ = 1850 COL$ (July 2010)
0%
20%
40%
60%
80%
100%
< 20 m3/2 months 20 - 80 m3/ 2 months
> 80 m3 / 2 months
Pe
rce
nta
ge o
f h
ou
seh
old
s
Stratum
> 586
351 - 586
278 - 351
141 - 278
< 141
__________________________________________________________________________________________________________
Balancing consumption and availability in a multiple uses of water system 78
5.1.2 Livelihoods, productive activities and water consumption
As indicated by World Bank (2009) most poor people living in rural areas of developing
countries, depend on agricultural production for their income. In La Palma Tres Puertas, as
presented in the previous section, there were a large proportion of farmers, who cultivated
their own land or day-labourers, who worked in agricultural activities, but on other´s plots. The
results below show the scale at which these agricultural activities, specially cropping and/or
animal husbandry were carried out in the region and how it relates to water consumption on
the strata defined.
Animal husbandry: Most animals been raised were pigs, cows and poultry. Figure 5-6
summarizes the scale of animal husbandry. Stratum 3 had a much higher presence of pigs
and cows in comparison to stratum 2 and 1. In all strata, pigs were raising in quantities from 1
to 5 (13%, 11% and 17% respectively). In the case of stratum 1, this 13% represented no
more than two pigs. In Stratum 3 there were dwellings (4%) where this activity was developed
on a large scale (150 pigs). 50% of users in stratum 3 had cows in quantities ranging from 1 to
100 units, with 13% on the upper limit; while all households on the stratum 2 had less than 50
cows. Poultry were in all strata; in strata 1 in 26% of the houses, and those accounted for 62%
in both, strata 2 and 3. In more than 50% of households, families had less than 20 units. In
stratum 2, there were some cases (1%) where this activity was developed at large scale (4000
units).
Raising animals was a widespread activity in the area at all levels and in all levels of water
consumption. However, cows had a greater presence in the stratum of highest water
consumption, even in large quantities, indicating that these animals may have a significant
impact on household water consumption, as can be inferred from the values reported by the
literature, regarding water consumption for these species (Nozaic, 2002; HR Wallingford,
2003; Ospina, 2009; Roa, 2005; Peden, 2007; Barrios, 2008). Pigs were raised at all levels,
usually in small quantities and rarely on a large scale, being more an asset for emergency or
sporadic income (Peden et al, 2007). Compared to the water consumption of cows, pigs
consumption is lower (Nozaic, 2002; HR Wallingford, 2003; Ospina, 2009; Roa, 2005; Barrios,
2008), but quantities larger than 6 units may represent a significant proportion of the water
household consumption. Thus, those who keep more than 6 pigs were located in stratum 3. In
the case of poultry, they were intended for household food security rather than for sale when
quantities were up to 20 units. Additionally, the impact of this species in water consumption is
not significant, since 100 heads require about 20 l/day (Nozaic, 2002; HR Wallingford, 2003;
Ospina, 2009; Roa, 2005).

__________________________________________________________________________________________________________
Balancing consumption and availability in a multiple uses of water system 79
Figure 5-6 Animal husbandry and water consumption
Growing crops: Main crops in the area were coffee, pineapple, maize and beans. Some
crops like pitaya, lulo and guava have being implemented in recent years.
Figure 5-7 shows cropped areas according to water consumption strata. In stratum 1, there
was no presence of commercial crops like pineapples, pitaya and lulo, only a small proportion
of coffee (4%). In stratum 2 people grew coffee in areas ranging from 3200 m2 to 50000 m
2
and this activity was developed in 30% of homesteads. To a lesser extent, pineapple was
grown in this stratum (8%), maize (17%), lulo, and pitaya (5% each). The users in stratum 3
planted less coffee (17%), but in larger areas (from 6400 m2 to 50000 m
2). Pineapple was
primarily grown in stratum 3 (34%). Maize was planted in most of the strata, but in small areas
(less than 6400 m2). A widespread practice was grow beans and maize together, although
some maize was planted alone (4%) for sale in slightly bigger areas (10000 m2) of stratum 3.
The presence of coffee in many of the farms in stratum 2 (30%) was due to most cropped
areas were small (less than 10,000 m2), coffee water requirements under the production
system implemented in the area (shaded coffee) were supplied entirely by rainfall, limiting the
need for water to the processing of the grain at harvest time. Therefore, it could be said, this is
a water efficient crop. Also in this stratum 50% of the 30% coffee growers were dedicated
exclusively to this activity.
20%
30%
40%
50%
60%
70%
80%
90%
100%
< 20 m3/2 months
20 - 80 m3/ 2 months
> 80 m3 / 2 months
Pe
rce
nta
ge o
f h
ou
seh
old
s
Pigs quantity
> 20
6 - 20
1 - 5
0
20%
30%
40%
50%
60%
70%
80%
90%
100%
< 20 m3/2 months
20 - 80 m3/ 2 months
> 80 m3 / 2 months
Pe
rce
nta
ge o
f h
ou
seh
old
s
Cows quantity
51 - 100
21 - 50
6 - 20
1 - 5
0
20%
30%
40%
50%
60%
70%
80%
90%
100%
< 20 m3/2 months
20 - 80 m3/ 2 months
> 80 m3 / 2 months
Pe
rce
nta
ge o
f h
ou
seh
old
s
Poultry quantity
> 1000
101 - 1000
51 - 100
21 - 50
1 - 20
0

__________________________________________________________________________________________________________
Balancing consumption and availability in a multiple uses of water system 80
Figure 5-7 Areas planted (103 m
2) with major crops and water consumption
Most of the households who cultivated pineapple were in stratum 3. This crop does not need
supplemental irrigation under the climatic conditions in La Palma Tres Puertas. Therefore, the
presence of a greater number of pineapple and coffee growers in this stratum, may be
explained by the fact, that these users developed a range of productive activities that depend
on water simultaneously.
Maize was grown in all strata, but more for self-consumption, rather than as a cash crop,
although in stratum 3 plots with maize were planted in relatively large areas compared to the
―normal‖ size of cropped land in the region. The water needs of this crop are slightly higher
than those for pineapple and coffee (Allen et al., 1998), and require supplemental irrigation.
However, 55% of farmers in the area claimed not to irrigate this crop.
On the other hand, pitaya was also planted in relatively large areas of households belonging to
strata 2 and 3. This crop is also efficient in water use (Ospina, 2009). It is also a very profitable
crop. Pitaya and pineapple harvests occur after 24 months and 18 months of planting
(Departamento de Agricultura del Valle del Cauca, n.d.), therefore, these are not crops poor
people can have as their livelihood. Besides, in this region, these crops are produced using
large quantities of agro-chemicals for which a substantial investment is required before
obtaining any yield.
65%
70%
75%
80%
85%
90%
95%
100%
< 20 m3/2
months
20 - 80 m3/ 2
months
> 80 m3 / 2 months
Pe
rce
nta
ge o
f h
ou
seh
old
sArea coffee
10,0 - 50,0
6,4 - 10
3,2 - 6,4
0,1 - 3,2
0 65%
70%
75%
80%
85%
90%
95%
100%
< 20 m3/2 months
20 - 80 m3/ 2 months
> 80 m3 / 2 months
Pe
rce
nta
ge o
f h
ou
seh
old
s
Area pineapple
10,0 - 50,0
6,4 - 10
3,2 - 6,4
0,1 - 3,2
0
65%
70%
75%
80%
85%
90%
95%
100%
< 20 m3/2 months
20 - 80 m3/ 2 months
> 80 m3 / 2 months
Pe
rce
nta
ge o
f h
ou
seh
old
s Area maize
6,4 - 10
3,2 - 6,4
0,1 - 3,2
0
65%
70%
75%
80%
85%
90%
95%
100%
< 20 m3/2 months
20 - 80 m3/ 2
months
> 80 m3 / 2 months
Pe
rce
nta
ge o
f h
ou
seh
old
s
Area pitaya
10,0 - 50,0
6,4 - 10
3,2 - 6,4
0,1 - 3,2
0

__________________________________________________________________________________________________________
Balancing consumption and availability in a multiple uses of water system 81
5.1.3 Access to water and water consumption
All categories of users in La Palma Tres Puertas defined in this document, according to water
consumption levels (strata), had connections to the water supply system. However, since this
service is intermittent, opportunities of access to water were mediated by different aspects,
such as the household location in relation to the distribution network, the storage capacity of
water at homes, and the frequency of service delivery. These aspects were included in this
research, as it is recognized that poor people are more likely to receive lower quality services
than the rich. This condition affects poor´s ability to develop productive activities that depend
on water, and contribute to improving their quality of life (Yang et al., 2006; Hansen & Bhatia,
2004; World Bank, 2009; UNDP, 2006).
Figure 5-8 shows how users of different consumption categories (strata) were distributed in
the service area. Households in stratum 1 were mainly in the settlements of Tres Puertas
(26%), Monteredondo (26%), and La Palma (30%). Households in stratum 2 were in all
settlements, mainly in Buenvivir (23%) and La Palma (33%). Users with high water
consumption (stratum 3), were also spread over all the settlements, mostly in La Palma and
Tres Puertas (25% each), but most households in El Agrado and Ventaquemada belonged to
this stratum (50%) and (40%), while this area did not have households in stratum 1.
Figure 5-8 Location and water consumption
The villages of La Palma and Buenvivir had areas that concentrated several houses and
therefore, some households in some of them were small, which restricts the possibilities for
productive activities. For Ventaquemada and El Agrado households were more scattered and
with larger areas, facilitating activities such as farming or ranching. For Monterendondo, where
several people in stratum 1 lived, some respondents stated that the water was provided there
less often; and in extreme dry season, some had to travel to a nearby source for bathing and
washing clothes, and even one household was uninhabited, apparently for lack of water. One
explanation to this situation is that the service comes to this area through a long branch, and
maybe for technical factors such as losses, or low pressure, conditions for accessing water
0%
20%
40%
60%
80%
100%
Pe
rce
nta
ge o
f h
ou
seh
old
s
Location
> 80 m3 / 2 months
20 - 80 m3/ 2 months
< 20 m3/2 months

__________________________________________________________________________________________________________
Balancing consumption and availability in a multiple uses of water system 82
are more difficult there. Unfortunately, technical information like ground levels or pipe lengths
was not collected to make a more accurate statement on this point.
Figure 5-9 presents the frequency of service provision in dry season to households in different
strata. A higher proportion of users in stratum 1 (42%) and in stratum 2 (35%) received the
service 1-4 times a month during dry season, while only (11%) had this level of service in
stratum 3. The same happens in the opposite situation, where 36% of users received water in
dry season from 9 to 16 times a month in stratum 3 and only 11% had this frequency in
stratum 1. Few users in stratum 3 (7%) were served daily.
Figure 5-9 Frequency of service provision during dry season and water consumption
From Figure 5-9 is evident that households that use more water were served more frequently
during dry season compared to households that used less water. However, in most cases the
service was received 8 times per month. Some households that received the service more
than 9 times per month were in areas surrounding the storage tank. This is a possible
explanation for their better service level. Other issue may be the schedule of the shifts, which
is according to branches. Households in branches with few customers (Ventaquemada and El
Agrado) can also receive the service in better conditions compared to those located in more
populated villages.
People had storage tanks at their premises. Figure 5-10 includes the relation between storage
capacity and water consumption. 91% of households in stratum 1, 68% in stratum 2 and 59%
in stratum 3 had storage tanks up to 5 m3. There were no dwellings in stratum 1 with storage
capacities greater than 10 m3, while storages capacities greater than 10 m
3 were installed in
16% of households on stratum 2 and 21% in stratum 3. There was even a house in stratum 3,
which had a 100 m3 storage tank.
There is a direct relationship between storage capacity at the household level and water
consumption. People who used more water had bigger storage tanks (Cinara, 2006). People
whose income depends more on water, due to the intermittent nature of the service, adapted
0%
20%
40%
60%
80%
100%
< 20 m3/2 months 20 - 80 m3/ 2 months
> 80 m3 / 2 months
Pe
rce
nta
ge o
f h
ou
seh
old
s
Stratum
17 - 30
9 -16
5 - 8
1 - 4

__________________________________________________________________________________________________________
Balancing consumption and availability in a multiple uses of water system 83
to these conditions to avoid losing their livelihoods, by building big storage tanks. For example,
many tanks over 10 m3 were in households where animal husbandry was developed at large
scale; i.e. some had more than 10 cows, 4000 chicken, more than 100 pigs. In the case of
people with storage tanks with lower capacity, such as up to 1 m3, the maximum amount of
cows reported was 5 units.
Figure 5-10 Storage capacity (m3) and water consumption
Several women said they had to be alert to the time when the water arrived and wash clothes
at night while the water was supplied. The service was usually delivered during the night and
apparently, people did not know the day of provision. This situation occurs where storage
tanks were small. In homesteads with larger storage tanks, there were comments on the fact
that woman did not even perceive the service intermittence, since they always had water
available in their homes for all their needs.
Figure 5-11 presents people´s perception on how affected they felt about the service
intermittence. Those who felt more affected were users in stratum 2. 44% in this stratum
answered they felt highly affected, while in stratum 1 the proportion of people who felt highly
affected was 33% and 29% in stratum 3.
Figure 5-11 Perception about the impact of water intermittence
0%
20%
40%
60%
80%
100%
< 20 m3/2 months 20 - 80 m3/ 2 months
> 80 m3 / 2 months
Pe
rce
nta
ge o
f h
ou
seh
old
s
Stratum
> 50
10,0 - 50
5,0 - 10,0
1,0 - 5,0
≤ 1
0%
20%
40%
60%
80%
100%
< 20 m3/2 months 20 - 80 m3/ 2 months
> 80 m3 / 2 months
Pe
rce
nta
ge o
f h
ou
seh
old
s
Stratum
Few
Median
High
__________________________________________________________________________________________________________
Balancing consumption and availability in a multiple uses of water system 84
An explanation of the results from Figure 5-11 can be that, as most households in stratum 1
did not require water for their livelihoods in the same proportion that households in stratum 2,
their tanks were sufficient and therefore, they did not feel highly affected by the lack of
continuity in the service. Households in stratum 3, who used large amounts of water for their
income generating activities, had mostly large storage tanks that allowed them to have the
water they needed, despite of service intermittence. However, households in stratum 2, whose
small-scale livelihoods depended on water as well, but had less storage capacity, perceived
that lack of continuity had a greater impact over their domestic and productive needs.
One limitation of these results is that no information was elicited to identify whether the price
paid for water (tariff) is a constraint to access, especially in the case of households with lower
income levels and lower water consumption (i.e. households in stratum 1).
In Summary,
Households in stratum 1 were people whose income in most cases did not depend on having
water at their premises, they were mostly day-labourers and unemployed, their farms were
small, they did not have crops or animals and if they did, they had few. 20% of them lived on
less than 2 US $/day. The majority had their own homestead, although, there were some that
lived in borrowed and rented houses, which may limited their ability to use those households
productively. They received the water service with lower frequency and their storage capacity
at the household level was lower as well. A few proportion of them felt highly affected by water
intermittence.
Households in stratum 2 were farmers, whose livelihoods depended mainly on a single
productive activity developed on a scale that under this context, could be categorized as
medium scale. Crops they grew were usually rainfed. Their income levels varied, as the size of
their households and the productive activities they developed. In this stratum, although, there
were farmers with little land and few assets, there were others with more land and more
assets. The difference was that those with more assets adapted their water needs to the
conditions of the area and had crops, which are water use efficient such as coffee, pineapple,
pitaya, and other crops that can meet their needs with the rain. Animal husbandry was
developed at small scale and was usually not the main productive activity from which income
is derived. The storage tanks they had were in most cases between 1 to 5 m3, although, few of
them had tanks up to 50 m3. A significant proportion of people in this stratum felt highly
affected by water intermittence.
Households in the stratum 3 were farmers, although several did not live in La Palma Tres
Puertas and thus, their income probably, did not depend solely on agriculture. These users

__________________________________________________________________________________________________________
Balancing consumption and availability in a multiple uses of water system 85
were involved on animal husbandry, especially raised cattle on a larger scale, compared to the
households in other strata. They also grew cash crops such as pineapple. Their farms had
larger areas, and diverse productive activities that depend on water were developed
simultaneously. Many of them had large storage tanks, higher frequency of water delivery and
were located in areas where households were scattered or close to the storage tank. Their
income levels were in all cases equal or greater to the current legal monthly minimum wage in
Colombia (278 US$/month).
5.2 Domestic water per capita consumption in households within a MUS system
This section presents and discusses the results of the activities undertaken to address
Objective 2: To measure different components of the domestic water per capita consumption
in households within a MUS system.
As has been previously discussed, in most rural households water supply systems are used
for domestic and productive activities (van Koppen et al., 2009; Moriarty et al., 2004). In
general, international and national norms and guidelines used for planning purposes on the
water sector, take into account quantities required specially for domestic uses, typically in a
range of 25-40 lpcd (van Koppen, et al., 2006). In opposition to this approach, MUS promoters
suggest that a water provision about 50-200 lpcd (Butterworth et al., 2003) is enough to
develop domestic and productive activities at the household level and look for the
consideration of the small-scale productive uses of water in conjunction with domestic uses
from the planning stage of rural water supply systems.
This section presents the results and discussion of the efforts in this research to estimate the
amount of water in La Palma Tres Puertas, used specifically for domestic purposes. The
results shown are from the household monitoring developed in six households of the area,
explained on section 4.2 on the methods chapter.
The six monitored houses used the water supply system as the only source for all domestic
purposes. Table 5-1 shows some characteristics of the households related to aspects that
may affect the water consumption for domestic purposes.
Table 5-1 Household characteristics affecting domestic consumption
Household
ID
Household
size Children Adult
Sanitation
system
Frequency of
service delivery
Storage
capacity
(m3)
Household
taps Days/week Hr/day
1 4 2 2 PFL 3 12 1000 3
2 4 2 2 PFL 2 8 2000 1
3 3 2 1 PFL 3 12 6000 4

__________________________________________________________________________________________________________
Balancing consumption and availability in a multiple uses of water system 86
Household
ID
Household
size Children Adult
Sanitation
system
Frequency of
service delivery
Storage
capacity
(m3)
Household
taps Days/week Hr/day
4 5 2 3 FT + ST 3 12 50000 6
5 4 0 4 FT + ST 2 12 5000 4
6 4 2 2 FT + ST 1 16 2000 6
PFL: Pour Flush Latrine; FT + ST: Flush Toilet + Septic tank
In most cases, number of people living in these households was 4. In all houses but
household 5, there were two children. Those children were from different ages since months of
birth up to 12 years. Regarding sanitation systems, 3 houses had Pour Flush Latrines and 3
houses Flush Toilets followed by Septic Tanks. As the service in the area is intermittent, the
number of days a week different houses receive the service varies from 1 to 3, being 2 days
the most frequent value. Families adapted to this situation having storage tanks with
capacities from 1000 m3 to 50000 m
3. The number of taps used for domestic purposes was
variable, from one single tap for all uses located in the lavadero, up to six taps.
Domestic water uses: The domestic uses reported and the categories identified were
grouped as appear in Table 5-2. The compiled information of the measurements from each of
the six households appears in Appendix B.
Table 5-2 Categories of domestic uses measured and number of data Category Number of data Category Number of data
Cooking 40 Wash body 29
Drinking 1 Toilet 34
Brush teeth 26 Housekeeping 3
Brush teeth and face 2 Garden irrigation 1
Brush teeth and wash hands 3 Wash clothes 5
Wash hands 8 Wash dishes 26
Table above shows that drinking was not reported itself, maybe because it is included on the
category of cooking, since people used to boil the water they drank. Uses related to hygiene,
such as brush teeth and hand washing were reported together. This is probably due to people
practices, and in other studies, these uses are not reported separated either, such as Roa
(2005), Barrios (2008) and the case of Howard & Bartram (2003), where all water hygiene
needs, including personal and household hygiene are reported together.
Wash hands was reported just 8 times and just by three households. Therefore, it is possible
that it can be included on brush teeth, or maybe that washing hands is not a common practice

__________________________________________________________________________________________________________
Balancing consumption and availability in a multiple uses of water system 87
among the participants. On the other hand, the reported use of the toilet was also low.
According to the Diary´s records and household sizes, one household member used the toilet
in average 1 – 2 times a day. It may be explained, because most household members were
not at the premises during the day. Although, in the house were the monitoring was carried out
directly by the author, just one of the household members used the toilet once during the
almost 11 hours that the author was present. Another reason for this underreporting, may be
that people felt ashamed to record the actual use. Not all households reported uses like
washing clothes, housekeeping and garden irrigation, since these activities are not carried out
every day.
Water consumption for different domestic uses: The measurements reported on the
diaries were grouped on the next categories:
Brushing teeth and washing hands Cooking and drinking
Bathing Washing dishes
Washing clothes Toilet
Housekeeping Garden irrigation
Results of per capita consumption for these uses are shown in Figure 5-12.
Figure 5-12 Water per capita consumption for personal hygiene and sanitation
0,0
2,0
4,0
6,0
8,0
1 3 5 7 9 11 13 15 17 19
Wat
er
con
sum
pti
on
(lp
cd)
Records
Brush teeth
Average
0,0
10,0
20,0
30,0
40,0
50,0
1 3 5 7 9 11 13 15 17 19 21 23Wat
er
con
sum
pti
on
(lp
cd)
Records
Bathing
Average
0,0
0,5
1,0
1,5
2,0
2,5
3,0
1 2 3 4 5 6Wat
er
con
sum
pti
on
(lp
cd)
Records
Washing handsAverage
0,0
5,0
10,0
15,0
20,0
25,0
1 3 5 7 9 11 13 15 17 19
Wat
er
con
sum
pti
on
(lp
cd)
Records
Sanitation
Average
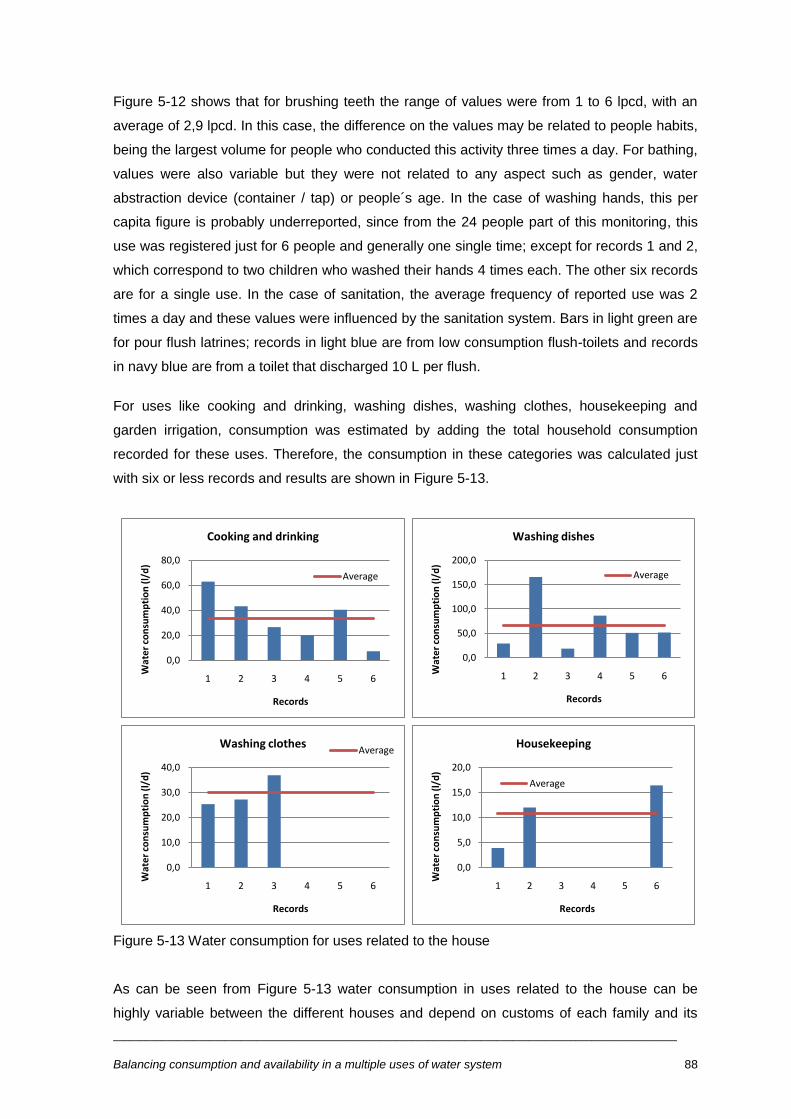
__________________________________________________________________________________________________________
Balancing consumption and availability in a multiple uses of water system 88
Figure 5-12 shows that for brushing teeth the range of values were from 1 to 6 lpcd, with an
average of 2,9 lpcd. In this case, the difference on the values may be related to people habits,
being the largest volume for people who conducted this activity three times a day. For bathing,
values were also variable but they were not related to any aspect such as gender, water
abstraction device (container / tap) or people´s age. In the case of washing hands, this per
capita figure is probably underreported, since from the 24 people part of this monitoring, this
use was registered just for 6 people and generally one single time; except for records 1 and 2,
which correspond to two children who washed their hands 4 times each. The other six records
are for a single use. In the case of sanitation, the average frequency of reported use was 2
times a day and these values were influenced by the sanitation system. Bars in light green are
for pour flush latrines; records in light blue are from low consumption flush-toilets and records
in navy blue are from a toilet that discharged 10 L per flush.
For uses like cooking and drinking, washing dishes, washing clothes, housekeeping and
garden irrigation, consumption was estimated by adding the total household consumption
recorded for these uses. Therefore, the consumption in these categories was calculated just
with six or less records and results are shown in Figure 5-13.
Figure 5-13 Water consumption for uses related to the house
As can be seen from Figure 5-13 water consumption in uses related to the house can be
highly variable between the different houses and depend on customs of each family and its
0,0
20,0
40,0
60,0
80,0
1 2 3 4 5 6
Wat
er
con
sum
pti
on
(l/
d)
Records
Cooking and drinking
Average
0,0
50,0
100,0
150,0
200,0
1 2 3 4 5 6Wat
er
con
sum
pti
on
(l/
d)
Records
Washing dishes
Average
0,0
10,0
20,0
30,0
40,0
1 2 3 4 5 6
Wat
er
con
sum
pti
on
(l/
d)
Records
Washing clothesAverage
0,0
5,0
10,0
15,0
20,0
1 2 3 4 5 6
Wat
er
con
sum
pti
on
(l/
d)
Records
Housekeeping
Average

__________________________________________________________________________________________________________
Balancing consumption and availability in a multiple uses of water system 89
daily dynamics. For example, uses such as laundry and housekeeping do not take place every
day.
Total domestic water per capita consumption: Total per capita water daily domestic
consumption appears on Figure 5-14.
Figure 5-14 Domestic per capita consumption in the six monitored households
Results in Figure 5-14 varied from a minimum of 44,3 lpcd to a maximum of 95,6 lpcd. The
data set for any of the households contained all of the reported categories of domestic uses.
Households 4 and 6 reported 7/8 uses, households 1, 3 and 5 informed 6/8, while in the home
monitored by the author just 5/8 uses were registered. Missing categories of use correspond
to those activities that are not performed daily, such as washing clothes, housekeeping and
garden irrigation (ornamental plants). These results support which has been stated by
Keshavarzi et al. (2006), indicating that water consumption is highly based on some
behavioural and cultural aspects.
Among the not recorded uses, washing clothes is a significant water demanding one. For this
reason to avoid this situation, monitoring activities like this, should be developed for more than
one day or in a bigger number of households. However, in this case, since it was very difficult
to achieve people participation, the chances of housewives agreed to fill the diaries for more
than one day were really low, and as discussed in the methodology chapter, to get that at least
6 households were involved, was also complicated.
Table 5-3 shows some descriptive statistics of the set of per capita water consumption figures
for the six households. Categories, which present the most highly variable water consumption,
0 5 10 15 20 25 30 35 40 45 50 55 60 65 70 75 80 85 90 95 100 105
1
2
3
4
5
6
Domestic consumption (lpcd)
Ho
use
ho
lds
B-teeth & W-hands
Cooking & drinking
Bathing
Washing-dishes
Washing-clothes
Toilet
Housekeeping
Garden irrigation
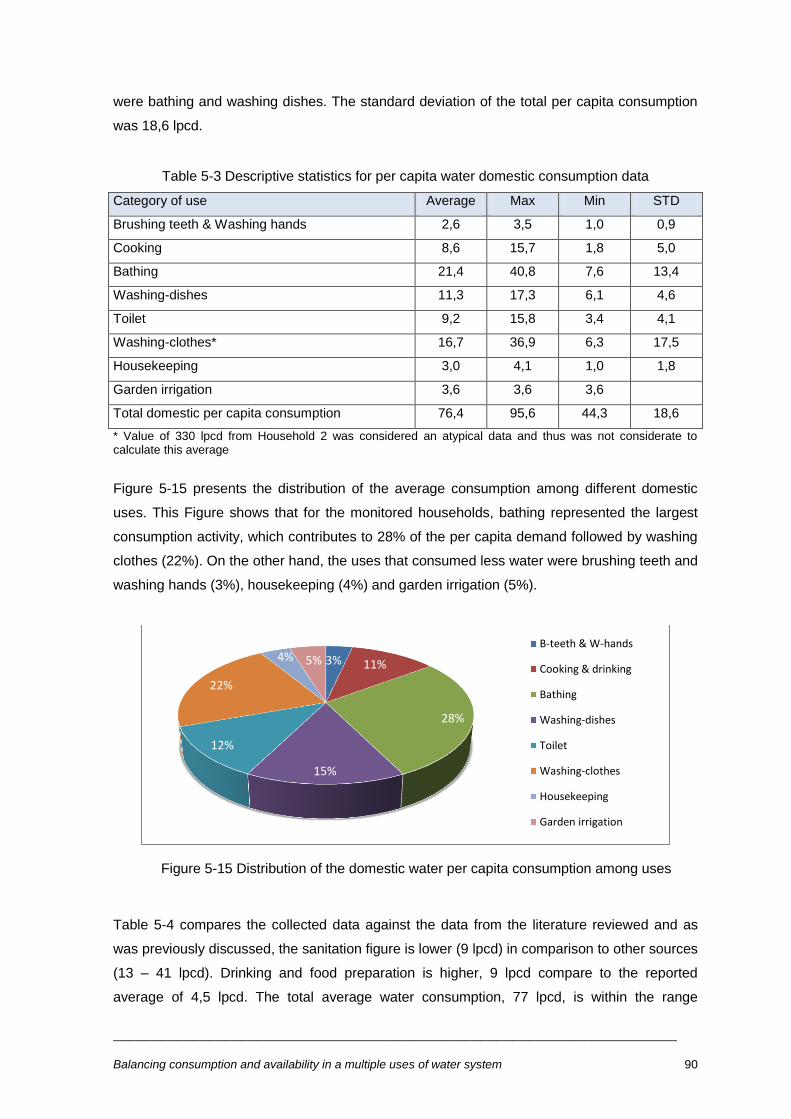
__________________________________________________________________________________________________________
Balancing consumption and availability in a multiple uses of water system 90
were bathing and washing dishes. The standard deviation of the total per capita consumption
was 18,6 lpcd.
Table 5-3 Descriptive statistics for per capita water domestic consumption data
Category of use Average Max Min STD
Brushing teeth & Washing hands 2,6 3,5 1,0 0,9
Cooking 8,6 15,7 1,8 5,0
Bathing 21,4 40,8 7,6 13,4
Washing-dishes 11,3 17,3 6,1 4,6
Toilet 9,2 15,8 3,4 4,1
Washing-clothes* 16,7 36,9 6,3 17,5
Housekeeping 3,0 4,1 1,0 1,8
Garden irrigation 3,6 3,6 3,6
Total domestic per capita consumption 76,4 95,6 44,3 18,6
* Value of 330 lpcd from Household 2 was considered an atypical data and thus was not considerate to calculate this average
Figure 5-15 presents the distribution of the average consumption among different domestic
uses. This Figure shows that for the monitored households, bathing represented the largest
consumption activity, which contributes to 28% of the per capita demand followed by washing
clothes (22%). On the other hand, the uses that consumed less water were brushing teeth and
washing hands (3%), housekeeping (4%) and garden irrigation (5%).
Figure 5-15 Distribution of the domestic water per capita consumption among uses
Table 5-4 compares the collected data against the data from the literature reviewed and as
was previously discussed, the sanitation figure is lower (9 lpcd) in comparison to other sources
(13 – 41 lpcd). Drinking and food preparation is higher, 9 lpcd compare to the reported
average of 4,5 lpcd. The total average water consumption, 77 lpcd, is within the range
3% 11%
28%
15%
12%
22%
4% 5%
B-teeth & W-hands
Cooking & drinking
Bathing
Washing-dishes
Toilet
Washing-clothes
Housekeeping
Garden irrigation

__________________________________________________________________________________________________________
Balancing consumption and availability in a multiple uses of water system 91
informed by the literature (50 – 178 lpcd), although due to the limitations discussed in relation
to sanitation use, and uses not performed every day, especially washing clothes, this figure
maybe higher.
Table 5-4 Comparison between the collected data and the Literature Review
Domestic water uses Literature
a La Palma Tres
Puertas Average Max Min
Sanitation(lpcd) 13 41 9
Bathing (lpcd) 12 46 21
Drinking and food preparation (lpcd) 4 5 9
Dish washing (lpcd) 8 28 11
Laundry (lpcd) 16 79 17
Housekeeping (lpcd) 5 5 3
Brush teeth and hand washing (lpcd) 3 5 3
Garden irrigation (lpcd) -- -- 4
Total (lpcd) 50 178 77
a Figures from the Literature review reported in Section 2.6, Table 2.1 from: Gleick (1996),
Roman (2002), Nozaic (2002), Roa (2005), Barrios (2008)
The data obtained from this monitoring, in particular, the average total domestic water demand
of 77 lpcd, which is lower than that reported by other authors in similar contexts such as Roa
(2005) and Barrios (2008), has the following limitations resulting from the methods employed
for its estimation:
The measurements undertook by the author in Household 5 are biased for that kind of bias
that Posdakoff et al. (2003) name ―social desirability bias‖, since participants were affected
by the presence of the researcher and thus behave in an unexpected way. For instance,
did not use the toilet for almost 11 hours; a young member of this family also decided to
spend most of the day out and did not take lunch, or bathed as she stated she felt
uncomfortable being observed.
Another source of error in the same category is that, since family members were active
participants in this activity, they were aware of the research objectives and there are
chances that they have changed their practices in relation to water use to have a more
rational behaviours (reduce the water use).
Another potential bias in relation to people´s behaviour is that in some cases, i.e.
Household 2, family members may have adopted more stringent hygiene practices (i.e.
washing hands more frequently, brush teeth three times a day).
On the other hand, hygienic practices that influence water per capita consumption
probably were underreported, such as brushing teeth, washing hands and using the toilet.
This may be because people did not spend much time at households, or maybe that

__________________________________________________________________________________________________________
Balancing consumption and availability in a multiple uses of water system 92
washing hands and brushing teeth habits are rare among the sample population. Another
explanation maybe because, since housewives were the main responsible to collect these
data, and these activities were carried out for all family members, it could not be registered
with the frequency with was actually performed. Although, specific forms for these uses
were provided separately to be filled for all people in the house in the areas where water
use took place, but just one stopwatch was provided. This may be the reason for the sub-
registration in the cases where these activities used a tap as a water abstraction device.
However, this also happened where a container was the water abstraction device.
Another source of error is that to find flows from the taps, those were measured according
to the way housewives tend to open them. No measurements were made for other family
members. For containers, it is also likely that people would require larger or lower volumes
than the volumes set, which also could be a source of bias.
To determine the validity of these measurements, per capita domestic demand was estimated
through other means, applying the principle of triangulation, using records from the meters and
information from the household survey. Comparison between data measured during
monitoring and results from the second approach appear in Table 5-5.
Table 5-5 Comparison between average consumption from two methods of estimation
Estimation Method
Domestic water per capita consumption (lpcd)
HH 1 HH 2 HH 3 HH 4 HH 5 HH 6
Monitoring 70,5 75,6 95,6 50,6 74,6 44,3
Meter records +
Household survey 86,5 N.A. 100 58,7 116,0 41,7
HH: Household
Data on Table 5-5 shows that monitoring results were close to those obtained from the meter
records and household survey in the cases of Households 3, 4 and 6, and even for Household
1. The case of Household 5 where the author carried out the monitoring presents the result
with the largest differences between the two methods. Therefore, recognizing all potential
errors in the monitoring strategy, it can be said that the water diaries were a better method of
collecting this information, and from the way they were submitted, is evident that the
housewives were committed to develop the task.
However, as will be discussed further, the domestic water per capita consumption was also
calculated with the second approach (meter records + household survey) in 106 households in
the system, providing an average figure of 95 lpcd for domestic water consumption. It
suggests that values resulting from the monitoring are fair values, maybe in the particular case

__________________________________________________________________________________________________________
Balancing consumption and availability in a multiple uses of water system 93
of the monitored households, but not to the general population. One possible explanation for
this is that since this activity was voluntary, possibly people which agreed to take part had a
higher level of concern for water protection compared to the rest of the community, which can
makes their per capita consumption lower.
77 lpcd and even 95 lpcd are within the range that the Colombian standard (RAS - 2000)
allows for designing of rural water supply systems for domestic purposes 100-150 lpcd.
However, as shown from the information presented on the characteristics of the households of
La Palma Tres Puertas system, only 17% of people served have exclusively domestic uses,
while the remaining 83% develop productive activities that depend on water, therefore, the
total household water needs, exceed the amounts suggested by this standard.
5.3 Water balances at the system and household level, including water demand for
multiple uses, and water inputs, considering blue water and green water
This section presents and discusses the results of the activities undertaken to address
Objective 3: To propose balances at the system and household level, including water demand
for multiple uses and water availability, considering blue water and green water.
As discussed in previous sections, people in rural areas use water supply systems for multiple
uses. However, these uses depend on several water sources which are used simultaneously
(Scheelbeek, 2005; Van Koppen et al., 2009; van Koppen & Smits, 2010; Mikhail, 2010).
Similarly, most small farmers in developing countries, especially in Latin America, produce
their crops under rainfed systems (Molden et al., 2007), which eventually require additional
water inputs to meet crop needs at special stages of development or during short dry-spells
(Sulser et al, 2009). To try to look at these aspects from an integral perspective in a MUS
system, water accounting tools based on water balance concepts (Perry, 1996; Molden, 1997;
Rosengrat et al., 2002; Ratnaweera et al., 2006; Haley et al., 2007) were used in the present
case study of La Palma Tres Puertas water supply system. The results are presented and
discussed below.
5.3.1 Water balance domain
Figure 5-16 presents the study area with the villages of La Palma, Tres Puertas and Buenvivir.
It also includes the pipes of the water supply system, which has been plotted over this political
map, and appear in purple.
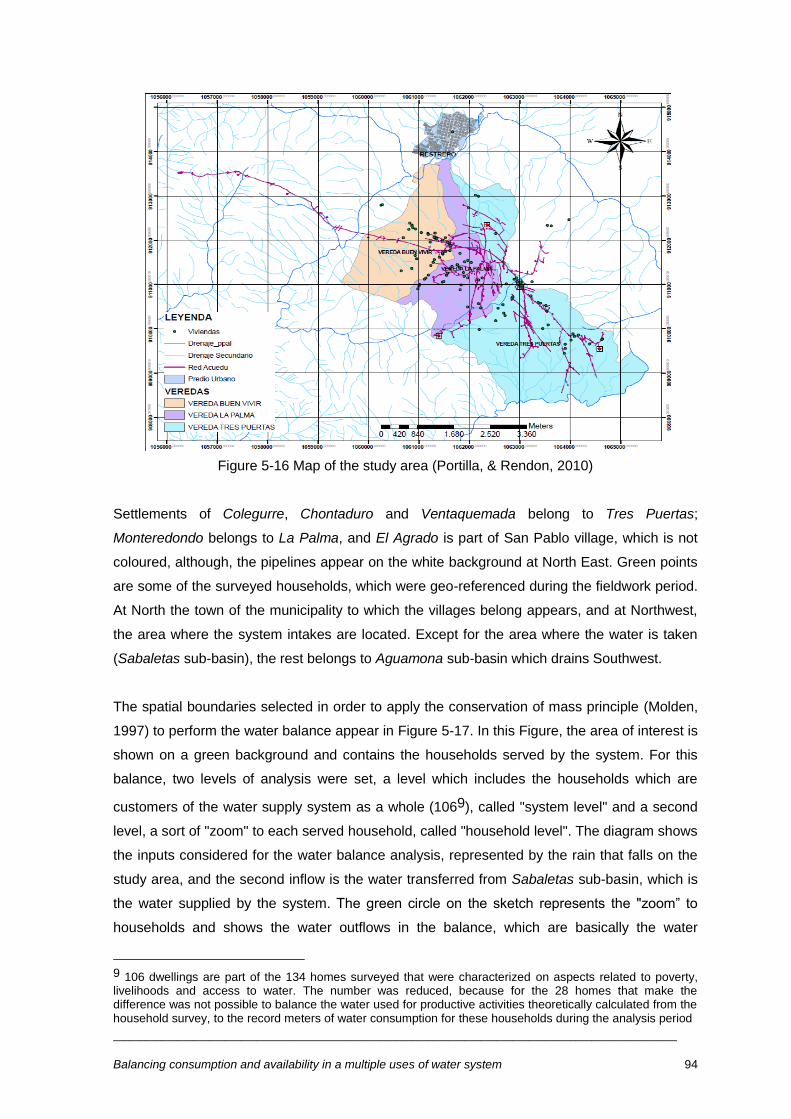
__________________________________________________________________________________________________________
Balancing consumption and availability in a multiple uses of water system 94
Figure 5-16 Map of the study area (Portilla, & Rendon, 2010)
Settlements of Colegurre, Chontaduro and Ventaquemada belong to Tres Puertas;
Monteredondo belongs to La Palma, and El Agrado is part of San Pablo village, which is not
coloured, although, the pipelines appear on the white background at North East. Green points
are some of the surveyed households, which were geo-referenced during the fieldwork period.
At North the town of the municipality to which the villages belong appears, and at Northwest,
the area where the system intakes are located. Except for the area where the water is taken
(Sabaletas sub-basin), the rest belongs to Aguamona sub-basin which drains Southwest.
The spatial boundaries selected in order to apply the conservation of mass principle (Molden,
1997) to perform the water balance appear in Figure 5-17. In this Figure, the area of interest is
shown on a green background and contains the households served by the system. For this
balance, two levels of analysis were set, a level which includes the households which are
customers of the water supply system as a whole (1069), called "system level" and a second
level, a sort of "zoom" to each served household, called "household level". The diagram shows
the inputs considered for the water balance analysis, represented by the rain that falls on the
study area, and the second inflow is the water transferred from Sabaletas sub-basin, which is
the water supplied by the system. The green circle on the sketch represents the "zoom‖ to
households and shows the water outflows in the balance, which are basically the water
9 106 dwellings are part of the 134 homes surveyed that were characterized on aspects related to poverty, livelihoods and access to water. The number was reduced, because for the 28 homes that make the difference was not possible to balance the water used for productive activities theoretically calculated from the household survey, to the record meters of water consumption for these households during the analysis period
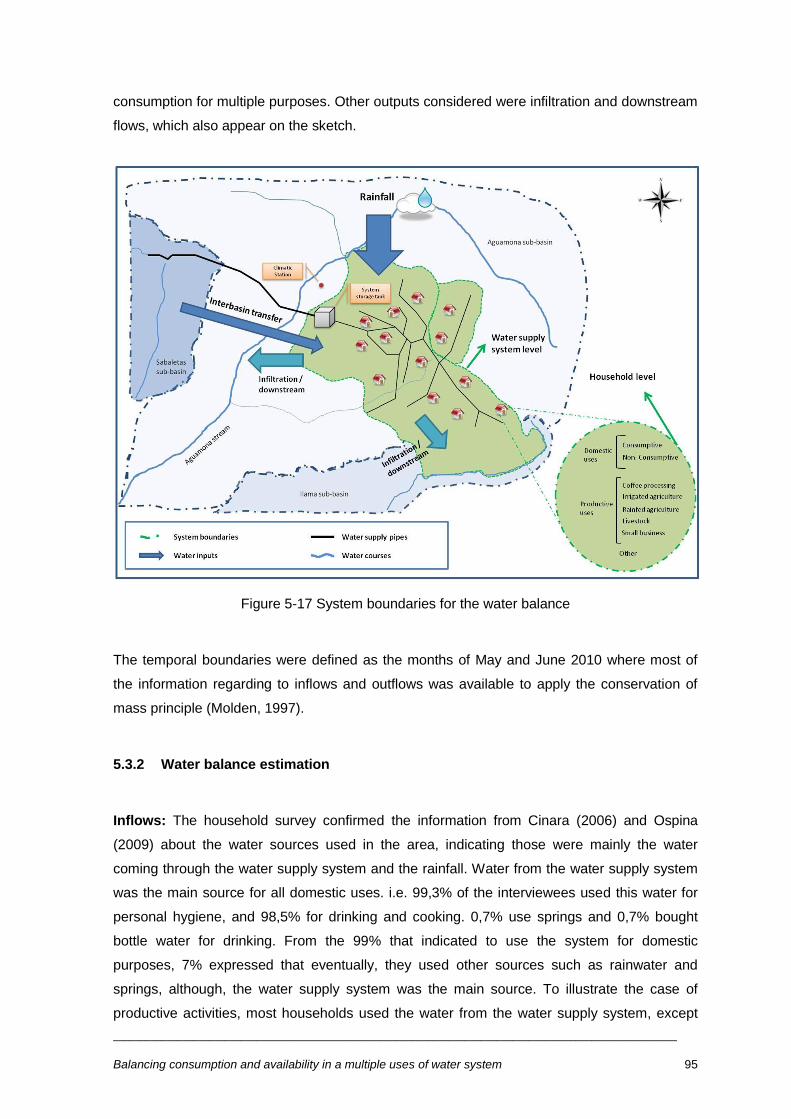
__________________________________________________________________________________________________________
Balancing consumption and availability in a multiple uses of water system 95
consumption for multiple purposes. Other outputs considered were infiltration and downstream
flows, which also appear on the sketch.
Figure 5-17 System boundaries for the water balance
The temporal boundaries were defined as the months of May and June 2010 where most of
the information regarding to inflows and outflows was available to apply the conservation of
mass principle (Molden, 1997).
5.3.2 Water balance estimation
Inflows: The household survey confirmed the information from Cinara (2006) and Ospina
(2009) about the water sources used in the area, indicating those were mainly the water
coming through the water supply system and the rainfall. Water from the water supply system
was the main source for all domestic uses. i.e. 99,3% of the interviewees used this water for
personal hygiene, and 98,5% for drinking and cooking. 0,7% use springs and 0,7% bought
bottle water for drinking. From the 99% that indicated to use the system for domestic
purposes, 7% expressed that eventually, they used other sources such as rainwater and
springs, although, the water supply system was the main source. To illustrate the case of
productive activities, most households used the water from the water supply system, except
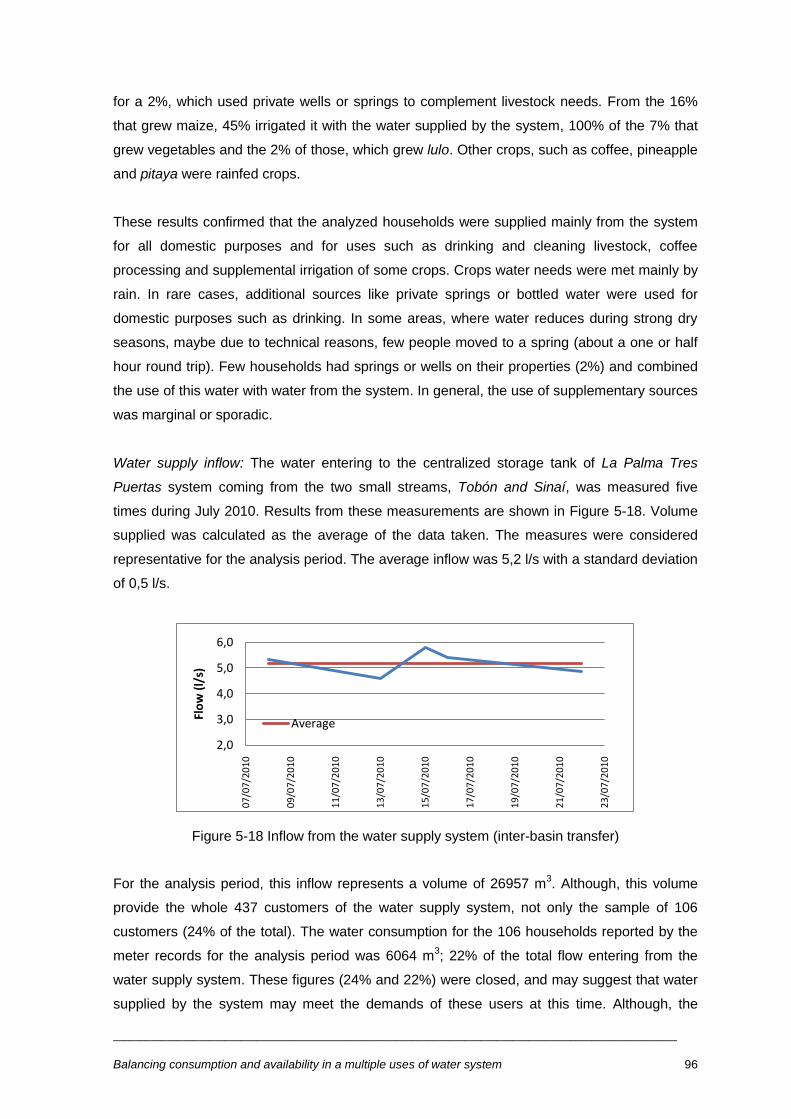
__________________________________________________________________________________________________________
Balancing consumption and availability in a multiple uses of water system 96
for a 2%, which used private wells or springs to complement livestock needs. From the 16%
that grew maize, 45% irrigated it with the water supplied by the system, 100% of the 7% that
grew vegetables and the 2% of those, which grew lulo. Other crops, such as coffee, pineapple
and pitaya were rainfed crops.
These results confirmed that the analyzed households were supplied mainly from the system
for all domestic purposes and for uses such as drinking and cleaning livestock, coffee
processing and supplemental irrigation of some crops. Crops water needs were met mainly by
rain. In rare cases, additional sources like private springs or bottled water were used for
domestic purposes such as drinking. In some areas, where water reduces during strong dry
seasons, maybe due to technical reasons, few people moved to a spring (about a one or half
hour round trip). Few households had springs or wells on their properties (2%) and combined
the use of this water with water from the system. In general, the use of supplementary sources
was marginal or sporadic.
Water supply inflow: The water entering to the centralized storage tank of La Palma Tres
Puertas system coming from the two small streams, Tobón and Sinaí, was measured five
times during July 2010. Results from these measurements are shown in Figure 5-18. Volume
supplied was calculated as the average of the data taken. The measures were considered
representative for the analysis period. The average inflow was 5,2 l/s with a standard deviation
of 0,5 l/s.
Figure 5-18 Inflow from the water supply system (inter-basin transfer)
For the analysis period, this inflow represents a volume of 26957 m3. Although, this volume
provide the whole 437 customers of the water supply system, not only the sample of 106
customers (24% of the total). The water consumption for the 106 households reported by the
meter records for the analysis period was 6064 m3; 22% of the total flow entering from the
water supply system. These figures (24% and 22%) were closed, and may suggest that water
supplied by the system may meet the demands of these users at this time. Although, the
2,0
3,0
4,0
5,0
6,0
07
/07
/20
10
09
/07
/20
10
11
/07
/20
10
13
/07
/20
10
15
/07
/20
10
17
/07
/20
10
19
/07
/20
10
21
/07
/20
10
23
/07
/20
10
Flo
w (
l/s)
Average

__________________________________________________________________________________________________________
Balancing consumption and availability in a multiple uses of water system 97
meter data covered the period May-June 2010, and the input data of the storage tank were
taken during July 2010, as shown below in Figure 5-20, the month of July is still representative
of dry season conditions.
This result indicates that the water available during dry season for the whole population is 5,2
l/s. The study carried out by Ospina (2009) in the same area indicates that 62 households will
require about 7 l/s to satisfy their water needs for multiple purposes. The scope of Ospina´s
study was on the demand side. The information presented may suggest that people have
accommodated their water needs for multiple purposes to the water available at the system.
Rainfall: Precipitation for the analysis period was provided by Cenicafé from records of Julio
Fernandez Climate Station and is shown in Figure 5-19. During the 61 days period, there were
25 days of rain and 72% of the total precipitation fell in 5 episodes.
Figure 5-19 Daily rainfall data for the analysis period (Cenicafé, 2010)
Although, the historical daily average rainfall was not available for this study, if this behaviour
follows the pattern shown in Figure 5-19, the available rain does not fall evenly over time, and
therefore it is possible that crops, major users of this flow, cannot use this resource properly
and therefore do not have optimal yields.
Total rainfall during the period was 169,5 mm distributed 81 mm in may 2010 and 88,5 mm in
June 2010. Figure 5-20 compares the rainfall during the analysis period with the average
rainfall in the area taken from Ospina (2009) who estimated this pattern analyzing data from a
ten-year period (1990 – 2000). Figure also tells about the bimodal pattern of rainfall in the area
with two wet and two dry seasons. This pattern is typical of the Andean Region in Colombia
(Rosales, 2001).
0
5
10
15
20
25
30
01/0
5/20
10
03/0
5/20
10
05/0
5/20
10
07/0
5/20
10
09/0
5/20
10
11/0
5/20
10
13/0
5/20
10
15/0
5/20
10
17/0
5/20
10
19/0
5/20
10
21/0
5/20
10
23/0
5/20
10
25/0
5/20
10
27/0
5/20
10
29/0
5/20
10
31/0
5/20
10
02/0
6/20
10
04/0
6/20
10
06/0
6/20
10
08/0
6/20
10
10/0
6/20
10
12/0
6/20
10
14/0
6/20
10
16/0
6/20
10
18/0
6/20
10
20/0
6/20
10
22/0
6/20
10
24/0
6/20
10
26/0
6/20
10
28/0
6/20
10
30/0
6/20
10
Rai
nfa
ll (m
m/d
ay)
Date

__________________________________________________________________________________________________________
Balancing consumption and availability in a multiple uses of water system 98
Figure 5-20 Monthly historical data and monthly data for the analysis period
The Figure shows how rainfall in May 2010 was about 30% less than the average conditions,
and June 2010 was close to the average pattern. In total, for the analyzed two months, it
rained less compared with the historical average. However, because apparently the rains were
torrential, many locals expressed that ―it's raining more‖, and many of the interviewed
indicated that periods they used to seed in the past, do not fit to the current situation and
therefore they do not know when it is the dry season, and when the wet season. This can be a
problematic situation, especially for households in stratum 210 who rely more on rainfall for
their agricultural activities.
Water inflow from rainfall into the domain is presented on Table 5-6 according to strata. The
Table shows how people in stratum 2 have slightly more inflow from the rainfall since they had
52% of the total area considered. People in stratum 3 had 46% of the area and therefore, an
equivalent proportion of rainfall.
Table 5-6 Water inflow from rainfall
Stratum Area (m2) Rainfall (m
3)
1 52.049 8.822
2 1.388.707 235.386
3 1.220.429 206.863
Total 2.661.185 451.071
Table 5-6 shows how, although users in stratum 3 were only 16% of total households, as they
had more land (46% of total), they had almost the same potential to benefit from the rain as do
all households in stratum 2 together (52% of total area).
10 Strata are based on consumption level of subscribers of the water supply system. Strata definition is detailed on the methods chapter
0
20
40
60
80
100
120
140
160
jan feb mar apr may jun jul aug sept oct nov dec
Ran
fall
(mm
/mo
nth
)
Month Historic Analysis period

__________________________________________________________________________________________________________
Balancing consumption and availability in a multiple uses of water system 99
Outflows: Outflows were calculated for water consumption, according to categories of
domestic and productive use; the latter divided into Livestock Consumption, Coffee
Processing Consumption, Crops Consumption and Other (Small Business and Swimming
Pools). Water consumption for crops was calculated as Blue Water Consumption (water
supply system) and Green Water Consumption (rainfall). All data are presented in volume (m3)
for the analysis period (May – June 2010). The information includes the volume per stratum
and the total volume. The approach to define categories of consumption and blue and green
water availability was described on the methodology chapter (See Table 4-9, Equation 4-4,
Equation 4-6).
Table 5-7 shows the domestic consumption outflow, which depends on the household size,
understood as the number of people within a household, and per capita water consumption.
Total volume consumed for this purpose was 2421 m3, from which 71% was consumed by
people in stratum 2, which had the bulk of the population within the sample.
Table 5-7 Domestic consumption Stratum Households Total inhabitants Total consumption (m
3)
1 16 36 183
2 73 309 1768
3 17 78 470
Total 106 423 2.421
Table 5-8 presents livestock consumption, which was mainly due to the presence of chickens,
pigs, cows, horses and in a minor scale other (rabbits, ducks and guinea pigs). Number of
animals per species appears on the Table and total livestock consumption, according to
stratum. Volumes include the required amount of water for drinking and cleaning purposes.
66% of the water livestock consumption was due to the 17 households on stratum 3, 32% for
households in stratum 2 and 1% of households in stratum 1.
Table 5-8 Livestock consumption
Stratum Units Total
consumption (m3) pigs chicken cows horses Other
1 0 55 6 0 8 18
2 34 520 162 28 71 416
3 165 4193 236 39 0 860
Total 199 4.768 404 67 79 1.294
Table 5-9 shows cropped areas with coffee and water consumption due to coffee processing.
Households on stratum 2 accounted for 68% of the areas cropped with coffee and since the
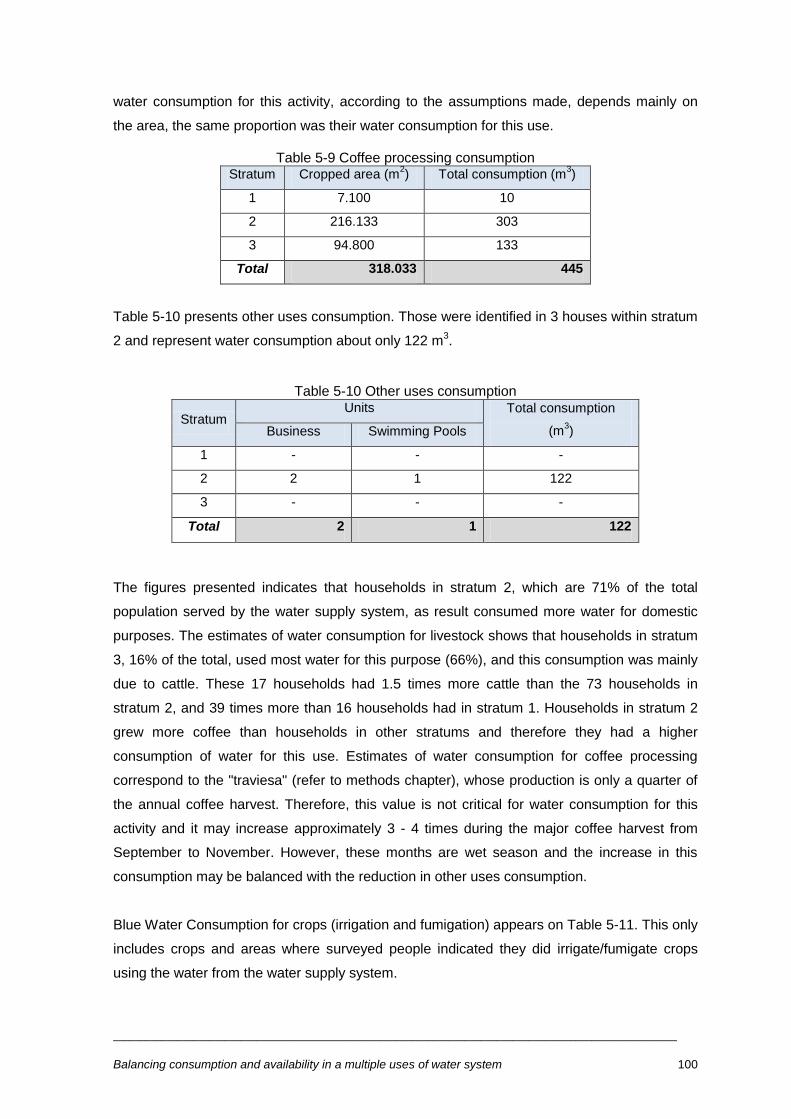
__________________________________________________________________________________________________________
Balancing consumption and availability in a multiple uses of water system 100
water consumption for this activity, according to the assumptions made, depends mainly on
the area, the same proportion was their water consumption for this use.
Table 5-9 Coffee processing consumption Stratum Cropped area (m
2) Total consumption (m
3)
1 7.100 10
2 216.133 303
3 94.800 133
Total 318.033 445
Table 5-10 presents other uses consumption. Those were identified in 3 houses within stratum
2 and represent water consumption about only 122 m3.
Table 5-10 Other uses consumption
Stratum Units Total consumption
(m3) Business Swimming Pools
1 - - -
2 2 1 122
3 - - -
Total 2 1 122
The figures presented indicates that households in stratum 2, which are 71% of the total
population served by the water supply system, as result consumed more water for domestic
purposes. The estimates of water consumption for livestock shows that households in stratum
3, 16% of the total, used most water for this purpose (66%), and this consumption was mainly
due to cattle. These 17 households had 1.5 times more cattle than the 73 households in
stratum 2, and 39 times more than 16 households had in stratum 1. Households in stratum 2
grew more coffee than households in other stratums and therefore they had a higher
consumption of water for this use. Estimates of water consumption for coffee processing
correspond to the "traviesa" (refer to methods chapter), whose production is only a quarter of
the annual coffee harvest. Therefore, this value is not critical for water consumption for this
activity and it may increase approximately 3 - 4 times during the major coffee harvest from
September to November. However, these months are wet season and the increase in this
consumption may be balanced with the reduction in other uses consumption.
Blue Water Consumption for crops (irrigation and fumigation) appears on Table 5-11. This only
includes crops and areas where surveyed people indicated they did irrigate/fumigate crops
using the water from the water supply system.

__________________________________________________________________________________________________________
Balancing consumption and availability in a multiple uses of water system 101
Table 5-11 Blue water consumption by crops (irrigation and fumigation)
Stratum Area (m2)*
Total
consumption (m3)
1 6.502 19
2 239.261 590
3 159.429 1.173
Total 405.192 1.782
* It includes only the areas which belong to people, which expressed they irrigate within the household survey
According to these results in stratum 2 people grew 59% of the area with irrigated crops and
consumed 33% of the water from the water supply system to supplement crop requirements,
while 39% of the area was grown with these types of crops in stratum 3 and accounted for
65% of the total water crop consumption from the water supply system. Although, fumigation
was included in the estimations, this consumption was less than 1% of the total water
households consumption in the majority of the cases.
Those figures suggests the need to improve the information in which assumptions that
underlie the water consumption estimations, using the water balance approach were carried
out. Although, in general terms, farmers have similar practices, there are differences: some
irrigated, some did not, the frequency and amounts of water applied could change and this
also depends on whether the crop was for sale or self-consumption (i.e. maize). For instance,
much of the area presented in Table 5-11 as area under irrigation in stratum 3 is pineapple,
which is not irrigated, and the use of fumigation is not significant. Therefore, irrigation
consumption estimation may include livestock consumption, in cases where pineapple farmers
have cattle, and even more if most of these cattle were dairy rather than meat (which was not
asked). Then, consumption of cows to some users might be under-estimated and irrigation
oversized. This may happen since to balance inflows and outflows for the final calculation,
water use for irrigation depended not on the area cropped, but on the surplus obtained by
subtracting to the total household consumption, the domestic, livestock, coffee processing,
etc. (in households whit crops). Furthermore, most of the 28 customers who were removed
from the sample to "balance the equation" belonged to stratum 3.
The examples shown above indicate that assumptions made, may be more reliable for
households in stratum 2 and 1, and the difficulty with large water consumers. These large
water consumers have a more complex use of water, since usually they develop productive
activities simultaneously, their production systems are more varied, in some cases more
―sophisticated‖, have storage tanks with higher capacities, or even marginally, some may use
additional water sources.
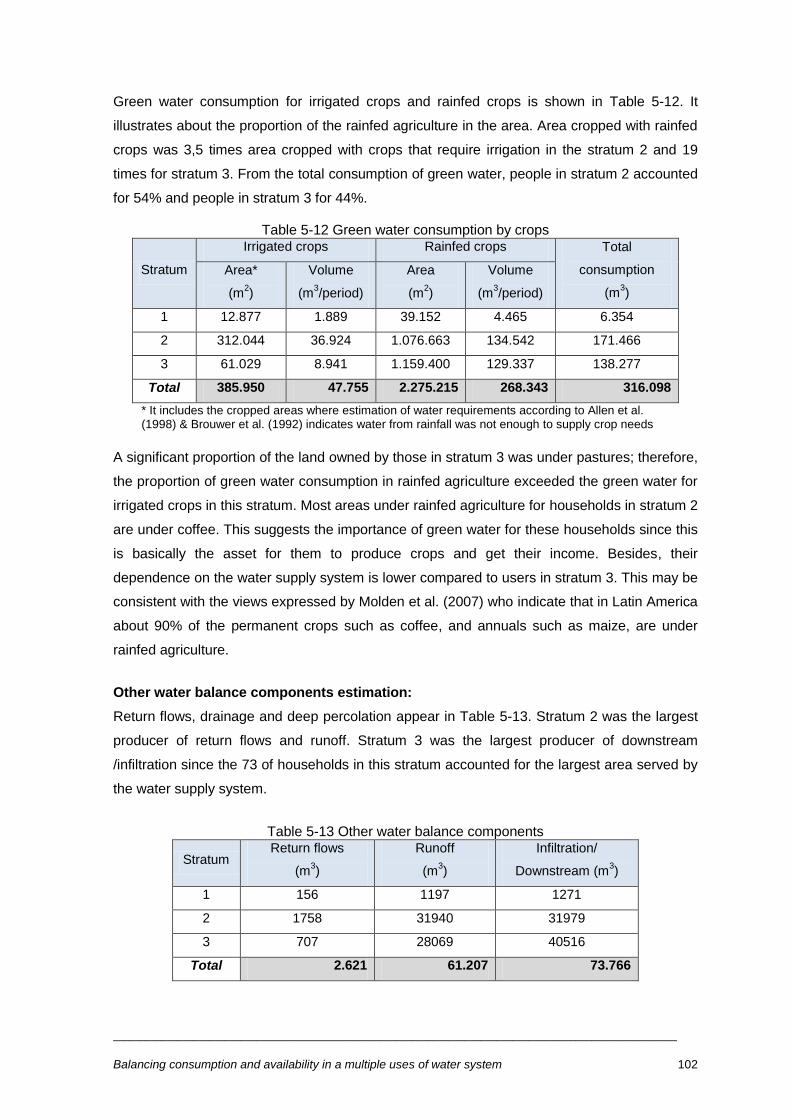
__________________________________________________________________________________________________________
Balancing consumption and availability in a multiple uses of water system 102
Green water consumption for irrigated crops and rainfed crops is shown in Table 5-12. It
illustrates about the proportion of the rainfed agriculture in the area. Area cropped with rainfed
crops was 3,5 times area cropped with crops that require irrigation in the stratum 2 and 19
times for stratum 3. From the total consumption of green water, people in stratum 2 accounted
for 54% and people in stratum 3 for 44%.
Table 5-12 Green water consumption by crops
Stratum
Irrigated crops Rainfed crops Total
consumption
(m3)
Area*
(m2)
Volume
(m3/period)
Area
(m2)
Volume
(m3/period)
1 12.877 1.889 39.152 4.465 6.354
2 312.044 36.924 1.076.663 134.542 171.466
3 61.029 8.941 1.159.400 129.337 138.277
Total 385.950 47.755 2.275.215 268.343 316.098
* It includes the cropped areas where estimation of water requirements according to Allen et al. (1998) & Brouwer et al. (1992) indicates water from rainfall was not enough to supply crop needs
A significant proportion of the land owned by those in stratum 3 was under pastures; therefore,
the proportion of green water consumption in rainfed agriculture exceeded the green water for
irrigated crops in this stratum. Most areas under rainfed agriculture for households in stratum 2
are under coffee. This suggests the importance of green water for these households since this
is basically the asset for them to produce crops and get their income. Besides, their
dependence on the water supply system is lower compared to users in stratum 3. This may be
consistent with the views expressed by Molden et al. (2007) who indicate that in Latin America
about 90% of the permanent crops such as coffee, and annuals such as maize, are under
rainfed agriculture.
Other water balance components estimation:
Return flows, drainage and deep percolation appear in Table 5-13. Stratum 2 was the largest
producer of return flows and runoff. Stratum 3 was the largest producer of downstream
/infiltration since the 73 of households in this stratum accounted for the largest area served by
the water supply system.
Table 5-13 Other water balance components
Stratum Return flows
(m3)
Runoff
(m3)
Infiltration/
Downstream (m3)
1 156 1197 1271
2 1758 31940 31979
3 707 28069 40516
Total 2.621 61.207 73.766
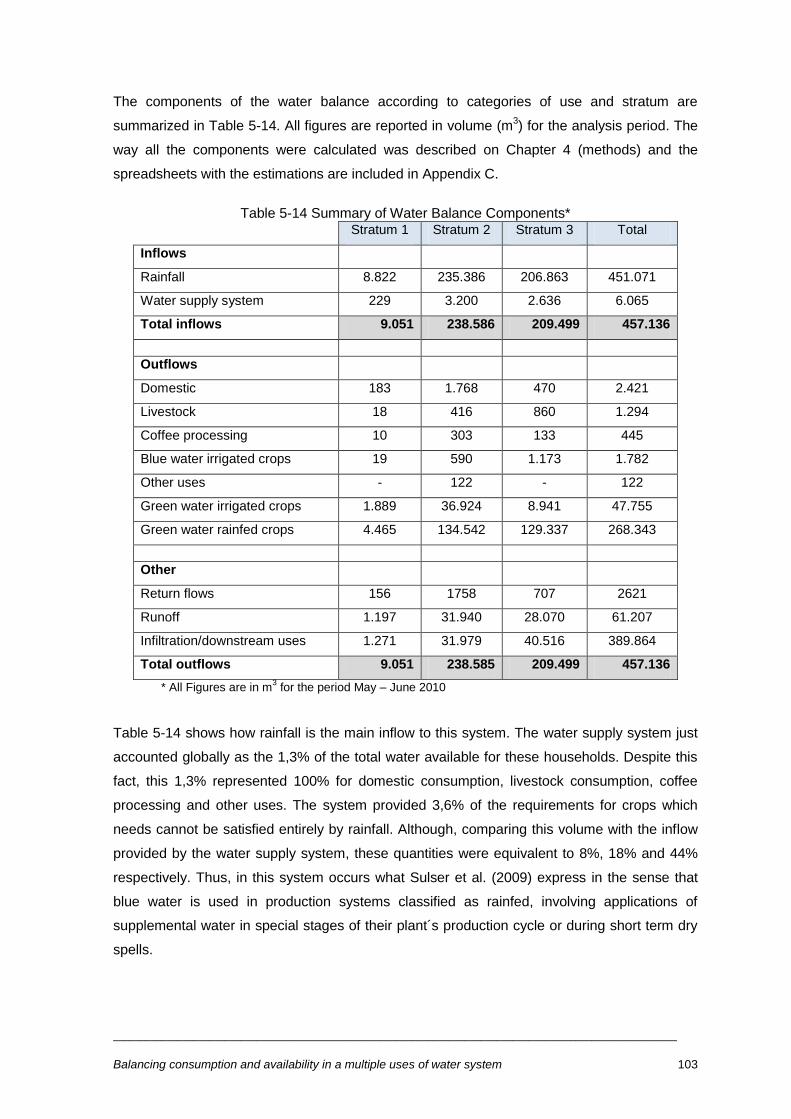
__________________________________________________________________________________________________________
Balancing consumption and availability in a multiple uses of water system 103
The components of the water balance according to categories of use and stratum are
summarized in Table 5-14. All figures are reported in volume (m3) for the analysis period. The
way all the components were calculated was described on Chapter 4 (methods) and the
spreadsheets with the estimations are included in Appendix C.
Table 5-14 Summary of Water Balance Components*
Stratum 1 Stratum 2 Stratum 3 Total
Inflows
Rainfall 8.822 235.386 206.863 451.071
Water supply system 229 3.200 2.636 6.065
Total inflows 9.051 238.586 209.499 457.136
Outflows
Domestic 183 1.768 470 2.421
Livestock 18 416 860 1.294
Coffee processing 10 303 133 445
Blue water irrigated crops 19 590 1.173 1.782
Other uses - 122 - 122
Green water irrigated crops 1.889 36.924 8.941 47.755
Green water rainfed crops 4.465 134.542 129.337 268.343
Other
Return flows 156 1758 707 2621
Runoff 1.197 31.940 28.070 61.207
Infiltration/downstream uses 1.271 31.979 40.516 389.864
Total outflows 9.051 238.585 209.499 457.136
* All Figures are in m3 for the period May – June 2010
Table 5-14 shows how rainfall is the main inflow to this system. The water supply system just
accounted globally as the 1,3% of the total water available for these households. Despite this
fact, this 1,3% represented 100% for domestic consumption, livestock consumption, coffee
processing and other uses. The system provided 3,6% of the requirements for crops which
needs cannot be satisfied entirely by rainfall. Although, comparing this volume with the inflow
provided by the water supply system, these quantities were equivalent to 8%, 18% and 44%
respectively. Thus, in this system occurs what Sulser et al. (2009) express in the sense that
blue water is used in production systems classified as rainfed, involving applications of
supplemental water in special stages of their plant´s production cycle or during short term dry
spells.

__________________________________________________________________________________________________________
Balancing consumption and availability in a multiple uses of water system 104
The 73 households on Stratum 2 used more water from the water supply system for domestic
uses, coffee processing, small business and pools, while 17 households of stratum 3 used
more water from this system for livestock and irrigation.
The distribution of the total input into the system is shown in Figure 5-21. To the left the
distribution of the water supply system into the different categories of use is shown. Domestic
uses accounted for 40% of the total consumption, 2% for uses such as small business and
swimming pools and the remaining 60% was distributed in productive uses: 30% as
supplemental irrigation, 21% for livestock, 7% for coffee processing. To the right the
distribution of the rainfall inflow is shown: rainfed crops used 59% of the water that fell and
irrigated crops 11%. The remaining 30% went to runoff, infiltration and downstream.
Figure 5-21 Global distribution of inflows according to categories of use
Figure 5-22 shows how inputs from the water supply system and the rain are distributed for
categories and strata. At the left inputs from the system are shown and at right inputs from
rainfall.
Figure at the left indicates that the 73 households on stratum 2 consumed most of the water
supplied from the system, especially for domestic purposes (about 55%) followed by crops
(about 20%) and livestock (about 10%). Although, quantities for those last uses (590 m3 and
416 m3) are smaller compared to the volumes consumed for those categories by the 17
households on stratum 3 (1173 m3 and 860 m
3). In this stratum, the quantity of water for
domestic use was less than 20% (470 m3). In stratum 1, about 80% of water consumption was
for domestic purposes and for the 16 households the total water consumed was 229 m3.
40%
21%
7%
30%
2%
Water supply system
Domestic
Livestock
Coffee processing
Blue water irrigated crops
Other uses
59%11%
14%
16%
Rainfall distribution
Green water rainfed crops
Green water irrigated crops
Runoff
Infiltration/downstream

__________________________________________________________________________________________________________
Balancing consumption and availability in a multiple uses of water system 105
Figure 5-22 Distribution of inflows according to categories of use and stratum.
Left: inputs from water supply system. Right: inputs from rainfall
Regarding inputs from rain, which are used mainly for crops, Figure 5-22 (right) shows that the
bulk of inputs from rainfall are used mainly for rainfed crops, similar volumes on strata 2 and 3
(134542 m3 y 129337 m
3). The volume of green-water used by irrigated crops was greater in
stratum 2 (36924 m3) compared to the volume used in stratum 3 (8941 m
3). This is because
the area planted with these crops for the total households in stratum 2 is approximately five
times greater than in stratum 3, and because these crops had greater water requirements.
This contrasts with the volume of water from the water supply system used in both strata for
these crops, possibly indicating that while households in stratum 3 applied supplementary
irrigation to these, those in stratum 2 did not. The use of green water in stratum 1 just
accounted for 6354 m3 for both type of crops.
Summarizing
The water inputs for the three categories of households served by La Palma Tres Puertas
system were given mainly by rain and the sub-basin transfer from Sabaletas coming through
the water supply system. Households in stratum 1 used the water almost exclusively for
domestic and some productive uses that were marginal or no significant to the water supply
system or rainwater. In absolute terms, the 73 users who belonged to stratum 2 used more
water from the water supply system and more rainwater than users in stratum 3. Overall, they
had the largest population, which directly influenced water consumption and had a greater
cumulative area. In this area, these households had mainly crops such as coffee that relied
exclusively on rainfall for its development, and supplemental irrigation occurred in isolated
cases (smaller areas planted with maize, vegetables, etc). The number of animals that all
these households had was 50% the amount households in stratum 3 had. In this stratum as
-
500
1.000
1.500
2.000
2.500
3.000
3.500
Stratum 1 Stratum 2 Stratum 3
Vo
lum
e (
m3
)
Domestic Livestock
Coffee processing Crops
-
50.000
100.000
150.000
200.000
Stratum 1 Stratum 2 Stratum 3
Vo
lum
e (
m3
)
Green water rainfed crops Green water irrigated crops

__________________________________________________________________________________________________________
Balancing consumption and availability in a multiple uses of water system 106
there was a large proportion of small coffee growers, water consumption for the processing of
grain was about over double for the same activity used by households in stratum 3.
In stratum 3 with only 17 households, the area they had was comparable to that of the 73
households in stratum 2, which allowed them a potential to benefit from the rainwater as much
as households in stratum 2 altogether. The same applied with the water from the water supply
system these 17 users consumed, 43% of water supplied, while in stratum 2 the 73 users
consumed 53%. Most of the water consumed by households in stratum 3 was for productive
activities, irrigation and animal husbandry. This is similar to the findings of Smits et al. (2010)
in Honduras where households categorized as cattle ranchers have the highest consumption
levels year-round.
Although, in stratum 2 was a larger area planted with crops that require irrigation, presumably,
these crops are for home consumption and consequently the proportion of water from the
water supply system used for irrigation was lower compared to that in stratum 3. However, as
explained before, due to the assumptions for the balance, water consumption for irrigation in
stratum 3 might include some of the water used for animals. In general, what is perceived, is
households in stratum 2 highly depended on rain, and despite these people used the water
supply system for some productive purposes, a 55% of the total was still used for purely
domestic uses. In contrary, users in stratum 3 used only 18% of the total, for domestic
purposes and the remaining percentage for productive activities.
Water balance at the household level
The estimated volumes for the different categories of consumption were expressed as
average domestic daily per capita consumption, and average productive daily per capita
consumption, according to strata, and the different categories of productive use: livestock,
coffee processing, irrigated crops, rainfed crops;. Results are shown schematically in Figure
5-23. This is intended to ―transfer the multiple water needs into water demand characteristics‖
as suggested by van Koppen et al. (2009).
For each stratum, Figure 5-23 shows the water inputs: water supply system and rainfall at the
top, and their distribution: the water supply system to supply domestic, livestock, coffee
processing, other uses and for supplemental irrigation; and the rainfall for irrigated and rainfed
crops. Water used by irrigated and rainfed crops left the system as evapotranspiration. A
proportion of domestic consumption, livestock and coffee processing became return flows.
Part of the rainfall, which was not used by crops, changed to runoff, infiltration and
downstream uses. All Figures are given in litres per capita per day (lpcd).

__________________________________________________________________________________________________________
Balancing consumption and availability in a multiple uses of water system 107
Figure 5-23 Water balance at the household level
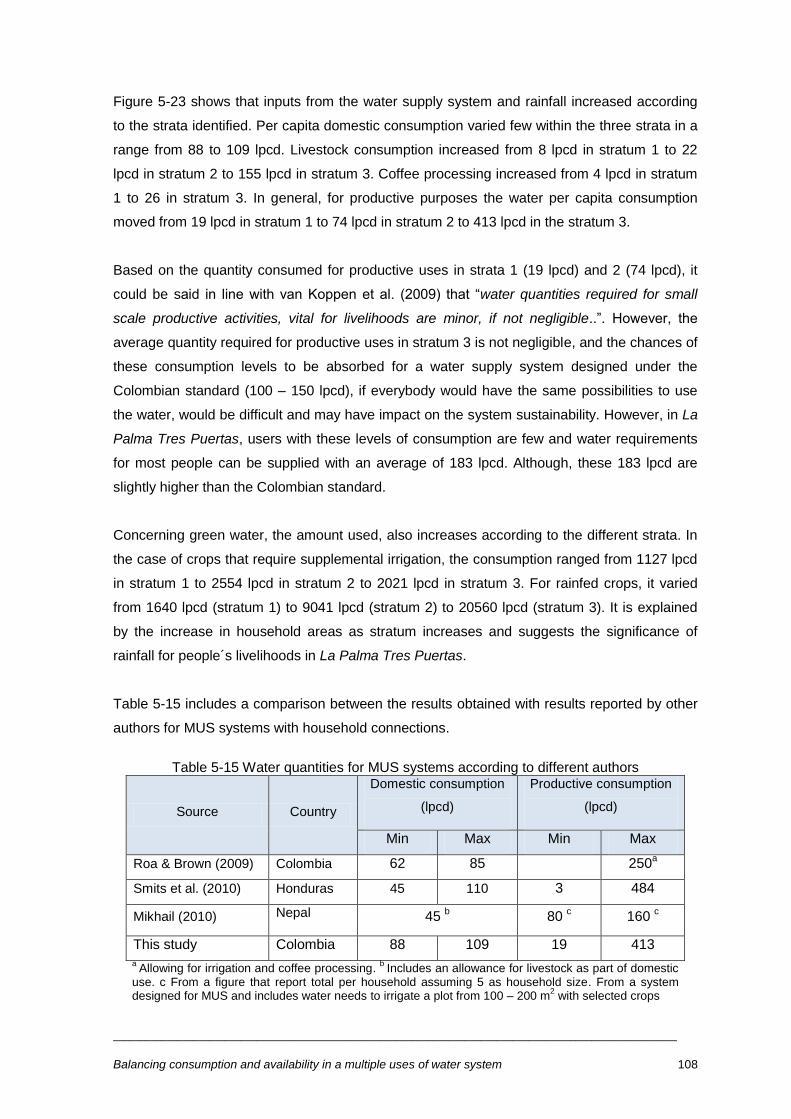
__________________________________________________________________________________________________________
Balancing consumption and availability in a multiple uses of water system 108
Figure 5-23 shows that inputs from the water supply system and rainfall increased according
to the strata identified. Per capita domestic consumption varied few within the three strata in a
range from 88 to 109 lpcd. Livestock consumption increased from 8 lpcd in stratum 1 to 22
lpcd in stratum 2 to 155 lpcd in stratum 3. Coffee processing increased from 4 lpcd in stratum
1 to 26 in stratum 3. In general, for productive purposes the water per capita consumption
moved from 19 lpcd in stratum 1 to 74 lpcd in stratum 2 to 413 lpcd in the stratum 3.
Based on the quantity consumed for productive uses in strata 1 (19 lpcd) and 2 (74 lpcd), it
could be said in line with van Koppen et al. (2009) that ―water quantities required for small
scale productive activities, vital for livelihoods are minor, if not negligible..‖. However, the
average quantity required for productive uses in stratum 3 is not negligible, and the chances of
these consumption levels to be absorbed for a water supply system designed under the
Colombian standard (100 – 150 lpcd), if everybody would have the same possibilities to use
the water, would be difficult and may have impact on the system sustainability. However, in La
Palma Tres Puertas, users with these levels of consumption are few and water requirements
for most people can be supplied with an average of 183 lpcd. Although, these 183 lpcd are
slightly higher than the Colombian standard.
Concerning green water, the amount used, also increases according to the different strata. In
the case of crops that require supplemental irrigation, the consumption ranged from 1127 lpcd
in stratum 1 to 2554 lpcd in stratum 2 to 2021 lpcd in stratum 3. For rainfed crops, it varied
from 1640 lpcd (stratum 1) to 9041 lpcd (stratum 2) to 20560 lpcd (stratum 3). It is explained
by the increase in household areas as stratum increases and suggests the significance of
rainfall for people´s livelihoods in La Palma Tres Puertas.
Table 5-15 includes a comparison between the results obtained with results reported by other
authors for MUS systems with household connections.
Table 5-15 Water quantities for MUS systems according to different authors
Source Country
Domestic consumption
(lpcd)
Productive consumption
(lpcd)
Min Max Min Max
Roa & Brown (2009) Colombia 62 85 250a
Smits et al. (2010) Honduras 45 110 3 484
Mikhail (2010) Nepal 45 b 80
c 160
c
This study Colombia 88 109 19 413
a Allowing for irrigation and coffee processing.
b Includes an allowance for livestock as part of domestic
use. c From a figure that report total per household assuming 5 as household size. From a system designed for MUS and includes water needs to irrigate a plot from 100 – 200 m
2 with selected crops

__________________________________________________________________________________________________________
Balancing consumption and availability in a multiple uses of water system 109
Domestic consumption for La Palma Tres Puertas estimated through the water balance
method, is higher compare to that reported by Roa & Brown (2009) and Mikhail (2010).
Although, in all cases domestic figures are less than 110 lpcd. Where differences appear
larger is compared to the case of Nepal. This may be explained because the system of Nepal
considers the irrigation of vegetables in small plots (100 - 200 m2) and a domestic allocation of
45 lpcd, including water for livestock. These 45 lpcd are roughly equivalent to the consumption
used in this study for the daily needs of one cow.
Productive activities reported in this research are similar to those in the study of Smits et al.
(2010) in Honduras, and Roa & Brown (2009) in Colombia, which are related to coffee
production, other crops, and animal husbandry as well. Consumptions from Roa and Brown
(2009) are smaller although, they suggested in this study area, people have suffered water
scarcity and they tend to use water in an efficient way. Smits et al. (2010) in Honduras, studied
water use for productive purposes and found differences in the amount of water used for
productive purposes between different household categories set according to occupation of
household head (i.e., labourers, small farmers, ranchers). As shown in Table 5-15 those
differences are on the range from 3 – 484 lpcd. They concluded that a variety of measures
which can facilitate multiple use without causing sustainability problems need to be
accommodated, such as regulating water consumption, with clear differentiation between
consumption patterns and user groups.
While recognizing this information is illustrative, is also important to highlight the limitations in
the way it was estimated. In addition to the limitations described on the Methodology chapter,
the values shown in Figure 5-23 are estimates based on averages, therefore, those include
the effect of maximum and minimum values (i.e. some users without cows averaged with
users with 50 cows), thus per capita demand can vary for every purpose, especially in stratum
3. However, since domestic use is less variable, the total productive use is in the ranges listed,
what may change is how it is distributed according to the livelihoods of each particular
household. Those details appear on the spreadsheets presented on Appendix C.
__________________________________________________________________________________________________________
Balancing consumption and availability in a multiple uses of water system 110
6 CONCLUSIONS AND RECOMMENDATIONS
This chapter presents the key points that can be drawn from the results of this investigation in
response to the objectives and research questions raised, and discussed to what extent those
objectives were achieved. The appropriateness of the methodologies used is also discussed.
Finally, the chapter contains recommendations for future research, especially in the study
area.
Conclusions around objective 1: To characterize groups of households within a MUS
system according to aspects related to poverty, productive activities, livelihoods and
access to water
Different groups of households within the system were characterized, and relations were
established between water consumption levels and aspects of poverty, livelihoods and equity;
concepts on which the MUS approach is based. Water consumption levels were mainly related
to household size, household area, household head occupation, and consequently, to the type
and scale of productive activities carried out at the homestead, and to other aspects such as
household storage.
It was found that indeed, those households with water consumption under 20 m3/every two
months (stratum 1), used the water supply system primarily for domestic use. There are
various reasons for this and the present study did not establish which was the most influential.
Some of the reasons are that families were small, or livelihoods did not depend directly from
the system, or had small areas, they were not owners, service was provided less frequently
and storage capacity was smaller. Households with consumption levels between 40-80
m3/every two months (stratum 2), had productive activities in farms under 5 hectares, although
these activities were dependent on rainfall rather than on piped water. However, some farmers
with larger areas or commercial activities, also had this level of consumption, although, those
were engaged on activities under systems which use water more efficiently. Households with
consumption over 80 m3/every two months (stratum 3) simultaneously performed various
productive activities, like agriculture and animal husbandry. Especially, they had a greater
number of animals and properties with larger areas compared to households with lower levels
of consumption.
In La Palma Tres Puertas, though all residents had the water service, this was intermittent,
and for this reason, it was provided by shifts, leading to some inequalities in the access to the
resource. It was found that households with water consumption up to 20 m3/every two months
had storage tanks up to 10 m3, and some of the households with higher consumption, more

__________________________________________________________________________________________________________
Balancing consumption and availability in a multiple uses of water system 111
than 80 m3/two every two months, had storage tanks up to 100 m
3, especially those who
developed larger-scale agricultural activities. This suggests that when the livelihoods of people
depend significantly on the water supply system, they are willing to make major investments to
have water in a more reliable way. Those who cannot afford to build infrastructure at the
households to cope with service intermittence may be in disadvantage compared to the better
off. The impact on people's perceptions regarding this condition depends mainly on whether
for people, water is a key asset to generate income or not.
Access to land and its ownership gives to people the opportunity to develop productive
activities to ensure their livelihoods. However, many times, despite this activities are carried
out they do not generate enough income to allow people a reasonable standard of living
(Ruben & van der Berg, 2001; Pérez & Pérez, 2002). In La Palma Tres Puertas about 20% of
households with water consumption less than 80 m3/every two months, some of those
engaged in farming, lived in poverty, earning less than 2US $ / day. None of the households
with consumption over 80 m3/every two months had these low income levels. This confirms
that water is just one factor contributing to livelihoods, and that health, sanitation, education,
agronomic knowledge, market linkages, veterinary services, and many other things are critical
to improve people´s ability to escape from poverty (van Koppen, 2009)
La Palma Tres Puertas is a clear example of the transformation processes undergone by rural
areas in Colombia, with the agricultural crisis, the increase in livestock, the change of
permanent crops to pasture, and the inequality in land ownership. At the end, all these aspects
are reflected in the pattern of water use within this rural water supply system, for example, in
the significant amount of water that now is used for livestock, that before was probably
dedicated to other purposes or not used.
Conclusions around objective 2: To measure different components of the domestic
water per capita consumption in households within a MUS system
The household monitoring to determine the water per capita consumption for domestic uses
resulted in a figure of per capita demand in a range from 44.3 to 95.6 lpcd with an average of
77 lpcd. The values obtained in the different households for each of the activities involved,
were variable, indicating that this consumption is influenced by many factors such as, the
number of taps, the system of sanitation, hygiene practices, people habits, preferences, etc.
Activities with the highest consumption of water were bathing, washing dishes and laundry.
The obtained values of per capita consumption with this monitoring were lower than values
reported by other studies conducted in rural communities in Colombia, and lower the range

__________________________________________________________________________________________________________
Balancing consumption and availability in a multiple uses of water system 112
that the Colombian standard (RAS - 2000) allows for designing of rural water supply systems
for domestic purposes 100-150 lpcd. However, within the water supply system, only 17% of
households had exclusively domestic uses, while the remaining 83% developed productive
activities that depend on water.
Conclusions around objective 3: To propose balances at the system and household
level, including water demand for multiple uses and water availability, considering blue
water and green water.
The possibility of using water balance concepts and budgets and their methodologies was
tested at the scale of a MUS system under administrative boundaries, incorporating the
concepts of green water and blue water. It showed the flexibility of these tools to suit the
objectives of a study, scale, and availability of information. The water balance probed to be
useful for understanding the dynamics of the hydrological cycle and the human cycle in a
system, when the required and available information is collected, according to defined time
and space boundaries, in order to obtain more reliable results.
The stratified analysis allowed estimating water consumption for domestic and productive
uses, making clear differences between types of households within the water supply system,
quantifying what was qualitatively described in first place. Thus, it confirmed that households
in stratum 2 were highly dependent on rain, and despite the use of the water supply system for
some productive purposes, a 55% of consumption was allocated to purely domestic uses. In
contrast, in stratum 3 the water supply system was only used by 18% for domestic purposes
and the remaining percentage for productive activities, like agriculture and animal husbandry.
Per capita domestic consumption varied few within the three strata in a range from 88 to 109
lpcd. In contrast, water per capita consumption for productive purposes, was 19 lpcd in
stratum 1, 74 lpcd in stratum 2 and 413 lpcd in stratum 3. Therefore, based on the quantity
consumed for productive uses in strata 1 and 2, it could be said those uses were ―minor, if not
negligible‖ (van Koppen et al., 2009). However, the average quantity required for productive
uses in stratum 3 was not negligible, and the chances of these consumption levels to be
absorbed for a water supply system designed under the Colombian standard (100 – 150 lpcd),
if everybody would have the same possibilities to use the water, would be difficult and may
have impact on the system sustainability. However, the 183 lpcd required for domestic and
productive uses by households in stratum 2 were slightly higher than the Colombian standard
as well. Those results were particularly similar to the findings of Smits et al. (2010) in
Honduras in a rural community, which productive activities were based on coffee production
and animal husbandry as in La Palma Tres Puertas.

__________________________________________________________________________________________________________
Balancing consumption and availability in a multiple uses of water system 113
It was found that water consumption levels in this MUS system, depended not only on whether
or not people developed productive activities and the scale, but also on the activities selected;
being livestock, an activity with a significant weight on the demand for water in the system.
Therefore, awareness about people´s livelihoods in an existing system providing water for
MUS is required to find whether these uses can be carried out with the amount of water and
the infrastructure available, and how to introduce these realities in the operational rules and
system management.
Sustainable Livelihoods, Demand Responsive, and therefore Multiples Uses approaches need
to be incorporated into planning in Colombia, including the water needs of the people and the
available supply. The current design standard, besides being insufficient for uses in rural
areas, promotes inequality between urban and rural areas (allocations are higher for the
cities). However, adopting these approaches implies the need for different strategies for
training water professionals and certainly, involves a cost in the planning phase derived from
the need for additional activities such as surveys, to collect information that currently is not
used. Though, this cost may be lower compared to the benefit of anticipate real future
demands on the system and work towards sustainability. The costs of the infrastructure with
higher capacity should also be considered in the analysis.
Appropriateness of the methodologies used
Although, there was already information on multiple uses in La Palma Tres Puertas, this study
posed new questions and adopted strategies based on the existing information to go slightly
further to find out on the influence of aspects of poverty and livelihoods on the levels of water
consumption the area. The possibility to cross information about livelihoods and poverty with
records from water meters, allowed enriching the analysis.
The household survey was an appropriate method to collect information related to issues of
poverty, livelihoods and access to water, especially in this community where homes were
scattered and there was low participation of local people in community activities, which had
impeded the implementation of other strategies, such as focus groups. However, given the
inconsistencies in some responses relating to income levels by some users, and the fact that
this seems to be a sensitive issue, it is important to try to get this information using a
combination of different strategies.
Achieve people participation in the household monitoring of domestic water use was not an
easy task due to the distrust of many people on the purposes of the research. This limited the
monitoring only to 6 homes. Additionally, the methodology originally proposed had to be
__________________________________________________________________________________________________________
Balancing consumption and availability in a multiple uses of water system 114
modified, which meant the change of direct observation by the author to filling out water
diaries by people in households and restrict the activity to record domestic consumption, since
who agreed to fill the diaries were housewives. The validity of the results would be improved,
with participation from a greater number of households.
Despite the limitations on the household monitoring, the methods provided an idea of the
water consumption levels for different activities and an estimate of total domestic per capita
demand. However, those methods were subjected to a variety of ―social desirability bias‖
(Posdakoff et al., 2003), since participants may have changed their behaviour, i.e. adopt more
rational water consumption or more stringent hygiene practices; the water diaries also may
have lead to under-report some uses that were not developed directly by the person in charge
to keep the records. In addition, the fact that taps were measured just once, also introduced
an error. Although, these sources of bias and errors may be reduced by applying the principle
of triangulation, as in this case, using records from the meters and information from the
household survey.
In particular, the stratified sampling strategy allowed to identify, how and why within a system
in which potentially all have the same level of service, some benefited more than others with it.
Although, the precision achieved was lower to draw conclusions for stratum 3, since it was not
possible to obtain the desired sample size. However, it provided a clearer picture of this group
of households, which was not visible enough in previous studies (Cinara, 2006, Ospina, 2009).
Even though, these households are not the targeted beneficiaries of MUS, its recognition is
important because, the impact of a small number of them can compromise the service
sustainability for the majority.
Combining information from meter records with surveys and monitoring use of water,
contributed to improve the reliability of the results and to minimize bias. This approach is not
documented in previous studies of MUS. To do this, it was fundamental to study the
methodologies implemented by other researchers on water topics from other perspectives.
The approach to study the availability of water was also different, since, in most previous
studies of MUS, it was generally based on people perceptions. The approach here was to take
into account the hydrological cycle, and to introduce the concepts of green water and blue
water in the analysis. However, the obtained figures are indicative, since their estimation were
based on several assumptions and rough information. Therefore, it is required to improve not
only the type of information that should be elicited through surveys, but also to have more
reliable reference values for the consumption factors used for the estimates.
__________________________________________________________________________________________________________
Balancing consumption and availability in a multiple uses of water system 115
Recommendations for future research
Recommendations for future research are summarized below
Study water productivity for the area
Study the variation of per capita demand for domestic and productive activities for wet
season and compare to the results obtained in this study for the dry season
Study on how these families ensure their food security and whether both the water
supply system and rainwater, have capacity to allow people having gardens looking for
self-sufficiency, or less dependency on the market for their food needs, especially in
the case of the poorest families
Study from the technical perspective, the effect that household storage tanks have on
the system performance to establish if their presence is related to the service
intermittence
Explore alternatives to improve the use of rainfall in the area as a strategy to increase
agricultural yields
Investigate whether the differential price of the tariff, includes the costs of providing the
service, and reflects principles of equity, solidarity and efficiency, given the differences
between users discussed, and the need to make rational use of the resource, since the
water supply system operates at full capacity and using water from a sub-basin
transfer.
Research water consumption reference values for local species of livestock and typical
crops, whose water needs are not available in the published literature

__________________________________________________________________________________________________________
Balancing consumption and availability in a multiple uses of water system 116
REFERENCES
Adekalu, K. O., Osunbitan, J. A., & Ojo, O. E. (2002) Water sources and demand in south western
Nigeria: Implications for water development planners and scientists. Technovation, Vol. 22, No
12, pp.799-805
Ahmad, Mobin-ud-Din , Islam, Md. Aminul , Masih, Ilyas , Muthuwatta, Lal , Karimi, Poolad &
Turral, Hugh (2009) Mapping basin-level water productivity using remote sensing and secondary
data in the Karkheh River Basin, Iran, Water International, Vol. 34, No 1, pp. 119 — 133
Alcaldía de Restrepo (2004) Esquema de Ordenamiento Territorial. Municipio de Restrepo, Valle
del Cauca, Unpublished document. Municipio de Restrepo, Colombia
Allen, R.G., Pereira, L.S., Raes, D. and Smith, M. (1998) Crop Evapotranspiration: Guidelines for
Computing Crop Water Requirements, Irrigation and Drainage paper , Vol. 56, Food and
Agriculture Organization (FAO): Rome, Italy
AQUASTAT (2000) Country Profile Colombia page, Information System on Water Use in
Agriculture, Food and Agriculture Organization (FAO)
http://www.fao.org/nr/water/aquastat/countries/colombia/indexesp.stm (Accessed 6 August 2010)
Ashley, C. & Carney, D. (1999) Sustainable Livelihoods: Lessons from Early Experience,
Department for International Development (DFIF): London. Russell Press Ltd., Nottingham.
Barrios, M. (2008) Propuesta para el Manejo del Agua en Unidades Productivas Rurales del
Quindío Bajo el Concepto de Uso Múltiple, Unpublished Msc. Project Report, Universidad del
Valle: Colombia
Bentley, J. & Baker, P. (2000) The Columbian Coffee Growers' Federation: Organised, Successful
Smallholder Farmers For 70 Years, Agricultural Research and Extension Network Paper, No.
100 Overseas Development Institute (ODI ), London
Bramfit, J., Burnett, S. & Amsworth, P (1997) A comparative study of water usage in metered and
unmetered households, Journal of Consumer Studies and Home Economics, Vol. 21, pp. 201-
213
Brouwer, C. Hoevenaars, J.P.M. Van Bosch, B.E., Hatcho, N., Heibloem M. (1992) Scheme
Irrigation Water Needs and Supply, Training Manual No. 6 - Food and Agriculture Organization
(FAO): Rome, Italy. http://www.fao.org/docrep/u5835e/u5835e00.htm#contents. (Accessed 22
July 2010)
Brouwer, C. & Heibloem, H. (1986) Irrigation water management. Irrigation water needs. Training
Manual No. 3. Food and Agriculture Organization (FAO): Rome, Italy.
Bryman A. & Cramer D. (2001) Quantitative data analysis with SPSS release 10 for Windows: a
guide for social scientists. Editorial Routledge: London, UK
Butterworth, J. Keijzer, M., Smout, I. & Hagos, (ed.) (2008) Multiple-Use Water Services,
Proceedings of an International Symposium held in Addis Ababa, Ethiopia, 4-6 November 2008,
Multiple Use Water Services (MUS) Group.
Cambio (2009) Operación Magdalena, Revista Cambio, Octubre 15 de 2009.
http://www.cambio.com.co/portadacambio/849 (Accessed 15 November 2009)
__________________________________________________________________________________________________________
Balancing consumption and availability in a multiple uses of water system 117
Cenicafé (2006) Sistemas de Producción de Café en Colombia page, Centro Nacional de
Investigaciones del Café.
http://www.cenicafe.org/modules.php?name=sistemas_produccion&file=sispro. (Accessed 26
July 2010)
Cenicafé (2010) Estado del Tiempo en la Zona Cafetera page, Centro Nacional de Investigaciones
del Café.
http://www.cenicafe.org/modules.php?name=estado_del_tiempo_en_la_zona_cafetera&file.
(Accessed 26 July 2010)
Cenicafé, (2010) Climatic information from Julio Fernandez Station, Period May - June 2010,
Unpublished records, Centro Internacional de Investigaciones del Café (Cenicafé), Colombia
Cinara (2006) Caso de Estudio del Sistema de Abastecimiento de Agua de la Palma Tres Puertas,
Restrepo, Valle del Cauca, Instituto de Investigación y Desarrollo en Agua Potable, Saneamiento
Básico y Conservación del Recurso Hídrico (Cinara): Colombia.
Cinara (2007a) Análisis de las intervenciones realizadas por el Programa PAAR desde la
perspectiva de usos múltiples del agua. Instituto de Investigación y Desarrollo en Agua Potable,
Saneamiento Básico y Conservación del Recurso Hídrico (Cinara): Colombia.
Cinara (2007b), Los usos múltiples del agua en zonas rurales de los departamentos del Valle del
Cauca y Quindio (Colombia), Instituto de Investigación y Desarrollo en Agua Potable,
Saneamiento Básico y Conservación del Recurso Hídrico (Cinara): Colombia.
DANE & DNP (2009) Resultados Fase 1: Empalme de las Series de Mercado Laboral, Pobreza y
Desigualdad, Misión para el Empalme de Las Series de Empleo, Pobreza y Desigualdad.
Bogotá, Departamento Administrativo Nacional de Estadística (DANE), Departamento Nacional
de Planeación (DNP): Colombia
http://www.dane.gov.co/files/noticias/presentacion_pobreza_dane_dnp.pdf (Accessed 6 August
2010)
DANE (2005) Censo General de 2005, Departamento Administrativo Nacional de Estadística
(DANE), Colombia (Accessed 15 November 2010)
DANE (2010) Estimaciones de Población 1985-2005 y Proyecciones de Población 2005-2020
Nacional y Departamentales. Departamento Administrativo Nacional de Estadística (DANE),
http://www.dane.gov.co/index.php?option=com_content&task=category§ionid=16&id=496&it
emid=996 (Accessed 6 August 2010)
Departamento de Agricultura del Valle del Cauca (n.d.) Guía Agronómica de los Cultivos
Representativos del Departamento para la Realización de Estimaciones Agrícolas por Métodos
Indirectos. www.valledelcauca.gov.co/agricultura/descargar.php?id=967. (Accessed 21 July
2010)
Deverill, P., Bibby, S., Wedgwood, A., Smout, I. (2002) Designing Water Supply and Sanitation
Projects to Meet Demand in Rural and Peri-Urban Communities, Book 1: Concept, Principles and
Practice, Water and Engineering Development Centre (WEDC), Loughborough University, UK.
DFID (2001) Addressing the Water Crisis: Healthier and More Productive Lives for Poor People,
DFID, Department for International Development: London, UK

__________________________________________________________________________________________________________
Balancing consumption and availability in a multiple uses of water system 118
DNP (2005) CONPES 91. 2005. Metas y Estrategias de Colombia para el Logro de los Objetivos
de Desarrollo del Milenio – 2015. Consejo Nacional de Política Económica y Social. República de
Colombia. Bogotá, D.C
DNP (2007) CONPES 3463. 2007. Planes Departamentales de Agua y Saneamiento para el
Manejo Empresarial de los Servicios de Acueducto, Alcantarillado y Aseo. Consejo Nacional de
Política Económica y Social. República de Colombia. Bogotá, D.C.
DNP (2009) Misión para el Empalme de las Series de Empleo, Pobreza y Desigualdad (MESEP),
Departamento Nacional de Planeación (DNP), Bogotá: Colombia.
Domínguez, I. Corrales, S. Restrepo, I. Butterworth, J. (2008) ―Multiple Uses of Water: A View from
Reality in Rural Communities and National Politics‖, in: J. Butterworth, M. Keijzer, I. Smout & F.
Hagos (eds.) Proceedings of an International Symposium Held in Addis Ababa, Ethiopia, 4-6
November 2008, Multiple Use Water Services (MUS) Group.
Droogers, P., Bastiaanssen, W. G. M., Beyazgül, M., Kayam, Y., Kite, G. W. & Murray-Rust, H.
(2000) Distributed agro-hydrological modeling of an irrigation system in western Turkey,
Agricultural Water Management, Vol. 43, pp. 183 - 202
Ezeji, E. & Smout, I. (2009) Incorporating productive use into water systems in urban Nigeria, 34th
WEDC International Conference, Addis Ababa, Ethiopia, 2009
Falkenmark, M. & Molden, D. (2008) Wake Up to Realities of River Basin Closure, International
Journal of Water Resources Development, Vol. 24, No 2 , pp. 201 - 215
Falkenmark, M. (2003) Water Management and Ecosystems: Living with Change, Tec Background
Papers No. 9. GWP, Global Water Partnership, Sweden
Falkenmark, M., Rockstrom, J., Savenije, H. (2004), Balancing Water for Humans and Nature: The
New Approach in Ecohydrology, Earthscan Publications: London, UK
Fernandez, P. (2001) Determinación del Tamaño Muestral page, Metodología de la Investigación,
http://www.fisterra.com/mbe/investiga/9muestras/9muestras.asp. (Accessed 22 June 2010)
Forero, J. (2010) Colombian Family Farmers' Adaptations to New Conditions in the World Market,
Latin American Perspectives, Vol. 37 No. 2, pp. 93-110
Foster, V. (2005) Ten Years of Water Service Reform in Latin America: Toward an Anglo-French
Model, Water Supply and Sanitation Sector Board Discussion Paper Series, No 3, World Bank,
Washington, D.C.
FAO (2006) Calendario de cultivos América Latina y el Caribe, Estudio FAO Producción y
Protección Vegetal 186, Organización de las Naciones Unidas para la Agricultura y la
Alimentación (FAO): Roma
Fox, C., McIntosh, B. S., & Jeffrey, P. (2009) Classifying households for water demand forecasting
using physical property characteristics. Land use Policy, Vol. 26, No 3, pp. 558-568.
Gazzinelli, A., Souza, M., Nascimento, I., Ribeiro, I., Meire M., Kloos H., Domestic water use in a
rural village in Minas Gerais, Brazil, with an emphasis on spatial patterns, sharing of water, and
factors in water use, Saúde Pública, Vol. 14 No 2, pp. 265-277
Gleick, P. H. (1996). Basic water requirements for human activities: Meeting basic needs, Water
International.Vol.21, No2, pp. 83-92.

__________________________________________________________________________________________________________
Balancing consumption and availability in a multiple uses of water system 119
Gutiérrez, J. (2009) La Estadística Estratégica del Sector Agropecuario en Colombia: Un Nuevo
Modelo de Oferta. Revista de la Información Básica. Vol.3, No2,
http://www.dane.gov.co/revista_ib/html_r6/articulo3_r5.html (Accessed 7 Augost 2010)
GWP (2000) Integrated Water Resources Management TAC Background Paper No. 4. Global
Water Partnership (GWP): Stockholm
Hadjer, K. (2005) Water consumption embedded in its social context, north-western Benin. Physics
and Chemistry of the Earth, Vol. 30 No 6-7, pp. 357-364.
Hansen, S. & Bhatia, R. (2004) Water and Poverty in a Macro-Economic Context, Paper
commissioned by the Norwegian Ministry of the Environment in preparation of CSD12, United
Nations, New York.
Harrington, L. (2009) Cross-basin comparisons of water use, water scarcity and their impact on
livelihoods: Present and future. Water International, Vol. 34 No 1, pp.144.
Haughton J. & Khandker, S. (2009), Handbook on Poverty and Inequality, World Bank, Washington
D.C.
Healy, R.W., Winter, T.C., Labaugh, J.W., & Franke, O.L., (2007) Water Budgets: Foundations for
Effective Water-Resources and Environmental Management: U.S. Geological Survey Circular
1308. U.S. Geological Survey, Reston, Virginia
Hoff, H., Falkenmark, M., Gerten, D., Gordon, L., Karlberg, L., & Rockström, J. (2010) Greening the
global water system. Journal of Hydrology, Vol. 384, Issues 3-4, pp. 177-186
Hope, R. A., Jewitt, G. P. W. and Gowing, J. W. (2004) Linking the hydrological cycle and rural
livelihoods: a case study in the Luvuvhu catchment, South Africa, Physics and Chemistry of the
Earth, Vol. 29, pp. 1209–1217
Howard, G. & Bartram, J. (2003) Domestic Water Quantity, Service Level and Health. World Health
Organization (WHO), Geneva: Switzerland,
HR Wallingford (2003) Handbook for the Assessment of Catchment Water Demand and Use, HR
Wallingford: Wallingford, UK
IDEAM (2008). Estudio Nacional del Agua. Instituto de Hidrología, Meteorología y Estudios
Ambientales (IDEAM). Bogotá: Colombia.
IRC & Cinara (2005) Conferencia Electrónica: Usos Múltiples Del Agua Como Estrategia para
Enfrentar la Pobreza. Informe Final. Tomo I. International Water and Sanitation Centre (IRC),
Instituto de Investigación y Desarrollo en Agua Potable, Saneamiento Básico y Conservación del
Recurso Hídrico (Cinara). http://www.musgroup.net/page/305 (Accessed 12 November 2009)
IWMI, IRC, GWP. (2006). Taking a Multiple-Use Approach to Meeting the Water Needs of Poor
Communities Brings Multiple Benefits, Water Policy Briefing, International Water Management
Institute (IWMI), International Water And Sanitation Centre (IRC), Global Water Partnership,
Colombo, Sri Lanka
Jewitt, G. (2006) Integrating Blue and Green Water Flows for Water Resources Management and
Planning, Physics and Chemistry of the Earth, Vol. 31 pp. 753–762

__________________________________________________________________________________________________________
Balancing consumption and availability in a multiple uses of water system 120
Katsi, L. (2007) Assessment of factors which affect multiple uses of water sources at household
level in rural Zimbabwe - A case study of Marondera, Murehwa and Uzumba Maramba Pfungwe
districts, Physics and Chemistry of the Earth, Vol. 32, No 15-18, pp.1157-1166.
Keshavarzi, A. R. (2006) Rural domestic water consumption behavior: A case study in Ramjerd
area, Fars province, I.R. Iran. Water Research, Vol. 40, No 6, pp.1173-1178
Kusiluka, L. J. M., Mlozi, M. R. S., Munishi, P. K. T., Karimuribo, E. D., Luoga, E. J., Mdegela, R.
H., et al. (2004) Preliminary observations on accessibility and utilisation of water in selected
villages in Dodoma rural and Bagamoyo districts, Tanzania. Physics and Chemistry of the Earth,
Vol. 29, No 15-18, pp. 1275-1280.
Lu & Smout (2008), Domestic water consumption: a field study in Harbin, China; 33rd WEDC
International Conference, Accra, Ghana
Lundy, M., Gottret, M. & Ashby, J. (2008) Learning Alliances: An Approach for Building
Multistakeholder Innovation Systems, Institutional Learning and Change Sourcebook
http://www.cgiar-ilac.org/content/chapter-14-learning-alliances (Accessed 7 August 2010)
Makurira, H., Savenije, H. H. G., Uhlenbrook, S., Rockström, J., & Senzanje, A. (2007) Towards a
better understanding of water partitioning processes for improved smallholder rainfed agricultural
systems: A case study of Makanya catchment, Tanzania. Physics and Chemistry of the Earth,
Vol. 32, No 15-18, pp.1082-1089.
Manzungu, E., & Machiridza, R. (2005) An analysis of water consumption and prospects for
implementing water demand management at household level in the city of Harare, Zimbabwe.
Physics and Chemistry of the Earth, Vol. 30, No 11-16, pp. 925-934.
Mazvimavi, D., & Mmopelwa, G. (2006) Access to water in gazetted and ungazetted rural
settlements in Ngamiland, Botswana. Physics and Chemistry of the Earth, Vol. 31, No 15-16, pp.
713-722.
McKinney, D., Cai, X., Rosegrant, M., Ringler, C., & Scott, C. (1999) Modelling Water Resources
Management at the Basin Level: Review and Future Directions, SWIM Paper 6, System-Wide
Initiative on Water Management, International Water Management Institute (IWMI): Colombo, Sri
Lanka
Meisel, A. (2007) ¿Porqué se Necesita una Política Económica Regional en Colombia?
Documentos de Trabajo de Economía Regional, No 004396, Banco de La República, Colombia
Mikhail, M. (2010) Opportunities Revealed by the Nepal Multiple Use Water Services Experience,
Waterlines, Vol 29, N° 1.
Minambiente, CRA, Unicef (2007) Guía Metodológica para la Formulación y Diseño de Sistemas
de Acueducto Rurales. Ministerio de Ambiente Vivienda y Desarrollo Territorial (MAVDT),
Comisión Reguladora de Agua Potable y Saneamiento (CRA), Fondo de las Naciones Unidas
para la Infancia (Unicef): Colombia.
Mindesarrollo (2000). Resolución 1096 de 2000. Reglamento Técnico para el Sector de Agua
Potable y Saneamiento Básico, RAS 2000. Ministerio de Desarrollo Económico (Mindesarrollo):
Bogota D.C., Colombia.

__________________________________________________________________________________________________________
Balancing consumption and availability in a multiple uses of water system 121
Molden, D. & Fraiture, C. (2004) Investing in water for food, ecosystems and livelihoods, Blue
paper, Stockholm 2004, International Water Management Institute (IWMI): Colombo, Sri Lanka.
Molden, D. (1997) Accounting for water use and productivity. SWIM Paper 1. System-Wide
Initiative for Water Management, International Irrigation Management Institute (IWMI): Colombo,
Sri Lanka
Molden, D., Frenken, K., Barker, R., Fraiture de, C., Mati, B., Svendsen, M., Sadoff, C., &
Finlayson, C. (2007) ―Trends in Water and Agricultural Development‖, in: David Molden (ed.),
Water for Food Water for Life, a Comprehensive Assessment of Water Management in
Agriculture, Earthscan, London: UK
Moriarty, P. & Butterworth, J. (2003) The Productive Use of Domestic Water Supplies: How Water
Supplies Can Play a Wider Role in Livelihood Improvement and Poverty Reduction, Thematic
Overview Paper, International Water and Sanitation Centre (IRC): Delft, The Netherlands
Moriarty, P., Butterworth, J., Van Koppen, B. (2004). Beyond Domestic: Case Studies on Poverty
and Productive Uses of Water at the Household Level, Technical Paper Series No. 41,
International Water and Sanitation Centre (IRC), Delft, The Netherlands
Murad, R. (2003) Estudio sobre la Distribución Espacial de la Población en Colombia. Proyecto
Regional de Población Centro Latinoamericano y Caribeño de Demografía (CELADE), Comisión
Económica para América Latina y el Caribe (CEPAL), Fondo de Población de las Naciones
Unidas (UNFPA): Santiago de Chile
MUS Group (n.d.) Overview Multiples Uses Of Water Group page.
http://www.musgroup.net/page/272 (Accessed 21 November 2009)
Mutiro J., Makurira, H., Senzanje, A., Mul, M.L. (2006) Water productivity analysis for smallholder
rainfed systems: A case study of Makanya catchment, Tanzania, Physics and Chemistry of the
Earth, Vol. 31, pp. 901–909
Nath, KJ., Bloomfield SF., Jones, M. (2006) Household water storage, handling and point of-use
treatment. A review commissioned by IFH; published on http://www.ifh-homehygiene.org
(Accessed 23 May 2010)
Nguyen-Khoa, S., Huber-Lee, A., Van Koppen, B., Peden, D., Andreini, A. and Smits, S. (2008)
Multi-Purpose Water Systems: Topic 2, Synthesis Paper. CGIAR Challenge Program on Water
and Food (CPWF) Colombo: Sri Lanka
Nicol, A. (2000) Adopting a Sustainable Livelihoods Approach to Water Projects: Implications for
Policy and Practice, Working Paper 133, Overseas Development Institute (ODI), London: UK
Nozaic, D. (2002) ―Water Quality and Quantity‖ in Jo Smet and Christine van Wijk (eds.) Small
Communities Water Supplies – Technology, People and Partnerships, International Water and
Sanitation Centre (IRC): Delft, The Netherlands.
Nyong, A. & Kanaroglou, P. (1999) Domestic water use in rural semiarid Africa: A case study of
Katarko village in north-eastern Nigeria. Human Ecology, Vol. 27, No4, pp. 537-555.
Ospina, A. (2009) Propuesta para Incorporar las Dotaciones de Agua para Actividades
Agropecuarias de Pequeña Escala al Acueducto La Palma – Tres Puertas, Unpublished
Undergraduate Project, Universidad del Valle: Colombia.
__________________________________________________________________________________________________________
Balancing consumption and availability in a multiple uses of water system 122
Pallas, P. (1986) Water for Animals, Food and Agriculture Organization of the United Nations
(FAO), Rome http://www.fao.org/docrep/r7488e/r7488e00.htm#contents. (Accessed 20 July
2010)
Peden, D., Tadesse, G., Misra, AK., Awad Amed, F., Astatke, A., Ayalneh, W., Herrero, M.,
Kiwuwa, G., Kumsa, T., Mati, B., Mpairwe, D., Wassenaar, T., Yimegnuhal, A. (2007). ―Water and
Livestock for Human Development‖ in: David Molden (ed.) Water for Food Water for Life, A
Comprehensive Assessment of Water Management in Agriculture. Earthscan, London: UK
Peña, M., Restrepo, I., Mara, D. and Gijzen, H. (eds.) Proceedings of Agua 2003: International
Conference on Multiple Uses of Water for Life and Sustainable Development. Water and
Environmental Management Series (WEMS) Vol: 1 IWA Publishing: Colombia.
Perez de Mendiguren Castresana, J.C. (2004). ‗Productive uses of water at the household level :
evidence from Bushbuckridge, South Africa‘. In: P. Moriarty, J., Butterworth & B. Van Koppen, B.
(2004). Beyond domestic: case studies on poverty and productive uses of water at the household
level. (Technical Paper; no. 41), Delft, The Netherlands, IRC.
Pérez, E. & Pérez, M. (2002) El Sector Rural en Colombia y su Crisis Actual. Cuadernos de
Desarrollo Rural, Serie 1, No 48, pp. 35 - 58.
Perry, C.J. (1996) The IWMI Water Balance Framework: A Model for Project Level Analysis,
Research Report 5, International Irrigation Management Institute (IWMI): Colombo, Sri Lanka
PNUD (2009) Human Development Report 2009 - Country Fact Sheets - Colombia page, The
Human Development Index - Going Beyond Income.
http://hdrstats.undp.org/es/countries/country_fact_sheets/cty_fs_COL.html (Accessed July 7
2010)
Portilla, A. & Rendon, D. (2010) Map of La Palma Tres Puertas, Unpublished map.
Posdakoff, P., Mackenzie, S., Lee, J., Posdakoff, N. (2003) Common Method Biases in Behavioural
Research: A Critical Review of the Literature and Recommend Remedies. Journal of Applied
Psychology, Vol. 88 No 5, pp. 879 - 903
Practical Action (n.d.) Coffee Processing page, Practical Action Technical Brief.
http://www.appropedia.org/coffee_processing_(practical_action_technical_brief). (Accessed 27
July 2010)
Ratnaweera, P., Kulatunga,G., Sriyananda, H. (2006) Modelling of Water Resources: Water
Balance, Water Use And Water Security In: 32nd WEDC International Conference, Sustainable
Development of Water Resources, Water Supply and Environmental Sanitation, 13–17 Nov 2006,
Colombo: Sri Lanka
Roa (2005) Relaciones entre disponibilidad de agua, usos múltiples del agua y usos del suelo:
caso de estudio de la microcuenca Los Sainos, Unpublished MSc., Project Report, Universidad
del Valle: Cali, Colombia
Roa, C. & Brown, S. (2009) Assessing water use and quality through youth participatory research
in a rural Andean watershed, Journal of Environmental Management, Vol. 90 pp. 3040–3047

__________________________________________________________________________________________________________
Balancing consumption and availability in a multiple uses of water system 123
Rockström J, Nuhu Hatibu, Theib Oweis and Suhas P Wani (2007) ―Managing Water in Rainfed
Agriculture‖, in David Molden (ed.) Water for Food, Water for Life: A Comprehensive Assessment
of Water Management in Agriculture, Earthscan, London: UK
Rockström, J., Barron, J., Fox, P. (2003) ―Water Productivity in Rainfed Agriculture: Challenges
and Opportunities for Smallholder Farmers in Drought-Prone Tropical Agroecosystems‖, in: J.W,
Kijne, R., Barker, D., Molden (eds.) Water Productivity in Agriculture: Limits and Opportunities for
Improvement. Wallingford: UK
Rodríguez, K. (2005) Medición del Impacto de un Programa de Reforma Agraria en Colombia.
Centro de Estudios sobre Desarrollo Económico, Universidad de Los Andes, No 2005 – 28.
http://economia.uniandes.edu.co/investigaciones_y_publicaciones/CEDE/Publicaciones/documen
tos_cede/2005/medicion_del_impacto_de_un_programa_de_reforma_agraria_en_colombia
(Accessed 6 August, 2010)
Rojas, L. (2008) Programa para Acceso Universal en Sistemas de Abastecimiento de Agua en
Colombia. Viceministerio de Agua y Saneamiento. Ministerio de Ambiente, Vivienda y Desarrollo
Territorial (MAVDT): Colombia.
Roman, M. (2002) ―Small Community Water Services in Central and Eastern European Countries –
Situation, Challenges, Needs and Developments‖ in Jo Smet and Christine van Wijk (eds.) Small
Communities Water Supplies – Technology, People and Partnerships, International Water and
Sanitation Centre (IRC): Delft, The Netherlands.
Rosales, C. (2001) Sobre el Comportamiento Sísmico de los Depósitos de Suelos del Área de
Cañaveralejo, Cali, Colombia, MSc., Project Report, Universidad del Valle: Cali, Colombia.
Rosegrant, M., Cai, X and Cline, S. (2002) World Water and Food to 2025: Dealing with Scarcity,
International Food Policy Research Institute, Washington: USA
Ruben, R & van der Berg, M. (2001) Non-farm employment and poverty alleviation of rural farm
households in Honduras, World Development, Vol. 29, No 3, pp. 549 - 560
Scheelbeek, P. (2005) Water quality, multiple uses and water division in the Lege Dini watershed
area, Ethiopia; Towards a Multiple Use System Approach, Unpublished Msc. Research project.
Irrigation and Water Engineering Group, Wageningen University, the Netherlands,
http://www.musgroup.net/page/972 (Accessed May 22 2010)
Semana (2009) Agro-Ingreso para Pobres... Revista Semana, October 10 de 2009.
http://www.semana.com/wf_imprimirarticulo.aspx?idart=130595 (Accessed On November 15
2009)
Semanario Voz (2009) El Escándalo de Agro Ingreso Seguro. Semanario Voz, October 7
2009.http://www.prensarural.org/spip/spip.php?article3020. (Accessed 15 November 2009)
Senzanje, A. (2008) Multiple use of water and water productivity of communal small dams in the
Limpopo basin, Zimbabwe, Irrigation and Drainage Systems, Vol. 22, No 3-4, pp. 225-237.
Shen, J. (2010) Average Water Use per Person per Day. Data360.
http://www.data360.org/dsg.aspx?data_set_group_id=757 (Accessed 21 July 2010)
Smits, S., Mejía, T., Rodríguez, S. & Suazo, D. (2010) Effects of Multiple-Use of Water on Users‘
Livelihoods and Sustainability Rural Water Supply Services in Honduras, Waterlines, Vol. 29, No1
__________________________________________________________________________________________________________
Balancing consumption and availability in a multiple uses of water system 124
Smits, S., Renwick, M., Renault, D., Butterworth, J. & van Koppen, B. (2008 a) From practice to
policy: background paper. In J. Butterworth, M. Keijzer, M., I. Smout & I. Hagos (ed.) (2008)
Proceedings of an international symposium held in Addis Ababa, Ethiopia, 4-6 November 2008.
Multiple Use Water Services (MUS) Group.
Sulser, T., Ringler, C., Zhu T., Msangi, S., Bryan, E., Rosegrant, M. (2009) Green and Blue Water
Accounting in the Limpopo and Nile Basins, Implications for Food and Agricultural Policy,
Environment and Production Technology, IFPRI Discussion Paper 00907, International Food
Policy and Research Institute (IFPRI), Washington, D.C.: USA
Trigg, M. (2000) Domestic water consumption and its determination in rural Guatemala, Water and
Environmental Management, Journal of the Institution of Water and Environmental Management,
Vol. 14, pp. 45-50.
UN (2002) Johannesburg Declaration on Sustainable Development, United Nations
http://www.un.org/esa/sustdev/documents/wssd_poi_pd/english/poi_pd.htm (19 November 2009)
UN (2006) Millennium Development Goals, Millennium Project – Historic Page, United Nations.
http://www.unmillenniumproject.org/goals/gti.htm. (21 November 2009)
UNDP (2003) Human Development Report 2003: Millennium Development Goals: A compact
among nations to end human poverty, United Nations Development Programme, Oxford
University Press: New York
UNDP (2006) Human Development Report 2006: Beyond Scarcity: Power, Poverty and the Global
Water Crisis, United Nations Development Programme (UNDP): New York.
UNDP (2007) Human Development Report 2007/2008: Fighting climate change: Human solidarity
in a divided world, United Nations Development Programme (UNDP): New York
UNEP (2007) Global Environment Outlook Geo4, United Nations Environment Programme
(UNEP): Malta http://www.unep.org/geo/. (Accessed 20 July, 2010)
UNC (n.d.) Guide to Writing Literature Reviews in Political Science and Public Administration
Department of Political Science, University of North Carolina,
http://www.politicalscience.uncc.edu/jwalsh/litreviews.html (Accessed 20 May 2010)
University of Edinburgh (2010) Research data management guidance page
http://www.ed.ac.uk/schools-departments/information-services/services/research-support/data-
library/research-data-mgmt. (Accessed June 6th 2009)
Upadhyay, B. (2005) Gendered livelihoods and multiple water use in north Gujara, Agriculture and
Human Values, Vol. 22, No 4, pp. 411- 420.
Urrutia, N. (2006) Sustainable Management after Irrigation System Transfer - Experiences in
Colombia – The RUT Irrigation District, PhD Dissertation, Unesco-IHE Institute For Water
Education, The Netherlands, Taylor & Francis Group plc, London, UK
Useche, L. & Mesa, D. (2006) Una Introducción a la Imputación de Valores Perdidos. Terra Nueva
Etapa, Vol. 22, No 31. Caracas, Venezuela
Van Koppen, B. and Smits, S. (2010) Multiple-Use Water Services: Climbing the Water Ladder.
Waterlines Vol. 29 No. 1
__________________________________________________________________________________________________________
Balancing consumption and availability in a multiple uses of water system 125
Van Koppen, B.; Moriarty, P.; Boelee, E. (2006) Multiple-Use Water Services to Advance the
Millennium Development Goals, Research Report 98. International Water Management Institute
(IWMI): Colombo, Sri Lanka
Van Koppen, B.; Smits, S.; Moriarty, P.; Penning de Vries, F.; Mikhail, M.; Boelee, E. (2009)
Climbing the Water Ladder: Multiple-Use Water Services for Poverty Reduction, Tp Series No.
52, International Water and Sanitation Centre (IRC), International Water Management Institute
(IWMI): The Hague, The Netherlands
Vazifedoust, M., van Dam, J. C., Feddes, R. A., & Feizi, M. (2008) Increasing water productivity of
irrigated crops under limited water supply at field scale. Agricultural Water Management, Vol. 95,
No 2, pp. 89-102.
Whittington, D, Mu, X. and Roche, R. (1990) Calculating the Value of Time Spent Collecting Water:
Some Estimates for Ukunda, Kenya. World Development, Vol. 18, No 2, 1990, pp. 269 -280
Whittington, D., Lauria, D.T. and Mu, X. (1991) A Study of Water Vending and Willingness to Pay
for Water in Onitsha, Nigeria, World Development, Vol. 19, No 2-3, pp. 179-198
World Bank (2004) Colombia Recent Economic Developments in Infrastructure, Volume I:
Executive Summary, Latin America and the Caribbean Report No. 30379-Co. http://www-
wds.worldbank.org/external/default/wdscontentserver/wdsp/ib/2004/11/12/000012009_20041112
100212/rendered/pdf/303790v1.pdf (Accessed 6 August 2004)
World Bank (2009) Global Monitoring Report: A Development Emergency, World Bank Publishers:
Washington DC
World Bank (2010) Country Brief: Colombia page http://go.worldbank.org/79b1v6ihq0 (Accessed 8
August, 2010)
Yang J.C, Pattanayak, S. Reed Jonson, F., Mansfield, C. Van Den Berg, C., Jones, K. (2006),
Unpackaging Demand for Water Service Quality: Evidence from Conjoint Surveys in Sri Lanka,
World Bank Policy Research Working Paper 3817. http://www-
wds.worldbank.org/servlet/WDSContentServer/WDSP/IB/2006/01/12/000016406_200601120924
00/Rendered/PDF/wps3817.pdf (Accessed 16 May 2010)
Yin, R. (2003) Case Study Research Design Methods, Third Edition, Applied Social Research
Methods Series, Vol. 5, Sage Publications Ltd: London, UK

__________________________________________________________________________________________________________
Balancing consumption and availability in a multiple uses of water system 126
APPENDIX
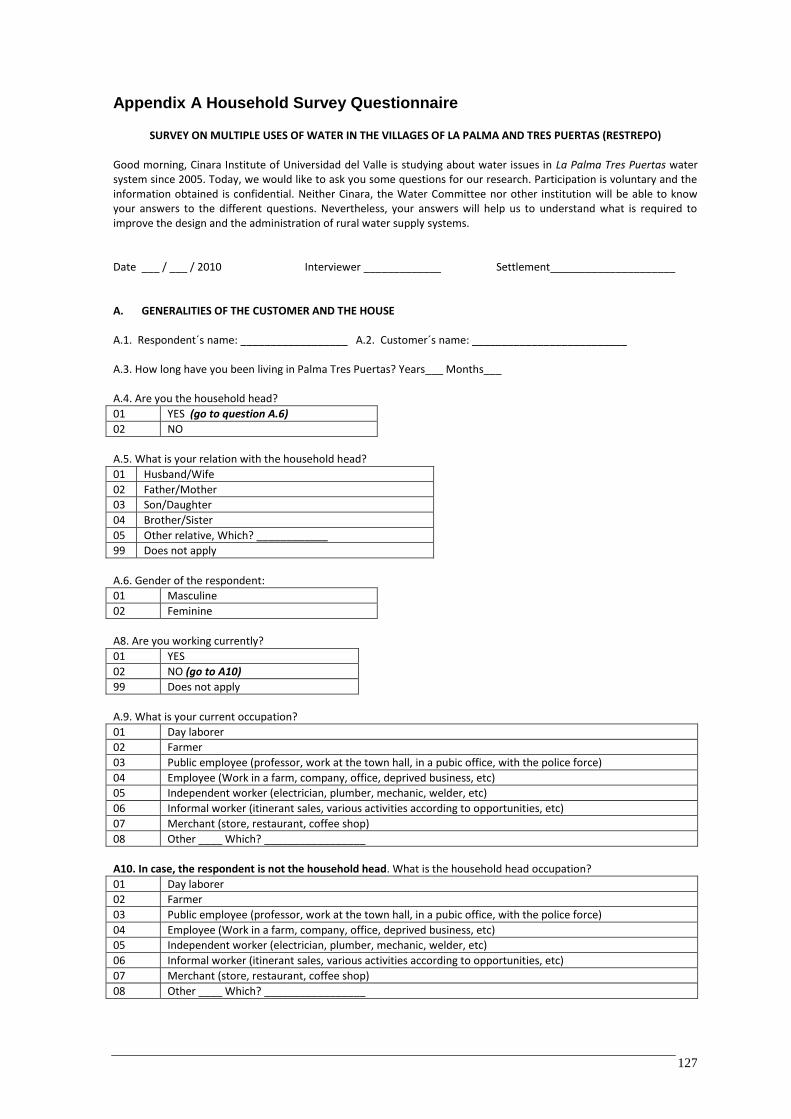
127
Appendix A Household Survey Questionnaire
SURVEY ON MULTIPLE USES OF WATER IN THE VILLAGES OF LA PALMA AND TRES PUERTAS (RESTREPO)
Good morning, Cinara Institute of Universidad del Valle is studying about water issues in La Palma Tres Puertas water system since 2005. Today, we would like to ask you some questions for our research. Participation is voluntary and the information obtained is confidential. Neither Cinara, the Water Committee nor other institution will be able to know your answers to the different questions. Nevertheless, your answers will help us to understand what is required to improve the design and the administration of rural water supply systems. Date ___ / ___ / 2010 Interviewer _____________ Settlement_____________________
A. GENERALITIES OF THE CUSTOMER AND THE HOUSE A.1. Respondent´s name: __________________ A.2. Customer´s name: __________________________ A.3. How long have you been living in Palma Tres Puertas? Years___ Months___ A.4. Are you the household head?
01 YES (go to question A.6)
02 NO
A.5. What is your relation with the household head?
01 Husband/Wife
02 Father/Mother
03 Son/Daughter
04 Brother/Sister
05 Other relative, Which? ____________
99 Does not apply
A.6. Gender of the respondent:
01 Masculine
02 Feminine
A8. Are you working currently?
01 YES
02 NO (go to A10)
99 Does not apply
A.9. What is your current occupation?
01 Day laborer
02 Farmer
03 Public employee (professor, work at the town hall, in a pubic office, with the police force)
04 Employee (Work in a farm, company, office, deprived business, etc)
05 Independent worker (electrician, plumber, mechanic, welder, etc)
06 Informal worker (itinerant sales, various activities according to opportunities, etc)
07 Merchant (store, restaurant, coffee shop)
08 Other ____ Which? _________________
A10. In case, the respondent is not the household head. What is the household head occupation?
01 Day laborer
02 Farmer
03 Public employee (professor, work at the town hall, in a pubic office, with the police force)
04 Employee (Work in a farm, company, office, deprived business, etc)
05 Independent worker (electrician, plumber, mechanic, welder, etc)
06 Informal worker (itinerant sales, various activities according to opportunities, etc)
07 Merchant (store, restaurant, coffee shop)
08 Other ____ Which? _________________

128
A11. The house in which this family lives is:
01 Own
02 Rented
03 Familiar
04 Borrowed
99 Does not apply
A12. Total of people living in this house: _________ A.13. What is the total area of the homestead? _________ Ha ____ m
2 ___ Other ___
B. WATER AND LAND USE B.1. What is the water source used for each of the following domestic tasks?
Domestic tasks Water source used
Water supply system Rainwater Well Stream Other N. A.
B.1.1. Personal hygiene
B.1.2. Cooking and drinking
B.1.4. Cleaning of the house
B.1.5. Washing clothes
B.1.6. Irrigation of garden
B.2. What´s the household system to eliminate excreta?
01 Open defecation 03 Pour flush latrine 05 Discharge to natural drainage
02 Latrine 04 Toilet + Septic tank 06 Other __ Which?______________
B.3. Please indicate the following aspects regarding animal husbandry and water
Type
a. Presence
b. Quantity
c. Occupied area (Ha, m2)
d. Water source used for drinking and cleaning
Yes No Water supply system
Rainwater Well Stream Other N.A.
B.3.1. Pigs B.3.2. Chicken B.3.3. Cows B.3.4. Horses B.3.5. Other
B.4. Please indicate the following aspects regarding crops and water
Type a. Presence
b. Occupied area.
(Ha, m2)
c. Irrigation is required?
d. Frequency of irrigation/
Time
e. Months of the year
f. Irrigation method a
g. Water source used for
irrigationb Yes No Yes No
B.4.1. Coffee
B.4.2. Pineapple
B.4.3. Bean
B.4.4. Maize
B.4.5. Veg.
B.4.6. Other __________
b 1. Drip irrigation 2. Sprinklers 3. “Mateo” 4. Back pump 5. Furrow 6. Other 99. Do not apply a 1. Water supply system 2. Rainwater 3. Well 4. Stream 5. Other 99. Do not apply
C. PERCEPTION OF THE SERVICE OF WATER SUPPLY C1. What is your opinion about the water service in terms of quality and quantity?(Select one or several of the answers)
01 Bad quality
02 Few quantity
03 Does not have any problem
88 Does not know the condition of water
99 Does not apply
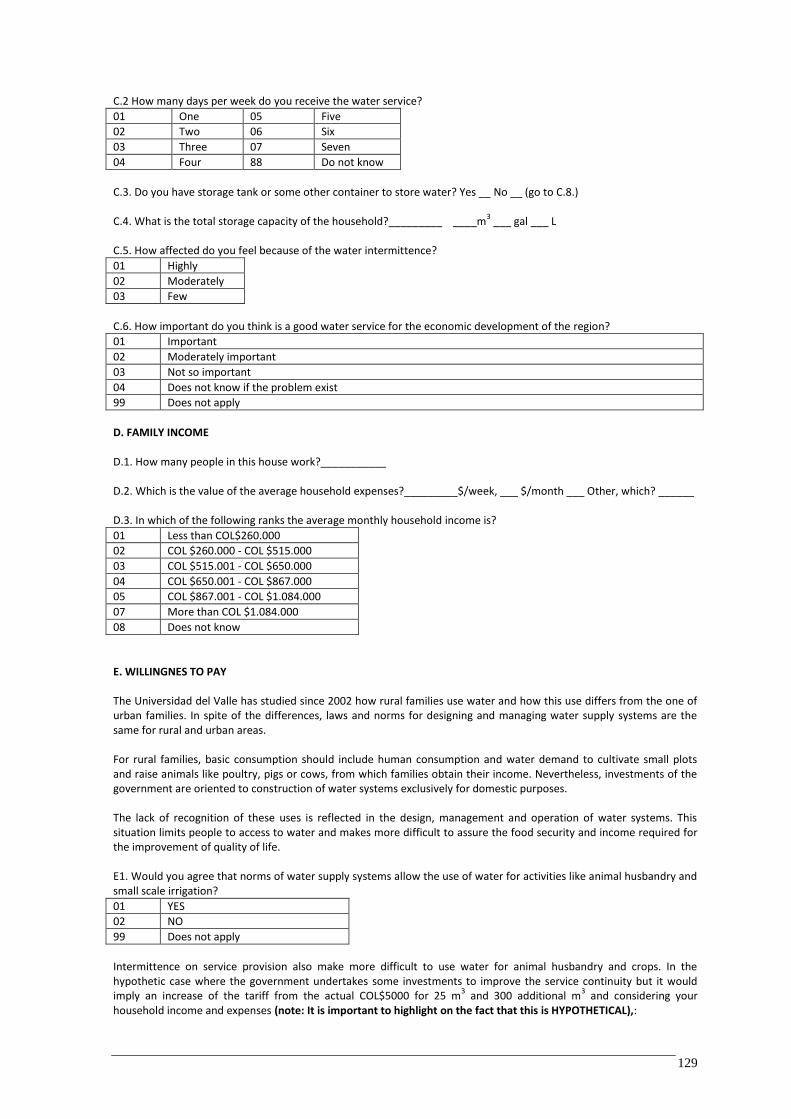
129
C.2 How many days per week do you receive the water service?
01 One 05 Five
02 Two 06 Six
03 Three 07 Seven
04 Four 88 Do not know
C.3. Do you have storage tank or some other container to store water? Yes __ No __ (go to C.8.) C.4. What is the total storage capacity of the household?_________ ____m
3 ___ gal ___ L
C.5. How affected do you feel because of the water intermittence?
01 Highly
02 Moderately
03 Few
C.6. How important do you think is a good water service for the economic development of the region?
01 Important
02 Moderately important
03 Not so important
04 Does not know if the problem exist
99 Does not apply
D. FAMILY INCOME D.1. How many people in this house work?___________ D.2. Which is the value of the average household expenses?_________$/week, ___ $/month ___ Other, which? ______ D.3. In which of the following ranks the average monthly household income is?
01 Less than COL$260.000
02 COL $260.000 - COL $515.000
03 COL $515.001 - COL $650.000
04 COL $650.001 - COL $867.000
05 COL $867.001 - COL $1.084.000
07 More than COL $1.084.000
08 Does not know
E. WILLINGNES TO PAY The Universidad del Valle has studied since 2002 how rural families use water and how this use differs from the one of urban families. In spite of the differences, laws and norms for designing and managing water supply systems are the same for rural and urban areas. For rural families, basic consumption should include human consumption and water demand to cultivate small plots and raise animals like poultry, pigs or cows, from which families obtain their income. Nevertheless, investments of the government are oriented to construction of water systems exclusively for domestic purposes. The lack of recognition of these uses is reflected in the design, management and operation of water systems. This situation limits people to access to water and makes more difficult to assure the food security and income required for the improvement of quality of life. E1. Would you agree that norms of water supply systems allow the use of water for activities like animal husbandry and small scale irrigation?
01 YES
02 NO
99 Does not apply
Intermittence on service provision also make more difficult to use water for animal husbandry and crops. In the hypothetic case where the government undertakes some investments to improve the service continuity but it would imply an increase of the tariff from the actual COL$5000 for 25 m
3 and 300 additional m
3 and considering your
household income and expenses (note: It is important to highlight on the fact that this is HYPOTHETICAL),:

130
E2. Would you agree to pay a monthly tariff of COL$7000 for 25 m3 to improve the continuity of the water service and
therefore, to be able to use water for animals and crops without having conflicts with the Water Committee?
01 YES
02 NO
99 Does not apply
E3. Considering the monthly tariff, what is the maximum monthly value that you would be willing to pay for an improvement of the service?_____________for the 25 m
3 (If the respondent says that he/she is not willing to pay any
value, go to E4; if he/she answers a value, go to E5). E4. Why you are not willing to pay any value for an improvement of the service?
01 Does not have enough money to pay
02 The municipal government must pay for this type of service
03 Is not interested in water
04 Would prefer to pay to solve another problems
05 Does not believe that the improvement can be done
06 Is satisfied with the service
07 Other. Which?
99 Does not apply
E5. Why you are willing to pay this maximum value (please read to the respondent the following options)?
01 Has enough money to pay
02 Is interested with in water
03 The water problem is critical for the locality
04 Thinks that water is fundamental to undertake his work
05 Other. Which?
99 Does not apply
E.6. Observations ____________________________________________________________________________________________________________________________________________________________________________________________________ F. WILLINGNESS TO PARTICIPATE ON AN ADDITIONAL STUDY
F.1. Would you willing to participate in an activity to investigate the use of water in your home for one day? Those activities would be exclusively for investigation purposes, and information obtained would be confidential. Would you feel disposed to participate? Yes ___ No ____.
THANKS A LOT FOR YOUR TIME!

131
Appendix B Processed information from Water Diaries
Processed information on domestic water consumption obtained from the six households monitored is included in an Excel file labelled ―Appendix B‖, contained in the CD that accompanies this document
Appendix C Water Balance Spreadsheet
Water balance for all households within the sample is included in an Excel file labelled ―Appendix C‖ contained in the CD that accompanies this document