balancing internal and external r&d strategies to improve ... · the knowledge type developed...
TRANSCRIPT

Available online at
http://www.anpad.org.br/bar
BAR, Rio de Janeiro, v. 15, n. 2,
art. 5, e170129, 2018
http://dx.doi.org/10.1590/1807-7692bar2018170129
Balancing Internal and External R&D Strategies to Improve
Innovation and Financial Performance
Fábio de Oliveira Paula1
Jorge Ferreira da Silva1
Pontifícia Universidade Católica do Rio de Janeiro, IAG - Escola de Negócios, Rio de Janeiro, RJ, Brazil1
Received 23 October 2017; received in revised form 12 June 2018 (this paper has been with the
authors for two revisions); accepted 17 June 2018; first published online 6 July 2018.
Editor’s note. Edson Ronaldo Guarido Filho served as Action editor for this article.

F. Paula, J. F. da Silva 2
BAR, Rio de Janeiro, v. 15, n. 2, art. 5, e170129, 2018 www.anpad.org.br/bar
Abstract
This research investigated the complementarity of internal and external R&D for innovation development and the
effect of innovation on the financial performance of European manufacturing firms. Using multigroup structural
equation modeling, this study partially supported that internal and external R&D are complementary in firms from
high-technology industries, whereas they are not in firms from low-technology industries. For the two groups of
firms, both internal and external R&D separately had a positive effect on innovation performance. These results
suggested that if low-tech firms, which had lower absorptive capacity than high-tech firms, want to improve their
innovation performance in the long term, they should start prioritizing internal R&D to improve their absorptive
capacity while achieving a short-term satisfactory innovation outcome. As absorptive capacity rises, more complex
strategies balancing internal and external R&D should be adopted. Contrary to expectations, the empirical analysis
indicated that innovation performance did not influence short-term financial performance for the whole sample.
However, in countries more affected by the 2008 crisis (for instance, Baltic countries, Portugal and Spain), this
effect was detected, indicating that innovation helped firms to recover faster.
Key words: innovation performance; internal R&D; external R&D; financial performance; manufacturing firms.

Balancing Internal and External R&D Strategies 3
BAR, Rio de Janeiro, v. 15, n. 2, art. 5, e170129, 2018 www.anpad.org.br/bar
Introduction
“Solve unsolved problems innovatively – previous 3M mission statement”
(Collins & Porras, 1996, p. 69)
It is commonly accepted that innovation is important for firms to help them reach their goals, but
it is not exactly a goal itself. It is also a popular belief that innovative companies are better than ones
that are not innovative. 3M seems to have noticed this fact and smartly used this belief as a marketing
tool in a former mission statement. However, innovation development, besides having a strong
marketing appeal, may help firms achieve better performance in many other ways.
Innovation helps in the acquisition of sustainable competitive advantages through the introduction
of new successful products and services or innovative processes that improve a cost-leadership position
by lowering costs and increasing profits (Ceccagnoli, 2009; Christensen & Raynor, 2013). Extensive
literature about the effects of innovation on a firm’s financial performance exists. Many authors (e.g.,
Cheng & Huizingh, 2014; Faems, Van Looy, & Debackere, 2005) empirically studied the influence of
the level of firm innovation on financial performance and concluded that a positive relationship exists
between them. Besides the impact on financial performance, innovation is essential for firm survival in
today’s uncertain environment (Teece, 2007) and it is even more important in technology-based
industries (Belderbos, Faems, Leten, & Van Looy, 2010). Concurrently, with the approach of the
relationship between innovation and financial performance, research has emerged examining different
innovation sources, which can be internal and external (Frenz & Ietto-Gillies, 2009).
Internal sources come mainly from R&D developed inside the boundaries of the company. On
the other hand, external sources can be innovations acquired from other firms, mergers, acquisitions and
collaboration with other players in the industry (Chesbrough, 2003; Faems et al., 2005). Many studies
examined the relationship among all these sources and innovation performance. The relationship
between internal R&D and innovation is positive in many of them (Belussi, Sammarra, & Sedita, 2010;
Faems et al., 2005), although it is dependent on firm structure (Arora, Belezon, & Rios, 2014) and on
the knowledge type developed (Pérez-Luño, Medina, Lavado, & Rodríguez, 2011). Another branch is
formed by studies that look for the relationship between external sources of R&D and innovation. This
relationship depends on the type of partner (Chatterji & Fabrizio, 2014; Soh & Subramanian, 2014), the
type of knowledge sought (Pérez-Luño et al., 2011) and firm absorptive capacity (Cohen & Levinthal,
1990). Absorptive capacity affects the relationship between external R&D and innovation performance
positively. As absorptive capacity rises, with higher levels of internal R&D (Tsai, 2009), internal and
external R&D would be complementary. In contrast, some papers found that they may be substitutes for
each other (Hagedoorn & Wang, 2012).
The study of the relationship between innovation and financial performance is not as extensive as
the studies associating R&D sources and innovation performance. Most studies of this type investigate
only a specific country and focus more on developed economies (e.g., Faems, De Visser, Andries, &
Van Looy, 2010). However, according to some authors, the process of accumulating innovation
capabilities and their application by firms from less developed economies might be different from the
process in developed countries. While firms in the latter countries usually have resources and
capabilities to develop radical product innovation from the beginning (Utterback & Abernathy, 1975),
firms in the former countries start their process of accumulating capabilities by copying or licensing
products from foreign firms and gradually adapt their production process while accumulating innovation
capabilities. This process can allow them to catch-up to be able to implement more sophisticated
innovations in the future (Kim, 1998).
These differences in the innovation process of firms from different countries must affect the
relationship among the different sources of innovation, innovation performance and financial
performance. So, the dearth of studies focusing on less developed countries justifies more investigation.
European countries dominated the top positions of the 2016 ranking of the most innovative countries

F. Paula, J. F. da Silva 4
BAR, Rio de Janeiro, v. 15, n. 2, art. 5, e170129, 2018 www.anpad.org.br/bar
according to the Global Innovation Index (Dutta, Lanvin, & Wunsch-Vincent, 2016), with four of the
top five countries in the ranking, and 15 countries among the 25 most innovative. However, they are not
homogeneous in their innovative stage. While some of the world’s most innovative countries are from
Europe, the continent also has countries in moderate and low innovative development stages (European
Union, 2015), which are less investigated by empirical studies than the top innovators.
Building on the literature mentioned above, this paper aims to answer the following research
questions: Do either internal or external sources of innovation impact on innovation performance?
Are they complementary? And does innovation performance impact financial performance?
Although several studies have investigated these relationships, most of them focused only on the
relationships among R&D sources and innovation performance or on the relationship between
innovation and financial performance. This study proposed a model to investigate these relationships
conjointly. Besides, different aspects are known to influence these relationships, such as the country and
the industrial sector. Most studies investigate only limited scenarios, however, we believe that different
outcomes may emerge from a study considering different dimensions. Using a sample of manufacturing
firms from 14 European countries (Bulgaria, Cyprus, Czech Republic, Spain, Croatia, Portugal,
Hungary, Slovenia, Norway, Lithuania, Romania, Italy, Slovakia and Estonia), this paper tested the
proposed model to investigate the relationships among the constructs mentioned above controlling for
industry technology intensity (high-tech manufacturing and low-tech manufacturing) and for groups of
similar countries (which have different innovation development levels).
The proposed model, with some adaptations, is also being tested in other research projects
considering other regions and industries, using different databases. The present study partially supported
that internal and external R&D are complementary in firms from high-technology industries, whereas
they are not in firms from low-technology industries. For the two groups of firms, both internal and
external R&D separately had a positive effect on innovation performance. The relationship between
innovation performance and financial performance could only be verified for Portugal, Spain, Estonia
and Lithuania, countries that present some specificities provoked by how they are recovering from the
2008 global crisis.
The remainder of the article contains the literature review, presenting the hypotheses and the
proposed model, followed by the methods section, which includes the description of the data, an
explanation of the sample selection, a description of the variables and the statistical method. Then, we
present the results, followed by a discussion and conclusions, which includes theoretical and managerial
implications, limitations and suggestions for future studies.
Literature Review
Complementarity of internal and external R&D
Internal R&D is most often mentioned in innovation management literature as causing a positive
impact on innovation performance (Belussi et al., 2010; Frenz & Ietto-Gillies, 2009; Hagedoorn &
Wang, 2012; Oerlemans, Knoben, & Pretorius, 2013). As internal R&D is mainly represented by proxies
such as R&D expenditures and R&D intensity (Hagedoorn & Wang, 2012), this positive relationship
indicates that the effort to produce internal knowledge is highly related to its effective generation.
However, the level of impact internal R&D has on innovation performance depends on the type of
innovation. Hall and Bagchi-Sen (2007) found that a high level of internal R&D is associated with high
levels of research-based innovation, which is more associated with the patenting of new technologies,
but not with high levels of product-based innovation, which is related to the introduction of or changes
in products and services. Some studies found that internal R&D is more important for process innovation

Balancing Internal and External R&D Strategies 5
BAR, Rio de Janeiro, v. 15, n. 2, art. 5, e170129, 2018 www.anpad.org.br/bar
than external R&D (Tomlinson, 2010), although a positive relationship between internal R&D and new
product development was found in some empirical studies (e.g., Stam & Wennberg, 2009).
External knowledge sources and R&D also have a central role in innovation development. Several
empirical studies confirmed that the relationship between external R&D and innovation performance is
positive (Belussi et al., 2010; Faems et al., 2005; Faems et al., 2010; Ritala, Olander, Michailova, &
Husted, 2015). This positive relationship may be caused by the easier transference of tacit and codified
knowledge, the access to new complementary assets or the sharing of R&D costs (Faems et al., 2005).
However, these results are not unanimous and some studies suggested that the relationship might be an
inverted U-shape, with lower levels when the firm has few or many types of partners and higher levels
for a moderate amount of partner types (Duysters & Lokshin, 2011). Other empirical studies did not
find a significant relationship (Belussi et al., 2010; Mowery, Oxley, & Silverman, 1996). These
contrasting results may have been caused by the coordination and monitoring costs to avoid
misappropriation, which increases with a greater number of partnerships and depends on the partner
type (Hallen, Katila, & Rosenberger, 2014).
Based on the previous discussion, one may conclude that balancing internal and external R&D is
necessary in order to have successful innovation performance. The complementarity of internal and
external R&D has been discussed in the academy (e.g., Cassiman & Veugelers, 2006). Complementary
activities bring more return if implemented conjointly than if implemented alone (Milgrom & Roberts,
1995). The complementarity between internal and external R&D would lie in the necessity of the firms
to build internal know-how to be able to identify possible projects and partners. This internal know-how
may be built by internal R&D efforts, among other internal activities, and develops a capability called
absorptive capacity (Cohen & Levinthal, 1990). According to these authors, absorptive capacity is a
firm’s capacity to recognize, acquire, assimilate and apply external knowledge. Empirical studies have
found a positive moderation of the absorptive capacity, as represented by internal R&D expenses
(Berchicci, 2013; Cohen & Levinthal, 1990; Hagedoorn & Wang, 2012) in the relationship of external
R&D and innovation (Belussi et al., 2010; Frenz & Ietto-Gillies, 2009; Hagedoorn & Wang, 2012;
Oerlemans et al., 2013). These led us to propose the following hypothesis.
Hypothesis 1. A firm’s internal R&D level and its external R&D level are complementary in their
contribution to improve the firm’s innovation performance.
Innovation performance and financial performance
Innovating is currently viewed as an effective strategy to improve firm performance. The way a
firm uses its internal and external knowledge sources to develop innovation, conjointly with the
environment, the industry structure, the firm’s characteristics and its overall strategies defines the
amount of any innovation’s rents it will appropriate, and the amount that will be appropriated by
suppliers, clients and imitators (Hurmelinna-Laukkanen & Puumalainen, 2007). An effective
introduction of process and product innovation followed by the correct use of appropriability
mechanisms should promote a better financial performance for the innovative firm (Ceccagnoli, 2009).
Product innovation may be a source of sustainable competitive advantage and provide a better
position in the market through the launching of better quality and lower cost products (Ateljević &
Trivić, 2016), which allow the firm to fill gaps in demand (Galindo & Méndez, 2014) and increase its
market-share (Leskovar-Spacapan & Bastic, 2007). Process innovation, in its turn may promote gains
in productivity (Terjesen & Patel, 2017) and enables cost reduction by implementing improvements in
the production process (Moutinho, Au-Yong-Oliveira, Coelho, & Manso, 2015). Radical innovations
even have the power to change the whole industry, by transforming new ventures in industry leaders
and moving incumbents out (Hill & Rothaermel, 2003; Schoenmakers & Duysters, 2006). For these
reasons, among others, today’s environment is very uncertain, and innovation is one of the strategies
that may contribute to firm survival (Teece, 2007). Corroborating the previously presented arguments,
several authors empirically detected a positive impact that innovation performance has on firm financial
performance (Du, Leten, & Vanhaverbeke, 2014; Faems et al., 2010; Tomlinson, 2010). Therefore,
F. Paula, J. F. da Silva 6
BAR, Rio de Janeiro, v. 15, n. 2, art. 5, e170129, 2018 www.anpad.org.br/bar
innovative products and services that effectively gain an important share in a firm’s turnover could,
consequently, guarantee a superior performance for the firm, reflected in some indicators such as
revenue and market share growth. Process innovation, on the other hand, may increase productivity and
lower production costs, promoting a growth in the firm’s profits.
Hypothesis 2. The level of a firm’s innovation performance positively influences its financial
performance.
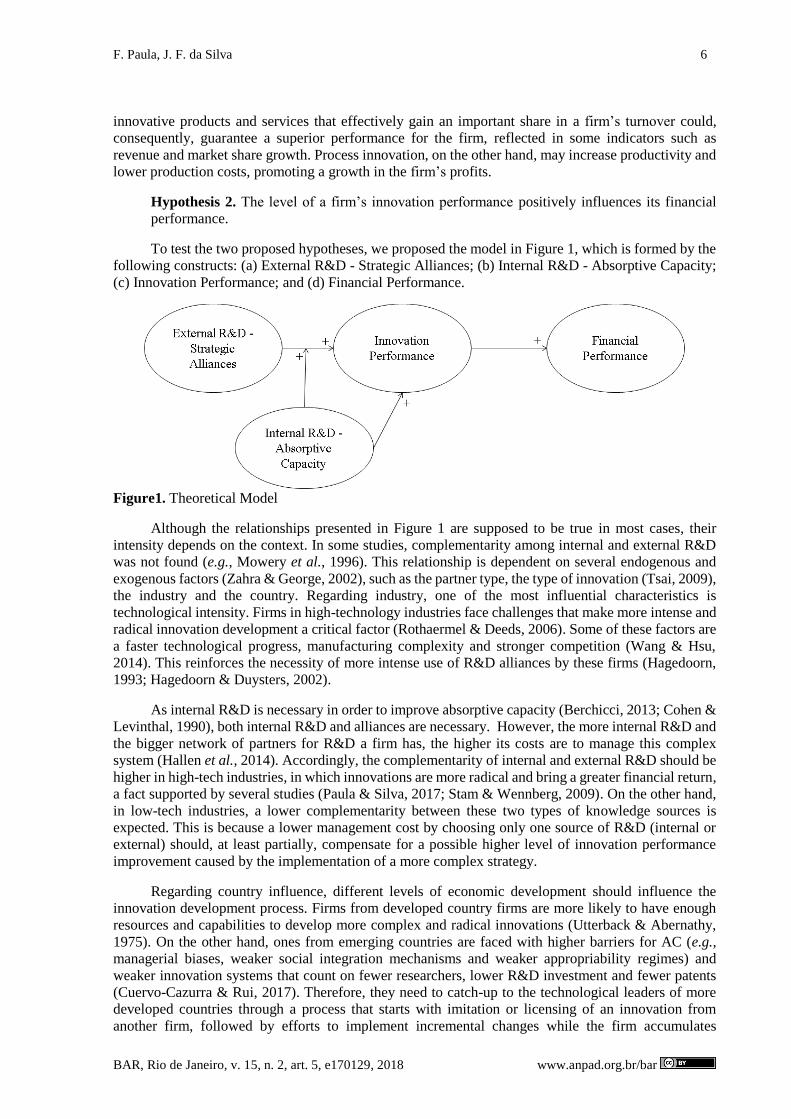
To test the two proposed hypotheses, we proposed the model in Figure 1, which is formed by the
following constructs: (a) External R&D - Strategic Alliances; (b) Internal R&D - Absorptive Capacity;
(c) Innovation Performance; and (d) Financial Performance.
Figure1. Theoretical Model
Although the relationships presented in Figure 1 are supposed to be true in most cases, their
intensity depends on the context. In some studies, complementarity among internal and external R&D
was not found (e.g., Mowery et al., 1996). This relationship is dependent on several endogenous and
exogenous factors (Zahra & George, 2002), such as the partner type, the type of innovation (Tsai, 2009),
the industry and the country. Regarding industry, one of the most influential characteristics is
technological intensity. Firms in high-technology industries face challenges that make more intense and
radical innovation development a critical factor (Rothaermel & Deeds, 2006). Some of these factors are
a faster technological progress, manufacturing complexity and stronger competition (Wang & Hsu,
2014). This reinforces the necessity of more intense use of R&D alliances by these firms (Hagedoorn,
1993; Hagedoorn & Duysters, 2002).
As internal R&D is necessary in order to improve absorptive capacity (Berchicci, 2013; Cohen &
Levinthal, 1990), both internal R&D and alliances are necessary. However, the more internal R&D and
the bigger network of partners for R&D a firm has, the higher its costs are to manage this complex
system (Hallen et al., 2014). Accordingly, the complementarity of internal and external R&D should be
higher in high-tech industries, in which innovations are more radical and bring a greater financial return,
a fact supported by several studies (Paula & Silva, 2017; Stam & Wennberg, 2009). On the other hand,
in low-tech industries, a lower complementarity between these two types of knowledge sources is
expected. This is because a lower management cost by choosing only one source of R&D (internal or
external) should, at least partially, compensate for a possible higher level of innovation performance
improvement caused by the implementation of a more complex strategy.
Regarding country influence, different levels of economic development should influence the
innovation development process. Firms from developed country firms are more likely to have enough
resources and capabilities to develop more complex and radical innovations (Utterback & Abernathy,
1975). On the other hand, ones from emerging countries are faced with higher barriers for AC (e.g.,
managerial biases, weaker social integration mechanisms and weaker appropriability regimes) and
weaker innovation systems that count on fewer researchers, lower R&D investment and fewer patents
(Cuervo-Cazurra & Rui, 2017). Therefore, they need to catch-up to the technological leaders of more
developed countries through a process that starts with imitation or licensing of an innovation from
another firm, followed by efforts to implement incremental changes while the firm accumulates

Balancing Internal and External R&D Strategies 7
BAR, Rio de Janeiro, v. 15, n. 2, art. 5, e170129, 2018 www.anpad.org.br/bar
technological capabilities. Only after a certain level of accumulated capabilities, a firm catches-up to a
level in which it can implement more radical innovations (Kim, 1998). In consequence of this
accumulation process, firms from less technologically developed countries are supposed to be stages
behind the ones from more developed countries. This should present a stronger complementarity
between internal and external R&D, and any innovations developed should have a more rapid and strong
influence on their financial performance.
Methods
Data source, sample and variable description
To test the model in Figure 1 for manufacturing firms of the cited European countries - Bulgaria,
Cyprus, Czech Republic, Spain, Croatia, Portugal, Hungary, Slovenia, Norway, Lithuania, Romania,
Italy, Slovakia and Estonia - we used data from Eurostat’s CIS 2010 – Community Innovation Survey
(Eurostat, n.d.a). This survey provides some indicators about innovation activities and financial
performance of European firms for 2008, 2009 and 2010. For this study, we only considered
manufacturing firms, based on the NACE Rev. 2.0 classification (Eurostat, 2016), that answered the
survey with no missing values and which had declared that they had developed at least one product or
process innovation in the period, had an ongoing innovation project by the end of 2010 or had abandoned
or suspended some innovation project in the period between 2008 and 2010. As the firm response rate
in CIS 2010 varied for each country, we calculated the number of firms by country in the final sample
proportionally to a total number of manufacturing firms each country effectively has, based on the
number of firms in the original sample divided by the response rates. The cases were randomly selected
from each country. The total number of firms by country before (total sample) and after this final
selection (weighted sample) is presented in Table 1.
Table 1
Sample of Manufacturing Firms by Country
Country
GII
(country)
GII
(group)
Total
sample
(country)
Weighted
sample
(country) Group
Total
sample
(group)
Weighted
sample
(group)
Bulgaria 38 43 1,509 50 1 1,783 141
Romania 48 274 91 1
Italy 29 29 731 731 2 731 731
Portugal 30 29 1,496 209 3 9,083 1,336
Spain 28 7,587 1,127 3
Estonia 24 30 478 30 4 709 59
Lithuania 36 231 29 4
Croatia 47 37 535 53 5 1,144 90
Cyprus 31 162 7 5
Slovenia 32 447 30 5
Continues

F. Paula, J. F. da Silva 8
BAR, Rio de Janeiro, v. 15, n. 2, art. 5, e170129, 2018 www.anpad.org.br/bar
Table 1 (continued)
Country
GII
(country)
GII
(group)
Total
sample
(country)
Weighted
sample
(country) Group
Total
sample
(group)
Weighted
sample
(group)
Czech Republic 27 33 1,094 202 6 1,976 306
Hungary 33 671 76 6
Slovakia 38 211 28 6
Norway 22 22 181 83 7 181 83
Total 15,607 2,746
Table 2 lists the constructs with their respective proxies and presents a description of them and
their formulas. All constructs are reflexive. The models were tested separately with two control variables
(through a multigroup SEM analysis). The first control variable was the industry’s technological
intensity, which is central for testing hypothesis 1. Manufacturing industries were classified as high-
tech (HT) or low-tech (LT), with HT representing the set of high-tech and medium high-tech industries
according to NACE Rev. 2.0 and LT the set of low-tech and medium-low-tech industries (Eurostat,
n.d.b). Table 3 shows the list of industries from NACE 2.0 classified into HT and LT groups.
Table 2
Constructs and Proxies
Construct Proxy name Proxy format
Innovation
Performance
(IP)
% Turnover from new products or services - %_TURN 0 to 100%
Introduction of product innovation – PRODINOV Yes/No
Introduction of process innovation – PROCINOV Yes/No
Innovative degree of product innovation –
RADPRODINOV
0- Did not introduce
product innovation
1- New to the firm
2- New to the market
Innovative degree of process innovation –
RADPROCINOV
0- Did not introduce
process innovation
1- New to the firm
2- New to the market
Innovation impact:
- Increase range of goods or services – ORANGE
- Replace outdated products or processes - OREPL
- Enter new markets or increase market share - ONMOMS
- Improve quality of goods or services - OQUA
- Improve flexibility for producing goods or services -
OFLEX
- Increase capacity for producing goods or services -
OCAP
- Reduce labour costs per unit output - OLBR
- Reduce material and energy costs per unit output -
ORME
- Reduce environmental impacts - OREI
- Improve health or safety of your employees – OHESY
0- Not relevant
1- Low
2- Medium
3- High
Continues

Balancing Internal and External R&D Strategies 9
BAR, Rio de Janeiro, v. 15, n. 2, art. 5, e170129, 2018 www.anpad.org.br/bar
Table 2 (continued)
Construct Proxy name Proxy format
Innovation
Performance
(IP)
Importance of the partnership/source of information by
partner type:
- Suppliers - SSUP
- Clients - SCLI
- Competitors - SCOM
- Consultants, commercial labs, or private R&D institutes -
SINS
- Universities - SUNI
- Government - SGMT
- Conferences, trade fairs and exhibitions - SCON
- Scientific journals and other publications - SJOU
- Professional and industry associations – SPRO
0- Not relevant
1- Low
2- Medium
3- High
Financial
Performance
(FP)
Turn. growth – turn_growth Turn. 2010/Turn.2008-1
Firm growth – emp_growth Num. Emp.2010/Num.
Emp.2008 – 1
Internal
R&D -
Absorptive
Capacity
(Int R&D)
Internal R&D spending/total turnover – rrdinx_rat 0 to 100%
R&D training – RTR Yes/No
Importance of internal R&D as a source of information –
SENTG
0- Not relevant
1- Low
2- Medium
3- High
Table 3
List of LT and HT Industries
Groups
Manufacturing Industries
Classification
NACE 2.0
2-digit
codes Industry description
HT High-technology 21 Manufacture of basic pharmaceutical products and
pharmaceutical preparations
26 Manufacture of computer, electronic and optical products
Medium-high technology 20 Manufacture of chemicals and chemical products
27 to 30 Manufacture of electrical equipment; Manufacture of
machinery and equipment n.e.c.; Manufacture of motor
vehicles, trailers and semi-trailers; Manufacture of other
transport equipment
LT Medium-low technology 19 Manufacture of coke and refined petroleum products
22 to 25 Manufacture of rubber and plastic products; Manufacture of
other non-metallic mineral products; Manufacture of basic
metals; Manufacture of fabricated metals products, excepts
machinery and equipment
Continues

F. Paula, J. F. da Silva 10
BAR, Rio de Janeiro, v. 15, n. 2, art. 5, e170129, 2018 www.anpad.org.br/bar
Table 3 (continued)
Groups
Manufacturing Industries
Classification
NACE 2.0
2-digit
codes
Industry description
Low technology 33 Repair and installation of machinery and equipment
10 to 18 Manufacture of food products, beverages, tobacco products,
textile, wearing apparel, leather and related products, wood
and of products of wood, paper and paper products, printing
and reproduction of recorded media;
31 to 32 Manufacture of furniture; Other manufacturing
Note. Source: adapted from Eurostat. (n.d.b). Aggregations of manufacturing based on NACE Rev. 2. Retrieved January 20,
2016, from http://ec.europa.eu/eurostat/cache/metadata/Annexes/htec_esms_an3.pdf
Second, to control for country-specific effects, countries were grouped according to a mix of
regional and economic characteristics (see Table 1 for the list of countries and their respective groups)
as follows: Group 1 (Romania and Bulgaria) - Danubian countries that were considered modest
innovators according to the 2015 Innovation Union Scoreboard (European Union, 2015); Group 2 (Italy)
– Italy was considered alone due to its economic importance; Group 3 (Portugal and Spain) – the
countries from the Iberian Peninsula; Group 4 (Estonia and Lithuania) – the Baltic states; Group 5
(Cyprus, Croatia and Slovenia) – Mediterranean countries, excluding Italy and the Iberian Peninsula;
Group 6 (Czech Republic, Hungary and Slovakia) - Danubian countries that were considered moderate
innovators according to the 2015 Innovation Union Scoreboard; and Group 7 (Norway) – a Scandinavian
country. Norway is the only country in the sample that is not a member state of the European Union.
However, we decided to include it in the research because it is part of the Schengen area, which has
officially abolished passport and all other types of border control at mutual borders (European
Commission, 2008). Table 1 also shows the average GII of each group, which varies from 22 (Norway)
to 43 (Bulgaria and Romania). This variation demonstrates the differences in the innovative environment
of the country groups, which should influence the relationships to be tested.
Statistical method
The first step of the analysis involved conducting an exploratory factor analysis (EFA) with all
the model variables to check the existence of common-method bias. We considered a total variance
explained in one common factor higher than 50% as a cut-off to consider common-method bias to be an
issue (Podsakoff, MacKenzie, Lee, & Podsakoff, 2003). We also conducted a second test to detect
common-method bias, proposed by the same authors, which consisted of running a CFA with an
additional construct in which we made all variables load equally. The square of this load is the common
variance and if it is high, common-method bias might be an issue.
As the second step, we conducted another EFA to verify the possibility for reducing the
constructs’ dimensions. The number of factors was chosen by the scree-plot method (checking for which
number of factors a plot forms an elbow) and guaranteeing that the factors explain at least 60% of the
variables’ variance (Hair, Black, Babin, Anderson, & Tatham, 2006). After this, we applied a varimax
rotation and calculated the final factors, whereupon the dimension reduction was applicable, with
summated-scales of the variables with factor loadings equal or higher than 0.7 (Hair et al., 2006).
Following, we proceeded with validation of the measurement model by confirmatory factor analysis
(CFA). We also conducted validity checks. For convergent validity, we tested if the standardized loads
of the variables inside each construct were higher than 0.7 (Nunnally, 1978), and if their average
variance extracted (AVE) was higher than 0.5 (Fornell & Larcker, 1981). For discriminant validity, the
AVE of one construct is supposed to be higher than the squared estimated correlations between two
constructs (Hair et al., 2006). For nomological validity, the between construct covariances should be
according to the theory. The construct reliability (CR) should be higher than 0.7 for each construct to
indicate construct reliability (Fornell & Larcker, 1981).
Balancing Internal and External R&D Strategies 11
BAR, Rio de Janeiro, v. 15, n. 2, art. 5, e170129, 2018 www.anpad.org.br/bar
To test the hypotheses and confirm the relationships among the constructs, we used Bayesian
structural equation modeling (SEM). Bayesian Estimation was chosen to run the CFA and SEM as this
estimation type has several advantages over others, such as maximum likelihood estimation. For
instance, it: (a) is not based on the normality of the variables; (b) works better with smaller samples; (c)
does not suppose a linear relationship; and (d) considers previous knowledge by demanding the
imputation of a prior distribution, which may be a result of previous studies (Kruschke, Aguinis, & Joo,
2012). We used a convergence statistic below 1.1 as acceptable (Gelman, Carlin, Stern, & Rubin, 2014)
and a confidence interval of 95% for the regression weights. We used the mean-centering technique
(Little, Bovaird, & Widaman, 2006) to represent the effect of the moderation relationship between the
constructs Internal R&D - Absorptive Capacity and External R&D - Strategic Alliances on the
Innovation Performance. This moderation was used to test the complementarity of internal and external
R&D.
According to this technique, we added a new moderation construct to the SEM that loaded the
innovation performance construct. This constructs’ variables were calculated by multiplying all factors
of the construct absorptive capacity with the factors of strategic alliances and applying the Z-score. We
also correlated the residuals of the variables that were formed by the product of a common original
factor (e.g., all variables formed by the multiplication of the first factor of absorptive capacity should
have its residuals correlated) in the SEM. Because the firms from Italy do not have emp_growth
information, we chose not to use Future Financial Performance as a latent variable, but instead ran two
separate models using the variables turn_growth and emp_growth as endogenous variables representing
financial performance. For the model that tested turn_growth, we used all firms in the weighted sample
and for the one that tested emp_growth, we used the same sample, excluding the Italian firms.
Results
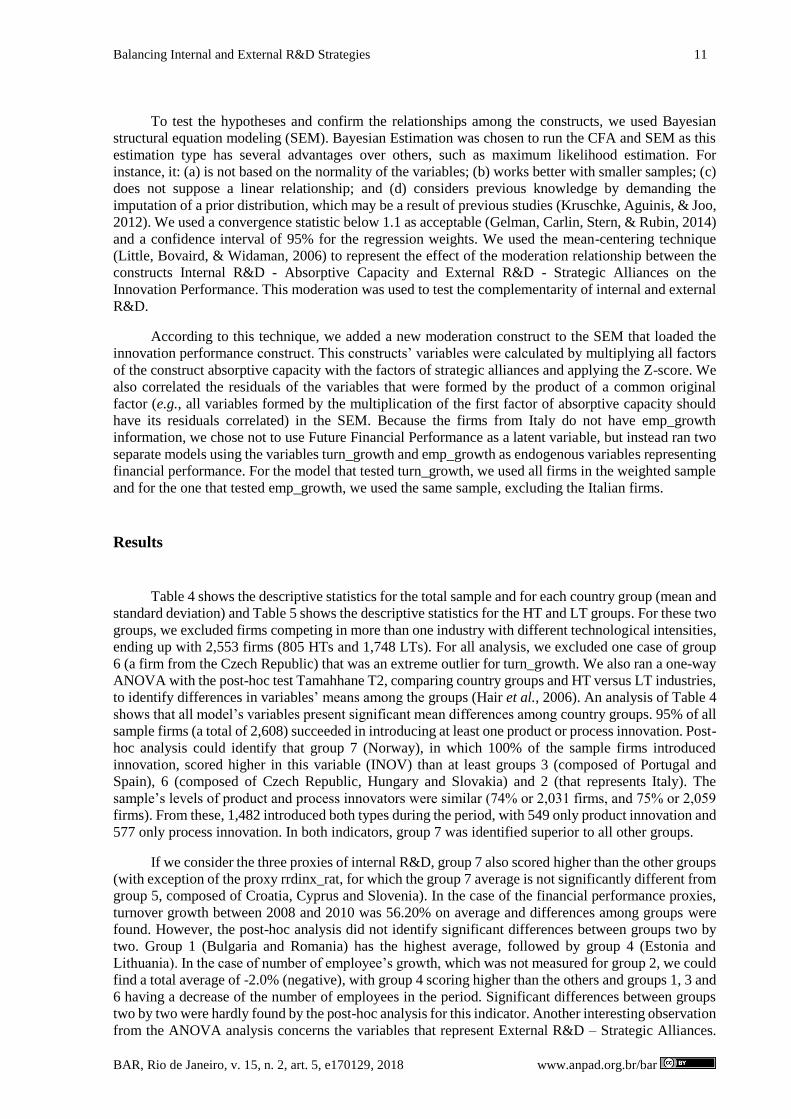
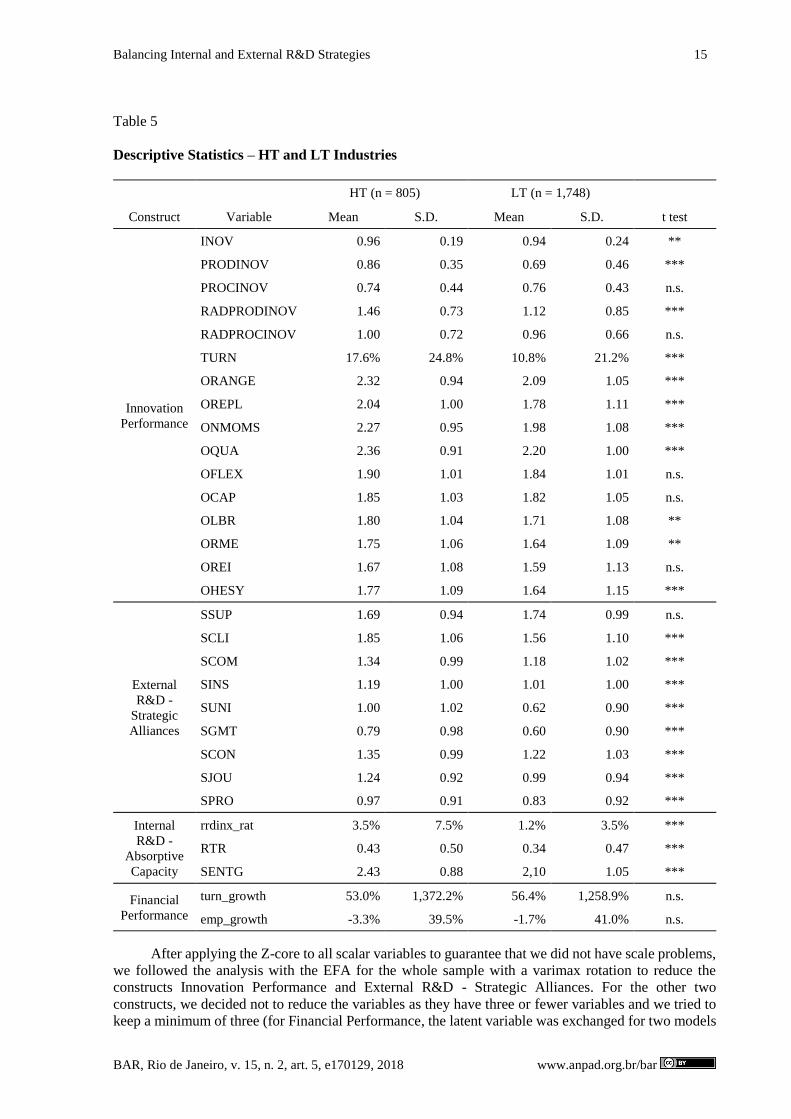
Table 4 shows the descriptive statistics for the total sample and for each country group (mean and
standard deviation) and Table 5 shows the descriptive statistics for the HT and LT groups. For these two
groups, we excluded firms competing in more than one industry with different technological intensities,
ending up with 2,553 firms (805 HTs and 1,748 LTs). For all analysis, we excluded one case of group
6 (a firm from the Czech Republic) that was an extreme outlier for turn_growth. We also ran a one-way
ANOVA with the post-hoc test Tamahhane T2, comparing country groups and HT versus LT industries,
to identify differences in variables’ means among the groups (Hair et al., 2006). An analysis of Table 4
shows that all model’s variables present significant mean differences among country groups. 95% of all
sample firms (a total of 2,608) succeeded in introducing at least one product or process innovation. Post-
hoc analysis could identify that group 7 (Norway), in which 100% of the sample firms introduced
innovation, scored higher in this variable (INOV) than at least groups 3 (composed of Portugal and
Spain), 6 (composed of Czech Republic, Hungary and Slovakia) and 2 (that represents Italy). The
sample’s levels of product and process innovators were similar (74% or 2,031 firms, and 75% or 2,059
firms). From these, 1,482 introduced both types during the period, with 549 only product innovation and
577 only process innovation. In both indicators, group 7 was identified superior to all other groups.
If we consider the three proxies of internal R&D, group 7 also scored higher than the other groups
(with exception of the proxy rrdinx_rat, for which the group 7 average is not significantly different from
group 5, composed of Croatia, Cyprus and Slovenia). In the case of the financial performance proxies,
turnover growth between 2008 and 2010 was 56.20% on average and differences among groups were
found. However, the post-hoc analysis did not identify significant differences between groups two by
two. Group 1 (Bulgaria and Romania) has the highest average, followed by group 4 (Estonia and
Lithuania). In the case of number of employee’s growth, which was not measured for group 2, we could
find a total average of -2.0% (negative), with group 4 scoring higher than the others and groups 1, 3 and
6 having a decrease of the number of employees in the period. Significant differences between groups
two by two were hardly found by the post-hoc analysis for this indicator. Another interesting observation
from the ANOVA analysis concerns the variables that represent External R&D – Strategic Alliances.

F. Paula, J. F. da Silva 12
BAR, Rio de Janeiro, v. 15, n. 2, art. 5, e170129, 2018 www.anpad.org.br/bar
Group 7 scored higher or belongs to the group of firms that scores higher in most cases (for SSUP,
SCLI, SCOM, SINS, SUNI, SGMT, SJOU and SPRO). From all these types of strategic alliances,
collaboration with suppliers and with clients were considered the most important for the innovation
process (1.72 and 1.66 respectively out of a maximum of 3). On the other hand, collaboration with the
government (SGMT), with universities (SUNI) and with professional and industry associations (SPRO)
scored less than 1, which indicates that they were considered somehow between irrelevant and of low
relevance.
An analysis of Table 5 also shows significant mean differences between HT and LT firms. The
HT group overcome the LT group in most of the variables of the constructs innovation performance,
external R&D, and internal R&D. In the case of innovation performance, HT firms introduce more
product innovation. In the case of process innovation, there is no significant difference. On external
R&D, HT firms score higher than LT firms in all types of partners, with exception of suppliers (SSUP).
Internal R&D is also higher in LT firms, considering all the three proxies. On the other hand, financial
performance differences could not be observed between the two groups.
After, we checked the possible existence of common-method bias, using an EFA with all model
variables to generate a unique factor. This factor presented a total variance explained of 28.9%, much
lower than the limit of 50%. We also conducted a CFA with a construct representing the common-
method variance. Its common load was 0.32, representing a common variance of 10.2%, low enough to
discard the existence of common-method bias.

Balancing Internal and External R&D Strategies 13
BAR, Rio de Janeiro, v. 15, n. 2, art. 5, e170129, 2018 www.anpad.org.br/bar
Table 4
Descriptive Statistics – All Firms and by Country Group
All firms
(n = 2,745)
Group 1
(n = 141)
Group 2
(n = 731)
Group 3
(n = 1,336)
Group 4
(n = 59)
Group 5
(n = 90)
Group 6
(n = 305)
Group 7
(n = 83)
Construct Variable Mean S.D. Mean S.D. Mean S.D. Mean S.D. Mean S.D. Mean S.D. Mean S.D. Mean S.D.
Innovation
Performance
INOV 0.95* 0.23 0.97 0.17 0.95 0.21 0.93 0.25 0.95 0.22 0.96 0.21 0.94 0.23 1.00 0.00
PRODINOV 0.74*** 0.44 0.79 0.41 0.82 0.38 0.67 0.47 0.63 0.49 0.86 0.35 0.79 0.41 1.00 0.00
PROCINOV 0.75*** 0.43 0.76 0.43 0.76 0.43 0.77 0.42 0.69 0.46 0.78 0.42 0.63 0.48 1.00 0.00
RADPRODINOV 1.22*** 0.83 1.21 0.77 1.47 0.78 1.03 0.83 0.93 0.83 1.36 0.74 1.31 0.80 1.81 0.40
RADPROCINOV 0.96*** 0.68 1.09 0.76 1.16 0.79 0.83 0.52 0.95 0.75 0.97 0.84 0.74 0.80 1.67 0.47
TURN 12.6%*** 22.1% 10.0% 16.0% 27.1% 31.0% 6.8% 15.0% 4.7% 6.9% 7.4% 13.7% 8.5% 14.5% 8.5% 11.8%
ORANGE 2.17*** 1.02 2.50 0.78 2.31 0.88 1.96 1.12 2.17 1.05 2.53 0.80 2.41 0.89 2.58 0.74
OREPL 1.87*** 1.09 2.18 0.98 1.95 0.99 1.68 1.15 2.17 1.02 2.20 0.89 2.07 1.02 2.39 0.85
ONMOMS 2.09*** 1.05 2.32 0.90 2.16 0.90 1.96 1.16 2.22 0.89 2.32 0.90 2.16 0.99 2.58 0.61
OQUA 2.25*** 0.98 2.49 0.81 2.41 0.76 2.06 1.12 2.37 0.74 2.61 0.71 2.38 0.86 2.60 0.58
OFLEX 1.86*** 1.01 2.11 0.92 1.89 0.93 1.76 1.06 2.02 0.78 2.24 0.94 1.85 1.06 2.22 0.80
OCAP 1.83*** 1.05 2.11 1.02 1.79 0.96 1.77 1.11 2.08 0.84 2.11 0.98 1.83 1.07 2.11 0.81
OLBR 1.73*** 1.07 1.96 1.02 1.70 0.99 1.63 1.13 2.08 0.93 2.20 0.93 1.80 1.04 2.39 0.75
ORME 1.68*** 1.08 2.00 1.05 1.74 0.99 1.50 1.12 1.90 0.94 2.11 0.98 1.86 1.04 2.34 0.80
OREI 1.64*** 1.11 1.84 1.12 1.83 1.00 1.48 1.16 1.59 1.02 2.01 1.12 1.57 1.10 2.07 0.93
OHESY 1.70*** 1.13 2.00 1.06 1.95 0.99 1.51 1.19 1.49 1.06 2.06 1.06 1.60 1.12 2.16 0.93
Continues

F. Paula, J. F. da Silva 14
BAR, Rio de Janeiro, v. 15, n. 2, art. 5, e170129, 2018 www.anpad.org.br/bar
Table 4 (continued)
All firms
(n = 2,745)
Group 1
(n = 141)
Group 2
(n = 731)
Group 3
(n = 1,336)
Group 4
(n = 59)
Group 5
(n = 90)
Group 6
(n = 305)
Group 7
(n = 83)
Construct Variable Mean S.D. Mean S.D. Mean S.D. Mean S.D. Mean S.D. Mean S.D. Mean S.D. Mean S.D.
External R&D
- Strategic
Alliances
SSUP 1.72*** 0.98 1.94 0.86 1.77 0.88 1.58 1.06 2.02 0.99 2.08 0.92 1.81 0.86 2.30 0.64
SCLI 1.66*** 1.09 2.02 0.94 1.61 1.05 1.50 1.12 1.36 1.06 2.07 1.00 2.07 1.01 2.51 0.67
SCOM 1.24*** 1.01 1.53 1.00 1.11 0.93 1.14 1.02 1.15 0.94 1.48 1.06 1.58 1.03 1.93 0.84
SINS 1.07*** 1.01 0.96 1.02 1.33 0.97 1.00 1.03 0.80 0.94 0.71 0.94 0.93 0.94 1.33 0.94
SUNI 0.75*** 0.96 0.73 0.96 0.85 0.98 0.69 0.96 0.36 0.71 0.50 0.80 0.76 0.92 1.31 0.90
SGMT 0.67*** 0.94 0.54 0.79 0.51 0.79 0.82 1.03 0.20 0.52 0.36 0.75 0.42 0.74 1.47 0.98
SCON 1.26*** 1.02 1.52 1.08 1.34 0.96 1.10 1.03 1.44 0.99 1.33 1.11 1.53 0.95 1.46 0.86
SJOU 1.07*** 0.94 1.38 1.03 1.08 0.89 0.93 0.93 0.88 0.83 1.23 1.01 1.30 0.88 1.90 0.78
SPRO 0.88*** 0.92 0.89 0.92 0.92 0.88 0.82 0.90 0.63 0.83 0.64 0.88 0.77 0.85 2.18 0.78
Internal R&D - Absorptive
Capacity
rrdinx_rat 1.97%*** 5.18% 1.03% 2.52% 1.75% 3.67% 2.11% 5.69% 0.64% 2.57% 1.59% 7.39% 1.81% 5.00% 5.10% 8.41%
RTR 0.37*** 0.48 0.50 0.50 0.44 0.50 0.21 0.41 0.61 0.49 0.58 0.50 0.55 0.50 0.89 0.31
SENTG 2.22*** 1.01 2.18 0.93 2.27 1.02 2.15 1.03 1.85 1.06 2.27 1.02 2.33 0.92 2.75 0.46
Financial
Performance
turn_growth 56.2%* 1269.6% 385.7% 3140.5% 15.6% 516.6% 53.7% 1417.2% 224.2% 1539.0% -1.7% 28.3% 11.0% 172.3% 4.5% 37.3%
emp_growth -2.0%*** 39.9% -4.5% 38.0% - - -4.1% 27.6% 15.4% 63.8% 5.1% 29.0% -1.4% 50.6% 12.9% 102.1%
Note. ANOVA - * p < 0.1; ** p < 0.05; *** p < 0.01.
Balancing Internal and External R&D Strategies 15
BAR, Rio de Janeiro, v. 15, n. 2, art. 5, e170129, 2018 www.anpad.org.br/bar
Table 5
Descriptive Statistics – HT and LT Industries
HT (n = 805) LT (n = 1,748)
Construct Variable Mean S.D. Mean S.D. t test
Innovation
Performance
INOV 0.96 0.19 0.94 0.24 **
PRODINOV 0.86 0.35 0.69 0.46 ***
PROCINOV 0.74 0.44 0.76 0.43 n.s.
RADPRODINOV 1.46 0.73 1.12 0.85 ***
RADPROCINOV 1.00 0.72 0.96 0.66 n.s.
TURN 17.6% 24.8% 10.8% 21.2% ***
ORANGE 2.32 0.94 2.09 1.05 ***
OREPL 2.04 1.00 1.78 1.11 ***
ONMOMS 2.27 0.95 1.98 1.08 ***
OQUA 2.36 0.91 2.20 1.00 ***
OFLEX 1.90 1.01 1.84 1.01 n.s.
OCAP 1.85 1.03 1.82 1.05 n.s.
OLBR 1.80 1.04 1.71 1.08 **
ORME 1.75 1.06 1.64 1.09 **
OREI 1.67 1.08 1.59 1.13 n.s.
OHESY 1.77 1.09 1.64 1.15 ***
External
R&D -
Strategic
Alliances
SSUP 1.69 0.94 1.74 0.99 n.s.
SCLI 1.85 1.06 1.56 1.10 ***
SCOM 1.34 0.99 1.18 1.02 ***
SINS 1.19 1.00 1.01 1.00 ***
SUNI 1.00 1.02 0.62 0.90 ***
SGMT 0.79 0.98 0.60 0.90 ***
SCON 1.35 0.99 1.22 1.03 ***
SJOU 1.24 0.92 0.99 0.94 ***
SPRO 0.97 0.91 0.83 0.92 ***
Internal
R&D -
Absorptive
Capacity
rrdinx_rat 3.5% 7.5% 1.2% 3.5% ***
RTR 0.43 0.50 0.34 0.47 ***
SENTG 2.43 0.88 2,10 1.05 ***
Financial
Performance
turn_growth 53.0% 1,372.2% 56.4% 1,258.9% n.s.
emp_growth -3.3% 39.5% -1.7% 41.0% n.s.
After applying the Z-core to all scalar variables to guarantee that we did not have scale problems,
we followed the analysis with the EFA for the whole sample with a varimax rotation to reduce the
constructs Innovation Performance and External R&D - Strategic Alliances. For the other two
constructs, we decided not to reduce the variables as they have three or fewer variables and we tried to
keep a minimum of three (for Financial Performance, the latent variable was exchanged for two models

F. Paula, J. F. da Silva 16
BAR, Rio de Janeiro, v. 15, n. 2, art. 5, e170129, 2018 www.anpad.org.br/bar
and only one indicator in each, as previously mentioned). We successfully reduced the two constructs
for three variables each. In the case of Innovation Performance, the EFA presented a KMO of 0.82 and
the Bartlett’s test of sphericity was significant (p < 0.01), validating the reduction. The three factors had
a cumulative variance of 62.5% of the original variables. For External R&D - Strategic Alliances, the
EFA presented a KMO of 0.84 and the Bartlett’s test of sphericity was significant (p < 0.01). The three
factors had a cumulative variance of 67.7% of the original variables. In Table 6, we present the results
of the EFA after the varimax rotation, with the proxies that formed each of the factors (which weighed
0.7 or higher in that factor) in bold.
Table 6
EFA Results – Varimax Rotation
Innovation Performance External R&D - Strategic Alliances
Variable Factor 1 Factor 2 Factor 3 Variable Factor 1 Factor 2 Factor 3
PRODINOV 0.06 0.89 -0.03 SSUP 0.77 0.21 0.65
RADPRODINOV 0.07 0.89 0.06 SCLI 0.11 0.17 0.83
TURN -0.03 0.56 0.16 SCOM 0.18 0.19 0.79
PROCINOV 0.155 -0.14 0.92 SINS 0.72 0.21 0.24
RADPROCINOV 0.20 0.14 0.90 SUNI 0.80 0.25 0.08
ORANGE 0.46 0.55 -0.16 SGMT 0.82 0.21 0.06
OREPL 0.54 0.31 -0.03 SCON 0.13 0.82 0.28
ONMOMS 0.57 0.45 -0.17 SJOU 0.23 0.83 0.22
OQUA 0.70 0.28 -0.08 SPRO 0.36 0.69 0.19
OFLEX 0.73 -0.04 0.22
OCAP 0.73 -0.01 0.21
OLBR 0.79 -0.03 0.18
ORME 0.78 0.04 0.12
OREI 0.74 0.14 0.07
OHESY 0.76 0.11 0.10
Factor 1 of Innovation Performance was formed by a summated-scale of OQUA, OFLEX, OCAP,
OLBR, ORME, OREI and OHESY, which are variables that measure the impact of the innovations for
the firm. The other variables that represents innovation impact did not participate in any other factor.
For that reason, we called factor 1 Innovations’ Impacts (INNOV_IMP). Factor 2 was called Product
Innovation Introduction (INTRO_PROD), as it was formed by the variables that indicate if product
innovation was introduced (PRODINOV) and the degree of innovativeness of product innovation
(RADPRODINOV). For a similar reason, Factor 3 was called Process Innovation Introduction
(INTRO_PROC), as it was formed by the variables that indicate if process innovation was introduced
(PROCINOV) and the degree of innovativeness of process innovation (RADPROCINOV). In the case
of the construct External R&D - Strategic Alliances, Factor 1 was formed by collaboration with
consultants and private research centers (SINS), the government (SGMT) and universities (SUNI), being
called Alliances with Formal Institutions (ALL_INST); Factor 2 was formed by other external sources
of information such as conferences (SCON) and journals (SJOU), being called Alliances with the
Academy (ALL_ACAD); and Factor 3 was formed by alliances with clients (SCLI) and competitors
(SCOM) and was called Alliances with the Market (ALL_MKT).

Balancing Internal and External R&D Strategies 17
BAR, Rio de Janeiro, v. 15, n. 2, art. 5, e170129, 2018 www.anpad.org.br/bar
The next step of the analysis was the full-sample’s CFA considering only the three model
constructs, excluding Financial Performance. The following errors’ correlations were added, according
to the modification indexes’ analysis: ALL_INST with ALL_MKT in the construct External R&D –
Strategic Alliances, and INNOV_IMP with INTRO_PROC in the construct Innovation Performance.
Tables 7 and 8 respectively show the results of the measurement model and the tests for discriminant
validity. All the standardized regression weights of the measurement model should be 0.7 or above to
guarantee the reliability of the individual index. INTRO_PROC for Innovation Performance and
rrdinx_rat for Internal R&D – Absorptive Capacity are considerably below this value (0.37 and 0.24
respectively), but we keep them in the model as they are statistically significant (p < 0.05) and we want
to keep a minimum of three proxies for each construct to guarantee that the model is identifiable. The
minimum for the average variance extracted – AVE (0.5) and the composite reliability – CR (0.7) were
only achieved for External R&D – Strategic Alliances. However, as some authors consider that the AVE
is a very conservative criterion for convergent validity (Malhotra & Dash, 2011) and that the researcher
may decide to continue even with more than 50% of the variance of the construct explained by error,
we moved on.
The discriminant validity was not achieved, as Table 8 shows. The main diagonal, presenting the
construct’s AVE, is lower in all cases than the squared estimated correlations between the constructs,
showed in the off-diagonal elements. However, as the criteria for the evaluation of discriminant validity
depends on AVE, which as previously discussed is a very conservative criterion for validity check, and
the choices of the proxies was based on a deep literature review which clearly stated the differences
between internal and external sources of innovation and innovation performance, we considered that the
proxies of one construct might not represent another better. For nomological validity, we expected to
find significant covariances between constructs. It was found for all constructs. The covariance between
Internal R&D – Absorptive Capacity and Innovation Performance was 1.00, between External R&D –
Strategic Alliances and Innovation Performance was 0.98, and between Internal R&D – Absorptive
Capacity and External R&D – Strategic Alliances was 0.88, all significant (p < 0.05). Even with some
validity issues, we decided to follow with the analysis of the proposed model.
Table 7
Results of the CFA
Variable S.R.W. t-test
(p < 0.05) CR AVE
INNOV_IMP 0.72 *** 0.62 0.41
INTRO_PROD 0.75 ***
INTRO_PROC 0.37 ***
rrdinx_rat 0.24 *** 0.52 0.35
RTR 0.75 ***
SENTG 0.67 ***
ALL_INST 0.83 *** 0.81 0.67
ALL_MKT 0.84 ***
ALL_ACAD 0.78 ***

F. Paula, J. F. da Silva 18
BAR, Rio de Janeiro, v. 15, n. 2, art. 5, e170129, 2018 www.anpad.org.br/bar
Table 8
Discriminant Validity
IR&D ER&D IP
Internal R&D - Absorptive Capacity (IR&D) 0.35
External R&D - Strategic Alliances (ER&D) 0.88 0.67
Innovation Performance (IP) 1.00 0.98 0.41
Next, we ran the structural model using multigroup Bayesian estimation controlling by the
technological intensity of the industry. The results were summarized in Table 9. The model presents a
fourth construct, ExtR&D x IntR&D, representing the moderation of absorptive capacity (Int R&D) and
the strategic alliances (Ext R&D), as previously explained.
Table 9
Results of the SEM – HT and LT Firms
FP - turn_growth FP - emp_growth
HT (n = 805) LT (n = 1,748) HT (n = 805) LT(n = 1,748)
Relationship S.R.W. Sig. S.R.W. Sig. S.R.W. Sig. S.R.W. Sig.
Ext. R&D → IP 0.383 *** 0.391 *** 0.301 *** 0.387 ***
Int. R&D → IP 0.069 *** 0.042 n.s. 0.167 *** 0.038 n.s.
Ext R&D x Int R&D → IP 0.010 *** -0.004 n.s. -0.002 n.s. -0.001 n.s.
IP → FP -0.003 n.s. -0.007 n.s. -0.100 *** 0.045 n.s.
Note. *** p < 0.05.
Examining the standard regression weights of the relationships in Table 9, we found that, with
turn_growth as the measure of financial performance, hypothesis 1, which proposed a complementary
relationship between internal and external R&D on innovation performance, primarily on the group of
high-tech firms, was supported. The path coefficient between the moderation construct and financial
performance is 0.010 and significant (p < 0.05) for the HT group and is not significant for the LT group.
On the other hand, using emp_growth as the proxy of financial performance, the hypothesis was
rejected, with both coefficients being non-significant. In consequence, hypothesis 1 was partially
supported in this study. Hypothesis 2, which proposed that innovation performance has a positive
influence on financial performance, was rejected for both firms’ groups, using both turn_growth and
emp_growth, as shows Table 9.
Next, we conducted a SEM analysis controlling by country group (see results in Table 10). The
analysis in general did not support hypotheses 1 and 2, showing that the technological intensity of the
industry is a better control variable, as the complementarity of internal and external R&D is contingent
upon it. However, some groups presented differences regarding hypothesis 2. In the case of group 3
(Portugal and Spain), we found a positive influence of innovation performance on emp_growth as the
proxy for financial performance (0.044 for p < 0.05). In the case of group 4 (Estonia and Lithuania), this
influence was supported for turn_growth as the proxy for financial performance (0.059 for p < 0.05).

Balancing Internal and External R&D Strategies 19
BAR, Rio de Janeiro, v. 15, n. 2, art. 5, e170129, 2018 www.anpad.org.br/bar
Table 10
Results of the SEM – by Country Group
Group 1 (n = 425)
Bulgaria and Romania
Group 2 (n = 731)
Italy
FP – turn_growth FP – emp_growth FP – turn_growth FP – emp_growth
Relationship S.R.W. Sig. S.R.W. Sig. S.R.W. Sig. S.R.W. Sig.
Ext. R&D → IP 0.412 **** 0.393 **** 0.148 **** - -
Int. R&D → IP 0.310 *** 0.322 *** 0.203 *** - -
Ext. R&DxInt. R&D → IP 0.073 n.s. 0.061 n.s. 0.030 n.s. - -
IP → FP 0.011 n.s. 0.071 n.s. 0.014 n.s. - -
Group 3 (n = 8,990)
Portugal and Spain
Group 4 (n = 470)
Estonia and Lithuania
FP – turn_growth FP – emp_growth FP – turn_growth FP – emp_growth
Relationship S.R.W. Sig. S.R.W. Sig. S.R.W. Sig. S.R.W. Sig.
Ext. R&D → IP 0.356 **** 0.356 **** 0.229 **** 0.246 ****
Int. R&D → IP 0.245 *** 0.245 *** 0.149 *** 0.151 ***
Ext. R&DxInt. R&D → IP -0.128 n.s. -0.131 *** -0.014 n.s. 0.012 n.s.
IP → FP -0.009 n.s. 0.044 *** 0.059 *** 0.003 n.s.
Group 5 (n = 909)
Croatia, Cyprus and Slovenia
Group 6 (n = 1,657)
Czech Republic, Hungary and
Slovakia
FP – turn_growth FP – emp_growth FP – turn_growth FP – emp_growth
Relationship S.R.W. Sig. S.R.W. Sig. S.R.W. Sig. S.R.W. Sig.
Ext. R&D → IP 0.231 **** 0.242 **** 0.258 **** 0.259 ****
Int. R&D → IP 0.210 *** 0.188 *** 0.177 *** 0.162 ***
Ext. R&DxInt. R&D → IP -0.027 n.s. -0.010 n.s. 0.001 n.s. -0.014 n.s.
IP → FP 0.035 n.s. 0.028 n.s. 0.001 n.s. 0.009 n.s.
Group 7 (n = 141)
Norway
FP – turn_growth FP – emp_growth
Relationship S.R.W. Sig. S.R.W. Sig.
Ext. R&D → IP 0.203 **** 0.253 ****
Int. R&D → IP 0.180 *** 0.190 ***
Ext. R&DxInt. R&D → IP 0.036 n.s. 0.043 n.s.
IP → FP 0.009 n.s. 0.029 n.s.
Note. *** p0.05.

F. Paula, J. F. da Silva 20
BAR, Rio de Janeiro, v. 15, n. 2, art. 5, e170129, 2018 www.anpad.org.br/bar
Discussion
This paper identified important differences in the influence diverse R&D sources have in
innovation outcomes. In high-tech firms, internal and external R&D are complementary (in the model
in which turn_growth represents financial performance), with each in isolation and their interaction
having a positive influence on innovation performance. These findings corroborated the absorptive
capacity theory and are in line with most empirical studies (e.g., Belussi et al., 2010; Cassiman &
Veugelers, 2006; Frenz & Ietto-Gillies, 2009; Oerlemans et al., 2013). On the other hand, in low-tech
firms, external R&D from strategic alliances and internal R&D investments, such as R&D intensity and
employee training, had a positive influence on the innovation performance directly, which is in line with
much of the preceding literature (e.g., Berchicci, 2013; Lin, Wu, Chang, Wang, & Lee, 2012; Schilling,
2015). However, the moderation of internal R&D on the relationship between external R&D and
innovation performance was not found (rejecting the hypothesis of complementarity between them).
All proxies of the construct Internal R&D - Absorptive Capacity presented significantly lower
values in the LT group than in the HT group (see Table 5). These findings corroborated the results of
Hagedoorn and Wang (2012), which suggested that internal and external R&D are substitutes in firms
with low level of absorptive capacity. As the countries in the study are moderate or modest innovators
in the European and global context (Dutta et al., 2016; Europe Union, 2015), their manufacturing
industry is not in a world-leading position in innovation. This disadvantage is even more prominent in
manufacturing industries of low technological intensity. The firms should invest in accumulating
innovative capabilities internally, by improving their investments in internal R&D and capacitation of
employees, in order to increase their absorptive capacity and the effectiveness of their collaboration
efforts, as suggested by several studies (Bell & Figueiredo, 2012; Kim, 1998; Lee & Lim, 2001).
A positive effect of innovation performance on financial performance was not found in both
groups of firms, leading us to reject hypothesis 2. Perhaps, the lack of a statistically significant
relationship between innovation and financial performance derives from the fact that the effects of the
introduction of innovative products, services or processes on firm performance may take some time to
show up. The financial performance indicators had no time-lag compared to the innovation performance
proxies, which didn’t allow capture of the expected relationship. It is expected that R&D investments
and the innovations introduced take some time to mature. Increased revenues from new products and
services takes time, as it is necessary to introduce them into the market, guarantee an appropriate
distribution, and communicate with the consumer. Similarly, process innovations with the potential to
reduce costs usually require training and operational adjustments that prevent an immediate positive
result. On the other hand, in the short-term, the effect of the innovation introduction tends to be negative
by the redirection of resources from marketing and sales to innovation activities, such as internal R&D,
and of the managerial costs of the strategic alliances.
However, when we analyzed by country group, there were exceptions. In group 3 (Portugal and
Spain), innovation performance positively influenced emp_growth. In group 4 (Estonia and Lithuania),
innovation performance had a positive effect on turn_growth. The case of group 4 may be explained
because the Baltic countries’ growth was more negatively affected by the 2008 global crisis than the
rest of Europe on average, followed by a very intense growth (Staehr, 2015), that was possibly pushed
by innovative firms. This suggests that an innovation strategy may position firms to better recover from
country level or global crises and to take advantage from the country’s recovery. Portugal and Spain
were also in an especially bad position after the 2008 crisis (Lin, Edvinsson, Chen, & Beding, 2013),
but their economies did not present recovery as fast as the Baltic countries. The industry in these
countries contracted during the crisis and the analysis shows that innovative firms had a better recovery,
by growing faster to reach their sizes before 2008, regarding the number of employees. However, we
still did not capture an effect in turnover growth as this indicator should take more time to recover.

Balancing Internal and External R&D Strategies 21
BAR, Rio de Janeiro, v. 15, n. 2, art. 5, e170129, 2018 www.anpad.org.br/bar
Conclusion
This paper investigated how internal and external R&D influence the innovation performance as
well as the influence of the latter on the financial performance of manufacturing firms from 14 European
countries - Bulgaria, Cyprus, Czech Republic, Spain, Croatia, Portugal, Hungary, Slovenia, Norway,
Lithuania, Romania, Italy, Slovakia and Estonia. We analyzed a sample of 2,745 firms which conducted
innovation activities from 2008 to 2010, with success in the introduction of innovation or not, from CIS
2010 survey and found some interesting conclusions. The main conclusion is that internal and external
R&D strategies are complementary in firms of more technologically intense industries, as they usually
have a higher absorptive capacity. In the case of firms in industries of low intense technology, both
strategies alone are effective for improving innovation performance, but the effect of their interaction is
not significant. Innovation performance did not influence short-term financial performance. Product and
process innovations take some time to mature and for that reason, their positive influence on financial
performance takes some time to emerge. Even some innovations that may promote some results in the
short term, such as incremental process innovations that reduce production costs, are compensated
against by a negative effect promoted by the redirection of resources from marketing and sales to
innovation activities and to manage strategic alliances. However, an analysis by country group identified
that in countries facing a strong economic crisis, innovation may more quickly improve the firms’
financial performance indicators.
There are some limitations in this research. First, we may point the tolerance with the low
discriminant validity of the measurement model. Also, there are some risks of endogeneity that may
affect the statistical analysis. Some exogenous construct that affects conjointly internal and external
R&D, innovation performance and financial performance may exist and may be the real source of the
effects found in the analysis. Another source of bias is a possible existence of reverse causality. A better
financial performance, for example, may be the cause of a higher innovation performance, and not the
contrary. Another limitation is that the CIS questionnaire mostly uses a four-point Likert scale, which
is not the most appropriate according to the Theory of Scales of Measurement, and it may have
implications for statistical analysis (Hand, 1996). We may also point that we only had access to data
from the countries cited above, while some important European countries such as Germany, France and
UK, and some of the most innovative countries such as Sweden, Denmark and Holland (European
Union, 2015) are out of the analysis, which may limit the generalizability of the results. The last
limitation is that the CIS database is subject to feelings and experiences of the respondents by the
presence of some subjective questions, which may bias the results. Regardless of these limitations, this
paper contributes to understanding the relationships among internal R&D, strategic alliances, absorptive
capacity, innovation performance and financial performance of European manufacturing firms,
especially from the countries studied.
As implications for practitioners, we may cite that high-tech firms should invest conjointly in
internal and external R&D regardless of their goals. Low-tech firms, in turn, should focus on either
internal or external R&D for an immediate improvement of their innovation performance levels.
However, if the firm has long-term goals, starting with an internal R&D is effective to improve the
firms’ absorptive capacity while achieving a satisfactory innovation outcome. This will allow firms to
adopt more complex strategies, balancing internal and external R&D, effectively in the future, when the
absorptive capacity level becomes high. For future studies, we suggest conducting the analysis of
manufacturing firms in more European countries at different innovative stages compared to the countries
presented in this analysis and compare the results with their respective innovative levels. Another
possibility is to test the model with firms from different sectors, such as service firms, which may present
different results.

F. Paula, J. F. da Silva 22
BAR, Rio de Janeiro, v. 15, n. 2, art. 5, e170129, 2018 www.anpad.org.br/bar
Contributions
1st author: concept, design, writing and analysis of the manuscript, discussion of results, final approval.
2nd author: concept, design, writing, discussion of results, final revision.
References
Arora, A., Belenzon, S., & Rios, L. A. (2014). Make, buy, organize: The interplay between research,
external knowledge, and firm structure. Strategic Management Journal, 35(3), 317-337.
https://doi.org/10.1002/smj.2098
Ateljević, J., & Trivić, J. (2016). Economic development and entrepreneurship in transition economies:
Issues, obstacles and perspectives. Switzerland: Springer. https://doi.org/10.1007/978-3-319-
28856-7
Belderbos, R., Faems, D., Leten, B., & Van Looy, B. (2010). Technological activities and their impact
on the financial performance of the firm: Exploitation and exploration within and between firms.
Journal of Product Innovation Management, 27(6), 869-882. https://doi.org/10.1111/j.1540-
5885.2010.00757.x
Bell, M., & Figueiredo, P. N. (2012). Building innovative capabilities in latecomer emerging market
firms: Some key issues. In E. Amann & J. Cantwell, Innovative firms in emerging market
countries (pp. 24-109). New York and London: Oxford University Press. https://doi.org/10.1093/acprof:oso/9780199646005.003.0002
Belussi, F., Sammarra, A., & Sedita, S. R. (2010). Learning at the boundaries in an “Open Regional
Innovation System”: A focus on firms' innovation strategies in the Emilia Romagna life science
industry. Research Policy, 39(6), 710-721. https://doi.org/10.1016/j.respol.2010.01.014
Berchicci, L. (2013). Towards an open R&D system: Internal R&D investment, external knowledge
acquisition and innovative performance. Research Policy, 42(1), 117-127.
https://doi.org/10.1016/j.respol.2012.04.017
Cassiman, B., & Veugelers, R. (2006). In search of complementarity in innovation strategy: Internal
R&D and external knowledge acquisition. Management Science, 52(1), 68-82.
https://doi.org/10.1287/mnsc.1050.0470
Ceccagnoli, M. (2009). Appropriability, preemption, and firm performance. Strategic Management
Journal, 30(1), 81-98. https://doi.org/10.1002/smj.723
Chatterji, A. K., & Fabrizio, K. R. (2014). Using users: When does external knowledge enhance
corporate product innovation? Strategic Management Journal, 35(10), 1427-1445.
https://doi.org/10.1002/smj.2168
Cheng, C. C. J., & Huizingh, E. K. R. E. (2014). When is open innovation beneficial? The role of
strategic orientation. Journal of Product Innovation Management, 31(6), 1235-1253.
https://doi.org/10.1111/jpim.12148
Chesbrough, H. W. (2003). Open innovation: The new imperative for creating and profiting from
technology. Boston, MA: Harvard Business School Press.
Christensen, C., & Raynor, M. (2013). The innovator's solution: Creating and sustaining successful
growth. Boston, MA: Harvard Business School Press.

Balancing Internal and External R&D Strategies 23
BAR, Rio de Janeiro, v. 15, n. 2, art. 5, e170129, 2018 www.anpad.org.br/bar
Cohen, W. M., & Levinthal, D. A. (1990). Absorptive capacity: A new perspective on learning and
innovation. Administrative Science Quarterly, 35(1), 128-152. https://doi.org/10.2307/2393553
Collins, J. C., & Porras, J. I. (1996). Building your company’s vision. Harvard Business Review, 74(5),
65.
Cuervo-Cazurra, A., & Rui, H. (2017). Barriers to absorptive capacity in emerging market firms. Journal
of World Business, 52(6), 727-742. https://doi.org/10.1016/j.jwb.2017.06.004
Du, J., Leten, B., & Vanhaverbeke, W. (2014). Managing open innovation projects with science-based
and market-based partners. Research Policy, 43(5), 828-840.
https://doi.org/10.1016/j.respol.2013.12.008
Dutta, S., Lanvin, B., & Wunsch-Vincent, S. (Eds.). (2016). The global innovation index 2016: Winning
with global innovation. Ithaca, Fontainebleau, and Geneva: Cornell University, INSEAD, &
WIPO. Retrieved from http://www.wipo.int/edocs/pubdocs/en/wipo_pub_gii_2016.pdf
Duysters, G., & Lokshin, B. (2011). Determinants of alliance portfolio complexity and its effect on
innovative performance of companies. Journal of Product Innovation Management, 28(4), 570-
585. https://doi.org/10.1111/j.1540-5885.2011.00824.x
European Commission. (2008). The Schengen area. Retrieved from
https://publications.europa.eu/en/publication-detail/-/publication/8b556648-c5fe-427a-b9fb-
8e7de617e125/language-en. https://doi.org/10.2758/45874
European Union. (2015). Innovation union scoreboard 2015. Retrieved January 20, 2016, from
https://publications.europa.eu/en/publication-detail/-/publication/b00c3803-a940-11e5-b528-
01aa75ed71a1
Eurostat. (n.d.b). Aggregations of manufacturing based on NACE Rev. 2. Retrieved January 20, 2016,
from http://ec.europa.eu/eurostat/cache/metadata/Annexes/htec_esms_an3.pdf
Eurostat. (n.d.a). Community innovation survey (CIS). Retrieved January 20, 2016, from
http://ec.europa.eu/eurostat/web/microdata/community-innovation-survey
Eurostat. (2016, February 24). Glossary: Statistical classification of economic activities in the European
Community (NACE). Retrieved October 8, 2016, from http://ec.europa.eu/eurostat/statistics-
explained/index.php/Glossary:Statistical_classification_of_economic_activities_in_the_Europea
n_Community_(NACE)
Faems, D., De Visser, M., Andries, P., & Van Looy, B. (2010). Technology alliance portfolios and
financial performance: Value-enhancing and cost-increasing Effects of open innovation. Journal
of Product Innovation Management, 27(6), 785-796. https://doi.org/10.1111/j.1540-
5885.2010.00752.x
Faems, D., Van Looy, B., & Debackere, K. (2005). Interorganizational collaboration and innovation:
Toward a portfolio approach. Journal of Product Innovation Management, 22(3), 238-250.
https://doi.org/10.1111/j.0737-6782.2005.00120.x
Fornell, C., & Larcker, D. (1981). Evaluating structural equation models with unobservable variables
and measurement error. Journal of Marketing Research, 18(1), 39-50.
https://doi.org/10.2307/3151312
Frenz, M., & Ietto-Gillies, G. (2009). The impact on innovation performance of different sources of
knowledge: Evidence from the UK community innovation survey. Research Policy, 38(7), 1125-
1135. https://doi.org/10.1016/j.respol.2009.05.002

F. Paula, J. F. da Silva 24
BAR, Rio de Janeiro, v. 15, n. 2, art. 5, e170129, 2018 www.anpad.org.br/bar
Galindo, M. Á., & Méndez, M. T. (2014). Entrepreneurship, economic growth, and innovation: Are
feedback effects at work?. Journal of Business Research, 67(5), 825-829.
https://doi.org/10.1016/j.jbusres.2013.11.052
Gelman, A., Carlin, J. B., Stern, H. S., & Rubin, D. B. (2014). Bayesian data analysis (Vol. 2). Boca
Raton, FL, USA: Chapman & Hall/CRC.
Hagedoorn, J. (1993). Understanding the rationale of strategic technology partnering:
Nterorganizational modes of cooperation and sectoral differences. Strategic Management
Journal, 14(5), 371-385. https://doi.org/10.1002/smj.4250140505
Hagedoorn, J., & Duysters, G. (2002). Learning in dynamic inter-firm networks: The efficacy of
multiple contacts. Organization Studies, 23(4), 525-548.
https://doi.org/10.1177/0170840602234002
Hagedoorn, J., & Wang., N. (2012). Is there complementarity or substitutability between internal and
external RandD strategies? Research Policy, 41(6), 1072-1083.
https://doi.org/10.1016/j.respol.2012.02.012
Hair, J., Black, W., Babin, B., Anderson, R., & Tatham, R. (2006). Multivariate data analysis. Upper
Saddle River, NJ: Pearson Prentice Hall.
Hall, L. A., & Bagchi-Sem, S. (2007). An analysis of firm-level innovation strategies in the US
biotechnology industry. Technovation, 27(1-2), 4-14.
https://doi.org/10.1016/j.technovation.2006.07.001
Hallen, B. L., Katila, R., & Rosenberger, J. D. (2014). How do social defenses work? A resource-
dependence lens on technology ventures, venture capital investors, and corporate relationships.
Academy of Management Journal, 57(4), 1078-1101. https://doi.org/10.5465/amj.2012.0003
Hand, D. J. (1996). Statistics and the theory of measurement. Journal of the Royal Statistical Society:
Series A (Statistics in Society), 159(part 3), 445-492. https://doi.org/10.2307/
Hill, C. W. L., & Rothaermel, F. T. (2003). The performance of incumbent firms in the face of radical
technological innovation. The Academy of Management Review, 28(2), 257-274.
https://doi.org/10.2307/30040712
Hurmelinna-Laukkanen, P., & Puumalainen, K. (2007). Nature and dynamics of appropriability:
Strategies for appropriating returns on innovation. R&D Management, 37(2), 95-112.
https://doi.org/10.1111/j.1467-9310.2007.00460.x
Kim, L. (1998). Crisis construction and organizational learning: Capability building in catching-up at
Hyundai motor. Organization Science, 9(4), 506-521. https://doi.org/10.1287/orsc.9.4.506
Kruschke, J. K., Aguinis, H., & Joo, H. (2012). The time has come: Bayesian methods for data analysis
in the organizational sciences. Organizational Research Methods, 15(4), 722-752.
https://doi.org/10.1177/1094428112457829
Lee, K., & Lim, C. (2001). Technological regimes, catching-up and leapfrogging: Findings from the
Korean industries. Research Policy, 30(3), 459-483. https://doi.org/10.1016/s0048-
7333(00)00088-3
Leskovar-Spacapan, G., & Bastic, M. (2007). Differences in organizations’ innovation capability in
transition economy: Internal aspect of the organizations’ strategic orientation. Technovation,
27(9), 533-546. https://doi.org/10.1016/j.technovation.2007.05.012

Balancing Internal and External R&D Strategies 25
BAR, Rio de Janeiro, v. 15, n. 2, art. 5, e170129, 2018 www.anpad.org.br/bar
Lin, C., Wu, Y.-J., Chang, C., Wang, W., & Lee, C.-Y. (2012). The alliance innovation performance of
R&D alliances — the absorptive capacity perspective. Technovation, 32(5), 282-292.
https://doi.org/10.1016/j.technovation.2012.01.004
Lin, C. Y.-Y., Edvinsson, L., Chen, J., & Beding, T. (2013). Impact of the 2008 global financial crisis.
In C. Y.-Y. Lin, L. Edvinsson, J. Chen, & T. Beding, National intellectual capital and the
financial crisis in Brazil, Russia, India, China, Korea, and South Africa (pp. 7-20). New York:
Springer-Verlag New York. https://doi.org/10.1007.978-1-4614-6089-3_2
Little, T. D., Bovaird, J. A., & Widaman, K. F. (2006). On the merits of orthogonalizing powered and
product terms: Implications for modeling interactions among latent variables. Structural Equation
Modeling: A Multidisciplinary Journal, 13(4), 497-519. https://doi.org/10.1207/s15328007sem1304_1
Malhotra, N. K., & Dash, S. (2011). Marketing research: An applied approach. London: Pearson
Publishing.
Milgrom, P., & Roberts, J. (1995). Complementarities and fit strategy, structure, and organizational
change in manufacturing. Journal of Accounting and Economics, 19(2/3), 179-208.
https://doi.org/10.1016/0165-4101(94)00382-f
Moutinho, R., Au-Yong-Oliveira, M., Coelho, A., & Manso, J. P. (2015). The role of regional innovation
systems (RIS) in translating R&D investments into economic and employment growth. Journal
of Technology Management & Innovation, 10(2), 9-23. http://dx.doi.org/10.4067/S0718-
27242015000200002
Mowery, D. C., Oxley, J. E., & Silverman, B. S. (1996). Strategic alliances and interfirm knowledge
transfer. Strategic Management Journal, 17(S2), 77-91. https://doi.org/10.1002/smj.4250171108
Nunnally, J. (1978). Psychometric theory. New York: McGraw-Hill.
Oerlemans, L. A. G., Knoben, J., & Pretorius, M. W. (2013). Alliance portfolio diversity, radical and
incremental innovation: The moderating role of technology management. Technovation, 33(6/7),
234-246. https://doi.org/10.1016/j.technovation.2013.02.004
Paula, F. D. O., & Silva, J. F. D. (2017). Innovation performance of Italian manufacturing firms: The
effect of internal and external knowledge sources. European Journal of Innovation Management,
20(3), 428-445. https://doi.org/10.1108/ejim-12-2016-0119
Pérez-Luño, A., Medina, C. C., Lavado, A. C., & Rodríguez, G. C. (2011). How social capital and
knowledge affect innovation. Journal of Business Research, 64(12), 1369-1376.
https://doi.org/10.1016/j.jbusres.2011.01.014
Podsakoff, P. M., MacKenzie, S. B., Lee, J.-Y., & Podsakoff, N. P. (2003). Common method biases in
behavioral research: A critical review of the literature and recommended remedies. The Journal
of Applied Psychology, 88(5), 879-903. https://doi.org/10.1037/0021-9010.88.5.879
Ritala, P., Olander, H., Michailova, S., & Husted, K. (2015). Knowledge sharing, knowledge leaking
and relative innovation performance: An empirical study. Technovation, 35(1), 22-31.
https://doi.org/10.1016/j.technovation.2014.07.011
Rothaermel, F. T., & Deeds, D. L. (2006). Alliance type, alliance experience and alliance management
capability in high-technology ventures. Journal of Business Venturing, 21(4), 429-460.
https://doi.org/10.1016/j.jbusvent.2005.02.006
Schilling, M. A. (2015). Technology shocks, technological collaboration, and innovation outcomes.
Organization Science, 26(3), 668-686. https://doi.org/10.1287/orsc.2015.0970

F. Paula, J. F. da Silva 26
BAR, Rio de Janeiro, v. 15, n. 2, art. 5, e170129, 2018 www.anpad.org.br/bar
Schoenmakers, W., & Duysters, G. (2006). Learning in strategic technology alliances. Technology
Analysis & Strategic Management, 18(2), 245-264. https://doi.org/10.1080/09537320600624162
Soh, P.-H., & Subramanian, A. M. (2014). When do firms benefit from university-industry RandD
collaborations? The implications of firm RandD focus on scientific research and technological
recombination. Journal of Business Venturing, 29(6), 807-821.
https://doi.org/10.1016/j.jbusvent.2013.11.001
Staehr, K. (2015). Economic growth and convergence in the baltic states: Caught in a middle-income
trap? Intereconomics, 50(5), 274-280. https://doi.org/10.1007/s10272-015-0551-1
Stam, E., & Wennberg, K. (2009). The roles of R&D in new firm growth. Small Business Economics,
33(1), 77-89. https://doi.org/10.1007/s11187-009-9183-9
Teece, D. (2007). Explicating dynamic capabilities: The nature and microfoundations of (sustainable)
enterprise performance. Strategic Management Journal, 28(13), 1319-1350.
https://doi.org/10.1002/smj.640
Terjesen, S., & Patel, P. C. (2017). In search of process innovations: The role of search depth, search
breadth, and the industry environment. Journal of Management, 43(5), 1421-1446.
https://doi.org/10.1177/0149206315575710
Tomlinson, P. R. (2010). Co-operative ties and innovation: Some new evidence for UK manufacturing.
Research Policy, 39(6), 762-775. https://doi.org/10.1016/j.respol.2010.02.010
Tsai, K.-H. (2009). Collaborative networks and product innovation performance: Toward a contingency
perspective. Research Policy, 38(5), 765-778. https://doi.org/10.1016/j.respol.2008.12.012
Utterback, J. M., & Abernathy, W. J. (1975). A dynamic model of process and product innovation.
Omega, 3(6), 639-656. https://doi.org/10.1016/0305-0483(75)90068-7
Wang, C.-H., & Hsu, L.-C. (2014). Building exploration and exploitation in the high-tech industry: The
role of relationship learning. Technological Forecasting and Social Change, 81, 331-340. https://doi.org/10.1016/j.techfore.2013.04.008
Zahra, S. A., & George, G. (2002). Absorptive capacity: A review, reconceptualization, and extension.
The Academy of Management Review, 27(2), 185-203. https://doi.org/10.2307/4134351
Authors’ Profiles
Fábio de Oliveira Paula
Rua Marquês de São Vicente, 225, Gávea, 22451-900, Rio de Janeiro, RJ, Brazil. E-mail address: [email protected].
http://orcid.org/0000-0002-1926-2241
Jorge Ferreira da Silva
Rua Marquês de São Vicente, 225, Gávea, 22451-900, Rio de Janeiro, RJ, Brazil. E-mail address: [email protected].
https://orcid.org/0000-0002-0021-8398