baltimore harbor and curtis creek/bay total maximum … harbor and curtis creek/bay total ......
TRANSCRIPT
1
Baltimore Harbor and Curtis Creek/Bay Total Maximum Daily Load Restoration Plan
2017 Annual TMDL Assessment Report
January 2018
Prepared by
Anne Arundel County
Department of Public Works
Watershed Protection and Restoration Program
With support from:
Biohabitats, Inc.
2081 Clipper Park Road
Baltimore, Maryland 21211
2
Anne Arundel County Update on Progress
Towards Meeting the Baltimore Harbor PCB TMDL WLA
Introduction:
Anne Arundel County (the County) submitted the Baltimore Harbor and Curtis Creek/Bay
Polychlorinated Biphenyls (PCB) TMDL Restoration Plan as part of the County’s 2016 MS4 Annual
Report. The County received comments from MDE on April 19 and July14, 2017. The County’s
response to those comments are considered part of this progress update and are submitted with the
County’s 2017 MS4 Annual Report. The Response to Comments document follows the progress
update.
Estimated Net Change in PCB Load Reductions:
Consistent with the Baltimore Harbor and Curtis Creek/Bay Polychlorinated Biphenyls (PCB) TMDL
Restoration Plan, PCB load updates were modeled based on the Center for Watershed Protection
Watershed Treatment Model (WTM) adapted for PCBs. The model was updated to compute the
2017 progress in PCB load reduction. Progress is tracked independently for each subwatershed.
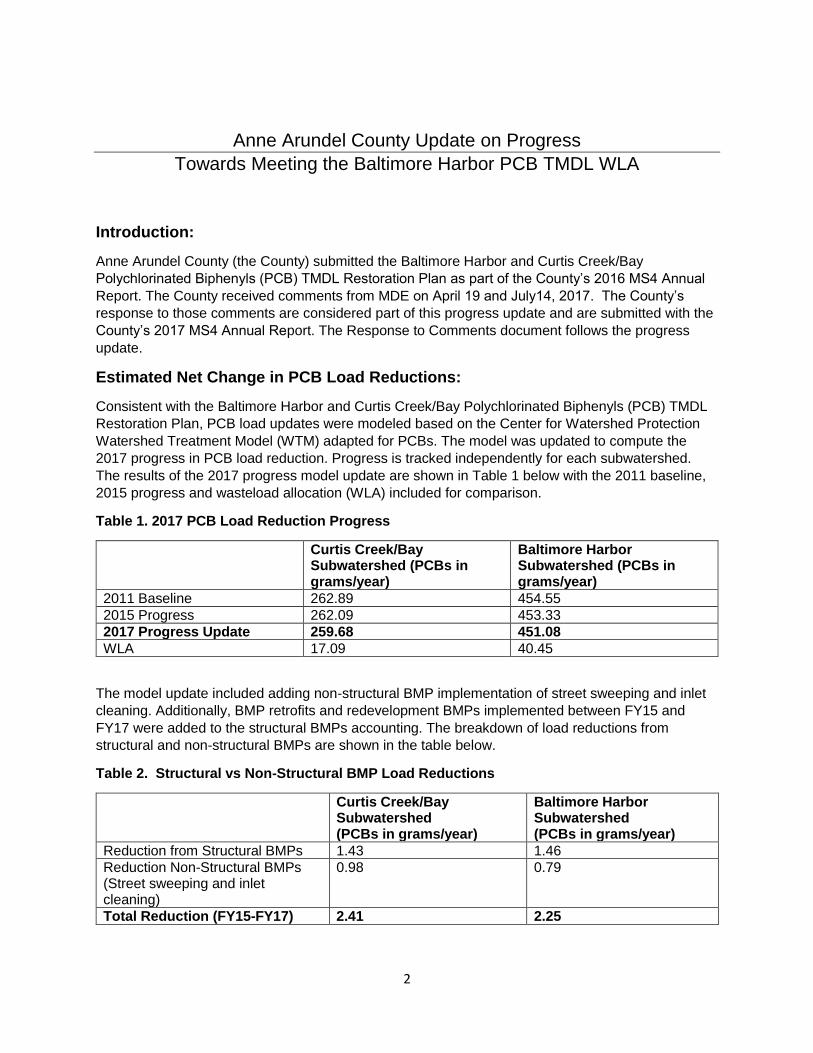
The results of the 2017 progress model update are shown in Table 1 below with the 2011 baseline,
2015 progress and wasteload allocation (WLA) included for comparison.
Table 1. 2017 PCB Load Reduction Progress
Curtis Creek/Bay Subwatershed (PCBs in grams/year)
Baltimore Harbor Subwatershed (PCBs in grams/year)
2011 Baseline 262.89 454.55
2015 Progress 262.09 453.33
2017 Progress Update 259.68 451.08
WLA 17.09 40.45
The model update included adding non-structural BMP implementation of street sweeping and inlet
cleaning. Additionally, BMP retrofits and redevelopment BMPs implemented between FY15 and
FY17 were added to the structural BMPs accounting. The breakdown of load reductions from
structural and non-structural BMPs are shown in the table below.
Table 2. Structural vs Non-Structural BMP Load Reductions
Curtis Creek/Bay Subwatershed (PCBs in grams/year)
Baltimore Harbor Subwatershed (PCBs in grams/year)
Reduction from Structural BMPs 1.43 1.46
Reduction Non-Structural BMPs (Street sweeping and inlet cleaning)
0.98 0.79
Total Reduction (FY15-FY17) 2.41 2.25
3
Between FY15 and FY17, the County retrofitted or added with redevelopment 19 BMPs in the Curtis
Creek/Bay subwatershed and 17 BMPs in the Baltimore Harbor subwatershed, representing
treatment of approximately an additional 81.3 acres of impervious in Curtis Creek/Bay and 26.7
acres of impervious in Baltimore Harbor. In FY2017, street sweeping covered 124 acres and 20
acres monthly in Curtis Creek/Bay and Baltimore Harbor subwatersheds respectively. Additionally,
inlet cleaning addressed 38 acres and 3 acres semiannually in Curtis Creek/Bay and Baltimore
Harbor subwatersheds respectively. Values for the WTM update were computed based on the most
up-to-date GIS data available from the County MS4 Geodatabase and included files documenting
redevelopment BMPs, restoration BMPs, street sweeping, and inlet cleaning. A comparison of the
net change in PCB load reductions detailed above with established benchmarks, deadlines, and
applicable stormwater WLAs is provided in the Response to MDE Comments which is included as
an element in this Progress Update.
4
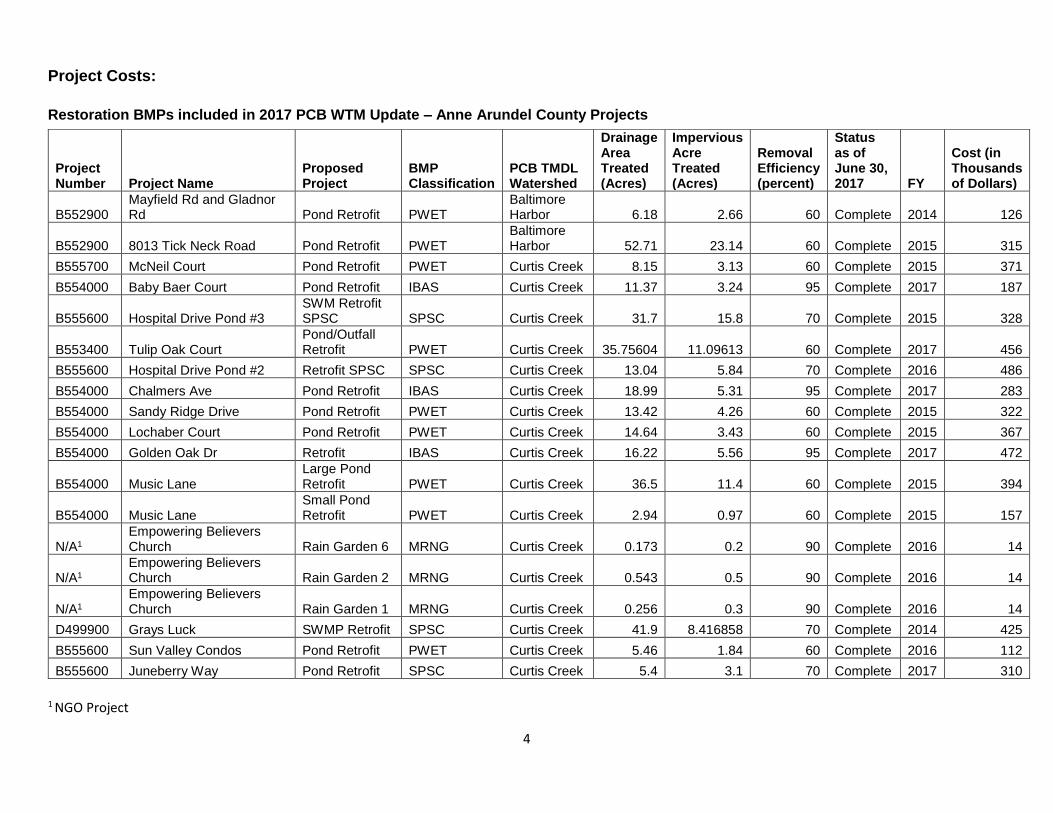
Project Costs:
Restoration BMPs included in 2017 PCB WTM Update – Anne Arundel County Projects
1 NGO Project
Project Number Project Name
Proposed Project
BMP Classification
PCB TMDL Watershed
Drainage Area Treated (Acres)
Impervious Acre Treated (Acres)
Removal Efficiency (percent)
Status as of June 30, 2017 FY
Cost (in Thousands of Dollars)
B552900 Mayfield Rd and Gladnor Rd Pond Retrofit PWET
Baltimore Harbor 6.18 2.66 60 Complete 2014 126
B552900 8013 Tick Neck Road Pond Retrofit PWET Baltimore Harbor 52.71 23.14 60 Complete 2015 315
B555700 McNeil Court Pond Retrofit PWET Curtis Creek 8.15 3.13 60 Complete 2015 371
B554000 Baby Baer Court Pond Retrofit IBAS Curtis Creek 11.37 3.24 95 Complete 2017 187
B555600 Hospital Drive Pond #3 SWM Retrofit SPSC SPSC Curtis Creek 31.7 15.8 70 Complete 2015 328
B553400 Tulip Oak Court Pond/Outfall Retrofit PWET Curtis Creek 35.75604 11.09613 60 Complete 2017 456
B555600 Hospital Drive Pond #2 Retrofit SPSC SPSC Curtis Creek 13.04 5.84 70 Complete 2016 486
B554000 Chalmers Ave Pond Retrofit IBAS Curtis Creek 18.99 5.31 95 Complete 2017 283
B554000 Sandy Ridge Drive Pond Retrofit PWET Curtis Creek 13.42 4.26 60 Complete 2015 322
B554000 Lochaber Court Pond Retrofit PWET Curtis Creek 14.64 3.43 60 Complete 2015 367
B554000 Golden Oak Dr Retrofit IBAS Curtis Creek 16.22 5.56 95 Complete 2017 472
B554000 Music Lane Large Pond Retrofit PWET Curtis Creek 36.5 11.4 60 Complete 2015 394
B554000 Music Lane Small Pond Retrofit PWET Curtis Creek 2.94 0.97 60 Complete 2015 157
N/A1 Empowering Believers Church Rain Garden 6 MRNG Curtis Creek 0.173 0.2 90 Complete 2016 14
N/A1 Empowering Believers Church Rain Garden 2 MRNG Curtis Creek 0.543 0.5 90 Complete 2016 14
N/A1 Empowering Believers Church Rain Garden 1 MRNG Curtis Creek 0.256 0.3 90 Complete 2016 14
D499900 Grays Luck SWMP Retrofit SPSC Curtis Creek 41.9 8.416858 70 Complete 2014 425
B555600 Sun Valley Condos Pond Retrofit PWET Curtis Creek 5.46 1.84 60 Complete 2016 112
B555600 Juneberry Way Pond Retrofit SPSC Curtis Creek 5.4 3.1 70 Complete 2017 310

5
Redevelopment BMPs in 2017 PCB WTM Update – Private Projects
Project Number* Project Name+ Proposed Project
BMP Classi-fication
PCB TMDL Watershed
Drainage Area Treated (Acres)
Impervious Acre Treated (Acres)
Removal Efficiency (percent)
Status as of June 30, 2017 FY
Cost* (in Thou-sands of Dollars)
N/A Arundel Corporation Rd Infiltration Trench ITRN Curtis Creek 3.584885 3.38335 95 Complete 2016 N/A
N/A 95 Stahl Point Rd Micro Bioretention MMBR Curtis Creek 2.894241 2.332193 90 Complete 2015 N/A
N/A 96 Stahl Point Rd Micro Bioretention MMBR Curtis Creek 1.422418 1.233547 90 Complete 2015 N/A
N/A 1033 Nabbs Creek Rd Infiltration Berms MIBR Baltimore Harbor 0.50428 0.053793 95 Complete 2015 N/A
N/A 7800 Parke West Dr Micro Bioretention MMBR Curtis Creek 0.48128 0.395661 90 Complete 2016 N/A
N/A 356 Mountain Rd Filtering Bioretention FBIO Baltimore Harbor 0.416877 0.256175 90 Complete 2015 N/A
N/A 8490 Ft Smallwood Rd Permeable Pavement APRP Baltimore Harbor 0.296271 0.229571 25 Complete 2014 N/A
N/A 8490 Ft Smallwood Rd Micro Bioretention MMBR Baltimore Harbor 0.236384 0.168054 90 Complete 2014 N/A
N/A 356 Mountain Rd Filtering Bioretention FBIO Baltimore Harbor 0.234032 0.169237 90 Complete 2015 N/A
N/A 1033 Nabbs Creek Rd Disconnection of Rooftop Runoff NDRR
Baltimore Harbor 0.006752 0.001422 0 Complete 2015 N/A
N/A 1033 Nabbs Creek Rd Disconnection of Rooftop Runoff NDRR
Baltimore Harbor 0.006548 0.006084 0 Complete 2015 N/A
N/A 1033 Nabbs Creek Rd Disconnection of Non Rooftop Runoff NDNR
Baltimore Harbor 0.00649 0.006084 0 Complete 2015 N/A
N/A 1033 Nabbs Creek Rd Disconnection of Rooftop Runoff NDRR
Baltimore Harbor 0.006308 0.000209 0 Complete 2015 N/A
N/A 1033 Nabbs Creek Rd Disconnection of Non Rooftop Runoff NDNR
Baltimore Harbor 0.006281 0.000301 0 Complete 2015 N/A
N/A 1033 Nabbs Creek Rd Disconnection of Non Rooftop Runoff NDNR
Baltimore Harbor 0.006253 0.003433 0 Complete 2015 N/A
N/A 1033 Nabbs Creek Rd Disconnection of Rooftop Runoff NDRR
Baltimore Harbor 0.006251 0.004071 0 Complete 2015 N/A
N/A 1033 Nabbs Creek Rd Disconnection of Non Rooftop Runoff NDNR
Baltimore Harbor 0.006251 0.003675 0 Complete 2015 N/A
N/A 1033 Nabbs Creek Rd Disconnection of Rooftop Runoff NDRR
Baltimore Harbor 0.006223 0.002259 0 Complete 2015 N/A
N/A 1033 Nabbs Creek Rd Disconnection of Rooftop Runoff NDRR
Baltimore Harbor 0.006042 0.003254 0 Complete 2015 N/A

6
*Project Number and Cost are not applicable due to being private projects. + Project Name provided is the address associated with the Anne Arundel County permit associated with the BMP Plan ID.

7
Plan for Implementing Additional Watershed Restoration Actions to Achieve
Benchmarks:
After implementing the structural and non-structural strategies identified in the Baltimore Harbor and
Curtis Creek/Bay Restoration Plan submitted to MDE with the 2016 MS4 Annual Report, reductions
remaining to meet the PCB WLAs are still significant. The County is proposing the development of a
Targeted PCB Actions Strategy to further refine source tracking results identified in the Restoration
Plan including site screening and physical data collection to better discern locations of PCB
contaminated materials and specific options (e.g. remediation) for load reduction strategies. The
County is in the beginning stages of the contracting process to develop the Targeted PCB Action
Strategy. A Scope of Work has been drafted and a request for proposals is planned for release in
February 2018.
Response to MDE Comments
The document is formatted with the MDE comments shown in bold followed by the Anne Arundel County (the County) response in plain text. The County response immediately follows each comment. Note for comment #1, a general response in provided as well as category specific responses. The category text is repeated in bold italics above each category specific response.
1. MDE suggests expanding your approach for identifying locations with significant
potential for PCB soil contamination to include the following categories: a. Industrial Stormwater and Surface Dischargers - SIC codes for facilities associated
with potential historical use or storage of PCB containing equipment and inadvertent production (e.g., junk yards, power plants, dye manufacturers).
b. Construction activity in areas with potential PCB contamination c. PCB era buildings (paint and sealants are a potential source of PCBs)
The completed source tracking efforts as documented in the Baltimore Harbor and Curtis Creek/Bay PCB TMDL Restoration Plan represent a significant level of effort and resulted in the identification of 39 locations with significant potential for PCB soil contamination as well as identified 43 BMPs near the identified locations and prioritized 83 BMPs for PCB likelihood based on type, land use, drainage area and age. While the County thinks these results provide a solid basis for future monitoring as part of the proposed Targeted PCB Action Plan, the County also acknowledges that expanding our approach to include the categories suggested by MDE may help identify additional new locations and BMPs with significant potential for PCB soil contamination, as well as help to further prioritize already identified BMPs. With this understanding, the County will incorporate the suggested categories to the degree possible as source tracking is updated and refined as part of the Targeted PCB Action Plan. The County proposes including in the contents of the to-be-developed Targeted PCB Action Plan, a statement that source tracking results will be updated to incorporate findings from additional data sources as feasible. After an initial investigation and consideration of the suggested additional categories, the County’s response to each suggested category is as follows:
8
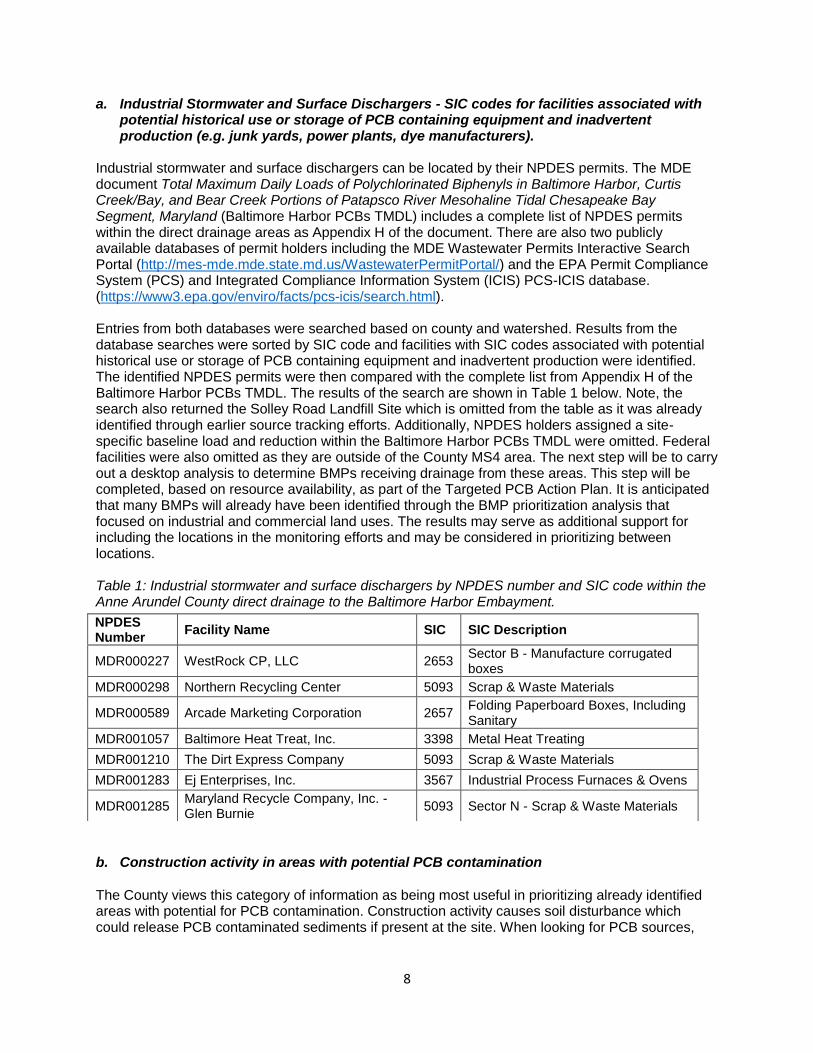
a. Industrial Stormwater and Surface Dischargers - SIC codes for facilities associated with potential historical use or storage of PCB containing equipment and inadvertent production (e.g. junk yards, power plants, dye manufacturers).
Industrial stormwater and surface dischargers can be located by their NPDES permits. The MDE document Total Maximum Daily Loads of Polychlorinated Biphenyls in Baltimore Harbor, Curtis Creek/Bay, and Bear Creek Portions of Patapsco River Mesohaline Tidal Chesapeake Bay Segment, Maryland (Baltimore Harbor PCBs TMDL) includes a complete list of NPDES permits within the direct drainage areas as Appendix H of the document. There are also two publicly available databases of permit holders including the MDE Wastewater Permits Interactive Search Portal (http://mes-mde.mde.state.md.us/WastewaterPermitPortal/) and the EPA Permit Compliance System (PCS) and Integrated Compliance Information System (ICIS) PCS-ICIS database. (https://www3.epa.gov/enviro/facts/pcs-icis/search.html). Entries from both databases were searched based on county and watershed. Results from the database searches were sorted by SIC code and facilities with SIC codes associated with potential historical use or storage of PCB containing equipment and inadvertent production were identified. The identified NPDES permits were then compared with the complete list from Appendix H of the Baltimore Harbor PCBs TMDL. The results of the search are shown in Table 1 below. Note, the search also returned the Solley Road Landfill Site which is omitted from the table as it was already identified through earlier source tracking efforts. Additionally, NPDES holders assigned a site-specific baseline load and reduction within the Baltimore Harbor PCBs TMDL were omitted. Federal facilities were also omitted as they are outside of the County MS4 area. The next step will be to carry out a desktop analysis to determine BMPs receiving drainage from these areas. This step will be completed, based on resource availability, as part of the Targeted PCB Action Plan. It is anticipated that many BMPs will already have been identified through the BMP prioritization analysis that focused on industrial and commercial land uses. The results may serve as additional support for including the locations in the monitoring efforts and may be considered in prioritizing between locations. Table 1: Industrial stormwater and surface dischargers by NPDES number and SIC code within the Anne Arundel County direct drainage to the Baltimore Harbor Embayment.
b. Construction activity in areas with potential PCB contamination
The County views this category of information as being most useful in prioritizing already identified areas with potential for PCB contamination. Construction activity causes soil disturbance which could release PCB contaminated sediments if present at the site. When looking for PCB sources,
NPDES Number
Facility Name SIC SIC Description
MDR000227 WestRock CP, LLC 2653 Sector B - Manufacture corrugated boxes
MDR000298 Northern Recycling Center 5093 Scrap & Waste Materials
MDR000589 Arcade Marketing Corporation 2657 Folding Paperboard Boxes, Including Sanitary
MDR001057 Baltimore Heat Treat, Inc. 3398 Metal Heat Treating
MDR001210 The Dirt Express Company 5093 Scrap & Waste Materials
MDR001283 Ej Enterprises, Inc. 3567 Industrial Process Furnaces & Ovens
MDR001285 Maryland Recycle Company, Inc. - Glen Burnie
5093 Sector N - Scrap & Waste Materials

9
areas with potential for PCB contamination having undergone renovations or construction may be more likely to have increased PCBs in their runoff. While there is no specific database to search for this information on a broad scale, historic aerial photos could be referenced to determine relative timeframe of disturbance for specific sites. Additionally, construction permit history could be searched on a parcel basis using the County Department of Inspections and Permits database. The County proposes that history of construction activity may be considered in prioritizing locations for monitoring during the development of Targeted PCB Action Plan. Additionally, as locations are sampled, if elevated PCB contamination is found, the Watershed Protection and Restoration Program will work with the Department of Inspections and Permits to ensure any future permits issued for the location limit soil disturbance.
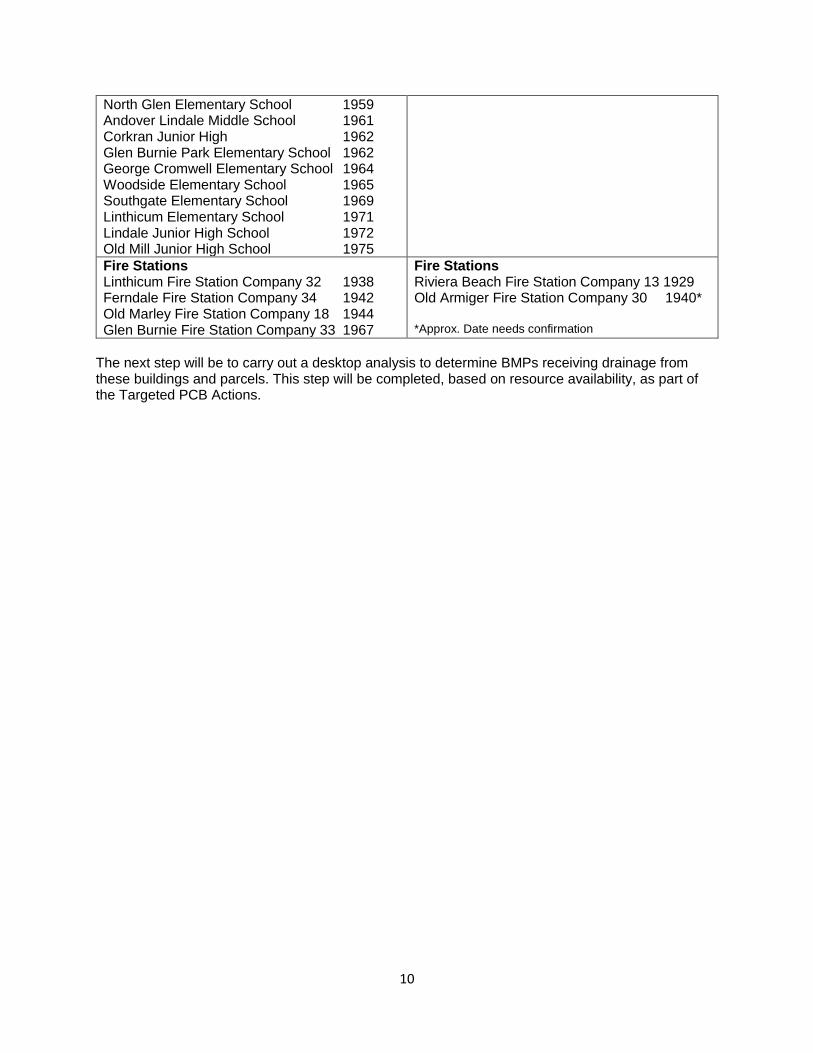
c. PCB era buildings (paint and sealants are a potential source of PCBs) The PCB era spans from approximately 1929-1979, a 50-year period in which the County experienced significant growth within the Baltimore Harbor and Curtis Creek/Bay subwatersheds. Many new schools and other public services were established during that time period. When considering buildings from the PCB era likely to contribute PCBs, the size of the building and use of the building are two important factors with industrial and commercial buildings being of specific interest. The BMP prioritization already carried out focused on commercial and industrial areas and considered age of BMP which likely corresponds to the timeframe of development in the area. As such, the County believes BMPs from PCB era commercial and industrial buildings have already been sufficiently identified. In order to expand our approach to include targeting PCB era buildings, the County proposes focusing on public school buildings and fire stations. These properties have the advantage of being mostly publicly owned1, schools are relatively large buildings, and fire stations have historically housed large mechanical equipment and also may have accumulated residue from fires which may have burned PCB containing materials. A comprehensive search of schools and fire stations within the Baltimore Harbor and Curtis Creek/Bay subwatesheds was completed. The results are listed in Table 2 below along with the date of the buildings. Of schools within the subwatershed 25 out of 26 were constructed during the PCB era and of 11 fire stations, five were confirmed constructed during the PCB era with one likely to have been, although a date could not be confirmed. Note that many schools have undergone renovations since the original construction and this will be considered when prioritizing locations for monitoring. Table 2: PCB era buildings by subwatershed including schools and fire stations.
Curtis Creek/Bay Subwatershed Baltimore Harbor Subwatershed
Schools Ferndale Elementary School 1925 Glen Burnie High School 1931 Solley Elementary School 1937 Park Elementary School 1943 Glendale Elementary School 1950 Marley Elementary School 1953 Oakwood Elementary School 1957 Richard Henry Lee Elementary School 1957 Point Pleasant Elementary School 1958 Freetown Elementary School 1959
Schools George Fox Junior High School 1949 Riviera Beach Elementary School 1955 Northeast Senior High School 1964 Sunset Beach Elementary School 1971 High Point Elementary School 1975
1 Certain fire stations are owned by the volunteer fire companies.
10
North Glen Elementary School 1959 Andover Lindale Middle School 1961 Corkran Junior High 1962 Glen Burnie Park Elementary School 1962 George Cromwell Elementary School 1964 Woodside Elementary School 1965 Southgate Elementary School 1969 Linthicum Elementary School 1971 Lindale Junior High School 1972 Old Mill Junior High School 1975
Fire Stations Linthicum Fire Station Company 32 1938 Ferndale Fire Station Company 34 1942 Old Marley Fire Station Company 18 1944 Glen Burnie Fire Station Company 33 1967
Fire Stations Riviera Beach Fire Station Company 13 1929 Old Armiger Fire Station Company 30 1940* *Approx. Date needs confirmation
The next step will be to carry out a desktop analysis to determine BMPs receiving drainage from these buildings and parcels. This step will be completed, based on resource availability, as part of the Targeted PCB Actions.

11
2. The plan prioritizes BMPs located within drainage areas containing commercial, industrial, or utility land uses. MDE suggests evaluating sediment concentrations in BMPs located in non-urban land uses (residential, forest, and agricultural) to establish a baseline and demonstrate whether PCBs are not present at significant levels. There is the potential for PCBs to be present in these land uses from several sources including atmospheric deposition, illicit dumping, failure of residential transformers, and land application of biosolids.
The location of PCBs throughout the environment and how PCBs interact with stormwater management practices is an active area of research. The County agrees that there is potential for PCBs to be present in areas of non-urban land use and that MDE’s suggestions of evaluating sediment concentration in BMPs located in non-urban land uses to establish a baseline and demonstrate whether PCBs are not present at significant levels are interesting topic areas. However, the County has limited resources and favors directing monitoring efforts towards areas with high likelihood of elevated PCBs to most efficiently locate PCB sources and most cost-effectively reduce PCB pollution. This seems especially necessary given the high cost of each PCB analysis. Additionally, the County’s Targeted PCB Strategy looks to identify BMPs and PCB sources with the highest PCB concentrations relative to the other sites investigated such that remediation can address the most influential sources. The County is more interested in investigating and understanding the upper limit concentration values versus a baseline value. The results of several published studies relating to urban stormwater and PCBs (Davis et al 2007, Gilbreathe et al 2012, Mangarella et al 2012) support the approach of targeting BMPs in areas with current and/or historical industrial land use. These results and additional recent research on the subject are well summarized in the Chesapeake Stormwater Network document titled “Potential Benefits of nutrient and Sediment Practices to Reduce Toxic Contaminants in the Chesapeake Bay Watershed, Part 1: Removal of Urban Toxic Contaminants” (Schueler and Youngk 2015). Based on this research and the County’s monitoring objective, the County plans to continue with the approach as described in the Baltimore Harbor and Curtis Creek/Bay PCB Restoration Plan that prioritizes BMPs located within drainage areas containing commercial, industrial or utility land uses. Notably, the source tracking exercise to identify locations with significant potential for PCB contamination was not limited by land use. It is possible certain identified locations are in a non-urban area and therefore non-urban BMPs may coincidentally be included as part of the monitoring. References: Davis, J., F. Hetzel, J. Oram and L. McKee. 2007. Polychlorinated biphenyls (PCBs) in San Francisco Bay. Environmental Research. 105: 67-86.
Gilbreath, A., D. Yee and L. McKee. 2012. Concentrations and loads of trace contaminants in a small urban tributary, San Francisco Bay, California. Technical Report of the Sources Pathways and Loading Work Group of the Regional Monitoring Program for Water Quality: Contribution No. 650. San Francisco Estuary Institute. Richmond, CA.
Mangarella, P., K. Havens, W. Lewis and L. McKee. 2010. Task 3.5.1: Desktop evaluation of controls for polychlorinated biphenyls and mercury load reduction. Technical Report of the Regional Watershed Program: SFEI Contribution 613. San Francisco Estuary Institute, Oakland, CA.
Schueler and Youngk. 2015. Potential Benefits of Nutrient and Sediment Practices to Reduce Toxic Contaminants in the Chesapeake Bay Watershed, Part 1: Removal of Urban Toxic Contaminants. Chesapeake Stormwater Network. Final Report Date: December 10, 2015.

12
3. Table 28 includes a total PCB load reduction as the summation of all WTM time step scenarios. In order to achieve the WLA, the load must be reduced by the required amount on an annual basis. Therefore the load reduction from street sweeping and inlet cleaning is not cumulative in contributing to the overall WLA. Only the amount reduced in 2025 should be considered in contributing to meeting the WLA.
The County agrees with MDE’s recommendation and as such, Table 28 on Page 38 is replaced by
the table below which eliminates the cumulative values:
Updated – Table 28: Anticipated Annual Reductions for Non-structural BMPs
Annual PCB Load Reduction (g/year)
Curtis Creek AACO Baltimore Harbor AACO
Street Sweeping Inlet Cleaning Total Street Sweeping Inlet Cleaning Total
1.25 0.05 1.3 2.3 0.38 2.68
This table assumes the same level of street sweeping and inlet cleaning will be carried out every
year as shown in Table 27. If efforts increase or decrease, this value will change accordingly for that
reporting year.
Since the load reduction from non-structural BMPs is non-cumulative Table 29 is updated as shown
below:
Updated – Table 1: Progress towards meeting WLAs by 2025 from Pond Retrofits and Non-Structural BMPs
Curtis Creek AACO
(g/year)
Baltimore Harbor AACO
(g/year)
WTM 2025 Progress Load with Pond Retrofits 248.31 439.83
WTM 2025 Progress Load with Pond Retrofits
and Non-Structural BMPs
247.01 437.15
PCB WLAs 17.09 40.45
Required Reduction Remaining 229.92 396.7
The County plans to address the increase in remaining required reduction through the proposed
Targeted PCB Action Plan.
Values presented in Tables 32 – 36 and Figures 8 and 9 are also directly impacted by this change.
These tables and figures have been updated and are provided below.
13
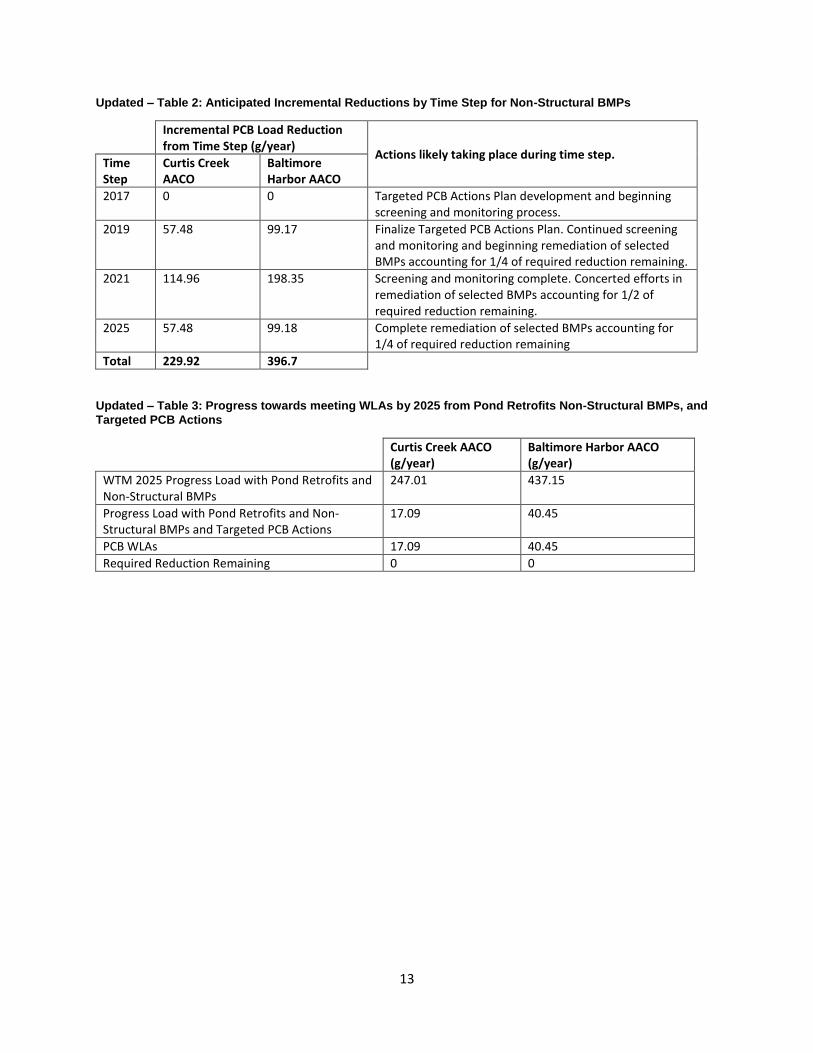
Updated – Table 2: Anticipated Incremental Reductions by Time Step for Non-Structural BMPs
Incremental PCB Load Reduction from Time Step (g/year)
Actions likely taking place during time step. Time Step
Curtis Creek AACO
Baltimore Harbor AACO
2017 0 0 Targeted PCB Actions Plan development and beginning screening and monitoring process.
2019 57.48 99.17 Finalize Targeted PCB Actions Plan. Continued screening and monitoring and beginning remediation of selected BMPs accounting for 1/4 of required reduction remaining.
2021 114.96
198.35 Screening and monitoring complete. Concerted efforts in remediation of selected BMPs accounting for 1/2 of required reduction remaining.
2025 57.48
99.18 Complete remediation of selected BMPs accounting for 1/4 of required reduction remaining
Total 229.92 396.7
Updated – Table 3: Progress towards meeting WLAs by 2025 from Pond Retrofits Non-Structural BMPs, and
Targeted PCB Actions
Curtis Creek AACO (g/year)
Baltimore Harbor AACO (g/year)
WTM 2025 Progress Load with Pond Retrofits and Non-Structural BMPs
247.01 437.15
Progress Load with Pond Retrofits and Non-Structural BMPs and Targeted PCB Actions
17.09 40.45
PCB WLAs 17.09 40.45
Required Reduction Remaining 0 0

14
Updated – Table 4: Summary of Incremental PCB Reductions for Curtis Creek AACO
Completed Planned Strategies
Time Step
PCB load reduction from BMPs added between 2011 and 2015 (g/year)
PCB load reduction from Structural BMPs (g/year)
Annual PCB load reduction from Non-Structural BMPs (combining street sweeping and inlet cleaning) (g/year)*
PCB load reduction from Targeted PCB Actions (g/year)
Total PCB load reduction for time step (g/year)
Percent of overall reduction required from 2011 Baseline (245.8 g/year)
2015 Progress 0.8 - - - 0.8 0.3%
2017 - 8.79 1.3 0 10.1 4.1%
2019 - 3.81 - 57.48 61.3 25.0%
2021 - 0.37 - 114.96 115.3 46.9%
2025 - 0.81 - 57.48 58.3 23.7%
Total 0.8 13.78 1.3 229.92 245.8 100% * The PCB load reduction from Non-structural BMPs is applied to the Total PCB Load Reduction only at time step 2017. It is
assumed the same level of street sweeping and inlet cleaning will be carried out every year such that the reduction continues
through 2025 and beyond.
Updated – Table 5: Summary of Incremental PCB Reductions for Baltimore Harbor AACO
Completed Planned Strategies
Time Step
PCB load reduction from BMPs added between 2011 and 2015 (g/year)
PCB load reduction from Structural BMPs (g/year)
PCB load reduction from Non-Structural BMPs (combining street sweeping and inlet cleaning) (g/year)
PCB load reduction from Targeted PCB Actions (g/year)
Total PCB load reduction for time step (g/year)
Percent of overall reduction required from baseline (414.1 g/year)
2015 Progress 1.22 - - - 1.2 0.3%
2017 - 1.76 2.68 0 4.4 1.1%
2019 - 6.24 - 99.17 105.4 25.4%
2021 - 0 - 198.35 198.4 47.9%
2025 - 5.5 - 99.18 104.7 25.3%
Total 1.22 13.5 2.68 396.7 414.1 100% * The PCB load reduction from Non-structural BMPs is applied to the Total PCB Load Reduction only at time step 2017. It is
assumed the same level of street sweeping and inlet cleaning will be carried out every year such that the reduction continues
through 2025 and beyond.
15
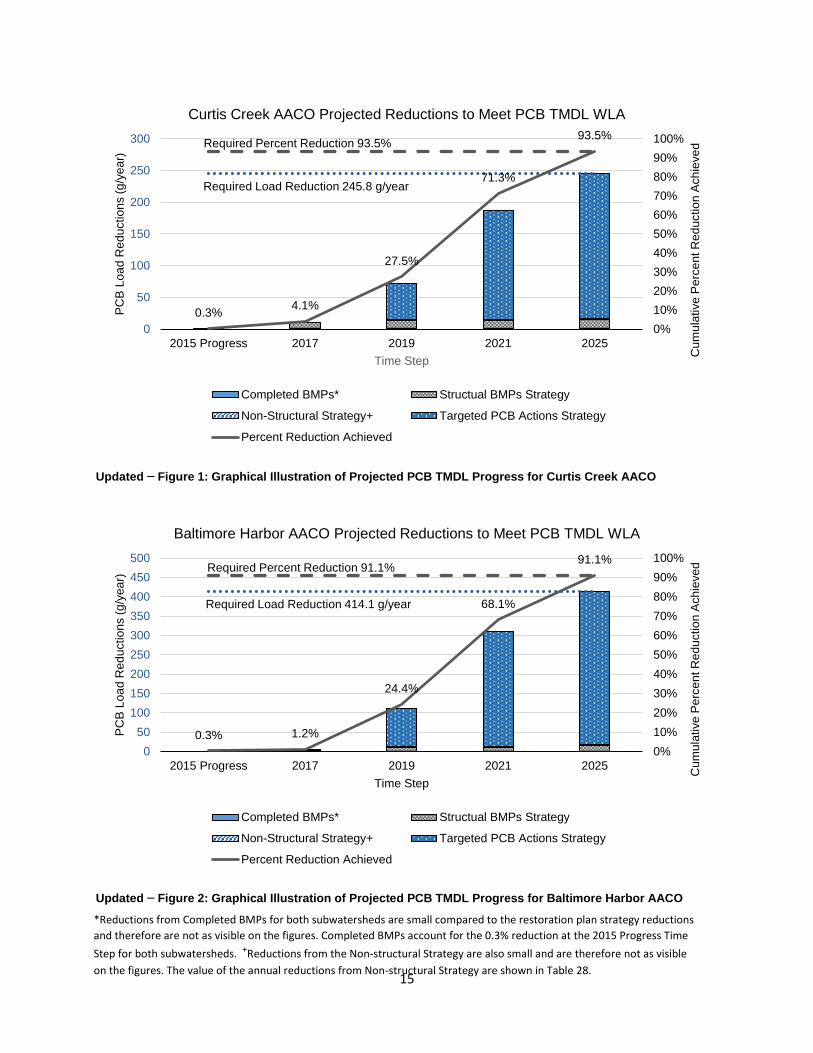
Updated – Figure 1: Graphical Illustration of Projected PCB TMDL Progress for Curtis Creek AACO
Updated – Figure 2: Graphical Illustration of Projected PCB TMDL Progress for Baltimore Harbor AACO
0.3%4.1%
27.5%
71.3%
93.5%
0%
10%
20%
30%
40%
50%
60%
70%
80%
90%
100%
0
50
100
150
200
250
300
2015 Progress 2017 2019 2021 2025
Cu
mu
lative
Pe
rce
nt R
ed
uctio
n A
ch
ieve
d
PC
B L
oa
d R
ed
uctio
ns (
g/y
ea
r)
Time Step
Curtis Creek AACO Projected Reductions to Meet PCB TMDL WLA
Completed BMPs* Structual BMPs Strategy
Non-Structural Strategy+ Targeted PCB Actions Strategy
Percent Reduction Achieved
Required Percent Reduction 93.5%
Required Load Reduction 245.8 g/year
0.3% 1.2%
24.4%
68.1%
91.1%
0%
10%
20%
30%
40%
50%
60%
70%
80%
90%
100%
0
50
100
150
200
250
300
350
400
450
500
2015 Progress 2017 2019 2021 2025
Cum
ula
tive
Pe
rce
nt R
ed
uctio
n A
ch
ieve
d
PC
B L
oa
d R
ed
uctio
ns (
g/y
ea
r)
Time Step
Baltimore Harbor AACO Projected Reductions to Meet PCB TMDL WLA
Completed BMPs* Structual BMPs Strategy
Non-Structural Strategy+ Targeted PCB Actions Strategy
Percent Reduction Achieved
Required Percent Reduction 91.1%
Required Load Reduction 414.1 g/year
*Reductions from Completed BMPs for both subwatersheds are small compared to the restoration plan strategy reductions
and therefore are not as visible on the figures. Completed BMPs account for the 0.3% reduction at the 2015 Progress Time
Step for both subwatersheds. +Reductions from the Non-structural Strategy are also small and are therefore not as visible
on the figures. The value of the annual reductions from Non-structural Strategy are shown in Table 28.
16
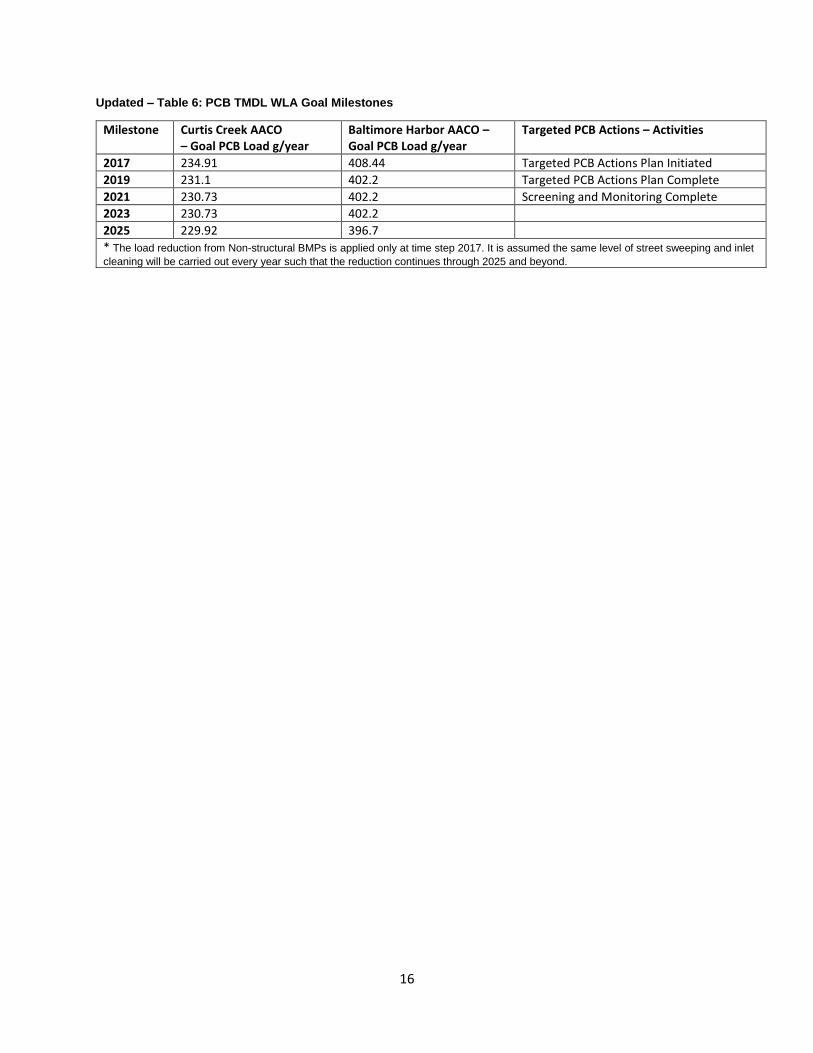
Updated – Table 6: PCB TMDL WLA Goal Milestones
Milestone Curtis Creek AACO – Goal PCB Load g/year
Baltimore Harbor AACO – Goal PCB Load g/year
Targeted PCB Actions – Activities
2017 234.91 408.44 Targeted PCB Actions Plan Initiated
2019 231.1 402.2 Targeted PCB Actions Plan Complete
2021 230.73 402.2 Screening and Monitoring Complete
2023 230.73 402.2
2025 229.92 396.7
* The load reduction from Non-structural BMPs is applied only at time step 2017. It is assumed the same level of street sweeping and inlet
cleaning will be carried out every year such that the reduction continues through 2025 and beyond.
17
4. The county plans to use mitigation levels specified by MDE for screening PCB contamination in structural BMPs. MDE suggests applying the sediment TMDL endpoint in this evaluation as VCP cleanup standards are only protective of human health from direct exposure to contaminated soil. The TMDL endpoint is more stringent and ultimately protective of the fishing designated use for which the TMDL is defined.
The Baltimore Harbor and Curtis Creek/Bay PCB TMDL Restoration Plan intended to provide a description of the general approach planned for the tasks of screening and monitoring as well as addressing PCB contaminated sediment. Specific details of these tasks are to be fully explained and advanced in the proposed Targeted PCB Action Plan. On page 40 of the Baltimore Harbor and Curtis Creek/Bay PCB TMDL Restoration Plan, it was the County’s intent to express planned compliance with the MDE guidance document, “MDE Recommendations for Addressing the PCB SW-WLA” which states in 2.a.ii.:
“If PCBs are found above detection levels, but below required mitigation levels, the county should briefly document and justify its decision on whether remediation steps will be taken.”
In order to explain how the County would comply with the above guidance, the County suggested it would use the MDE VCP cleanup standards for comparison of screening and monitoring results in the absence of specific MDE mitigation levels for PCBs in BMPs. Incorporating additional research prompted by MDE’s comment, the County instead proposes to use site specific mitigation levels that will be determined for each site. The County believes this revised approach is consistent with the approach proposed by Prince George’s County Restoration Plan for PCB-Impacted Waters and also follows the precedent set by federally regulated remediation projects that suggests the use of initial screening levels that are then refined into remediation goals tailored to the specific risk exposures presented by the site. The County plans to detail this revised approach for determining required mitigation levels in the proposed Targeted PCB Action Plan. Regarding the use of the TMDL endpoint in screening, the County wishes to clarify its understanding that the proposed use of the sediment TMDL endpoint is not that it would be applied as a required mitigation level for addressing PCB contaminated sediment, but rather that it would be used to guide decision making during the screening and monitoring tasks. The Baltimore Harbor sediment PCB TMDL endpoint was calculated incorporating bioaccumulation factors to be protective of fishing and is specific to the risk associated with sediment in the Baltimore Harbor embayment waterbody. As such, the County believes the TMDL endpoint should not be the only screening level applicable to BMP sediments because the sediment is not in the embayment waterbody at present and BMP sediments are expected to have higher concentrations due to the concentrating effect of retention. Instead, the County proposes using an iterative approach to evaluating the results of their screening and subsequent monitoring efforts that incorporates the TMDL endpoint (3.1 ng/g) as well as other relevant PCB sediment standards referenced in the Baltimore Harbor TMDL including the sediment quality guideline (SQG) effects-range median (ERM) (180 ng/g) used to classify waterbodies as impaired for sediment, and the SQG Threshold Effects Level (TEL) (21.9 ng/g). The County plans to detail the suggested iterative approach in the proposed Targeted PCB Action Plan. However, the strategy may be described generally as follows. The PCB sediment standards may be used for screening by first employing the highest value proceeding to the lowest value until the County is able to identify a sufficient number of sites to select for further monitoring and investigation of potential PCB sources within the drainage area. This approach allows the County to increase the stringency of screening level as appropriate to prioritize finding BMPs with the highest PCB concentrations, while also providing flexibility which the County feels is important since little is known about what concentrations the County will encounter once sampling begins.

18
5. The county plans to achieve the WLA through the removal and disposal of PCB contaminated sediments from BMPs. While the county is following MDE's guidance for PCB MS4 stormwater implementation, MDE is planning to overhaul the guidance in the near future. The guidance indicates that counties may be credited for PCB load reduction through the removal of contaminated materials from stormwater management facilities; however, MDE has determined that this will not contribute to achieving the WLA. Only the reduction of PCB loads discharged from BMPs will meet this goal. The restoration plan already accounts for this through retrofits or the implementation of new BMPs. Therefore in order to achieve the required reductions it will be necessary to focus on identifying and remediating sites with PCB soil contamination responsible for transporting PCBs to BMPs or directly to the waterways. The restoration plan has laid out the framework for this approach which MDE suggests should be the focus of implementation. The county should not consider dredged maintenance of BMPs in order to achieve PCB reductions. This should only be done in order to maintain trapping capacity within these BMPs or to address other contaminants of concern.
The County acknowledges current guidance from MDE for crediting removal of PCB contaminated sediment from BMPs would result in a reduction calculated in units of mass that is inconsistent with the WLA which is expressed in units of mass per unit time, and as such, the County agrees new guidance for crediting seems appropriate.
The County appreciates the advance notice of the anticipated upcoming changes to MDE’s
guidance for crediting removal of PCB contaminated sediment from stormwater management
facilities. The County will take this information into consideration in the development of the
Targeted PCB Action Plan by emphasizing the importance of locating and addressing sources
of PCBs. The County anticipates maintaining its strategy to first identify contaminated BMPs
and then carry out additional source tracking as practicable on an individual BMP basis. The
County anticipates awaiting the final publication of the updated guidance before finalizing the
proposed Targeted PCB Action Plan to ensure the full content of the updated guidance can be
incorporated.