bangalore elecrticty supply company …bescom.org/.../uploads/2016/01/chapter8-new-proposal.docx ·...
TRANSCRIPT
BANGALORE ELECRTICTY SUPPLY COMPANY NEW PROPOSALS
CHAPTER – 8
New Proposals
I. Restructuring of tariff:
Introduction
It is pertinent to say that the approved revenue receipts are not being achieved with the
existing tariff structure. The primary reason for the latter loss is that BESCOM is unable to
meet the approved level of sales and also the approved sales mix. It is inappropriate to
propose tariff hike to cover such losses. Therefore we agree that the existing electricity
tariff structure should be amended.
i. Telescopic tariff - Domestic Sector
The electricity bill of poor and middle class consumers (consumption between 50 - 100
units) who consume less pay more rate than affluent consumers who consume an excessive
quantity of electricity. This is revealed in the paras below.
The existing tariff structure fetches an average rate of Rs.4.71 per unit from the domestic
consumers as against the actual average cost of supply of Rs.5.64 per unit.
BESCOM is proposing a new tariff structure which will fatten the purse of the rich and at the
same time protects the pocket of the poor.
The new tariff structure is to encourage the consumers to conserve energy so that it is
possible to reduce the generation of the power. The electricity tariff should be formulated in
such a way that the rich should fill the increase in the electricity cost. This can be done by
applying an aggressive tariff increase to the higher electricity consuming consumers. This
will encourage either for them to conserve energy or to switch to solar power plant. The
present tariff structure demands cross subsidization to domestic consumers from other
categories and BESCOM sees no strategy by the Commission in making the elite among this
category of consumers paying at the cost of supply. With this burden of cross subsidy the
other cross subsidizing consumers are leaving the grid. BESCOM sees no gain in carrying
MYT 4TH CONTROL PERIOD FOR FY-17 TO FY-19 Page 210

BANGALORE ELECRTICTY SUPPLY COMPANY NEW PROPOSALS
forward the business suffering losses. BESCOM has come to this conclusion as it is unable to
supply energy to this category of consumers at the approved tariff structure.
According to the new proposal, there is no need to increase the electricity charges of the
consumers who consume below 50 units per month. This group constitutes 34% of the
domestic sector. Further, the consumers consuming above 50 units below 150units (43%)
are also not heavily burdened. All that is needed is to make a slight change in the fixed
charges within this category. It is proposed to charge the actual cost from affluent
consumers who waste electricity for luxury activities.
Even if BESCOM plans to meet the energy requirement of the domestic consumers through
hydel sources it is unable to do so as the consumers consuming higher energy are creeping
the benefit of it than the poor. BESCOM has a noble intention of supplying the poorer
consumers with hydel cost at Rs1.65/unit for life line consumption. At the same time the
consumers with higher consumption must be allowed to charge appropriately.
Therefore an effort is being made through this new proposal to reduce the cross subsidy
that is being charged to affluent consumers at the expense of the other consumers. It is
further expected that with this increase in tariff the affluent customers would opt for self-
generation.
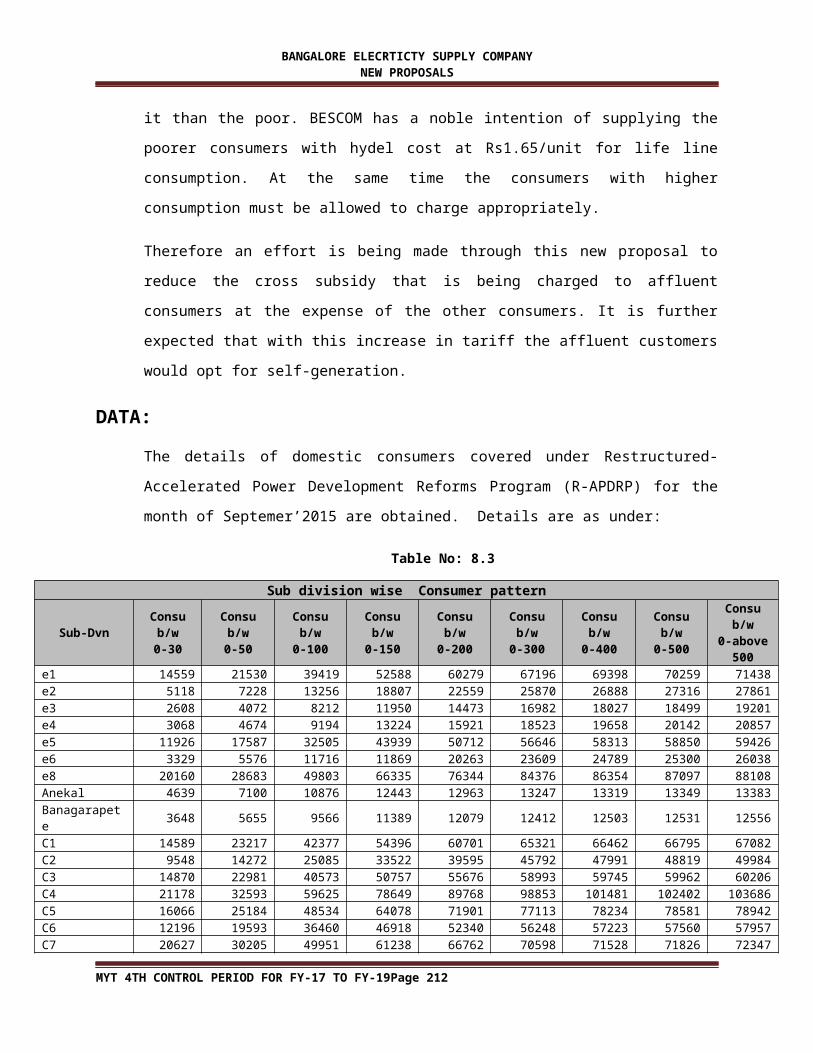
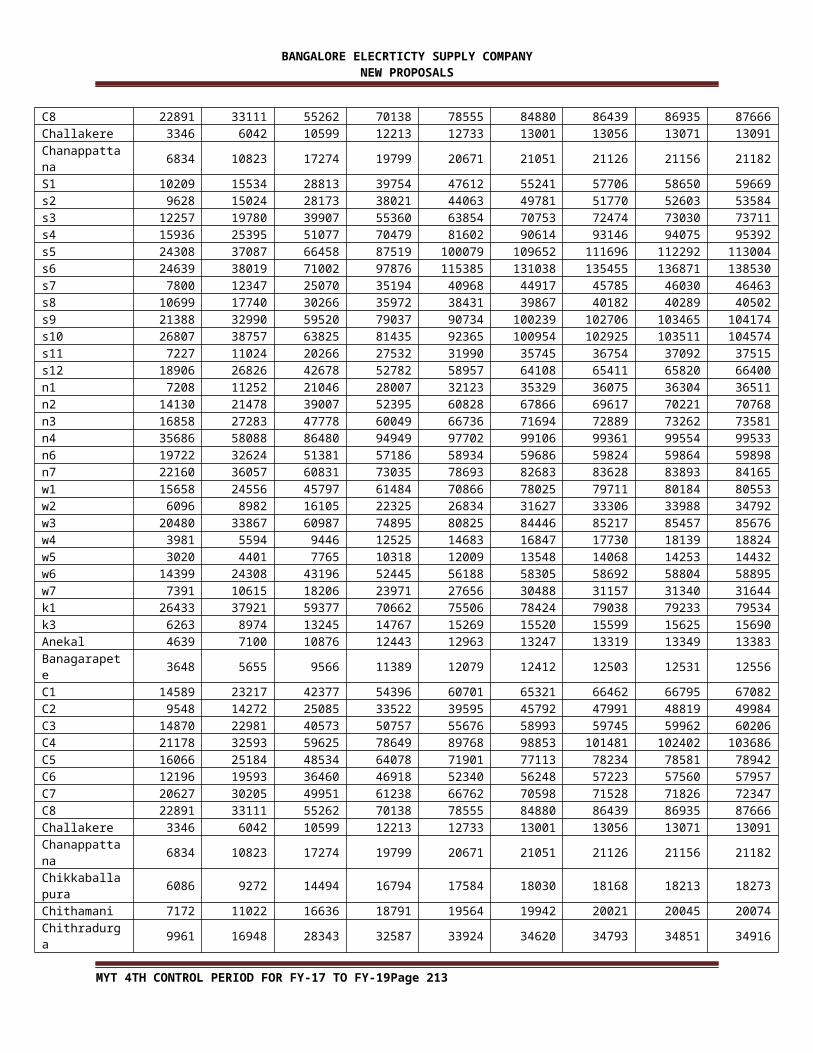
DATA:
The details of domestic consumers covered under Restructured- Accelerated Power
Development Reforms Program (R-APDRP) for the month of Septemer’2015 are obtained.
Details are as under:
Table No: 8.3
Sub division wise Consumer pattern
Sub-DvnConsu
b/w0-30
Consu b/w0-50
Consu b/w
0-100
Consu b/w
0-150
Consu b/w
0-200
Consu b/w
0-300
Consu b/w
0-400
Consu b/w
0-500
Consu b/w
0-above 500
e1 14559 21530 39419 52588 60279 67196 69398 70259 71438e2 5118 7228 13256 18807 22559 25870 26888 27316 27861e3 2608 4072 8212 11950 14473 16982 18027 18499 19201e4 3068 4674 9194 13224 15921 18523 19658 20142 20857e5 11926 17587 32505 43939 50712 56646 58313 58850 59426e6 3329 5576 11716 11869 20263 23609 24789 25300 26038e8 20160 28683 49803 66335 76344 84376 86354 87097 88108Anekal 4639 7100 10876 12443 12963 13247 13319 13349 13383
MYT 4TH CONTROL PERIOD FOR FY-17 TO FY-19 Page 211
BANGALORE ELECRTICTY SUPPLY COMPANY NEW PROPOSALS
Banagarapete 3648 5655 9566 11389 12079 12412 12503 12531 12556C1 14589 23217 42377 54396 60701 65321 66462 66795 67082C2 9548 14272 25085 33522 39595 45792 47991 48819 49984C3 14870 22981 40573 50757 55676 58993 59745 59962 60206C4 21178 32593 59625 78649 89768 98853 101481 102402 103686C5 16066 25184 48534 64078 71901 77113 78234 78581 78942C6 12196 19593 36460 46918 52340 56248 57223 57560 57957C7 20627 30205 49951 61238 66762 70598 71528 71826 72347C8 22891 33111 55262 70138 78555 84880 86439 86935 87666Challakere 3346 6042 10599 12213 12733 13001 13056 13071 13091Chanappattana 6834 10823 17274 19799 20671 21051 21126 21156 21182S1 10209 15534 28813 39754 47612 55241 57706 58650 59669s2 9628 15024 28173 38021 44063 49781 51770 52603 53584s3 12257 19780 39907 55360 63854 70753 72474 73030 73711s4 15936 25395 51077 70479 81602 90614 93146 94075 95392s5 24308 37087 66458 87519 100079 109652 111696 112292 113004s6 24639 38019 71002 97876 115385 131038 135455 136871 138530s7 7800 12347 25070 35194 40968 44917 45785 46030 46463s8 10699 17740 30266 35972 38431 39867 40182 40289 40502s9 21388 32990 59520 79037 90734 100239 102706 103465 104174s10 26807 38757 63825 81435 92365 100954 102925 103511 104574s11 7227 11024 20266 27532 31990 35745 36754 37092 37515s12 18906 26826 42678 52782 58957 64108 65411 65820 66400n1 7208 11252 21046 28007 32123 35329 36075 36304 36511n2 14130 21478 39007 52395 60828 67866 69617 70221 70768n3 16858 27283 47778 60049 66736 71694 72889 73262 73581n4 35686 58088 86480 94949 97702 99106 99361 99554 99533n6 19722 32624 51381 57186 58934 59686 59824 59864 59898n7 22160 36057 60831 73035 78693 82683 83628 83893 84165w1 15658 24556 45797 61484 70866 78025 79711 80184 80553w2 6096 8982 16105 22325 26834 31627 33306 33988 34792w3 20480 33867 60987 74895 80825 84446 85217 85457 85676w4 3981 5594 9446 12525 14683 16847 17730 18139 18824w5 3020 4401 7765 10318 12009 13548 14068 14253 14432w6 14399 24308 43196 52445 56188 58305 58692 58804 58895w7 7391 10615 18206 23971 27656 30488 31157 31340 31644k1 26433 37921 59377 70662 75506 78424 79038 79233 79534k3 6263 8974 13245 14767 15269 15520 15599 15625 15690Anekal 4639 7100 10876 12443 12963 13247 13319 13349 13383Banagarapete 3648 5655 9566 11389 12079 12412 12503 12531 12556C1 14589 23217 42377 54396 60701 65321 66462 66795 67082C2 9548 14272 25085 33522 39595 45792 47991 48819 49984C3 14870 22981 40573 50757 55676 58993 59745 59962 60206C4 21178 32593 59625 78649 89768 98853 101481 102402 103686C5 16066 25184 48534 64078 71901 77113 78234 78581 78942C6 12196 19593 36460 46918 52340 56248 57223 57560 57957C7 20627 30205 49951 61238 66762 70598 71528 71826 72347C8 22891 33111 55262 70138 78555 84880 86439 86935 87666Challakere 3346 6042 10599 12213 12733 13001 13056 13071 13091Chanappattana 6834 10823 17274 19799 20671 21051 21126 21156 21182Chikkaballapura 6086 9272 14494 16794 17584 18030 18168 18213 18273Chithamani 7172 11022 16636 18791 19564 19942 20021 20045 20074Chithradurga 9961 16948 28343 32587 33924 34620 34793 34851 34916Davanagere -2 10940 21278 35781 39935 41207 41875 42011 42068 42121Davanagere -1 18417 31614 54225 64942 69266 71746 72369 72573 72855Doddaballapura 10822 16605 24209 26634 27443 27883 27982 28014 28060E9 24762 34767 58371 74051 82272 88069 89537 89974 90701
MYT 4TH CONTROL PERIOD FOR FY-17 TO FY-19 Page 212
BANGALORE ELECRTICTY SUPPLY COMPANY NEW PROPOSALS
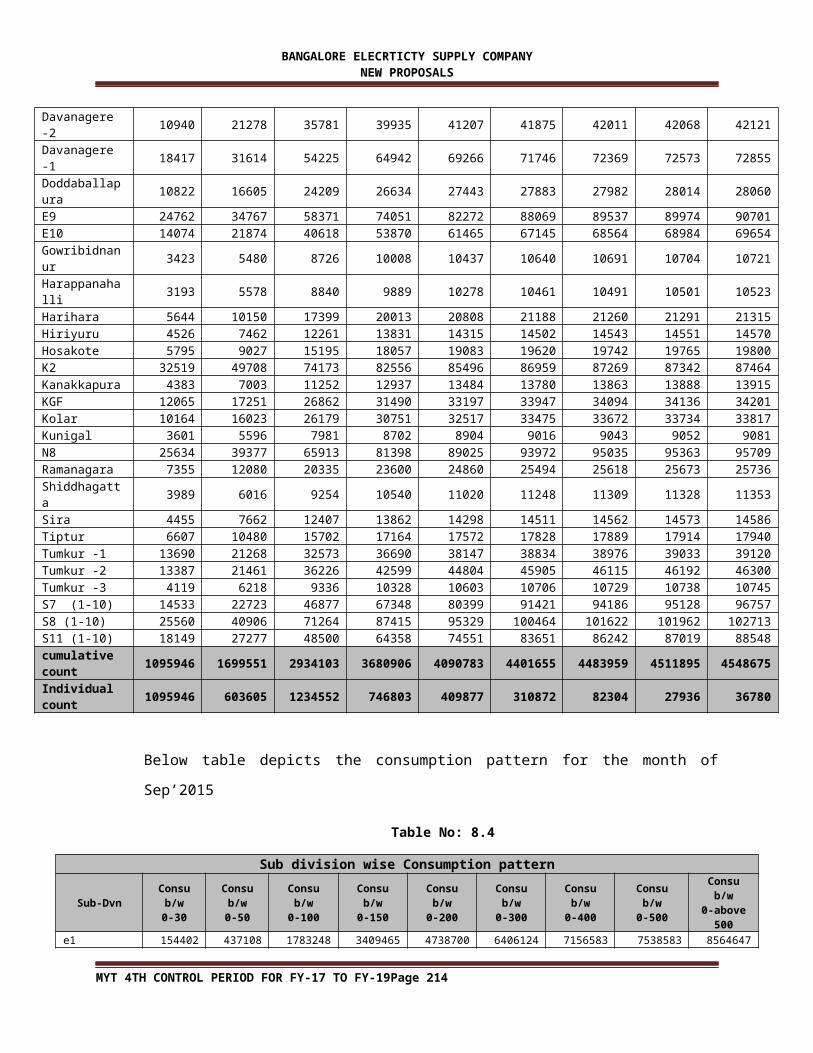
E10 14074 21874 40618 53870 61465 67145 68564 68984 69654Gowribidnanur 3423 5480 8726 10008 10437 10640 10691 10704 10721Harappanahalli 3193 5578 8840 9889 10278 10461 10491 10501 10523Harihara 5644 10150 17399 20013 20808 21188 21260 21291 21315Hiriyuru 4526 7462 12261 13831 14315 14502 14543 14551 14570Hosakote 5795 9027 15195 18057 19083 19620 19742 19765 19800K2 32519 49708 74173 82556 85496 86959 87269 87342 87464Kanakkapura 4383 7003 11252 12937 13484 13780 13863 13888 13915KGF 12065 17251 26862 31490 33197 33947 34094 34136 34201Kolar 10164 16023 26179 30751 32517 33475 33672 33734 33817Kunigal 3601 5596 7981 8702 8904 9016 9043 9052 9081N8 25634 39377 65913 81398 89025 93972 95035 95363 95709Ramanagara 7355 12080 20335 23600 24860 25494 25618 25673 25736Shiddhagatta 3989 6016 9254 10540 11020 11248 11309 11328 11353Sira 4455 7662 12407 13862 14298 14511 14562 14573 14586Tiptur 6607 10480 15702 17164 17572 17828 17889 17914 17940Tumkur -1 13690 21268 32573 36690 38147 38834 38976 39033 39120Tumkur -2 13387 21461 36226 42599 44804 45905 46115 46192 46300Tumkur -3 4119 6218 9336 10328 10603 10706 10729 10738 10745S7 (1-10) 14533 22723 46877 67348 80399 91421 94186 95128 96757S8 (1-10) 25560 40906 71264 87415 95329 100464 101622 101962 102713S11 (1-10) 18149 27277 48500 64358 74551 83651 86242 87019 88548cumulative count
1095946 1699551 2934103 3680906 4090783 4401655 4483959 4511895 4548675
Individual count
1095946 603605 1234552 746803 409877 310872 82304 27936 36780
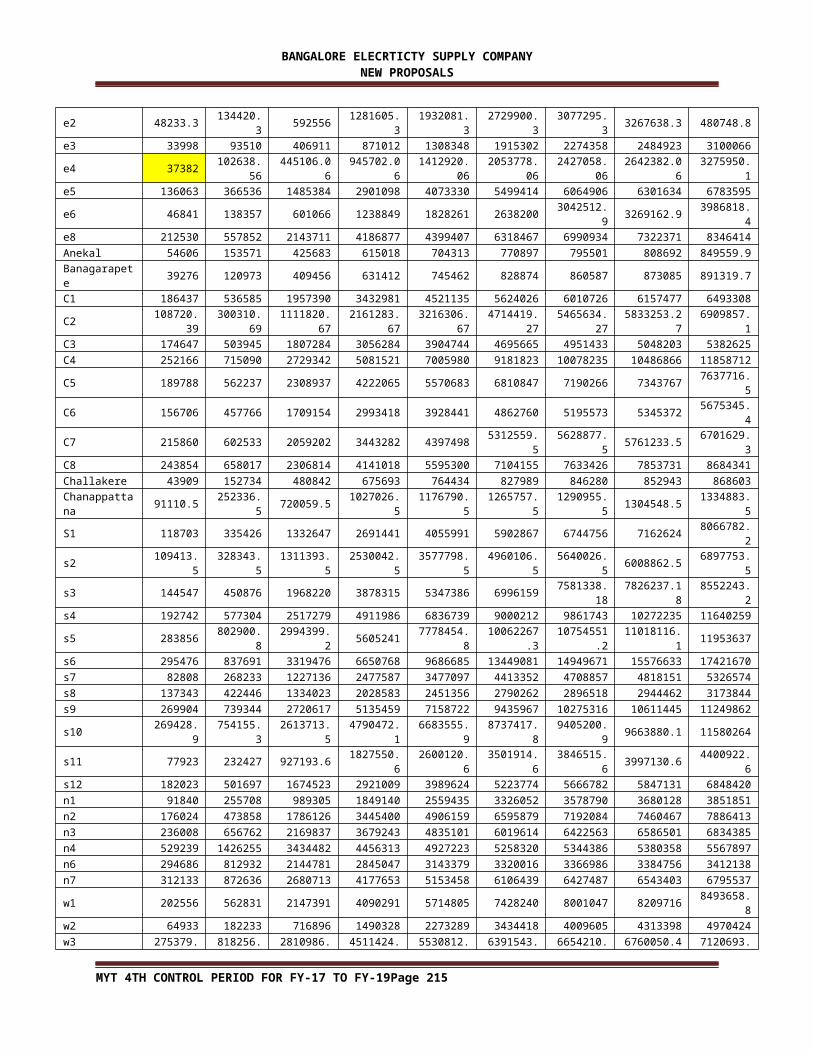
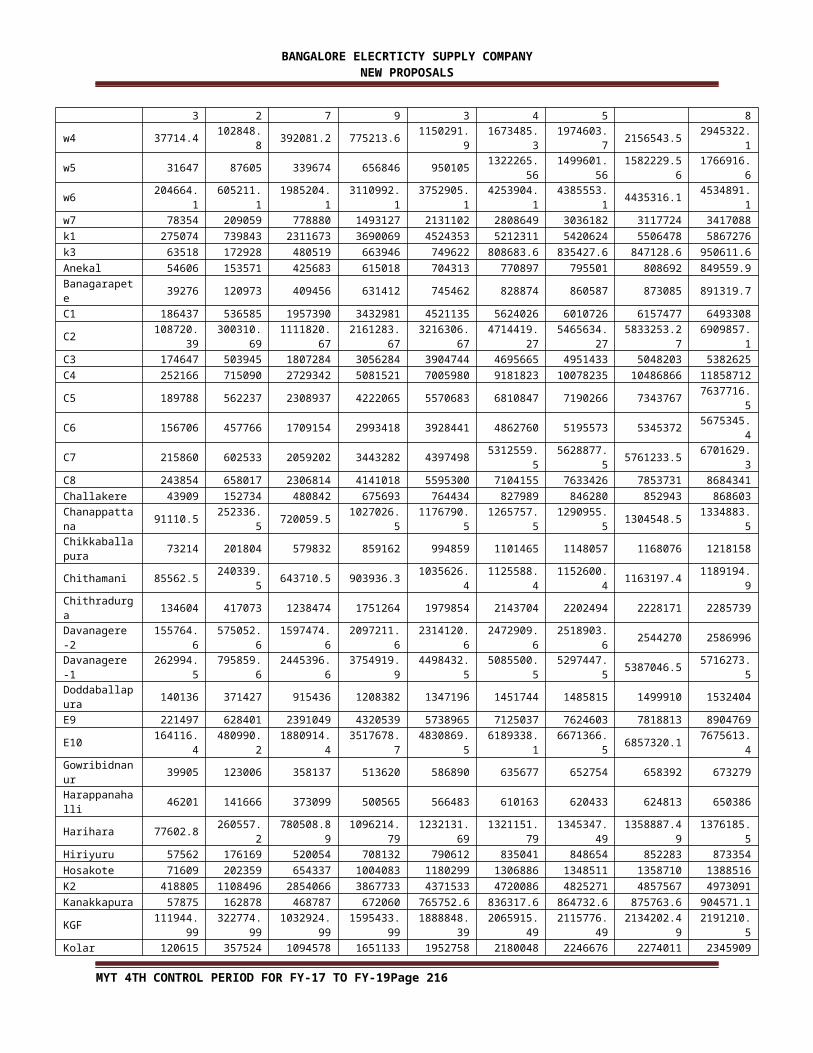
Below table depicts the consumption pattern for the month of Sep’2015
Table No: 8.4
Sub division wise Consumption pattern
Sub-DvnConsu
b/w0-30
Consu b/w0-50
Consu b/w
0-100
Consu b/w
0-150
Consu b/w
0-200
Consu b/w
0-300
Consu b/w
0-400
Consu b/w0-500
Consu b/w0-above
500e1 154402 437108 1783248 3409465 4738700 6406124 7156583 7538583 8564647
e2 48233.3 134420.3 592556 1281605.3 1932081.3 2729900.3 3077295.3 3267638.3 480748.8
e3 33998 93510 406911 871012 1308348 1915302 2274358 2484923 3100066
e4 37382102638.5
6445106.06 945702.06
1412920.06
2053778.06
2427058.06
2642382.06 3275950.1
e5 136063 366536 1485384 2901098 4073330 5499414 6064906 6301634 6783595
e6 46841 138357 601066 1238849 1828261 2638200 3042512.9 3269162.9 3986818.4
e8 212530 557852 2143711 4186877 4399407 6318467 6990934 7322371 8346414
Anekal 54606 153571 425683 615018 704313 770897 795501 808692 849559.9
Banagarapete 39276 120973 409456 631412 745462 828874 860587 873085 891319.7
C1 186437 536585 1957390 3432981 4521135 5624026 6010726 6157477 6493308
C2108720.3
9300310.6
91111820.6
72161283.6
73216306.6
74714419.2
75465634.2
75833253.27 6909857.1
C3 174647 503945 1807284 3056284 3904744 4695665 4951433 5048203 5382625
C4 252166 715090 2729342 5081521 7005980 9181823 10078235 10486866 11858712
C5 189788 562237 2308937 4222065 5570683 6810847 7190266 7343767 7637716.5
C6 156706 457766 1709154 2993418 3928441 4862760 5195573 5345372 5675345.4
C7 215860 602533 2059202 3443282 4397498 5312559.5 5628877.5 5761233.5 6701629.3
C8 243854 658017 2306814 4141018 5595300 7104155 7633426 7853731 8684341
Challakere 43909 152734 480842 675693 764434 827989 846280 852943 868603
MYT 4TH CONTROL PERIOD FOR FY-17 TO FY-19 Page 213
BANGALORE ELECRTICTY SUPPLY COMPANY NEW PROPOSALS
Chanappattana 91110.5 252336.5 720059.5 1027026.5 1176790.5 1265757.5 1290955.5 1304548.5 1334883.5
S1 118703 335426 1332647 2691441 4055991 5902867 6744756 7162624 8066782.2
s2 109413.5 328343.5 1311393.5 2530042.5 3577798.5 4960106.5 5640026.5 6008862.5 6897753.5
s3 144547 450876 1968220 3878315 5347386 69961597581338.1
87826237.18 8552243.2
s4 192742 577304 2517279 4911986 6836739 9000212 9861743 10272235 11640259
s5 283856 802900.8 2994399.2 5605241 7778454.810062267.
310754551.
211018116.1 11953637
s6 295476 837691 3319476 6650768 9686685 13449081 14949671 15576633 17421670
s7 82808 268233 1227136 2477587 3477097 4413352 4708857 4818151 5326574
s8 137343 422446 1334023 2028583 2451356 2790262 2896518 2944462 3173844
s9 269904 739344 2720617 5135459 7158722 9435967 10275316 10611445 11249862
s10 269428.9 754155.3 2613713.5 4790472.1 6683555.9 8737417.8 9405200.9 9663880.1 11580264
s11 77923 232427 927193.6 1827550.6 2600120.6 3501914.6 3846515.6 3997130.6 4400922.6
s12 182023 501697 1674523 2921009 3989624 5223774 5666782 5847131 6848420
n1 91840 255708 989305 1849140 2559435 3326052 3578790 3680128 3851851
n2 176024 473858 1786126 3445400 4906159 6595879 7192084 7460467 7886413
n3 236008 656762 2169837 3679243 4835101 6019614 6422563 6586501 6834385
n4 529239 1426255 3434482 4456313 4927223 5258320 5344386 5380358 5567897
n6 294686 812932 2144781 2845047 3143379 3320016 3366986 3384756 3412138
n7 312133 872636 2680713 4177653 5153458 6106439 6427487 6543403 6795537
w1 202556 562831 2147391 4090291 5714805 7428240 8001047 8209716 8493658.8
w2 64933 182233 716896 1490328 2273289 3434418 4009605 4313398 4970424
w3 275379.3 818256.2 2810986.7 4511424.9 5530812.3 6391543.4 6654210.5 6760050.4 7120693.8
w4 37714.4 102848.8 392081.2 775213.6 1150291.9 1673485.3 1974603.7 2156543.5 2945322.1
w5 31647 87605 339674 656846 9501051322265.5
61499601.5
61582229.56 1766916.6
w6 204664.1 605211.1 1985204.1 3110992.1 3752905.1 4253904.1 4385553.1 4435316.1 4534891.1
w7 78354 209059 778880 1493127 2131102 2808649 3036182 3117724 3417088
k1 275074 739843 2311673 3690069 4524353 5212311 5420624 5506478 5867276
k3 63518 172928 480519 663946 749622 808683.6 835427.6 847128.6 950611.6
Anekal 54606 153571 425683 615018 704313 770897 795501 808692 849559.9
Banagarapete 39276 120973 409456 631412 745462 828874 860587 873085 891319.7
C1 186437 536585 1957390 3432981 4521135 5624026 6010726 6157477 6493308
C2108720.3
9300310.6
91111820.6
72161283.6
73216306.6
74714419.2
75465634.2
75833253.27 6909857.1
C3 174647 503945 1807284 3056284 3904744 4695665 4951433 5048203 5382625
C4 252166 715090 2729342 5081521 7005980 9181823 10078235 10486866 11858712
C5 189788 562237 2308937 4222065 5570683 6810847 7190266 7343767 7637716.5
C6 156706 457766 1709154 2993418 3928441 4862760 5195573 5345372 5675345.4
C7 215860 602533 2059202 3443282 4397498 5312559.5 5628877.5 5761233.5 6701629.3
C8 243854 658017 2306814 4141018 5595300 7104155 7633426 7853731 8684341
Challakere 43909 152734 480842 675693 764434 827989 846280 852943 868603
Chanappattana 91110.5 252336.5 720059.5 1027026.5 1176790.5 1265757.5 1290955.5 1304548.5 1334883.5Chikkaballapura
73214 201804 579832 859162 994859 1101465 1148057 1168076 1218158
Chithamani 85562.5 240339.5 643710.5 903936.3 1035626.4 1125588.4 1152600.4 1163197.4 1189194.9
Chithradurga 134604 417073 1238474 1751264 1979854 2143704 2202494 2228171 2285739
Davanagere -2 155764.6 575052.6 1597474.6 2097211.6 2314120.6 2472909.6 2518903.6 2544270 2586996
Davanagere -1 262994.5 795859.6 2445396.6 3754919.9 4498432.5 5085500.5 5297447.5 5387046.5 5716273.5Doddaballapura
140136 371427 915436 1208382 1347196 1451744 1485815 1499910 1532404
E9 221497 628401 2391049 4320539 5738965 7125037 7624603 7818813 8904769
E10 164116.4 480990.2 1880914.4 3517678.7 4830869.5 6189338.1 6671366.5 6857320.1 7675613.4
Gowribidnanur 39905 123006 358137 513620 586890 635677 652754 658392 673279
MYT 4TH CONTROL PERIOD FOR FY-17 TO FY-19 Page 214
BANGALORE ELECRTICTY SUPPLY COMPANY NEW PROPOSALS
Harappanahalli 46201 141666 373099 500565 566483 610163 620433 624813 650386
Harihara 77602.8 260557.2 780508.891096214.7
91232131.6
91321151.7
91345347.4
91358887.49 1376185.5
Hiriyuru 57562 176169 520054 708132 790612 835041 848654 852283 873354
Hosakote 71609 202359 654337 1004083 1180299 1306886 1348511 1358710 1388516
K2 418805 1108496 2854066 3867733 4371533 4720086 4825271 4857567 4973091
Kanakkapura 57875 162878 468787 672060 765752.6 836317.6 864732.6 875763.6 904571.1
KGF111944.9
9322774.9
91032924.9
91595433.9
91888848.3
92065915.4
92115776.4
92134202.49 2191210.5
Kolar 120615 357524 1094578 1651133 1952758 2180048 2246676 2274011 2345909
Kunigal 47501 127436 297099 383408 417830.2 444603.2 453692.2 457723.2 488115.2
N8 334569 889445 2845020 4748893 6061654 7239678 7600386 7745289 8037516
Ramanagara 96007 287629 886685 1284327 1500225 1648713 1691293 1715433 1768654
Shiddhagatta 45024 126691 361211 517015 599363 653354 673810 681988 702209
Sira 64631.9 194237.9 532352.8 707450.8 782297.8 833033.8 850148.8 854898.8 866806.8
Tiptur 89539 244588 617210 793217 863360 923355 944029 955198.42 974278.42
Tumkur -1 181544 487175.5 1304270 1802318 2052373 2215833 2264450 2289093 2394443
Tumkur -2 175810 501443 1580702 2353398 2729807 2989134 3060754 3094676 3199343.5
Tumkur -3 53891 138736 362971 482165 528789 552682 560415 564458 571542
S7 (1-10) 160382 495227 2330927 4869316 7133507 9776064 10717352 11135521 13870326
S8 (1-10) 315569 938249 3161147 5142284 6506712 7727690 8121105 8271728 9686154
S11 (1-10) 193632 564052 2148911 4116756 5884202 8076004 8957084 9301369 12048042Cumulative sum
13219655
37653715
128876405
221402716
289836142
364280647
392273023
40460495144373445
5Individual sum
13219655
24434060
91222690 92526311 68433425 74444504 27992376 12331927 39129505
From the existing tariff the different consumption patterns are computed considering 1 KW
as sanctioned load for consumption below 50 units and 3 KW for consumption above 50
units as shown in the table below:
Table No: 8.5
Consumption Fixed charge
Energy charge at existing rate
Total bill
Avg, variable charge
Avg Fixed charge
Avg rate of realization
30 25 81 111 2.7 0.83 3.5350 25 161 211 3.2 0.50 3.72
100 70 361 461 3.6 0.70 4.31150 95 628.5 778.5 4.2 0.63 4.82200 95 896 1096 4.5 0.48 4.96300 95 1521 1821 5.1 0.32 5.39400 95 2146 2546 5.4 0.24 5.60500 95 2771 3271 5.5 0.19 5.73
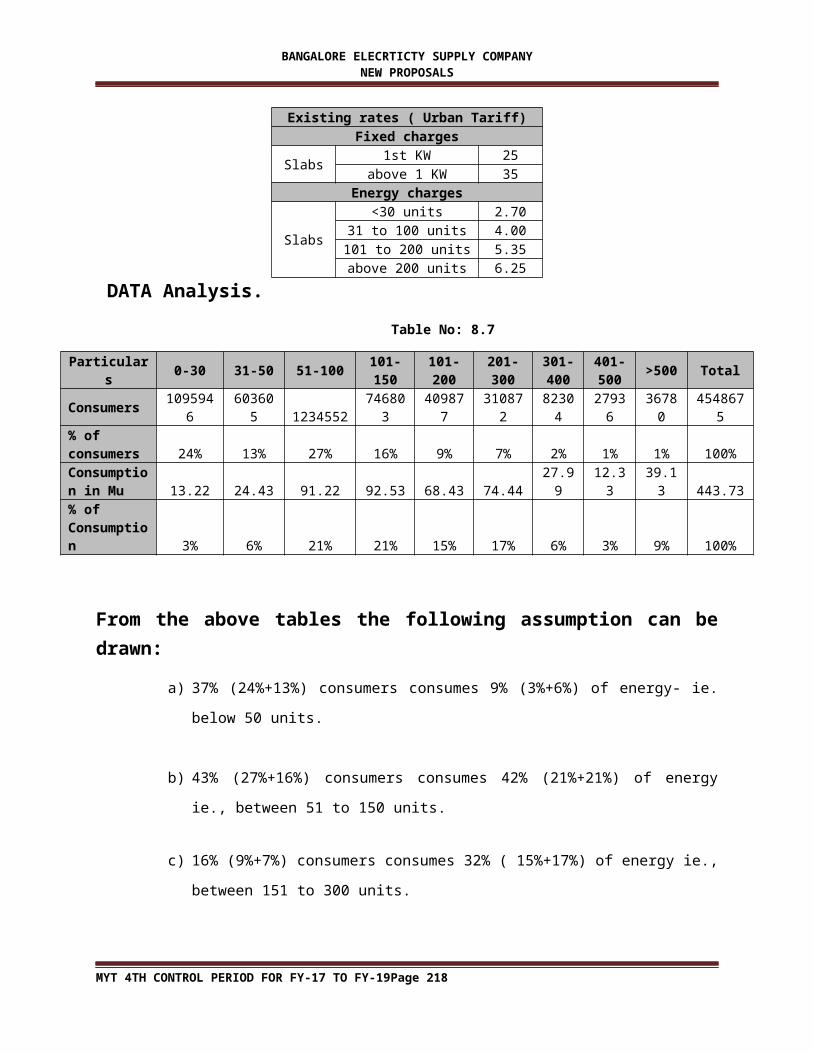
Existing Tariff rate:
Table No: 8.6
Existing rates ( Urban Tariff)
MYT 4TH CONTROL PERIOD FOR FY-17 TO FY-19 Page 215
BANGALORE ELECRTICTY SUPPLY COMPANY NEW PROPOSALS
Fixed charges
Slabs1st KW 25
above 1 KW 35Energy charges
Slabs
<30 units 2.7031 to 100 units 4.00
101 to 200 units 5.35above 200 units 6.25
DATA Analysis.
Table No: 8.7
Particulars 0-30 31-50 51-100101-150
101-200
201-300
301-400
401-500 >500 Total
Consumers 1095946 603605 1234552 746803 409877 310872 82304 27936 36780 4548675% of consumers 24% 13% 27% 16% 9% 7% 2% 1% 1% 100%Consumption in Mu 13.22 24.43 91.22 92.53 68.43 74.44 27.99 12.33 39.13 443.73% of Consumption
3% 6% 21% 21% 15% 17% 6% 3% 9% 100%
From the above tables the following assumption can be drawn:
a) 37% (24%+13%) consumers consumes 9% (3%+6%) of energy- ie. below 50 units.
b) 43% (27%+16%) consumers consumes 42% (21%+21%) of energy ie., between 51
to 150 units.
c) 16% (9%+7%) consumers consumes 32% ( 15%+17%) of energy ie., between 151
to 300 units.
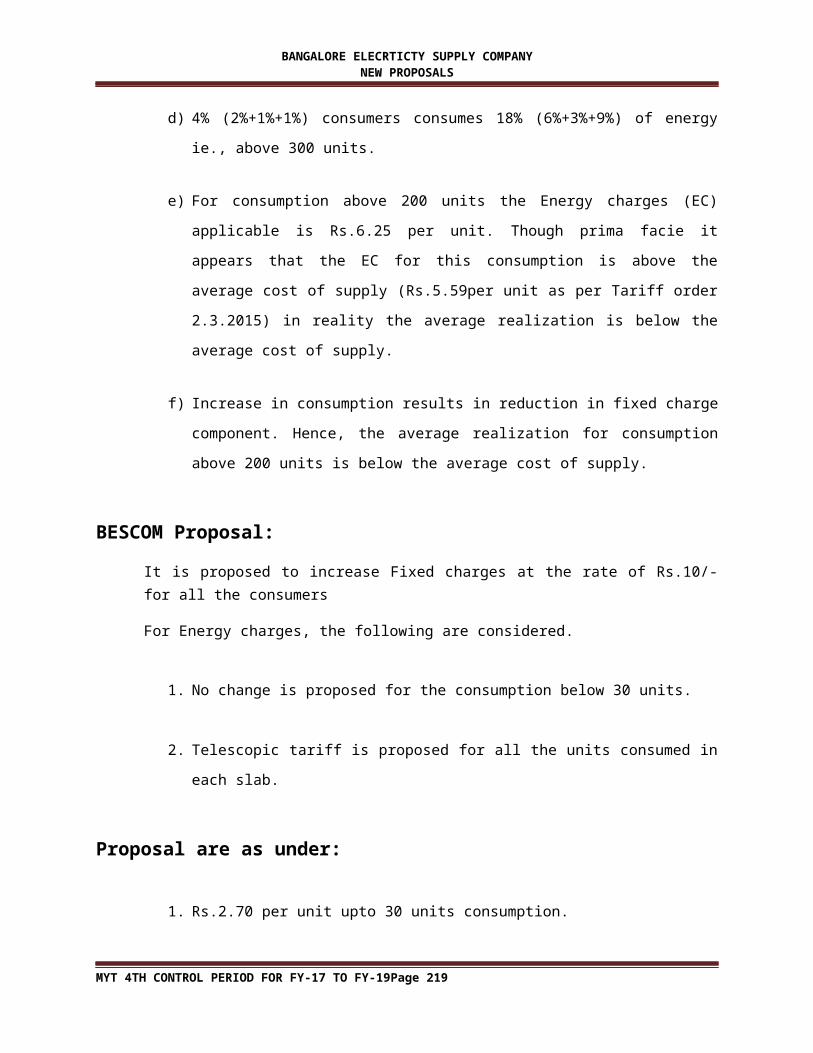
d) 4% (2%+1%+1%) consumers consumes 18% (6%+3%+9%) of energy ie., above
300 units.
e) For consumption above 200 units the Energy charges (EC) applicable is Rs.6.25 per
unit. Though prima facie it appears that the EC for this consumption is above the
average cost of supply (Rs.5.59per unit as per Tariff order 2.3.2015) in reality the
average realization is below the average cost of supply.
MYT 4TH CONTROL PERIOD FOR FY-17 TO FY-19 Page 216

BANGALORE ELECRTICTY SUPPLY COMPANY NEW PROPOSALS
f) Increase in consumption results in reduction in fixed charge component. Hence, the
average realization for consumption above 200 units is below the average cost of
supply.
BESCOM Proposal:
It is proposed to increase Fixed charges at the rate of Rs.10/- for all the consumers
For Energy charges, the following are considered.
1. No change is proposed for the consumption below 30 units.
2. Telescopic tariff is proposed for all the units consumed in each slab.
Proposal are as under:
1. Rs.2.70 per unit upto 30 units consumption.
2. Rs.3.5 per unit for all the monthly units if the consumption exceeds 30 units and
upto 50 units.
3. Rs.4.8 per unit for all the monthly units if the consumption exceeds 50 units and
upto 200 units.
4. Rs.5.4 per unit for all the monthly units if the consumption exceeds 200 units and
upto 300 units.
5. Rs.5.75 per unit for all the monthly units if the consumption exceeds 300 units and
upto 400 units.
6. Rs.5.95 per unit for all the monthly units if the consumption exceeds 400 units and
upto 500 units.
7. Rs.6.1 per units for monthly units if the consumption exceeds 500 units.
MYT 4TH CONTROL PERIOD FOR FY-17 TO FY-19 Page 217
BANGALORE ELECRTICTY SUPPLY COMPANY NEW PROPOSALS
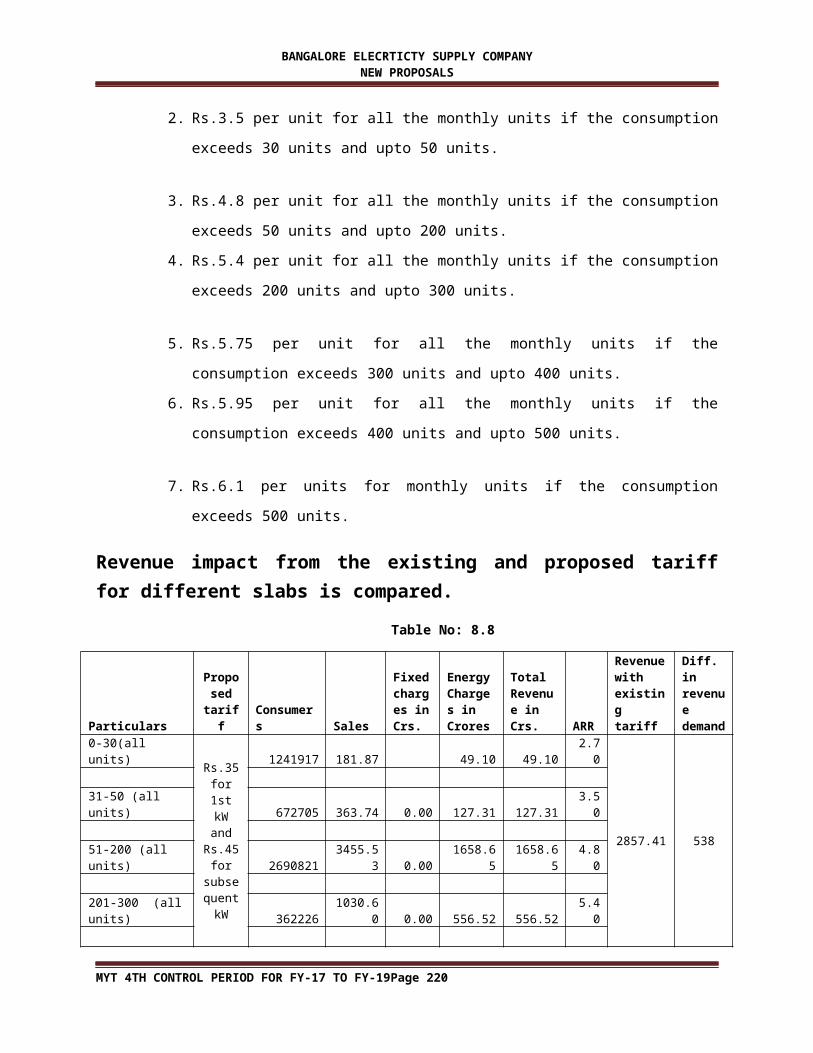
Revenue impact from the existing and proposed tariff for different slabs is compared.
Table No: 8.8
Particulars
Proposed
tariff Consumers Sales
Fixed charges in Crs.
Energy Charges in Crores
Total Revenue in Crs. ARR
Revenue with existing tariff
Diff. in revenue demand
0-30(all units)
Rs.35 for 1st
kW and Rs.45
for subseq
uent kW
1241917 181.87 49.10 49.10 2.70
2857.41 538
31-50 (all units) 672705 363.74 0.00 127.31 127.31 3.50
51-200 (all units) 2690821 3455.53 0.00 1658.65 1658.65 4.80
201-300 (all units) 362226 1030.60 0.00 556.52 556.52 5.40
301-400 (all units) 103493 363.74 0.00 209.15 209.15 5.75
401-500 (all units) 51747 181.87 0.00 108.21 108.21 5.95
> 500 (all units) 51747 484.99 0.00 295.84 295.84 6.10
Total 5174655 6062 391 3005 3395 2857.41 538.00
ii. Voltage class wise tariff for HT- consumers
Introduction:
Government owned distribution companies have lost the opportunity of competition in the
market consequent to open access. Existing Acts, Regulations favors competition. These
relaxed laws have allowed the generators to cherry pick consumers from distribution
companies. This has resulted in losing the competence of competition. On these grounds
reduction in variable charges for the HT consumers and increase in demand charges by
introducing voltage class wise tariff are proposed.
DATA.
Details of expenditure incurred towards fixed and variable cost for the last 3 years and receipts for the last 3 years are tabulated below:
MYT 4TH CONTROL PERIOD FOR FY-17 TO FY-19 Page 218
BANGALORE ELECRTICTY SUPPLY COMPANY NEW PROPOSALS
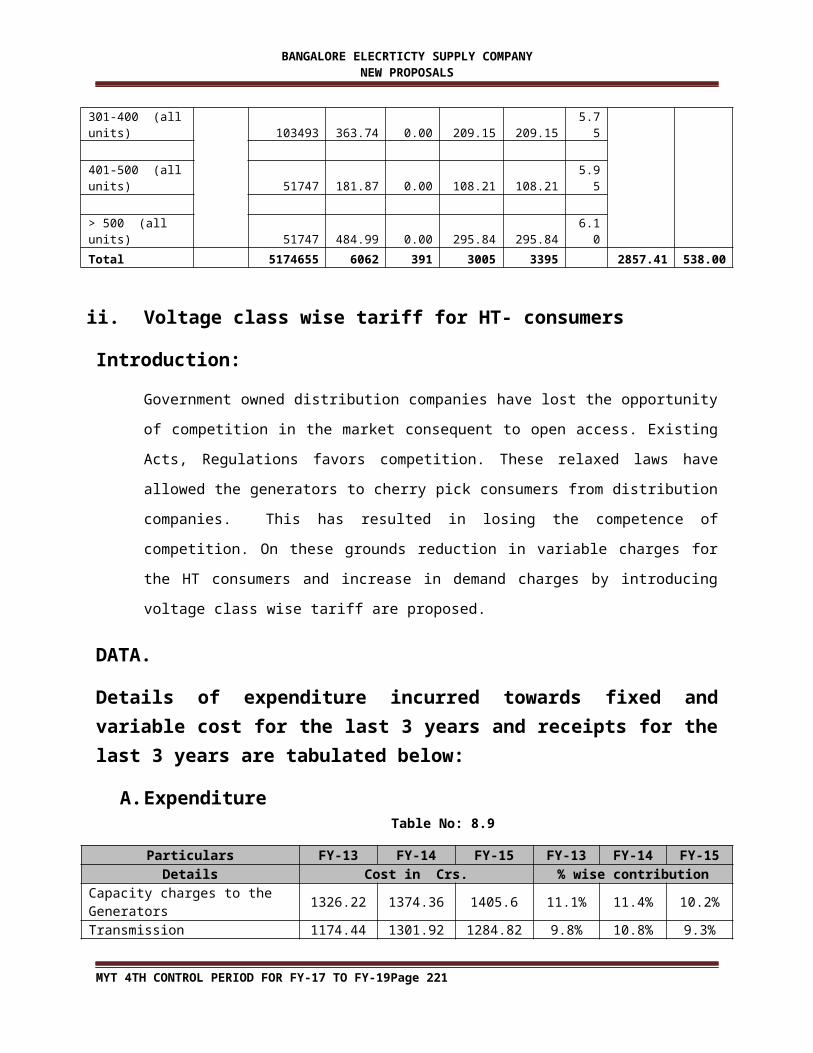
A. ExpenditureTable No: 8.9
Particulars FY-13 FY-14 FY-15 FY-13 FY-14 FY-15Details Cost in Crs. % wise contribution
Capacity charges to the Generators 1326.22 1374.36 1405.6 11.1% 11.4% 10.2%Transmission charge(KPTCL+PGCL) to Transmission utilities
1174.44 1301.92 1284.82 9.8% 10.8% 9.3%
Distribution-wire business 731.09 767.34 996.39 6.1% 6.4% 7.2%Distribution-Supply business 500.29 585.55 852.55 4.2% 4.9% 6.2%Total Fixed charge 3732.04 4029.17 4539.36 31.3% 33.4% 33.0%Variable charge ( Power purchase) 8203.23 8026.47 9233.47 68.7% 66.6% 67.0%Total ARR 11935.27 12055.64 13772.83 100.0% 100.0% 100.0%
B. Receipts:Table No: 8.10
DetailsFY-13 FY-14 FY-15 FY-13 FY-14 FY-15
Receipts in Crs. % wise contributionFixed charge 1124.97 1312.34 1551.02 10% 11% 12%Energy Charge 9662.27 10237.34 11574.22 90% 89% 88%Total 10787.24 11549.68 13125.24 100% 100% 100%
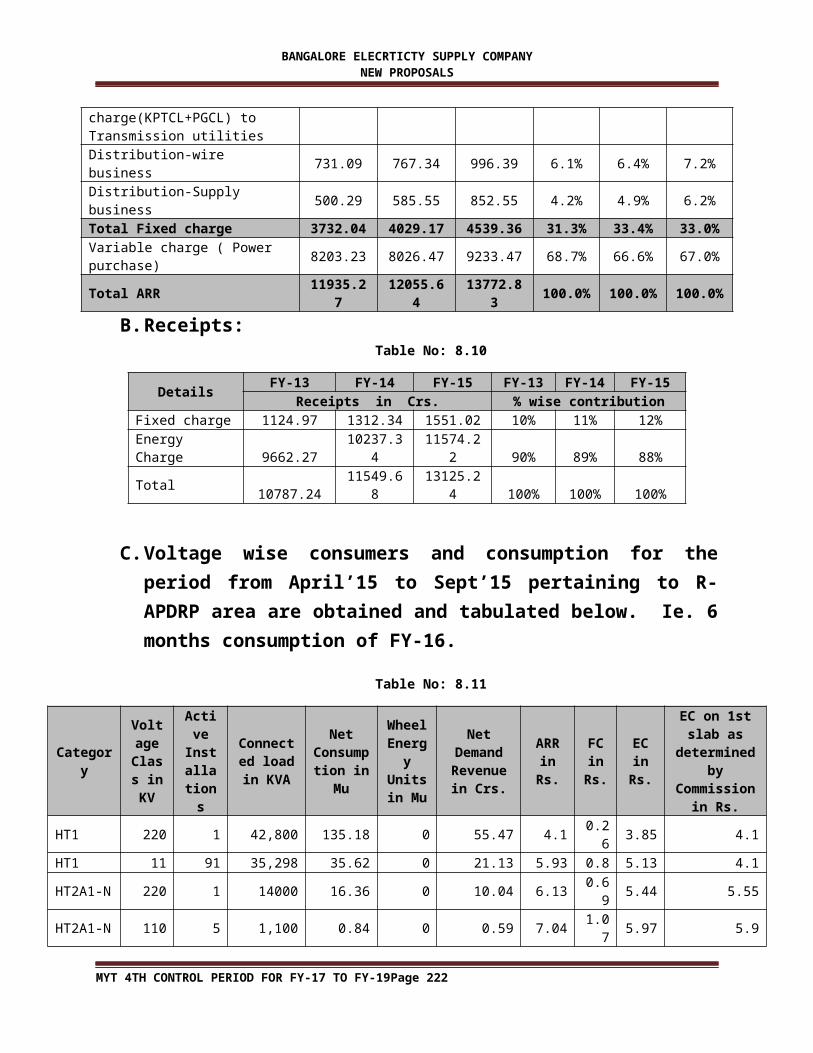
C. Voltage wise consumers and consumption for the period from April’15 to Sept’15 pertaining to R-APDRP area are obtained and tabulated below. Ie. 6 months consumption of FY-16.
Table No: 8.11
Category
Voltage
Class in KV
Active Installations
Connected load in
KVA
Net Consump
tion in Mu
Wheel Energy Units in Mu
Net Demand
Revenue in Crs.
ARR in Rs.
FC in Rs.
EC in Rs.
EC on 1st slab as
determined by
Commission in Rs.
HT1 220 1 42,800 135.18 0 55.47 4.1 0.26 3.85 4.1
HT1 11 91 35,298 35.62 0 21.13 5.93 0.8 5.13 4.1
HT2A1-N 220 1 14000 16.36 0 10.04 6.13 0.69 5.44 5.55
HT2A1-N 110 5 1,100 0.84 0 0.59 7.04 1.07 5.97 5.9
HT2A1-N 66 16 161,465 174.64 38.37 99.12 5.68 0.75 4.93 5.9
HT2A1-N 11 2331 1,000,718 1262.23 188.67 756.85 6 0.64 5.35 5.9
HT2A2-N 66 1 350 0.3 0 0.21 6.87 0.88 5.98 5.85
HT2A2-N 11 145 26,202 32.42 0 21.89 6.75 0.62 6.13 5.85
HT2B1 110 4 1,070 0.84 0 0.73 8.7 1.15 7.56 7.55
HT2B1 11 4,611 1,403,947 1532.48 235.95 1161.22 7.58 0.82 6.75 7.55
HT2B2 66 1 118 0.01 0 0.02 15.95 8.97 6.97 7.35
MYT 4TH CONTROL PERIOD FOR FY-17 TO FY-19 Page 219
BANGALORE ELECRTICTY SUPPLY COMPANY NEW PROPOSALS
HT2B2 11 69 9,257 6.58 0 5.9 8.97 1.2 7.76 7.75
HT2C1 11 87 34,256 51.58 0 34.92 6.77 0.51 6.26 5.6
HT2C2 11 248 59,451 72.76 12.99 46.59 6.4 0.63 5.78 6.6HT4A Sub meter
110 1 1 0.43 0 0.28 6.36 6.36 5.5
HT4A sub meter
11 29 1,489 13.64 9.3 6.8 6.8 5.5
HT4A 11 137 29,843.53 34.32 20.27 5.91 0.39 5.51 5.5
Total 7,778 2,821,365 3370.23 475.98 2244.49 6.66
D. Approved v/s Actuals HT sales for FY-15
Table No: 8.12
Sl No ParticularsApproved Actuals Consumption Mix
Consumption Consumption Approved Actual Variation in Mix1 HT-1 629.29 664.24 2.48% 2.72% 0.24%2 HT2(a)(I) 2634.33 2441.34 10.37% 9.99% -0.38%3 HT2(a)(ii) 2930.38 2308.81 11.54% 9.45% -2.09%4 HT2 b(i) 3124.02 2594.57 12.30% 10.62% -1.68%5 HT2 b(ii) 213.61 201.32 0.84% 0.82% -0.02%6 HT2 C(i) 1.48 75.4 0.01% 0.31% 0.30%7 HT2 C(ii) 8 113.91 0.03% 0.47% 0.43%8 HT3(a)(i) 6.93 17.43 0.03% 0.07% 0.04%9 HT-3(a)(ii) 1.04 0.52 0.00% 0.00% 0.00%
11 HT3(a)(iii) 11.99 0.31 0.05% 0.00% -0.05%12 HT-4 128.65 127.25 0.51% 0.52% 0.01%13 HT-5 59.06 285.59 0.23% 1.17% 0.94%
HT - TOTAL Total 9748.78 8830.68 38.39% 36.14% -2.25%
Data analysis: From the above tables the following points can be drawn:
Revenue expenditure can be divided into two parts 1. Fixed expenditure contributing 33%
of the total cost and 2. Variable expenditure contributing 67% of the total cost.
On the contrary under Revenue earned from tariff 1. Fixed cost collected are at the rate of
11% and 2. Variable costs collected are at the rate of 89% of the total receipt.
In majority of categories recovery of variable charges are not even at the Commission
determined first slab rate. This may be due to inbuilt rebate such as voltage class rebate and
incentive for Time of the Day tariff.
MYT 4TH CONTROL PERIOD FOR FY-17 TO FY-19 Page 220
BANGALORE ELECRTICTY SUPPLY COMPANY NEW PROPOSALS
Since the contribution of fixed charges is only 10% of the average realization rate the
balance i.e 23% (33%-10%) is camouflaged in the energy charges. Hence, the energy charge
seems to be on a higher side. This is foremost reason for tapping HT consumers by
generators. If the Demand/Fixed charges which is masked in the energy charges are
separated then the variable cost can be reduced. Hence, it is proposed for increasing the
fixed charges and reducing variable charges for HT consumers. This proposal does not affect
the existing average realization rate of HT consumers.
Change in the approved sales mix also affects the cross subsidy level.
If there is any reduction in sales under HT tariff, loss on account of fixed charges is at the
larger extent ie. -23%, and this will further worsen the cross subsidy level.
Commission while determining the tariff does not consider the inbuilt rebate. Hence the
existing D-21 format needs to be corrected suitably to arrive at the exact impact of the tariff
revision.
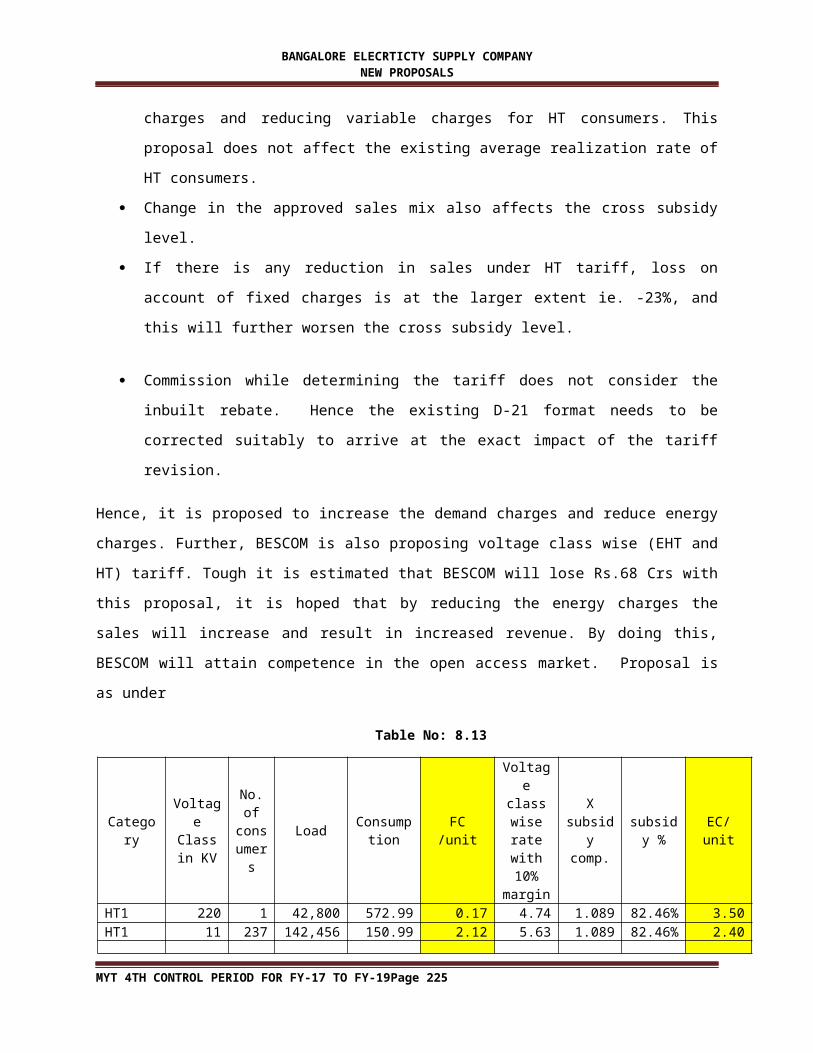
Hence, it is proposed to increase the demand charges and reduce energy charges. Further, BESCOM
is also proposing voltage class wise (EHT and HT) tariff. Tough it is estimated that BESCOM will lose
Rs.68 Crs with this proposal, it is hoped that by reducing the energy charges the sales will increase
and result in increased revenue. By doing this, BESCOM will attain competence in the open access
market. Proposal is as under
Table No: 8.13
CategoryVoltage Class in
KV
No. of
consumer
s
LoadConsumpt
ionFC /unit
Voltage class wise rate with 10%
margin
X subsidy comp.
subsidy %
EC/unit
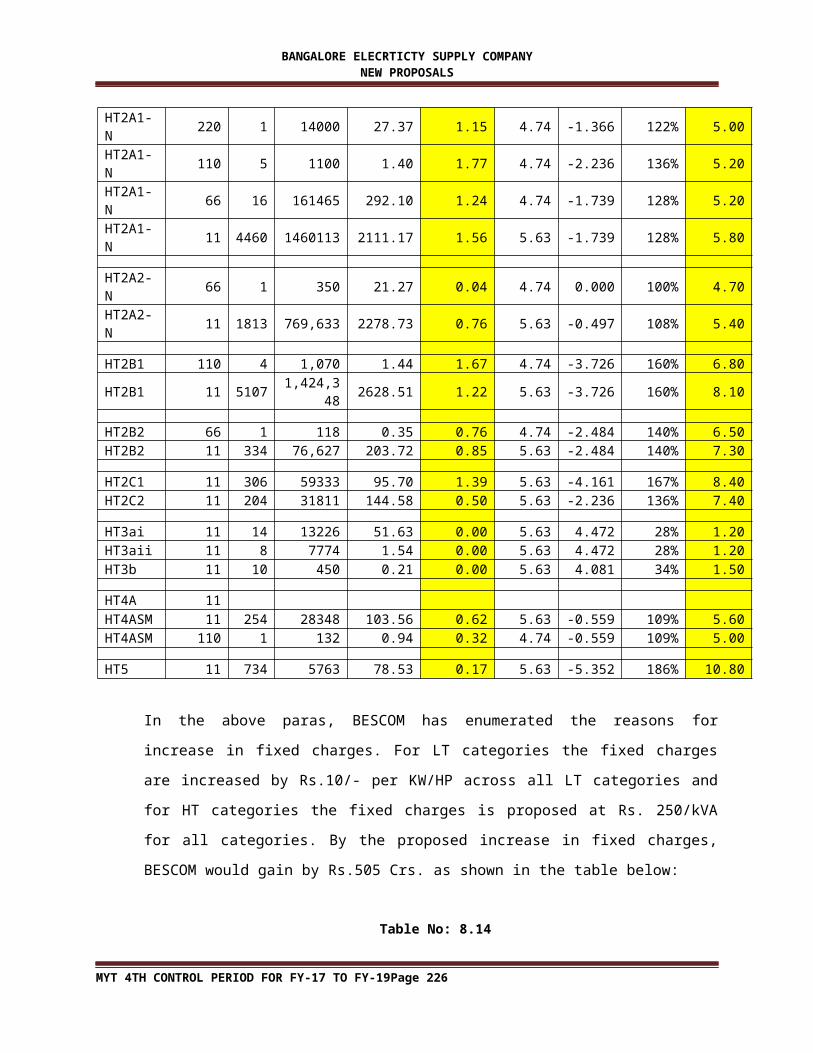
HT1 220 1 42,800 572.99 0.17 4.74 1.089 82.46% 3.50HT1 11 237 142,456 150.99 2.12 5.63 1.089 82.46% 2.40
HT2A1-N 220 1 14000 27.37 1.15 4.74 -1.366 122% 5.00HT2A1-N 110 5 1100 1.40 1.77 4.74 -2.236 136% 5.20HT2A1-N 66 16 161465 292.10 1.24 4.74 -1.739 128% 5.20HT2A1-N 11 4460 1460113 2111.17 1.56 5.63 -1.739 128% 5.80
HT2A2-N 66 1 350 21.27 0.04 4.74 0.000 100% 4.70HT2A2-N 11 1813 769,633 2278.73 0.76 5.63 -0.497 108% 5.40
HT2B1 110 4 1,070 1.44 1.67 4.74 -3.726 160% 6.80HT2B1 11 5107 1,424,348 2628.51 1.22 5.63 -3.726 160% 8.10
MYT 4TH CONTROL PERIOD FOR FY-17 TO FY-19 Page 221
BANGALORE ELECRTICTY SUPPLY COMPANY NEW PROPOSALS
HT2B2 66 1 118 0.35 0.76 4.74 -2.484 140% 6.50HT2B2 11 334 76,627 203.72 0.85 5.63 -2.484 140% 7.30
HT2C1 11 306 59333 95.70 1.39 5.63 -4.161 167% 8.40HT2C2 11 204 31811 144.58 0.50 5.63 -2.236 136% 7.40
HT3ai 11 14 13226 51.63 0.00 5.63 4.472 28% 1.20HT3aii 11 8 7774 1.54 0.00 5.63 4.472 28% 1.20HT3b 11 10 450 0.21 0.00 5.63 4.081 34% 1.50
HT4A 11HT4ASM 11 254 28348 103.56 0.62 5.63 -0.559 109% 5.60HT4ASM 110 1 132 0.94 0.32 4.74 -0.559 109% 5.00
HT5 11 734 5763 78.53 0.17 5.63 -5.352 186% 10.80
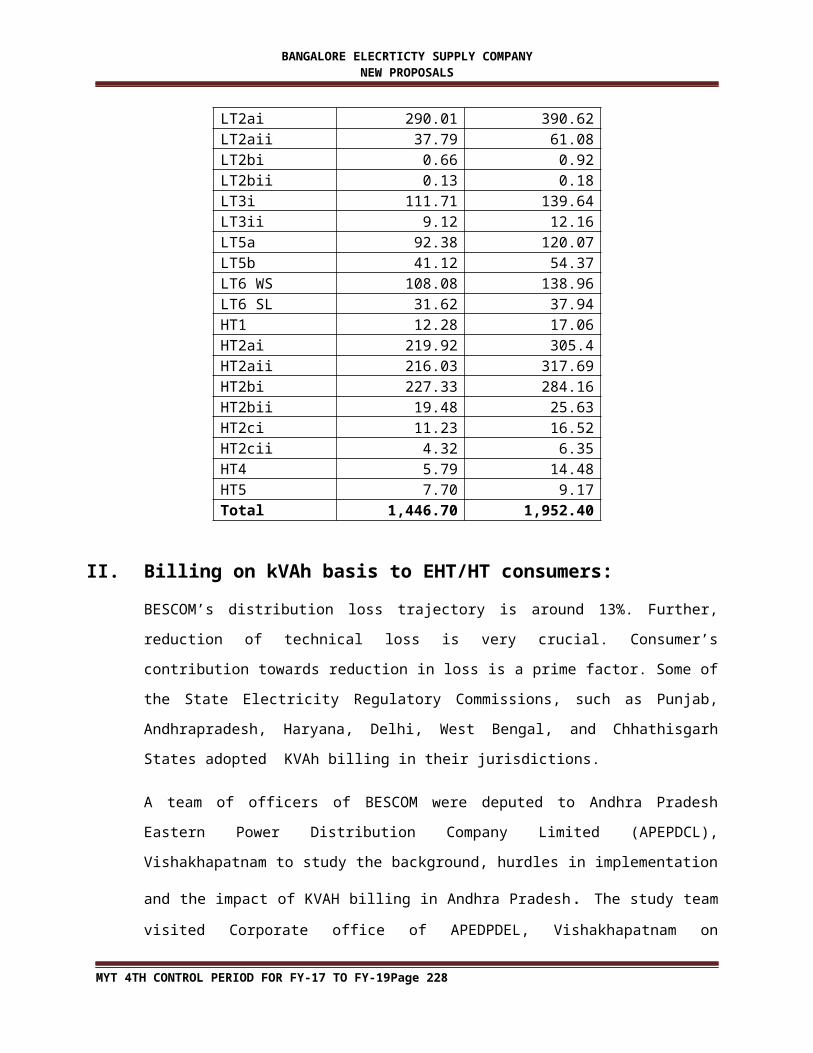
In the above paras, BESCOM has enumerated the reasons for increase in fixed charges. For
LT categories the fixed charges are increased by Rs.10/- per KW/HP across all LT categories
and for HT categories the fixed charges is proposed at Rs. 250/kVA for all categories. By the
proposed increase in fixed charges, BESCOM would gain by Rs.505 Crs. as shown in the
table below:
Table No: 8.14
TariffExisting Revised
FC FCLT2ai 290.01 390.62LT2aii 37.79 61.08LT2bi 0.66 0.92LT2bii 0.13 0.18LT3i 111.71 139.64LT3ii 9.12 12.16LT5a 92.38 120.07LT5b 41.12 54.37LT6 WS 108.08 138.96LT6 SL 31.62 37.94HT1 12.28 17.06HT2ai 219.92 305.4HT2aii 216.03 317.69HT2bi 227.33 284.16HT2bii 19.48 25.63HT2ci 11.23 16.52HT2cii 4.32 6.35HT4 5.79 14.48HT5 7.70 9.17
MYT 4TH CONTROL PERIOD FOR FY-17 TO FY-19 Page 222
BANGALORE ELECRTICTY SUPPLY COMPANY NEW PROPOSALS
Total 1,446.70 1,952.40
II. Billing on kVAh basis to EHT/HT consumers:
BESCOM’s distribution loss trajectory is around 13%. Further, reduction of technical loss is
very crucial. Consumer’s contribution towards reduction in loss is a prime factor. Some of
the State Electricity Regulatory Commissions, such as Punjab, Andhrapradesh, Haryana,
Delhi, West Bengal, and Chhathisgarh States adopted KVAh billing in their jurisdictions.
A team of officers of BESCOM were deputed to Andhra Pradesh Eastern Power Distribution
Company Limited (APEPDCL), Vishakhapatnam to study the background, hurdles in
implementation and the impact of KVAH billing in Andhra Pradesh. The study team visited
Corporate office of APEDPDEL, Vishakhapatnam on 11.08.2015. The team, after considering
the existing situation in Eastern Power Distribution Company Limited (APEPDCL),
Vishakhapatnam, recommended for KVAH billing in Bangalore Electricity Supply Company
(BESCOM).
As per the team report, situation existing in Karnataka and Andhra Pradesh are compared
and remarks are tabulated below.
Situation prevailing in (APEPDCL), Vishakhapatnam before
implementation of KVAH billing.
Situation prevailing in Karnataka
Remarks
Power factor bench mark set at 0.95 lag for both HT and LT
Power factor bench mark set at 0.85 lag in case of LT and 0.90lag in case of HT
This difference itself save about 10% of energy in Karnataka
Power factor penalty at 0.5% to 3% of energy charges for all categories
Penalty at 3paise per unit for every fall of .01 lag in case of HT and 2 paise in case of LT subject to a maximum of 30 paise per unit
Penalty rate in AP Is high compared to Karnataka
25% of energy charges was being levied as surcharge
There is no surcharge for not fixing capacitors
This is the prime factor which mooted for KVAH billing
For Ferro industries, 50 unit per KVA is the deemed energy charges
There is no deemed Energy charges
This is one of the reason for opting alternative billing method by Ferro consumers of AP
One suitable capacity transformer for one installation and metering done at the HT side of the transformer
Multiple consumers are connected to single transformer and metering is being done on LT side of Transformer
This has resulted in Virtual HT for LT installations.Transformation loss is loaded to the consumer.Interference in metering equipment,
MYT 4TH CONTROL PERIOD FOR FY-17 TO FY-19 Page 223

BANGALORE ELECRTICTY SUPPLY COMPANY NEW PROPOSALS
theft of energy by these consumers are eliminated in AP
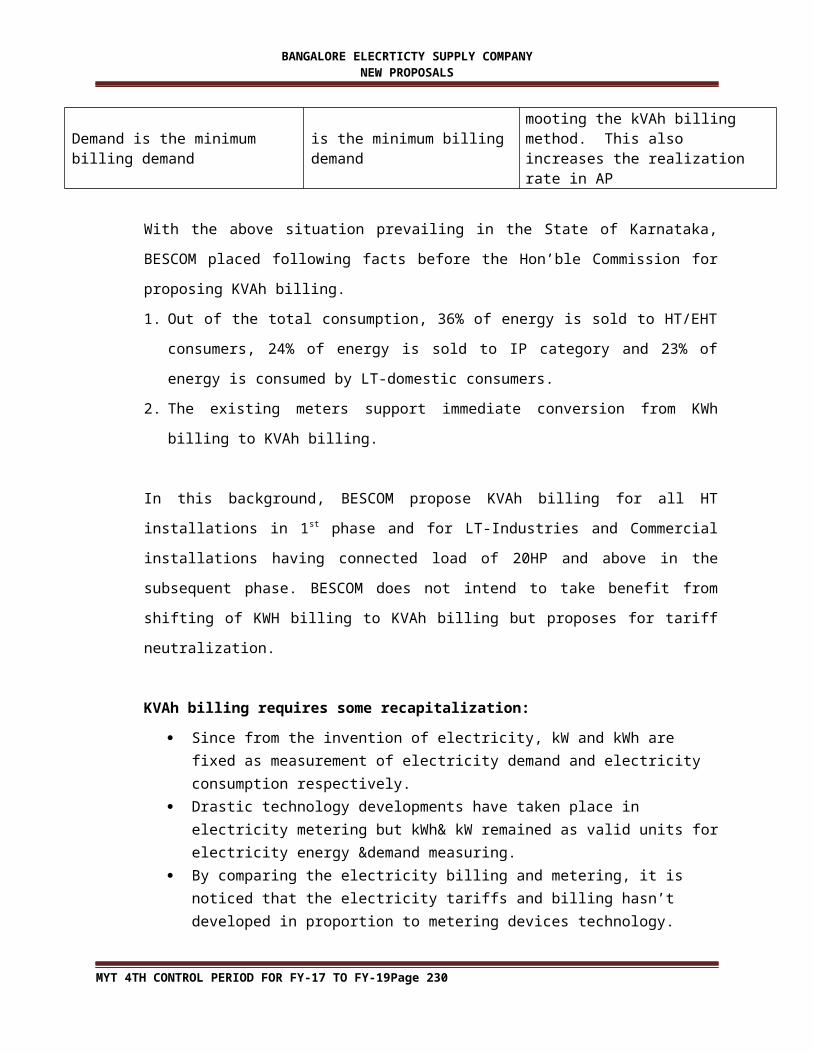
80% of the Contract Demand is the minimum billing demand
75% of Contract Demand is the minimum billing demand
This is also reason for mooting the kVAh billing method. This also increases the realization rate in AP
With the above situation prevailing in the State of Karnataka, BESCOM placed following
facts before the Hon’ble Commission for proposing KVAh billing.
1. Out of the total consumption, 36% of energy is sold to HT/EHT consumers, 24% of
energy is sold to IP category and 23% of energy is consumed by LT-domestic
consumers.
2. The existing meters support immediate conversion from KWh billing to KVAh billing.
In this background, BESCOM propose KVAh billing for all HT installations in 1 st phase and
for LT-Industries and Commercial installations having connected load of 20HP and above in
the subsequent phase. BESCOM does not intend to take benefit from shifting of KWH billing
to KVAh billing but proposes for tariff neutralization.
KVAh billing requires some recapitalization:
Since from the invention of electricity, kW and kWh are fixed as measurement of electricity demand and electricity consumption respectively.
Drastic technology developments have taken place in electricity metering but kWh& kW remained as valid units for electricity energy &demand measuring.
By comparing the electricity billing and metering, it is noticed that the electricity tariffs and billing hasn’t developed in proportion to metering devices technology.
The electricity charges must contain quantitative as well as qualitative components motivating the customers to improve their quality standard. The electricity meters are manufactured according to standards. But there is no identified standards for electricity billing. So it is necessary that the electricity based tariffs and metering be redefined.
The electricity billing commonly consist of three components in which at least one component (Demand charge) is constant.
The components are as follows:
1- Active energy charge - measured in kWh2- Reactive energy charge (power factor penalty) – measured in kVARh3- Demand charge – measured in kW/kVA/HP (for consecutive periods of time).
MYT 4TH CONTROL PERIOD FOR FY-17 TO FY-19 Page 224
BANGALORE ELECRTICTY SUPPLY COMPANY NEW PROPOSALS
The electricity charges are of two kinds ie., tariffs & penalties. Tariffs are those charges that are applied to quantitative components ie., like active energy (KWh) and demand (KW/HP/KVA)
The electricity power in normal condition is consisted of two components; active and reactive. The active or real power is actually consumed and converted into useful work for creating heat, light and motion and is measured in (kW) and is totalized by the electric meter in (kWh).
The reactive power that is measured by (kVAR) and is totalized by the meter in (kVARh) unit is the power used to provide the electromagnetic field in inductive and capacitive equipment. It isn’t actually consumed but it is conserved as a potential energy in electromagnetic field and has a periodic movement (oscillation) between power supplier and power consumer. Therefore the reactive power cannot be converted to work but its existence is necessary for converting the electric energy to work and vice versa. Hence the reactive power occupy the capacity of electricity network and reduce the useful capacity of system for generation and distribution of the active power& energy and so increase the power& energy losses in electricity network.
In any case the customer compensates the losses on account of this either by power factor penalty or by providing individual capacitive compensator.
For reactive compensation the customer has two options: Pay monthly minimum charges for penalty or Pay a high charge once forever by installing capacitive compensator.
Traditionally we have electromagnetic meters which recorded demand in kW and energy in kWh. Due to the advent of meters like trivector electronic, the following are recorded
apparent energy ie., kilo volt amps,(kva) kilo volt ampere hour ( kvah), real energy ie., kilo watt , kilo watt hour (kwh) and reactive power ie.,kvarh
But the effects of conventional meters still persists in electricity billing.
Electrical energy is a vector quantity, it is the product of current and voltage. In a non-harmonic environment ie., for lighting, heating loads etc., where the loads are linear in nature, both current and voltage are in same phase so the apparent power is equal to real power.
In harmonic environment, where the energy flows through an induction motor. The voltage drops hence voltage will not be in phase with current (lag condition). If energy flows in capacitor, voltage boost and in this case also voltage will not be in phase with current (lead condition). On both these counts current is not in phase with the voltage. But by using the
MYT 4TH CONTROL PERIOD FOR FY-17 TO FY-19 Page 225
BANGALORE ELECRTICTY SUPPLY COMPANY NEW PROPOSALS
second ie. Lead condition can mitigate the lag condition thus minimizing the optimum usage of apparent power into real power.By adding the suitable capacitors, consumer can convert the apparent energy into real energy.
Now BESCOM is billing energy under KWh basis and wishes to shift the billing from kWh to kVAh. This will encourage the consumer to use energy efficiently and also result in reduction in his bill besides helping BESCOM’s reduction in its energy requirement.
Need of the Hour:
Regulatory bodies are more cautious on the reduction of distribution loss. Central financial institutions such as PFC are tagging the reduction of Aggregate Technical and Commercial loss (AT&C losses) to the rate of interest on the loans borrowed.
BESCOM has almost reached its optimal technical loss and further reduction is becoming very difficult.Emphasis is rolling on Energy conservation, energy efficiency and Demand Side Management (DSM) and green energy solutions to resolve the energy crisis.It is time for consumers to reduce his demand and energy bill by fixing appropriate technology so as to mitigate the reactive energy.
By this action, the consumer who opted for energy efficient program are encouraged and the others have to bear the cost.
Energy conservation by high end consumers who consume more than 36 % (EHT, HT and consumers fixed with ETV meter) will benefit in supplying of energy to the needy consumers who doesn’t have option.
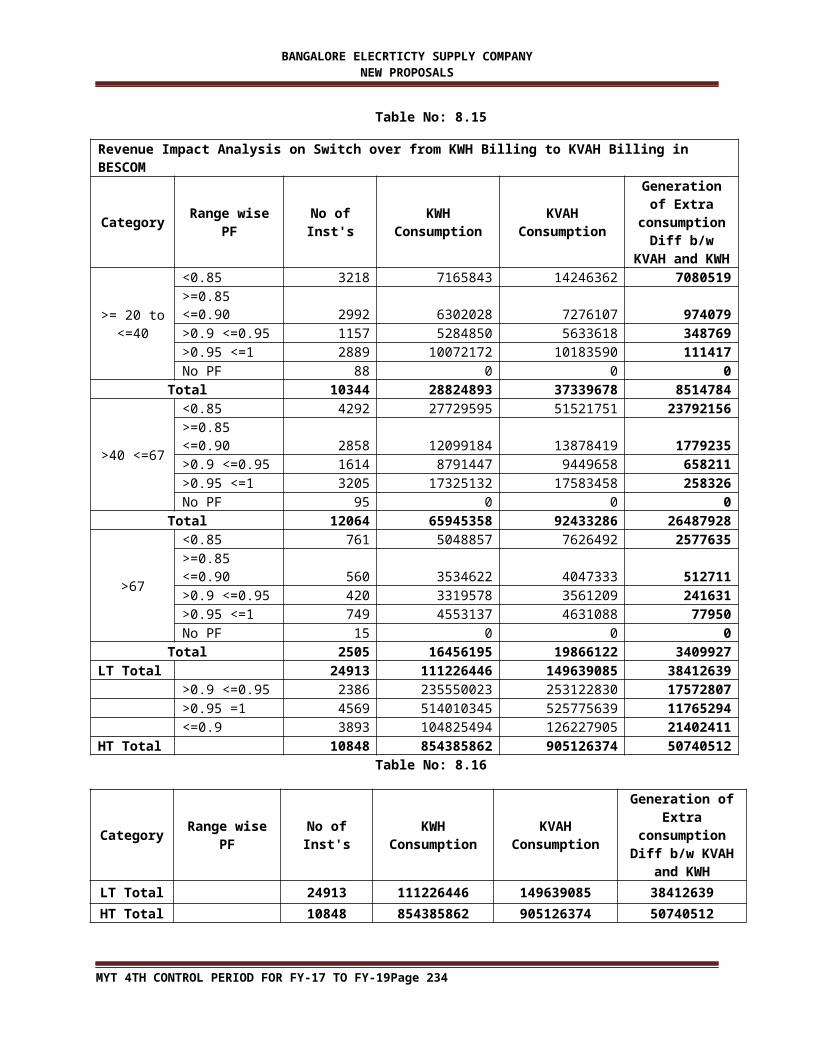
A sample study and analysis made on switching from kWh billing to KVAh billing is illustrated below for kind perusal of the Hon’ble Commission.
Table No: 8.15
Revenue Impact Analysis on Switch over from KWH Billing to KVAH Billing in BESCOM
Category Range wise PF No of Inst's KWH Consumption
KVAH Consumption
Generation of Extra
consumption Diff b/w KVAH
and KWH
>= 20 to <=40
<0.85 3218 7165843 14246362 7080519>=0.85 <=0.90 2992 6302028 7276107 974079>0.9 <=0.95 1157 5284850 5633618 348769>0.95 <=1 2889 10072172 10183590 111417
MYT 4TH CONTROL PERIOD FOR FY-17 TO FY-19 Page 226

BANGALORE ELECRTICTY SUPPLY COMPANY NEW PROPOSALS
No PF 88 0 0 0Total 10344 28824893 37339678 8514784
>40 <=67
<0.85 4292 27729595 51521751 23792156>=0.85 <=0.90 2858 12099184 13878419 1779235>0.9 <=0.95 1614 8791447 9449658 658211>0.95 <=1 3205 17325132 17583458 258326No PF 95 0 0 0
Total 12064 65945358 92433286 26487928
>67
<0.85 761 5048857 7626492 2577635>=0.85 <=0.90 560 3534622 4047333 512711>0.9 <=0.95 420 3319578 3561209 241631>0.95 <=1 749 4553137 4631088 77950No PF 15 0 0 0
Total 2505 16456195 19866122 3409927LT Total 24913 111226446 149639085 38412639
>0.9 <=0.95 2386 235550023 253122830 17572807>0.95 =1 4569 514010345 525775639 11765294<=0.9 3893 104825494 126227905 21402411
HT Total 10848 854385862 905126374 50740512Table No: 8.16
Category Range wise PF No of Inst's KWH Consumption
KVAH Consumption
Generation of Extra
consumption Diff b/w KVAH and
KWH
LT Total 24913 111226446 149639085 38412639
HT Total 10848 854385862 905126374 50740512
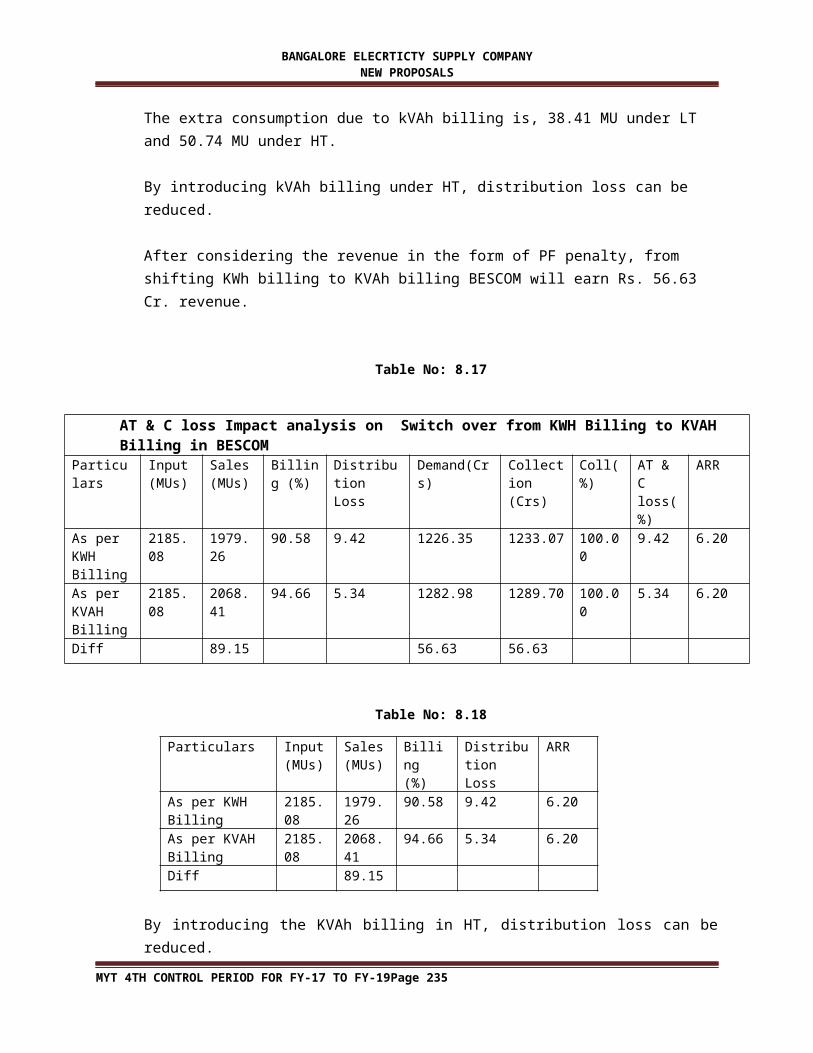
The extra consumption due to kVAh billing is, 38.41 MU under LT and 50.74 MU under HT.
By introducing kVAh billing under HT, distribution loss can be reduced.
After considering the revenue in the form of PF penalty, from shifting KWh billing to KVAh billing BESCOM will earn Rs. 56.63 Cr. revenue.
Table No: 8.17
AT & C loss Impact analysis on Switch over from KWH Billing to KVAH Billing in BESCOM
Particulars
Input (MUs)
Sales (MUs)
Billing (%)
Distribution Loss
Demand(Crs) Collection (Crs)
Coll(%)
AT & C loss(%)
ARR
As per KWH Billing
2185.08 1979.26 90.58 9.42 1226.35 1233.07 100.00 9.42 6.20
As per 2185.08 2068.41 94.66 5.34 1282.98 1289.70 100.00 5.34 6.20
MYT 4TH CONTROL PERIOD FOR FY-17 TO FY-19 Page 227
BANGALORE ELECRTICTY SUPPLY COMPANY NEW PROPOSALS
KVAH BillingDiff 89.15 56.63 56.63
Table No: 8.18
Particulars Input (MUs)
Sales (MUs)
Billing (%)
Distribution Loss
ARR
As per KWH Billing
2185.08
1979.26
90.58 9.42 6.20
As per KVAH Billing
2185.08
2068.41
94.66 5.34 6.20
Diff 89.15
By introducing the KVAh billing in HT, distribution loss can be reduced.
Hon’ble Appellate Tribunal for Electricity, New Delhi in its judgment dated 10th April 2015 vide Appeal No. 264/2013 had observed advantages of High Power Factor and KVAH billing. The extract of the same is reiterated below:
Higher the power factor, lower is the load current and thereby technical losses of the transmission lines i.e. I²R losses will be reduced considerably.
The Higher Power Factor will reduce the demand on the system and improve the systems Voltage.
Increases the available transmission and distribution system capacity.
The Hon’ble ATE, in appeal No.130 of 2005 between South East Central Railways, Chhattisgarh Versus Chhattisgarh State Electricity Board has upheld the decision of the State Commission in introducing kVAh billing, extract of the appeal petition No.130 of 2005, dated 10.06.2006 is reiterated below:
“ KVAH billing which provides inbuilt incentive for the Appellant’s category, which will automatically take care of power factor inventive and disincentive for the high and low power factor respectively”
Hence, introduction of KVAh billing is win-win situation for both the consumers and the distribution Company.
Commission is requested to examine the proposal which will increase the competence in the market and may attract the consumers to the grid.
MYT 4TH CONTROL PERIOD FOR FY-17 TO FY-19 Page 228

BANGALORE ELECRTICTY SUPPLY COMPANY NEW PROPOSALS
III. Meter rental charges to prepaid meters:
1. As per the KERC Tariff Order dated 30/04/2012, all of the temporary installations shall
be arranged through a Pre-paid Energy Meter duly observing the provisions of Clause
12 of the Conditions of Supply of Electricity of the Distribution Licensees in the State of
Karnataka.
2. BESCOM has already installed 3525 nos. of prepaid meters using smart card technology
for temporary installations (LT7 Tariff) in its Indiranagar Division out of which 2700
nos. are single phase meters and 825 nos. are three phase meters. Further order for 750
nos. of three phase meters are yet to be installed. These prepaid meters are being fixed
to Temporary installations at the cost of the BESCOM.
3. Section 47 (5) of the Electricity Act 2003 which empowers the Distribution Licensee to
require the consumers to provide a security deposit in respect of supply of power is as
follows:
“47. (1) Subject to the provisions of this section, a distribution licensee may require any
person, who requires a supply of electricity in pursuance of section 43, to give him
reasonable security, as determined by regulations, for the payment to him of all monies
which may become due to him –
a) in respect of the electricity supplied to such persons; or
b) Where any electric line or electrical plant or electric meter is to be provided for
supplying electricity to person, in respect of the provision of such line or plant or
meter.
(5) A distribution licensee shall not be entitled to require security in pursuance of clause
(a) of sub-section (1) if the person requiring the supply is prepared to take the supply
through a pre-payment meter.”
4. As can be seen from the above, a Distribution Licensee cannot require the consumer to
provide security for the electricity supplied if the supply is through a prepaid meter.
However, BESCOM is entitled to collect security for the meter fixed to the installation.
MYT 4TH CONTROL PERIOD FOR FY-17 TO FY-19 Page 229
BANGALORE ELECRTICTY SUPPLY COMPANY NEW PROPOSALS
5. The prepaid meters that are currently in the market are digital meters, whose costs are
considerably higher as compared to the electromagnetic static meters. The following
comparative table shows the difference in cost of the static meter and prepaid meter:
Table No: 8.19
Particulars Cost of Static meter Cost of Prepaid meter
Single phase Rs. 905.14 Rs. 10,733.00
Three phase Rs. 2449.39 Rs. 13,532.00
Three phase CT operated Rs. 2999.90 N.A
6. The LT-7 temporary installations are normally availed for a wide range of periods from
one day to several months. For each of such installations the Company has to provide a
prepaid meter, which it has to acquire at the aforesaid high cost. Such meters are
exposed to greater wear and tear considering the fact that they would be used to short
periods. BESCOM is incurring expenditure in the acquisition of the prepaid meters, it is
unable to recover the cost of such meters, which in turn is causing financial burden.
Therefore, it is just and essential to allow BESCOM to collect security deposit/meter
rental charges in respect of prepaid meters.
7. The BESCOM proposes the following security deposit/meter rental charges for the kind
consideration of this Hon’ble Commission:
Table No: 8.20
LT-7 installations for a period upto 7 days
No meter security deposit or meter rental charges
LT-7 installations for a period in excess of 8 days up to 56 days.
Meter rental charges at Rs.75/- per week
LT-7 installations for period in excess of 57 days
Meter security deposit equivalent to the cost of the meter
8. The aforesaid proposals are based on the following calculations:
Calculation of Rental Charges:
Single Phase Meters:
Cost of the meter: Rs.10,732/- as per the above rates.
MYT 4TH CONTROL PERIOD FOR FY-17 TO FY-19 Page 230
BANGALORE ELECRTICTY SUPPLY COMPANY NEW PROPOSALS
Average life of the meter: 5 Years.
Rental charges as per calculation made: Rs.75 per week (min Rs.75/-)
( Rs.10,732/- divided into 144 weeks (3 years) considering the wear and tear,
down time, and handling issues in transit, comes to Rs.74.53 per week which is
rounded off to Rs.75 per week).
Three Phase Meters:
Cost of the meter: Rs.13, 532/- as per the above rates.
Average life of the meter: 5 Years.
Rental charges as per calculation made: Rs.100 per week (min Rs.100/-)
( Rs.13,532/- divided into 144 weeks (3 years) considering the wear and tear,
down time, and handling issues in transit, comes to Rs.94 per week which is
rounded off to Rs.100 per week)
9. The various utilities mentioned below across India have already adopted the Meter
rentals (information gathered through internet):
1. Kerala State Electricity Board,
2. West Bengal Electricity Distribution Company Limited
3. Andhra Pradesh Distribution Company Ltd.
4. Punjab State Electricity Board:
IV. Expensive Marriage:
Government of Karnataka has forwarded the 42nd report of the subcommittee
recommendation to Secretary, KERC vide letter No. EN18/PTC 2015, dated 10.09.2015. The
report speaks of recommending higher tariff to the Kalyana Mantap which carryout
luxurious expensive marriages. BESCOM concurs with the Government’s view and has
proposed higher tariff to Kalyana Mantapa.
V. Drinking Water supply
MYT 4TH CONTROL PERIOD FOR FY-17 TO FY-19 Page 231

BANGALORE ELECRTICTY SUPPLY COMPANY NEW PROPOSALS
Hon’ble Energy Minister of Karnataka in his Note has stated that the State is facing severe
drought and in this scenario it is the responsibility of the Government to provide pure
drinking water to its people. In this scenario Hon’ble Energy Minister has proposed for
rebate in drinking water supply (RO drinking water unit) and also to categorize the activity
separately. The Commission is requested to look into the issue in the interest of public
welfare.
VI. Withdrawal of Solar rebate:
To encourage consumers to use environmental friendly energy i.e renewable energy and
also to reduce the morning peak, solar rebate was introduced to domestic consumers who
install solar water heater. It was presumed that, by installing the solar water heater,
morning peak load will reduce, thus deferring the interest on that investment. That
deferred interest was shared with the consumer as incentive.
Now, the situation is entirely different,
Distribution system is now strengthened and interest and depreciation on these
investments are being passed through tariff.
Government has notified mandatory installation of solar water heaters.
Commission approved tariff for solar energy generation from Solar roof top PV
plants @ Rs.9.56 per unit.
Government of Karnataka is also providing subsidy for solar generation to an extent
of 30%.
The present slab rates after 200 units are more or less equal to Average cost of
supply. Hence, consumers are voluntarily not only installing solar water heaters but
also providing solar street light to their parks around there residential apartments
and approaching BESCOM for extension of rebates to their premises on similar lines.
Under the above circumstances, the extension of solar rebate has become futile. Hence, solar
rebate is to be reduced partially year on year or to be withdrawn.
MYT 4TH CONTROL PERIOD FOR FY-17 TO FY-19 Page 232

BANGALORE ELECRTICTY SUPPLY COMPANY NEW PROPOSALS
VII. MODE OF PAYMENT:
There are around 10800HT installations in BESCOM. BESCOM wishes to make the payment
procedure easy for HT consumers by giving them option of paying their electricity bill
through RTGS/NEFT. The Consumer who has registered with BESCOM website can pay
their power supply charges through RTGS/ NEFT. It is proposed before the Commission to
make payments above one lakh through RTGS /NEFT mandatory. BESCOM will bear the
processing charges/service charges for RTGS transaction.
VIII. PROMPT PAYMENT INCENTIVE:
Encouraging the behavior of customers who pay early, prompt payment incentive is
proposed. BESCOM proposes, if the payment is made within 5 days of the bill being received
an incentive for prompt payment of the bill amount should be given to the consumers in the
same month’s energy bill. A discount of 1% on the amount of monthly energy bill
(excluding statutory levies, etc.)in the same month, if the payment of the bill is received by
BESCOM within 5 (Five) days from the due date. This incentive is applicable to the
payments received from all E-payment modes. The consumers with arrears shall not be
eligible for prompt payment incentive.
Proposed graded incentive is as under:
Table No: 8.21
Bills paid 15 to13 days advance of due date
1.5% ob bill amount excluding statutory levy will be given on the same month
Bills paid 12 days advance of due date
1.4% ob bill amount excluding statutory levy will be given on the same month
Bills paid 11 days advance of due date
1.3% ob bill amount excluding statutory levy will be given on the same month
Bills paid 10 days advance of due date
1.2% ob bill amount excluding statutory levy will be given on the same month
Bills paid 9 days advance of due date
1.1% ob bill amount excluding statutory levy will be given on the same month
Bills paid 8 days advance of due date
1% ob bill amount excluding statutory levy will be given on the same month
Disincentive
MYT 4TH CONTROL PERIOD FOR FY-17 TO FY-19 Page 233
BANGALORE ELECRTICTY SUPPLY COMPANY NEW PROPOSALS
Bill paid upto due date No disincentive
15 th day to 30 day12% of interest per annum on the amount due subject to minimum of Rs,10 per month will be levied on the same month
30th day to 90 days18% of interest per annum on the amount due subject to minimum of Rs,10 per month will be levied on the same month
Above 90 days24% interest per annum on the amount subject to minimum of Rs.10 per month will be levied on the same month
Advance payment:
For the consumers who pays one year advance payment based on the estimated bill of the
previous year. For such advance payment interest at the rate of 4% per annum will be
allowed.
IX. Gate way charges for on line payment:
To encourage the e-payments among the customer, the consumers who pays the energy
charges in advance ie., before due date, gate way charges will be borne by the Licensee for
the bill amount upto Rs.10,000/-.
X. Include 6AM to 10AM as peak hours under Time of Day:
The objective of ToD billing is to encourage the consumers to shift their load from peak
hours to non –peak hours by incentivizing them and also to levy penalty to discourage the
consumers to use energy at peak hours. The idea of introducing differential pricing method
was to clip of the load curve during peak hours which has not happened.
Of late, it is noticed that the ToD consumers who neither shift the load to the off peak hours
nor reduce the consumption during the peak hour are getting incentive (benefit) due to
inherent error in the existing provision. As per the existing ToD tariff structure, penalty at
Rs.1.25 per unit is being levied for the consumption during peak hours ie., 6PM to 10PM ( 4
hours) and incentive at the rate of Rs.1.00 per unit is being extended to the half peak hour ie
10PM to 6 AM.
MYT 4TH CONTROL PERIOD FOR FY-17 TO FY-19 Page 234
BANGALORE ELECRTICTY SUPPLY COMPANY NEW PROPOSALS
Maximum peak recorded in BESCOM in each month for the years FY14 and FY-15 are
tabulated below:
Table No: 8.22
MonthBESCOM Load in MW
Maximum Time Minimum TimeApr-14 4344 19:24 2751 3:03May-14 4148 19:24 2069 15:50Jun-14 4081 18:52 1696 3:02Jul-14 4093 8:08 1733 2:51
Aug-14 4175 9:23 1973 3:16Sep-14 4177 9:21 1961 2:04Oct-14 3763 7:27 1830 2:04Nov-14 3957 7:48 2012 2:03Dec-14 4318 7:48 2446 2:05Jan-15 4592 8:21 2202 0:30Feb-15 4608 7:58 2607 14:15Mar-15 4639 9:46 2799 2:06
4639 9:46 1696 3:02
Table No: 8.23
Month Maximum Time Minimum TimeApril-13 4034 19:21 2330 0:01May’13 3895 8:41 1767 23:20June’13 3777 8:16 1806 4:37July’13 3732 8:32 1895 23:52Aug’13 3829 8:40 1786 3:08Sep’13 3808 10:24 1950 23:05Oct’13 3934 8:45 1827 2:04Nov’13 4001 7:58 1704 23:59Dec’13 4221 7:15 2104 0:43Jan’14 4297 7:49 2293 23:56Feb’14 4321 7:40 2300 4:40Mar’14 4275 7:42 2291 23:03
It can be seen from the above table, the maximum peak records in the morning. Hence, it is
necessary to consider morning period from 6AM to 10AM is also peak hours.
Consumers who neither reduce the load during the peak hour nor shift the load to the off
peak hours get only 4 hours penalty and are rewarded with 8 hours of incentive, net
incentive of 37.5%.
MYT 4TH CONTROL PERIOD FOR FY-17 TO FY-19 Page 235
BANGALORE ELECRTICTY SUPPLY COMPANY NEW PROPOSALS
The ToD tariff was introduced as a DSM measure to clip off the peak but the peak has shifted
from evening to morning. Hence to rectify the error, the Hon’ble Commission is requested to
levy penalty for the morning peak from 6AM upto 10AM and to do away with Re1.25/-
incentive during off peak hours.
XI. Increase in minimum interest charges to the extent of Rs.10/- for the bill amount more than Rs.100/- in case of LT
The existing interest on belated payment, simple interest at the rate of 1 % per month is
being levied on the actual No. of days of delay subject to a minimum of Re.1/- for LT
installation and Rs.100/- for HT installation. No interest is however levied for arrears of
Rs.10/- and less.
Since minimum interest rate is Rs.1/-, there is slackness in paying the bills by the
consumers. Hence, to push the consumers to pay the bills before due date, it is requested to
increase the minimum interest from Rs.1 to Rs.10/-. No interest is however levied for
arrears of Rs.100/- and less.
XII. To discourage banking during summer month
During summer months when there is peak demand, the Hon’ble Commission is requested
not to allow banking facility for the generators. From the past records it is found that the
State is facing severe energy crisis during summer months and the Licensee is unable to
mitigate the peak demand during summer. Under the above circumstances, banking facility
must not be extended to the generators for more than one month.
XIII. Redi mix concrete to be included in LT5 tariff
Previously redimix concrete activity was included under LT5/HT2a category. In Tariff
Order 2015, dtd 02.03.2015 this activity is not included either under commercial or
industrial activity. To prevent ambiguity in the field it is prayed before the Hon’ble
Commission to include the said activity under LT5/HT2a category.
MYT 4TH CONTROL PERIOD FOR FY-17 TO FY-19 Page 236